Cities with the Largest Black / African American Community in Connecticut
RELATED REPORTS & OPTIONS
Black / African American
Connecticut
Compare Cities
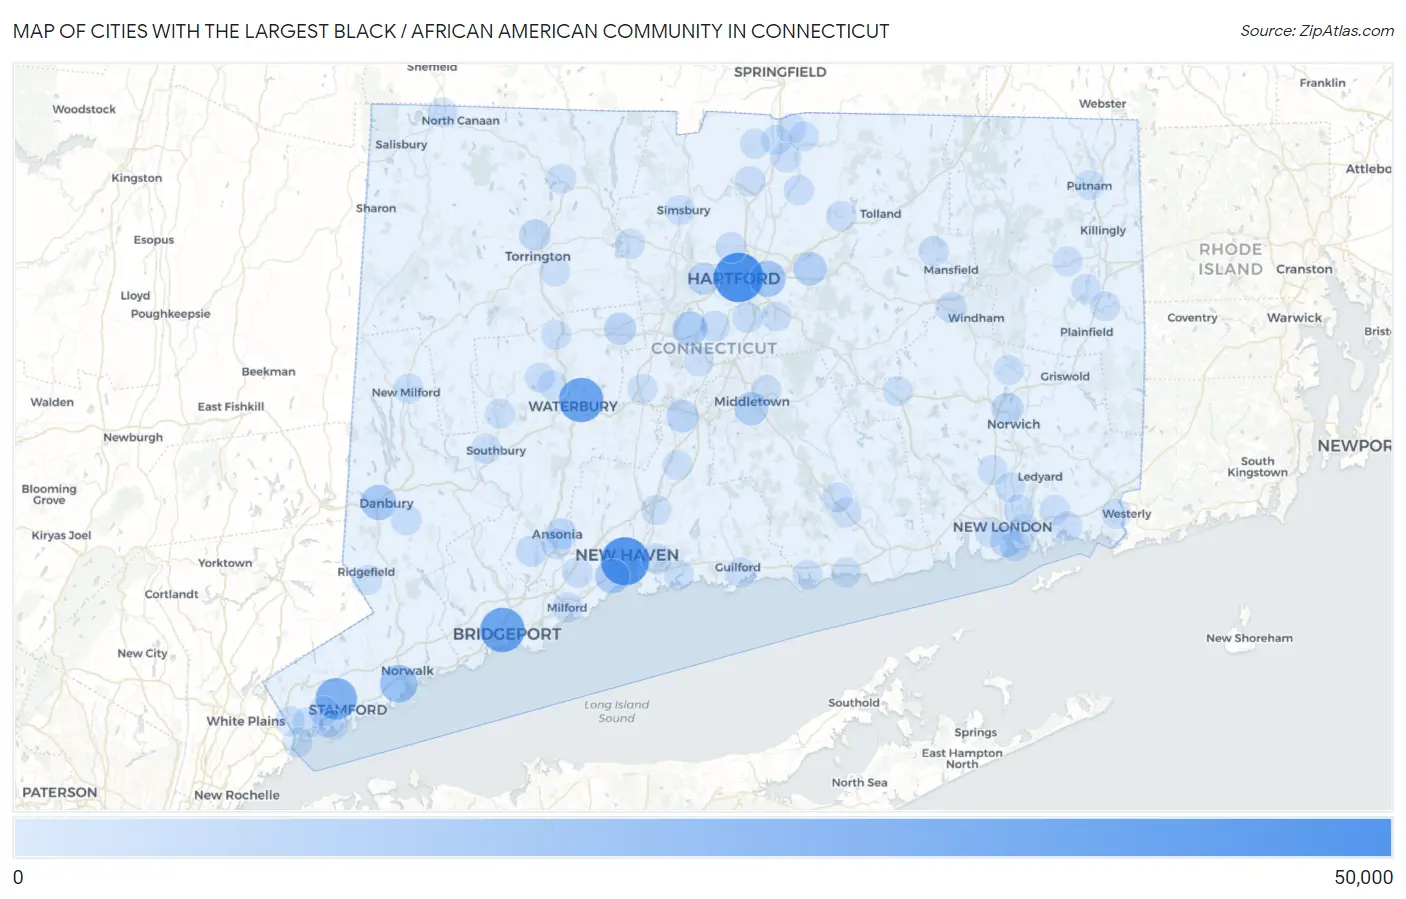
Map of Cities with the Largest Black / African American Community in Connecticut
0
50,000
Cities with the Largest Black / African American Community in Connecticut
| City | Black / African American | vs State | vs National | |
| 1. | Hartford | 43,747 | 385,407(11.35%)#1 | 41,288,572(0.11%)#104 |
| 2. | New Haven | 40,592 | 385,407(10.53%)#2 | 41,288,572(0.10%)#109 |
| 3. | Bridgeport | 32,196 | 385,407(8.35%)#3 | 41,288,572(0.08%)#146 |
| 4. | Waterbury | 32,046 | 385,407(8.31%)#4 | 41,288,572(0.08%)#147 |
| 5. | Stamford | 25,207 | 385,407(6.54%)#5 | 41,288,572(0.06%)#198 |
| 6. | Norwalk | 16,324 | 385,407(4.24%)#6 | 41,288,572(0.04%)#324 |
| 7. | East Hartford | 13,407 | 385,407(3.48%)#7 | 41,288,572(0.03%)#392 |
| 8. | Danbury | 11,512 | 385,407(2.99%)#8 | 41,288,572(0.03%)#479 |
| 9. | New Britain | 9,880 | 385,407(2.56%)#9 | 41,288,572(0.02%)#559 |
| 10. | West Haven | 9,822 | 385,407(2.55%)#10 | 41,288,572(0.02%)#565 |
| 11. | Manchester | 7,659 | 385,407(1.99%)#11 | 41,288,572(0.02%)#738 |
| 12. | Middletown | 7,204 | 385,407(1.87%)#12 | 41,288,572(0.02%)#780 |
| 13. | Meriden | 4,945 | 385,407(1.28%)#13 | 41,288,572(0.01%)#1,068 |
| 14. | West Hartford | 4,896 | 385,407(1.27%)#14 | 41,288,572(0.01%)#1,073 |
| 15. | New London | 4,694 | 385,407(1.22%)#15 | 41,288,572(0.01%)#1,109 |
| 16. | Bristol | 4,655 | 385,407(1.21%)#16 | 41,288,572(0.01%)#1,123 |
| 17. | Norwich | 4,324 | 385,407(1.12%)#17 | 41,288,572(0.01%)#1,193 |
| 18. | Naugatuck Borough | 4,033 | 385,407(1.05%)#18 | 41,288,572(0.01%)#1,277 |
| 19. | Torrington | 3,697 | 385,407(0.96%)#19 | 41,288,572(0.01%)#1,371 |
| 20. | Ansonia | 2,660 | 385,407(0.69%)#20 | 41,288,572(0.01%)#1,763 |
| 21. | Shelton | 1,953 | 385,407(0.51%)#21 | 41,288,572(0.00%)#2,262 |
| 22. | Blue Hills | 1,784 | 385,407(0.46%)#22 | 41,288,572(0.00%)#2,397 |
| 23. | Derby | 1,709 | 385,407(0.44%)#23 | 41,288,572(0.00%)#2,455 |
| 24. | Newington | 1,453 | 385,407(0.38%)#24 | 41,288,572(0.00%)#2,733 |
| 25. | East Haven | 1,447 | 385,407(0.38%)#25 | 41,288,572(0.00%)#2,746 |
| 26. | Willimantic | 1,444 | 385,407(0.37%)#26 | 41,288,572(0.00%)#2,750 |
| 27. | Bethel | 1,247 | 385,407(0.32%)#27 | 41,288,572(0.00%)#2,982 |
| 28. | Wethersfield | 1,169 | 385,407(0.30%)#28 | 41,288,572(0.00%)#3,106 |
| 29. | Greenwich | 906 | 385,407(0.24%)#29 | 41,288,572(0.00%)#3,619 |
| 30. | Milford City Balance | 900 | 385,407(0.23%)#30 | 41,288,572(0.00%)#3,627 |
| 31. | North Haven | 794 | 385,407(0.21%)#31 | 41,288,572(0.00%)#3,902 |
| 32. | Windsor Locks | 790 | 385,407(0.20%)#32 | 41,288,572(0.00%)#3,916 |
| 33. | Groton | 749 | 385,407(0.19%)#33 | 41,288,572(0.00%)#4,003 |
| 34. | Broad Brook | 710 | 385,407(0.18%)#34 | 41,288,572(0.00%)#4,117 |
| 35. | Rockville | 679 | 385,407(0.18%)#35 | 41,288,572(0.00%)#4,222 |
| 36. | Storrs | 672 | 385,407(0.17%)#36 | 41,288,572(0.00%)#4,243 |
| 37. | Orange | 615 | 385,407(0.16%)#37 | 41,288,572(0.00%)#4,422 |
| 38. | Conning Towers Nautilus Park | 612 | 385,407(0.16%)#38 | 41,288,572(0.00%)#4,437 |
| 39. | Thompsonville | 535 | 385,407(0.14%)#39 | 41,288,572(0.00%)#4,766 |
| 40. | Quinnipiac University | 426 | 385,407(0.11%)#40 | 41,288,572(0.00%)#5,289 |
| 41. | Riverside | 402 | 385,407(0.10%)#41 | 41,288,572(0.00%)#5,411 |
| 42. | Long Hill | 396 | 385,407(0.10%)#42 | 41,288,572(0.00%)#5,448 |
| 43. | Sherwood Manor | 386 | 385,407(0.10%)#43 | 41,288,572(0.00%)#5,507 |
| 44. | Winsted | 339 | 385,407(0.09%)#44 | 41,288,572(0.00%)#5,835 |
| 45. | Glenville | 339 | 385,407(0.09%)#45 | 41,288,572(0.00%)#5,837 |
| 46. | Southwood Acres | 328 | 385,407(0.09%)#46 | 41,288,572(0.00%)#5,908 |
| 47. | Compo | 319 | 385,407(0.08%)#47 | 41,288,572(0.00%)#5,997 |
| 48. | Wallingford Center | 317 | 385,407(0.08%)#48 | 41,288,572(0.00%)#6,005 |
| 49. | Sandy Hook | 286 | 385,407(0.07%)#49 | 41,288,572(0.00%)#6,260 |
| 50. | Ridgefield | 280 | 385,407(0.07%)#50 | 41,288,572(0.00%)#6,310 |
| 51. | Northwest Harwinton | 277 | 385,407(0.07%)#51 | 41,288,572(0.00%)#6,334 |
| 52. | Trumbull Center | 275 | 385,407(0.07%)#52 | 41,288,572(0.00%)#6,353 |
| 53. | Byram | 259 | 385,407(0.07%)#53 | 41,288,572(0.00%)#6,492 |
| 54. | New Milford | 258 | 385,407(0.07%)#54 | 41,288,572(0.00%)#6,502 |
| 55. | Pawcatuck | 227 | 385,407(0.06%)#55 | 41,288,572(0.00%)#6,801 |
| 56. | Stratford Downtown | 222 | 385,407(0.06%)#56 | 41,288,572(0.00%)#6,864 |
| 57. | Hazardville | 219 | 385,407(0.06%)#57 | 41,288,572(0.00%)#6,890 |
| 58. | Cos Cob | 218 | 385,407(0.06%)#58 | 41,288,572(0.00%)#6,900 |
| 59. | Oakville | 213 | 385,407(0.06%)#59 | 41,288,572(0.00%)#6,968 |
| 60. | Branford Center | 205 | 385,407(0.05%)#60 | 41,288,572(0.00%)#7,075 |
| 61. | Danielson Borough | 194 | 385,407(0.05%)#61 | 41,288,572(0.00%)#7,215 |
| 62. | Putnam | 191 | 385,407(0.05%)#62 | 41,288,572(0.00%)#7,248 |
| 63. | Heritage Village | 185 | 385,407(0.05%)#63 | 41,288,572(0.00%)#7,346 |
| 64. | Watertown | 180 | 385,407(0.05%)#64 | 41,288,572(0.00%)#7,422 |
| 65. | Woodbury Center | 173 | 385,407(0.04%)#65 | 41,288,572(0.00%)#7,530 |
| 66. | Oxoboxo River | 170 | 385,407(0.04%)#66 | 41,288,572(0.00%)#7,587 |
| 67. | Collinsville | 166 | 385,407(0.04%)#67 | 41,288,572(0.00%)#7,666 |
| 68. | New Canaan | 144 | 385,407(0.04%)#68 | 41,288,572(0.00%)#8,046 |
| 69. | Canaan | 139 | 385,407(0.04%)#69 | 41,288,572(0.00%)#8,160 |
| 70. | Waterford | 137 | 385,407(0.04%)#70 | 41,288,572(0.00%)#8,191 |
| 71. | Clinton | 122 | 385,407(0.03%)#71 | 41,288,572(0.00%)#8,535 |
| 72. | Colchester | 121 | 385,407(0.03%)#72 | 41,288,572(0.00%)#8,556 |
| 73. | South Wilton | 120 | 385,407(0.03%)#73 | 41,288,572(0.00%)#8,591 |
| 74. | Fairfield University | 119 | 385,407(0.03%)#74 | 41,288,572(0.00%)#8,606 |
| 75. | Ridgebury | 118 | 385,407(0.03%)#75 | 41,288,572(0.00%)#8,633 |
| 76. | Suffield Depot | 110 | 385,407(0.03%)#76 | 41,288,572(0.00%)#8,846 |
| 77. | East | 108 | 385,407(0.03%)#77 | 41,288,572(0.00%)#8,882 |
| 78. | Thomaston | 107 | 385,407(0.03%)#78 | 41,288,572(0.00%)#8,907 |
| 79. | Brooklyn | 101 | 385,407(0.03%)#79 | 41,288,572(0.00%)#9,056 |
| 80. | Gales Ferry | 91 | 385,407(0.02%)#80 | 41,288,572(0.00%)#9,324 |
| 81. | Portland | 90 | 385,407(0.02%)#81 | 41,288,572(0.00%)#9,342 |
| 82. | Lordship | 87 | 385,407(0.02%)#82 | 41,288,572(0.00%)#9,438 |
| 83. | Glastonbury Center | 78 | 385,407(0.02%)#83 | 41,288,572(0.00%)#9,705 |
| 84. | Old Mystic | 78 | 385,407(0.02%)#84 | 41,288,572(0.00%)#9,716 |
| 85. | Wauregan | 74 | 385,407(0.02%)#85 | 41,288,572(0.00%)#9,872 |
| 86. | Moosup | 73 | 385,407(0.02%)#86 | 41,288,572(0.00%)#9,897 |
| 87. | Deep River Center | 70 | 385,407(0.02%)#87 | 41,288,572(0.00%)#10,027 |
| 88. | Noroton | 69 | 385,407(0.02%)#88 | 41,288,572(0.00%)#10,059 |
| 89. | Old Greenwich | 66 | 385,407(0.02%)#89 | 41,288,572(0.00%)#10,181 |
| 90. | Noroton Heights | 57 | 385,407(0.01%)#90 | 41,288,572(0.00%)#10,578 |
| 91. | Baltic | 56 | 385,407(0.01%)#91 | 41,288,572(0.00%)#10,638 |
| 92. | Tashua | 55 | 385,407(0.01%)#92 | 41,288,572(0.00%)#10,671 |
| 93. | Westbrook Center | 54 | 385,407(0.01%)#93 | 41,288,572(0.00%)#10,731 |
| 94. | Kensington | 53 | 385,407(0.01%)#94 | 41,288,572(0.00%)#10,770 |
| 95. | Mystic | 51 | 385,407(0.01%)#95 | 41,288,572(0.00%)#10,878 |
| 96. | Simsbury Center | 47 | 385,407(0.01%)#96 | 41,288,572(0.00%)#11,075 |
| 97. | Plantsville | 46 | 385,407(0.01%)#97 | 41,288,572(0.00%)#11,157 |
| 98. | Guilford Center | 44 | 385,407(0.01%)#98 | 41,288,572(0.00%)#11,265 |
| 99. | Staples | 41 | 385,407(0.01%)#99 | 41,288,572(0.00%)#11,428 |
| 100. | Chester Center | 41 | 385,407(0.01%)#100 | 41,288,572(0.00%)#11,451 |
Common Questions
What are the Top 10 Cities with the Largest Black / African American Community in Connecticut?
Top 10 Cities with the Largest Black / African American Community in Connecticut are:
#1
43,747
#2
40,592
#3
32,196
#4
32,046
#5
25,207
#6
16,324
#7
13,407
#8
11,512
#9
9,880
#10
9,822
What city has the Largest Black / African American Community in Connecticut?
Hartford has the Largest Black / African American Community in Connecticut with 43,747.
What is the Total Black / African American Population in the State of Connecticut?
Total Black / African American Population in Connecticut is 385,407.
What is the Total Black / African American Population in the United States?
Total Black / African American Population in the United States is 41,288,572.