Cities with the Largest Black / African American Community in Ohio
RELATED REPORTS & OPTIONS
Black / African American
Ohio
Compare Cities
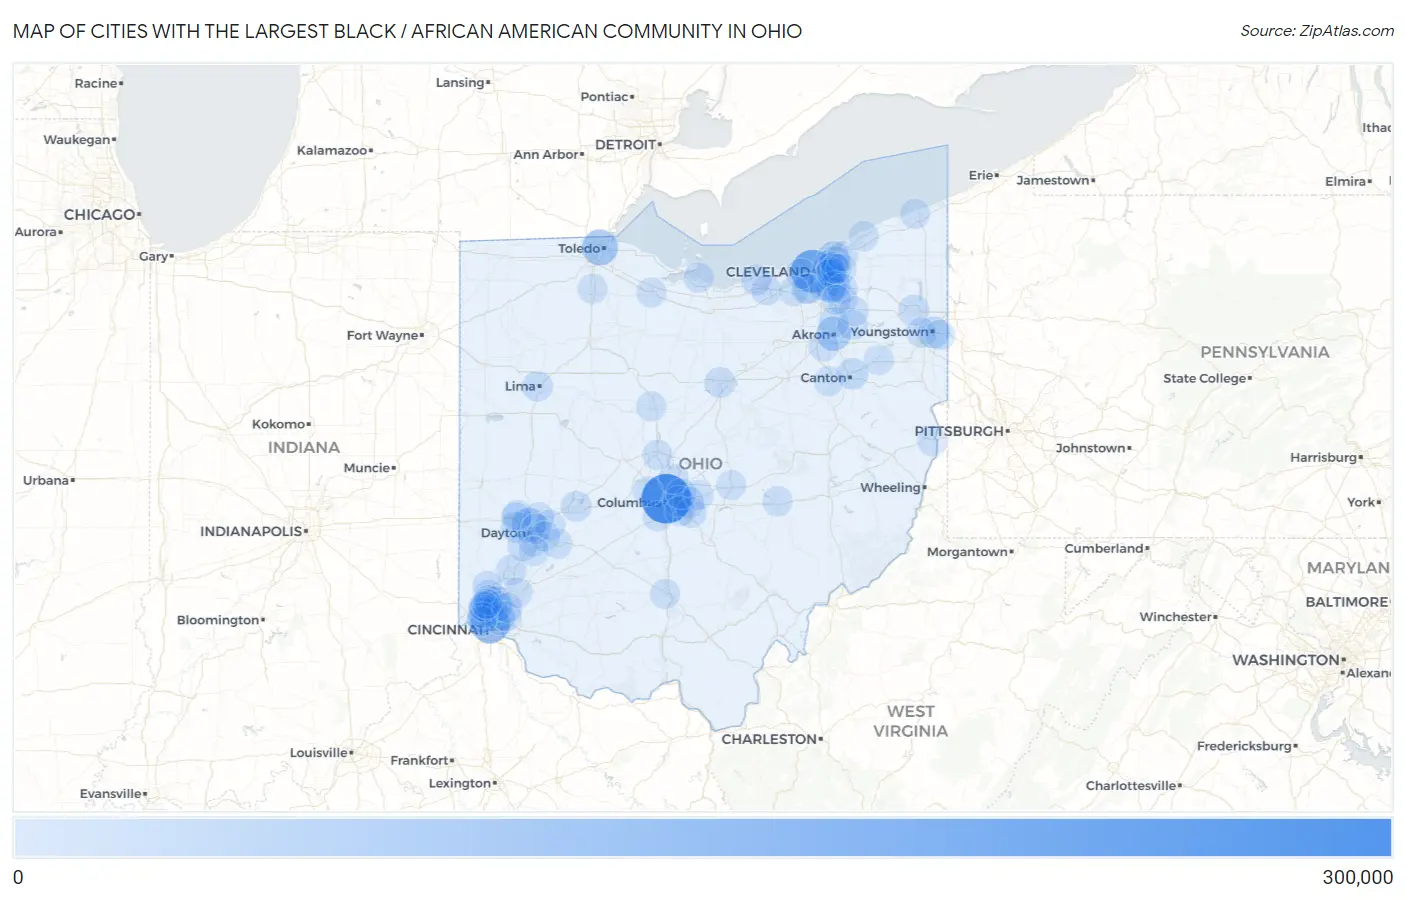
Map of Cities with the Largest Black / African American Community in Ohio
0
300,000
Cities with the Largest Black / African American Community in Ohio
| City | Black / African American | vs State | vs National | |
| 1. | Columbus | 263,000 | 1,449,450(18.14%)#1 | 41,288,572(0.64%)#13 |
| 2. | Cleveland | 172,571 | 1,449,450(11.91%)#2 | 41,288,572(0.42%)#20 |
| 3. | Cincinnati | 122,384 | 1,449,450(8.44%)#3 | 41,288,572(0.30%)#31 |
| 4. | Toledo | 75,862 | 1,449,450(5.23%)#4 | 41,288,572(0.18%)#58 |
| 5. | Akron | 56,085 | 1,449,450(3.87%)#5 | 41,288,572(0.14%)#80 |
| 6. | Dayton | 52,202 | 1,449,450(3.60%)#6 | 41,288,572(0.13%)#89 |
| 7. | Euclid | 32,679 | 1,449,450(2.25%)#7 | 41,288,572(0.08%)#144 |
| 8. | Youngstown | 25,124 | 1,449,450(1.73%)#8 | 41,288,572(0.06%)#199 |
| 9. | Cleveland Heights | 18,778 | 1,449,450(1.30%)#9 | 41,288,572(0.05%)#277 |
| 10. | Canton | 17,705 | 1,449,450(1.22%)#10 | 41,288,572(0.04%)#294 |
| 11. | Maple Heights | 17,135 | 1,449,450(1.18%)#11 | 41,288,572(0.04%)#304 |
| 12. | Garfield Heights | 16,701 | 1,449,450(1.15%)#12 | 41,288,572(0.04%)#317 |
| 13. | Trotwood | 15,022 | 1,449,450(1.04%)#13 | 41,288,572(0.04%)#349 |
| 14. | Warrensville Heights | 12,834 | 1,449,450(0.89%)#14 | 41,288,572(0.03%)#421 |
| 15. | East Cleveland | 12,251 | 1,449,450(0.85%)#15 | 41,288,572(0.03%)#442 |
| 16. | Reynoldsburg | 12,206 | 1,449,450(0.84%)#16 | 41,288,572(0.03%)#444 |
| 17. | South Euclid | 11,297 | 1,449,450(0.78%)#17 | 41,288,572(0.03%)#484 |
| 18. | Forest Park | 11,023 | 1,449,450(0.76%)#18 | 41,288,572(0.03%)#497 |
| 19. | Warren | 10,998 | 1,449,450(0.76%)#19 | 41,288,572(0.03%)#500 |
| 20. | Lorain | 10,891 | 1,449,450(0.75%)#20 | 41,288,572(0.03%)#504 |
| 21. | Shaker Heights | 10,379 | 1,449,450(0.72%)#21 | 41,288,572(0.03%)#532 |
| 22. | Springfield | 10,210 | 1,449,450(0.70%)#22 | 41,288,572(0.02%)#542 |
| 23. | Mansfield | 9,236 | 1,449,450(0.64%)#23 | 41,288,572(0.02%)#607 |
| 24. | Lima | 8,359 | 1,449,450(0.58%)#24 | 41,288,572(0.02%)#677 |
| 25. | Whitehall | 8,337 | 1,449,450(0.58%)#25 | 41,288,572(0.02%)#678 |
| 26. | Bedford Heights | 8,221 | 1,449,450(0.57%)#26 | 41,288,572(0.02%)#688 |
| 27. | Fairfield | 7,834 | 1,449,450(0.54%)#27 | 41,288,572(0.02%)#721 |
| 28. | Bedford | 7,277 | 1,449,450(0.50%)#28 | 41,288,572(0.02%)#769 |
| 29. | Huber Heights | 6,862 | 1,449,450(0.47%)#29 | 41,288,572(0.02%)#805 |
| 30. | Elyria | 6,616 | 1,449,450(0.46%)#30 | 41,288,572(0.02%)#828 |
| 31. | Richmond Heights | 6,428 | 1,449,450(0.44%)#31 | 41,288,572(0.02%)#847 |
| 32. | Middletown | 5,958 | 1,449,450(0.41%)#32 | 41,288,572(0.01%)#910 |
| 33. | North College Hill | 5,793 | 1,449,450(0.40%)#33 | 41,288,572(0.01%)#933 |
| 34. | Sandusky | 5,758 | 1,449,450(0.40%)#34 | 41,288,572(0.01%)#936 |
| 35. | Hamilton | 5,608 | 1,449,450(0.39%)#35 | 41,288,572(0.01%)#958 |
| 36. | Northbrook | 4,714 | 1,449,450(0.33%)#36 | 41,288,572(0.01%)#1,106 |
| 37. | Finneytown | 4,576 | 1,449,450(0.32%)#37 | 41,288,572(0.01%)#1,139 |
| 38. | Pickerington | 4,543 | 1,449,450(0.31%)#38 | 41,288,572(0.01%)#1,147 |
| 39. | Gahanna | 4,487 | 1,449,450(0.31%)#39 | 41,288,572(0.01%)#1,155 |
| 40. | Springdale | 4,190 | 1,449,450(0.29%)#40 | 41,288,572(0.01%)#1,235 |
| 41. | Parma | 3,934 | 1,449,450(0.27%)#41 | 41,288,572(0.01%)#1,307 |
| 42. | Clayton | 3,917 | 1,449,450(0.27%)#42 | 41,288,572(0.01%)#1,314 |
| 43. | Mayfield Heights | 3,363 | 1,449,450(0.23%)#43 | 41,288,572(0.01%)#1,468 |
| 44. | Twinsburg | 3,337 | 1,449,450(0.23%)#44 | 41,288,572(0.01%)#1,484 |
| 45. | Marion | 3,320 | 1,449,450(0.23%)#45 | 41,288,572(0.01%)#1,497 |
| 46. | Parma Heights | 3,306 | 1,449,450(0.23%)#46 | 41,288,572(0.01%)#1,503 |
| 47. | Mount Healthy | 3,288 | 1,449,450(0.23%)#47 | 41,288,572(0.01%)#1,508 |
| 48. | Kettering | 3,231 | 1,449,450(0.22%)#48 | 41,288,572(0.01%)#1,529 |
| 49. | Fairborn | 3,178 | 1,449,450(0.22%)#49 | 41,288,572(0.01%)#1,550 |
| 50. | University Heights | 3,167 | 1,449,450(0.22%)#50 | 41,288,572(0.01%)#1,553 |
| 51. | Groesbeck | 3,004 | 1,449,450(0.21%)#51 | 41,288,572(0.01%)#1,618 |
| 52. | Painesville | 2,989 | 1,449,450(0.21%)#52 | 41,288,572(0.01%)#1,625 |
| 53. | Lakewood | 2,978 | 1,449,450(0.21%)#53 | 41,288,572(0.01%)#1,628 |
| 54. | Fort Mckinley | 2,916 | 1,449,450(0.20%)#54 | 41,288,572(0.01%)#1,657 |
| 55. | Solon | 2,795 | 1,449,450(0.19%)#55 | 41,288,572(0.01%)#1,700 |
| 56. | Westerville | 2,716 | 1,449,450(0.19%)#56 | 41,288,572(0.01%)#1,728 |
| 57. | Norwood | 2,711 | 1,449,450(0.19%)#57 | 41,288,572(0.01%)#1,732 |
| 58. | New Burlington | 2,706 | 1,449,450(0.19%)#58 | 41,288,572(0.01%)#1,737 |
| 59. | White Oak | 2,679 | 1,449,450(0.18%)#59 | 41,288,572(0.01%)#1,751 |
| 60. | Blacklick Estates | 2,592 | 1,449,450(0.18%)#60 | 41,288,572(0.01%)#1,804 |
| 61. | Xenia | 2,495 | 1,449,450(0.17%)#61 | 41,288,572(0.01%)#1,864 |
| 62. | Cuyahoga Falls | 2,444 | 1,449,450(0.17%)#62 | 41,288,572(0.01%)#1,899 |
| 63. | Steubenville | 2,443 | 1,449,450(0.17%)#63 | 41,288,572(0.01%)#1,900 |
| 64. | Austintown | 2,414 | 1,449,450(0.17%)#64 | 41,288,572(0.01%)#1,917 |
| 65. | Kent | 2,397 | 1,449,450(0.17%)#65 | 41,288,572(0.01%)#1,927 |
| 66. | Barberton | 2,346 | 1,449,450(0.16%)#66 | 41,288,572(0.01%)#1,961 |
| 67. | Massillon | 2,316 | 1,449,450(0.16%)#67 | 41,288,572(0.01%)#1,979 |
| 68. | Golf Manor | 2,260 | 1,449,450(0.16%)#68 | 41,288,572(0.01%)#2,011 |
| 69. | Woodlawn | 2,257 | 1,449,450(0.16%)#69 | 41,288,572(0.01%)#2,013 |
| 70. | Willoughby Hills | 2,206 | 1,449,450(0.15%)#70 | 41,288,572(0.01%)#2,043 |
| 71. | Silverton | 2,193 | 1,449,450(0.15%)#71 | 41,288,572(0.01%)#2,054 |
| 72. | Zanesville | 2,180 | 1,449,450(0.15%)#72 | 41,288,572(0.01%)#2,062 |
| 73. | Pleasant Run Farm | 2,065 | 1,449,450(0.14%)#73 | 41,288,572(0.01%)#2,167 |
| 74. | Englewood | 2,062 | 1,449,450(0.14%)#74 | 41,288,572(0.00%)#2,171 |
| 75. | Delaware | 2,051 | 1,449,450(0.14%)#75 | 41,288,572(0.00%)#2,180 |
| 76. | Lyndhurst | 1,982 | 1,449,450(0.14%)#76 | 41,288,572(0.00%)#2,235 |
| 77. | Alliance | 1,933 | 1,449,450(0.13%)#77 | 41,288,572(0.00%)#2,276 |
| 78. | West Carrollton | 1,870 | 1,449,450(0.13%)#78 | 41,288,572(0.00%)#2,331 |
| 79. | Chillicothe | 1,794 | 1,449,450(0.12%)#79 | 41,288,572(0.00%)#2,387 |
| 80. | Mason | 1,765 | 1,449,450(0.12%)#80 | 41,288,572(0.00%)#2,414 |
| 81. | Riverside | 1,726 | 1,449,450(0.12%)#81 | 41,288,572(0.00%)#2,442 |
| 82. | Monfort Heights | 1,698 | 1,449,450(0.12%)#82 | 41,288,572(0.00%)#2,463 |
| 83. | Newark | 1,674 | 1,449,450(0.12%)#83 | 41,288,572(0.00%)#2,476 |
| 84. | Cheviot | 1,659 | 1,449,450(0.11%)#84 | 41,288,572(0.00%)#2,488 |
| 85. | Grove City | 1,638 | 1,449,450(0.11%)#85 | 41,288,572(0.00%)#2,514 |
| 86. | Berea | 1,615 | 1,449,450(0.11%)#86 | 41,288,572(0.00%)#2,545 |
| 87. | Bowling Green | 1,599 | 1,449,450(0.11%)#87 | 41,288,572(0.00%)#2,556 |
| 88. | Hilliard | 1,588 | 1,449,450(0.11%)#88 | 41,288,572(0.00%)#2,571 |
| 89. | Campbell | 1,554 | 1,449,450(0.11%)#89 | 41,288,572(0.00%)#2,606 |
| 90. | Ashtabula | 1,518 | 1,449,450(0.10%)#90 | 41,288,572(0.00%)#2,647 |
| 91. | Pataskala | 1,512 | 1,449,450(0.10%)#91 | 41,288,572(0.00%)#2,655 |
| 92. | Beavercreek | 1,500 | 1,449,450(0.10%)#92 | 41,288,572(0.00%)#2,672 |
| 93. | Oakwood Village Cuyahoga County | 1,499 | 1,449,450(0.10%)#93 | 41,288,572(0.00%)#2,678 |
| 94. | Fremont | 1,495 | 1,449,450(0.10%)#94 | 41,288,572(0.00%)#2,686 |
| 95. | Northgate | 1,484 | 1,449,450(0.10%)#95 | 41,288,572(0.00%)#2,697 |
| 96. | Centerville | 1,406 | 1,449,450(0.10%)#96 | 41,288,572(0.00%)#2,790 |
| 97. | Streetsboro | 1,393 | 1,449,450(0.10%)#97 | 41,288,572(0.00%)#2,810 |
| 98. | Blue Ash | 1,371 | 1,449,450(0.09%)#98 | 41,288,572(0.00%)#2,837 |
| 99. | Mount Healthy Heights | 1,338 | 1,449,450(0.09%)#99 | 41,288,572(0.00%)#2,872 |
| 100. | Macedonia | 1,305 | 1,449,450(0.09%)#100 | 41,288,572(0.00%)#2,906 |
Common Questions
What are the Top 10 Cities with the Largest Black / African American Community in Ohio?
Top 10 Cities with the Largest Black / African American Community in Ohio are:
#1
263,000
#2
172,571
#3
122,384
#4
75,862
#5
56,085
#6
52,202
#7
32,679
#8
25,124
#9
18,778
#10
17,705
What city has the Largest Black / African American Community in Ohio?
Columbus has the Largest Black / African American Community in Ohio with 263,000.
What is the Total Black / African American Population in the State of Ohio?
Total Black / African American Population in Ohio is 1,449,450.
What is the Total Black / African American Population in the United States?
Total Black / African American Population in the United States is 41,288,572.