Apple Valley, CA Map & Demographics
Apple Valley Map
Apple Valley Overview
$29,010
PER CAPITA INCOME
$73,670
AVG FAMILY INCOME
$62,898
AVG HOUSEHOLD INCOME
43.3%
WAGE / INCOME GAP [ % ]
56.7¢/ $1
WAGE / INCOME GAP [ $ ]
$12,297
FAMILY INCOME DEFICIT
0.44
INEQUALITY / GINI INDEX
75,603
TOTAL POPULATION
37,188
MALE POPULATION
38,415
FEMALE POPULATION
96.81
MALES / 100 FEMALES
103.30
FEMALES / 100 MALES
36.1
MEDIAN AGE
3.5
AVG FAMILY SIZE
3.0
AVG HOUSEHOLD SIZE
30,052
LABOR FORCE [ PEOPLE ]
53.4%
PERCENT IN LABOR FORCE
9.2%
UNEMPLOYMENT RATE
Apple Valley Area Codes
Income in Apple Valley
Income Overview in Apple Valley
Per Capita Income in Apple Valley is $29,010, while median incomes of families and households are $73,670 and $62,898 respectively.
| Characteristic | Number | Measure |
| Per Capita Income | 75,603 | $29,010 |
| Median Family Income | 18,210 | $73,670 |
| Mean Family Income | 18,210 | $93,372 |
| Median Household Income | 24,777 | $62,898 |
| Mean Household Income | 24,777 | $86,248 |
| Income Deficit | 18,210 | $12,297 |
| Wage / Income Gap (%) | 75,603 | 43.32% |
| Wage / Income Gap ($) | 75,603 | 56.68¢ per $1 |
| Gini / Inequality Index | 75,603 | 0.44 |
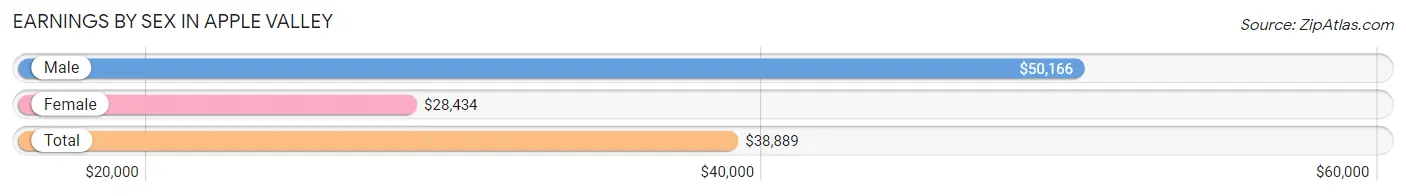
Earnings by Sex in Apple Valley
Average Earnings in Apple Valley are $38,889, $50,166 for men and $28,434 for women, a difference of 43.3%.
| Sex | Number | Average Earnings |
| Male | 16,045 (53.0%) | $50,166 |
| Female | 14,219 (47.0%) | $28,434 |
| Total | 30,264 (100.0%) | $38,889 |
Earnings by Sex by Income Bracket in Apple Valley
The most common earnings brackets in Apple Valley are $100,000+ for men (2,711 | 16.9%) and $25,000 to $29,999 for women (1,189 | 8.4%).
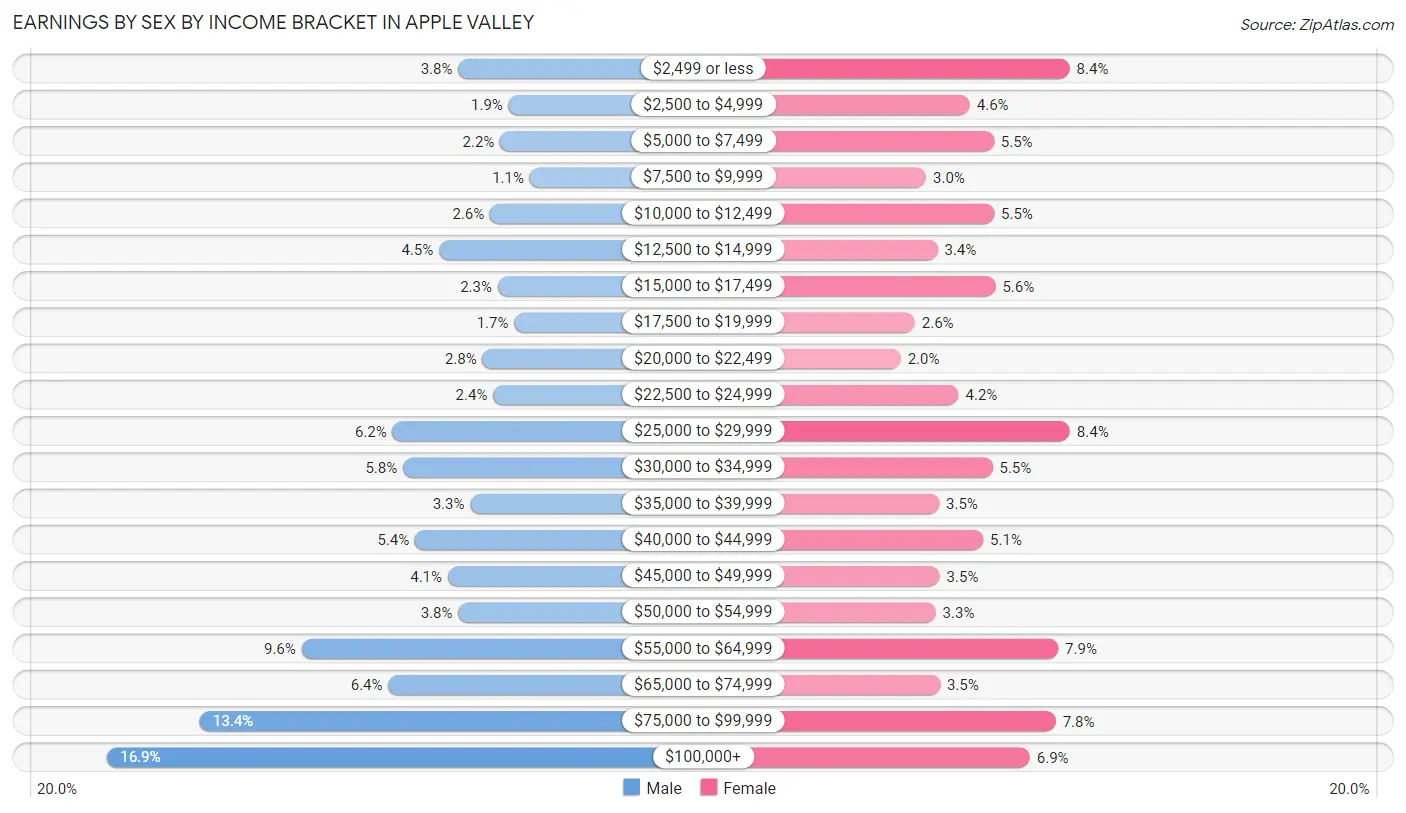
| Income | Male | Female |
| $2,499 or less | 602 (3.7%) | 1,187 (8.4%) |
| $2,500 to $4,999 | 299 (1.9%) | 656 (4.6%) |
| $5,000 to $7,499 | 349 (2.2%) | 783 (5.5%) |
| $7,500 to $9,999 | 171 (1.1%) | 422 (3.0%) |
| $10,000 to $12,499 | 410 (2.6%) | 785 (5.5%) |
| $12,500 to $14,999 | 717 (4.5%) | 483 (3.4%) |
| $15,000 to $17,499 | 364 (2.3%) | 792 (5.6%) |
| $17,500 to $19,999 | 265 (1.7%) | 363 (2.5%) |
| $20,000 to $22,499 | 456 (2.8%) | 287 (2.0%) |
| $22,500 to $24,999 | 391 (2.4%) | 596 (4.2%) |
| $25,000 to $29,999 | 997 (6.2%) | 1,189 (8.4%) |
| $30,000 to $34,999 | 934 (5.8%) | 777 (5.5%) |
| $35,000 to $39,999 | 529 (3.3%) | 492 (3.5%) |
| $40,000 to $44,999 | 862 (5.4%) | 727 (5.1%) |
| $45,000 to $49,999 | 665 (4.1%) | 495 (3.5%) |
| $50,000 to $54,999 | 602 (3.7%) | 474 (3.3%) |
| $55,000 to $64,999 | 1,544 (9.6%) | 1,126 (7.9%) |
| $65,000 to $74,999 | 1,022 (6.4%) | 496 (3.5%) |
| $75,000 to $99,999 | 2,155 (13.4%) | 1,113 (7.8%) |
| $100,000+ | 2,711 (16.9%) | 976 (6.9%) |
| Total | 16,045 (100.0%) | 14,219 (100.0%) |
Earnings by Sex by Educational Attainment in Apple Valley
Average earnings in Apple Valley are $56,055 for men and $32,972 for women, a difference of 41.2%. Men with an educational attainment of graduate degree enjoy the highest average annual earnings of $101,417, while those with less than high school education earn the least with $34,521. Women with an educational attainment of graduate degree earn the most with the average annual earnings of $62,663, while those with less than high school education have the smallest earnings of $17,262.
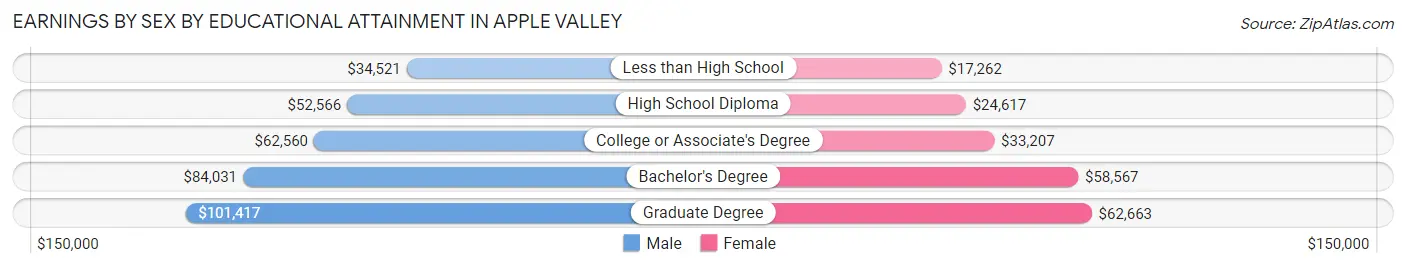
| Educational Attainment | Male Income | Female Income |
| Less than High School | $34,521 | $17,262 |
| High School Diploma | $52,566 | $24,617 |
| College or Associate's Degree | $62,560 | $33,207 |
| Bachelor's Degree | $84,031 | $58,567 |
| Graduate Degree | $101,417 | $62,663 |
| Total | $56,055 | $32,972 |
Family Income in Apple Valley
Family Income Brackets in Apple Valley
According to the Apple Valley family income data, there are 3,150 families falling into the $100,000 to $149,999 income range, which is the most common income bracket and makes up 17.3% of all families. Conversely, the $10,000 to $14,999 income bracket is the least frequent group with only 473 families (2.6%) belonging to this category.
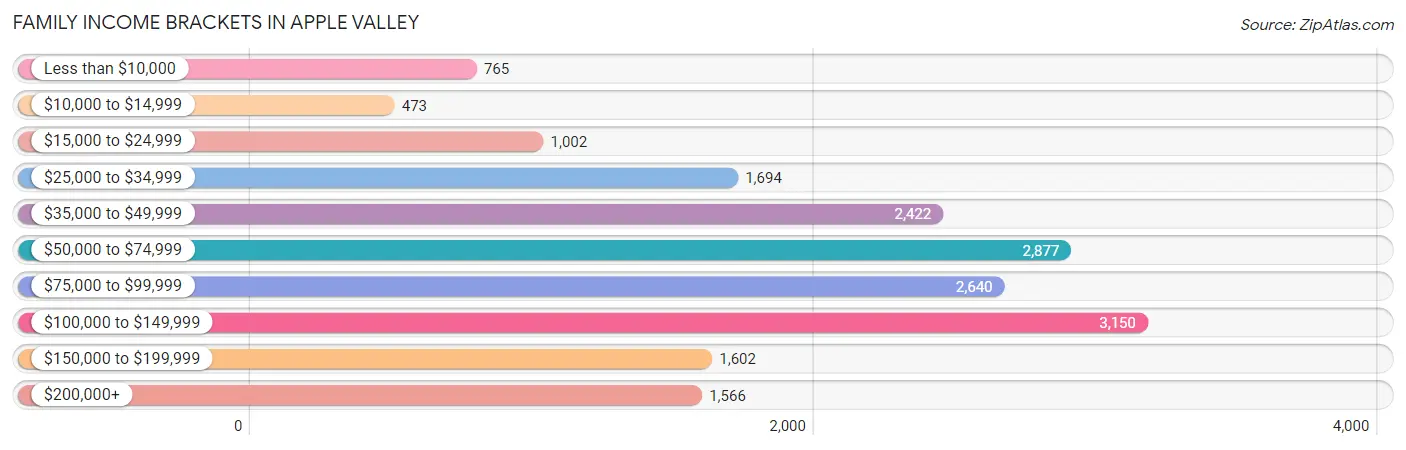
| Income Bracket | # Families | % Families |
| Less than $10,000 | 765 | 4.2% |
| $10,000 to $14,999 | 473 | 2.6% |
| $15,000 to $24,999 | 1,002 | 5.5% |
| $25,000 to $34,999 | 1,694 | 9.3% |
| $35,000 to $49,999 | 2,422 | 13.3% |
| $50,000 to $74,999 | 2,877 | 15.8% |
| $75,000 to $99,999 | 2,640 | 14.5% |
| $100,000 to $149,999 | 3,150 | 17.3% |
| $150,000 to $199,999 | 1,602 | 8.8% |
| $200,000+ | 1,566 | 8.6% |
Family Income by Famaliy Size in Apple Valley
6-person families (991 | 5.4%) account for the highest median family income in Apple Valley with $101,627 per family, while 2-person families (7,371 | 40.5%) have the highest median income of $31,604 per family member.
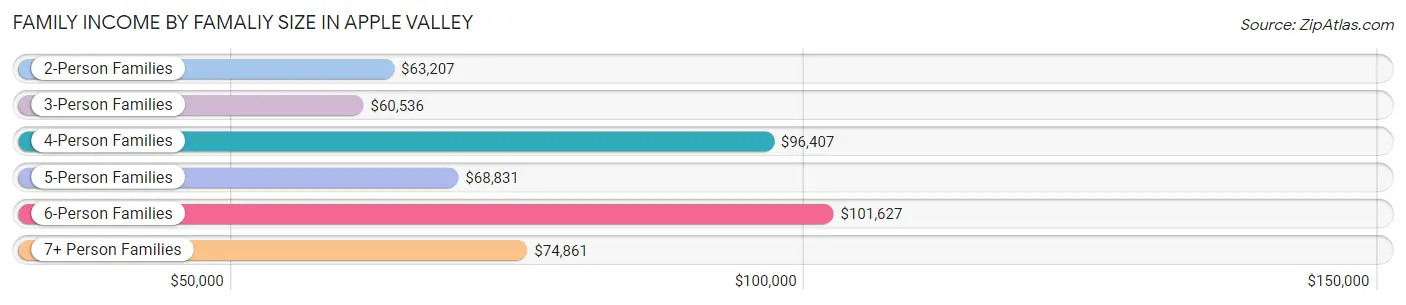
| Income Bracket | # Families | Median Income |
| 2-Person Families | 7,371 (40.5%) | $63,207 |
| 3-Person Families | 3,795 (20.8%) | $60,536 |
| 4-Person Families | 3,523 (19.4%) | $96,407 |
| 5-Person Families | 1,953 (10.7%) | $68,831 |
| 6-Person Families | 991 (5.4%) | $101,627 |
| 7+ Person Families | 577 (3.2%) | $74,861 |
| Total | 18,210 (100.0%) | $73,670 |
Family Income by Number of Earners in Apple Valley
The median family income in Apple Valley is $73,670, with families comprising 3+ earners (1,691) having the highest median family income of $126,694, while families with no earners (4,197) have the lowest median family income of $48,121, accounting for 9.3% and 23.1% of families, respectively.
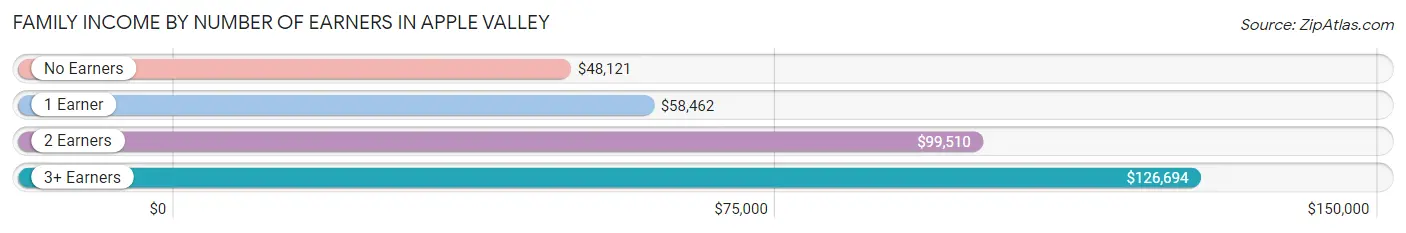
| Number of Earners | # Families | Median Income |
| No Earners | 4,197 (23.1%) | $48,121 |
| 1 Earner | 6,849 (37.6%) | $58,462 |
| 2 Earners | 5,473 (30.0%) | $99,510 |
| 3+ Earners | 1,691 (9.3%) | $126,694 |
| Total | 18,210 (100.0%) | $73,670 |
Household Income in Apple Valley
Household Income Brackets in Apple Valley
With 3,940 households falling in the category, the $50,000 to $74,999 income range is the most frequent in Apple Valley, accounting for 15.9% of all households. In contrast, only 1,065 households (4.3%) fall into the $10,000 to $14,999 income bracket, making it the least populous group.
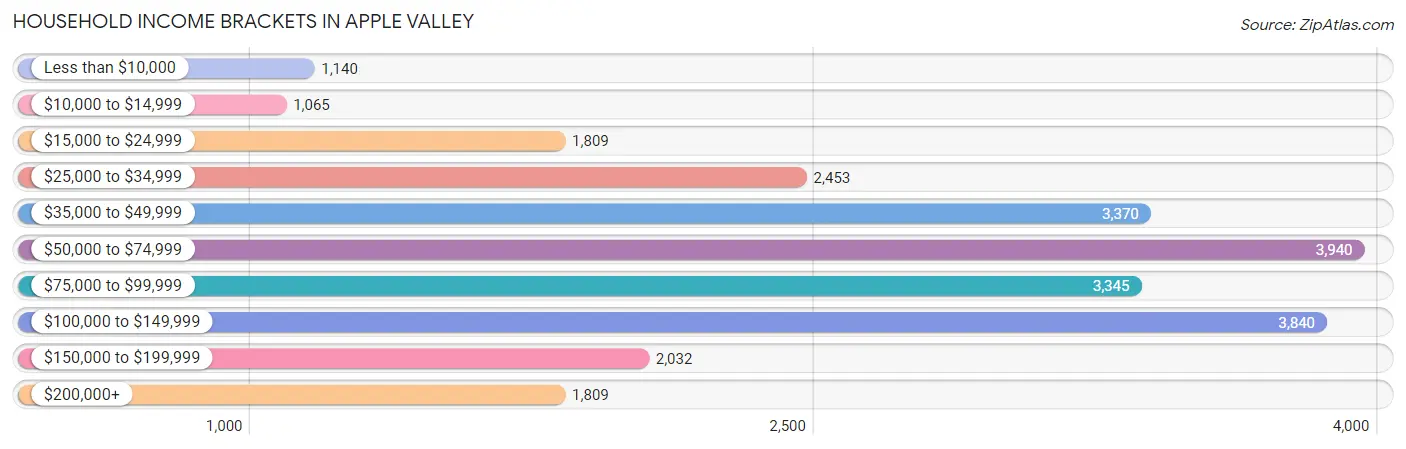
| Income Bracket | # Households | % Households |
| Less than $10,000 | 1,140 | 4.6% |
| $10,000 to $14,999 | 1,065 | 4.3% |
| $15,000 to $24,999 | 1,809 | 7.3% |
| $25,000 to $34,999 | 2,453 | 9.9% |
| $35,000 to $49,999 | 3,370 | 13.6% |
| $50,000 to $74,999 | 3,940 | 15.9% |
| $75,000 to $99,999 | 3,345 | 13.5% |
| $100,000 to $149,999 | 3,840 | 15.5% |
| $150,000 to $199,999 | 2,032 | 8.2% |
| $200,000+ | 1,809 | 7.3% |
Household Income by Householder Age in Apple Valley
The median household income in Apple Valley is $62,898, with the highest median household income of $74,059 found in the 25 to 44 years age bracket for the primary householder. A total of 7,805 households (31.5%) fall into this category. Meanwhile, the 15 to 24 years age bracket for the primary householder has the lowest median household income of $24,846, with 809 households (3.3%) in this group.
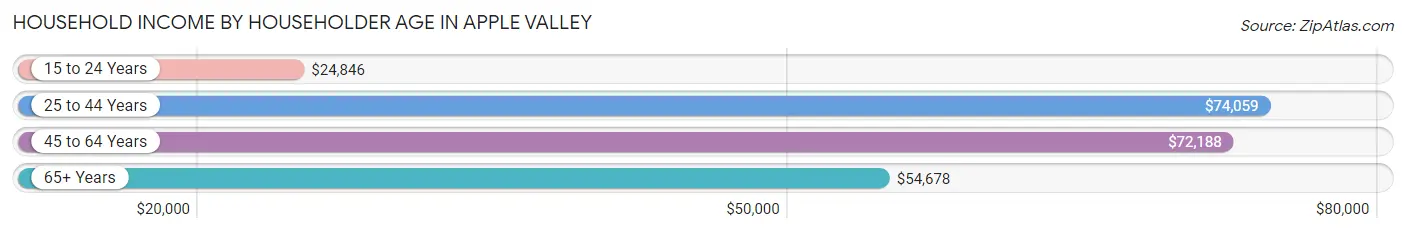
| Income Bracket | # Households | Median Income |
| 15 to 24 Years | 809 (3.3%) | $24,846 |
| 25 to 44 Years | 7,805 (31.5%) | $74,059 |
| 45 to 64 Years | 8,950 (36.1%) | $72,188 |
| 65+ Years | 7,213 (29.1%) | $54,678 |
| Total | 24,777 (100.0%) | $62,898 |
Poverty in Apple Valley
Income Below Poverty by Sex and Age in Apple Valley
With 16.1% poverty level for males and 17.9% for females among the residents of Apple Valley, under 5 year old males and 15 year old females are the most vulnerable to poverty, with 771 males (27.7%) and 245 females (47.8%) in their respective age groups living below the poverty level.
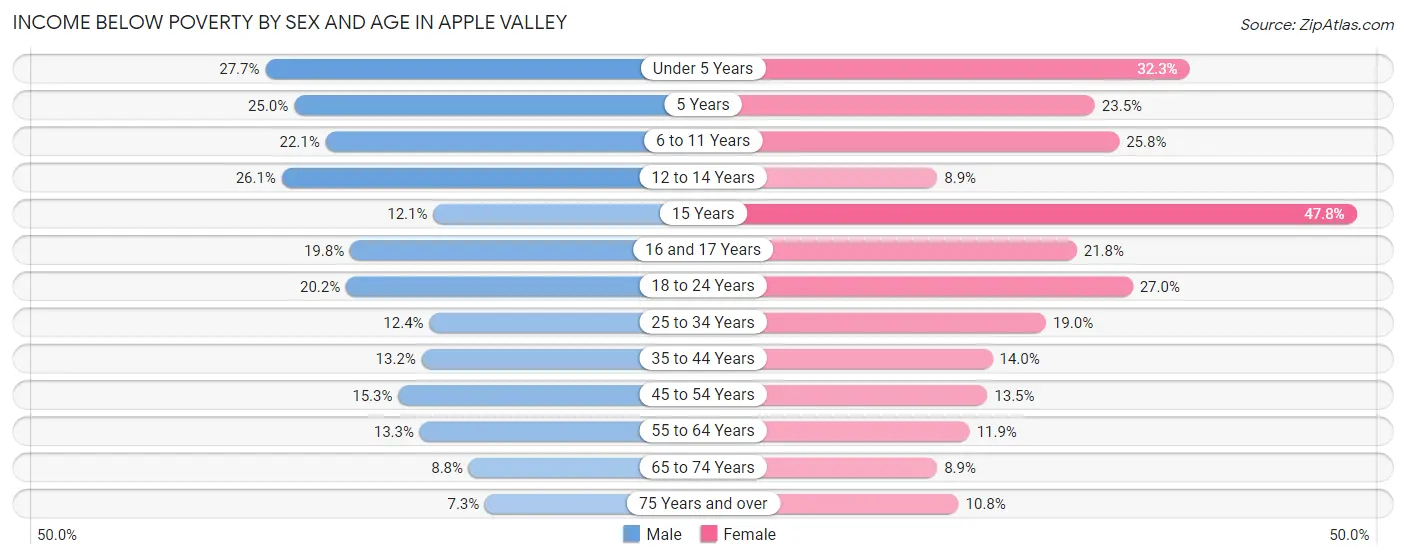
| Age Bracket | Male | Female |
| Under 5 Years | 771 (27.7%) | 923 (32.3%) |
| 5 Years | 115 (25.0%) | 113 (23.5%) |
| 6 to 11 Years | 832 (22.1%) | 968 (25.8%) |
| 12 to 14 Years | 516 (26.1%) | 122 (8.9%) |
| 15 Years | 106 (12.1%) | 245 (47.8%) |
| 16 and 17 Years | 261 (19.8%) | 258 (21.8%) |
| 18 to 24 Years | 519 (20.2%) | 971 (27.0%) |
| 25 to 34 Years | 518 (12.4%) | 849 (19.0%) |
| 35 to 44 Years | 581 (13.2%) | 631 (14.0%) |
| 45 to 54 Years | 632 (15.3%) | 545 (13.5%) |
| 55 to 64 Years | 610 (13.3%) | 560 (11.9%) |
| 65 to 74 Years | 285 (8.8%) | 345 (8.9%) |
| 75 Years and over | 189 (7.3%) | 278 (10.8%) |
| Total | 5,935 (16.1%) | 6,808 (17.9%) |
Income Above Poverty by Sex and Age in Apple Valley
According to the poverty statistics in Apple Valley, males aged 75 years and over and females aged 65 to 74 years are the age groups that are most secure financially, with 92.7% of males and 91.1% of females in these age groups living above the poverty line.
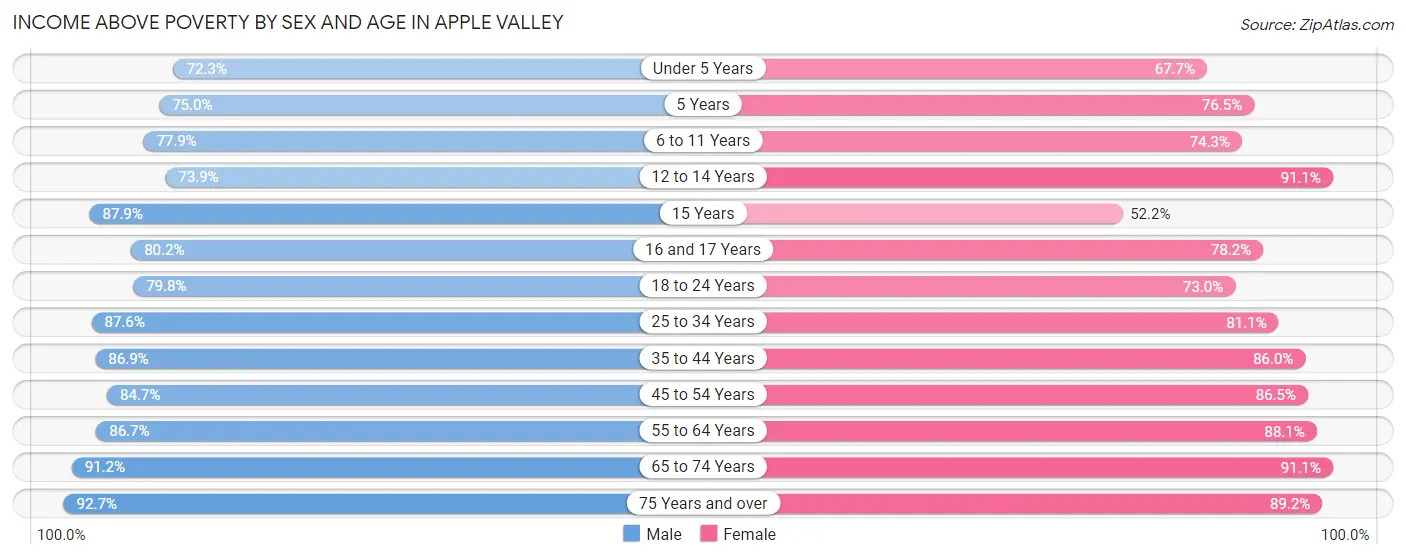
| Age Bracket | Male | Female |
| Under 5 Years | 2,016 (72.3%) | 1,938 (67.7%) |
| 5 Years | 345 (75.0%) | 368 (76.5%) |
| 6 to 11 Years | 2,938 (77.9%) | 2,791 (74.3%) |
| 12 to 14 Years | 1,458 (73.9%) | 1,254 (91.1%) |
| 15 Years | 772 (87.9%) | 268 (52.2%) |
| 16 and 17 Years | 1,057 (80.2%) | 925 (78.2%) |
| 18 to 24 Years | 2,054 (79.8%) | 2,625 (73.0%) |
| 25 to 34 Years | 3,649 (87.6%) | 3,631 (81.0%) |
| 35 to 44 Years | 3,837 (86.9%) | 3,878 (86.0%) |
| 45 to 54 Years | 3,493 (84.7%) | 3,489 (86.5%) |
| 55 to 64 Years | 3,970 (86.7%) | 4,159 (88.1%) |
| 65 to 74 Years | 2,965 (91.2%) | 3,551 (91.1%) |
| 75 Years and over | 2,416 (92.7%) | 2,287 (89.2%) |
| Total | 30,970 (83.9%) | 31,164 (82.1%) |
Income Below Poverty Among Married-Couple Families in Apple Valley
The poverty statistics for married-couple families in Apple Valley show that 7.1% or 966 of the total 13,615 families live below the poverty line. Families with 5 or more children have the highest poverty rate of 39.4%, comprising of 102 families. On the other hand, families with no children have the lowest poverty rate of 3.8%, which includes 287 families.
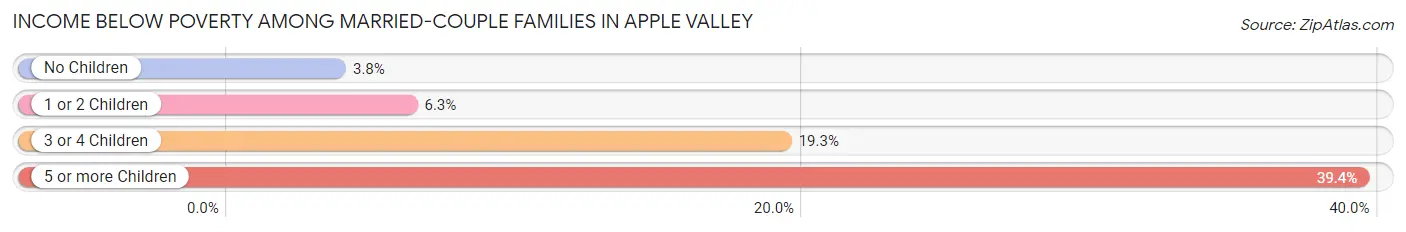
| Children | Above Poverty | Below Poverty |
| No Children | 7,354 (96.2%) | 287 (3.8%) |
| 1 or 2 Children | 3,777 (93.8%) | 252 (6.2%) |
| 3 or 4 Children | 1,361 (80.7%) | 325 (19.3%) |
| 5 or more Children | 157 (60.6%) | 102 (39.4%) |
| Total | 12,649 (92.9%) | 966 (7.1%) |
Income Below Poverty Among Single-Parent Households in Apple Valley
According to the poverty data in Apple Valley, 20.0% or 277 single-father households and 31.1% or 998 single-mother households are living below the poverty line. Among single-father households, those with 1 or 2 children have the highest poverty rate, with 178 households (32.2%) experiencing poverty. Likewise, among single-mother households, those with 5 or more children have the highest poverty rate, with 20 households (100.0%) falling below the poverty line.
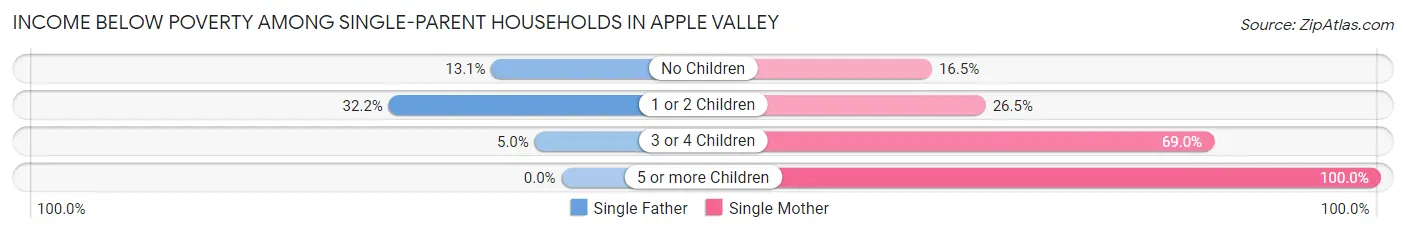
| Children | Single Father | Single Mother |
| No Children | 93 (13.1%) | 176 (16.5%) |
| 1 or 2 Children | 178 (32.2%) | 411 (26.5%) |
| 3 or 4 Children | 6 (5.0%) | 391 (69.0%) |
| 5 or more Children | 0 (0.0%) | 20 (100.0%) |
| Total | 277 (20.0%) | 998 (31.1%) |
Income Below Poverty Among Married-Couple vs Single-Parent Households in Apple Valley
The poverty data for Apple Valley shows that 966 of the married-couple family households (7.1%) and 1,275 of the single-parent households (27.8%) are living below the poverty level. Within the married-couple family households, those with 5 or more children have the highest poverty rate, with 102 households (39.4%) falling below the poverty line. Among the single-parent households, those with 5 or more children have the highest poverty rate, with 20 household (100.0%) living below poverty.
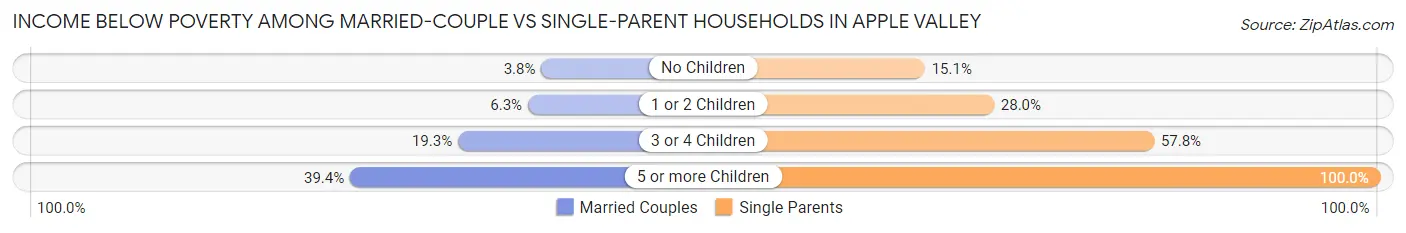
| Children | Married-Couple Families | Single-Parent Households |
| No Children | 287 (3.8%) | 269 (15.1%) |
| 1 or 2 Children | 252 (6.2%) | 589 (28.0%) |
| 3 or 4 Children | 325 (19.3%) | 397 (57.8%) |
| 5 or more Children | 102 (39.4%) | 20 (100.0%) |
| Total | 966 (7.1%) | 1,275 (27.8%) |
Race in Apple Valley
The most populous races in Apple Valley are White / Caucasian (46,528 | 61.5%), Hispanic or Latino (29,479 | 39.0%), and Two or more Races (12,626 | 16.7%).
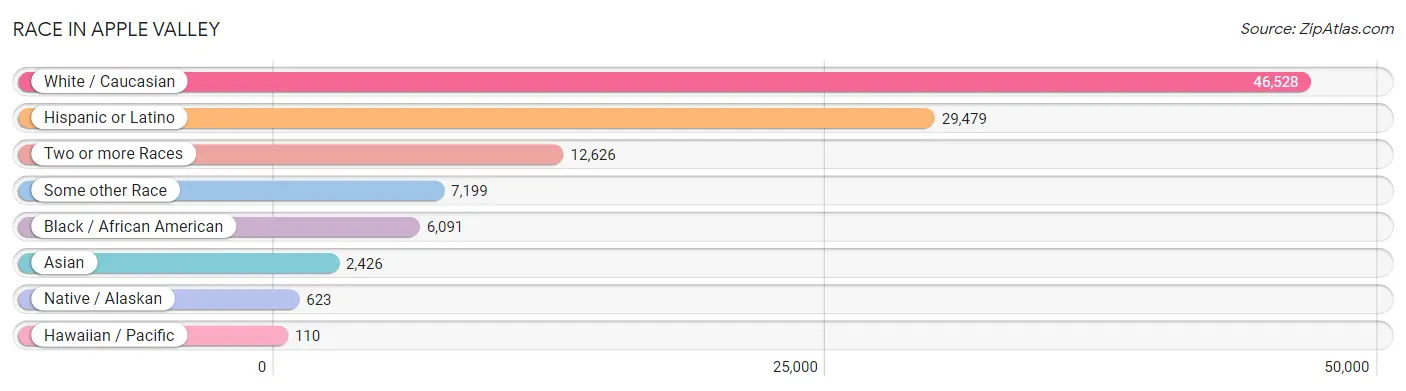
| Race | # Population | % Population |
| Asian | 2,426 | 3.2% |
| Black / African American | 6,091 | 8.1% |
| Hawaiian / Pacific | 110 | 0.2% |
| Hispanic or Latino | 29,479 | 39.0% |
| Native / Alaskan | 623 | 0.8% |
| White / Caucasian | 46,528 | 61.5% |
| Two or more Races | 12,626 | 16.7% |
| Some other Race | 7,199 | 9.5% |
| Total | 75,603 | 100.0% |
Ancestry in Apple Valley
The most populous ancestries reported in Apple Valley are Mexican (25,071 | 33.2%), German (7,381 | 9.8%), Irish (5,296 | 7.0%), English (4,622 | 6.1%), and American (3,932 | 5.2%), together accounting for 61.2% of all Apple Valley residents.
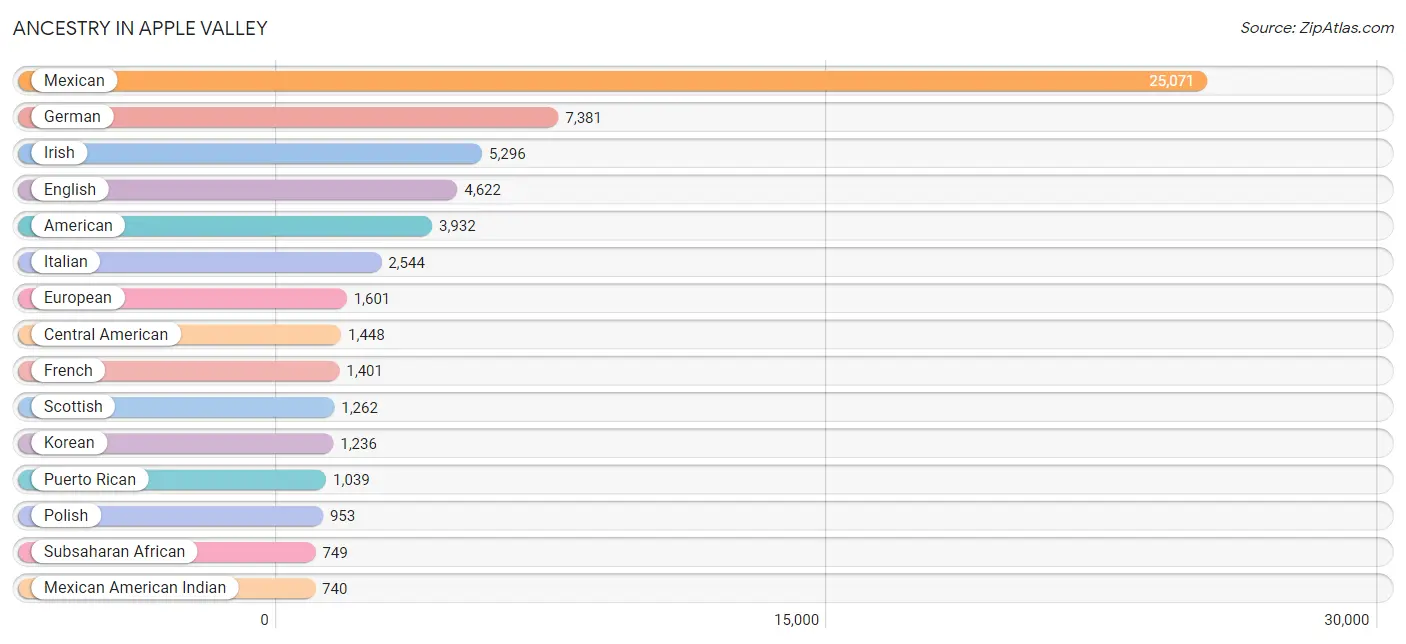
| Ancestry | # Population | % Population |
| Afghan | 90 | 0.1% |
| African | 558 | 0.7% |
| American | 3,932 | 5.2% |
| Apache | 10 | 0.0% |
| Arab | 482 | 0.6% |
| Armenian | 40 | 0.1% |
| Austrian | 46 | 0.1% |
| Barbadian | 11 | 0.0% |
| Basque | 7 | 0.0% |
| Belizean | 92 | 0.1% |
| Bhutanese | 643 | 0.9% |
| Blackfeet | 336 | 0.4% |
| British | 325 | 0.4% |
| Burmese | 225 | 0.3% |
| Canadian | 302 | 0.4% |
| Central American | 1,448 | 1.9% |
| Central American Indian | 522 | 0.7% |
| Cherokee | 270 | 0.4% |
| Choctaw | 32 | 0.0% |
| Colombian | 46 | 0.1% |
| Costa Rican | 37 | 0.1% |
| Creek | 16 | 0.0% |
| Crow | 14 | 0.0% |
| Cuban | 283 | 0.4% |
| Czech | 46 | 0.1% |
| Czechoslovakian | 78 | 0.1% |
| Danish | 225 | 0.3% |
| Delaware | 5 | 0.0% |
| Dominican | 30 | 0.0% |
| Dutch | 683 | 0.9% |
| Eastern European | 57 | 0.1% |
| Egyptian | 6 | 0.0% |
| English | 4,622 | 6.1% |
| European | 1,601 | 2.1% |
| Filipino | 182 | 0.2% |
| Finnish | 49 | 0.1% |
| French | 1,401 | 1.8% |
| French Canadian | 338 | 0.4% |
| German | 7,381 | 9.8% |
| Greek | 23 | 0.0% |
| Guamanian / Chamorro | 162 | 0.2% |
| Guatemalan | 643 | 0.9% |
| Haitian | 2 | 0.0% |
| Honduran | 44 | 0.1% |
| Hungarian | 195 | 0.3% |
| Indian (Asian) | 365 | 0.5% |
| Iranian | 11 | 0.0% |
| Irish | 5,296 | 7.0% |
| Iroquois | 125 | 0.2% |
| Italian | 2,544 | 3.4% |
| Jamaican | 42 | 0.1% |
| Japanese | 45 | 0.1% |
| Kenyan | 152 | 0.2% |
| Korean | 1,236 | 1.6% |
| Laotian | 19 | 0.0% |
| Lebanese | 35 | 0.1% |
| Lithuanian | 34 | 0.0% |
| Luxembourger | 57 | 0.1% |
| Mexican | 25,071 | 33.2% |
| Mexican American Indian | 740 | 1.0% |
| Native Hawaiian | 130 | 0.2% |
| Navajo | 54 | 0.1% |
| New Zealander | 8 | 0.0% |
| Nicaraguan | 134 | 0.2% |
| Nigerian | 28 | 0.0% |
| Northern European | 77 | 0.1% |
| Norwegian | 453 | 0.6% |
| Osage | 42 | 0.1% |
| Pakistani | 16 | 0.0% |
| Panamanian | 1 | 0.0% |
| Peruvian | 48 | 0.1% |
| Polish | 953 | 1.3% |
| Portuguese | 230 | 0.3% |
| Pueblo | 44 | 0.1% |
| Puerto Rican | 1,039 | 1.4% |
| Romanian | 90 | 0.1% |
| Russian | 196 | 0.3% |
| Salvadoran | 564 | 0.7% |
| Samoan | 110 | 0.2% |
| Scandinavian | 105 | 0.1% |
| Scotch-Irish | 461 | 0.6% |
| Scottish | 1,262 | 1.7% |
| Shoshone | 16 | 0.0% |
| Slovak | 14 | 0.0% |
| Slovene | 30 | 0.0% |
| South American | 94 | 0.1% |
| South American Indian | 23 | 0.0% |
| Spaniard | 451 | 0.6% |
| Spanish | 70 | 0.1% |
| Sri Lankan | 211 | 0.3% |
| Subsaharan African | 749 | 1.0% |
| Swedish | 452 | 0.6% |
| Swiss | 113 | 0.2% |
| Syrian | 290 | 0.4% |
| Thai | 530 | 0.7% |
| Tongan | 44 | 0.1% |
| Trinidadian and Tobagonian | 12 | 0.0% |
| Turkish | 23 | 0.0% |
| Ukrainian | 44 | 0.1% |
| Welsh | 278 | 0.4% |
| West Indian | 17 | 0.0% |
| Yaqui | 132 | 0.2% | View All 102 Rows |
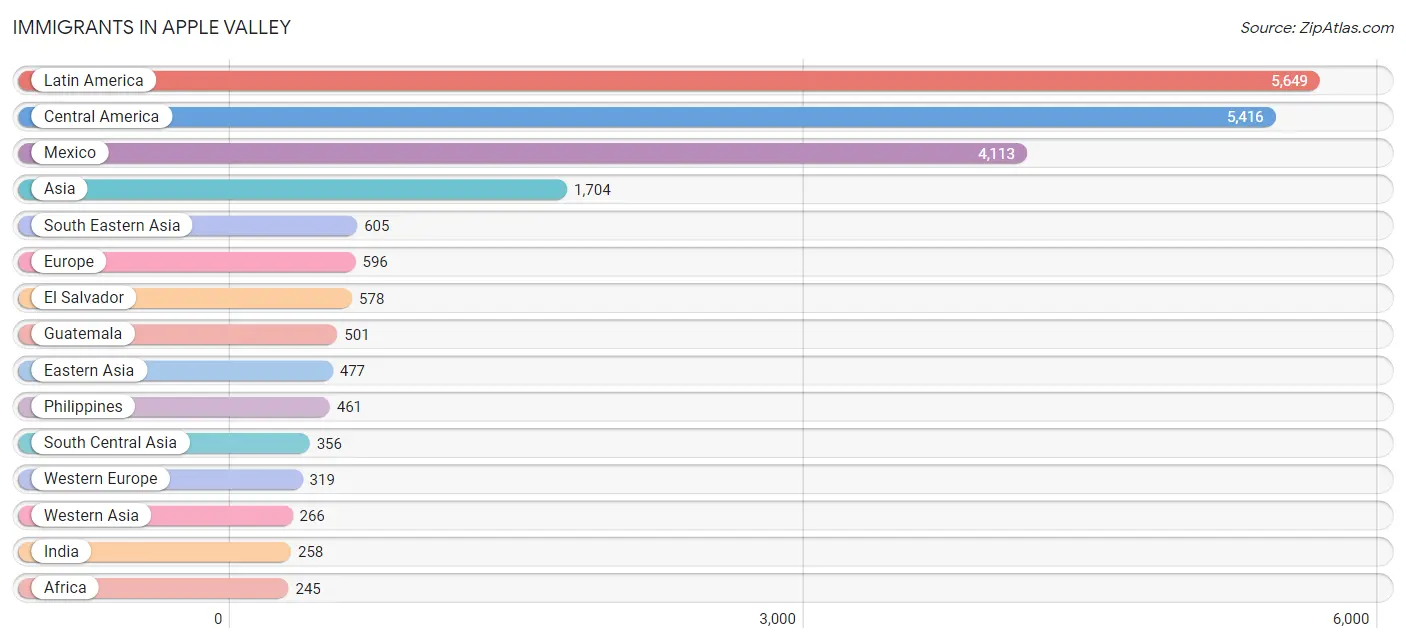
Immigrants in Apple Valley
The most numerous immigrant groups reported in Apple Valley came from Latin America (5,649 | 7.5%), Central America (5,416 | 7.2%), Mexico (4,113 | 5.4%), Asia (1,704 | 2.2%), and South Eastern Asia (605 | 0.8%), together accounting for 23.1% of all Apple Valley residents.
| Immigration Origin | # Population | % Population |
| Afghanistan | 67 | 0.1% |
| Africa | 245 | 0.3% |
| Argentina | 14 | 0.0% |
| Asia | 1,704 | 2.2% |
| Australia | 16 | 0.0% |
| Austria | 16 | 0.0% |
| Belize | 40 | 0.1% |
| Bolivia | 19 | 0.0% |
| Cambodia | 9 | 0.0% |
| Canada | 243 | 0.3% |
| Caribbean | 112 | 0.2% |
| Central America | 5,416 | 7.2% |
| China | 242 | 0.3% |
| Colombia | 40 | 0.1% |
| Costa Rica | 10 | 0.0% |
| Cuba | 54 | 0.1% |
| Dominican Republic | 18 | 0.0% |
| Eastern Africa | 239 | 0.3% |
| Eastern Asia | 477 | 0.6% |
| Eastern Europe | 97 | 0.1% |
| Egypt | 6 | 0.0% |
| El Salvador | 578 | 0.8% |
| England | 87 | 0.1% |
| Europe | 596 | 0.8% |
| Germany | 214 | 0.3% |
| Guatemala | 501 | 0.7% |
| Honduras | 42 | 0.1% |
| Hong Kong | 15 | 0.0% |
| Hungary | 44 | 0.1% |
| India | 258 | 0.3% |
| Indonesia | 27 | 0.0% |
| Iran | 31 | 0.0% |
| Iraq | 52 | 0.1% |
| Ireland | 18 | 0.0% |
| Israel | 10 | 0.0% |
| Italy | 9 | 0.0% |
| Japan | 110 | 0.2% |
| Jordan | 29 | 0.0% |
| Kenya | 239 | 0.3% |
| Korea | 125 | 0.2% |
| Latin America | 5,649 | 7.5% |
| Mexico | 4,113 | 5.4% |
| Netherlands | 69 | 0.1% |
| Nicaragua | 71 | 0.1% |
| Northern Africa | 6 | 0.0% |
| Northern Europe | 149 | 0.2% |
| Norway | 13 | 0.0% |
| Oceania | 20 | 0.0% |
| Panama | 61 | 0.1% |
| Peru | 48 | 0.1% |
| Philippines | 461 | 0.6% |
| Romania | 28 | 0.0% |
| Russia | 12 | 0.0% |
| South America | 121 | 0.2% |
| South Central Asia | 356 | 0.5% |
| South Eastern Asia | 605 | 0.8% |
| Southern Europe | 9 | 0.0% |
| Switzerland | 20 | 0.0% |
| Syria | 175 | 0.2% |
| Taiwan | 182 | 0.2% |
| Thailand | 16 | 0.0% |
| Trinidad and Tobago | 40 | 0.1% |
| Vietnam | 92 | 0.1% |
| Western Asia | 266 | 0.4% |
| Western Europe | 319 | 0.4% | View All 65 Rows |
Sex and Age in Apple Valley
Sex and Age in Apple Valley
The most populous age groups in Apple Valley are 10 to 14 Years (3,352 | 9.0%) for men and 5 to 9 Years (3,041 | 7.9%) for women.
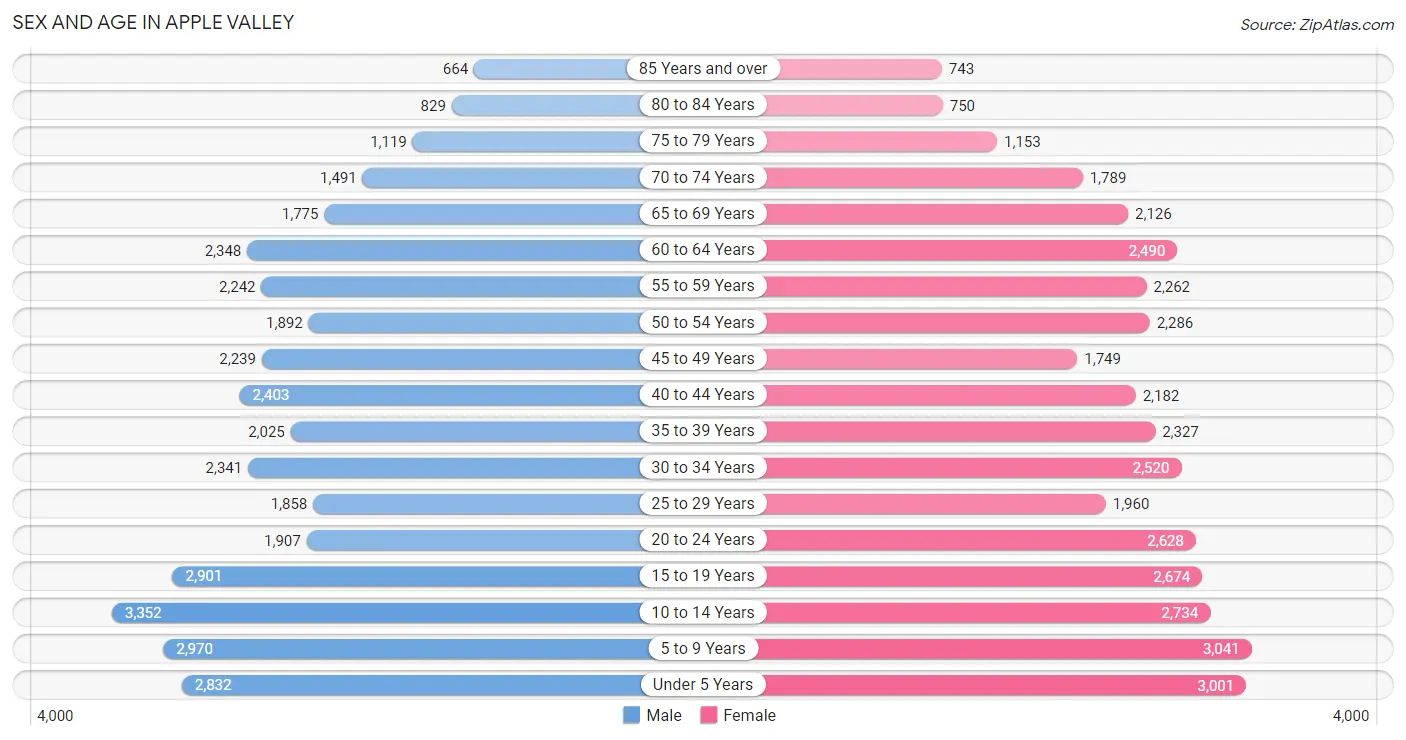
| Age Bracket | Male | Female |
| Under 5 Years | 2,832 (7.6%) | 3,001 (7.8%) |
| 5 to 9 Years | 2,970 (8.0%) | 3,041 (7.9%) |
| 10 to 14 Years | 3,352 (9.0%) | 2,734 (7.1%) |
| 15 to 19 Years | 2,901 (7.8%) | 2,674 (7.0%) |
| 20 to 24 Years | 1,907 (5.1%) | 2,628 (6.8%) |
| 25 to 29 Years | 1,858 (5.0%) | 1,960 (5.1%) |
| 30 to 34 Years | 2,341 (6.3%) | 2,520 (6.6%) |
| 35 to 39 Years | 2,025 (5.4%) | 2,327 (6.1%) |
| 40 to 44 Years | 2,403 (6.5%) | 2,182 (5.7%) |
| 45 to 49 Years | 2,239 (6.0%) | 1,749 (4.5%) |
| 50 to 54 Years | 1,892 (5.1%) | 2,286 (5.9%) |
| 55 to 59 Years | 2,242 (6.0%) | 2,262 (5.9%) |
| 60 to 64 Years | 2,348 (6.3%) | 2,490 (6.5%) |
| 65 to 69 Years | 1,775 (4.8%) | 2,126 (5.5%) |
| 70 to 74 Years | 1,491 (4.0%) | 1,789 (4.7%) |
| 75 to 79 Years | 1,119 (3.0%) | 1,153 (3.0%) |
| 80 to 84 Years | 829 (2.2%) | 750 (1.9%) |
| 85 Years and over | 664 (1.8%) | 743 (1.9%) |
| Total | 37,188 (100.0%) | 38,415 (100.0%) |
Families and Households in Apple Valley
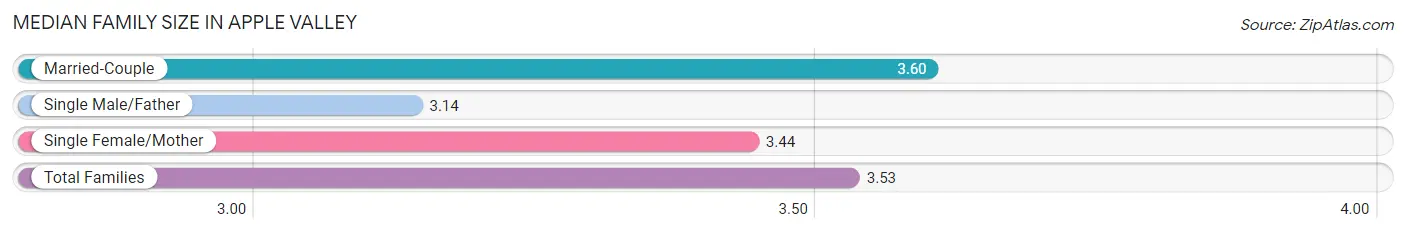
Median Family Size in Apple Valley
The median family size in Apple Valley is 3.53 persons per family, with married-couple families (13,615 | 74.8%) accounting for the largest median family size of 3.6 persons per family. On the other hand, single male/father families (1,385 | 7.6%) represent the smallest median family size with 3.14 persons per family.
| Family Type | # Families | Family Size |
| Married-Couple | 13,615 (74.8%) | 3.60 |
| Single Male/Father | 1,385 (7.6%) | 3.14 |
| Single Female/Mother | 3,210 (17.6%) | 3.44 |
| Total Families | 18,210 (100.0%) | 3.53 |
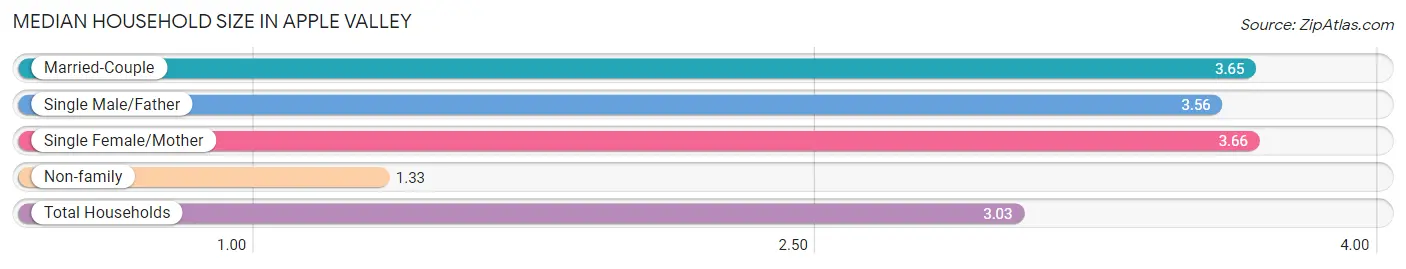
Median Household Size in Apple Valley
The median household size in Apple Valley is 3.03 persons per household, with single female/mother households (3,210 | 13.0%) accounting for the largest median household size of 3.66 persons per household. non-family households (6,567 | 26.5%) represent the smallest median household size with 1.33 persons per household.
| Household Type | # Households | Household Size |
| Married-Couple | 13,615 (54.9%) | 3.65 |
| Single Male/Father | 1,385 (5.6%) | 3.56 |
| Single Female/Mother | 3,210 (13.0%) | 3.66 |
| Non-family | 6,567 (26.5%) | 1.33 |
| Total Households | 24,777 (100.0%) | 3.03 |
Household Size by Marriage Status in Apple Valley
Out of a total of 24,777 households in Apple Valley, 18,210 (73.5%) are family households, while 6,567 (26.5%) are nonfamily households. The most numerous type of family households are 2-person households, comprising 6,934, and the most common type of nonfamily households are 1-person households, comprising 5,169.
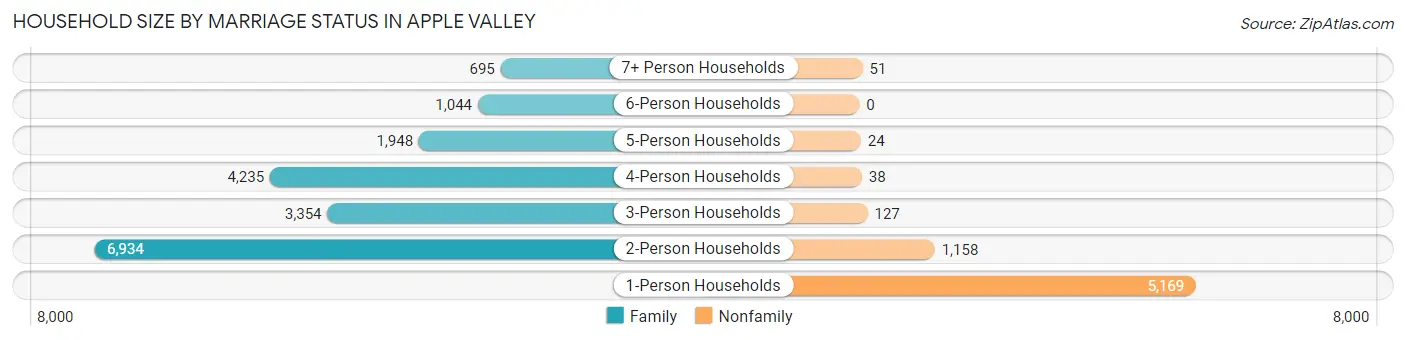
| Household Size | Family Households | Nonfamily Households |
| 1-Person Households | - | 5,169 (20.9%) |
| 2-Person Households | 6,934 (28.0%) | 1,158 (4.7%) |
| 3-Person Households | 3,354 (13.5%) | 127 (0.5%) |
| 4-Person Households | 4,235 (17.1%) | 38 (0.2%) |
| 5-Person Households | 1,948 (7.9%) | 24 (0.1%) |
| 6-Person Households | 1,044 (4.2%) | 0 (0.0%) |
| 7+ Person Households | 695 (2.8%) | 51 (0.2%) |
| Total | 18,210 (73.5%) | 6,567 (26.5%) |
Female Fertility in Apple Valley
Fertility by Age in Apple Valley
Average fertility rate in Apple Valley is 64.0 births per 1,000 women. Women in the age bracket of 20 to 34 years have the highest fertility rate with 117.0 births per 1,000 women. Women in the age bracket of 20 to 34 years acount for 78.4% of all women with births.
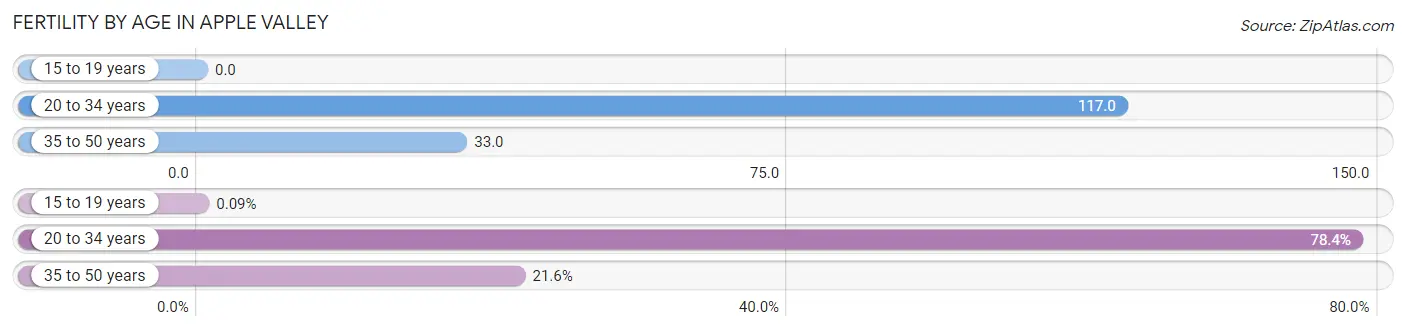
| Age Bracket | Women with Births | Births / 1,000 Women |
| 15 to 19 years | 1 (0.1%) | 0.0 |
| 20 to 34 years | 829 (78.4%) | 117.0 |
| 35 to 50 years | 228 (21.5%) | 33.0 |
| Total | 1,058 (100.0%) | 64.0 |
Fertility by Age by Marriage Status in Apple Valley
54.6% of women with births (1,058) in Apple Valley are married. The highest percentage of unmarried women with births falls into 15 to 19 years age bracket with 100.0% of them unmarried at the time of birth, while the lowest percentage of unmarried women with births belong to 35 to 50 years age bracket with 17.5% of them unmarried.
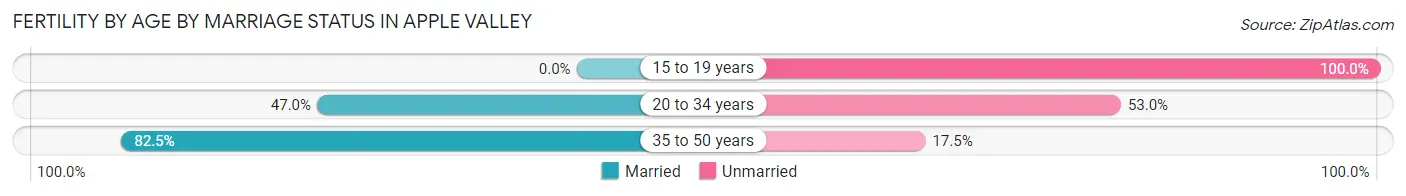
| Age Bracket | Married | Unmarried |
| 15 to 19 years | 0 (0.0%) | 1 (100.0%) |
| 20 to 34 years | 390 (47.0%) | 439 (53.0%) |
| 35 to 50 years | 188 (82.5%) | 40 (17.5%) |
| Total | 578 (54.6%) | 480 (45.4%) |
Fertility by Education in Apple Valley
Average fertility rate in Apple Valley is 64.0 births per 1,000 women. Women with the education attainment of college or associate's degree have the highest fertility rate of 94.0 births per 1,000 women, while women with the education attainment of bachelor's degree have the lowest fertility at 19.0 births per 1,000 women. Women with the education attainment of college or associate's degree represent 52.5% of all women with births.
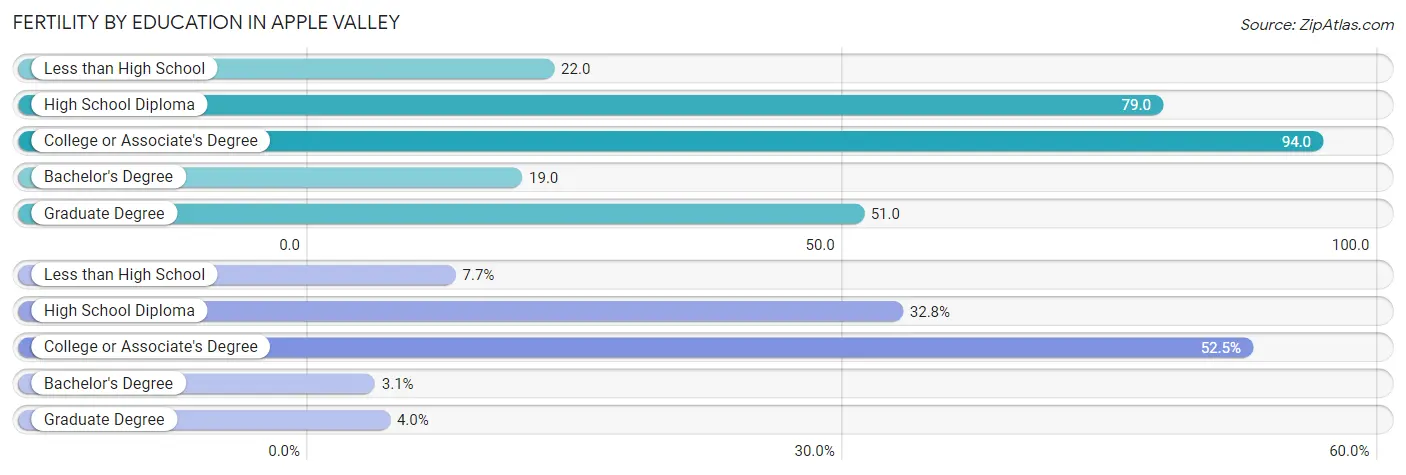
| Educational Attainment | Women with Births | Births / 1,000 Women |
| Less than High School | 81 (7.7%) | 22.0 |
| High School Diploma | 347 (32.8%) | 79.0 |
| College or Associate's Degree | 555 (52.5%) | 94.0 |
| Bachelor's Degree | 33 (3.1%) | 19.0 |
| Graduate Degree | 42 (4.0%) | 51.0 |
| Total | 1,058 (100.0%) | 64.0 |
Fertility by Education by Marriage Status in Apple Valley
45.4% of women with births in Apple Valley are unmarried. Women with the educational attainment of bachelor's degree are most likely to be married with 100.0% of them married at childbirth, while women with the educational attainment of less than high school are least likely to be married with 60.5% of them unmarried at childbirth.
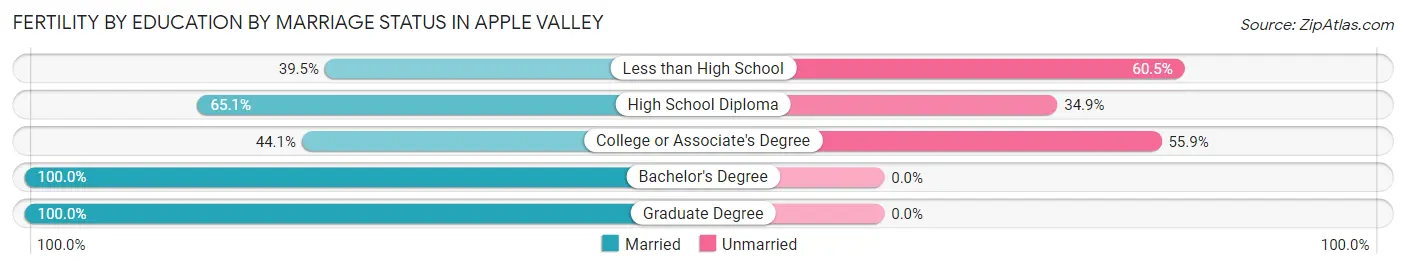
| Educational Attainment | Married | Unmarried |
| Less than High School | 32 (39.5%) | 49 (60.5%) |
| High School Diploma | 226 (65.1%) | 121 (34.9%) |
| College or Associate's Degree | 245 (44.1%) | 310 (55.9%) |
| Bachelor's Degree | 33 (100.0%) | 0 (0.0%) |
| Graduate Degree | 42 (100.0%) | 0 (0.0%) |
| Total | 578 (54.6%) | 480 (45.4%) |
Employment Characteristics in Apple Valley
Employment by Class of Employer in Apple Valley
Among the 26,465 employed individuals in Apple Valley, private company employees (16,030 | 60.6%), local government employees (3,661 | 13.8%), and self-employed (not incorporated) (2,014 | 7.6%) make up the most common classes of employment.
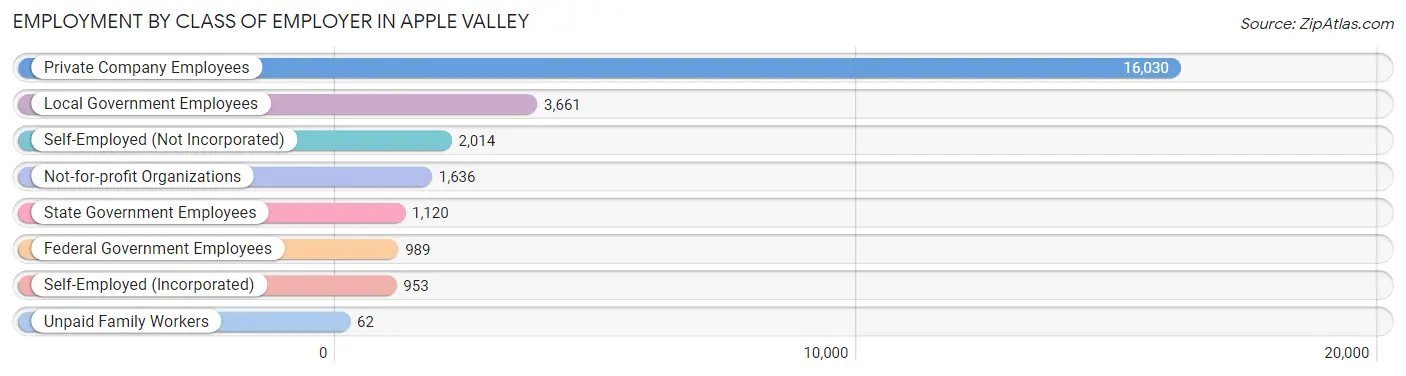
| Employer Class | # Employees | % Employees |
| Private Company Employees | 16,030 | 60.6% |
| Self-Employed (Incorporated) | 953 | 3.6% |
| Self-Employed (Not Incorporated) | 2,014 | 7.6% |
| Not-for-profit Organizations | 1,636 | 6.2% |
| Local Government Employees | 3,661 | 13.8% |
| State Government Employees | 1,120 | 4.2% |
| Federal Government Employees | 989 | 3.7% |
| Unpaid Family Workers | 62 | 0.2% |
| Total | 26,465 | 100.0% |
Employment Status by Age in Apple Valley
According to the labor force statistics for Apple Valley, out of the total population over 16 years of age (56,277), 53.4% or 30,052 individuals are in the labor force, with 9.2% or 2,765 of them unemployed. The age group with the highest labor force participation rate is 35 to 44 years, with 78.0% or 6,971 individuals in the labor force. Within the labor force, the 16 to 19 years age range has the highest percentage of unemployed individuals, with 23.2% or 258 of them being unemployed.
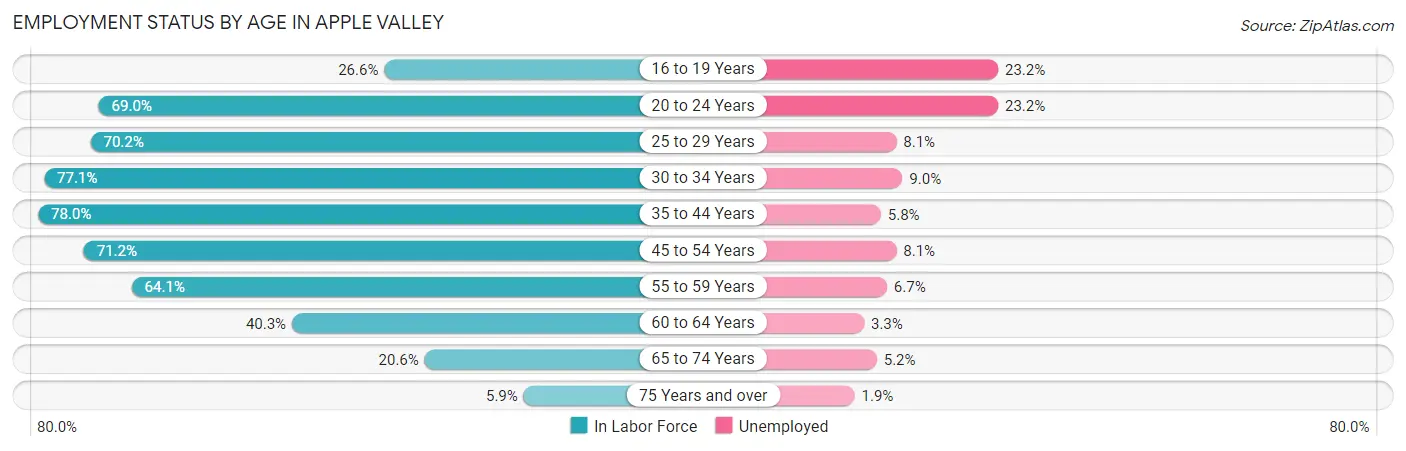
| Age Bracket | In Labor Force | Unemployed |
| 16 to 19 Years | 1,112 (26.6%) | 258 (23.2%) |
| 20 to 24 Years | 3,129 (69.0%) | 726 (23.2%) |
| 25 to 29 Years | 2,680 (70.2%) | 217 (8.1%) |
| 30 to 34 Years | 3,748 (77.1%) | 337 (9.0%) |
| 35 to 44 Years | 6,971 (78.0%) | 404 (5.8%) |
| 45 to 54 Years | 5,814 (71.2%) | 471 (8.1%) |
| 55 to 59 Years | 2,887 (64.1%) | 193 (6.7%) |
| 60 to 64 Years | 1,950 (40.3%) | 64 (3.3%) |
| 65 to 74 Years | 1,479 (20.6%) | 77 (5.2%) |
| 75 Years and over | 310 (5.9%) | 6 (1.9%) |
| Total | 30,052 (53.4%) | 2,765 (9.2%) |
Employment Status by Educational Attainment in Apple Valley
According to labor force statistics for Apple Valley, 68.5% of individuals (24,060) out of the total population between 25 and 64 years of age (35,124) are in the labor force, with 7.0% or 1,684 of them being unemployed. The group with the highest labor force participation rate are those with the educational attainment of bachelor's degree or higher, with 80.0% or 5,090 individuals in the labor force. Within the labor force, individuals with high school diploma education have the highest percentage of unemployment, with 9.7% or 675 of them being unemployed.
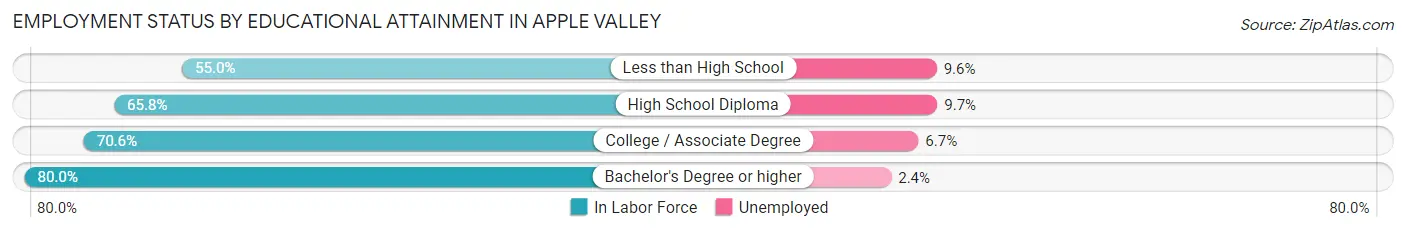
| Educational Attainment | In Labor Force | Unemployed |
| Less than High School | 2,959 (55.0%) | 516 (9.6%) |
| High School Diploma | 6,960 (65.8%) | 1,026 (9.7%) |
| College / Associate Degree | 9,040 (70.6%) | 858 (6.7%) |
| Bachelor's Degree or higher | 5,090 (80.0%) | 153 (2.4%) |
| Total | 24,060 (68.5%) | 2,459 (7.0%) |
Employment Occupations by Sex in Apple Valley
Management, Business, Science and Arts Occupations
The most common Management, Business, Science and Arts occupations in Apple Valley are Community & Social Service (3,359 | 12.4%), Management (2,375 | 8.7%), Education Instruction & Library (2,177 | 8.0%), Health Diagnosing & Treating (1,385 | 5.1%), and Health Technologists (943 | 3.5%).
Management, Business, Science and Arts Occupations by Sex
Within the Management, Business, Science and Arts occupations in Apple Valley, the most male-oriented occupations are Architecture & Engineering (84.5%), Legal Services & Support (68.9%), and Computers & Mathematics (64.6%), while the most female-oriented occupations are Life, Physical & Social Science (82.5%), Health Diagnosing & Treating (78.5%), and Health Technologists (76.9%).
| Occupation | Male | Female |
| Management | 1,379 (58.1%) | 996 (41.9%) |
| Business & Financial | 427 (53.6%) | 369 (46.4%) |
| Computers, Engineering & Science | 608 (64.5%) | 334 (35.5%) |
| Computers & Mathematics | 336 (64.6%) | 184 (35.4%) |
| Architecture & Engineering | 250 (84.5%) | 46 (15.5%) |
| Life, Physical & Social Science | 22 (17.5%) | 104 (82.5%) |
| Community & Social Service | 1,356 (40.4%) | 2,003 (59.6%) |
| Education, Arts & Media | 376 (60.4%) | 247 (39.7%) |
| Legal Services & Support | 84 (68.9%) | 38 (31.1%) |
| Education Instruction & Library | 661 (30.4%) | 1,516 (69.6%) |
| Arts, Media & Entertainment | 235 (53.8%) | 202 (46.2%) |
| Health Diagnosing & Treating | 298 (21.5%) | 1,087 (78.5%) |
| Health Technologists | 218 (23.1%) | 725 (76.9%) |
| Total (Category) | 4,068 (45.9%) | 4,789 (54.1%) |
| Total (Overall) | 14,695 (54.1%) | 12,486 (45.9%) |
Services Occupations
The most common Services occupations in Apple Valley are Healthcare Support (1,280 | 4.7%), Food Preparation & Serving (1,183 | 4.3%), Security & Protection (1,034 | 3.8%), Cleaning & Maintenance (886 | 3.3%), and Personal Care & Service (646 | 2.4%).
Services Occupations by Sex
Within the Services occupations in Apple Valley, the most male-oriented occupations are Cleaning & Maintenance (89.0%), Law Enforcement (84.6%), and Security & Protection (67.5%), while the most female-oriented occupations are Healthcare Support (85.6%), Personal Care & Service (68.9%), and Food Preparation & Serving (65.3%).
| Occupation | Male | Female |
| Healthcare Support | 184 (14.4%) | 1,096 (85.6%) |
| Security & Protection | 698 (67.5%) | 336 (32.5%) |
| Firefighting & Prevention | 364 (57.0%) | 275 (43.0%) |
| Law Enforcement | 334 (84.6%) | 61 (15.4%) |
| Food Preparation & Serving | 411 (34.7%) | 772 (65.3%) |
| Cleaning & Maintenance | 789 (89.0%) | 97 (11.0%) |
| Personal Care & Service | 201 (31.1%) | 445 (68.9%) |
| Total (Category) | 2,283 (45.4%) | 2,746 (54.6%) |
| Total (Overall) | 14,695 (54.1%) | 12,486 (45.9%) |
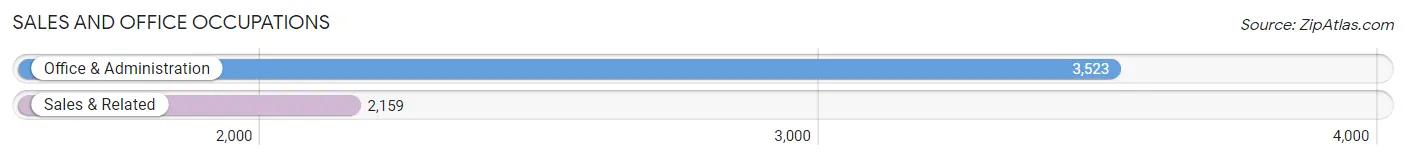
Sales and Office Occupations
The most common Sales and Office occupations in Apple Valley are Office & Administration (3,523 | 13.0%), and Sales & Related (2,159 | 7.9%).
Sales and Office Occupations by Sex
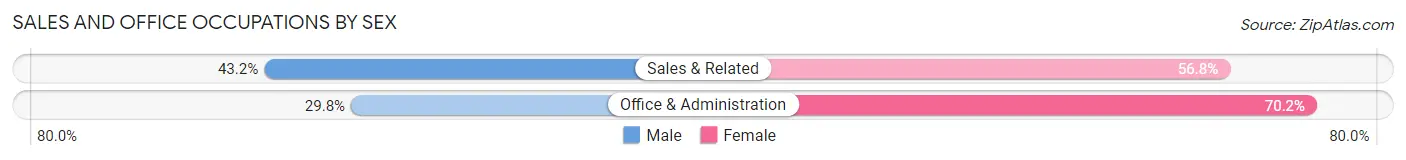
| Occupation | Male | Female |
| Sales & Related | 932 (43.2%) | 1,227 (56.8%) |
| Office & Administration | 1,050 (29.8%) | 2,473 (70.2%) |
| Total (Category) | 1,982 (34.9%) | 3,700 (65.1%) |
| Total (Overall) | 14,695 (54.1%) | 12,486 (45.9%) |
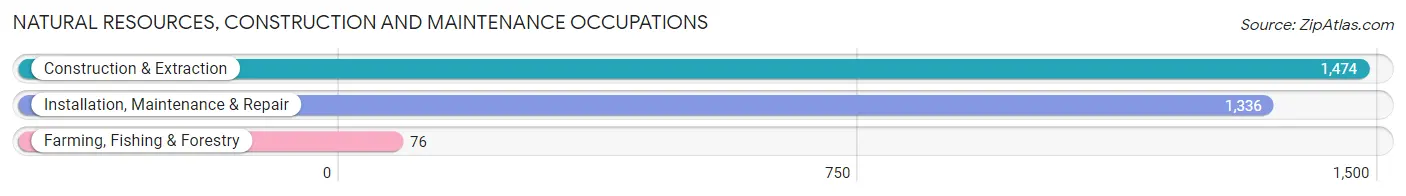
Natural Resources, Construction and Maintenance Occupations
The most common Natural Resources, Construction and Maintenance occupations in Apple Valley are Construction & Extraction (1,474 | 5.4%), Installation, Maintenance & Repair (1,336 | 4.9%), and Farming, Fishing & Forestry (76 | 0.3%).
Natural Resources, Construction and Maintenance Occupations by Sex
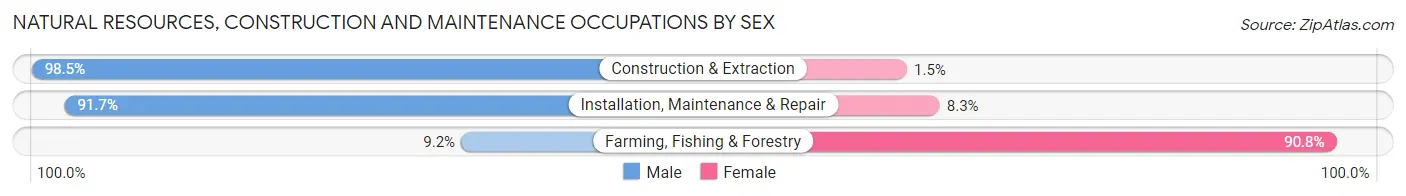
| Occupation | Male | Female |
| Farming, Fishing & Forestry | 7 (9.2%) | 69 (90.8%) |
| Construction & Extraction | 1,452 (98.5%) | 22 (1.5%) |
| Installation, Maintenance & Repair | 1,225 (91.7%) | 111 (8.3%) |
| Total (Category) | 2,684 (93.0%) | 202 (7.0%) |
| Total (Overall) | 14,695 (54.1%) | 12,486 (45.9%) |
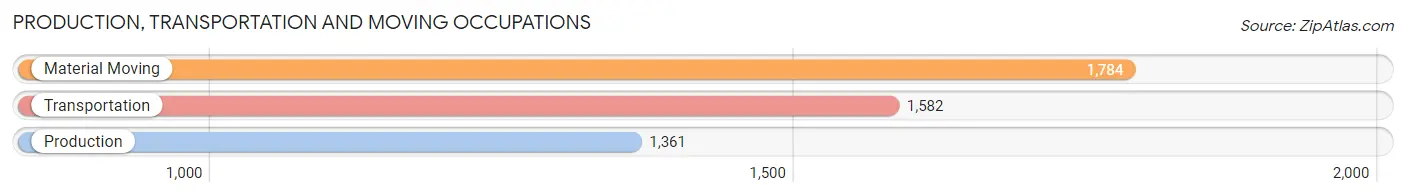
Production, Transportation and Moving Occupations
The most common Production, Transportation and Moving occupations in Apple Valley are Material Moving (1,784 | 6.6%), Transportation (1,582 | 5.8%), and Production (1,361 | 5.0%).
Production, Transportation and Moving Occupations by Sex
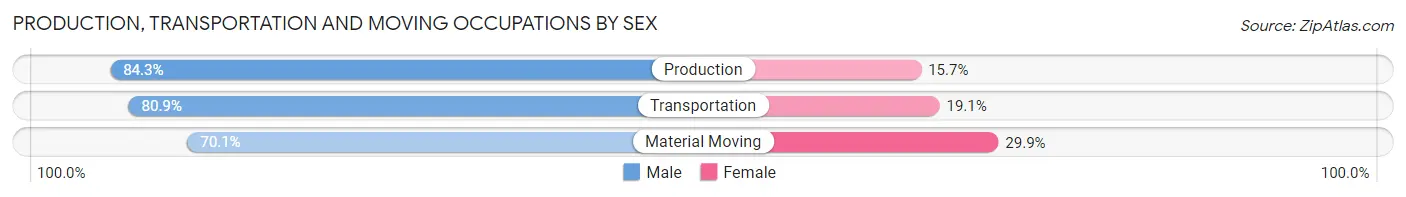
| Occupation | Male | Female |
| Production | 1,147 (84.3%) | 214 (15.7%) |
| Transportation | 1,280 (80.9%) | 302 (19.1%) |
| Material Moving | 1,251 (70.1%) | 533 (29.9%) |
| Total (Category) | 3,678 (77.8%) | 1,049 (22.2%) |
| Total (Overall) | 14,695 (54.1%) | 12,486 (45.9%) |
Employment Industries by Sex in Apple Valley
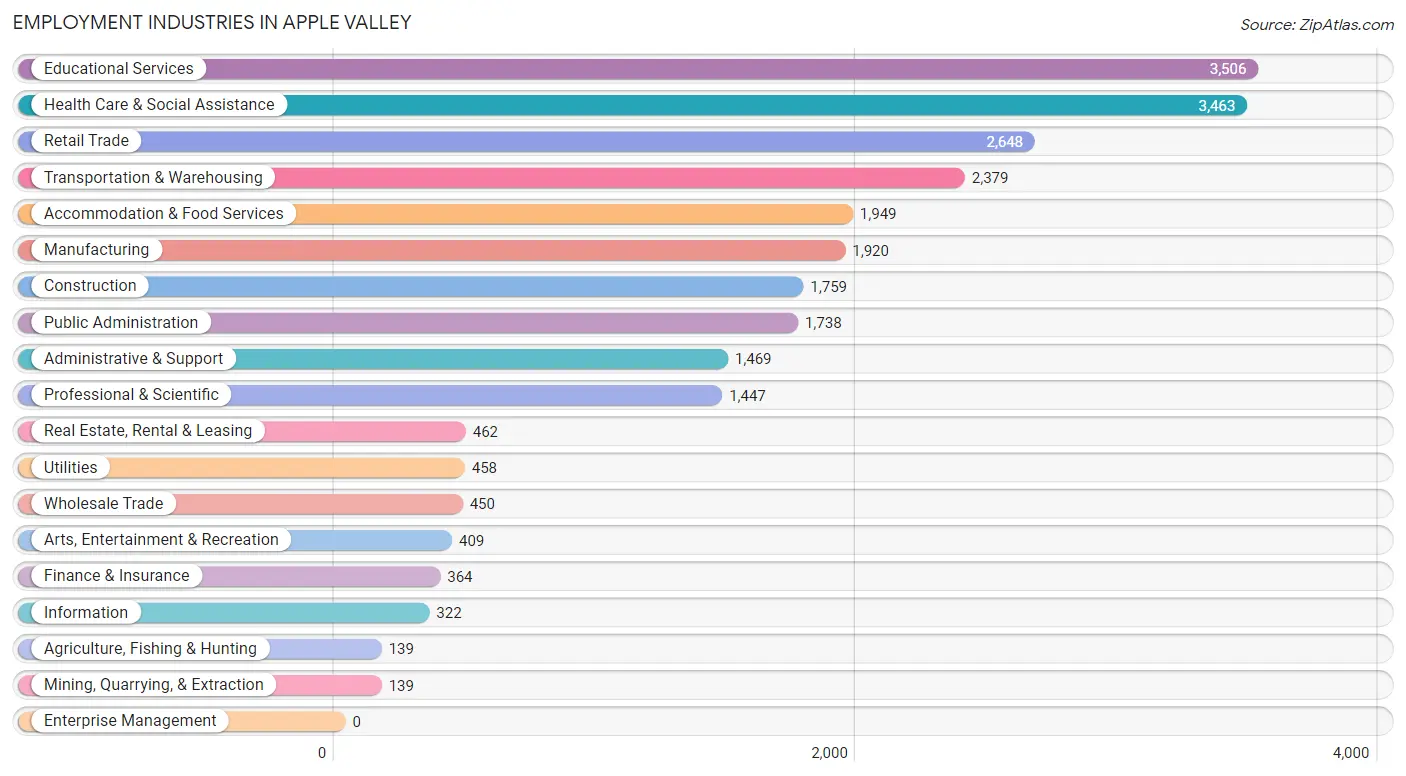
Employment Industries in Apple Valley
The major employment industries in Apple Valley include Educational Services (3,506 | 12.9%), Health Care & Social Assistance (3,463 | 12.7%), Retail Trade (2,648 | 9.7%), Transportation & Warehousing (2,379 | 8.7%), and Accommodation & Food Services (1,949 | 7.2%).
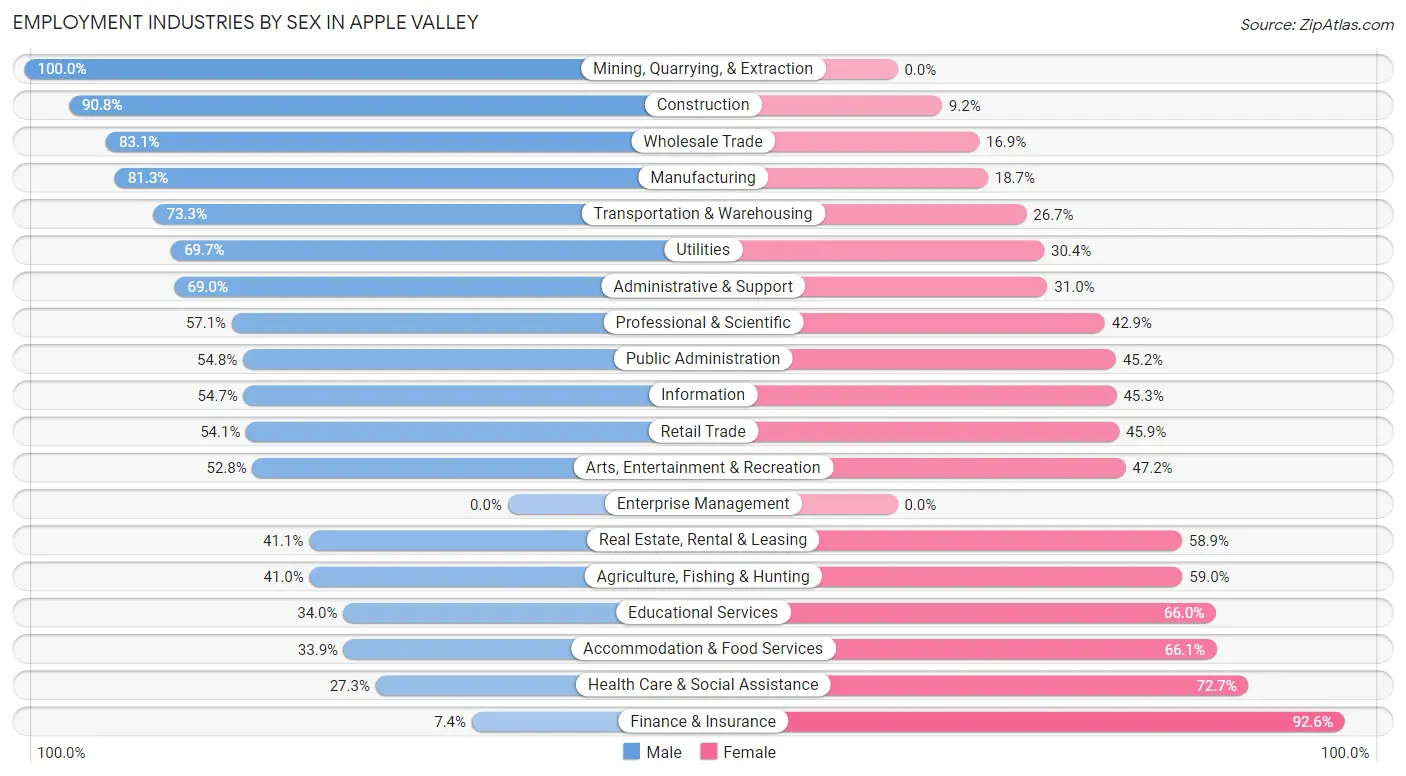
Employment Industries by Sex in Apple Valley
The Apple Valley industries that see more men than women are Mining, Quarrying, & Extraction (100.0%), Construction (90.8%), and Wholesale Trade (83.1%), whereas the industries that tend to have a higher number of women are Finance & Insurance (92.6%), Health Care & Social Assistance (72.7%), and Accommodation & Food Services (66.1%).
| Industry | Male | Female |
| Agriculture, Fishing & Hunting | 57 (41.0%) | 82 (59.0%) |
| Mining, Quarrying, & Extraction | 139 (100.0%) | 0 (0.0%) |
| Construction | 1,597 (90.8%) | 162 (9.2%) |
| Manufacturing | 1,561 (81.3%) | 359 (18.7%) |
| Wholesale Trade | 374 (83.1%) | 76 (16.9%) |
| Retail Trade | 1,433 (54.1%) | 1,215 (45.9%) |
| Transportation & Warehousing | 1,744 (73.3%) | 635 (26.7%) |
| Utilities | 319 (69.7%) | 139 (30.3%) |
| Information | 176 (54.7%) | 146 (45.3%) |
| Finance & Insurance | 27 (7.4%) | 337 (92.6%) |
| Real Estate, Rental & Leasing | 190 (41.1%) | 272 (58.9%) |
| Professional & Scientific | 826 (57.1%) | 621 (42.9%) |
| Enterprise Management | 0 (0.0%) | 0 (0.0%) |
| Administrative & Support | 1,013 (69.0%) | 456 (31.0%) |
| Educational Services | 1,193 (34.0%) | 2,313 (66.0%) |
| Health Care & Social Assistance | 946 (27.3%) | 2,517 (72.7%) |
| Arts, Entertainment & Recreation | 216 (52.8%) | 193 (47.2%) |
| Accommodation & Food Services | 661 (33.9%) | 1,288 (66.1%) |
| Public Administration | 952 (54.8%) | 786 (45.2%) |
| Total | 14,695 (54.1%) | 12,486 (45.9%) |
Education in Apple Valley
School Enrollment in Apple Valley
The most common levels of schooling among the 21,304 students in Apple Valley are high school (5,360 | 25.2%), elementary school (5,097 | 23.9%), and middle school (4,551 | 21.4%).
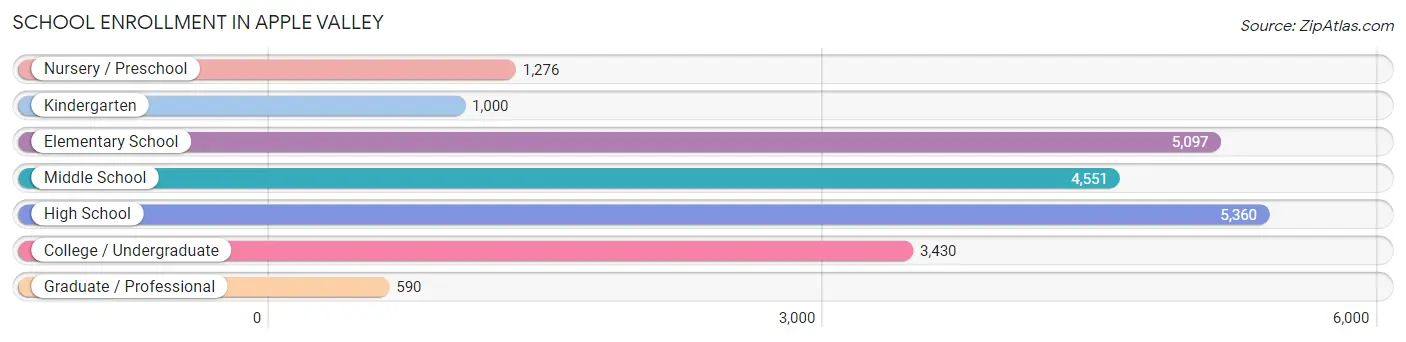
| School Level | # Students | % Students |
| Nursery / Preschool | 1,276 | 6.0% |
| Kindergarten | 1,000 | 4.7% |
| Elementary School | 5,097 | 23.9% |
| Middle School | 4,551 | 21.4% |
| High School | 5,360 | 25.2% |
| College / Undergraduate | 3,430 | 16.1% |
| Graduate / Professional | 590 | 2.8% |
| Total | 21,304 | 100.0% |
School Enrollment by Age by Funding Source in Apple Valley
Out of a total of 21,304 students who are enrolled in schools in Apple Valley, 1,726 (8.1%) attend a private institution, while the remaining 19,578 (91.9%) are enrolled in public schools. The age group of 35 years and over has the highest likelihood of being enrolled in private schools, with 344 (27.3% in the age bracket) enrolled. Conversely, the age group of 10 to 14 year olds has the lowest likelihood of being enrolled in a private school, with 5,723 (95.8% in the age bracket) attending a public institution.
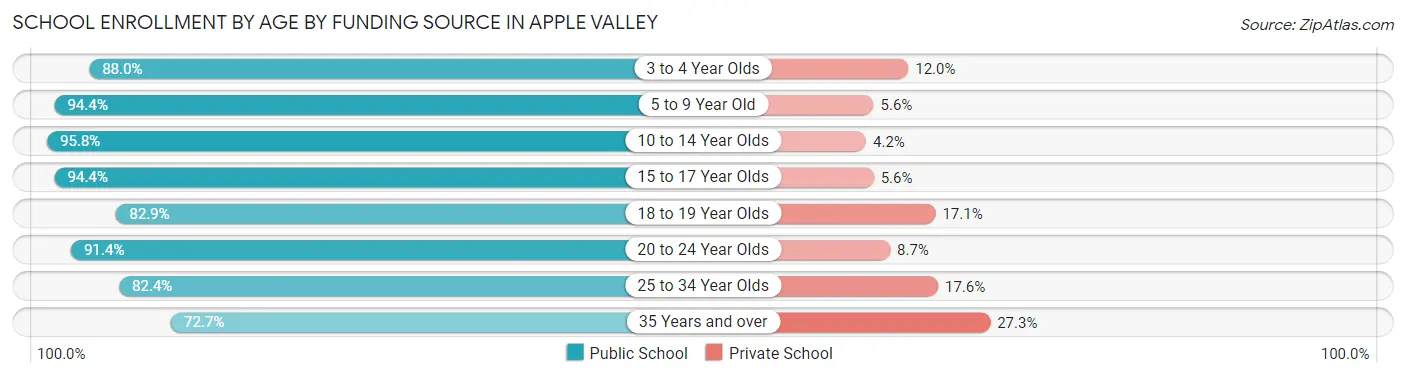
| Age Bracket | Public School | Private School |
| 3 to 4 Year Olds | 1,067 (88.0%) | 146 (12.0%) |
| 5 to 9 Year Old | 5,302 (94.4%) | 313 (5.6%) |
| 10 to 14 Year Olds | 5,723 (95.8%) | 249 (4.2%) |
| 15 to 17 Year Olds | 3,607 (94.4%) | 214 (5.6%) |
| 18 to 19 Year Olds | 887 (82.9%) | 183 (17.1%) |
| 20 to 24 Year Olds | 1,500 (91.3%) | 142 (8.6%) |
| 25 to 34 Year Olds | 586 (82.4%) | 125 (17.6%) |
| 35 Years and over | 916 (72.7%) | 344 (27.3%) |
| Total | 19,578 (91.9%) | 1,726 (8.1%) |
Educational Attainment by Field of Study in Apple Valley
Business (1,629 | 16.9%), education (1,158 | 12.0%), liberal arts & history (1,125 | 11.7%), arts & humanities (1,105 | 11.5%), and science & technology (1,086 | 11.3%) are the most common fields of study among 9,645 individuals in Apple Valley who have obtained a bachelor's degree or higher.
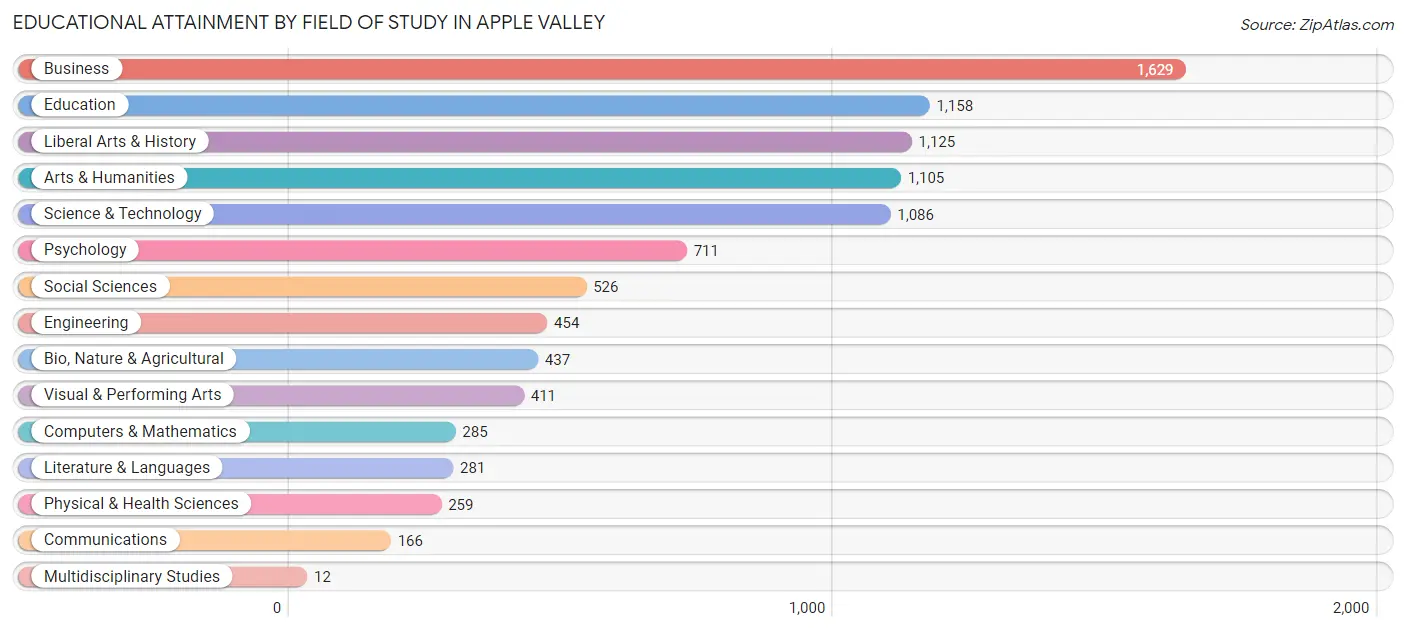
| Field of Study | # Graduates | % Graduates |
| Computers & Mathematics | 285 | 2.9% |
| Bio, Nature & Agricultural | 437 | 4.5% |
| Physical & Health Sciences | 259 | 2.7% |
| Psychology | 711 | 7.4% |
| Social Sciences | 526 | 5.4% |
| Engineering | 454 | 4.7% |
| Multidisciplinary Studies | 12 | 0.1% |
| Science & Technology | 1,086 | 11.3% |
| Business | 1,629 | 16.9% |
| Education | 1,158 | 12.0% |
| Literature & Languages | 281 | 2.9% |
| Liberal Arts & History | 1,125 | 11.7% |
| Visual & Performing Arts | 411 | 4.3% |
| Communications | 166 | 1.7% |
| Arts & Humanities | 1,105 | 11.5% |
| Total | 9,645 | 100.0% |
Transportation & Commute in Apple Valley
Vehicle Availability by Sex in Apple Valley
The most prevalent vehicle ownership categories in Apple Valley are males with 2 vehicles (5,502, accounting for 38.4%) and females with 2 vehicles (3,686, making up 45.6%).
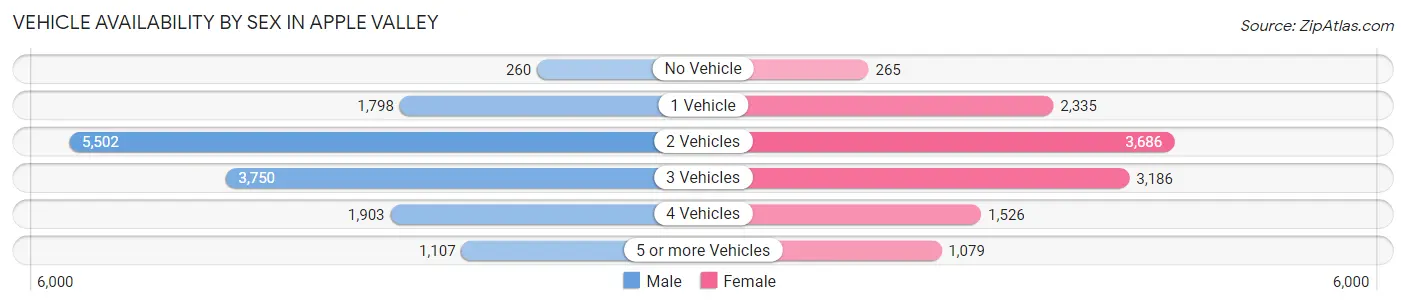
| Vehicles Available | Male | Female |
| No Vehicle | 260 (1.8%) | 265 (2.2%) |
| 1 Vehicle | 1,798 (12.6%) | 2,335 (19.3%) |
| 2 Vehicles | 5,502 (38.4%) | 3,686 (30.5%) |
| 3 Vehicles | 3,750 (26.2%) | 3,186 (26.4%) |
| 4 Vehicles | 1,903 (13.3%) | 1,526 (12.6%) |
| 5 or more Vehicles | 1,107 (7.7%) | 1,079 (8.9%) |
| Total | 14,320 (100.0%) | 12,077 (100.0%) |
Commute Time in Apple Valley
The most frequently occuring commute durations in Apple Valley are 15 to 19 minutes (4,170 commuters, 17.1%), 60 to 89 minutes (3,223 commuters, 13.2%), and 10 to 14 minutes (3,201 commuters, 13.1%).
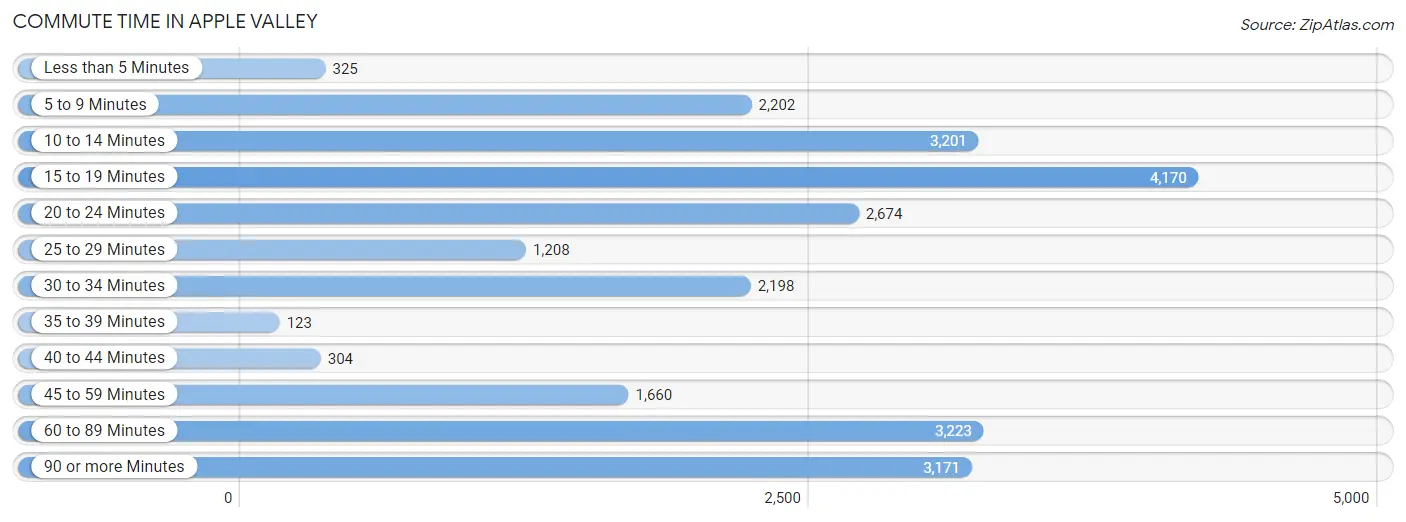
| Commute Time | # Commuters | % Commuters |
| Less than 5 Minutes | 325 | 1.3% |
| 5 to 9 Minutes | 2,202 | 9.0% |
| 10 to 14 Minutes | 3,201 | 13.1% |
| 15 to 19 Minutes | 4,170 | 17.1% |
| 20 to 24 Minutes | 2,674 | 10.9% |
| 25 to 29 Minutes | 1,208 | 4.9% |
| 30 to 34 Minutes | 2,198 | 9.0% |
| 35 to 39 Minutes | 123 | 0.5% |
| 40 to 44 Minutes | 304 | 1.2% |
| 45 to 59 Minutes | 1,660 | 6.8% |
| 60 to 89 Minutes | 3,223 | 13.2% |
| 90 or more Minutes | 3,171 | 13.0% |
Commute Time by Sex in Apple Valley
The most common commute times in Apple Valley are 60 to 89 minutes (2,321 commuters, 17.1%) for males and 15 to 19 minutes (2,291 commuters, 21.1%) for females.
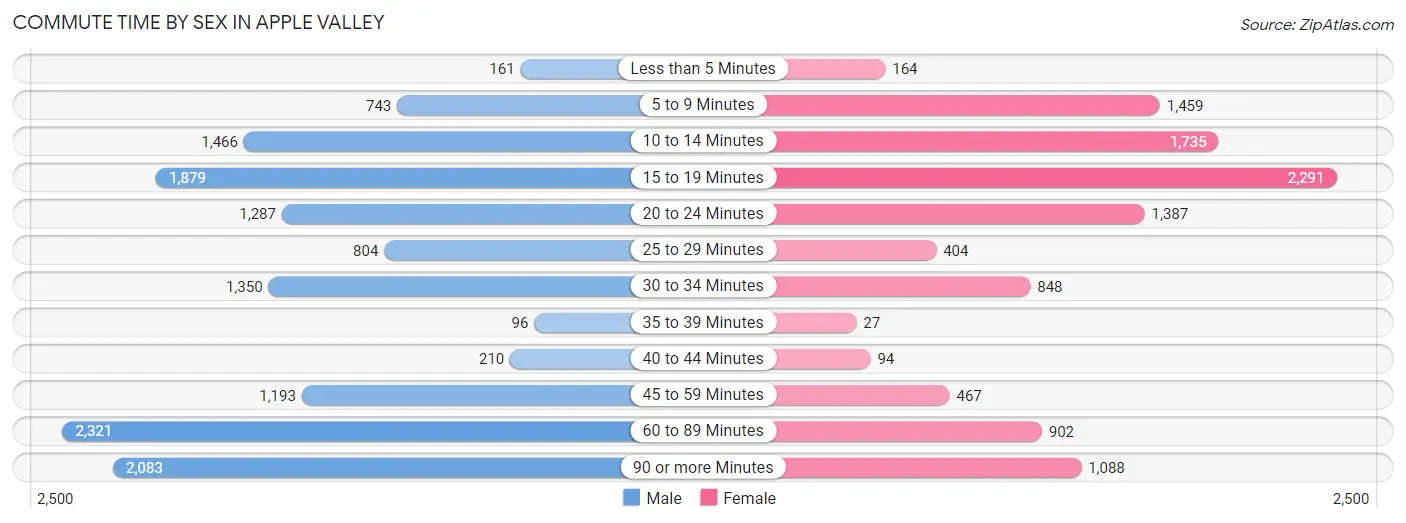
| Commute Time | Male | Female |
| Less than 5 Minutes | 161 (1.2%) | 164 (1.5%) |
| 5 to 9 Minutes | 743 (5.5%) | 1,459 (13.4%) |
| 10 to 14 Minutes | 1,466 (10.8%) | 1,735 (16.0%) |
| 15 to 19 Minutes | 1,879 (13.8%) | 2,291 (21.1%) |
| 20 to 24 Minutes | 1,287 (9.5%) | 1,387 (12.8%) |
| 25 to 29 Minutes | 804 (5.9%) | 404 (3.7%) |
| 30 to 34 Minutes | 1,350 (9.9%) | 848 (7.8%) |
| 35 to 39 Minutes | 96 (0.7%) | 27 (0.3%) |
| 40 to 44 Minutes | 210 (1.5%) | 94 (0.9%) |
| 45 to 59 Minutes | 1,193 (8.8%) | 467 (4.3%) |
| 60 to 89 Minutes | 2,321 (17.1%) | 902 (8.3%) |
| 90 or more Minutes | 2,083 (15.3%) | 1,088 (10.0%) |
Time of Departure to Work by Sex in Apple Valley
The most frequent times of departure to work in Apple Valley are 12:00 AM to 4:59 AM (2,310, 17.0%) for males and 7:00 AM to 7:29 AM (1,603, 14.7%) for females.
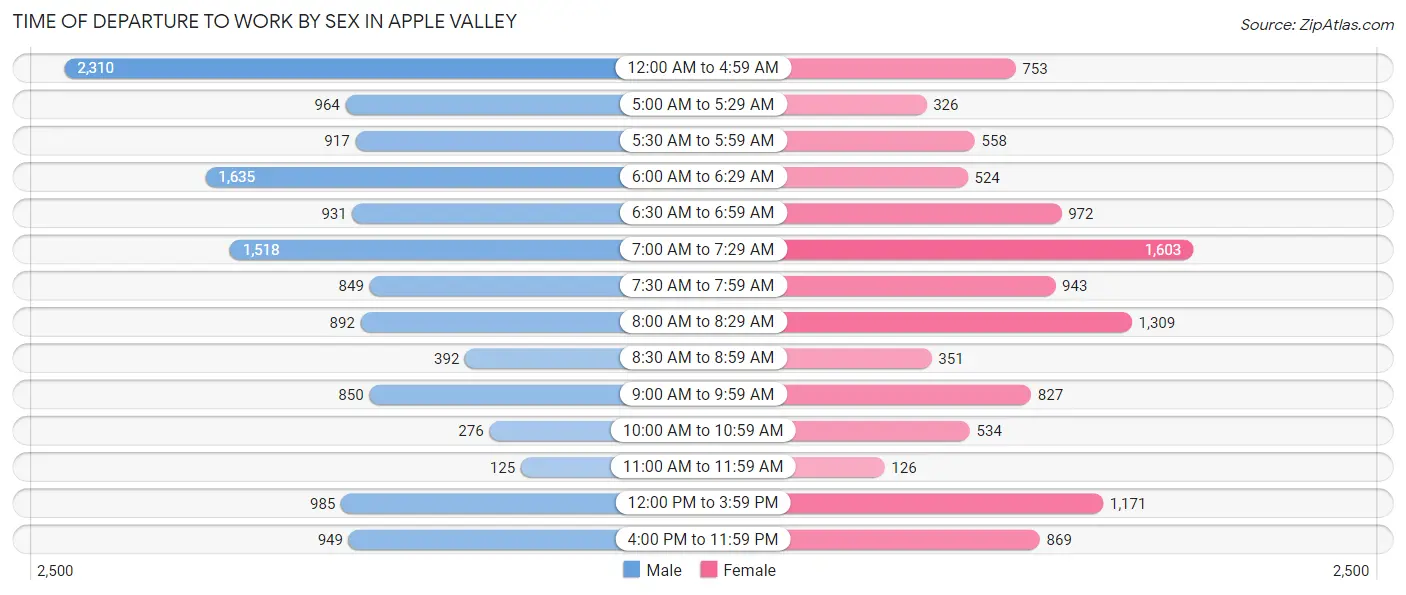
| Time of Departure | Male | Female |
| 12:00 AM to 4:59 AM | 2,310 (17.0%) | 753 (6.9%) |
| 5:00 AM to 5:29 AM | 964 (7.1%) | 326 (3.0%) |
| 5:30 AM to 5:59 AM | 917 (6.8%) | 558 (5.1%) |
| 6:00 AM to 6:29 AM | 1,635 (12.0%) | 524 (4.8%) |
| 6:30 AM to 6:59 AM | 931 (6.9%) | 972 (8.9%) |
| 7:00 AM to 7:29 AM | 1,518 (11.2%) | 1,603 (14.7%) |
| 7:30 AM to 7:59 AM | 849 (6.2%) | 943 (8.7%) |
| 8:00 AM to 8:29 AM | 892 (6.6%) | 1,309 (12.0%) |
| 8:30 AM to 8:59 AM | 392 (2.9%) | 351 (3.2%) |
| 9:00 AM to 9:59 AM | 850 (6.2%) | 827 (7.6%) |
| 10:00 AM to 10:59 AM | 276 (2.0%) | 534 (4.9%) |
| 11:00 AM to 11:59 AM | 125 (0.9%) | 126 (1.2%) |
| 12:00 PM to 3:59 PM | 985 (7.2%) | 1,171 (10.8%) |
| 4:00 PM to 11:59 PM | 949 (7.0%) | 869 (8.0%) |
| Total | 13,593 (100.0%) | 10,866 (100.0%) |
Housing Occupancy in Apple Valley
Occupancy by Ownership in Apple Valley
Of the total 24,777 dwellings in Apple Valley, owner-occupied units account for 16,731 (67.5%), while renter-occupied units make up 8,046 (32.5%).
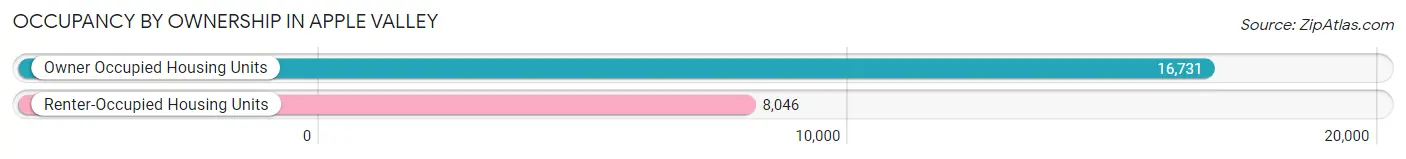
| Occupancy | # Housing Units | % Housing Units |
| Owner Occupied Housing Units | 16,731 | 67.5% |
| Renter-Occupied Housing Units | 8,046 | 32.5% |
| Total Occupied Housing Units | 24,777 | 100.0% |
Occupancy by Household Size in Apple Valley
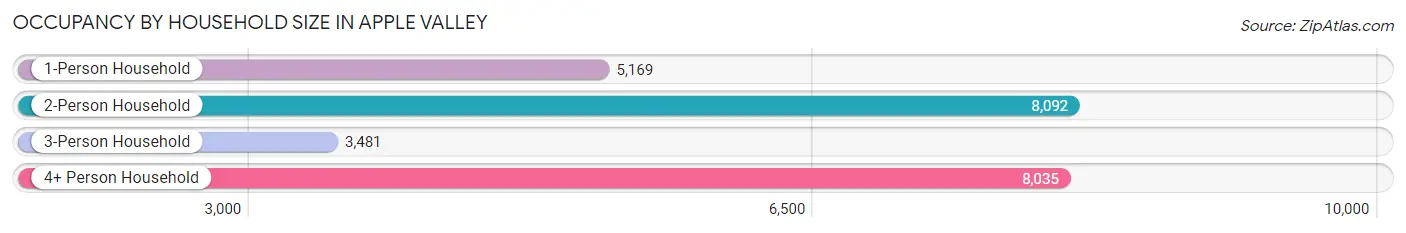
| Household Size | # Housing Units | % Housing Units |
| 1-Person Household | 5,169 | 20.9% |
| 2-Person Household | 8,092 | 32.7% |
| 3-Person Household | 3,481 | 14.1% |
| 4+ Person Household | 8,035 | 32.4% |
| Total Housing Units | 24,777 | 100.0% |
Occupancy by Ownership by Household Size in Apple Valley
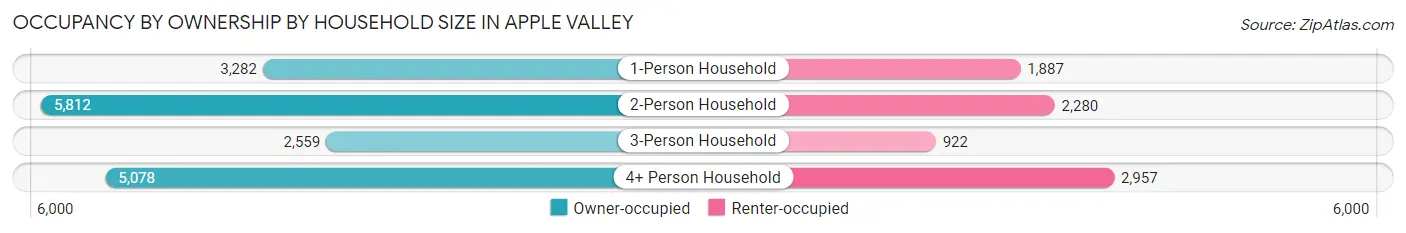
| Household Size | Owner-occupied | Renter-occupied |
| 1-Person Household | 3,282 (63.5%) | 1,887 (36.5%) |
| 2-Person Household | 5,812 (71.8%) | 2,280 (28.2%) |
| 3-Person Household | 2,559 (73.5%) | 922 (26.5%) |
| 4+ Person Household | 5,078 (63.2%) | 2,957 (36.8%) |
| Total Housing Units | 16,731 (67.5%) | 8,046 (32.5%) |
Occupancy by Educational Attainment in Apple Valley
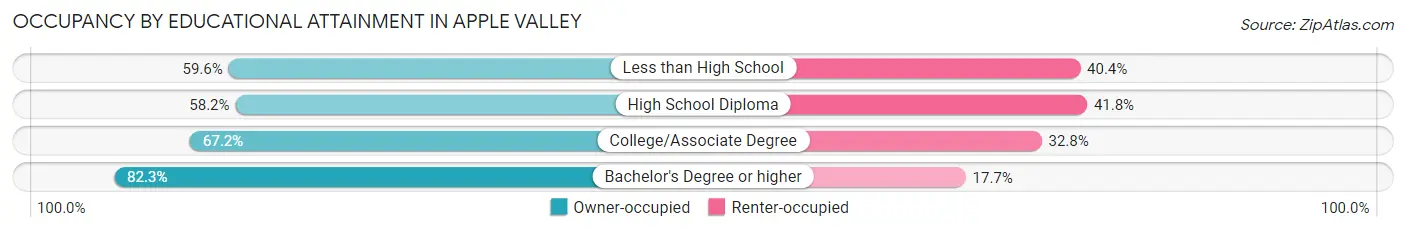
| Household Size | Owner-occupied | Renter-occupied |
| Less than High School | 1,715 (59.6%) | 1,164 (40.4%) |
| High School Diploma | 3,438 (58.2%) | 2,468 (41.8%) |
| College/Associate Degree | 7,048 (67.2%) | 3,437 (32.8%) |
| Bachelor's Degree or higher | 4,530 (82.3%) | 977 (17.7%) |
Occupancy by Age of Householder in Apple Valley
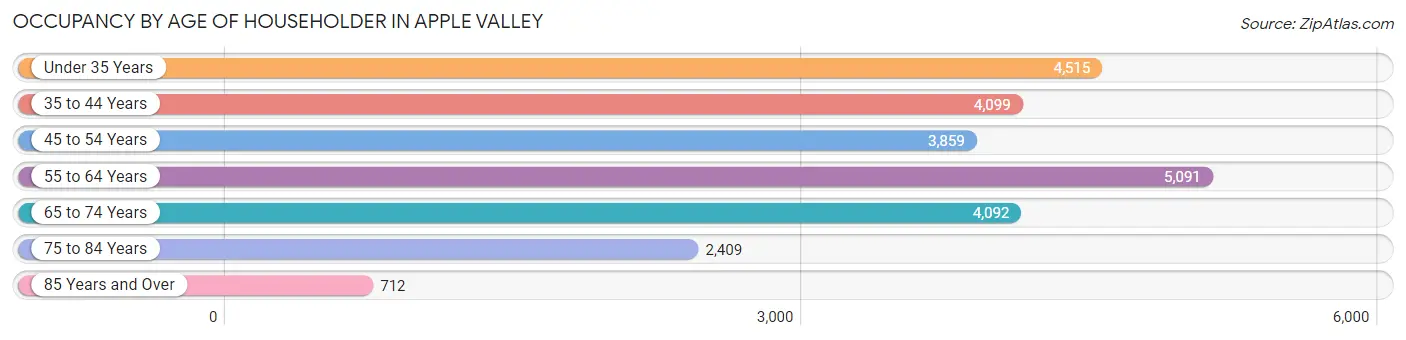
| Age Bracket | # Households | % Households |
| Under 35 Years | 4,515 | 18.2% |
| 35 to 44 Years | 4,099 | 16.5% |
| 45 to 54 Years | 3,859 | 15.6% |
| 55 to 64 Years | 5,091 | 20.5% |
| 65 to 74 Years | 4,092 | 16.5% |
| 75 to 84 Years | 2,409 | 9.7% |
| 85 Years and Over | 712 | 2.9% |
| Total | 24,777 | 100.0% |
Housing Finances in Apple Valley
Median Income by Occupancy in Apple Valley
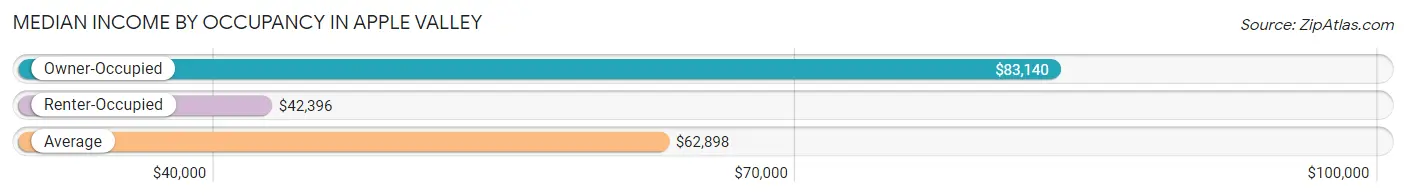
| Occupancy Type | # Households | Median Income |
| Owner-Occupied | 16,731 (67.5%) | $83,140 |
| Renter-Occupied | 8,046 (32.5%) | $42,396 |
| Average | 24,777 (100.0%) | $62,898 |
Occupancy by Householder Income Bracket in Apple Valley
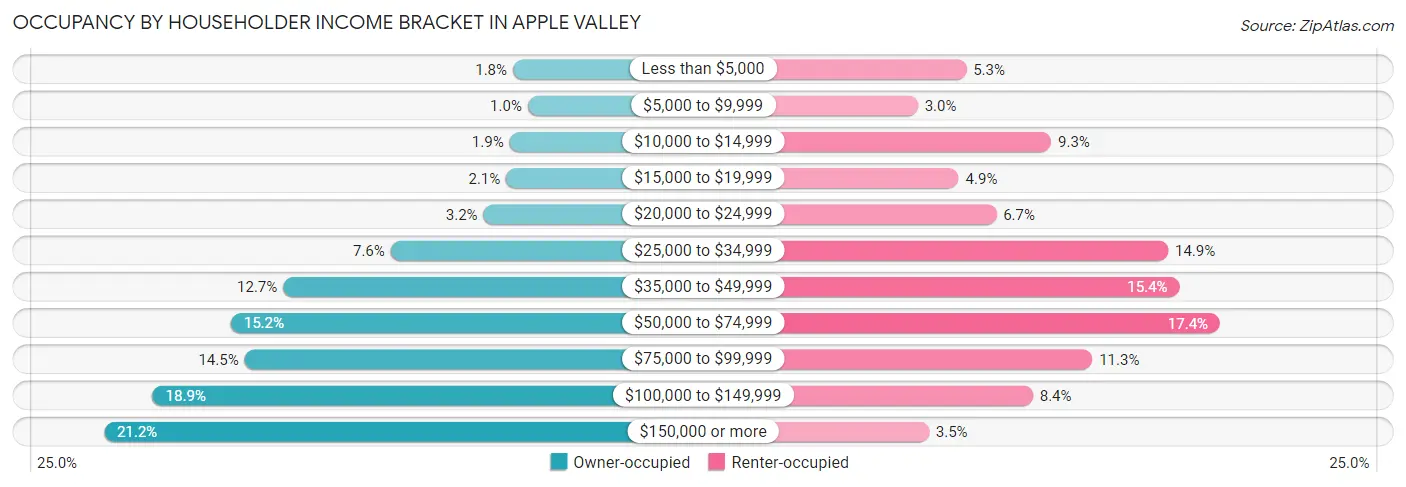
| Income Bracket | Owner-occupied | Renter-occupied |
| Less than $5,000 | 292 (1.8%) | 424 (5.3%) |
| $5,000 to $9,999 | 174 (1.0%) | 238 (3.0%) |
| $10,000 to $14,999 | 319 (1.9%) | 749 (9.3%) |
| $15,000 to $19,999 | 346 (2.1%) | 395 (4.9%) |
| $20,000 to $24,999 | 527 (3.2%) | 539 (6.7%) |
| $25,000 to $34,999 | 1,267 (7.6%) | 1,197 (14.9%) |
| $35,000 to $49,999 | 2,124 (12.7%) | 1,241 (15.4%) |
| $50,000 to $74,999 | 2,539 (15.2%) | 1,396 (17.3%) |
| $75,000 to $99,999 | 2,431 (14.5%) | 907 (11.3%) |
| $100,000 to $149,999 | 3,162 (18.9%) | 679 (8.4%) |
| $150,000 or more | 3,550 (21.2%) | 281 (3.5%) |
| Total | 16,731 (100.0%) | 8,046 (100.0%) |
Monthly Housing Cost Tiers in Apple Valley
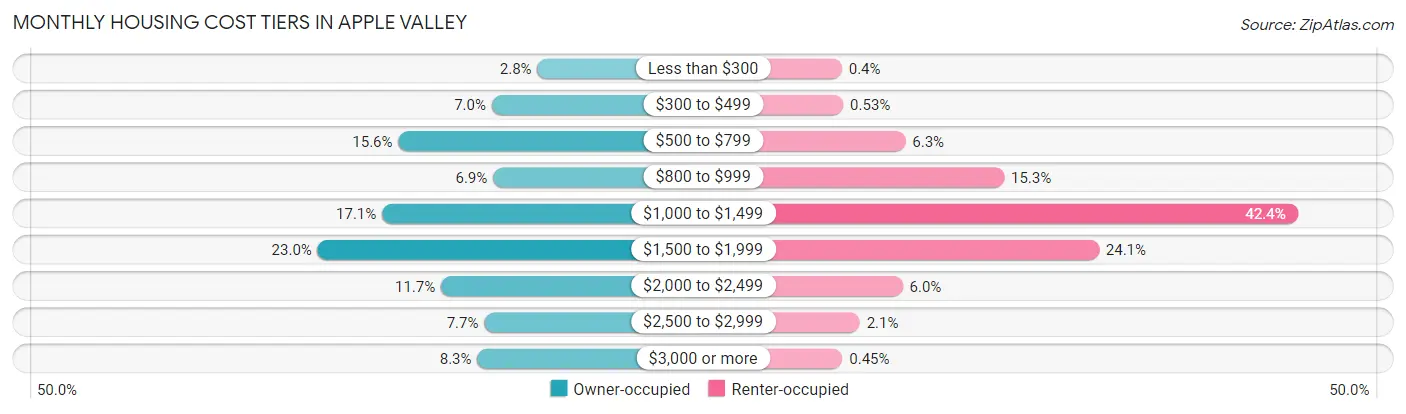
| Monthly Cost | Owner-occupied | Renter-occupied |
| Less than $300 | 467 (2.8%) | 32 (0.4%) |
| $300 to $499 | 1,169 (7.0%) | 43 (0.5%) |
| $500 to $799 | 2,608 (15.6%) | 503 (6.2%) |
| $800 to $999 | 1,149 (6.9%) | 1,234 (15.3%) |
| $1,000 to $1,499 | 2,860 (17.1%) | 3,408 (42.4%) |
| $1,500 to $1,999 | 3,851 (23.0%) | 1,937 (24.1%) |
| $2,000 to $2,499 | 1,950 (11.7%) | 483 (6.0%) |
| $2,500 to $2,999 | 1,285 (7.7%) | 165 (2.1%) |
| $3,000 or more | 1,392 (8.3%) | 36 (0.4%) |
| Total | 16,731 (100.0%) | 8,046 (100.0%) |
Physical Housing Characteristics in Apple Valley
Housing Structures in Apple Valley
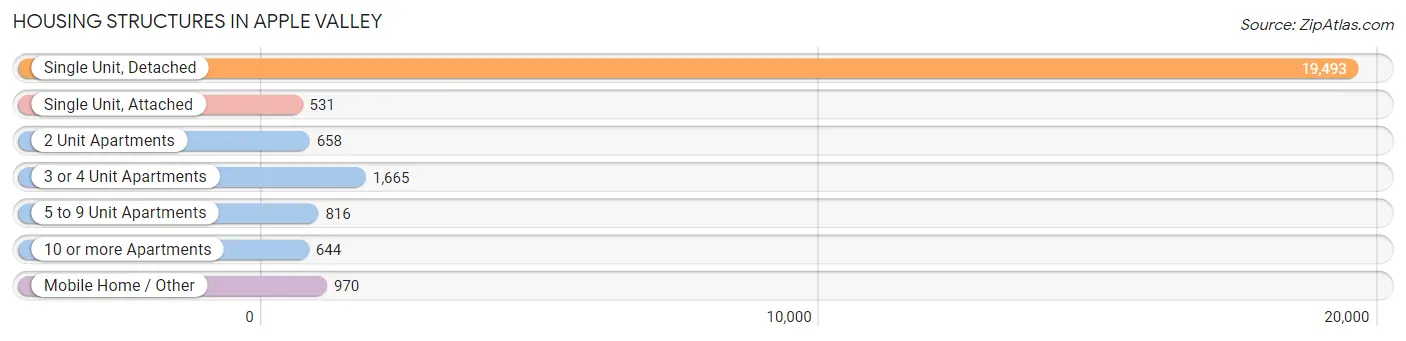
| Structure Type | # Housing Units | % Housing Units |
| Single Unit, Detached | 19,493 | 78.7% |
| Single Unit, Attached | 531 | 2.1% |
| 2 Unit Apartments | 658 | 2.7% |
| 3 or 4 Unit Apartments | 1,665 | 6.7% |
| 5 to 9 Unit Apartments | 816 | 3.3% |
| 10 or more Apartments | 644 | 2.6% |
| Mobile Home / Other | 970 | 3.9% |
| Total | 24,777 | 100.0% |
Housing Structures by Occupancy in Apple Valley
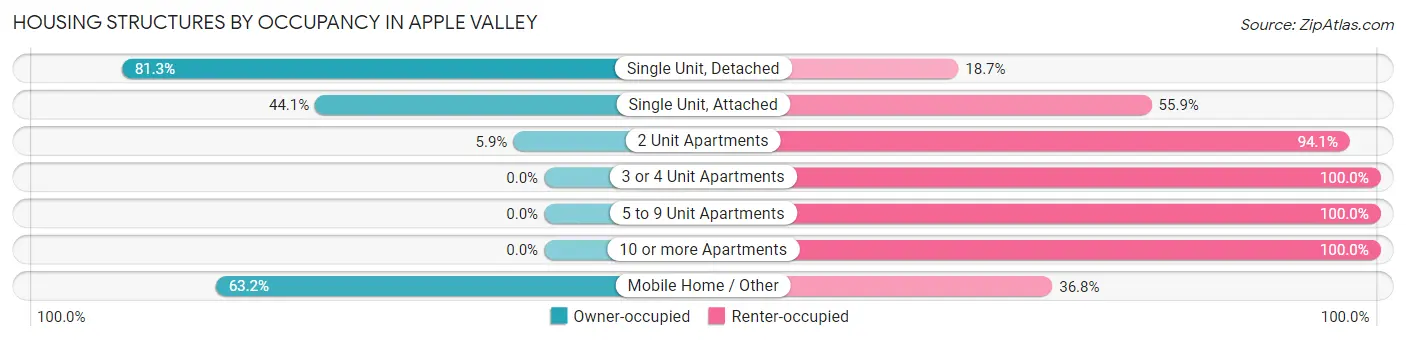
| Structure Type | Owner-occupied | Renter-occupied |
| Single Unit, Detached | 15,845 (81.3%) | 3,648 (18.7%) |
| Single Unit, Attached | 234 (44.1%) | 297 (55.9%) |
| 2 Unit Apartments | 39 (5.9%) | 619 (94.1%) |
| 3 or 4 Unit Apartments | 0 (0.0%) | 1,665 (100.0%) |
| 5 to 9 Unit Apartments | 0 (0.0%) | 816 (100.0%) |
| 10 or more Apartments | 0 (0.0%) | 644 (100.0%) |
| Mobile Home / Other | 613 (63.2%) | 357 (36.8%) |
| Total | 16,731 (67.5%) | 8,046 (32.5%) |
Housing Structures by Number of Rooms in Apple Valley
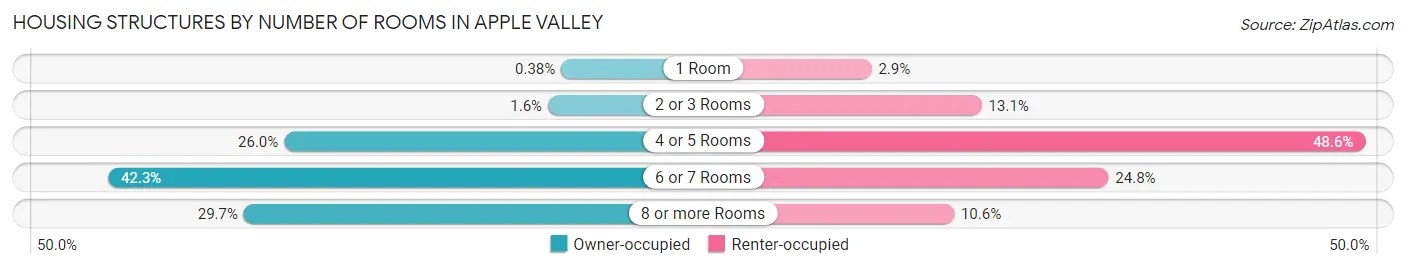
| Number of Rooms | Owner-occupied | Renter-occupied |
| 1 Room | 64 (0.4%) | 235 (2.9%) |
| 2 or 3 Rooms | 267 (1.6%) | 1,055 (13.1%) |
| 4 or 5 Rooms | 4,350 (26.0%) | 3,909 (48.6%) |
| 6 or 7 Rooms | 7,076 (42.3%) | 1,998 (24.8%) |
| 8 or more Rooms | 4,974 (29.7%) | 849 (10.5%) |
| Total | 16,731 (100.0%) | 8,046 (100.0%) |
Housing Structure by Heating Type in Apple Valley
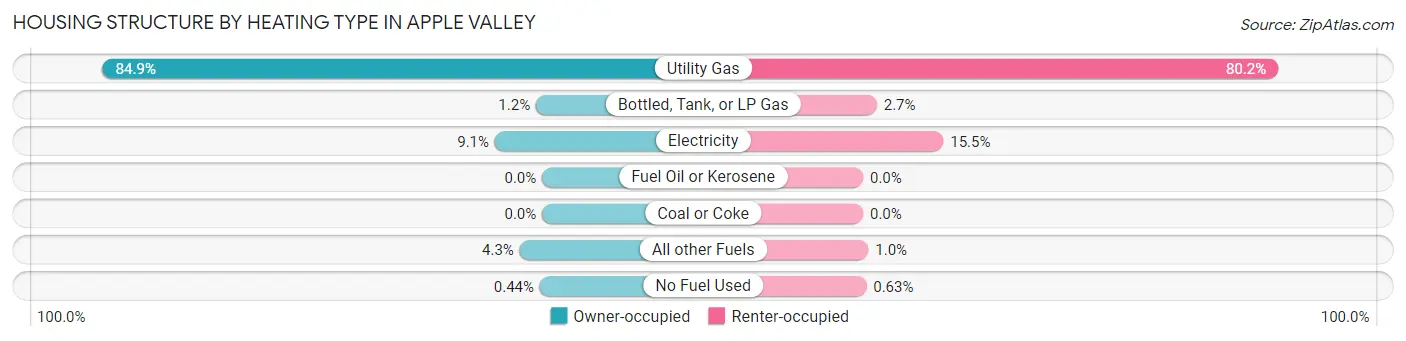
| Heating Type | Owner-occupied | Renter-occupied |
| Utility Gas | 14,208 (84.9%) | 6,451 (80.2%) |
| Bottled, Tank, or LP Gas | 197 (1.2%) | 214 (2.7%) |
| Electricity | 1,528 (9.1%) | 1,248 (15.5%) |
| Fuel Oil or Kerosene | 0 (0.0%) | 0 (0.0%) |
| Coal or Coke | 0 (0.0%) | 0 (0.0%) |
| All other Fuels | 725 (4.3%) | 82 (1.0%) |
| No Fuel Used | 73 (0.4%) | 51 (0.6%) |
| Total | 16,731 (100.0%) | 8,046 (100.0%) |
Household Vehicle Usage in Apple Valley
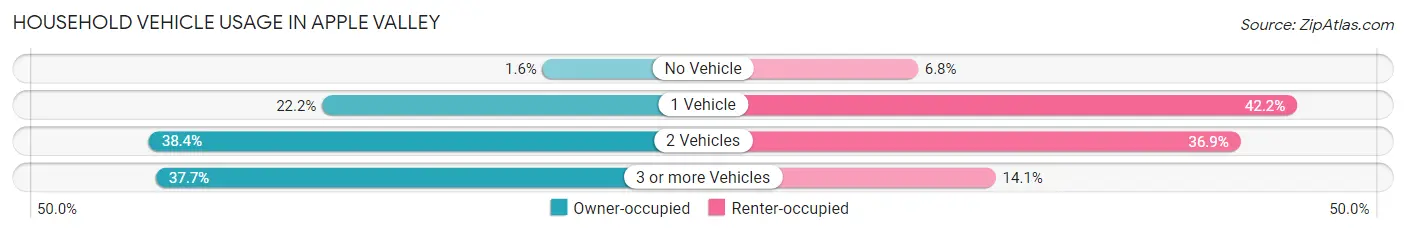
| Vehicles per Household | Owner-occupied | Renter-occupied |
| No Vehicle | 275 (1.6%) | 547 (6.8%) |
| 1 Vehicle | 3,717 (22.2%) | 3,396 (42.2%) |
| 2 Vehicles | 6,425 (38.4%) | 2,971 (36.9%) |
| 3 or more Vehicles | 6,314 (37.7%) | 1,132 (14.1%) |
| Total | 16,731 (100.0%) | 8,046 (100.0%) |
Real Estate & Mortgages in Apple Valley
Real Estate and Mortgage Overview in Apple Valley
| Characteristic | Without Mortgage | With Mortgage |
| Housing Units | 4,992 | 11,739 |
| Median Property Value | $309,900 | $359,100 |
| Median Household Income | $55,680 | $2,886 |
| Monthly Housing Costs | $586 | $1,383 |
| Real Estate Taxes | $2,280 | $321 |
Property Value by Mortgage Status in Apple Valley
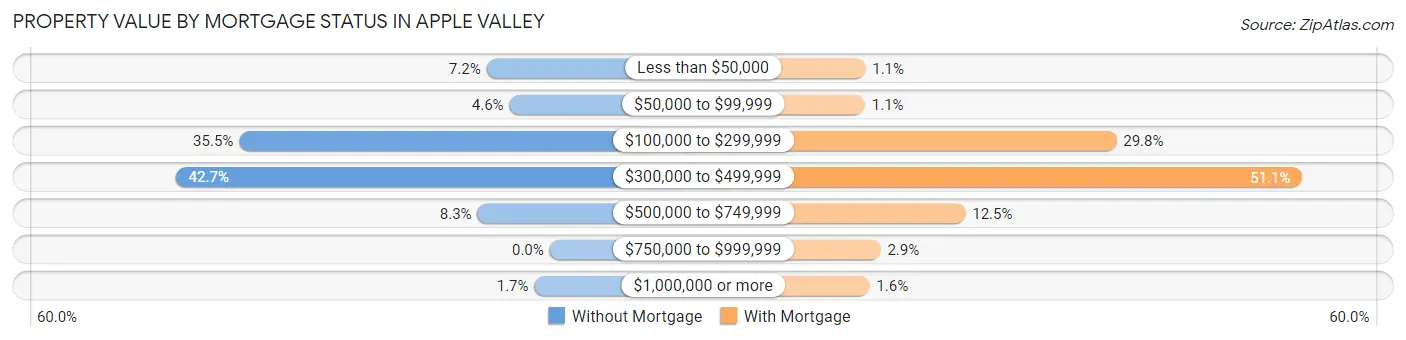
| Property Value | Without Mortgage | With Mortgage |
| Less than $50,000 | 360 (7.2%) | 130 (1.1%) |
| $50,000 to $99,999 | 229 (4.6%) | 124 (1.1%) |
| $100,000 to $299,999 | 1,771 (35.5%) | 3,498 (29.8%) |
| $300,000 to $499,999 | 2,133 (42.7%) | 5,994 (51.1%) |
| $500,000 to $749,999 | 412 (8.3%) | 1,472 (12.5%) |
| $750,000 to $999,999 | 0 (0.0%) | 334 (2.9%) |
| $1,000,000 or more | 87 (1.7%) | 187 (1.6%) |
| Total | 4,992 (100.0%) | 11,739 (100.0%) |
Household Income by Mortgage Status in Apple Valley
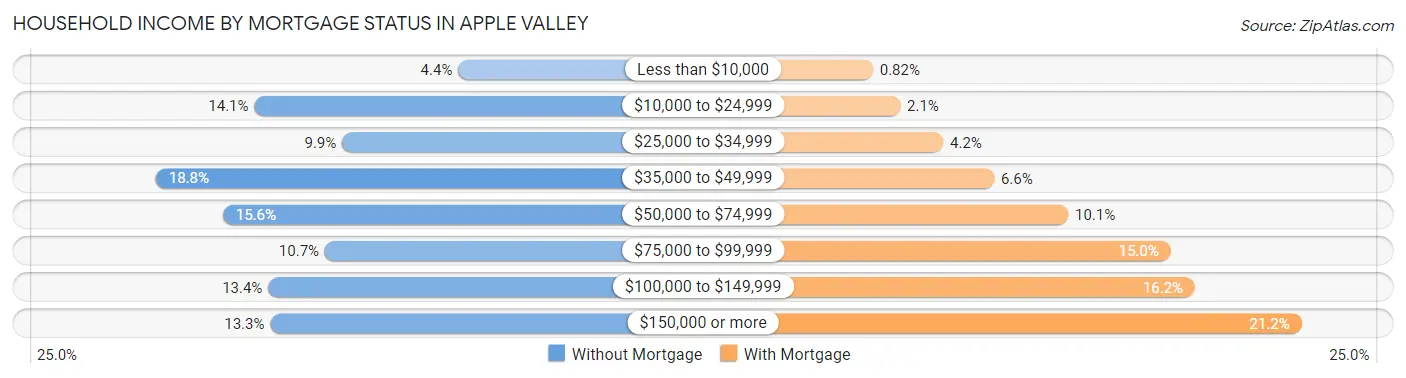
| Household Income | Without Mortgage | With Mortgage |
| Less than $10,000 | 217 (4.3%) | 96 (0.8%) |
| $10,000 to $24,999 | 702 (14.1%) | 249 (2.1%) |
| $25,000 to $34,999 | 493 (9.9%) | 490 (4.2%) |
| $35,000 to $49,999 | 936 (18.8%) | 774 (6.6%) |
| $50,000 to $74,999 | 777 (15.6%) | 1,188 (10.1%) |
| $75,000 to $99,999 | 534 (10.7%) | 1,762 (15.0%) |
| $100,000 to $149,999 | 669 (13.4%) | 1,897 (16.2%) |
| $150,000 or more | 664 (13.3%) | 2,493 (21.2%) |
| Total | 4,992 (100.0%) | 11,739 (100.0%) |
Property Value to Household Income Ratio in Apple Valley
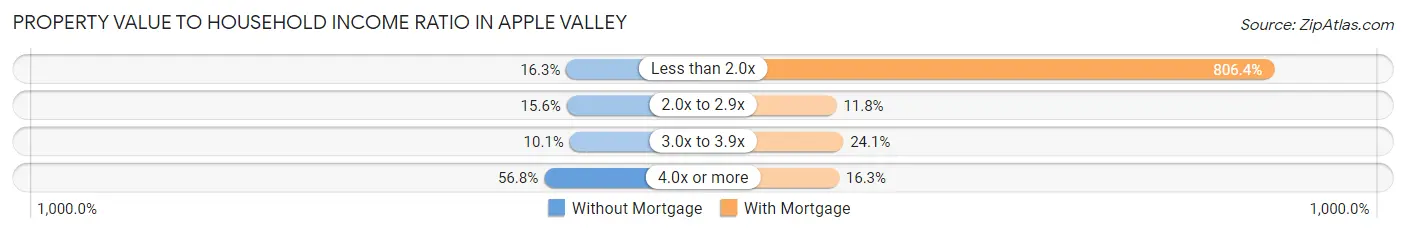
| Value-to-Income Ratio | Without Mortgage | With Mortgage |
| Less than 2.0x | 814 (16.3%) | 94,664 (806.4%) |
| 2.0x to 2.9x | 777 (15.6%) | 1,389 (11.8%) |
| 3.0x to 3.9x | 506 (10.1%) | 2,829 (24.1%) |
| 4.0x or more | 2,834 (56.8%) | 1,910 (16.3%) |
| Total | 4,992 (100.0%) | 11,739 (100.0%) |
Real Estate Taxes by Mortgage Status in Apple Valley
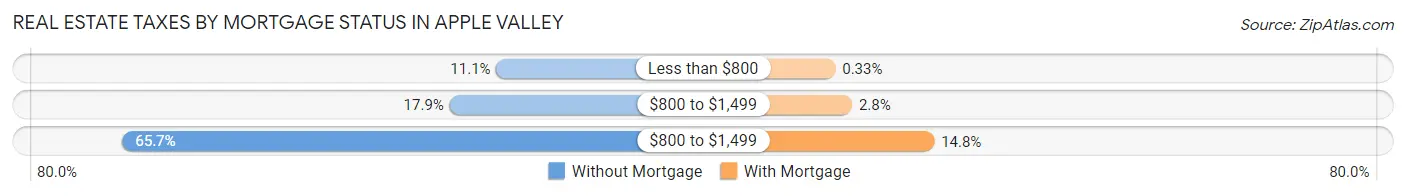
| Property Taxes | Without Mortgage | With Mortgage |
| Less than $800 | 552 (11.1%) | 39 (0.3%) |
| $800 to $1,499 | 893 (17.9%) | 325 (2.8%) |
| $800 to $1,499 | 3,280 (65.7%) | 1,735 (14.8%) |
| Total | 4,992 (100.0%) | 11,739 (100.0%) |
Health & Disability in Apple Valley
Health Insurance Coverage by Age in Apple Valley
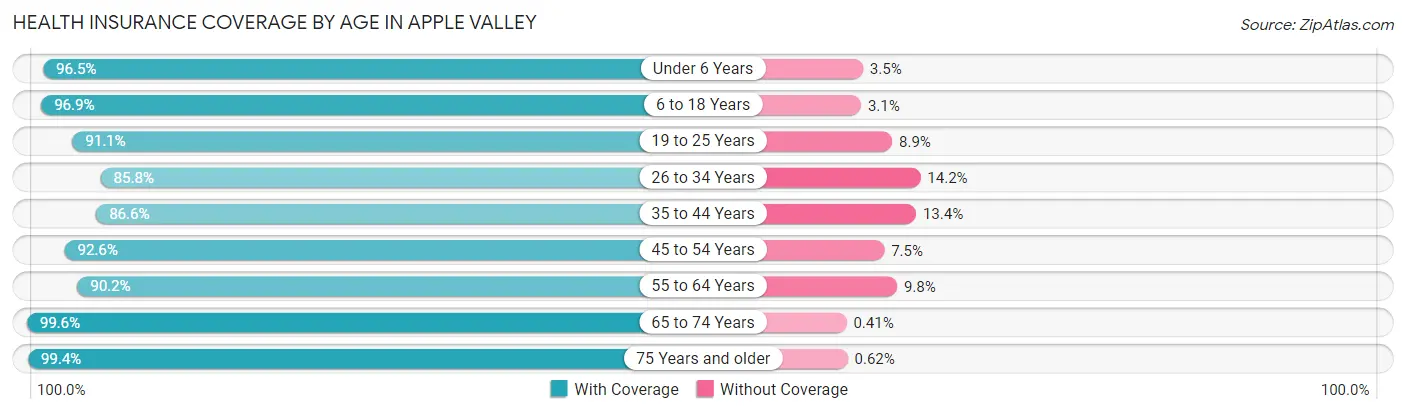
| Age Bracket | With Coverage | Without Coverage |
| Under 6 Years | 6,586 (96.5%) | 237 (3.5%) |
| 6 to 18 Years | 15,425 (96.9%) | 495 (3.1%) |
| 19 to 25 Years | 5,391 (91.1%) | 527 (8.9%) |
| 26 to 34 Years | 6,802 (85.8%) | 1,125 (14.2%) |
| 35 to 44 Years | 7,636 (86.6%) | 1,178 (13.4%) |
| 45 to 54 Years | 7,551 (92.5%) | 608 (7.4%) |
| 55 to 64 Years | 8,385 (90.2%) | 914 (9.8%) |
| 65 to 74 Years | 7,117 (99.6%) | 29 (0.4%) |
| 75 Years and older | 5,138 (99.4%) | 32 (0.6%) |
| Total | 70,031 (93.2%) | 5,145 (6.8%) |
Health Insurance Coverage by Citizenship Status in Apple Valley
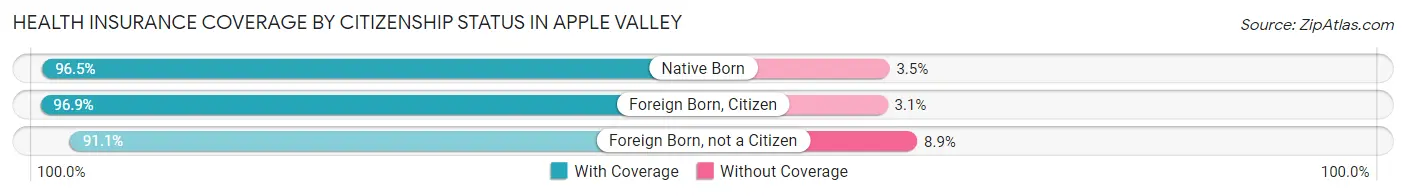
| Citizenship Status | With Coverage | Without Coverage |
| Native Born | 6,586 (96.5%) | 237 (3.5%) |
| Foreign Born, Citizen | 15,425 (96.9%) | 495 (3.1%) |
| Foreign Born, not a Citizen | 5,391 (91.1%) | 527 (8.9%) |
Health Insurance Coverage by Household Income in Apple Valley
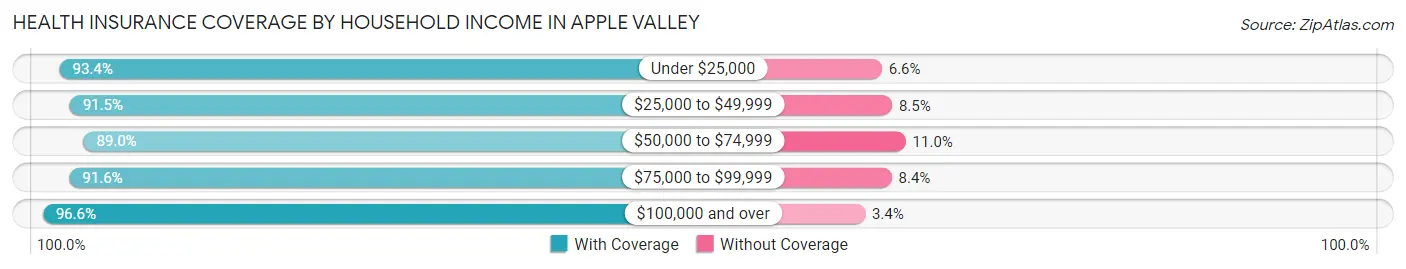
| Household Income | With Coverage | Without Coverage |
| Under $25,000 | 8,455 (93.4%) | 594 (6.6%) |
| $25,000 to $49,999 | 14,320 (91.5%) | 1,324 (8.5%) |
| $50,000 to $74,999 | 11,141 (89.0%) | 1,381 (11.0%) |
| $75,000 to $99,999 | 9,976 (91.6%) | 915 (8.4%) |
| $100,000 and over | 25,934 (96.6%) | 914 (3.4%) |
Public vs Private Health Insurance Coverage by Age in Apple Valley
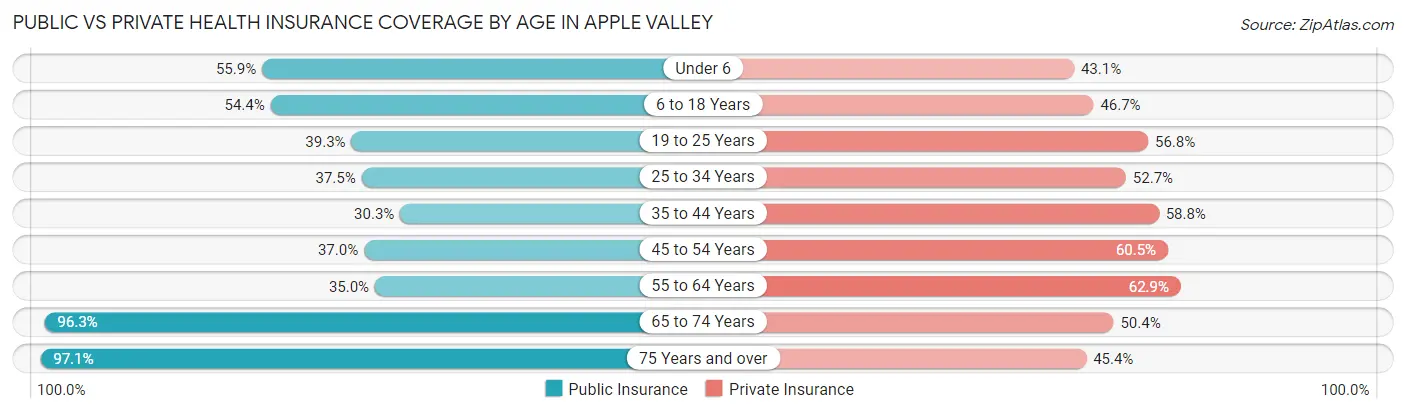
| Age Bracket | Public Insurance | Private Insurance |
| Under 6 | 3,817 (55.9%) | 2,941 (43.1%) |
| 6 to 18 Years | 8,652 (54.3%) | 7,436 (46.7%) |
| 19 to 25 Years | 2,328 (39.3%) | 3,364 (56.8%) |
| 25 to 34 Years | 2,969 (37.4%) | 4,181 (52.7%) |
| 35 to 44 Years | 2,670 (30.3%) | 5,184 (58.8%) |
| 45 to 54 Years | 3,020 (37.0%) | 4,939 (60.5%) |
| 55 to 64 Years | 3,252 (35.0%) | 5,851 (62.9%) |
| 65 to 74 Years | 6,883 (96.3%) | 3,604 (50.4%) |
| 75 Years and over | 5,019 (97.1%) | 2,345 (45.4%) |
| Total | 38,610 (51.4%) | 39,845 (53.0%) |
Disability Status by Sex by Age in Apple Valley
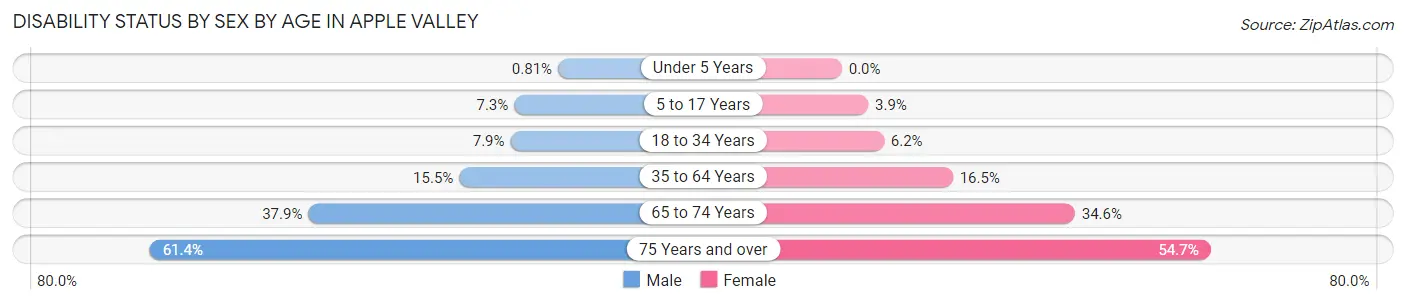
| Age Bracket | Male | Female |
| Under 5 Years | 23 (0.8%) | 0 (0.0%) |
| 5 to 17 Years | 622 (7.3%) | 292 (3.9%) |
| 18 to 34 Years | 528 (7.9%) | 504 (6.2%) |
| 35 to 64 Years | 2,030 (15.5%) | 2,166 (16.5%) |
| 65 to 74 Years | 1,231 (37.9%) | 1,348 (34.6%) |
| 75 Years and over | 1,600 (61.4%) | 1,404 (54.7%) |
Disability Class by Sex by Age in Apple Valley
Disability Class: Hearing Difficulty
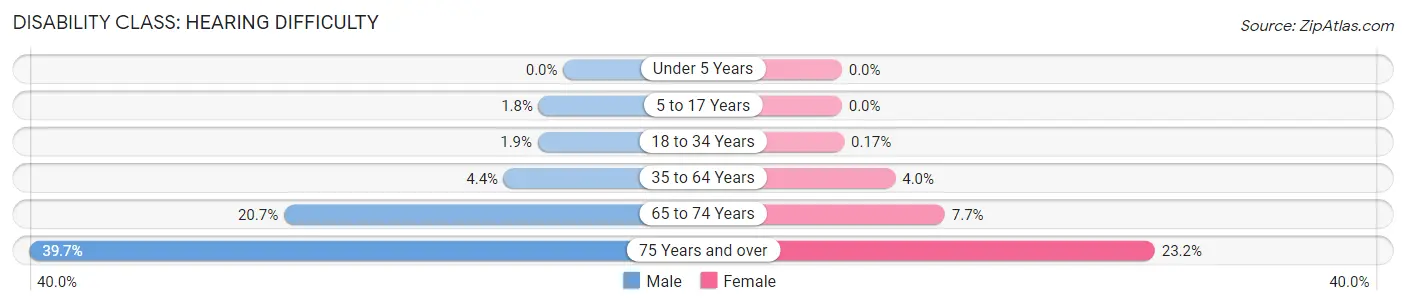
| Age Bracket | Male | Female |
| Under 5 Years | 0 (0.0%) | 0 (0.0%) |
| 5 to 17 Years | 155 (1.8%) | 0 (0.0%) |
| 18 to 34 Years | 127 (1.9%) | 14 (0.2%) |
| 35 to 64 Years | 579 (4.4%) | 522 (4.0%) |
| 65 to 74 Years | 674 (20.7%) | 298 (7.6%) |
| 75 Years and over | 1,033 (39.7%) | 596 (23.2%) |
Disability Class: Vision Difficulty
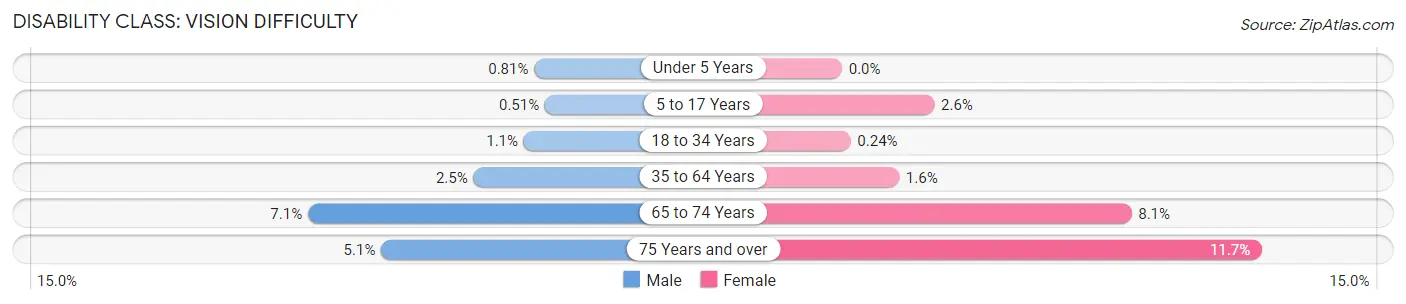
| Age Bracket | Male | Female |
| Under 5 Years | 23 (0.8%) | 0 (0.0%) |
| 5 to 17 Years | 43 (0.5%) | 192 (2.6%) |
| 18 to 34 Years | 74 (1.1%) | 19 (0.2%) |
| 35 to 64 Years | 328 (2.5%) | 209 (1.6%) |
| 65 to 74 Years | 231 (7.1%) | 314 (8.1%) |
| 75 Years and over | 132 (5.1%) | 300 (11.7%) |
Disability Class: Cognitive Difficulty
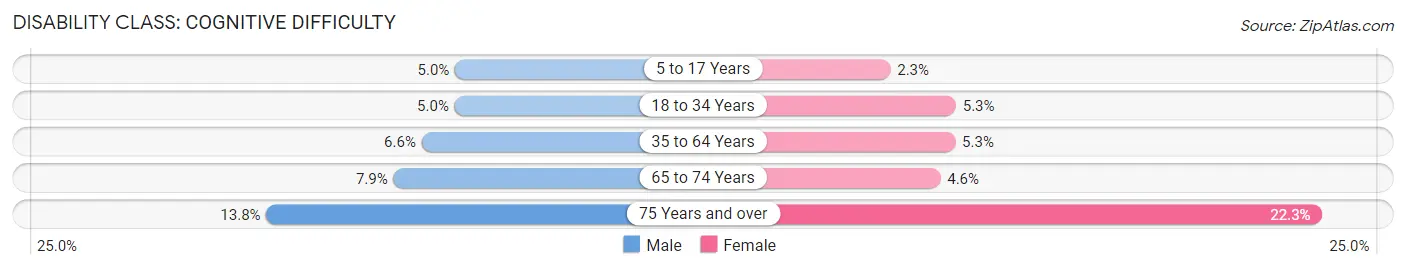
| Age Bracket | Male | Female |
| 5 to 17 Years | 427 (5.0%) | 168 (2.2%) |
| 18 to 34 Years | 338 (5.0%) | 427 (5.3%) |
| 35 to 64 Years | 862 (6.6%) | 691 (5.3%) |
| 65 to 74 Years | 256 (7.9%) | 178 (4.6%) |
| 75 Years and over | 359 (13.8%) | 572 (22.3%) |
Disability Class: Ambulatory Difficulty
| Age Bracket | Male | Female |
| 5 to 17 Years | 51 (0.6%) | 0 (0.0%) |
| 18 to 34 Years | 46 (0.7%) | 115 (1.4%) |
| 35 to 64 Years | 870 (6.6%) | 1,299 (9.9%) |
| 65 to 74 Years | 561 (17.3%) | 775 (19.9%) |
| 75 Years and over | 883 (33.9%) | 1,118 (43.6%) |
Disability Class: Self-Care Difficulty
| Age Bracket | Male | Female |
| 5 to 17 Years | 253 (3.0%) | 19 (0.3%) |
| 18 to 34 Years | 82 (1.2%) | 131 (1.6%) |
| 35 to 64 Years | 509 (3.9%) | 382 (2.9%) |
| 65 to 74 Years | 206 (6.3%) | 266 (6.8%) |
| 75 Years and over | 499 (19.2%) | 521 (20.3%) |
Technology Access in Apple Valley
Computing Device Access in Apple Valley
| Device Type | # Households | % Households |
| Desktop or Laptop | 20,657 | 83.4% |
| Smartphone | 22,644 | 91.4% |
| Tablet | 15,897 | 64.2% |
| No Computing Device | 657 | 2.6% |
| Total | 24,777 | 100.0% |
Internet Access in Apple Valley
| Internet Type | # Households | % Households |
| Dial-Up Internet | 19 | 0.1% |
| Broadband Home | 18,774 | 75.8% |
| Cellular Data Only | 3,416 | 13.8% |
| Satellite Internet | 1,713 | 6.9% |
| No Internet | 1,825 | 7.4% |
| Total | 24,777 | 100.0% |
Apple Valley Summary
Apple Valley is a town located in the Mojave Desert of San Bernardino County, California. It is situated in the Victor Valley, which is part of the High Desert region of Southern California. The town is located about 85 miles northeast of Los Angeles and 35 miles south of Barstow. The population of Apple Valley was estimated to be 72,174 in 2019.
History
Apple Valley was founded in the late 1950s by Orville and Wilbur Armstrong, who purchased the land from the Southern Pacific Railroad. The Armstrongs named the town after the apple orchards that were planted in the area. The town was incorporated in 1988.
Geography
Apple Valley is located in the Mojave Desert of San Bernardino County, California. It is situated in the Victor Valley, which is part of the High Desert region of Southern California. The town is located about 85 miles northeast of Los Angeles and 35 miles south of Barstow. The town is surrounded by the San Bernardino National Forest and the Mojave National Preserve.
The town has a total area of 73.2 square miles, of which 73.1 square miles is land and 0.1 square miles is water. The town is located at an elevation of 2,835 feet.
Economy
Apple Valley is home to several major employers, including St. Mary Medical Center, Apple Valley Unified School District, and Apple Valley Ranchos Water Company. The town is also home to several retail stores, restaurants, and other businesses.
The town's economy is largely based on tourism, with many visitors coming to the area to enjoy the desert scenery and outdoor activities. The town is also home to several golf courses, including the Apple Valley Country Club and the Apple Valley Golf Course.
Demographics
As of the 2019 census, the population of Apple Valley was estimated to be 72,174. The racial makeup of the town was 68.2% White, 5.3% African American, 0.9% Native American, 1.7% Asian, 0.2% Pacific Islander, 20.2% from other races, and 3.5% from two or more races. Hispanic or Latino of any race were 37.2% of the population.
The median household income in Apple Valley was $50,845 in 2019. The median age of the town's population was 34.7 years. The town's population is largely made up of families, with 33.2% of households having children under the age of 18.
Common Questions
What is Per Capita Income in Apple Valley?
Per Capita income in Apple Valley is $29,010.
What is the Median Family Income in Apple Valley?
Median Family Income in Apple Valley is $73,670.
What is the Median Household income in Apple Valley?
Median Household Income in Apple Valley is $62,898.
What is Income or Wage Gap in Apple Valley?
Income or Wage Gap in Apple Valley is 43.3%.
Women in Apple Valley earn 56.7 cents for every dollar earned by a man.
What is Family Income Deficit in Apple Valley?
Family Income Deficit in Apple Valley is $12,297.
Families that are below poverty line in Apple Valley earn $12,297 less on average than the poverty threshold level.
What is Inequality or Gini Index in Apple Valley?
Inequality or Gini Index in Apple Valley is 0.44.
What is the Total Population of Apple Valley?
Total Population of Apple Valley is 75,603.
What is the Total Male Population of Apple Valley?
Total Male Population of Apple Valley is 37,188.
What is the Total Female Population of Apple Valley?
Total Female Population of Apple Valley is 38,415.
What is the Ratio of Males per 100 Females in Apple Valley?
There are 96.81 Males per 100 Females in Apple Valley.
What is the Ratio of Females per 100 Males in Apple Valley?
There are 103.30 Females per 100 Males in Apple Valley.
What is the Median Population Age in Apple Valley?
Median Population Age in Apple Valley is 36.1 Years.
What is the Average Family Size in Apple Valley
Average Family Size in Apple Valley is 3.5 People.
What is the Average Household Size in Apple Valley
Average Household Size in Apple Valley is 3.0 People.
How Large is the Labor Force in Apple Valley?
There are 30,052 People in the Labor Forcein in Apple Valley.
What is the Percentage of People in the Labor Force in Apple Valley?
53.4% of People are in the Labor Force in Apple Valley.
What is the Unemployment Rate in Apple Valley?
Unemployment Rate in Apple Valley is 9.2%.