Oceanside, CA Map & Demographics
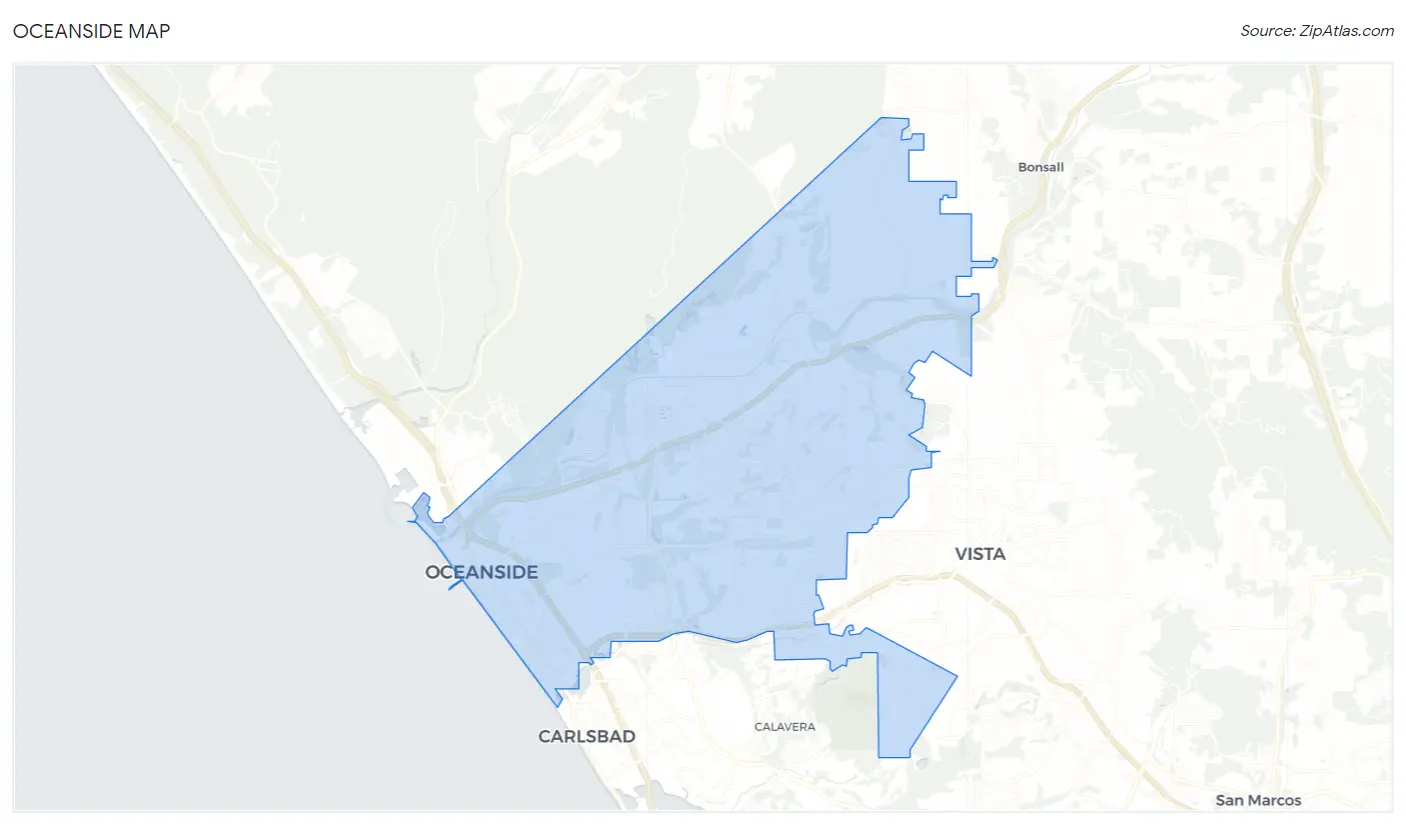
Oceanside Map
Oceanside Overview
$40,131
PER CAPITA INCOME
$101,357
AVG FAMILY INCOME
$86,701
AVG HOUSEHOLD INCOME
26.0%
WAGE / INCOME GAP [ % ]
74.0¢/ $1
WAGE / INCOME GAP [ $ ]
$13,306
FAMILY INCOME DEFICIT
0.42
INEQUALITY / GINI INDEX
173,722
TOTAL POPULATION
86,713
MALE POPULATION
87,009
FEMALE POPULATION
99.66
MALES / 100 FEMALES
100.34
FEMALES / 100 MALES
37.5
MEDIAN AGE
3.3
AVG FAMILY SIZE
2.8
AVG HOUSEHOLD SIZE
94,455
LABOR FORCE [ PEOPLE ]
67.1%
PERCENT IN LABOR FORCE
5.9%
UNEMPLOYMENT RATE
Income in Oceanside
Income Overview in Oceanside
Per Capita Income in Oceanside is $40,131, while median incomes of families and households are $101,357 and $86,701 respectively.
| Characteristic | Number | Measure |
| Per Capita Income | 173,722 | $40,131 |
| Median Family Income | 41,845 | $101,357 |
| Mean Family Income | 41,845 | $122,675 |
| Median Household Income | 61,636 | $86,701 |
| Mean Household Income | 61,636 | $109,818 |
| Income Deficit | 41,845 | $13,306 |
| Wage / Income Gap (%) | 173,722 | 26.05% |
| Wage / Income Gap ($) | 173,722 | 73.95¢ per $1 |
| Gini / Inequality Index | 173,722 | 0.42 |
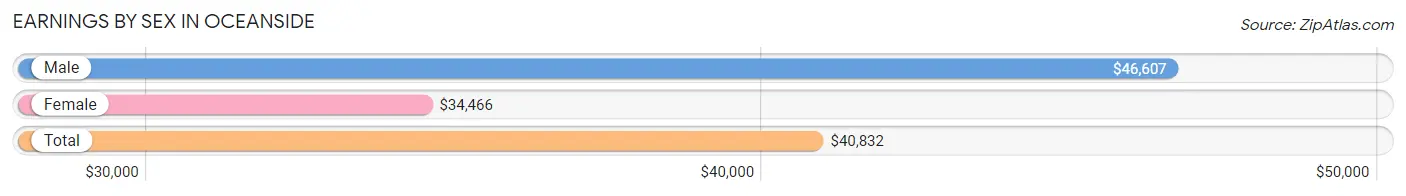
Earnings by Sex in Oceanside
Average Earnings in Oceanside are $40,832, $46,607 for men and $34,466 for women, a difference of 26.1%.
| Sex | Number | Average Earnings |
| Male | 53,239 (54.8%) | $46,607 |
| Female | 43,817 (45.2%) | $34,466 |
| Total | 97,056 (100.0%) | $40,832 |
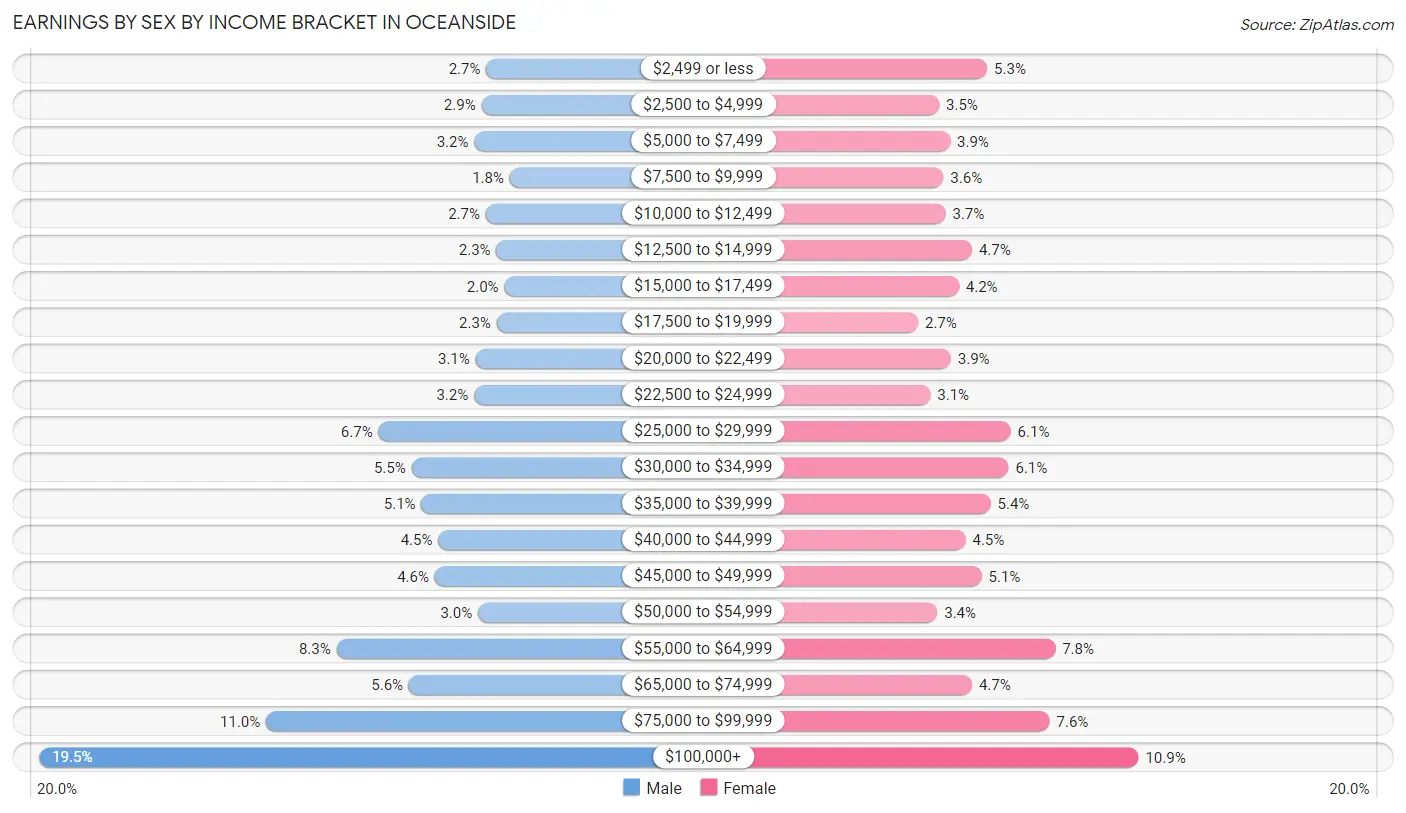
Earnings by Sex by Income Bracket in Oceanside
The most common earnings brackets in Oceanside are $100,000+ for men (10,355 | 19.5%) and $100,000+ for women (4,791 | 10.9%).
| Income | Male | Female |
| $2,499 or less | 1,440 (2.7%) | 2,305 (5.3%) |
| $2,500 to $4,999 | 1,534 (2.9%) | 1,517 (3.5%) |
| $5,000 to $7,499 | 1,678 (3.2%) | 1,696 (3.9%) |
| $7,500 to $9,999 | 967 (1.8%) | 1,585 (3.6%) |
| $10,000 to $12,499 | 1,447 (2.7%) | 1,623 (3.7%) |
| $12,500 to $14,999 | 1,234 (2.3%) | 2,053 (4.7%) |
| $15,000 to $17,499 | 1,074 (2.0%) | 1,839 (4.2%) |
| $17,500 to $19,999 | 1,231 (2.3%) | 1,171 (2.7%) |
| $20,000 to $22,499 | 1,649 (3.1%) | 1,710 (3.9%) |
| $22,500 to $24,999 | 1,683 (3.2%) | 1,373 (3.1%) |
| $25,000 to $29,999 | 3,586 (6.7%) | 2,689 (6.1%) |
| $30,000 to $34,999 | 2,930 (5.5%) | 2,654 (6.1%) |
| $35,000 to $39,999 | 2,730 (5.1%) | 2,361 (5.4%) |
| $40,000 to $44,999 | 2,396 (4.5%) | 1,950 (4.4%) |
| $45,000 to $49,999 | 2,467 (4.6%) | 2,212 (5.1%) |
| $50,000 to $54,999 | 1,601 (3.0%) | 1,485 (3.4%) |
| $55,000 to $64,999 | 4,424 (8.3%) | 3,421 (7.8%) |
| $65,000 to $74,999 | 2,981 (5.6%) | 2,054 (4.7%) |
| $75,000 to $99,999 | 5,832 (11.0%) | 3,328 (7.6%) |
| $100,000+ | 10,355 (19.5%) | 4,791 (10.9%) |
| Total | 53,239 (100.0%) | 43,817 (100.0%) |
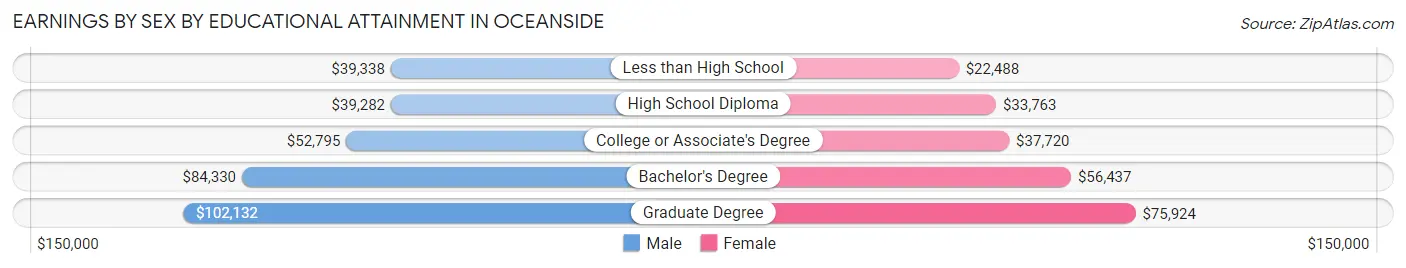
Earnings by Sex by Educational Attainment in Oceanside
Average earnings in Oceanside are $55,947 for men and $40,052 for women, a difference of 28.4%. Men with an educational attainment of graduate degree enjoy the highest average annual earnings of $102,132, while those with high school diploma education earn the least with $39,282. Women with an educational attainment of graduate degree earn the most with the average annual earnings of $75,924, while those with less than high school education have the smallest earnings of $22,488.
| Educational Attainment | Male Income | Female Income |
| Less than High School | $39,338 | $22,488 |
| High School Diploma | $39,282 | $33,763 |
| College or Associate's Degree | $52,795 | $37,720 |
| Bachelor's Degree | $84,330 | $56,437 |
| Graduate Degree | $102,132 | $75,924 |
| Total | $55,947 | $40,052 |
Family Income in Oceanside
Family Income Brackets in Oceanside
According to the Oceanside family income data, there are 9,164 families falling into the $100,000 to $149,999 income range, which is the most common income bracket and makes up 21.9% of all families. Conversely, the $10,000 to $14,999 income bracket is the least frequent group with only 335 families (0.8%) belonging to this category.
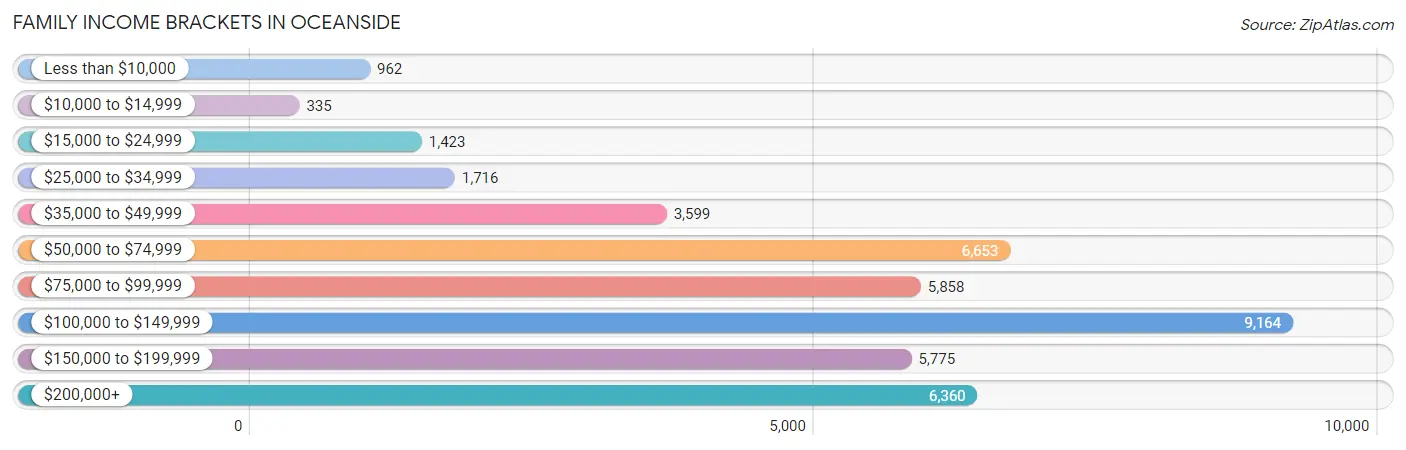
| Income Bracket | # Families | % Families |
| Less than $10,000 | 962 | 2.3% |
| $10,000 to $14,999 | 335 | 0.8% |
| $15,000 to $24,999 | 1,423 | 3.4% |
| $25,000 to $34,999 | 1,716 | 4.1% |
| $35,000 to $49,999 | 3,599 | 8.6% |
| $50,000 to $74,999 | 6,653 | 15.9% |
| $75,000 to $99,999 | 5,858 | 14.0% |
| $100,000 to $149,999 | 9,164 | 21.9% |
| $150,000 to $199,999 | 5,775 | 13.8% |
| $200,000+ | 6,360 | 15.2% |
Family Income by Famaliy Size in Oceanside
4-person families (7,970 | 19.1%) account for the highest median family income in Oceanside with $126,288 per family, while 2-person families (18,541 | 44.3%) have the highest median income of $43,555 per family member.
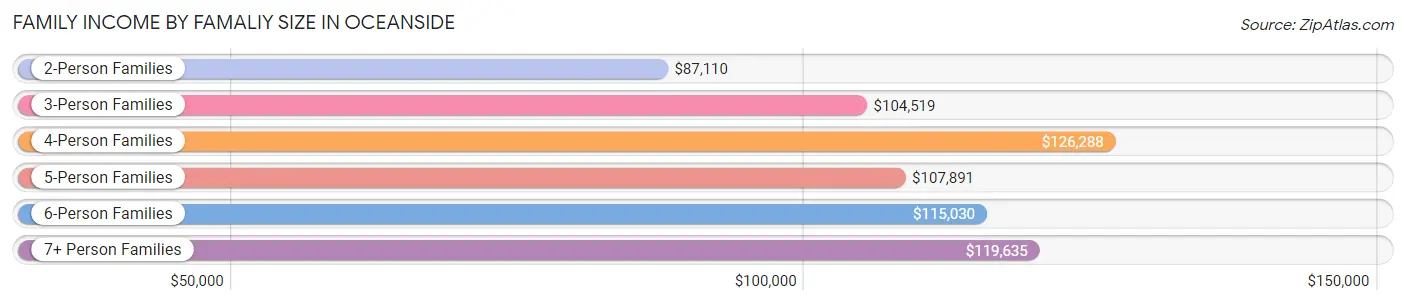
| Income Bracket | # Families | Median Income |
| 2-Person Families | 18,541 (44.3%) | $87,110 |
| 3-Person Families | 9,061 (21.6%) | $104,519 |
| 4-Person Families | 7,970 (19.1%) | $126,288 |
| 5-Person Families | 3,711 (8.9%) | $107,891 |
| 6-Person Families | 1,563 (3.7%) | $115,030 |
| 7+ Person Families | 999 (2.4%) | $119,635 |
| Total | 41,845 (100.0%) | $101,357 |
Family Income by Number of Earners in Oceanside
The median family income in Oceanside is $101,357, with families comprising 3+ earners (7,181) having the highest median family income of $146,288, while families with no earners (5,459) have the lowest median family income of $57,669, accounting for 17.2% and 13.1% of families, respectively.
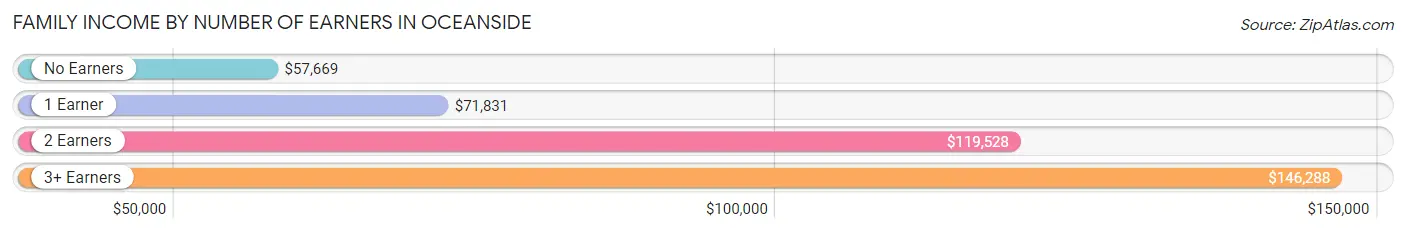
| Number of Earners | # Families | Median Income |
| No Earners | 5,459 (13.1%) | $57,669 |
| 1 Earner | 11,713 (28.0%) | $71,831 |
| 2 Earners | 17,492 (41.8%) | $119,528 |
| 3+ Earners | 7,181 (17.2%) | $146,288 |
| Total | 41,845 (100.0%) | $101,357 |
Household Income in Oceanside
Household Income Brackets in Oceanside
With 12,204 households falling in the category, the $100,000 to $149,999 income range is the most frequent in Oceanside, accounting for 19.8% of all households. In contrast, only 1,418 households (2.3%) fall into the $10,000 to $14,999 income bracket, making it the least populous group.
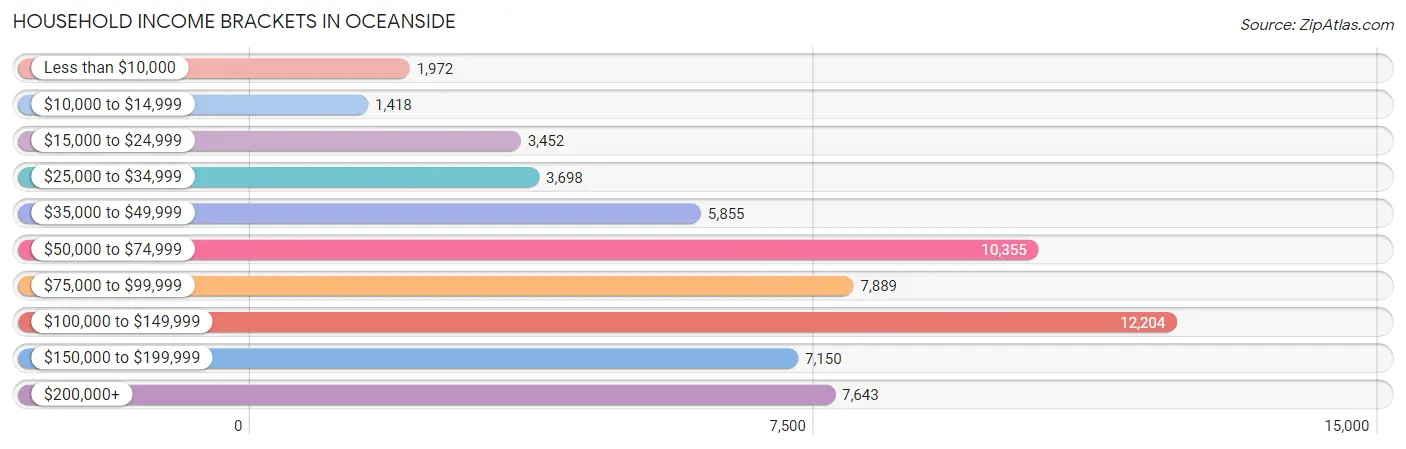
| Income Bracket | # Households | % Households |
| Less than $10,000 | 1,972 | 3.2% |
| $10,000 to $14,999 | 1,418 | 2.3% |
| $15,000 to $24,999 | 3,452 | 5.6% |
| $25,000 to $34,999 | 3,698 | 6.0% |
| $35,000 to $49,999 | 5,855 | 9.5% |
| $50,000 to $74,999 | 10,355 | 16.8% |
| $75,000 to $99,999 | 7,889 | 12.8% |
| $100,000 to $149,999 | 12,204 | 19.8% |
| $150,000 to $199,999 | 7,150 | 11.6% |
| $200,000+ | 7,643 | 12.4% |
Household Income by Householder Age in Oceanside
The median household income in Oceanside is $86,701, with the highest median household income of $103,730 found in the 45 to 64 years age bracket for the primary householder. A total of 22,006 households (35.7%) fall into this category. Meanwhile, the 65+ years age bracket for the primary householder has the lowest median household income of $60,109, with 16,436 households (26.7%) in this group.
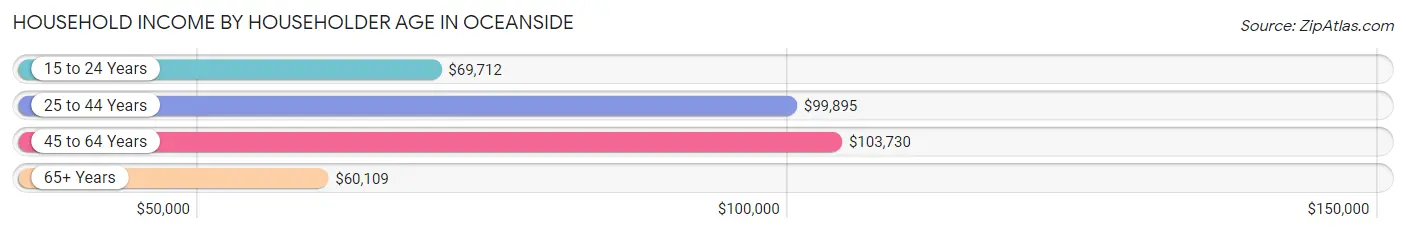
| Income Bracket | # Households | Median Income |
| 15 to 24 Years | 2,040 (3.3%) | $69,712 |
| 25 to 44 Years | 21,154 (34.3%) | $99,895 |
| 45 to 64 Years | 22,006 (35.7%) | $103,730 |
| 65+ Years | 16,436 (26.7%) | $60,109 |
| Total | 61,636 (100.0%) | $86,701 |
Poverty in Oceanside
Income Below Poverty by Sex and Age in Oceanside
With 7.9% poverty level for males and 10.5% for females among the residents of Oceanside, 12 to 14 year old males and 16 and 17 year old females are the most vulnerable to poverty, with 585 males (17.0%) and 367 females (18.8%) in their respective age groups living below the poverty level.
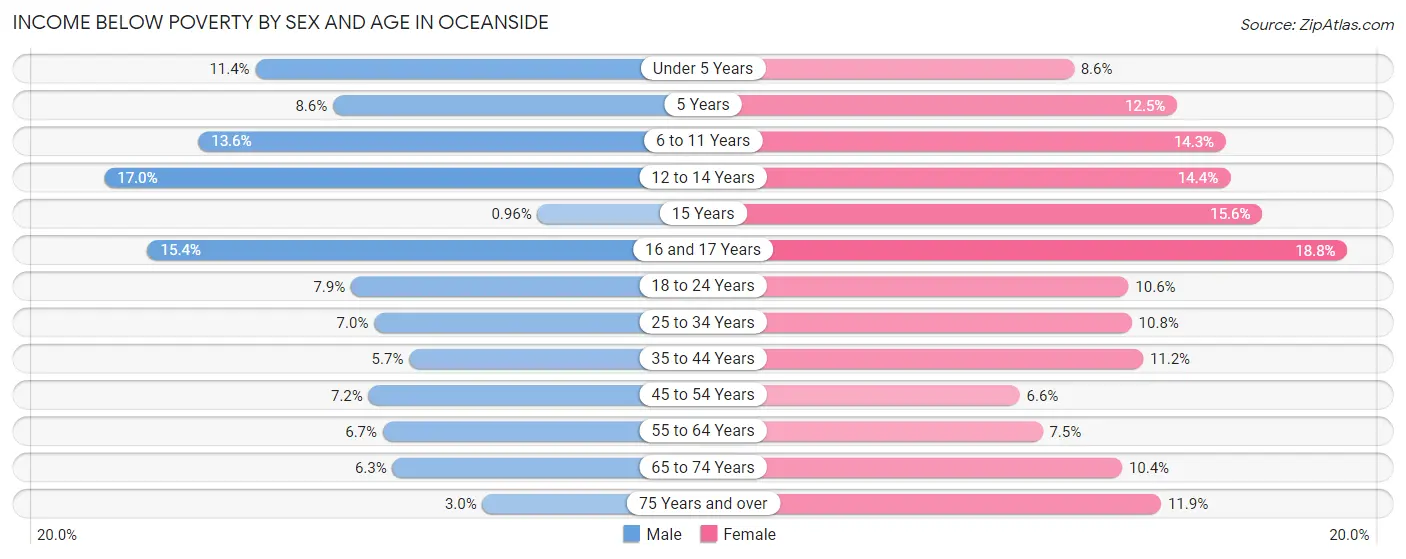
| Age Bracket | Male | Female |
| Under 5 Years | 593 (11.4%) | 403 (8.6%) |
| 5 Years | 82 (8.6%) | 96 (12.4%) |
| 6 to 11 Years | 786 (13.6%) | 847 (14.3%) |
| 12 to 14 Years | 585 (17.0%) | 534 (14.4%) |
| 15 Years | 7 (1.0%) | 138 (15.6%) |
| 16 and 17 Years | 323 (15.4%) | 367 (18.8%) |
| 18 to 24 Years | 688 (7.9%) | 784 (10.6%) |
| 25 to 34 Years | 1,004 (7.0%) | 1,386 (10.8%) |
| 35 to 44 Years | 695 (5.7%) | 1,270 (11.2%) |
| 45 to 54 Years | 711 (7.2%) | 670 (6.6%) |
| 55 to 64 Years | 758 (6.7%) | 840 (7.4%) |
| 65 to 74 Years | 441 (6.3%) | 885 (10.4%) |
| 75 Years and over | 135 (3.0%) | 847 (11.8%) |
| Total | 6,808 (7.9%) | 9,067 (10.5%) |
Income Above Poverty by Sex and Age in Oceanside
According to the poverty statistics in Oceanside, males aged 15 years and females aged 45 to 54 years are the age groups that are most secure financially, with 99.0% of males and 93.4% of females in these age groups living above the poverty line.
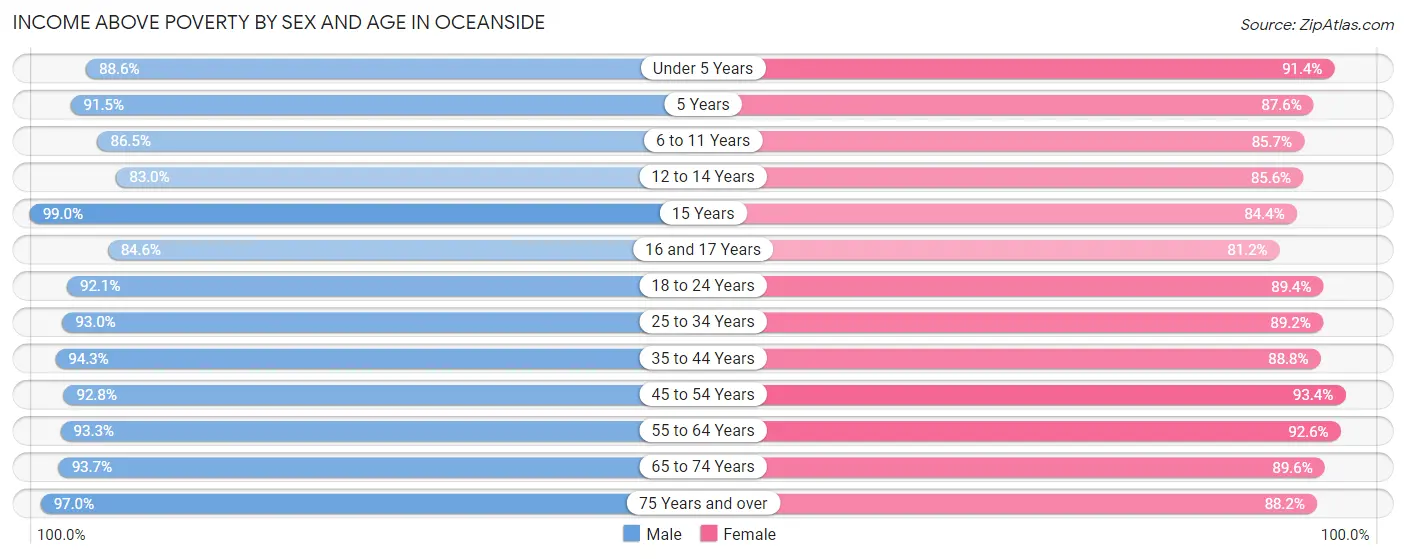
| Age Bracket | Male | Female |
| Under 5 Years | 4,597 (88.6%) | 4,276 (91.4%) |
| 5 Years | 877 (91.4%) | 675 (87.5%) |
| 6 to 11 Years | 5,014 (86.5%) | 5,091 (85.7%) |
| 12 to 14 Years | 2,849 (83.0%) | 3,171 (85.6%) |
| 15 Years | 719 (99.0%) | 746 (84.4%) |
| 16 and 17 Years | 1,770 (84.6%) | 1,588 (81.2%) |
| 18 to 24 Years | 8,042 (92.1%) | 6,585 (89.4%) |
| 25 to 34 Years | 13,289 (93.0%) | 11,495 (89.2%) |
| 35 to 44 Years | 11,463 (94.3%) | 10,090 (88.8%) |
| 45 to 54 Years | 9,129 (92.8%) | 9,474 (93.4%) |
| 55 to 64 Years | 10,557 (93.3%) | 10,434 (92.5%) |
| 65 to 74 Years | 6,518 (93.7%) | 7,623 (89.6%) |
| 75 Years and over | 4,358 (97.0%) | 6,298 (88.1%) |
| Total | 79,182 (92.1%) | 77,546 (89.5%) |
Income Below Poverty Among Married-Couple Families in Oceanside
The poverty statistics for married-couple families in Oceanside show that 3.0% or 943 of the total 31,687 families live below the poverty line. Families with 5 or more children have the highest poverty rate of 15.7%, comprising of 24 families. On the other hand, families with no children have the lowest poverty rate of 1.7%, which includes 321 families.
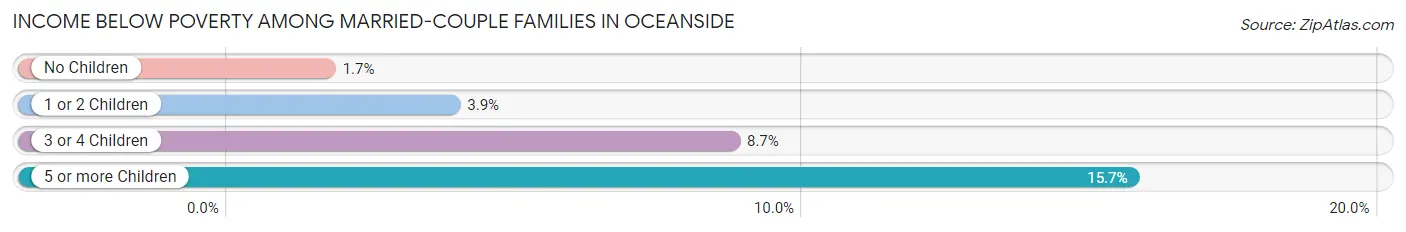
| Children | Above Poverty | Below Poverty |
| No Children | 18,513 (98.3%) | 321 (1.7%) |
| 1 or 2 Children | 10,097 (96.1%) | 406 (3.9%) |
| 3 or 4 Children | 2,005 (91.3%) | 192 (8.7%) |
| 5 or more Children | 129 (84.3%) | 24 (15.7%) |
| Total | 30,744 (97.0%) | 943 (3.0%) |
Income Below Poverty Among Single-Parent Households in Oceanside
According to the poverty data in Oceanside, 6.3% or 238 single-father households and 17.6% or 1,126 single-mother households are living below the poverty line. Among single-father households, those with 3 or 4 children have the highest poverty rate, with 53 households (17.0%) experiencing poverty. Likewise, among single-mother households, those with 5 or more children have the highest poverty rate, with 69 households (78.4%) falling below the poverty line.
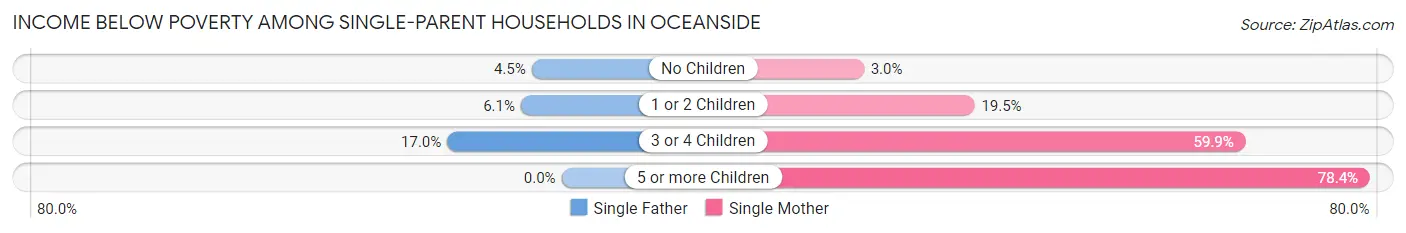
| Children | Single Father | Single Mother |
| No Children | 70 (4.5%) | 85 (3.0%) |
| 1 or 2 Children | 115 (6.1%) | 527 (19.5%) |
| 3 or 4 Children | 53 (17.0%) | 445 (59.9%) |
| 5 or more Children | 0 (0.0%) | 69 (78.4%) |
| Total | 238 (6.3%) | 1,126 (17.6%) |
Income Below Poverty Among Married-Couple vs Single-Parent Households in Oceanside
The poverty data for Oceanside shows that 943 of the married-couple family households (3.0%) and 1,364 of the single-parent households (13.4%) are living below the poverty level. Within the married-couple family households, those with 5 or more children have the highest poverty rate, with 24 households (15.7%) falling below the poverty line. Among the single-parent households, those with 5 or more children have the highest poverty rate, with 69 household (78.4%) living below poverty.
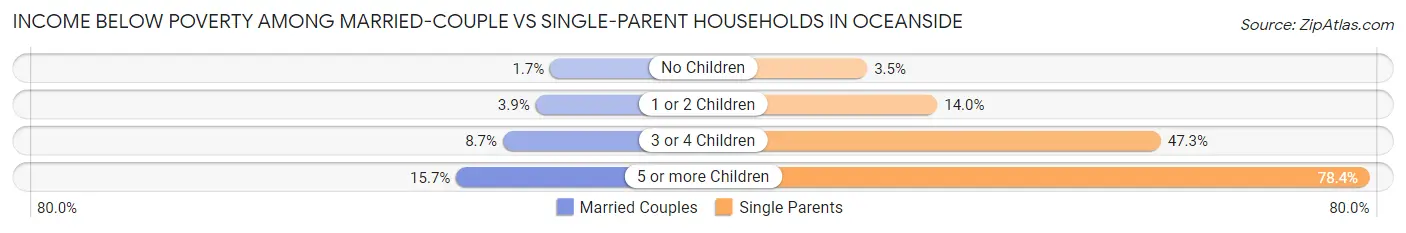
| Children | Married-Couple Families | Single-Parent Households |
| No Children | 321 (1.7%) | 155 (3.5%) |
| 1 or 2 Children | 406 (3.9%) | 642 (14.0%) |
| 3 or 4 Children | 192 (8.7%) | 498 (47.2%) |
| 5 or more Children | 24 (15.7%) | 69 (78.4%) |
| Total | 943 (3.0%) | 1,364 (13.4%) |
Race in Oceanside
The most populous races in Oceanside are White / Caucasian (101,508 | 58.4%), Hispanic or Latino (65,501 | 37.7%), and Two or more Races (33,200 | 19.1%).
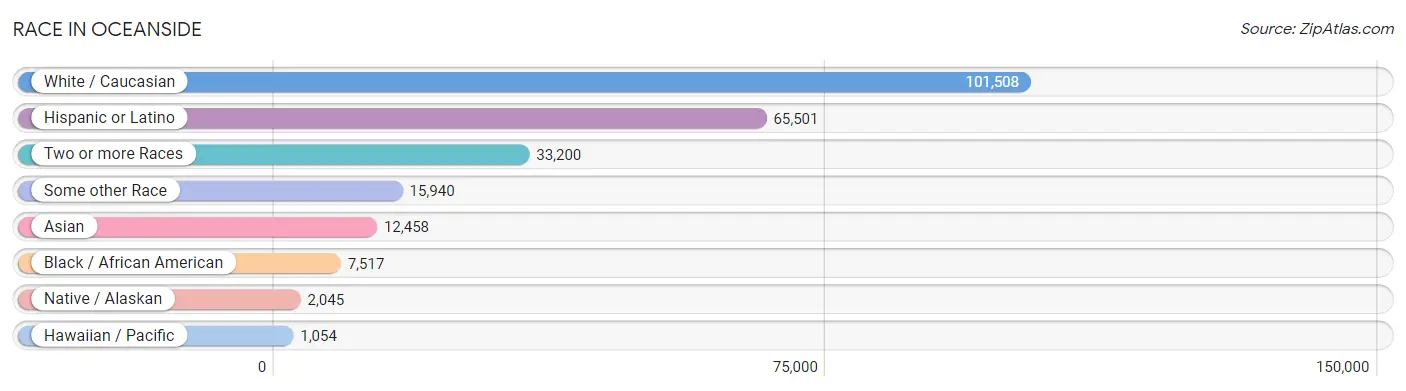
| Race | # Population | % Population |
| Asian | 12,458 | 7.2% |
| Black / African American | 7,517 | 4.3% |
| Hawaiian / Pacific | 1,054 | 0.6% |
| Hispanic or Latino | 65,501 | 37.7% |
| Native / Alaskan | 2,045 | 1.2% |
| White / Caucasian | 101,508 | 58.4% |
| Two or more Races | 33,200 | 19.1% |
| Some other Race | 15,940 | 9.2% |
| Total | 173,722 | 100.0% |
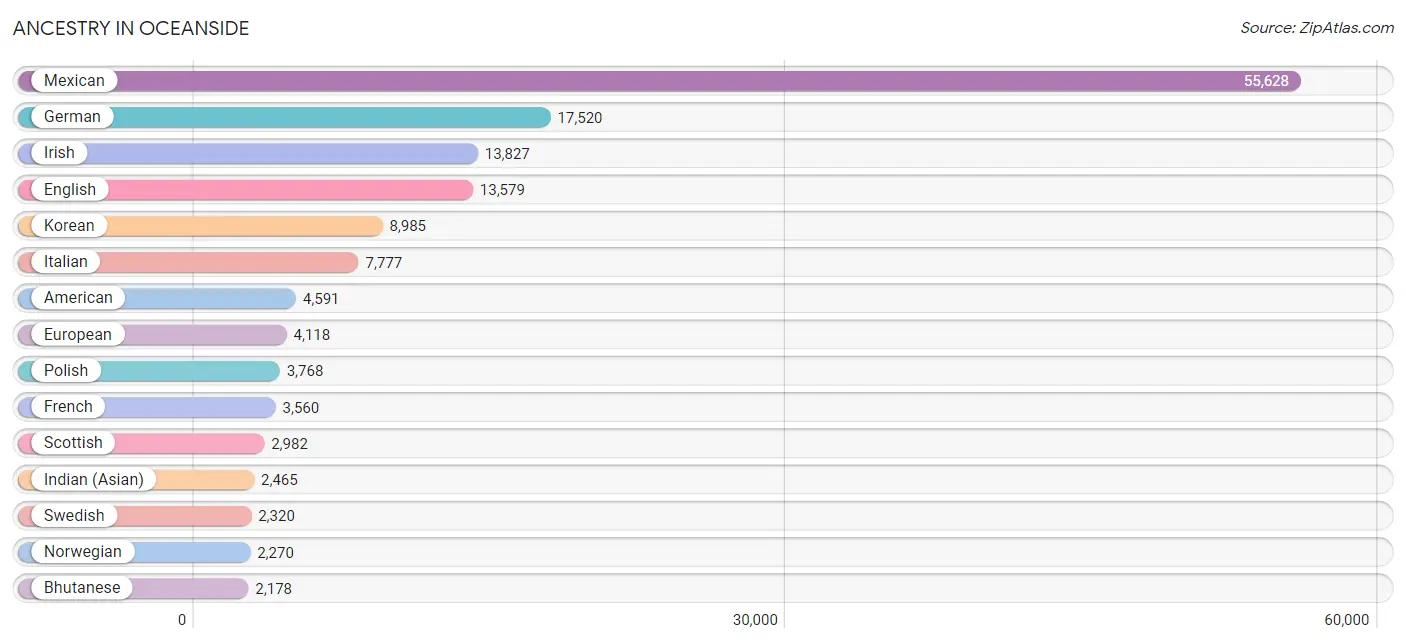
Ancestry in Oceanside
The most populous ancestries reported in Oceanside are Mexican (55,628 | 32.0%), German (17,520 | 10.1%), Irish (13,827 | 8.0%), English (13,579 | 7.8%), and Korean (8,985 | 5.2%), together accounting for 63.1% of all Oceanside residents.
| Ancestry | # Population | % Population |
| Afghan | 161 | 0.1% |
| African | 657 | 0.4% |
| American | 4,591 | 2.6% |
| Apache | 148 | 0.1% |
| Arab | 726 | 0.4% |
| Argentinean | 173 | 0.1% |
| Armenian | 262 | 0.2% |
| Assyrian / Chaldean / Syriac | 48 | 0.0% |
| Australian | 52 | 0.0% |
| Austrian | 324 | 0.2% |
| Bangladeshi | 11 | 0.0% |
| Barbadian | 10 | 0.0% |
| Basque | 144 | 0.1% |
| Belgian | 203 | 0.1% |
| Belizean | 10 | 0.0% |
| Bhutanese | 2,178 | 1.3% |
| Blackfeet | 158 | 0.1% |
| Bolivian | 132 | 0.1% |
| Brazilian | 255 | 0.2% |
| British | 904 | 0.5% |
| Bulgarian | 14 | 0.0% |
| Burmese | 1,345 | 0.8% |
| Cajun | 13 | 0.0% |
| Cambodian | 23 | 0.0% |
| Canadian | 540 | 0.3% |
| Central American | 2,097 | 1.2% |
| Central American Indian | 347 | 0.2% |
| Cherokee | 814 | 0.5% |
| Chickasaw | 31 | 0.0% |
| Chilean | 144 | 0.1% |
| Chinese | 91 | 0.1% |
| Chippewa | 60 | 0.0% |
| Choctaw | 269 | 0.2% |
| Colombian | 483 | 0.3% |
| Comanche | 33 | 0.0% |
| Costa Rican | 110 | 0.1% |
| Creek | 27 | 0.0% |
| Croatian | 198 | 0.1% |
| Crow | 4 | 0.0% |
| Cuban | 736 | 0.4% |
| Czech | 298 | 0.2% |
| Czechoslovakian | 33 | 0.0% |
| Danish | 995 | 0.6% |
| Dominican | 335 | 0.2% |
| Dutch | 1,529 | 0.9% |
| Dutch West Indian | 18 | 0.0% |
| Eastern European | 286 | 0.2% |
| Ecuadorian | 189 | 0.1% |
| Egyptian | 155 | 0.1% |
| English | 13,579 | 7.8% |
| Estonian | 7 | 0.0% |
| Ethiopian | 32 | 0.0% |
| European | 4,118 | 2.4% |
| Fijian | 61 | 0.0% |
| Filipino | 153 | 0.1% |
| Finnish | 345 | 0.2% |
| French | 3,560 | 2.1% |
| French Canadian | 873 | 0.5% |
| German | 17,520 | 10.1% |
| Greek | 612 | 0.4% |
| Guamanian / Chamorro | 291 | 0.2% |
| Guatemalan | 874 | 0.5% |
| Guyanese | 58 | 0.0% |
| Haitian | 36 | 0.0% |
| Hmong | 32 | 0.0% |
| Honduran | 152 | 0.1% |
| Hungarian | 403 | 0.2% |
| Icelander | 107 | 0.1% |
| Indian (Asian) | 2,465 | 1.4% |
| Indonesian | 24 | 0.0% |
| Inupiat | 28 | 0.0% |
| Iranian | 543 | 0.3% |
| Irish | 13,827 | 8.0% |
| Iroquois | 20 | 0.0% |
| Israeli | 53 | 0.0% |
| Italian | 7,777 | 4.5% |
| Jamaican | 218 | 0.1% |
| Japanese | 289 | 0.2% |
| Jordanian | 70 | 0.0% |
| Kenyan | 76 | 0.0% |
| Korean | 8,985 | 5.2% |
| Laotian | 166 | 0.1% |
| Latvian | 17 | 0.0% |
| Lebanese | 222 | 0.1% |
| Liberian | 17 | 0.0% |
| Lithuanian | 302 | 0.2% |
| Macedonian | 15 | 0.0% |
| Malaysian | 36 | 0.0% |
| Mexican | 55,628 | 32.0% |
| Mexican American Indian | 1,207 | 0.7% |
| Mongolian | 18 | 0.0% |
| Moroccan | 13 | 0.0% |
| Native Hawaiian | 1,041 | 0.6% |
| Navajo | 192 | 0.1% |
| New Zealander | 10 | 0.0% |
| Nicaraguan | 192 | 0.1% |
| Nigerian | 11 | 0.0% |
| Northern European | 467 | 0.3% |
| Norwegian | 2,270 | 1.3% |
| Osage | 6 | 0.0% |
| Paiute | 13 | 0.0% |
| Pakistani | 476 | 0.3% |
| Panamanian | 134 | 0.1% |
| Pennsylvania German | 7 | 0.0% |
| Peruvian | 301 | 0.2% |
| Polish | 3,768 | 2.2% |
| Portuguese | 822 | 0.5% |
| Potawatomi | 16 | 0.0% |
| Pueblo | 25 | 0.0% |
| Puerto Rican | 1,948 | 1.1% |
| Romanian | 94 | 0.1% |
| Russian | 1,492 | 0.9% |
| Salvadoran | 635 | 0.4% |
| Samoan | 923 | 0.5% |
| Scandinavian | 959 | 0.5% |
| Scotch-Irish | 1,328 | 0.8% |
| Scottish | 2,982 | 1.7% |
| Senegalese | 6 | 0.0% |
| Serbian | 281 | 0.2% |
| Sioux | 167 | 0.1% |
| Slavic | 178 | 0.1% |
| Slovak | 185 | 0.1% |
| Slovene | 44 | 0.0% |
| South African | 67 | 0.0% |
| South American | 1,437 | 0.8% |
| South American Indian | 66 | 0.0% |
| Spaniard | 1,118 | 0.6% |
| Spanish | 1,159 | 0.7% |
| Spanish American | 29 | 0.0% |
| Sri Lankan | 1,902 | 1.1% |
| Subsaharan African | 879 | 0.5% |
| Swedish | 2,320 | 1.3% |
| Swiss | 471 | 0.3% |
| Syrian | 73 | 0.0% |
| Thai | 1,138 | 0.7% |
| Tlingit-Haida | 94 | 0.1% |
| Tohono O'Odham | 5 | 0.0% |
| Trinidadian and Tobagonian | 244 | 0.1% |
| Turkish | 320 | 0.2% |
| Ukrainian | 370 | 0.2% |
| Venezuelan | 15 | 0.0% |
| Welsh | 744 | 0.4% |
| West Indian | 238 | 0.1% |
| Yugoslavian | 133 | 0.1% | View All 144 Rows |
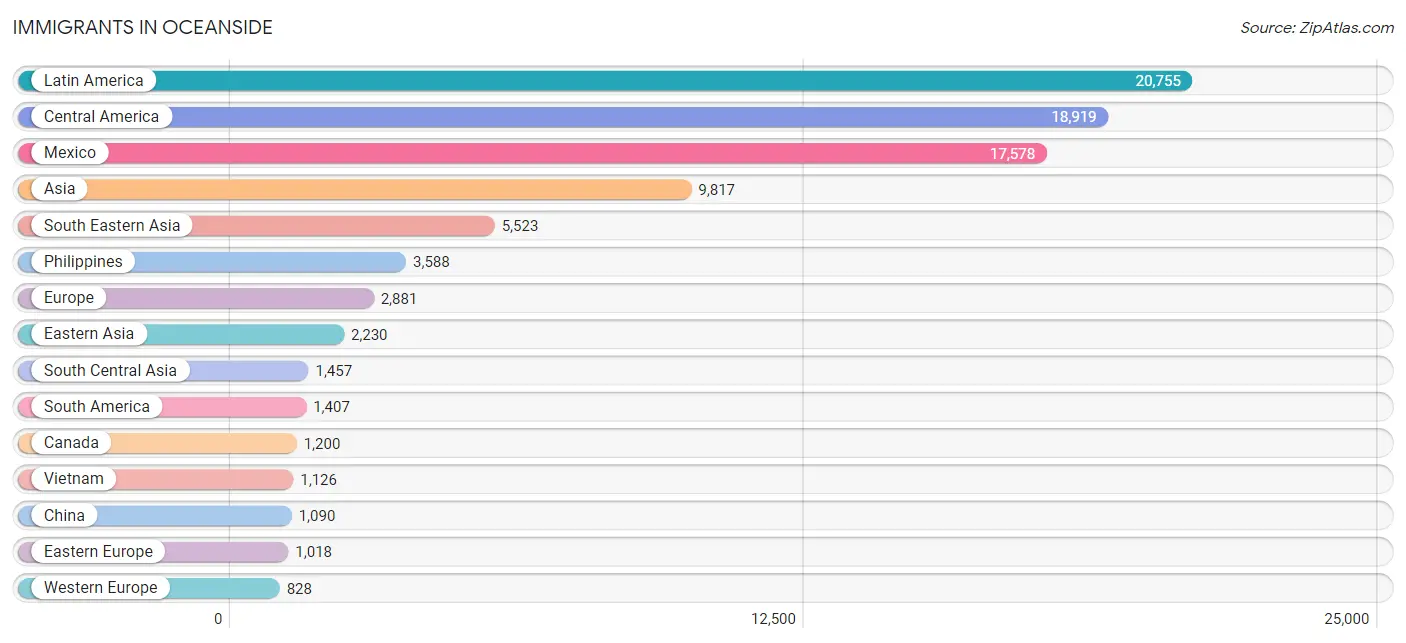
Immigrants in Oceanside
The most numerous immigrant groups reported in Oceanside came from Latin America (20,755 | 11.9%), Central America (18,919 | 10.9%), Mexico (17,578 | 10.1%), Asia (9,817 | 5.7%), and South Eastern Asia (5,523 | 3.2%), together accounting for 41.8% of all Oceanside residents.
| Immigration Origin | # Population | % Population |
| Afghanistan | 146 | 0.1% |
| Africa | 390 | 0.2% |
| Argentina | 52 | 0.0% |
| Asia | 9,817 | 5.7% |
| Australia | 98 | 0.1% |
| Austria | 34 | 0.0% |
| Bahamas | 4 | 0.0% |
| Belarus | 58 | 0.0% |
| Belgium | 46 | 0.0% |
| Bolivia | 90 | 0.1% |
| Bosnia and Herzegovina | 18 | 0.0% |
| Brazil | 308 | 0.2% |
| Bulgaria | 14 | 0.0% |
| Cambodia | 216 | 0.1% |
| Canada | 1,200 | 0.7% |
| Caribbean | 429 | 0.3% |
| Central America | 18,919 | 10.9% |
| Chile | 65 | 0.0% |
| China | 1,090 | 0.6% |
| Colombia | 411 | 0.2% |
| Costa Rica | 41 | 0.0% |
| Croatia | 42 | 0.0% |
| Cuba | 95 | 0.1% |
| Czechoslovakia | 17 | 0.0% |
| Denmark | 39 | 0.0% |
| Dominican Republic | 7 | 0.0% |
| Eastern Africa | 133 | 0.1% |
| Eastern Asia | 2,230 | 1.3% |
| Eastern Europe | 1,018 | 0.6% |
| Ecuador | 182 | 0.1% |
| Egypt | 24 | 0.0% |
| El Salvador | 676 | 0.4% |
| England | 266 | 0.2% |
| Europe | 2,881 | 1.7% |
| France | 43 | 0.0% |
| Germany | 584 | 0.3% |
| Ghana | 4 | 0.0% |
| Guatemala | 350 | 0.2% |
| Guyana | 13 | 0.0% |
| Haiti | 35 | 0.0% |
| Honduras | 128 | 0.1% |
| Hong Kong | 125 | 0.1% |
| Hungary | 45 | 0.0% |
| India | 490 | 0.3% |
| Indonesia | 16 | 0.0% |
| Iran | 404 | 0.2% |
| Iraq | 48 | 0.0% |
| Ireland | 61 | 0.0% |
| Israel | 69 | 0.0% |
| Italy | 189 | 0.1% |
| Jamaica | 27 | 0.0% |
| Japan | 543 | 0.3% |
| Jordan | 54 | 0.0% |
| Kazakhstan | 294 | 0.2% |
| Kenya | 117 | 0.1% |
| Korea | 597 | 0.3% |
| Laos | 12 | 0.0% |
| Latin America | 20,755 | 11.9% |
| Lebanon | 65 | 0.0% |
| Liberia | 17 | 0.0% |
| Lithuania | 55 | 0.0% |
| Malaysia | 283 | 0.2% |
| Mexico | 17,578 | 10.1% |
| Micronesia | 19 | 0.0% |
| Morocco | 32 | 0.0% |
| Netherlands | 73 | 0.0% |
| Nicaragua | 69 | 0.0% |
| Northern Africa | 92 | 0.1% |
| Northern Europe | 713 | 0.4% |
| Norway | 33 | 0.0% |
| Oceania | 448 | 0.3% |
| Pakistan | 14 | 0.0% |
| Panama | 77 | 0.0% |
| Peru | 276 | 0.2% |
| Philippines | 3,588 | 2.1% |
| Poland | 372 | 0.2% |
| Portugal | 46 | 0.0% |
| Romania | 52 | 0.0% |
| Russia | 120 | 0.1% |
| Saudi Arabia | 11 | 0.0% |
| Scotland | 79 | 0.1% |
| Serbia | 72 | 0.0% |
| Singapore | 8 | 0.0% |
| South Africa | 93 | 0.1% |
| South America | 1,407 | 0.8% |
| South Central Asia | 1,457 | 0.8% |
| South Eastern Asia | 5,523 | 3.2% |
| Southern Europe | 322 | 0.2% |
| Spain | 87 | 0.1% |
| Sri Lanka | 67 | 0.0% |
| Sweden | 20 | 0.0% |
| Switzerland | 48 | 0.0% |
| Syria | 14 | 0.0% |
| Taiwan | 207 | 0.1% |
| Thailand | 250 | 0.1% |
| Trinidad and Tobago | 229 | 0.1% |
| Turkey | 236 | 0.1% |
| Ukraine | 119 | 0.1% |
| Uzbekistan | 42 | 0.0% |
| Vietnam | 1,126 | 0.6% |
| Western Africa | 25 | 0.0% |
| Western Asia | 607 | 0.4% |
| Western Europe | 828 | 0.5% | View All 103 Rows |
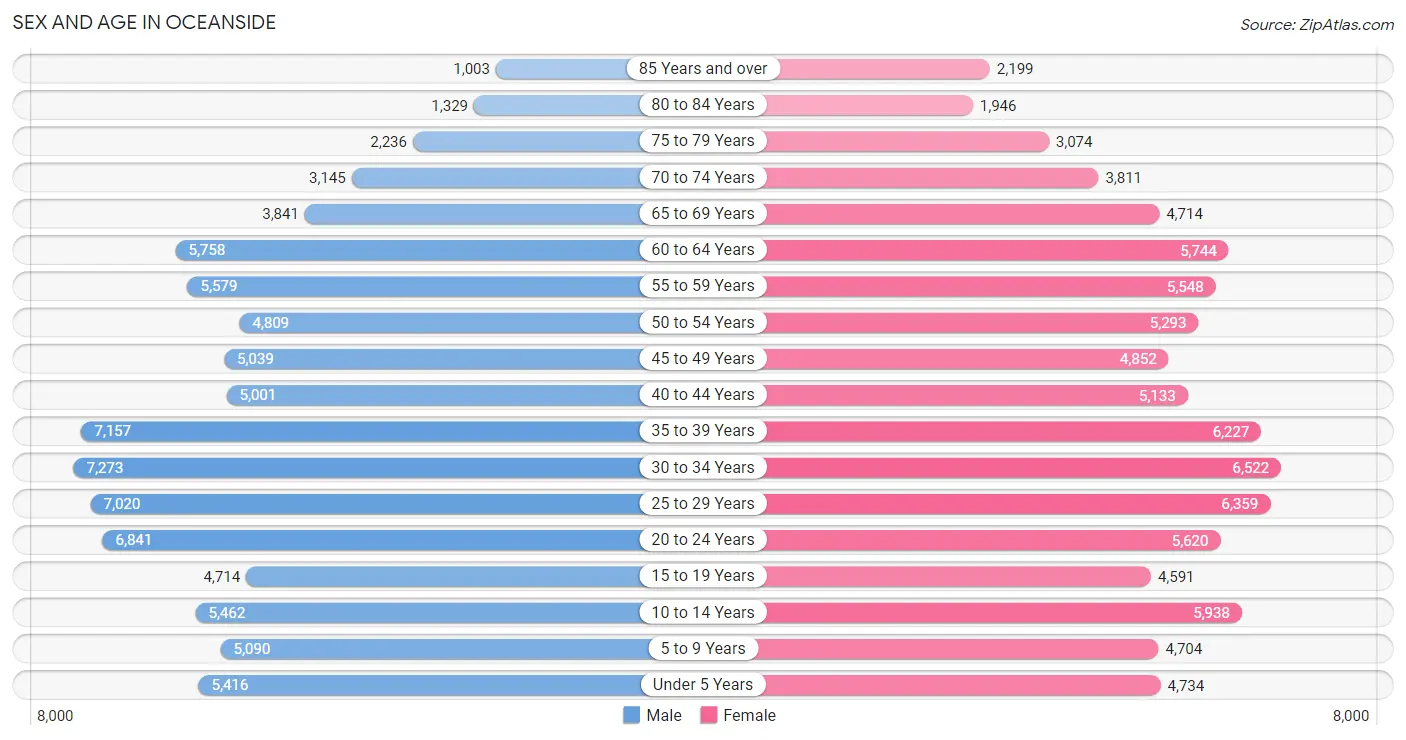
Sex and Age in Oceanside
Sex and Age in Oceanside
The most populous age groups in Oceanside are 30 to 34 Years (7,273 | 8.4%) for men and 30 to 34 Years (6,522 | 7.5%) for women.
| Age Bracket | Male | Female |
| Under 5 Years | 5,416 (6.2%) | 4,734 (5.4%) |
| 5 to 9 Years | 5,090 (5.9%) | 4,704 (5.4%) |
| 10 to 14 Years | 5,462 (6.3%) | 5,938 (6.8%) |
| 15 to 19 Years | 4,714 (5.4%) | 4,591 (5.3%) |
| 20 to 24 Years | 6,841 (7.9%) | 5,620 (6.5%) |
| 25 to 29 Years | 7,020 (8.1%) | 6,359 (7.3%) |
| 30 to 34 Years | 7,273 (8.4%) | 6,522 (7.5%) |
| 35 to 39 Years | 7,157 (8.3%) | 6,227 (7.2%) |
| 40 to 44 Years | 5,001 (5.8%) | 5,133 (5.9%) |
| 45 to 49 Years | 5,039 (5.8%) | 4,852 (5.6%) |
| 50 to 54 Years | 4,809 (5.6%) | 5,293 (6.1%) |
| 55 to 59 Years | 5,579 (6.4%) | 5,548 (6.4%) |
| 60 to 64 Years | 5,758 (6.6%) | 5,744 (6.6%) |
| 65 to 69 Years | 3,841 (4.4%) | 4,714 (5.4%) |
| 70 to 74 Years | 3,145 (3.6%) | 3,811 (4.4%) |
| 75 to 79 Years | 2,236 (2.6%) | 3,074 (3.5%) |
| 80 to 84 Years | 1,329 (1.5%) | 1,946 (2.2%) |
| 85 Years and over | 1,003 (1.2%) | 2,199 (2.5%) |
| Total | 86,713 (100.0%) | 87,009 (100.0%) |
Families and Households in Oceanside
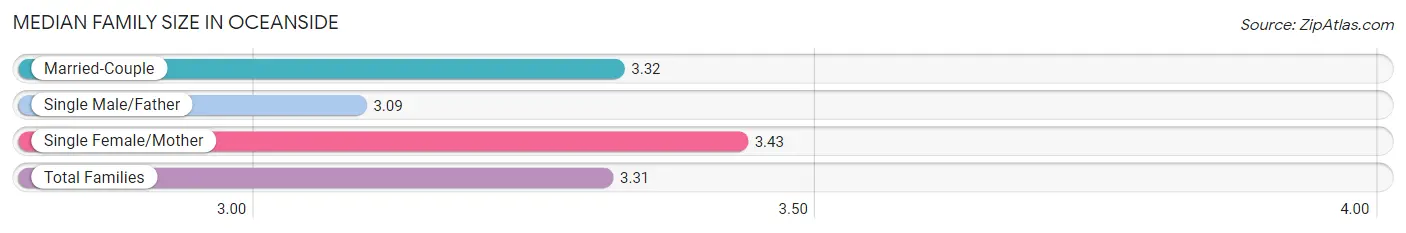
Median Family Size in Oceanside
The median family size in Oceanside is 3.31 persons per family, with single female/mother families (6,381 | 15.2%) accounting for the largest median family size of 3.43 persons per family. On the other hand, single male/father families (3,777 | 9.0%) represent the smallest median family size with 3.09 persons per family.
| Family Type | # Families | Family Size |
| Married-Couple | 31,687 (75.7%) | 3.32 |
| Single Male/Father | 3,777 (9.0%) | 3.09 |
| Single Female/Mother | 6,381 (15.2%) | 3.43 |
| Total Families | 41,845 (100.0%) | 3.31 |
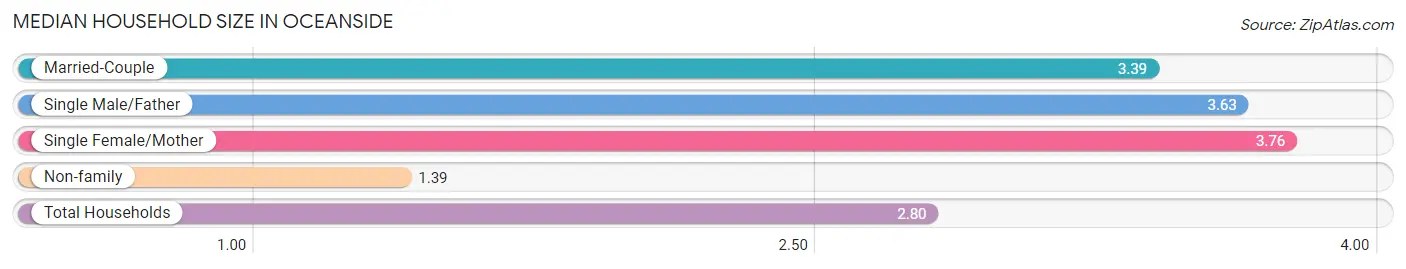
Median Household Size in Oceanside
The median household size in Oceanside is 2.80 persons per household, with single female/mother households (6,381 | 10.3%) accounting for the largest median household size of 3.76 persons per household. non-family households (19,791 | 32.1%) represent the smallest median household size with 1.39 persons per household.
| Household Type | # Households | Household Size |
| Married-Couple | 31,687 (51.4%) | 3.39 |
| Single Male/Father | 3,777 (6.1%) | 3.63 |
| Single Female/Mother | 6,381 (10.3%) | 3.76 |
| Non-family | 19,791 (32.1%) | 1.39 |
| Total Households | 61,636 (100.0%) | 2.80 |
Household Size by Marriage Status in Oceanside
Out of a total of 61,636 households in Oceanside, 41,845 (67.9%) are family households, while 19,791 (32.1%) are nonfamily households. The most numerous type of family households are 2-person households, comprising 16,619, and the most common type of nonfamily households are 1-person households, comprising 14,724.
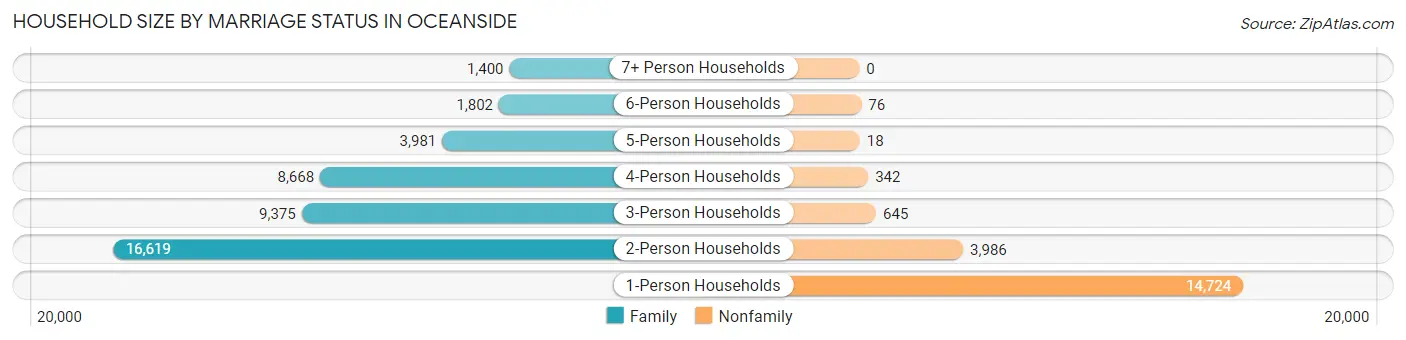
| Household Size | Family Households | Nonfamily Households |
| 1-Person Households | - | 14,724 (23.9%) |
| 2-Person Households | 16,619 (27.0%) | 3,986 (6.5%) |
| 3-Person Households | 9,375 (15.2%) | 645 (1.1%) |
| 4-Person Households | 8,668 (14.1%) | 342 (0.5%) |
| 5-Person Households | 3,981 (6.5%) | 18 (0.0%) |
| 6-Person Households | 1,802 (2.9%) | 76 (0.1%) |
| 7+ Person Households | 1,400 (2.3%) | 0 (0.0%) |
| Total | 41,845 (67.9%) | 19,791 (32.1%) |
Female Fertility in Oceanside
Fertility by Age in Oceanside
Average fertility rate in Oceanside is 51.0 births per 1,000 women. Women in the age bracket of 20 to 34 years have the highest fertility rate with 88.0 births per 1,000 women. Women in the age bracket of 20 to 34 years acount for 78.5% of all women with births.
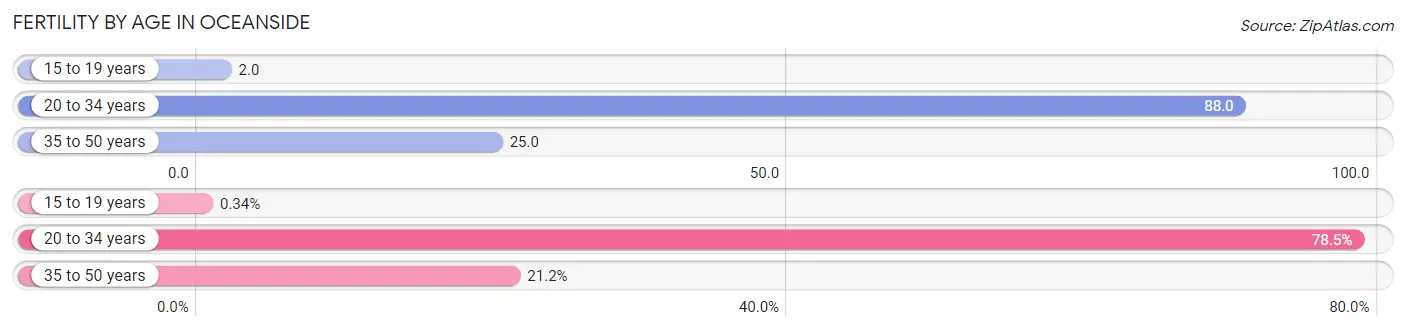
| Age Bracket | Women with Births | Births / 1,000 Women |
| 15 to 19 years | 7 (0.3%) | 2.0 |
| 20 to 34 years | 1,632 (78.5%) | 88.0 |
| 35 to 50 years | 441 (21.2%) | 25.0 |
| Total | 2,080 (100.0%) | 51.0 |
Fertility by Age by Marriage Status in Oceanside
60.2% of women with births (2,080) in Oceanside are married. The highest percentage of unmarried women with births falls into 20 to 34 years age bracket with 44.4% of them unmarried at the time of birth, while the lowest percentage of unmarried women with births belong to 15 to 19 years age bracket with 0.0% of them unmarried.
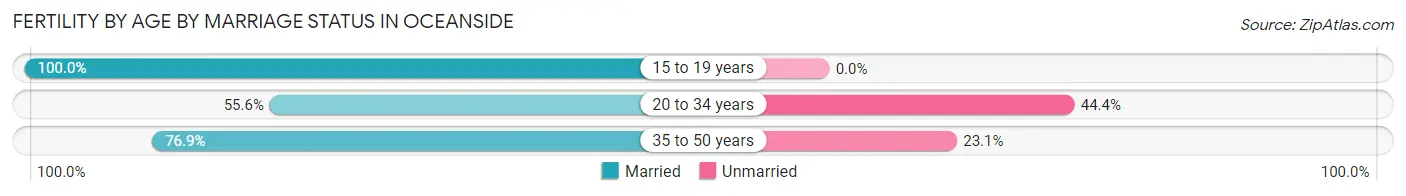
| Age Bracket | Married | Unmarried |
| 15 to 19 years | 7 (100.0%) | 0 (0.0%) |
| 20 to 34 years | 907 (55.6%) | 725 (44.4%) |
| 35 to 50 years | 339 (76.9%) | 102 (23.1%) |
| Total | 1,252 (60.2%) | 828 (39.8%) |
Fertility by Education in Oceanside
Average fertility rate in Oceanside is 51.0 births per 1,000 women. Women with the education attainment of bachelor's degree have the highest fertility rate of 74.0 births per 1,000 women, while women with the education attainment of less than high school have the lowest fertility at 29.0 births per 1,000 women. Women with the education attainment of bachelor's degree represent 33.3% of all women with births.
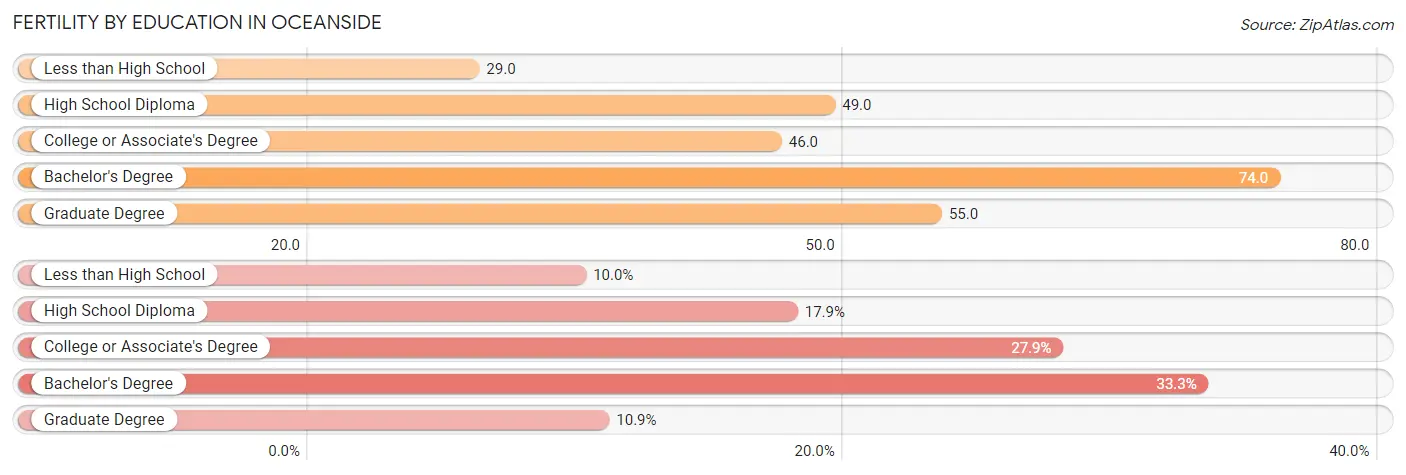
| Educational Attainment | Women with Births | Births / 1,000 Women |
| Less than High School | 208 (10.0%) | 29.0 |
| High School Diploma | 373 (17.9%) | 49.0 |
| College or Associate's Degree | 580 (27.9%) | 46.0 |
| Bachelor's Degree | 693 (33.3%) | 74.0 |
| Graduate Degree | 226 (10.9%) | 55.0 |
| Total | 2,080 (100.0%) | 51.0 |
Fertility by Education by Marriage Status in Oceanside
39.8% of women with births in Oceanside are unmarried. Women with the educational attainment of graduate degree are most likely to be married with 89.4% of them married at childbirth, while women with the educational attainment of college or associate's degree are least likely to be married with 53.8% of them unmarried at childbirth.
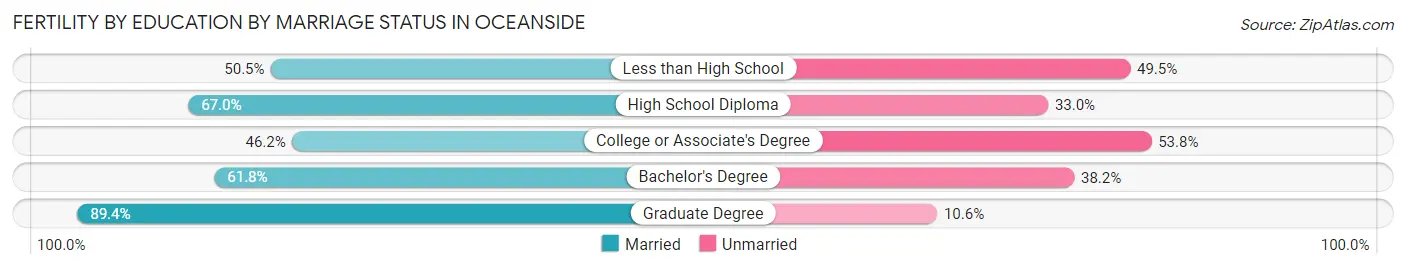
| Educational Attainment | Married | Unmarried |
| Less than High School | 105 (50.5%) | 103 (49.5%) |
| High School Diploma | 250 (67.0%) | 123 (33.0%) |
| College or Associate's Degree | 268 (46.2%) | 312 (53.8%) |
| Bachelor's Degree | 428 (61.8%) | 265 (38.2%) |
| Graduate Degree | 202 (89.4%) | 24 (10.6%) |
| Total | 1,252 (60.2%) | 828 (39.8%) |
Employment Characteristics in Oceanside
Employment by Class of Employer in Oceanside
Among the 86,430 employed individuals in Oceanside, private company employees (57,084 | 66.0%), self-employed (not incorporated) (6,546 | 7.6%), and federal government employees (6,524 | 7.5%) make up the most common classes of employment.
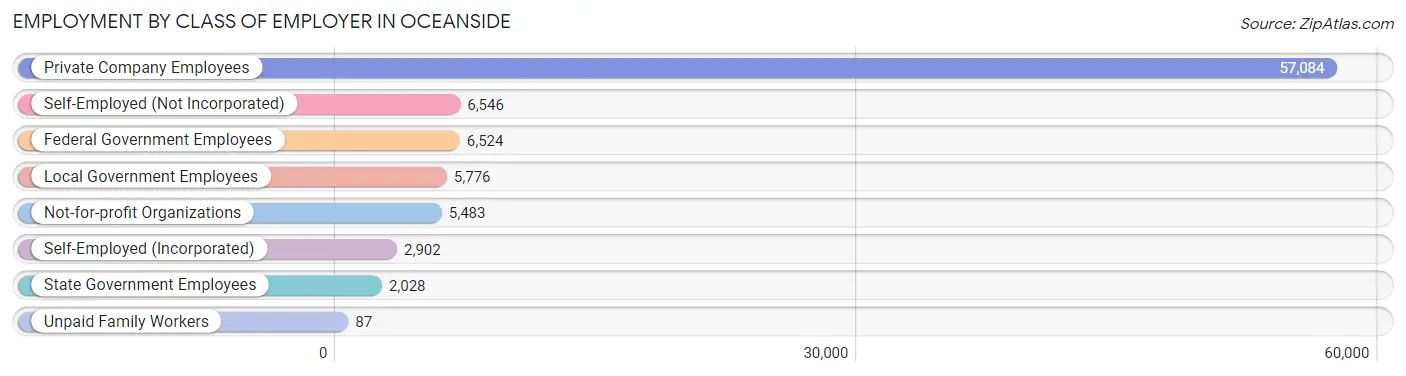
| Employer Class | # Employees | % Employees |
| Private Company Employees | 57,084 | 66.0% |
| Self-Employed (Incorporated) | 2,902 | 3.4% |
| Self-Employed (Not Incorporated) | 6,546 | 7.6% |
| Not-for-profit Organizations | 5,483 | 6.3% |
| Local Government Employees | 5,776 | 6.7% |
| State Government Employees | 2,028 | 2.4% |
| Federal Government Employees | 6,524 | 7.5% |
| Unpaid Family Workers | 87 | 0.1% |
| Total | 86,430 | 100.0% |
Employment Status by Age in Oceanside
According to the labor force statistics for Oceanside, out of the total population over 16 years of age (140,767), 67.1% or 94,455 individuals are in the labor force, with 5.9% or 5,573 of them unemployed. The age group with the highest labor force participation rate is 45 to 54 years, with 85.9% or 17,174 individuals in the labor force. Within the labor force, the 16 to 19 years age range has the highest percentage of unemployed individuals, with 13.5% or 480 of them being unemployed.
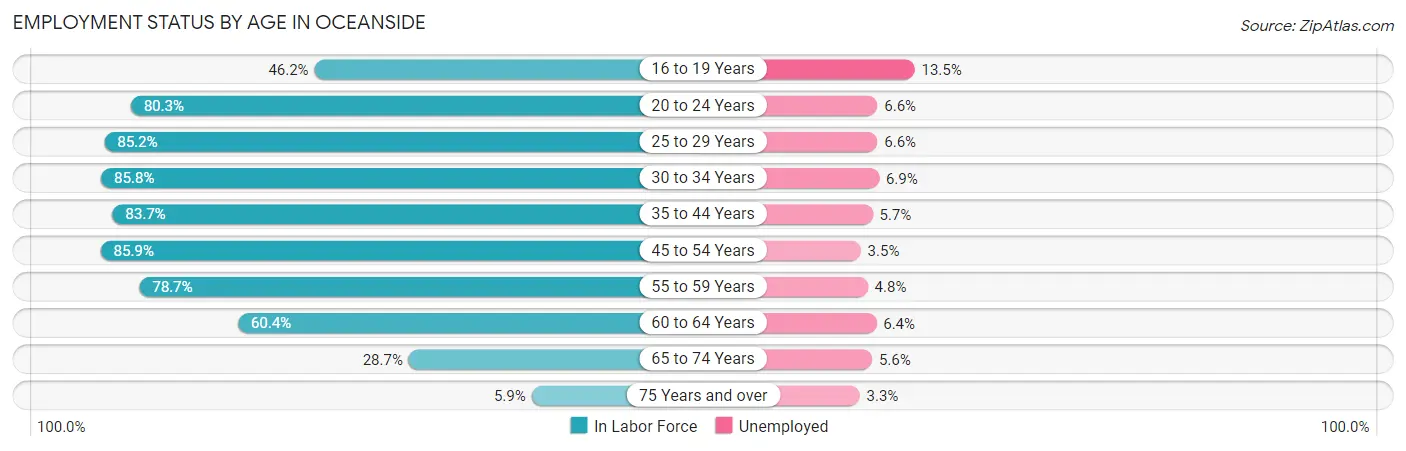
| Age Bracket | In Labor Force | Unemployed |
| 16 to 19 Years | 3,555 (46.2%) | 480 (13.5%) |
| 20 to 24 Years | 10,006 (80.3%) | 660 (6.6%) |
| 25 to 29 Years | 11,399 (85.2%) | 752 (6.6%) |
| 30 to 34 Years | 11,836 (85.8%) | 817 (6.9%) |
| 35 to 44 Years | 19,685 (83.7%) | 1,122 (5.7%) |
| 45 to 54 Years | 17,174 (85.9%) | 601 (3.5%) |
| 55 to 59 Years | 8,757 (78.7%) | 420 (4.8%) |
| 60 to 64 Years | 6,947 (60.4%) | 445 (6.4%) |
| 65 to 74 Years | 4,452 (28.7%) | 249 (5.6%) |
| 75 Years and over | 695 (5.9%) | 23 (3.3%) |
| Total | 94,455 (67.1%) | 5,573 (5.9%) |
Employment Status by Educational Attainment in Oceanside
According to labor force statistics for Oceanside, 81.2% of individuals (75,771) out of the total population between 25 and 64 years of age (93,314) are in the labor force, with 5.4% or 4,092 of them being unemployed. The group with the highest labor force participation rate are those with the educational attainment of bachelor's degree or higher, with 85.4% or 26,587 individuals in the labor force. Within the labor force, individuals with high school diploma education have the highest percentage of unemployment, with 7.5% or 1,083 of them being unemployed.
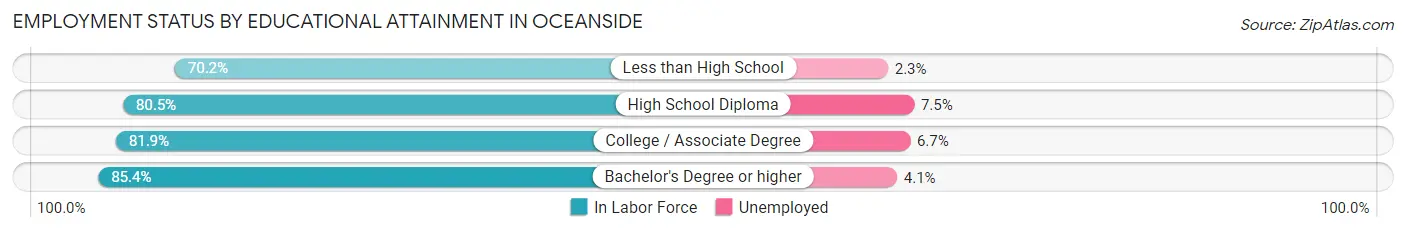
| Educational Attainment | In Labor Force | Unemployed |
| Less than High School | 8,721 (70.2%) | 286 (2.3%) |
| High School Diploma | 14,440 (80.5%) | 1,345 (7.5%) |
| College / Associate Degree | 26,061 (81.9%) | 2,132 (6.7%) |
| Bachelor's Degree or higher | 26,587 (85.4%) | 1,276 (4.1%) |
| Total | 75,771 (81.2%) | 5,039 (5.4%) |
Employment Occupations by Sex in Oceanside
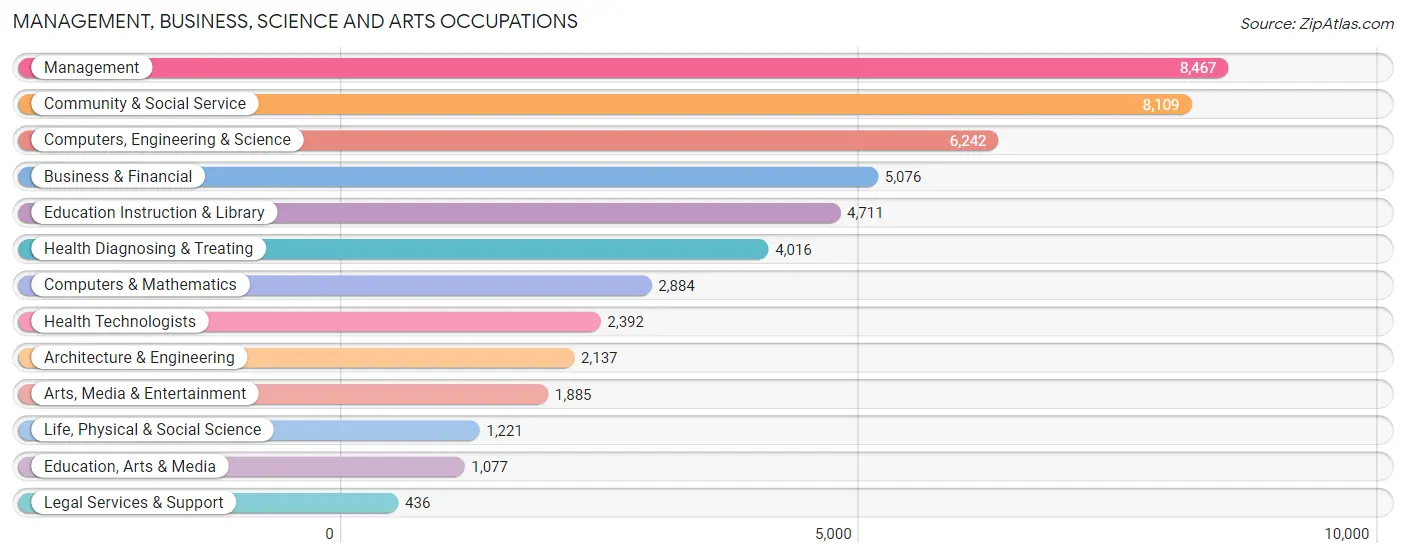
Management, Business, Science and Arts Occupations
The most common Management, Business, Science and Arts occupations in Oceanside are Management (8,467 | 9.9%), Community & Social Service (8,109 | 9.5%), Computers, Engineering & Science (6,242 | 7.3%), Business & Financial (5,076 | 5.9%), and Education Instruction & Library (4,711 | 5.5%).
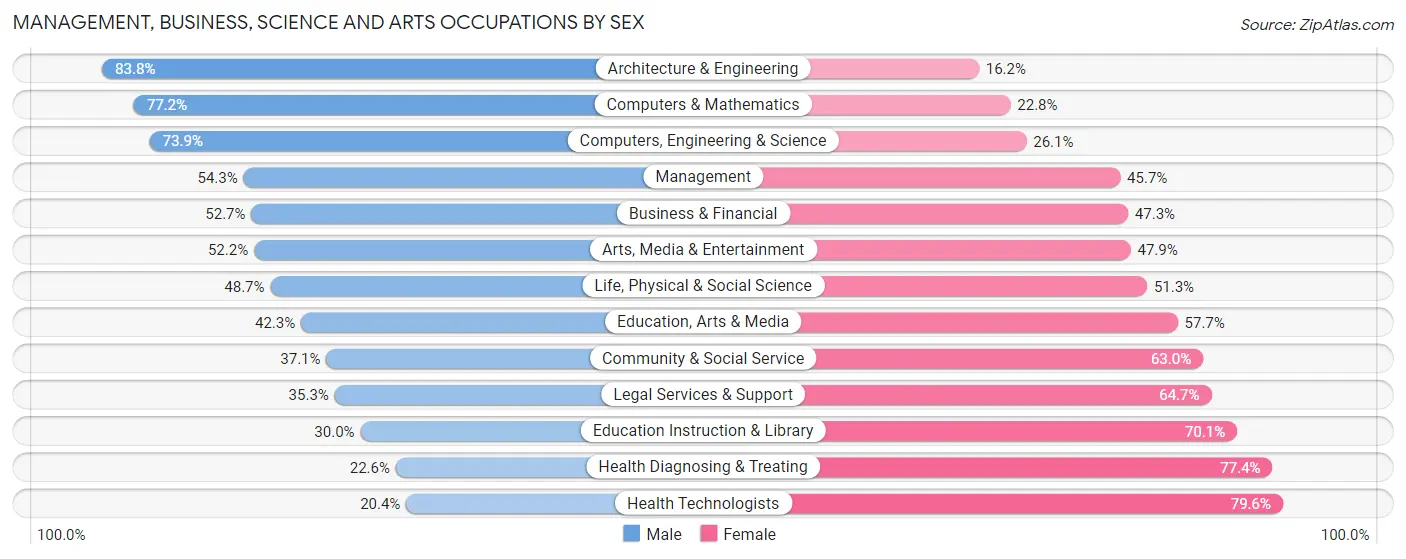
Management, Business, Science and Arts Occupations by Sex
Within the Management, Business, Science and Arts occupations in Oceanside, the most male-oriented occupations are Architecture & Engineering (83.8%), Computers & Mathematics (77.2%), and Computers, Engineering & Science (73.9%), while the most female-oriented occupations are Health Technologists (79.6%), Health Diagnosing & Treating (77.4%), and Education Instruction & Library (70.1%).
| Occupation | Male | Female |
| Management | 4,599 (54.3%) | 3,868 (45.7%) |
| Business & Financial | 2,675 (52.7%) | 2,401 (47.3%) |
| Computers, Engineering & Science | 4,613 (73.9%) | 1,629 (26.1%) |
| Computers & Mathematics | 2,227 (77.2%) | 657 (22.8%) |
| Architecture & Engineering | 1,791 (83.8%) | 346 (16.2%) |
| Life, Physical & Social Science | 595 (48.7%) | 626 (51.3%) |
| Community & Social Service | 3,004 (37.0%) | 5,105 (62.9%) |
| Education, Arts & Media | 456 (42.3%) | 621 (57.7%) |
| Legal Services & Support | 154 (35.3%) | 282 (64.7%) |
| Education Instruction & Library | 1,411 (29.9%) | 3,300 (70.1%) |
| Arts, Media & Entertainment | 983 (52.1%) | 902 (47.8%) |
| Health Diagnosing & Treating | 906 (22.6%) | 3,110 (77.4%) |
| Health Technologists | 488 (20.4%) | 1,904 (79.6%) |
| Total (Category) | 15,797 (49.5%) | 16,113 (50.5%) |
| Total (Overall) | 46,201 (54.1%) | 39,184 (45.9%) |
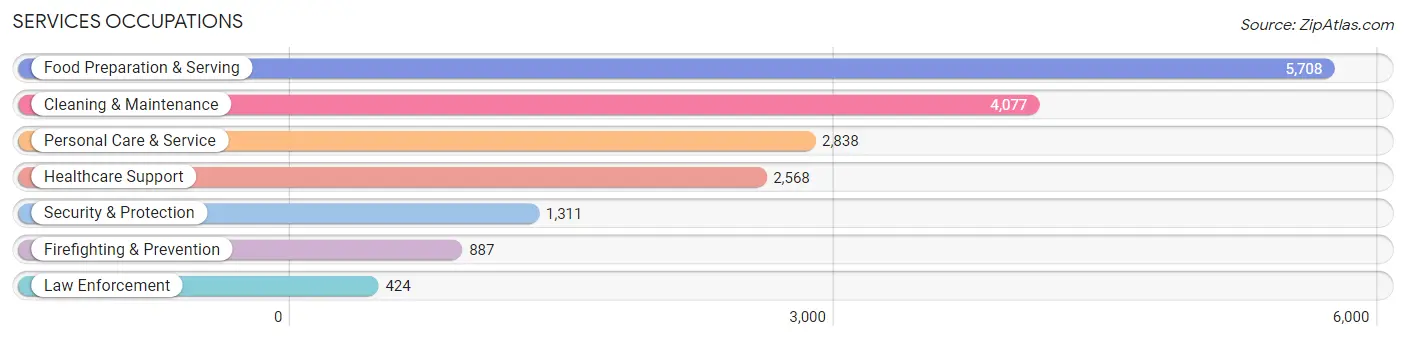
Services Occupations
The most common Services occupations in Oceanside are Food Preparation & Serving (5,708 | 6.7%), Cleaning & Maintenance (4,077 | 4.8%), Personal Care & Service (2,838 | 3.3%), Healthcare Support (2,568 | 3.0%), and Security & Protection (1,311 | 1.5%).
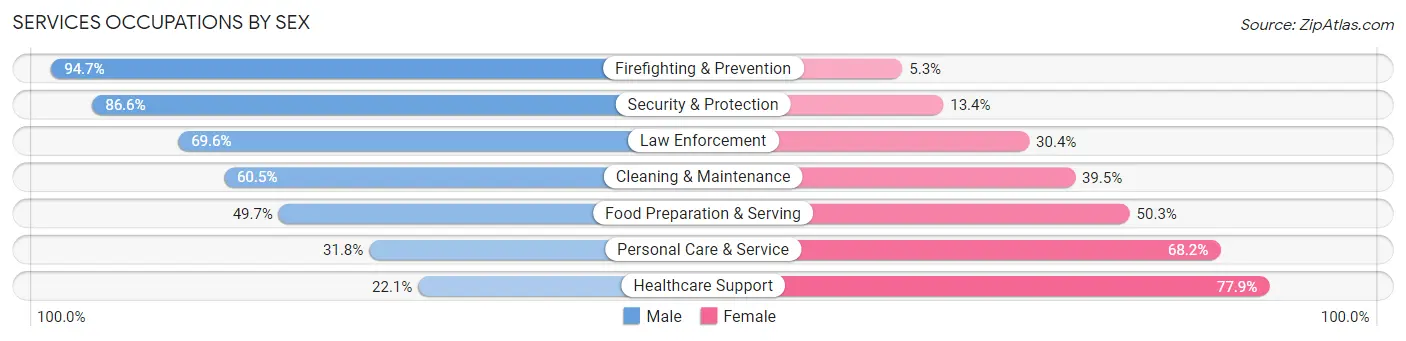
Services Occupations by Sex
Within the Services occupations in Oceanside, the most male-oriented occupations are Firefighting & Prevention (94.7%), Security & Protection (86.6%), and Law Enforcement (69.6%), while the most female-oriented occupations are Healthcare Support (77.9%), Personal Care & Service (68.2%), and Food Preparation & Serving (50.3%).
| Occupation | Male | Female |
| Healthcare Support | 567 (22.1%) | 2,001 (77.9%) |
| Security & Protection | 1,135 (86.6%) | 176 (13.4%) |
| Firefighting & Prevention | 840 (94.7%) | 47 (5.3%) |
| Law Enforcement | 295 (69.6%) | 129 (30.4%) |
| Food Preparation & Serving | 2,836 (49.7%) | 2,872 (50.3%) |
| Cleaning & Maintenance | 2,467 (60.5%) | 1,610 (39.5%) |
| Personal Care & Service | 902 (31.8%) | 1,936 (68.2%) |
| Total (Category) | 7,907 (47.9%) | 8,595 (52.1%) |
| Total (Overall) | 46,201 (54.1%) | 39,184 (45.9%) |
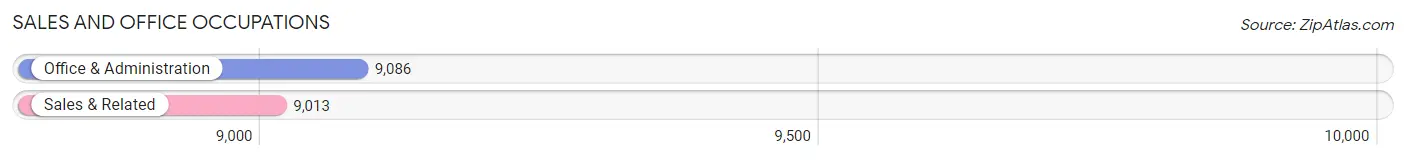
Sales and Office Occupations
The most common Sales and Office occupations in Oceanside are Office & Administration (9,086 | 10.6%), and Sales & Related (9,013 | 10.6%).
Sales and Office Occupations by Sex
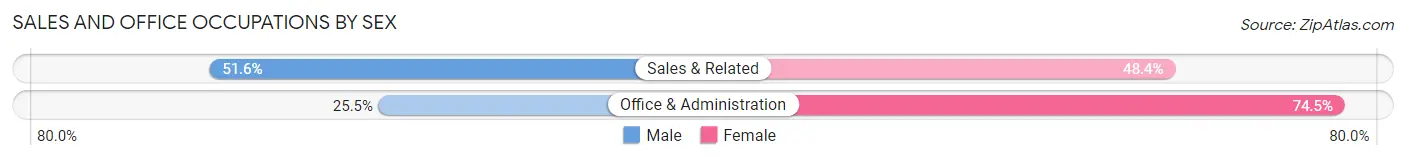
| Occupation | Male | Female |
| Sales & Related | 4,649 (51.6%) | 4,364 (48.4%) |
| Office & Administration | 2,317 (25.5%) | 6,769 (74.5%) |
| Total (Category) | 6,966 (38.5%) | 11,133 (61.5%) |
| Total (Overall) | 46,201 (54.1%) | 39,184 (45.9%) |
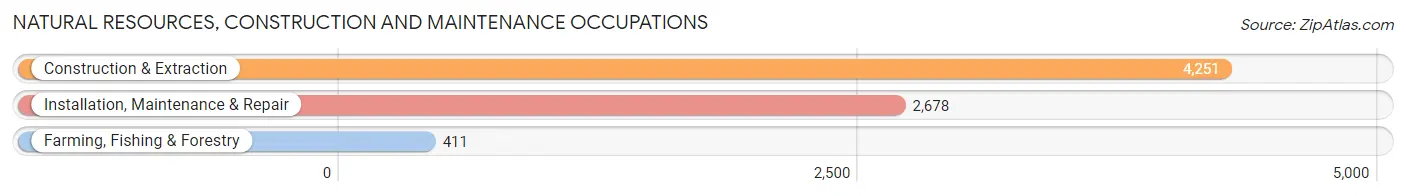
Natural Resources, Construction and Maintenance Occupations
The most common Natural Resources, Construction and Maintenance occupations in Oceanside are Construction & Extraction (4,251 | 5.0%), Installation, Maintenance & Repair (2,678 | 3.1%), and Farming, Fishing & Forestry (411 | 0.5%).
Natural Resources, Construction and Maintenance Occupations by Sex
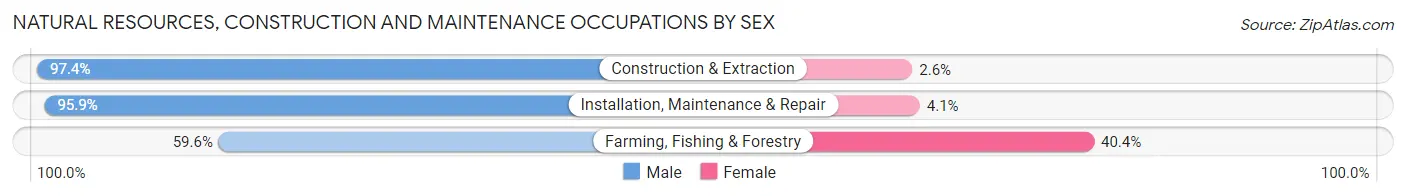
| Occupation | Male | Female |
| Farming, Fishing & Forestry | 245 (59.6%) | 166 (40.4%) |
| Construction & Extraction | 4,141 (97.4%) | 110 (2.6%) |
| Installation, Maintenance & Repair | 2,567 (95.9%) | 111 (4.1%) |
| Total (Category) | 6,953 (94.7%) | 387 (5.3%) |
| Total (Overall) | 46,201 (54.1%) | 39,184 (45.9%) |
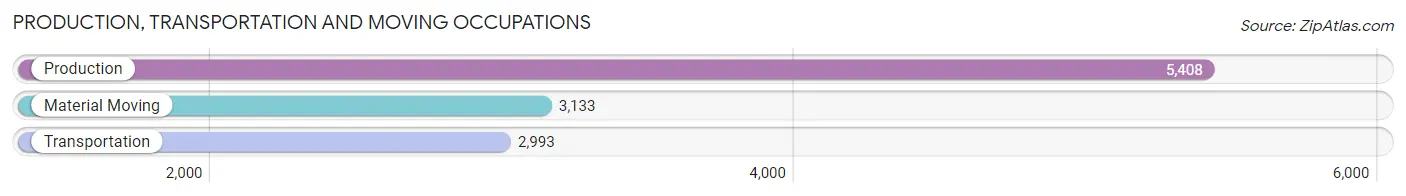
Production, Transportation and Moving Occupations
The most common Production, Transportation and Moving occupations in Oceanside are Production (5,408 | 6.3%), Material Moving (3,133 | 3.7%), and Transportation (2,993 | 3.5%).
Production, Transportation and Moving Occupations by Sex
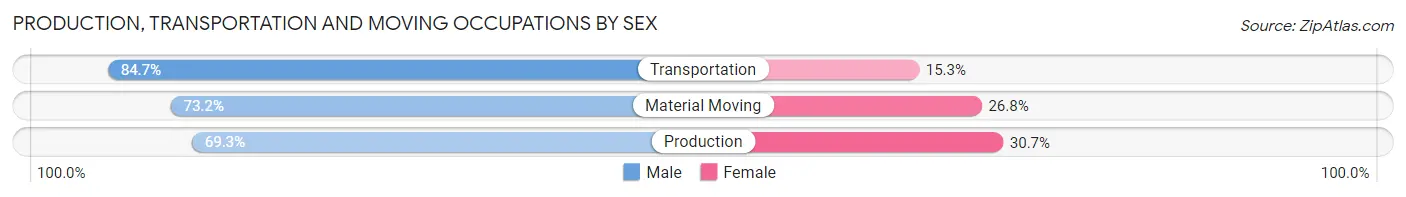
| Occupation | Male | Female |
| Production | 3,748 (69.3%) | 1,660 (30.7%) |
| Transportation | 2,536 (84.7%) | 457 (15.3%) |
| Material Moving | 2,294 (73.2%) | 839 (26.8%) |
| Total (Category) | 8,578 (74.4%) | 2,956 (25.6%) |
| Total (Overall) | 46,201 (54.1%) | 39,184 (45.9%) |
Employment Industries by Sex in Oceanside
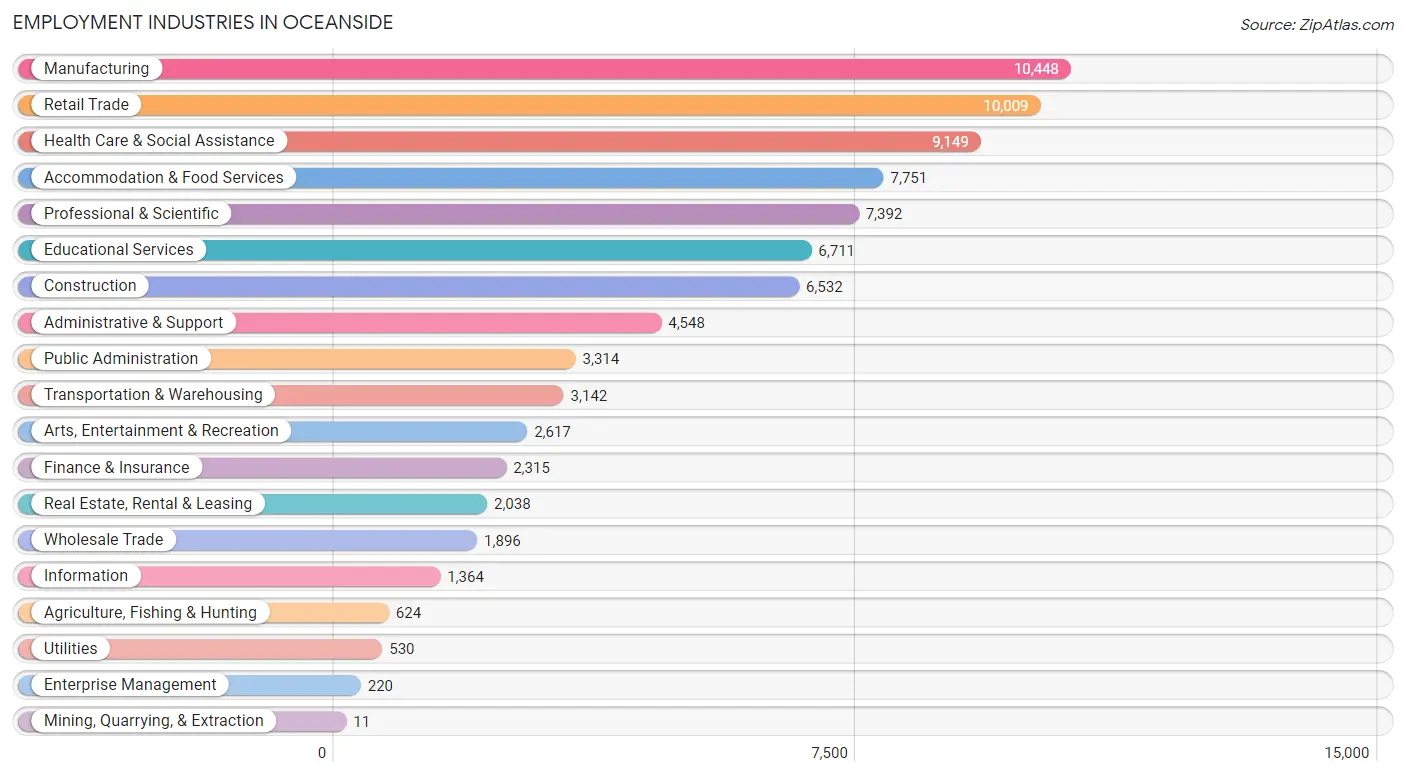
Employment Industries in Oceanside
The major employment industries in Oceanside include Manufacturing (10,448 | 12.2%), Retail Trade (10,009 | 11.7%), Health Care & Social Assistance (9,149 | 10.7%), Accommodation & Food Services (7,751 | 9.1%), and Professional & Scientific (7,392 | 8.7%).
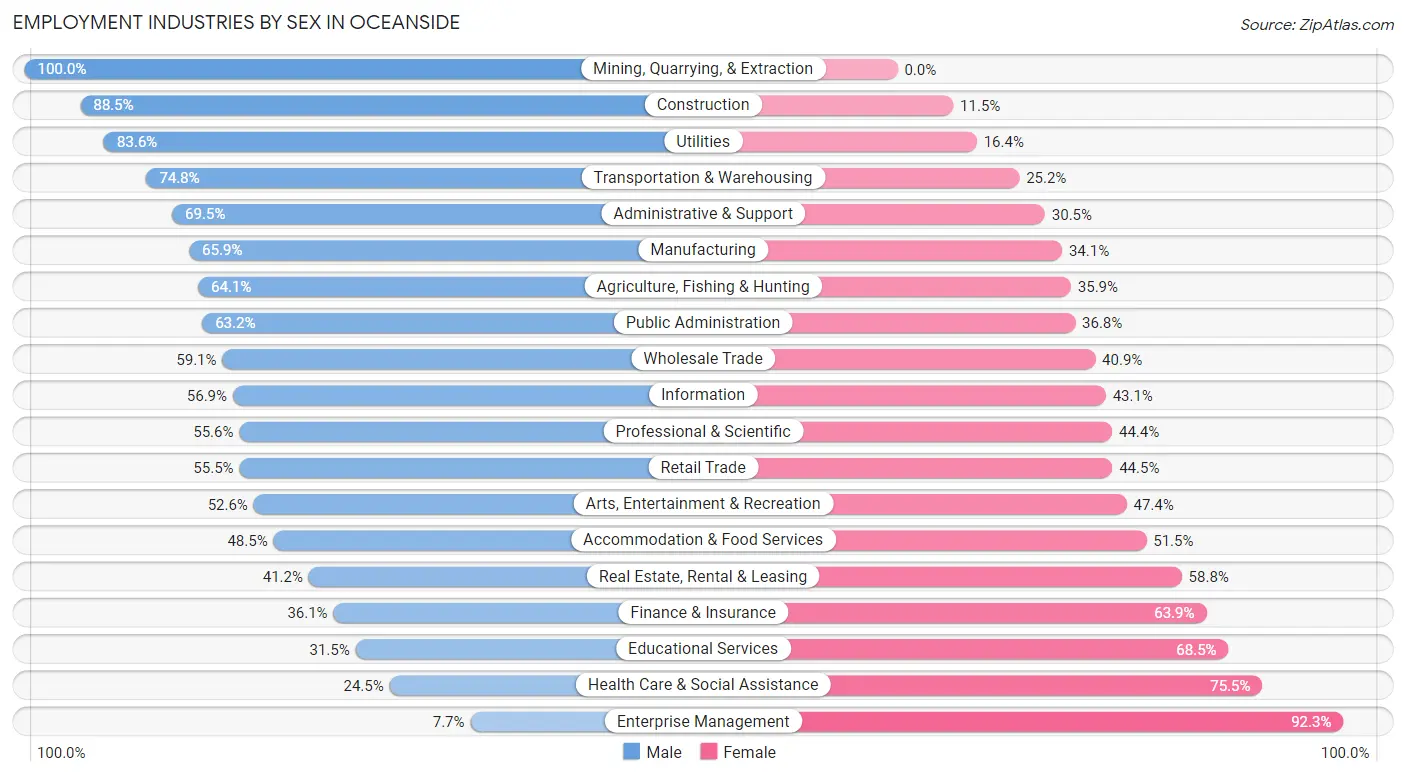
Employment Industries by Sex in Oceanside
The Oceanside industries that see more men than women are Mining, Quarrying, & Extraction (100.0%), Construction (88.5%), and Utilities (83.6%), whereas the industries that tend to have a higher number of women are Enterprise Management (92.3%), Health Care & Social Assistance (75.5%), and Educational Services (68.5%).
| Industry | Male | Female |
| Agriculture, Fishing & Hunting | 400 (64.1%) | 224 (35.9%) |
| Mining, Quarrying, & Extraction | 11 (100.0%) | 0 (0.0%) |
| Construction | 5,778 (88.5%) | 754 (11.5%) |
| Manufacturing | 6,889 (65.9%) | 3,559 (34.1%) |
| Wholesale Trade | 1,120 (59.1%) | 776 (40.9%) |
| Retail Trade | 5,559 (55.5%) | 4,450 (44.5%) |
| Transportation & Warehousing | 2,350 (74.8%) | 792 (25.2%) |
| Utilities | 443 (83.6%) | 87 (16.4%) |
| Information | 776 (56.9%) | 588 (43.1%) |
| Finance & Insurance | 835 (36.1%) | 1,480 (63.9%) |
| Real Estate, Rental & Leasing | 839 (41.2%) | 1,199 (58.8%) |
| Professional & Scientific | 4,108 (55.6%) | 3,284 (44.4%) |
| Enterprise Management | 17 (7.7%) | 203 (92.3%) |
| Administrative & Support | 3,160 (69.5%) | 1,388 (30.5%) |
| Educational Services | 2,114 (31.5%) | 4,597 (68.5%) |
| Health Care & Social Assistance | 2,239 (24.5%) | 6,910 (75.5%) |
| Arts, Entertainment & Recreation | 1,376 (52.6%) | 1,241 (47.4%) |
| Accommodation & Food Services | 3,758 (48.5%) | 3,993 (51.5%) |
| Public Administration | 2,095 (63.2%) | 1,219 (36.8%) |
| Total | 46,201 (54.1%) | 39,184 (45.9%) |
Education in Oceanside
School Enrollment in Oceanside
The most common levels of schooling among the 41,835 students in Oceanside are college / undergraduate (11,339 | 27.1%), middle school (9,057 | 21.6%), and high school (7,762 | 18.5%).
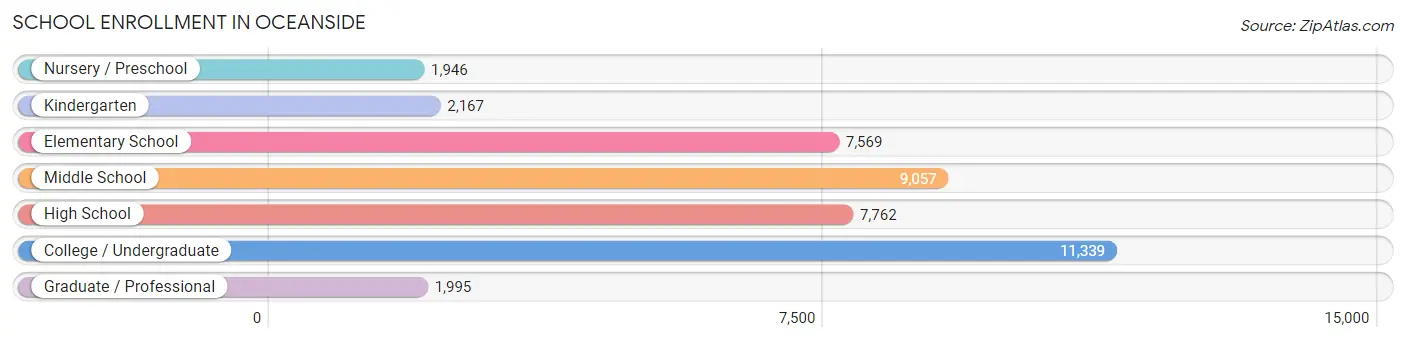
| School Level | # Students | % Students |
| Nursery / Preschool | 1,946 | 4.6% |
| Kindergarten | 2,167 | 5.2% |
| Elementary School | 7,569 | 18.1% |
| Middle School | 9,057 | 21.6% |
| High School | 7,762 | 18.5% |
| College / Undergraduate | 11,339 | 27.1% |
| Graduate / Professional | 1,995 | 4.8% |
| Total | 41,835 | 100.0% |
School Enrollment by Age by Funding Source in Oceanside
Out of a total of 41,835 students who are enrolled in schools in Oceanside, 5,899 (14.1%) attend a private institution, while the remaining 35,936 (85.9%) are enrolled in public schools. The age group of 3 to 4 year olds has the highest likelihood of being enrolled in private schools, with 670 (44.1% in the age bracket) enrolled. Conversely, the age group of 15 to 17 year olds has the lowest likelihood of being enrolled in a private school, with 5,157 (94.0% in the age bracket) attending a public institution.
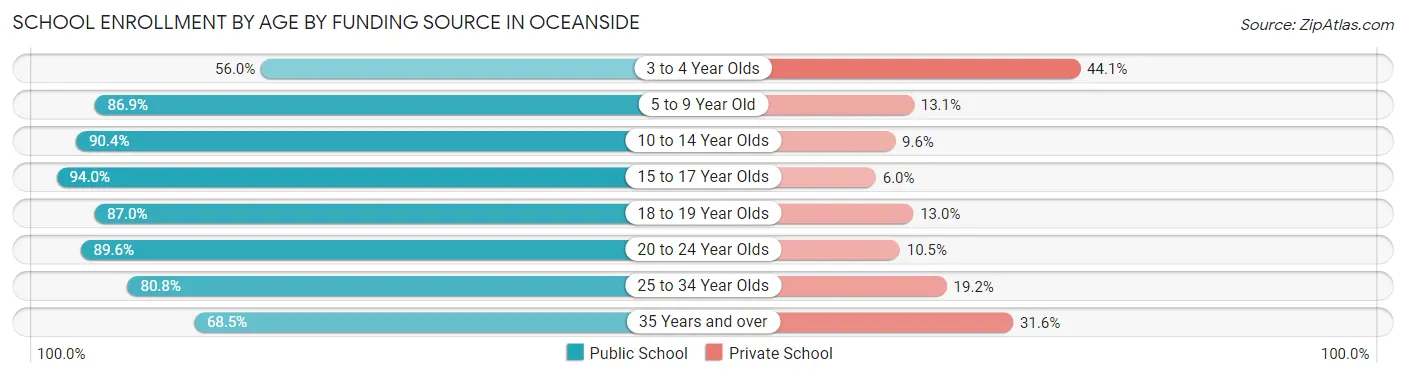
| Age Bracket | Public School | Private School |
| 3 to 4 Year Olds | 851 (55.9%) | 670 (44.1%) |
| 5 to 9 Year Old | 8,087 (86.9%) | 1,215 (13.1%) |
| 10 to 14 Year Olds | 10,096 (90.4%) | 1,070 (9.6%) |
| 15 to 17 Year Olds | 5,157 (94.0%) | 328 (6.0%) |
| 18 to 19 Year Olds | 2,196 (87.0%) | 327 (13.0%) |
| 20 to 24 Year Olds | 4,181 (89.5%) | 488 (10.4%) |
| 25 to 34 Year Olds | 2,920 (80.8%) | 693 (19.2%) |
| 35 Years and over | 2,434 (68.4%) | 1,122 (31.6%) |
| Total | 35,936 (85.9%) | 5,899 (14.1%) |
Educational Attainment by Field of Study in Oceanside
Business (8,064 | 18.6%), social sciences (4,032 | 9.3%), science & technology (3,762 | 8.7%), engineering (3,458 | 8.0%), and education (3,206 | 7.4%) are the most common fields of study among 43,240 individuals in Oceanside who have obtained a bachelor's degree or higher.
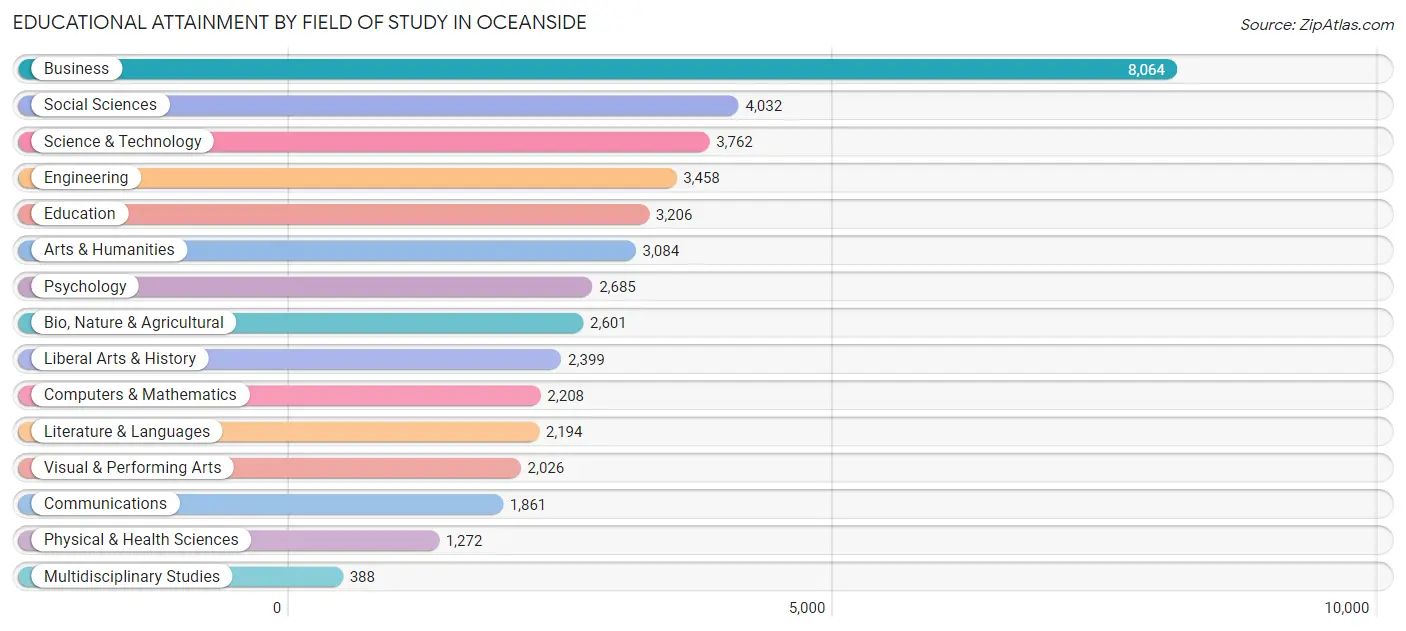
| Field of Study | # Graduates | % Graduates |
| Computers & Mathematics | 2,208 | 5.1% |
| Bio, Nature & Agricultural | 2,601 | 6.0% |
| Physical & Health Sciences | 1,272 | 2.9% |
| Psychology | 2,685 | 6.2% |
| Social Sciences | 4,032 | 9.3% |
| Engineering | 3,458 | 8.0% |
| Multidisciplinary Studies | 388 | 0.9% |
| Science & Technology | 3,762 | 8.7% |
| Business | 8,064 | 18.6% |
| Education | 3,206 | 7.4% |
| Literature & Languages | 2,194 | 5.1% |
| Liberal Arts & History | 2,399 | 5.6% |
| Visual & Performing Arts | 2,026 | 4.7% |
| Communications | 1,861 | 4.3% |
| Arts & Humanities | 3,084 | 7.1% |
| Total | 43,240 | 100.0% |
Transportation & Commute in Oceanside
Vehicle Availability by Sex in Oceanside
The most prevalent vehicle ownership categories in Oceanside are males with 2 vehicles (19,287, accounting for 40.1%) and females with 2 vehicles (14,634, making up 50.6%).
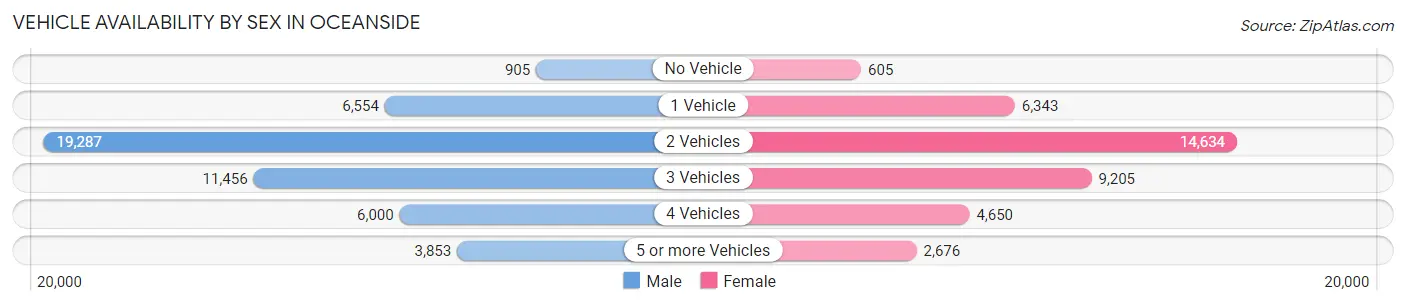
| Vehicles Available | Male | Female |
| No Vehicle | 905 (1.9%) | 605 (1.6%) |
| 1 Vehicle | 6,554 (13.6%) | 6,343 (16.6%) |
| 2 Vehicles | 19,287 (40.1%) | 14,634 (38.4%) |
| 3 Vehicles | 11,456 (23.8%) | 9,205 (24.1%) |
| 4 Vehicles | 6,000 (12.5%) | 4,650 (12.2%) |
| 5 or more Vehicles | 3,853 (8.0%) | 2,676 (7.0%) |
| Total | 48,055 (100.0%) | 38,113 (100.0%) |
Commute Time in Oceanside
The most frequently occuring commute durations in Oceanside are 30 to 34 minutes (13,235 commuters, 17.7%), 20 to 24 minutes (12,188 commuters, 16.3%), and 15 to 19 minutes (11,994 commuters, 16.0%).
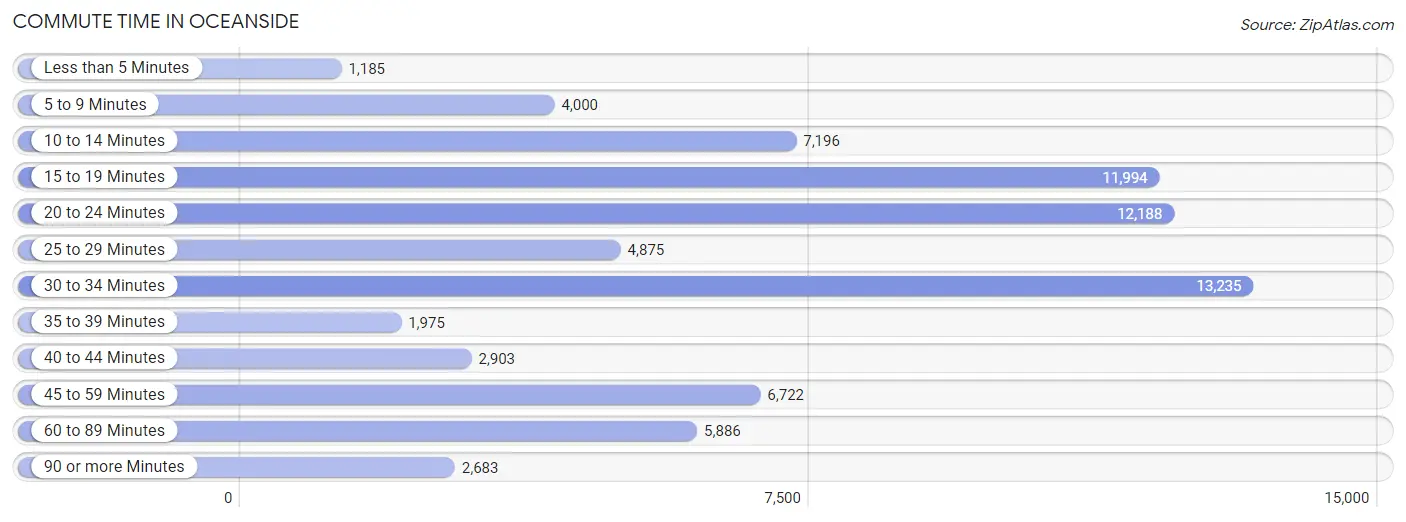
| Commute Time | # Commuters | % Commuters |
| Less than 5 Minutes | 1,185 | 1.6% |
| 5 to 9 Minutes | 4,000 | 5.3% |
| 10 to 14 Minutes | 7,196 | 9.6% |
| 15 to 19 Minutes | 11,994 | 16.0% |
| 20 to 24 Minutes | 12,188 | 16.3% |
| 25 to 29 Minutes | 4,875 | 6.5% |
| 30 to 34 Minutes | 13,235 | 17.7% |
| 35 to 39 Minutes | 1,975 | 2.6% |
| 40 to 44 Minutes | 2,903 | 3.9% |
| 45 to 59 Minutes | 6,722 | 9.0% |
| 60 to 89 Minutes | 5,886 | 7.9% |
| 90 or more Minutes | 2,683 | 3.6% |
Commute Time by Sex in Oceanside
The most common commute times in Oceanside are 30 to 34 minutes (7,743 commuters, 18.3%) for males and 20 to 24 minutes (5,850 commuters, 18.0%) for females.
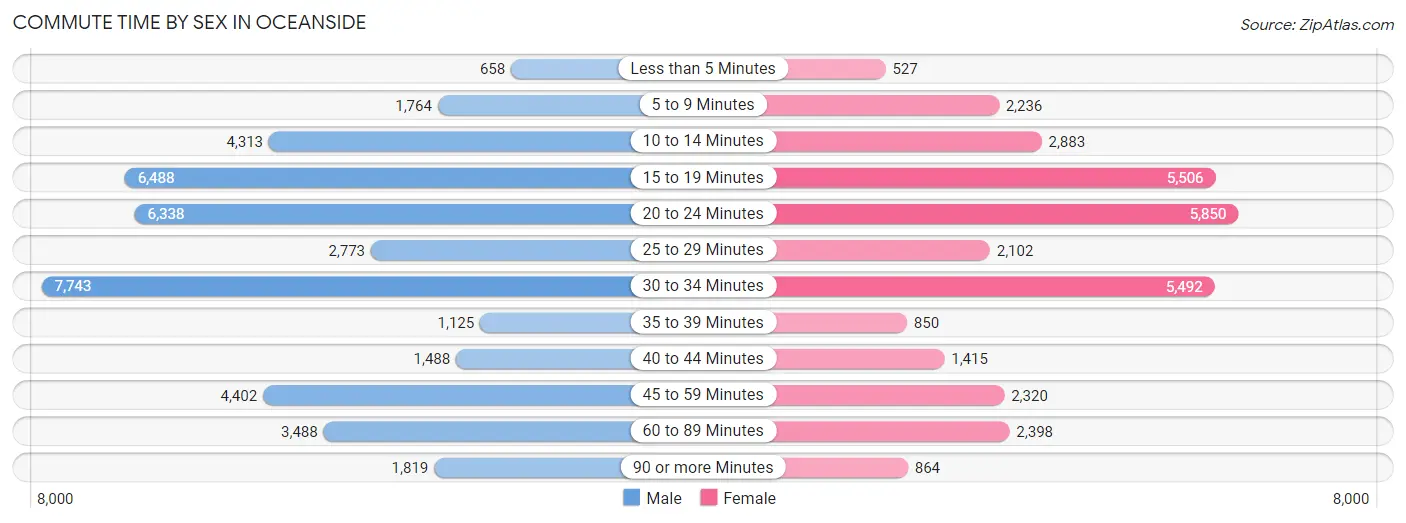
| Commute Time | Male | Female |
| Less than 5 Minutes | 658 (1.5%) | 527 (1.6%) |
| 5 to 9 Minutes | 1,764 (4.2%) | 2,236 (6.9%) |
| 10 to 14 Minutes | 4,313 (10.2%) | 2,883 (8.9%) |
| 15 to 19 Minutes | 6,488 (15.3%) | 5,506 (17.0%) |
| 20 to 24 Minutes | 6,338 (14.9%) | 5,850 (18.0%) |
| 25 to 29 Minutes | 2,773 (6.5%) | 2,102 (6.5%) |
| 30 to 34 Minutes | 7,743 (18.3%) | 5,492 (16.9%) |
| 35 to 39 Minutes | 1,125 (2.6%) | 850 (2.6%) |
| 40 to 44 Minutes | 1,488 (3.5%) | 1,415 (4.4%) |
| 45 to 59 Minutes | 4,402 (10.4%) | 2,320 (7.1%) |
| 60 to 89 Minutes | 3,488 (8.2%) | 2,398 (7.4%) |
| 90 or more Minutes | 1,819 (4.3%) | 864 (2.7%) |
Time of Departure to Work by Sex in Oceanside
The most frequent times of departure to work in Oceanside are 7:00 AM to 7:29 AM (5,724, 13.5%) for males and 7:00 AM to 7:29 AM (4,333, 13.4%) for females.
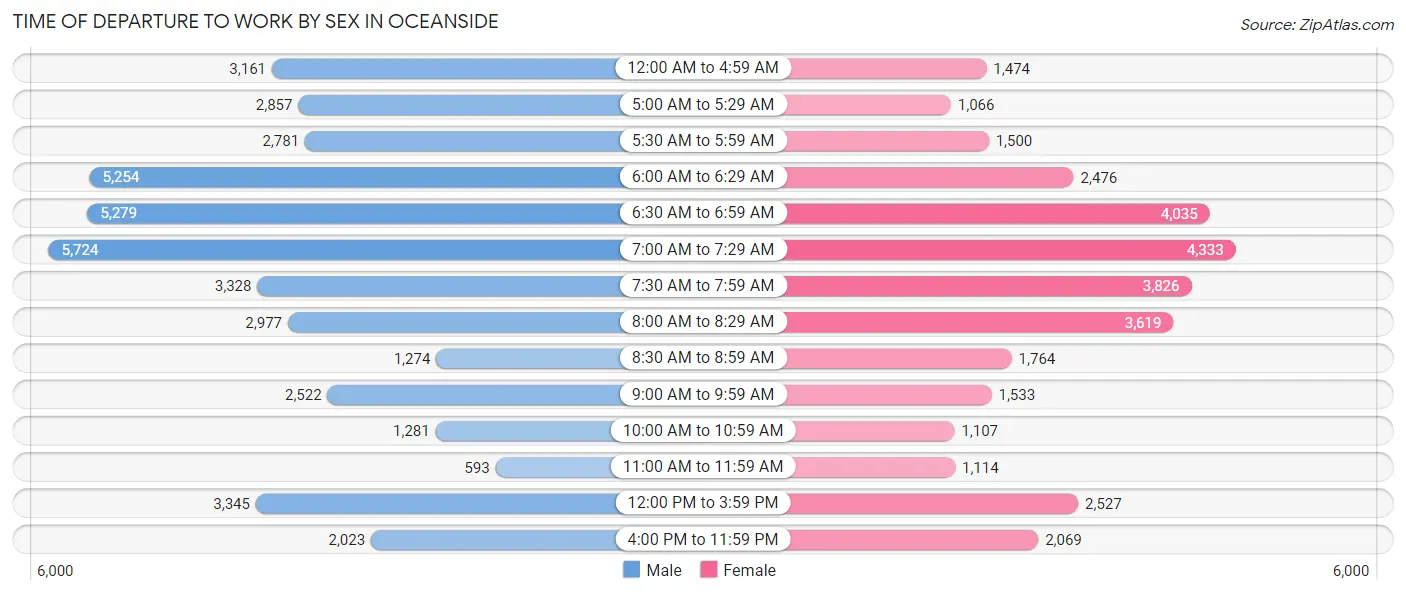
| Time of Departure | Male | Female |
| 12:00 AM to 4:59 AM | 3,161 (7.5%) | 1,474 (4.5%) |
| 5:00 AM to 5:29 AM | 2,857 (6.7%) | 1,066 (3.3%) |
| 5:30 AM to 5:59 AM | 2,781 (6.6%) | 1,500 (4.6%) |
| 6:00 AM to 6:29 AM | 5,254 (12.4%) | 2,476 (7.6%) |
| 6:30 AM to 6:59 AM | 5,279 (12.4%) | 4,035 (12.4%) |
| 7:00 AM to 7:29 AM | 5,724 (13.5%) | 4,333 (13.4%) |
| 7:30 AM to 7:59 AM | 3,328 (7.9%) | 3,826 (11.8%) |
| 8:00 AM to 8:29 AM | 2,977 (7.0%) | 3,619 (11.2%) |
| 8:30 AM to 8:59 AM | 1,274 (3.0%) | 1,764 (5.4%) |
| 9:00 AM to 9:59 AM | 2,522 (5.9%) | 1,533 (4.7%) |
| 10:00 AM to 10:59 AM | 1,281 (3.0%) | 1,107 (3.4%) |
| 11:00 AM to 11:59 AM | 593 (1.4%) | 1,114 (3.4%) |
| 12:00 PM to 3:59 PM | 3,345 (7.9%) | 2,527 (7.8%) |
| 4:00 PM to 11:59 PM | 2,023 (4.8%) | 2,069 (6.4%) |
| Total | 42,399 (100.0%) | 32,443 (100.0%) |
Housing Occupancy in Oceanside
Occupancy by Ownership in Oceanside
Of the total 61,636 dwellings in Oceanside, owner-occupied units account for 35,668 (57.9%), while renter-occupied units make up 25,968 (42.1%).
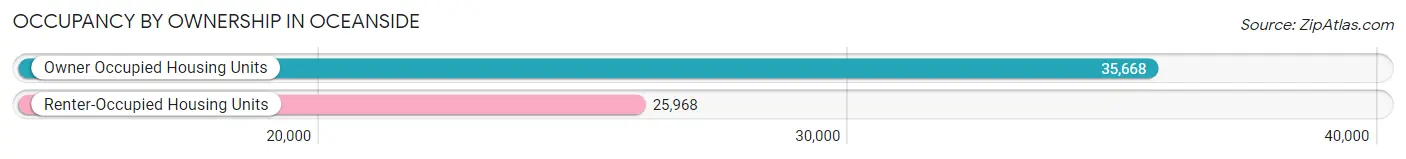
| Occupancy | # Housing Units | % Housing Units |
| Owner Occupied Housing Units | 35,668 | 57.9% |
| Renter-Occupied Housing Units | 25,968 | 42.1% |
| Total Occupied Housing Units | 61,636 | 100.0% |
Occupancy by Household Size in Oceanside
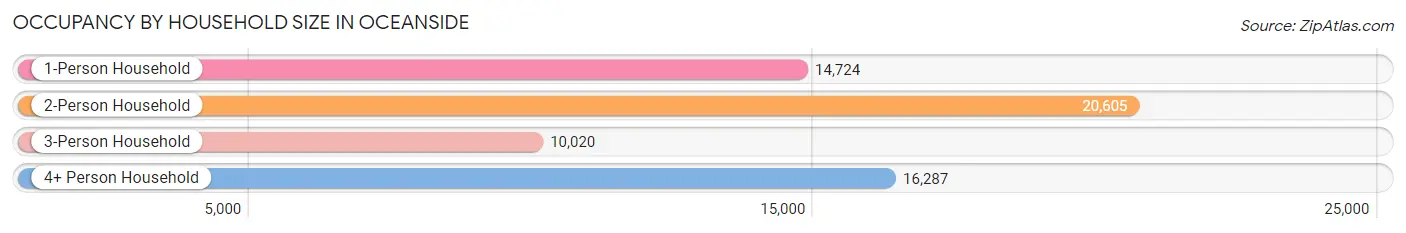
| Household Size | # Housing Units | % Housing Units |
| 1-Person Household | 14,724 | 23.9% |
| 2-Person Household | 20,605 | 33.4% |
| 3-Person Household | 10,020 | 16.3% |
| 4+ Person Household | 16,287 | 26.4% |
| Total Housing Units | 61,636 | 100.0% |
Occupancy by Ownership by Household Size in Oceanside
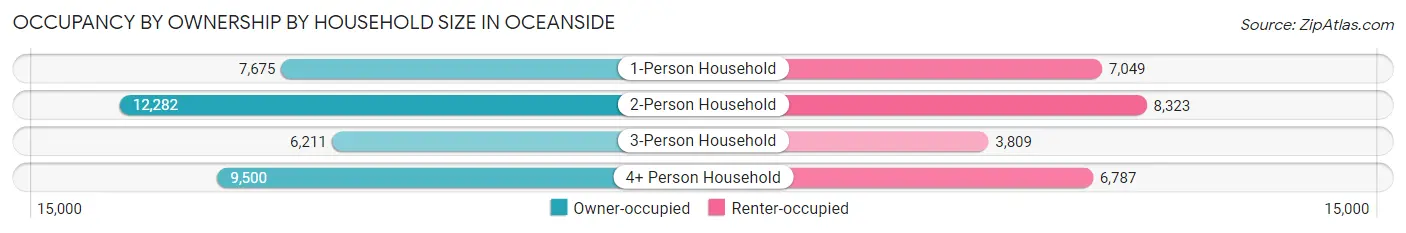
| Household Size | Owner-occupied | Renter-occupied |
| 1-Person Household | 7,675 (52.1%) | 7,049 (47.9%) |
| 2-Person Household | 12,282 (59.6%) | 8,323 (40.4%) |
| 3-Person Household | 6,211 (62.0%) | 3,809 (38.0%) |
| 4+ Person Household | 9,500 (58.3%) | 6,787 (41.7%) |
| Total Housing Units | 35,668 (57.9%) | 25,968 (42.1%) |
Occupancy by Educational Attainment in Oceanside
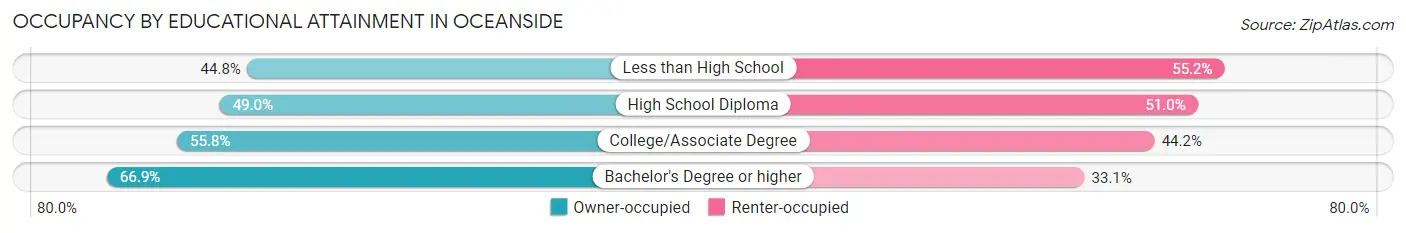
| Household Size | Owner-occupied | Renter-occupied |
| Less than High School | 2,777 (44.8%) | 3,425 (55.2%) |
| High School Diploma | 5,011 (49.0%) | 5,208 (51.0%) |
| College/Associate Degree | 11,977 (55.8%) | 9,480 (44.2%) |
| Bachelor's Degree or higher | 15,903 (66.9%) | 7,855 (33.1%) |
Occupancy by Age of Householder in Oceanside
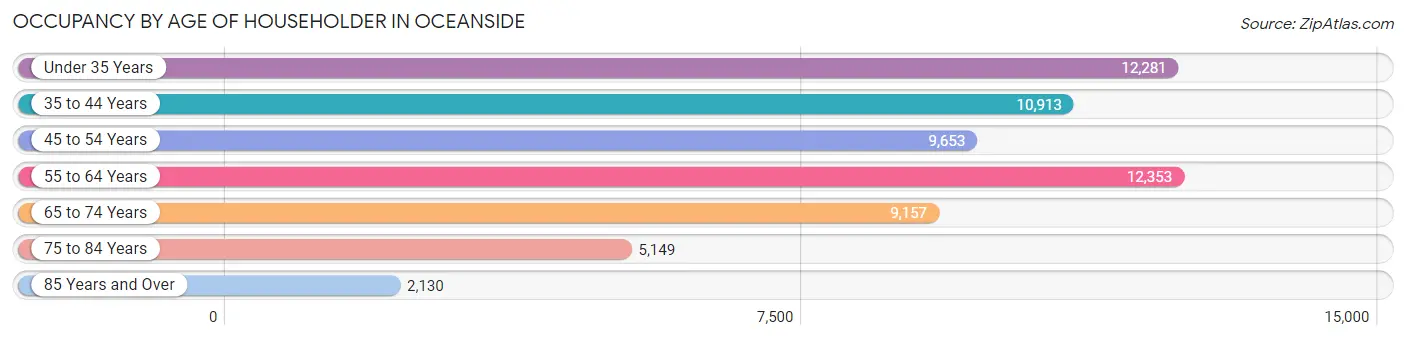
| Age Bracket | # Households | % Households |
| Under 35 Years | 12,281 | 19.9% |
| 35 to 44 Years | 10,913 | 17.7% |
| 45 to 54 Years | 9,653 | 15.7% |
| 55 to 64 Years | 12,353 | 20.0% |
| 65 to 74 Years | 9,157 | 14.9% |
| 75 to 84 Years | 5,149 | 8.4% |
| 85 Years and Over | 2,130 | 3.5% |
| Total | 61,636 | 100.0% |
Housing Finances in Oceanside
Median Income by Occupancy in Oceanside
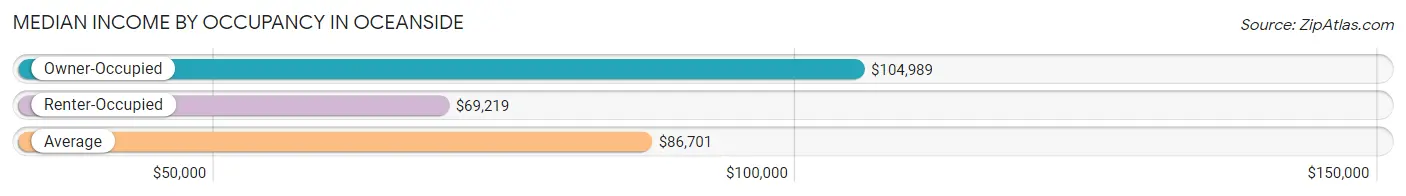
| Occupancy Type | # Households | Median Income |
| Owner-Occupied | 35,668 (57.9%) | $104,989 |
| Renter-Occupied | 25,968 (42.1%) | $69,219 |
| Average | 61,636 (100.0%) | $86,701 |
Occupancy by Householder Income Bracket in Oceanside
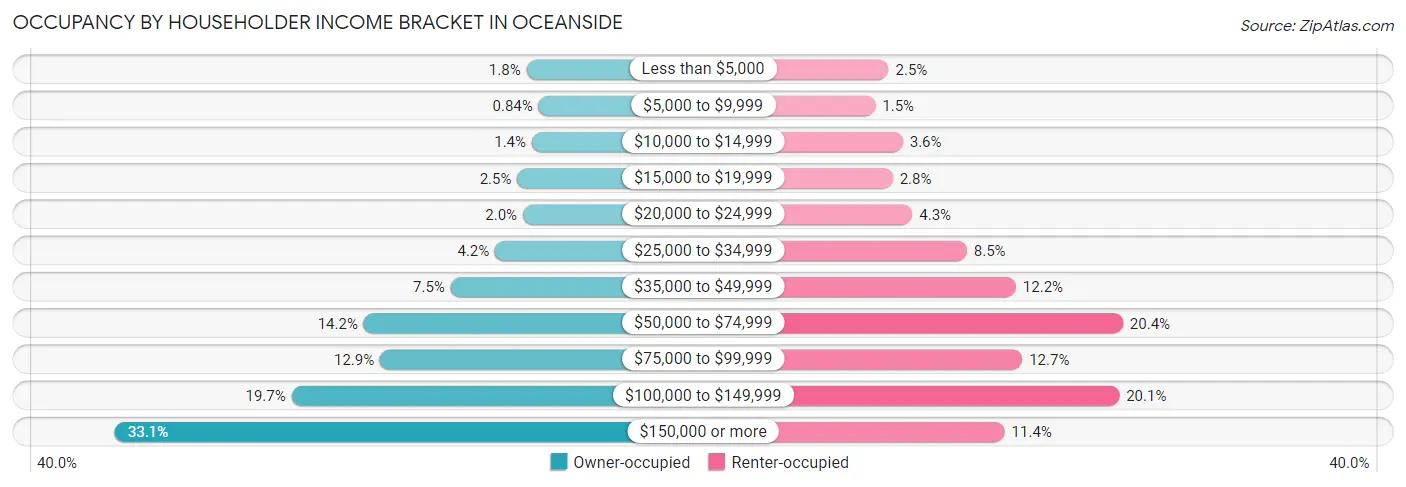
| Income Bracket | Owner-occupied | Renter-occupied |
| Less than $5,000 | 629 (1.8%) | 654 (2.5%) |
| $5,000 to $9,999 | 301 (0.8%) | 392 (1.5%) |
| $10,000 to $14,999 | 481 (1.3%) | 936 (3.6%) |
| $15,000 to $19,999 | 879 (2.5%) | 735 (2.8%) |
| $20,000 to $24,999 | 723 (2.0%) | 1,124 (4.3%) |
| $25,000 to $34,999 | 1,481 (4.2%) | 2,201 (8.5%) |
| $35,000 to $49,999 | 2,688 (7.5%) | 3,174 (12.2%) |
| $50,000 to $74,999 | 5,051 (14.2%) | 5,289 (20.4%) |
| $75,000 to $99,999 | 4,609 (12.9%) | 3,298 (12.7%) |
| $100,000 to $149,999 | 7,012 (19.7%) | 5,216 (20.1%) |
| $150,000 or more | 11,814 (33.1%) | 2,949 (11.4%) |
| Total | 35,668 (100.0%) | 25,968 (100.0%) |
Monthly Housing Cost Tiers in Oceanside
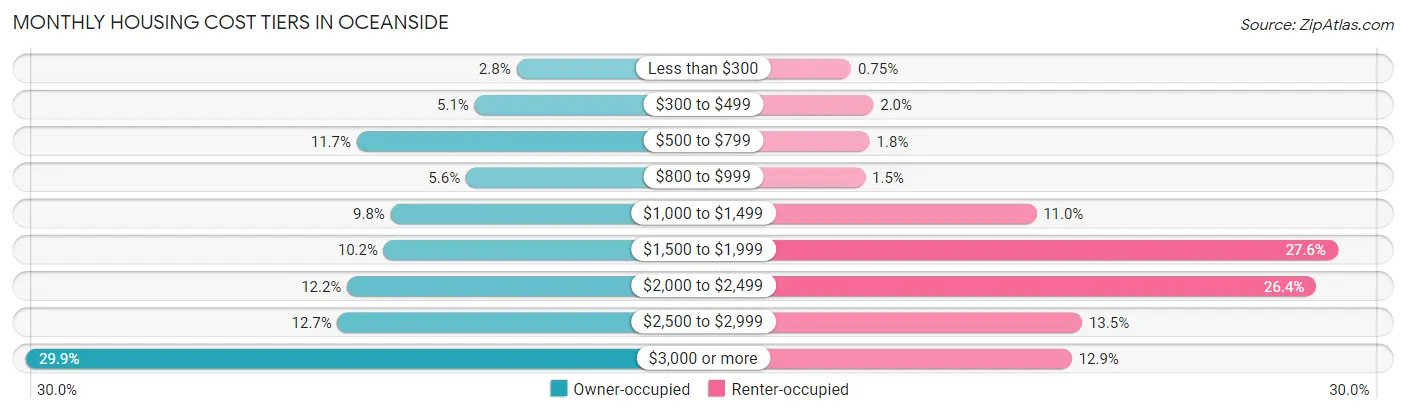
| Monthly Cost | Owner-occupied | Renter-occupied |
| Less than $300 | 1,010 (2.8%) | 194 (0.7%) |
| $300 to $499 | 1,834 (5.1%) | 515 (2.0%) |
| $500 to $799 | 4,157 (11.7%) | 462 (1.8%) |
| $800 to $999 | 2,006 (5.6%) | 397 (1.5%) |
| $1,000 to $1,499 | 3,488 (9.8%) | 2,852 (11.0%) |
| $1,500 to $1,999 | 3,623 (10.2%) | 7,176 (27.6%) |
| $2,000 to $2,499 | 4,345 (12.2%) | 6,867 (26.4%) |
| $2,500 to $2,999 | 4,533 (12.7%) | 3,508 (13.5%) |
| $3,000 or more | 10,672 (29.9%) | 3,359 (12.9%) |
| Total | 35,668 (100.0%) | 25,968 (100.0%) |
Physical Housing Characteristics in Oceanside
Housing Structures in Oceanside
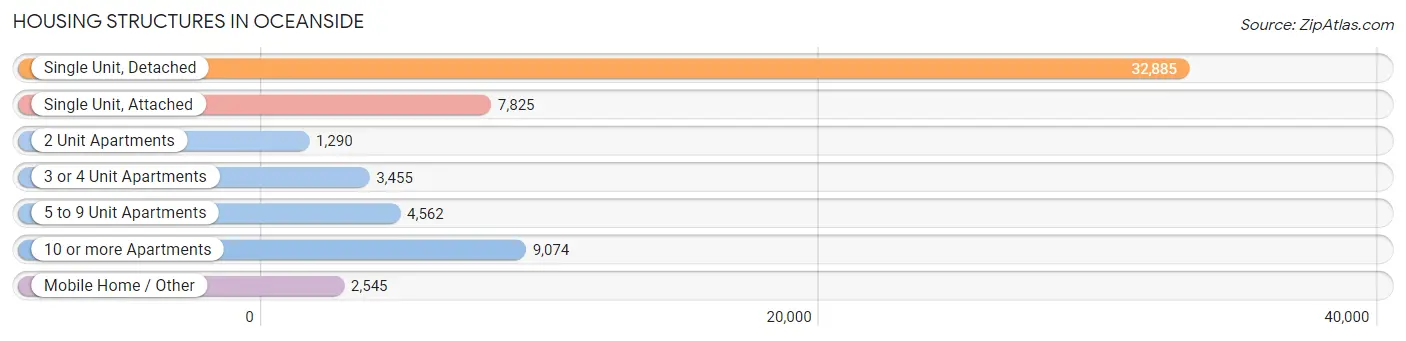
| Structure Type | # Housing Units | % Housing Units |
| Single Unit, Detached | 32,885 | 53.3% |
| Single Unit, Attached | 7,825 | 12.7% |
| 2 Unit Apartments | 1,290 | 2.1% |
| 3 or 4 Unit Apartments | 3,455 | 5.6% |
| 5 to 9 Unit Apartments | 4,562 | 7.4% |
| 10 or more Apartments | 9,074 | 14.7% |
| Mobile Home / Other | 2,545 | 4.1% |
| Total | 61,636 | 100.0% |
Housing Structures by Occupancy in Oceanside
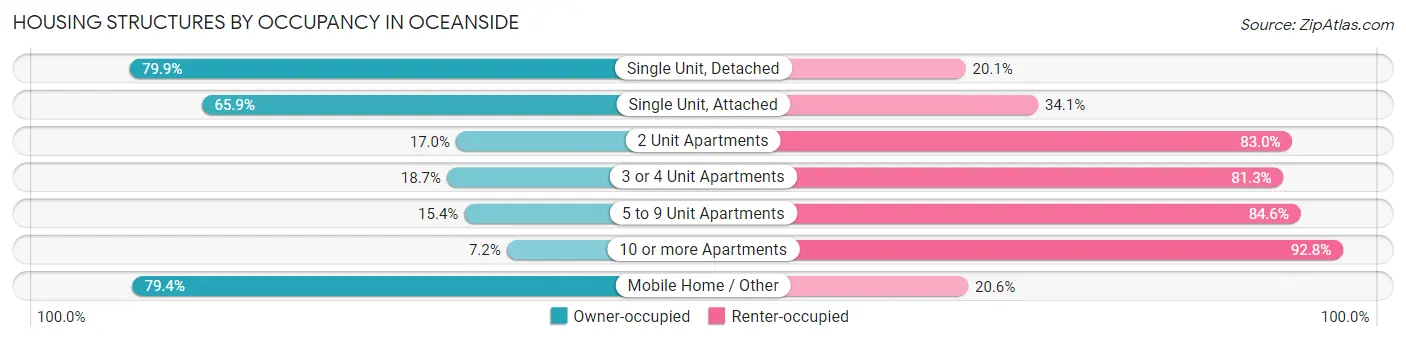
| Structure Type | Owner-occupied | Renter-occupied |
| Single Unit, Detached | 26,267 (79.9%) | 6,618 (20.1%) |
| Single Unit, Attached | 5,160 (65.9%) | 2,665 (34.1%) |
| 2 Unit Apartments | 219 (17.0%) | 1,071 (83.0%) |
| 3 or 4 Unit Apartments | 646 (18.7%) | 2,809 (81.3%) |
| 5 to 9 Unit Apartments | 701 (15.4%) | 3,861 (84.6%) |
| 10 or more Apartments | 654 (7.2%) | 8,420 (92.8%) |
| Mobile Home / Other | 2,021 (79.4%) | 524 (20.6%) |
| Total | 35,668 (57.9%) | 25,968 (42.1%) |
Housing Structures by Number of Rooms in Oceanside
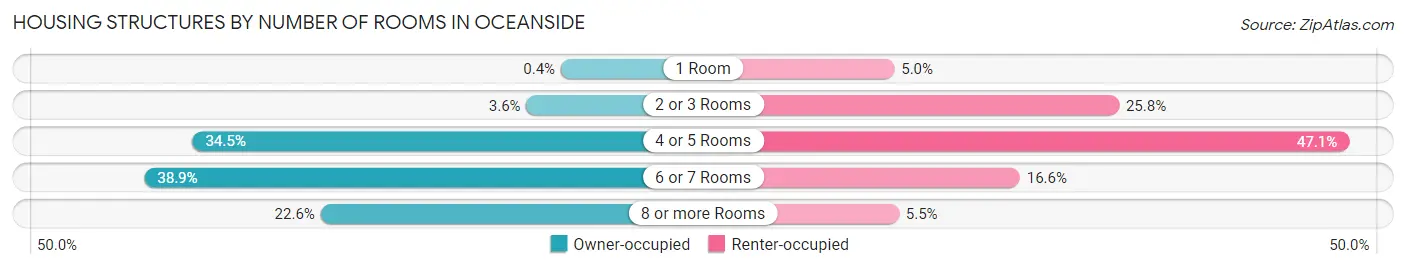
| Number of Rooms | Owner-occupied | Renter-occupied |
| 1 Room | 144 (0.4%) | 1,305 (5.0%) |
| 2 or 3 Rooms | 1,279 (3.6%) | 6,703 (25.8%) |
| 4 or 5 Rooms | 12,293 (34.5%) | 12,226 (47.1%) |
| 6 or 7 Rooms | 13,883 (38.9%) | 4,320 (16.6%) |
| 8 or more Rooms | 8,069 (22.6%) | 1,414 (5.4%) |
| Total | 35,668 (100.0%) | 25,968 (100.0%) |
Housing Structure by Heating Type in Oceanside
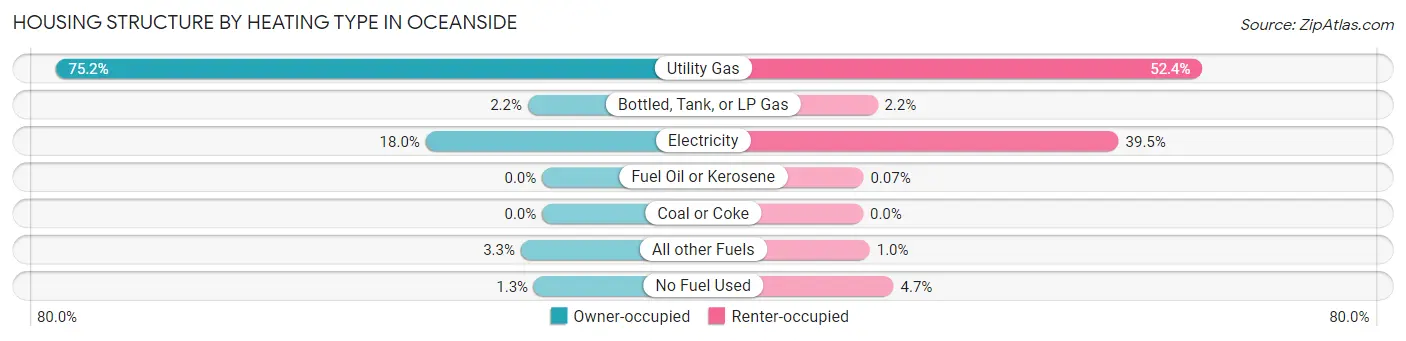
| Heating Type | Owner-occupied | Renter-occupied |
| Utility Gas | 26,836 (75.2%) | 13,617 (52.4%) |
| Bottled, Tank, or LP Gas | 789 (2.2%) | 580 (2.2%) |
| Electricity | 6,421 (18.0%) | 10,260 (39.5%) |
| Fuel Oil or Kerosene | 0 (0.0%) | 17 (0.1%) |
| Coal or Coke | 0 (0.0%) | 0 (0.0%) |
| All other Fuels | 1,173 (3.3%) | 269 (1.0%) |
| No Fuel Used | 449 (1.3%) | 1,225 (4.7%) |
| Total | 35,668 (100.0%) | 25,968 (100.0%) |
Household Vehicle Usage in Oceanside
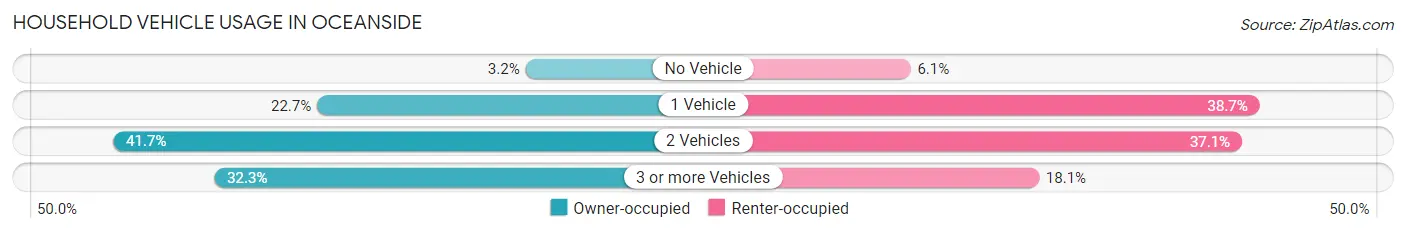
| Vehicles per Household | Owner-occupied | Renter-occupied |
| No Vehicle | 1,155 (3.2%) | 1,590 (6.1%) |
| 1 Vehicle | 8,096 (22.7%) | 10,053 (38.7%) |
| 2 Vehicles | 14,888 (41.7%) | 9,623 (37.1%) |
| 3 or more Vehicles | 11,529 (32.3%) | 4,702 (18.1%) |
| Total | 35,668 (100.0%) | 25,968 (100.0%) |
Real Estate & Mortgages in Oceanside
Real Estate and Mortgage Overview in Oceanside
| Characteristic | Without Mortgage | With Mortgage |
| Housing Units | 10,960 | 24,708 |
| Median Property Value | $591,700 | $664,000 |
| Median Household Income | $71,399 | $9,929 |
| Monthly Housing Costs | $706 | $10,639 |
| Real Estate Taxes | $3,283 | $571 |
Property Value by Mortgage Status in Oceanside
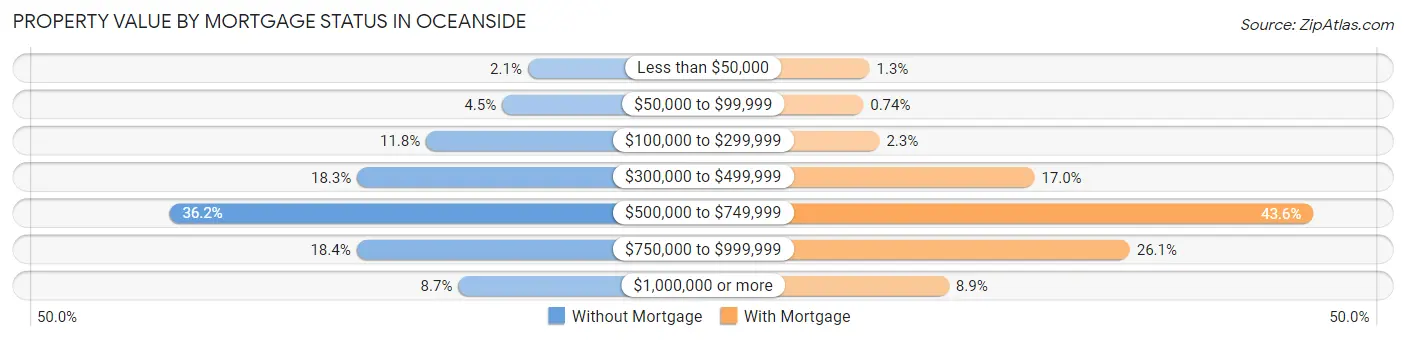
| Property Value | Without Mortgage | With Mortgage |
| Less than $50,000 | 228 (2.1%) | 331 (1.3%) |
| $50,000 to $99,999 | 496 (4.5%) | 182 (0.7%) |
| $100,000 to $299,999 | 1,290 (11.8%) | 563 (2.3%) |
| $300,000 to $499,999 | 2,010 (18.3%) | 4,211 (17.0%) |
| $500,000 to $749,999 | 3,968 (36.2%) | 10,771 (43.6%) |
| $750,000 to $999,999 | 2,015 (18.4%) | 6,454 (26.1%) |
| $1,000,000 or more | 953 (8.7%) | 2,196 (8.9%) |
| Total | 10,960 (100.0%) | 24,708 (100.0%) |
Household Income by Mortgage Status in Oceanside
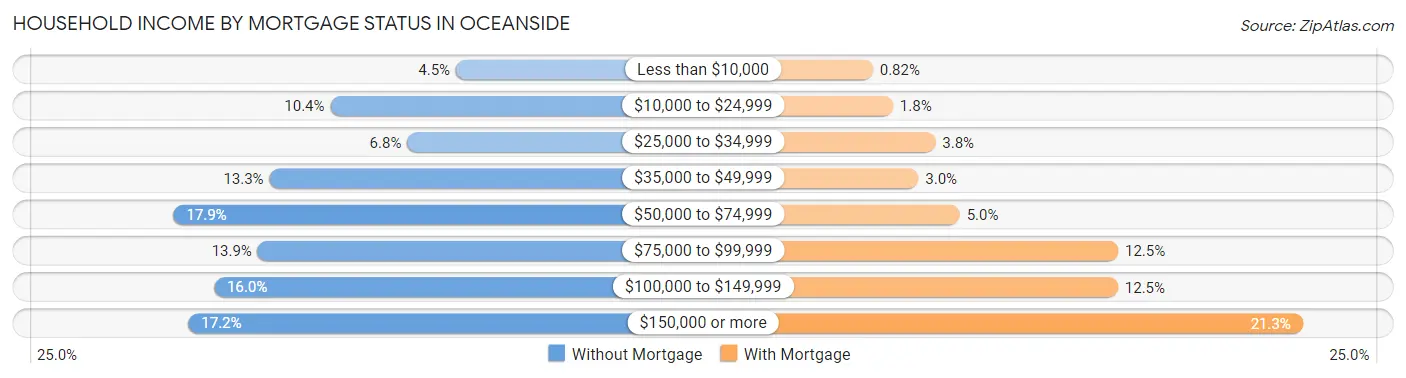
| Household Income | Without Mortgage | With Mortgage |
| Less than $10,000 | 489 (4.5%) | 202 (0.8%) |
| $10,000 to $24,999 | 1,144 (10.4%) | 441 (1.8%) |
| $25,000 to $34,999 | 743 (6.8%) | 939 (3.8%) |
| $35,000 to $49,999 | 1,462 (13.3%) | 738 (3.0%) |
| $50,000 to $74,999 | 1,963 (17.9%) | 1,226 (5.0%) |
| $75,000 to $99,999 | 1,523 (13.9%) | 3,088 (12.5%) |
| $100,000 to $149,999 | 1,751 (16.0%) | 3,086 (12.5%) |
| $150,000 or more | 1,885 (17.2%) | 5,261 (21.3%) |
| Total | 10,960 (100.0%) | 24,708 (100.0%) |
Property Value to Household Income Ratio in Oceanside
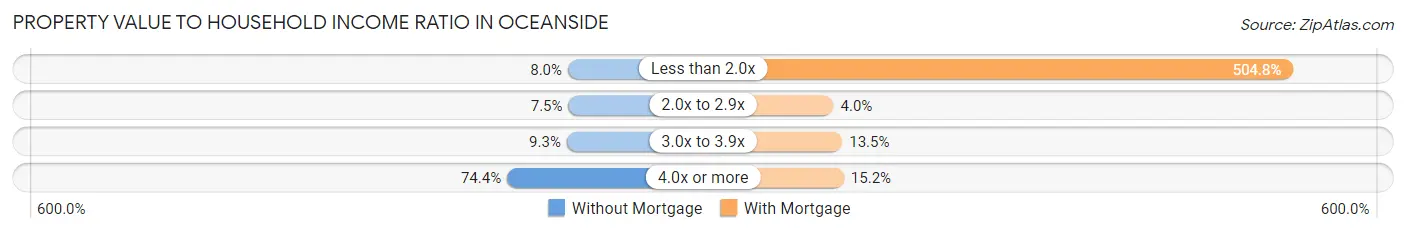
| Value-to-Income Ratio | Without Mortgage | With Mortgage |
| Less than 2.0x | 876 (8.0%) | 124,735 (504.8%) |
| 2.0x to 2.9x | 820 (7.5%) | 990 (4.0%) |
| 3.0x to 3.9x | 1,014 (9.2%) | 3,330 (13.5%) |
| 4.0x or more | 8,149 (74.4%) | 3,766 (15.2%) |
| Total | 10,960 (100.0%) | 24,708 (100.0%) |
Real Estate Taxes by Mortgage Status in Oceanside
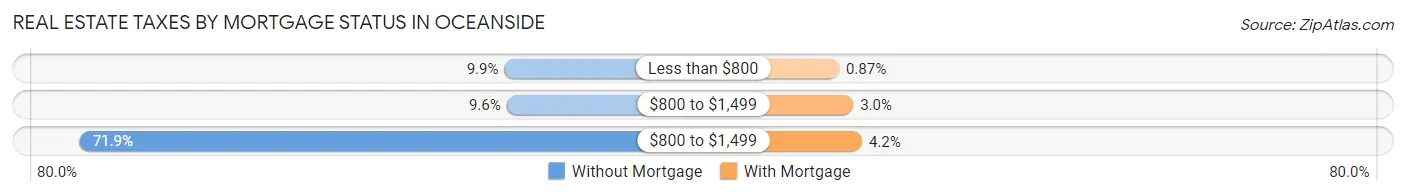
| Property Taxes | Without Mortgage | With Mortgage |
| Less than $800 | 1,086 (9.9%) | 216 (0.9%) |
| $800 to $1,499 | 1,050 (9.6%) | 728 (2.9%) |
| $800 to $1,499 | 7,885 (71.9%) | 1,045 (4.2%) |
| Total | 10,960 (100.0%) | 24,708 (100.0%) |
Health & Disability in Oceanside
Health Insurance Coverage by Age in Oceanside
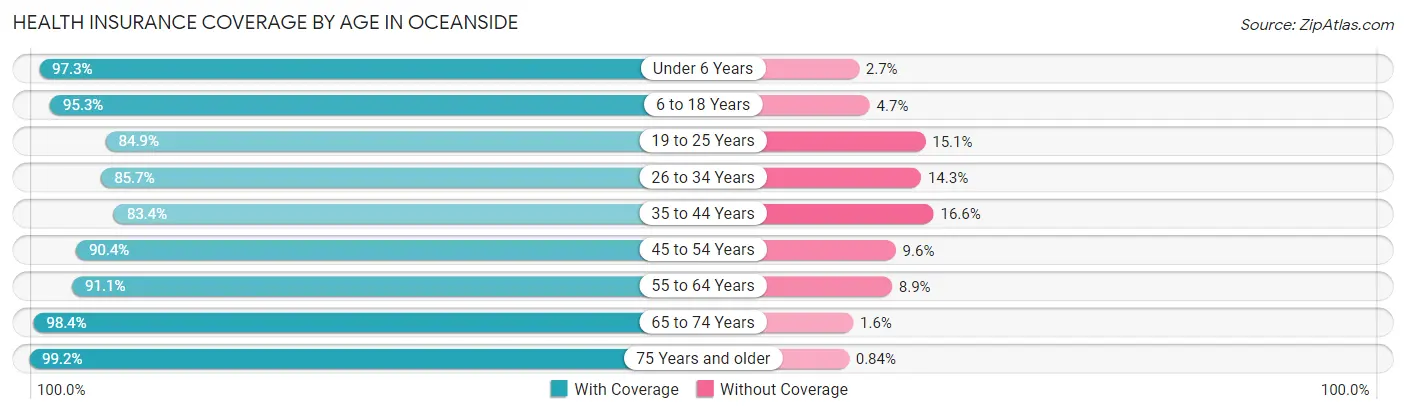
| Age Bracket | With Coverage | Without Coverage |
| Under 6 Years | 11,569 (97.3%) | 323 (2.7%) |
| 6 to 18 Years | 25,576 (95.3%) | 1,269 (4.7%) |
| 19 to 25 Years | 13,558 (84.9%) | 2,414 (15.1%) |
| 26 to 34 Years | 19,311 (85.7%) | 3,222 (14.3%) |
| 35 to 44 Years | 19,087 (83.4%) | 3,810 (16.6%) |
| 45 to 54 Years | 17,939 (90.4%) | 1,901 (9.6%) |
| 55 to 64 Years | 20,586 (91.1%) | 2,003 (8.9%) |
| 65 to 74 Years | 15,214 (98.4%) | 253 (1.6%) |
| 75 Years and older | 11,540 (99.2%) | 98 (0.8%) |
| Total | 154,380 (91.0%) | 15,293 (9.0%) |
Health Insurance Coverage by Citizenship Status in Oceanside
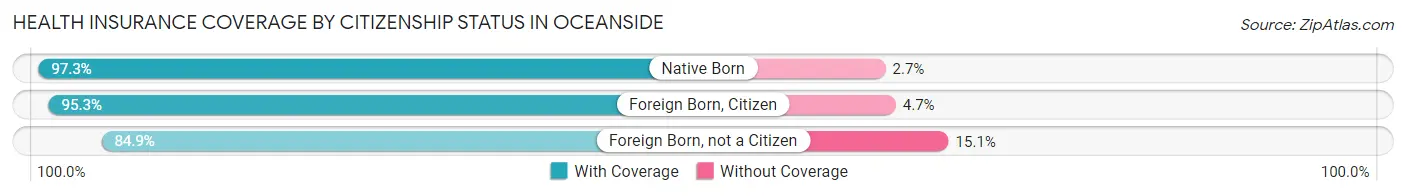
| Citizenship Status | With Coverage | Without Coverage |
| Native Born | 11,569 (97.3%) | 323 (2.7%) |
| Foreign Born, Citizen | 25,576 (95.3%) | 1,269 (4.7%) |
| Foreign Born, not a Citizen | 13,558 (84.9%) | 2,414 (15.1%) |
Health Insurance Coverage by Household Income in Oceanside
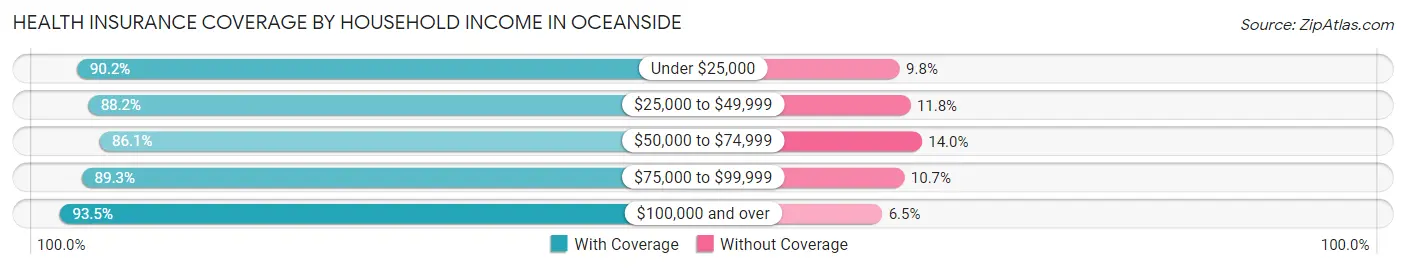
| Household Income | With Coverage | Without Coverage |
| Under $25,000 | 10,256 (90.2%) | 1,115 (9.8%) |
| $25,000 to $49,999 | 18,209 (88.2%) | 2,444 (11.8%) |
| $50,000 to $74,999 | 21,561 (86.1%) | 3,494 (14.0%) |
| $75,000 to $99,999 | 19,874 (89.3%) | 2,379 (10.7%) |
| $100,000 and over | 83,554 (93.5%) | 5,844 (6.5%) |
Public vs Private Health Insurance Coverage by Age in Oceanside
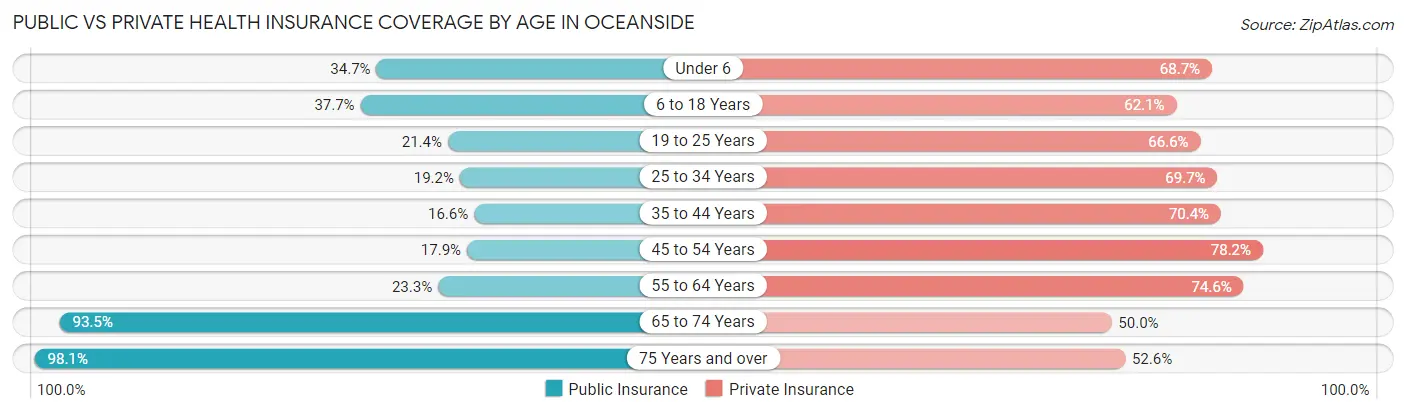
| Age Bracket | Public Insurance | Private Insurance |
| Under 6 | 4,127 (34.7%) | 8,169 (68.7%) |
| 6 to 18 Years | 10,110 (37.7%) | 16,671 (62.1%) |
| 19 to 25 Years | 3,424 (21.4%) | 10,631 (66.6%) |
| 25 to 34 Years | 4,330 (19.2%) | 15,707 (69.7%) |
| 35 to 44 Years | 3,796 (16.6%) | 16,113 (70.4%) |
| 45 to 54 Years | 3,552 (17.9%) | 15,505 (78.1%) |
| 55 to 64 Years | 5,257 (23.3%) | 16,847 (74.6%) |
| 65 to 74 Years | 14,462 (93.5%) | 7,740 (50.0%) |
| 75 Years and over | 11,421 (98.1%) | 6,117 (52.6%) |
| Total | 60,479 (35.6%) | 113,500 (66.9%) |
Disability Status by Sex by Age in Oceanside
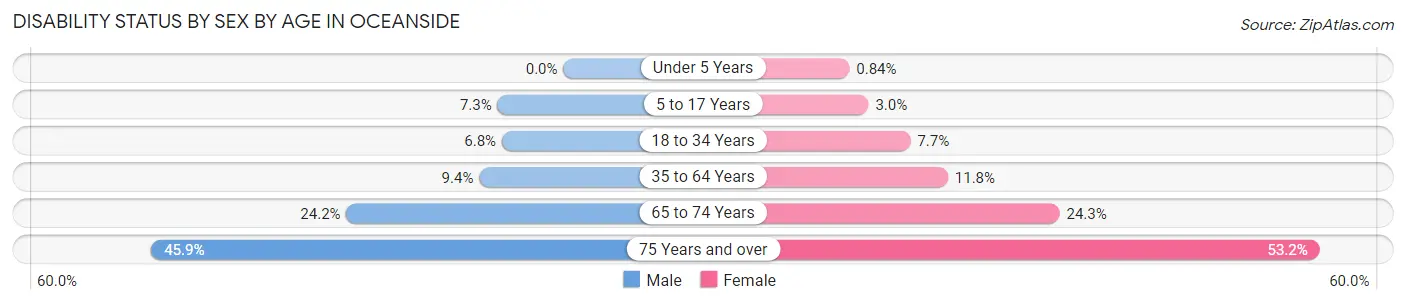
| Age Bracket | Male | Female |
| Under 5 Years | 0 (0.0%) | 40 (0.8%) |
| 5 to 17 Years | 980 (7.3%) | 401 (3.0%) |
| 18 to 34 Years | 1,398 (6.8%) | 1,515 (7.6%) |
| 35 to 64 Years | 3,053 (9.4%) | 3,866 (11.8%) |
| 65 to 74 Years | 1,681 (24.2%) | 2,063 (24.2%) |
| 75 Years and over | 2,062 (45.9%) | 3,802 (53.2%) |
Disability Class by Sex by Age in Oceanside
Disability Class: Hearing Difficulty
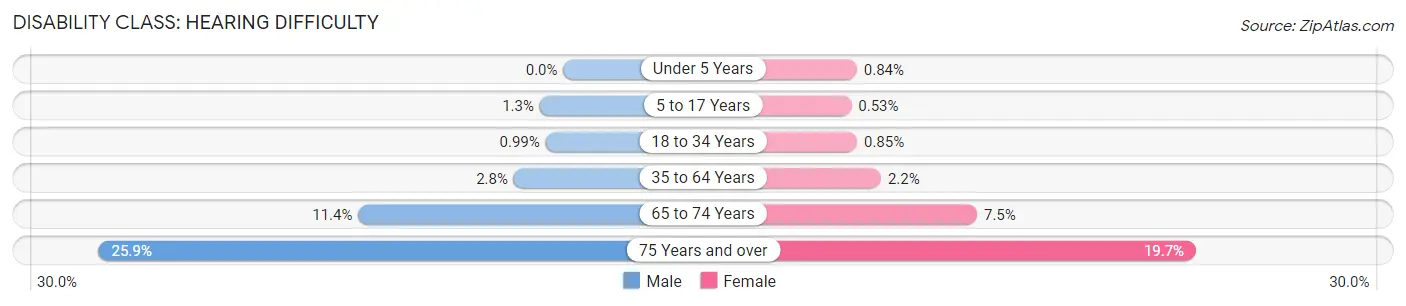
| Age Bracket | Male | Female |
| Under 5 Years | 0 (0.0%) | 40 (0.8%) |
| 5 to 17 Years | 175 (1.3%) | 71 (0.5%) |
| 18 to 34 Years | 203 (1.0%) | 168 (0.9%) |
| 35 to 64 Years | 900 (2.8%) | 714 (2.2%) |
| 65 to 74 Years | 795 (11.4%) | 641 (7.5%) |
| 75 Years and over | 1,163 (25.9%) | 1,409 (19.7%) |
Disability Class: Vision Difficulty
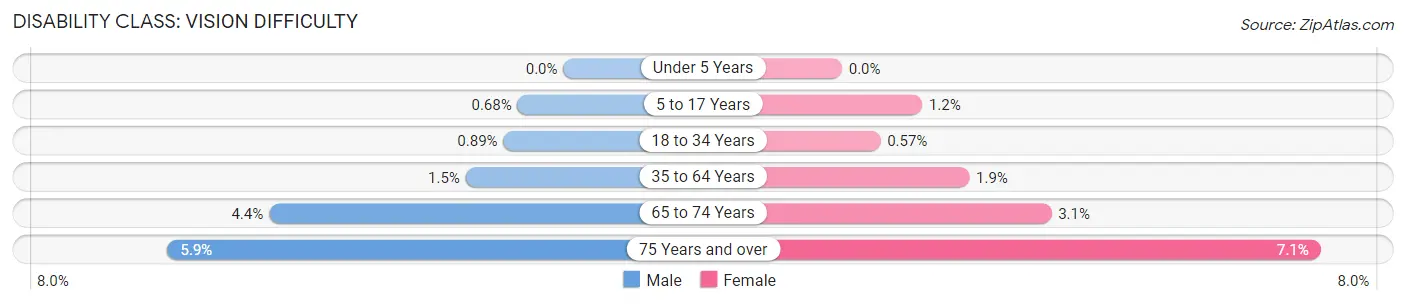
| Age Bracket | Male | Female |
| Under 5 Years | 0 (0.0%) | 0 (0.0%) |
| 5 to 17 Years | 91 (0.7%) | 161 (1.2%) |
| 18 to 34 Years | 181 (0.9%) | 113 (0.6%) |
| 35 to 64 Years | 474 (1.5%) | 617 (1.9%) |
| 65 to 74 Years | 304 (4.4%) | 265 (3.1%) |
| 75 Years and over | 264 (5.9%) | 508 (7.1%) |
Disability Class: Cognitive Difficulty
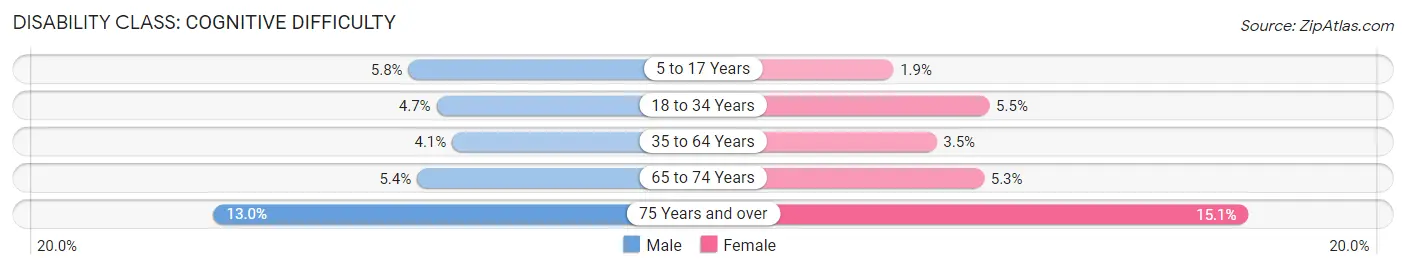
| Age Bracket | Male | Female |
| 5 to 17 Years | 769 (5.8%) | 258 (1.9%) |
| 18 to 34 Years | 963 (4.7%) | 1,083 (5.5%) |
| 35 to 64 Years | 1,345 (4.1%) | 1,149 (3.5%) |
| 65 to 74 Years | 378 (5.4%) | 448 (5.3%) |
| 75 Years and over | 583 (13.0%) | 1,078 (15.1%) |
Disability Class: Ambulatory Difficulty
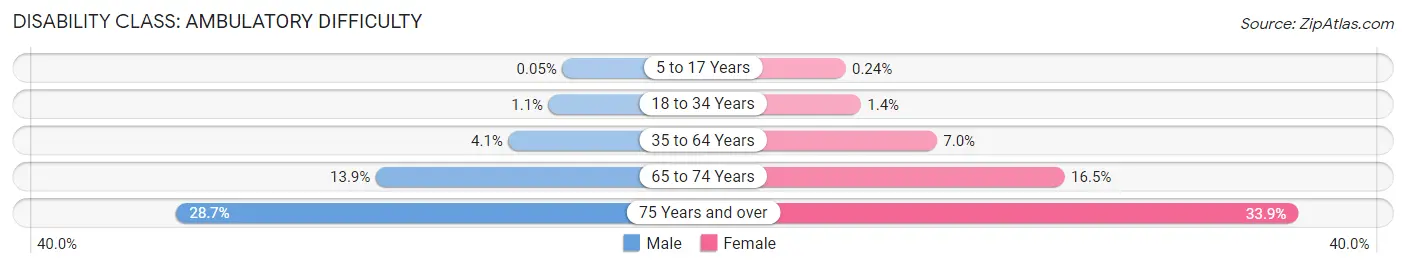
| Age Bracket | Male | Female |
| 5 to 17 Years | 7 (0.1%) | 33 (0.2%) |
| 18 to 34 Years | 218 (1.1%) | 273 (1.4%) |
| 35 to 64 Years | 1,323 (4.1%) | 2,297 (7.0%) |
| 65 to 74 Years | 967 (13.9%) | 1,405 (16.5%) |
| 75 Years and over | 1,291 (28.7%) | 2,421 (33.9%) |
Disability Class: Self-Care Difficulty
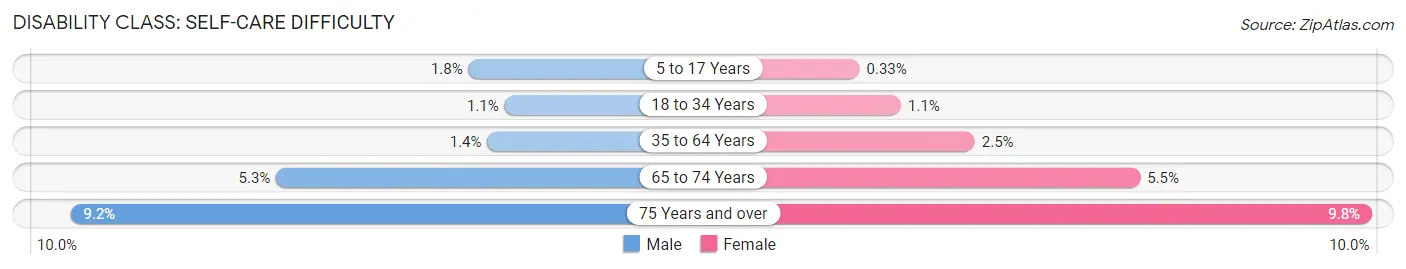
| Age Bracket | Male | Female |
| 5 to 17 Years | 235 (1.8%) | 45 (0.3%) |
| 18 to 34 Years | 222 (1.1%) | 218 (1.1%) |
| 35 to 64 Years | 461 (1.4%) | 809 (2.5%) |
| 65 to 74 Years | 371 (5.3%) | 471 (5.5%) |
| 75 Years and over | 411 (9.1%) | 703 (9.8%) |
Technology Access in Oceanside
Computing Device Access in Oceanside
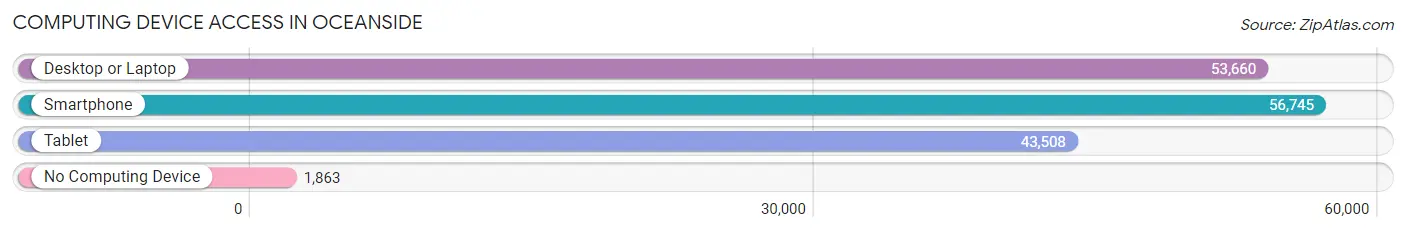
| Device Type | # Households | % Households |
| Desktop or Laptop | 53,660 | 87.1% |
| Smartphone | 56,745 | 92.1% |
| Tablet | 43,508 | 70.6% |
| No Computing Device | 1,863 | 3.0% |
| Total | 61,636 | 100.0% |
Internet Access in Oceanside
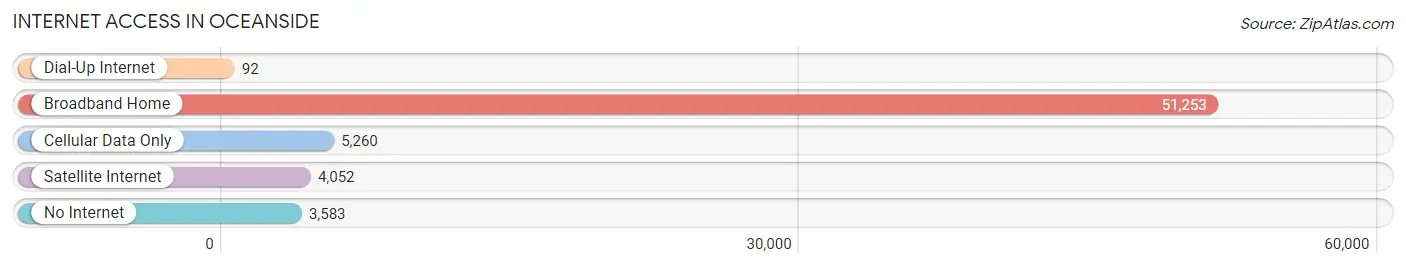
| Internet Type | # Households | % Households |
| Dial-Up Internet | 92 | 0.2% |
| Broadband Home | 51,253 | 83.2% |
| Cellular Data Only | 5,260 | 8.5% |
| Satellite Internet | 4,052 | 6.6% |
| No Internet | 3,583 | 5.8% |
| Total | 61,636 | 100.0% |
Oceanside Summary
Oceanside is a coastal city located in San Diego County, California. It is situated on the Pacific Ocean, just south of Camp Pendleton, the largest Marine Corps base on the West Coast. Oceanside is the third-largest city in San Diego County, with a population of over 175,000 people. It is known for its beautiful beaches, historic downtown, and vibrant culture.
History
The area now known as Oceanside has been inhabited for thousands of years by the Luiseño people. The first Europeans to explore the area were Spanish missionaries, who arrived in 1769. The area was part of the Rancho Buena Vista, a Mexican land grant given to Juan María Osuna in 1843. In the late 1800s, the area was developed as a resort town, with the construction of the Oceanside Hotel in 1887. The city was officially incorporated in 1888.
In the early 1900s, Oceanside became a popular destination for tourists, with the construction of the Oceanside Pier in 1916. The pier was a popular spot for fishing and other recreational activities. During World War II, the city was home to a U.S. Navy base, Camp Pendleton. The base is still active today and is the largest Marine Corps base on the West Coast.
Geography
Oceanside is located in San Diego County, California, on the Pacific Ocean. It is situated between the cities of Carlsbad and San Clemente. The city covers an area of 42.2 square miles, with a population density of 4,093 people per square mile. The city is bordered by the San Luis Rey River to the north, the San Luis Rey Valley to the east, and the Pacific Ocean to the south and west.
The city has a Mediterranean climate, with mild temperatures year-round. The average high temperature in July is 78°F, and the average low temperature in January is 48°F. The city receives an average of 10 inches of rain per year.
Economy
Oceanside’s economy is largely driven by tourism, with the city’s beaches and attractions drawing visitors from around the world. The city is also home to a number of military installations, including Camp Pendleton, which is the largest Marine Corps base on the West Coast. The base is a major employer in the city, with over 40,000 personnel.
Other major employers in the city include Tri-City Medical Center, Oceanside Unified School District, and the Oceanside Unified School District. The city is also home to a number of technology companies, including Northrop Grumman, Qualcomm, and Sony.
Demographics
As of the 2010 census, Oceanside had a population of 175,723 people. The racial makeup of the city was 68.2% White, 5.2% African American, 0.7% Native American, 8.3% Asian, 0.3% Pacific Islander, and 14.3% from other races. Hispanic or Latino of any race made up 33.2% of the population.
The median household income in Oceanside was $60,845, and the median family income was $68,824. The per capita income was $27,845. About 11.2% of the population was below the poverty line.
Oceanside is a diverse city, with a vibrant culture and a rich history. It is home to a number of attractions, including the Oceanside Pier, the Oceanside Museum of Art, and the California Surf Museum. The city is also home to a number of military installations, making it an important part of the San Diego County economy.
Common Questions
What is Per Capita Income in Oceanside?
Per Capita income in Oceanside is $40,131.
What is the Median Family Income in Oceanside?
Median Family Income in Oceanside is $101,357.
What is the Median Household income in Oceanside?
Median Household Income in Oceanside is $86,701.
What is Income or Wage Gap in Oceanside?
Income or Wage Gap in Oceanside is 26.0%.
Women in Oceanside earn 74.0 cents for every dollar earned by a man.
What is Family Income Deficit in Oceanside?
Family Income Deficit in Oceanside is $13,306.
Families that are below poverty line in Oceanside earn $13,306 less on average than the poverty threshold level.
What is Inequality or Gini Index in Oceanside?
Inequality or Gini Index in Oceanside is 0.42.
What is the Total Population of Oceanside?
Total Population of Oceanside is 173,722.
What is the Total Male Population of Oceanside?
Total Male Population of Oceanside is 86,713.
What is the Total Female Population of Oceanside?
Total Female Population of Oceanside is 87,009.
What is the Ratio of Males per 100 Females in Oceanside?
There are 99.66 Males per 100 Females in Oceanside.
What is the Ratio of Females per 100 Males in Oceanside?
There are 100.34 Females per 100 Males in Oceanside.
What is the Median Population Age in Oceanside?
Median Population Age in Oceanside is 37.5 Years.
What is the Average Family Size in Oceanside
Average Family Size in Oceanside is 3.3 People.
What is the Average Household Size in Oceanside
Average Household Size in Oceanside is 2.8 People.
How Large is the Labor Force in Oceanside?
There are 94,455 People in the Labor Forcein in Oceanside.
What is the Percentage of People in the Labor Force in Oceanside?
67.1% of People are in the Labor Force in Oceanside.
What is the Unemployment Rate in Oceanside?
Unemployment Rate in Oceanside is 5.9%.