Merced, CA Map & Demographics
Merced Map
Merced Overview
$25,155
PER CAPITA INCOME
$65,348
AVG FAMILY INCOME
$59,233
AVG HOUSEHOLD INCOME
25.5%
WAGE / INCOME GAP [ % ]
74.5¢/ $1
WAGE / INCOME GAP [ $ ]
$12,066
FAMILY INCOME DEFICIT
0.46
INEQUALITY / GINI INDEX
87,686
TOTAL POPULATION
43,481
MALE POPULATION
44,205
FEMALE POPULATION
98.36
MALES / 100 FEMALES
101.67
FEMALES / 100 MALES
29.9
MEDIAN AGE
3.7
AVG FAMILY SIZE
3.2
AVG HOUSEHOLD SIZE
39,538
LABOR FORCE [ PEOPLE ]
60.9%
PERCENT IN LABOR FORCE
12.6%
UNEMPLOYMENT RATE
Merced Area Codes
Income in Merced
Income Overview in Merced
Per Capita Income in Merced is $25,155, while median incomes of families and households are $65,348 and $59,233 respectively.
| Characteristic | Number | Measure |
| Per Capita Income | 87,686 | $25,155 |
| Median Family Income | 19,406 | $65,348 |
| Mean Family Income | 19,406 | $82,973 |
| Median Household Income | 27,084 | $59,233 |
| Mean Household Income | 27,084 | $78,097 |
| Income Deficit | 19,406 | $12,066 |
| Wage / Income Gap (%) | 87,686 | 25.50% |
| Wage / Income Gap ($) | 87,686 | 74.50¢ per $1 |
| Gini / Inequality Index | 87,686 | 0.46 |
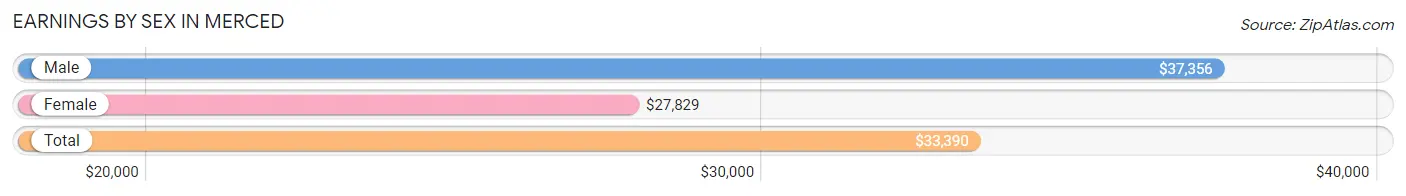
Earnings by Sex in Merced
Average Earnings in Merced are $33,390, $37,356 for men and $27,829 for women, a difference of 25.5%.
| Sex | Number | Average Earnings |
| Male | 22,171 (55.5%) | $37,356 |
| Female | 17,798 (44.5%) | $27,829 |
| Total | 39,969 (100.0%) | $33,390 |
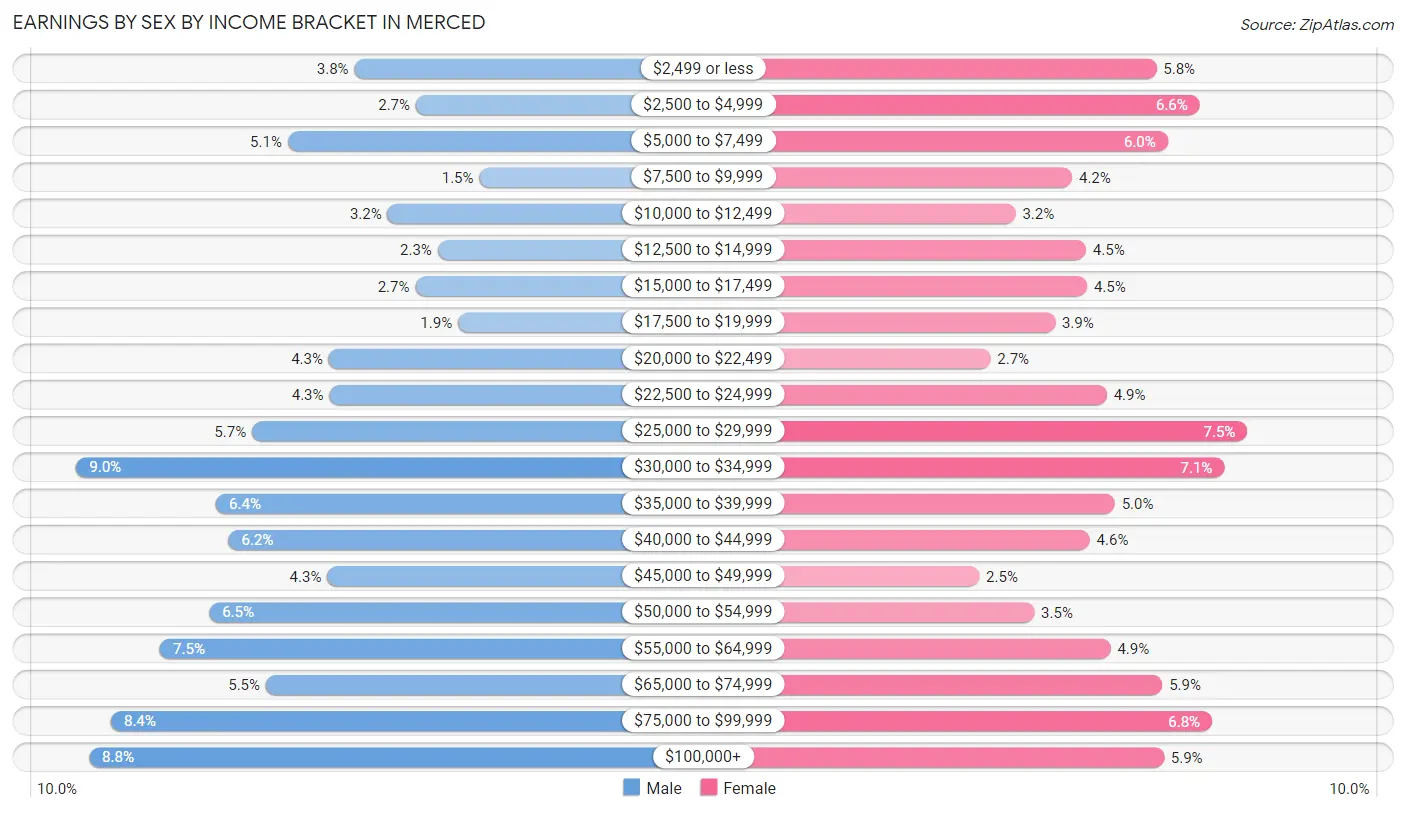
Earnings by Sex by Income Bracket in Merced
The most common earnings brackets in Merced are $30,000 to $34,999 for men (2,002 | 9.0%) and $25,000 to $29,999 for women (1,334 | 7.5%).
| Income | Male | Female |
| $2,499 or less | 847 (3.8%) | 1,032 (5.8%) |
| $2,500 to $4,999 | 593 (2.7%) | 1,176 (6.6%) |
| $5,000 to $7,499 | 1,123 (5.1%) | 1,070 (6.0%) |
| $7,500 to $9,999 | 328 (1.5%) | 751 (4.2%) |
| $10,000 to $12,499 | 709 (3.2%) | 562 (3.2%) |
| $12,500 to $14,999 | 502 (2.3%) | 798 (4.5%) |
| $15,000 to $17,499 | 594 (2.7%) | 801 (4.5%) |
| $17,500 to $19,999 | 417 (1.9%) | 695 (3.9%) |
| $20,000 to $22,499 | 954 (4.3%) | 479 (2.7%) |
| $22,500 to $24,999 | 951 (4.3%) | 867 (4.9%) |
| $25,000 to $29,999 | 1,273 (5.7%) | 1,334 (7.5%) |
| $30,000 to $34,999 | 2,002 (9.0%) | 1,259 (7.1%) |
| $35,000 to $39,999 | 1,422 (6.4%) | 893 (5.0%) |
| $40,000 to $44,999 | 1,370 (6.2%) | 810 (4.5%) |
| $45,000 to $49,999 | 959 (4.3%) | 442 (2.5%) |
| $50,000 to $54,999 | 1,450 (6.5%) | 624 (3.5%) |
| $55,000 to $64,999 | 1,655 (7.5%) | 879 (4.9%) |
| $65,000 to $74,999 | 1,216 (5.5%) | 1,051 (5.9%) |
| $75,000 to $99,999 | 1,858 (8.4%) | 1,217 (6.8%) |
| $100,000+ | 1,948 (8.8%) | 1,058 (5.9%) |
| Total | 22,171 (100.0%) | 17,798 (100.0%) |
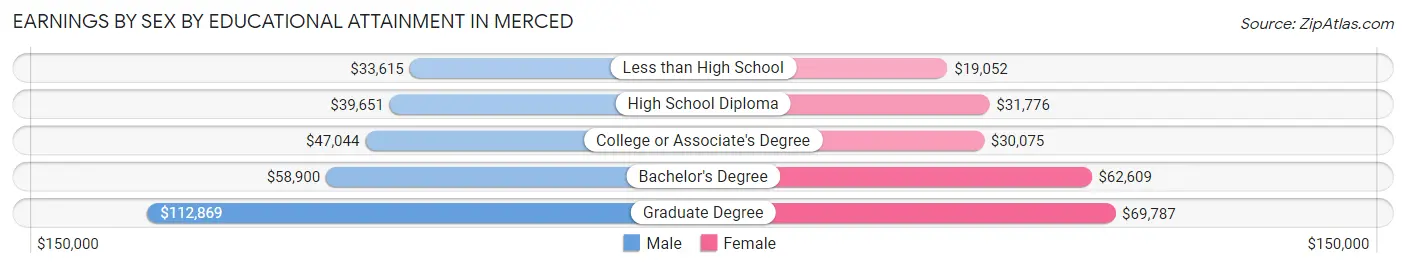
Earnings by Sex by Educational Attainment in Merced
Average earnings in Merced are $43,046 for men and $32,843 for women, a difference of 23.7%. Men with an educational attainment of graduate degree enjoy the highest average annual earnings of $112,869, while those with less than high school education earn the least with $33,615. Women with an educational attainment of graduate degree earn the most with the average annual earnings of $69,787, while those with less than high school education have the smallest earnings of $19,052.
| Educational Attainment | Male Income | Female Income |
| Less than High School | $33,615 | $19,052 |
| High School Diploma | $39,651 | $31,776 |
| College or Associate's Degree | $47,044 | $30,075 |
| Bachelor's Degree | $58,900 | $62,609 |
| Graduate Degree | $112,869 | $69,787 |
| Total | $43,046 | $32,843 |
Family Income in Merced
Family Income Brackets in Merced
According to the Merced family income data, there are 3,726 families falling into the $50,000 to $74,999 income range, which is the most common income bracket and makes up 19.2% of all families. Conversely, the $10,000 to $14,999 income bracket is the least frequent group with only 776 families (4.0%) belonging to this category.
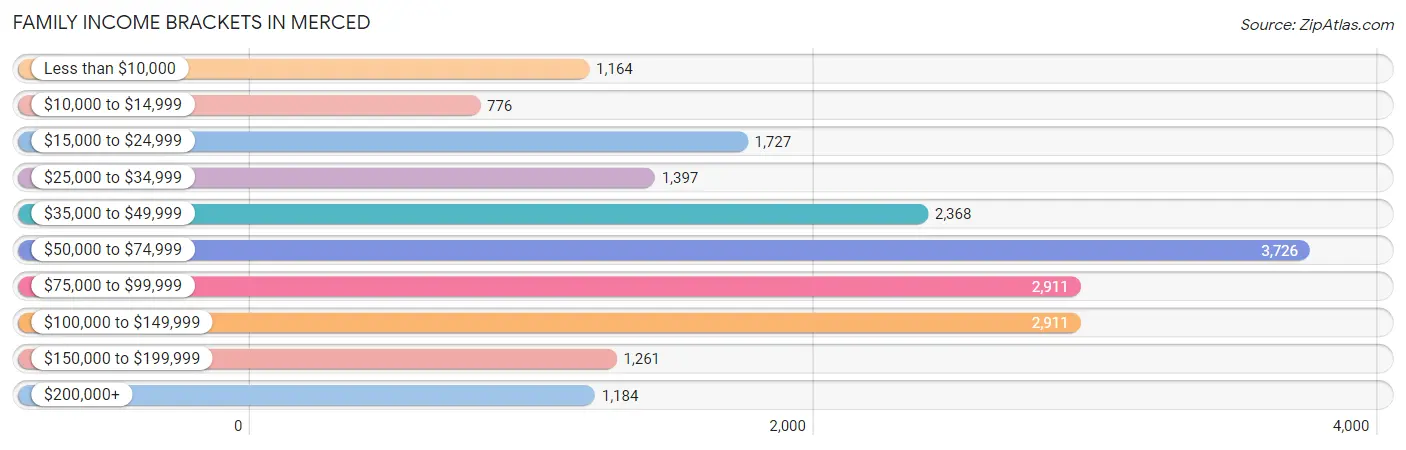
| Income Bracket | # Families | % Families |
| Less than $10,000 | 1,164 | 6.0% |
| $10,000 to $14,999 | 776 | 4.0% |
| $15,000 to $24,999 | 1,727 | 8.9% |
| $25,000 to $34,999 | 1,397 | 7.2% |
| $35,000 to $49,999 | 2,368 | 12.2% |
| $50,000 to $74,999 | 3,726 | 19.2% |
| $75,000 to $99,999 | 2,911 | 15.0% |
| $100,000 to $149,999 | 2,911 | 15.0% |
| $150,000 to $199,999 | 1,261 | 6.5% |
| $200,000+ | 1,184 | 6.1% |
Family Income by Famaliy Size in Merced
6-person families (1,004 | 5.2%) account for the highest median family income in Merced with $82,431 per family, while 2-person families (7,197 | 37.1%) have the highest median income of $29,608 per family member.
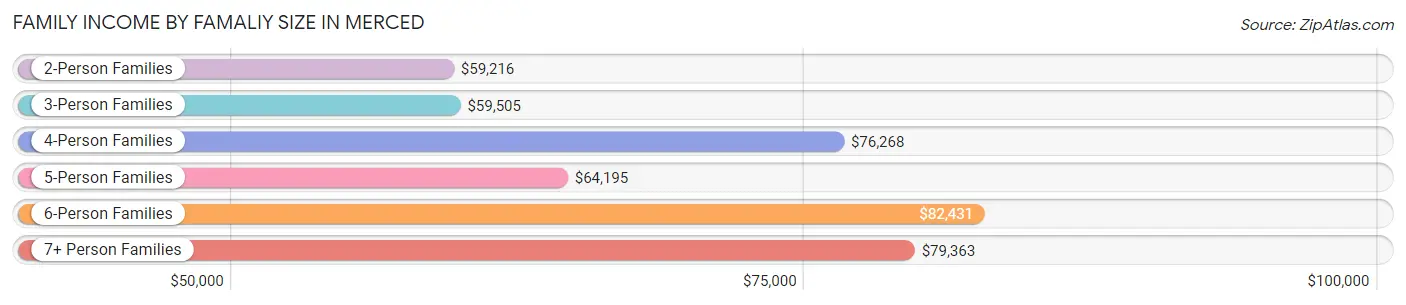
| Income Bracket | # Families | Median Income |
| 2-Person Families | 7,197 (37.1%) | $59,216 |
| 3-Person Families | 3,974 (20.5%) | $59,505 |
| 4-Person Families | 3,698 (19.1%) | $76,268 |
| 5-Person Families | 2,705 (13.9%) | $64,195 |
| 6-Person Families | 1,004 (5.2%) | $82,431 |
| 7+ Person Families | 828 (4.3%) | $79,363 |
| Total | 19,406 (100.0%) | $65,348 |
Family Income by Number of Earners in Merced
The median family income in Merced is $65,348, with families comprising 3+ earners (2,201) having the highest median family income of $113,523, while families with no earners (2,908) have the lowest median family income of $21,547, accounting for 11.3% and 15.0% of families, respectively.
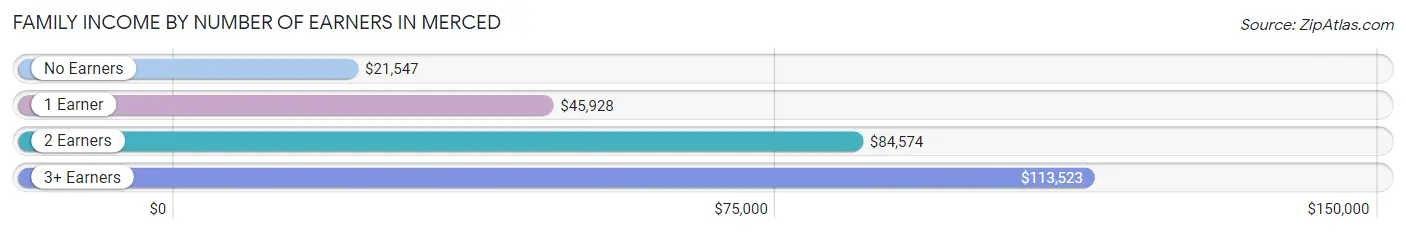
| Number of Earners | # Families | Median Income |
| No Earners | 2,908 (15.0%) | $21,547 |
| 1 Earner | 7,104 (36.6%) | $45,928 |
| 2 Earners | 7,193 (37.1%) | $84,574 |
| 3+ Earners | 2,201 (11.3%) | $113,523 |
| Total | 19,406 (100.0%) | $65,348 |
Household Income in Merced
Household Income Brackets in Merced
With 4,956 households falling in the category, the $50,000 to $74,999 income range is the most frequent in Merced, accounting for 18.3% of all households. In contrast, only 1,408 households (5.2%) fall into the $10,000 to $14,999 income bracket, making it the least populous group.
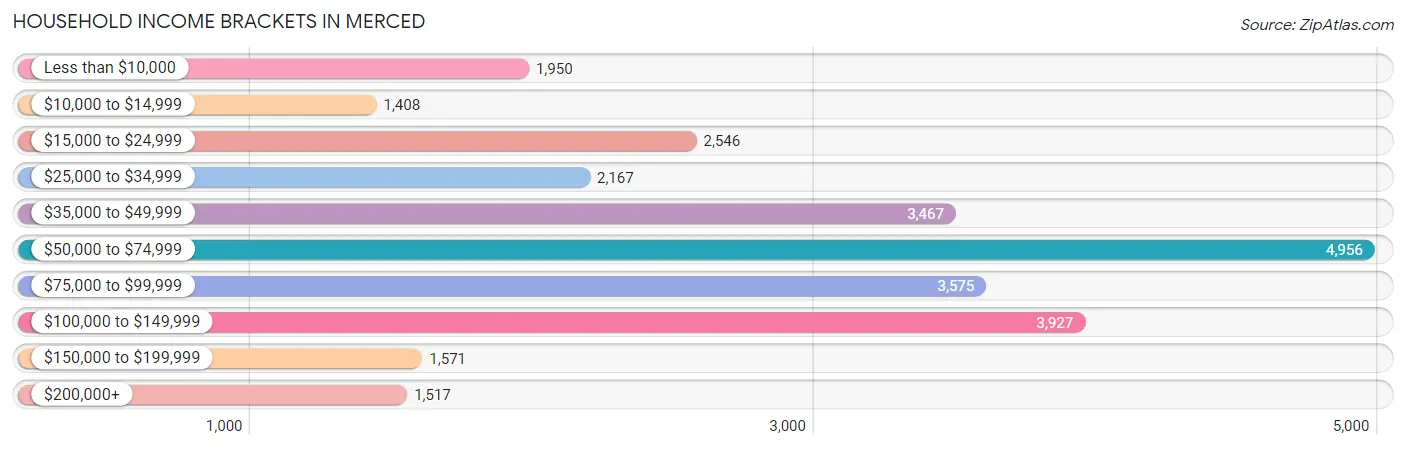
| Income Bracket | # Households | % Households |
| Less than $10,000 | 1,950 | 7.2% |
| $10,000 to $14,999 | 1,408 | 5.2% |
| $15,000 to $24,999 | 2,546 | 9.4% |
| $25,000 to $34,999 | 2,167 | 8.0% |
| $35,000 to $49,999 | 3,467 | 12.8% |
| $50,000 to $74,999 | 4,956 | 18.3% |
| $75,000 to $99,999 | 3,575 | 13.2% |
| $100,000 to $149,999 | 3,927 | 14.5% |
| $150,000 to $199,999 | 1,571 | 5.8% |
| $200,000+ | 1,517 | 5.6% |
Household Income by Householder Age in Merced
The median household income in Merced is $59,233, with the highest median household income of $65,748 found in the 45 to 64 years age bracket for the primary householder. A total of 8,539 households (31.5%) fall into this category. Meanwhile, the 15 to 24 years age bracket for the primary householder has the lowest median household income of $35,938, with 1,722 households (6.4%) in this group.
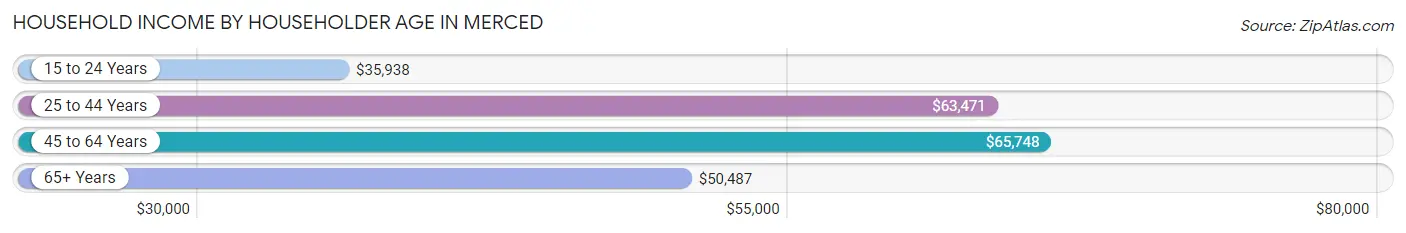
| Income Bracket | # Households | Median Income |
| 15 to 24 Years | 1,722 (6.4%) | $35,938 |
| 25 to 44 Years | 11,381 (42.0%) | $63,471 |
| 45 to 64 Years | 8,539 (31.5%) | $65,748 |
| 65+ Years | 5,442 (20.1%) | $50,487 |
| Total | 27,084 (100.0%) | $59,233 |
Poverty in Merced
Income Below Poverty by Sex and Age in Merced
With 21.9% poverty level for males and 28.4% for females among the residents of Merced, 5 year old males and 15 year old females are the most vulnerable to poverty, with 399 males (53.3%) and 476 females (58.3%) in their respective age groups living below the poverty level.
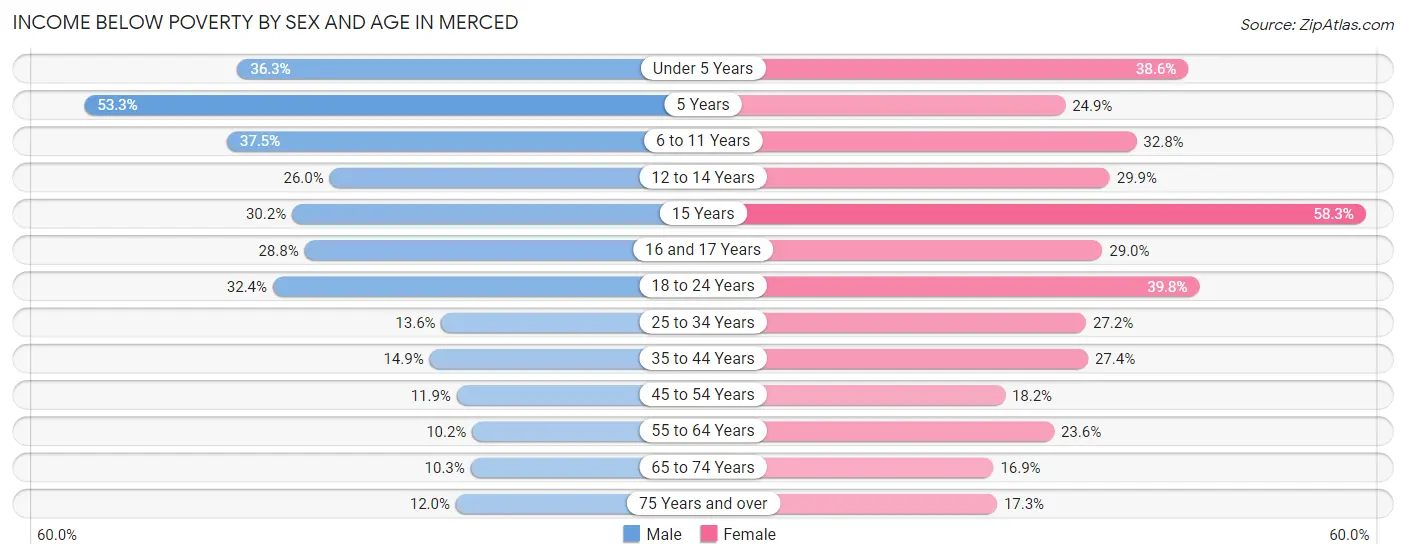
| Age Bracket | Male | Female |
| Under 5 Years | 1,213 (36.3%) | 1,104 (38.6%) |
| 5 Years | 399 (53.3%) | 200 (24.9%) |
| 6 to 11 Years | 1,703 (37.5%) | 1,325 (32.8%) |
| 12 to 14 Years | 543 (26.0%) | 692 (29.8%) |
| 15 Years | 259 (30.2%) | 476 (58.3%) |
| 16 and 17 Years | 369 (28.8%) | 460 (29.0%) |
| 18 to 24 Years | 1,837 (32.4%) | 2,195 (39.8%) |
| 25 to 34 Years | 988 (13.6%) | 1,810 (27.2%) |
| 35 to 44 Years | 805 (14.9%) | 1,492 (27.4%) |
| 45 to 54 Years | 509 (11.9%) | 801 (18.2%) |
| 55 to 64 Years | 377 (10.2%) | 1,025 (23.6%) |
| 65 to 74 Years | 252 (10.3%) | 532 (16.9%) |
| 75 Years and over | 150 (12.0%) | 331 (17.3%) |
| Total | 9,404 (21.9%) | 12,443 (28.4%) |
Income Above Poverty by Sex and Age in Merced
According to the poverty statistics in Merced, males aged 55 to 64 years and females aged 65 to 74 years are the age groups that are most secure financially, with 89.8% of males and 83.1% of females in these age groups living above the poverty line.
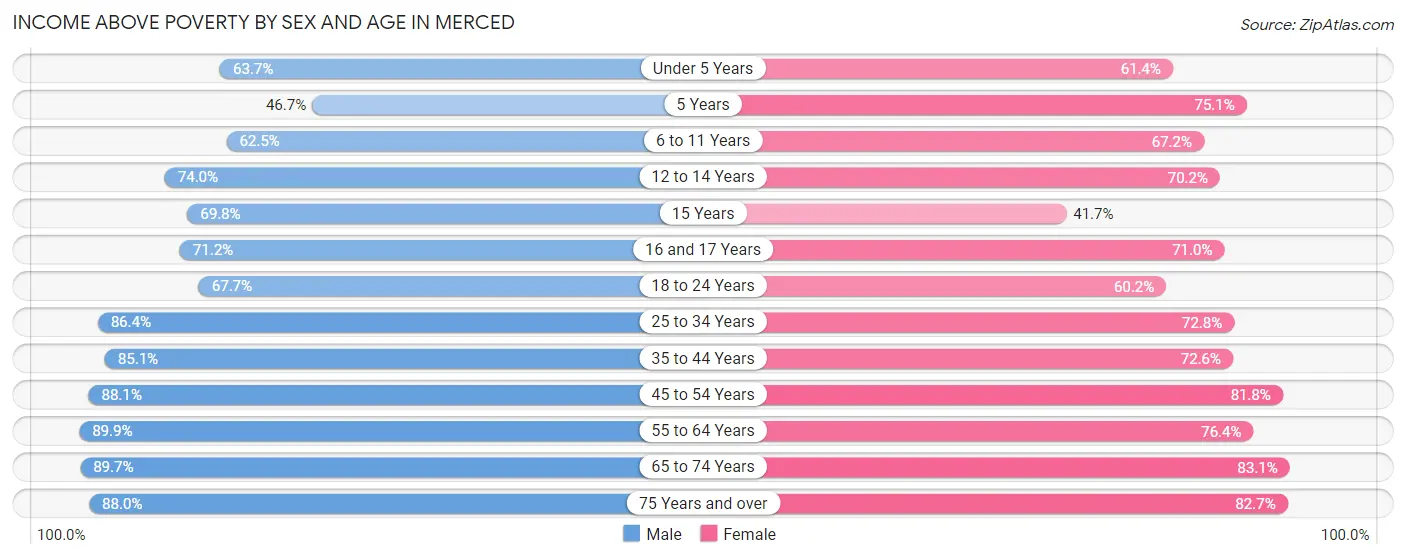
| Age Bracket | Male | Female |
| Under 5 Years | 2,129 (63.7%) | 1,758 (61.4%) |
| 5 Years | 349 (46.7%) | 604 (75.1%) |
| 6 to 11 Years | 2,842 (62.5%) | 2,713 (67.2%) |
| 12 to 14 Years | 1,542 (74.0%) | 1,626 (70.2%) |
| 15 Years | 598 (69.8%) | 340 (41.7%) |
| 16 and 17 Years | 911 (71.2%) | 1,125 (71.0%) |
| 18 to 24 Years | 3,842 (67.6%) | 3,318 (60.2%) |
| 25 to 34 Years | 6,290 (86.4%) | 4,844 (72.8%) |
| 35 to 44 Years | 4,595 (85.1%) | 3,950 (72.6%) |
| 45 to 54 Years | 3,777 (88.1%) | 3,607 (81.8%) |
| 55 to 64 Years | 3,336 (89.8%) | 3,313 (76.4%) |
| 65 to 74 Years | 2,187 (89.7%) | 2,617 (83.1%) |
| 75 Years and over | 1,102 (88.0%) | 1,584 (82.7%) |
| Total | 33,500 (78.1%) | 31,399 (71.6%) |
Income Below Poverty Among Married-Couple Families in Merced
The poverty statistics for married-couple families in Merced show that 8.5% or 943 of the total 11,077 families live below the poverty line. Families with 5 or more children have the highest poverty rate of 22.3%, comprising of 62 families. On the other hand, families with no children have the lowest poverty rate of 4.0%, which includes 214 families.
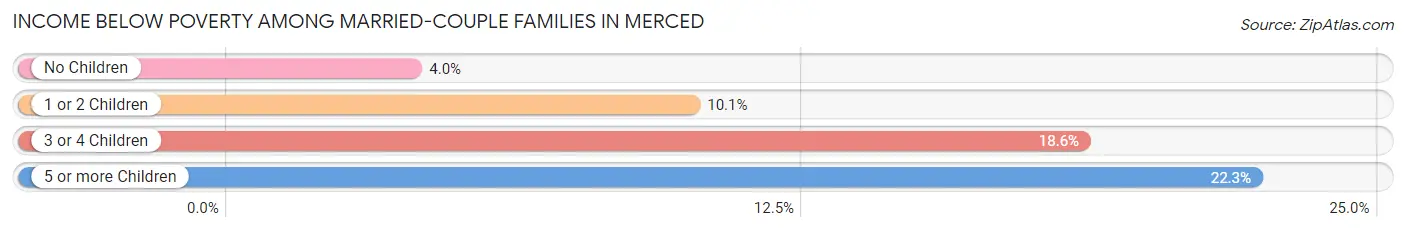
| Children | Above Poverty | Below Poverty |
| No Children | 5,123 (96.0%) | 214 (4.0%) |
| 1 or 2 Children | 3,667 (89.9%) | 410 (10.1%) |
| 3 or 4 Children | 1,128 (81.4%) | 257 (18.6%) |
| 5 or more Children | 216 (77.7%) | 62 (22.3%) |
| Total | 10,134 (91.5%) | 943 (8.5%) |
Income Below Poverty Among Single-Parent Households in Merced
According to the poverty data in Merced, 16.1% or 413 single-father households and 42.8% or 2,469 single-mother households are living below the poverty line. Among single-father households, those with 5 or more children have the highest poverty rate, with 10 households (100.0%) experiencing poverty. Likewise, among single-mother households, those with 5 or more children have the highest poverty rate, with 197 households (98.0%) falling below the poverty line.
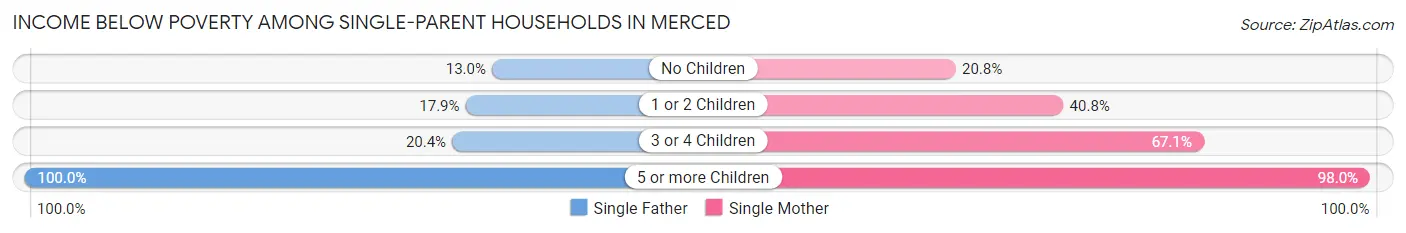
| Children | Single Father | Single Mother |
| No Children | 160 (13.0%) | 297 (20.7%) |
| 1 or 2 Children | 182 (17.9%) | 1,242 (40.8%) |
| 3 or 4 Children | 61 (20.4%) | 733 (67.1%) |
| 5 or more Children | 10 (100.0%) | 197 (98.0%) |
| Total | 413 (16.1%) | 2,469 (42.8%) |
Income Below Poverty Among Married-Couple vs Single-Parent Households in Merced
The poverty data for Merced shows that 943 of the married-couple family households (8.5%) and 2,882 of the single-parent households (34.6%) are living below the poverty level. Within the married-couple family households, those with 5 or more children have the highest poverty rate, with 62 households (22.3%) falling below the poverty line. Among the single-parent households, those with 5 or more children have the highest poverty rate, with 207 household (98.1%) living below poverty.
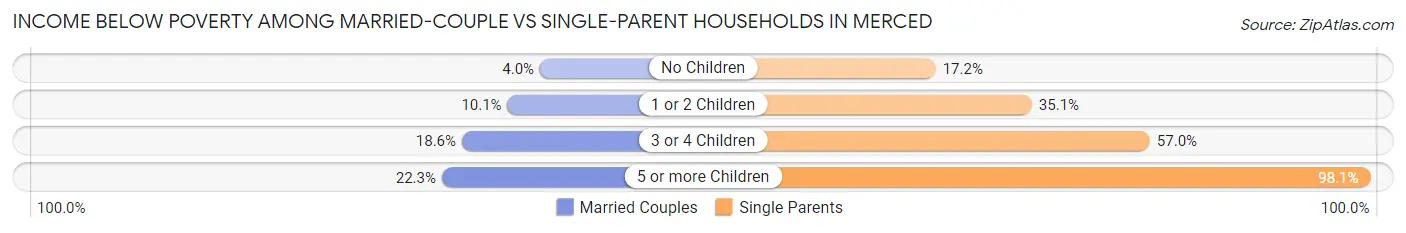
| Children | Married-Couple Families | Single-Parent Households |
| No Children | 214 (4.0%) | 457 (17.2%) |
| 1 or 2 Children | 410 (10.1%) | 1,424 (35.1%) |
| 3 or 4 Children | 257 (18.6%) | 794 (57.0%) |
| 5 or more Children | 62 (22.3%) | 207 (98.1%) |
| Total | 943 (8.5%) | 2,882 (34.6%) |
Race in Merced
The most populous races in Merced are Hispanic or Latino (51,782 | 59.1%), White / Caucasian (33,439 | 38.1%), and Some other Race (31,307 | 35.7%).
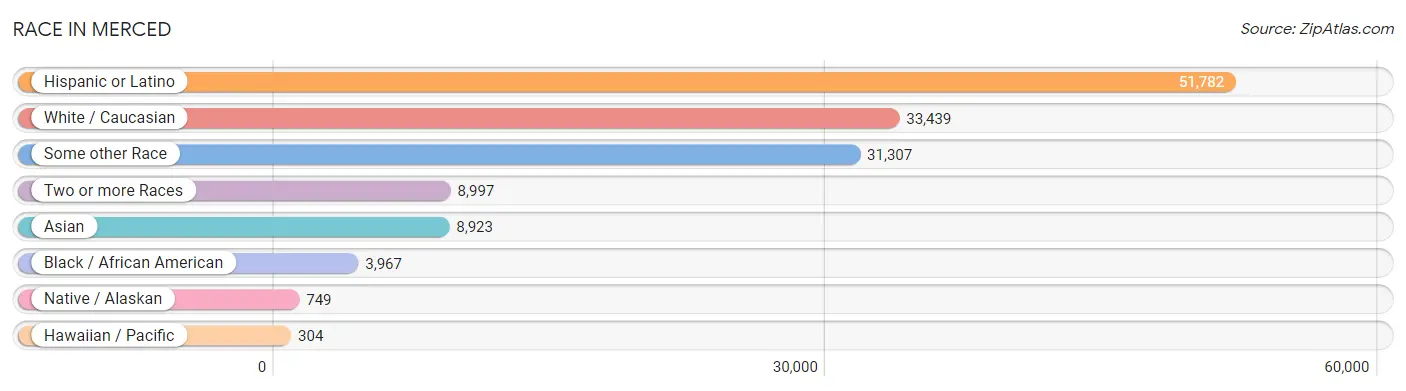
| Race | # Population | % Population |
| Asian | 8,923 | 10.2% |
| Black / African American | 3,967 | 4.5% |
| Hawaiian / Pacific | 304 | 0.4% |
| Hispanic or Latino | 51,782 | 59.1% |
| Native / Alaskan | 749 | 0.9% |
| White / Caucasian | 33,439 | 38.1% |
| Two or more Races | 8,997 | 10.3% |
| Some other Race | 31,307 | 35.7% |
| Total | 87,686 | 100.0% |
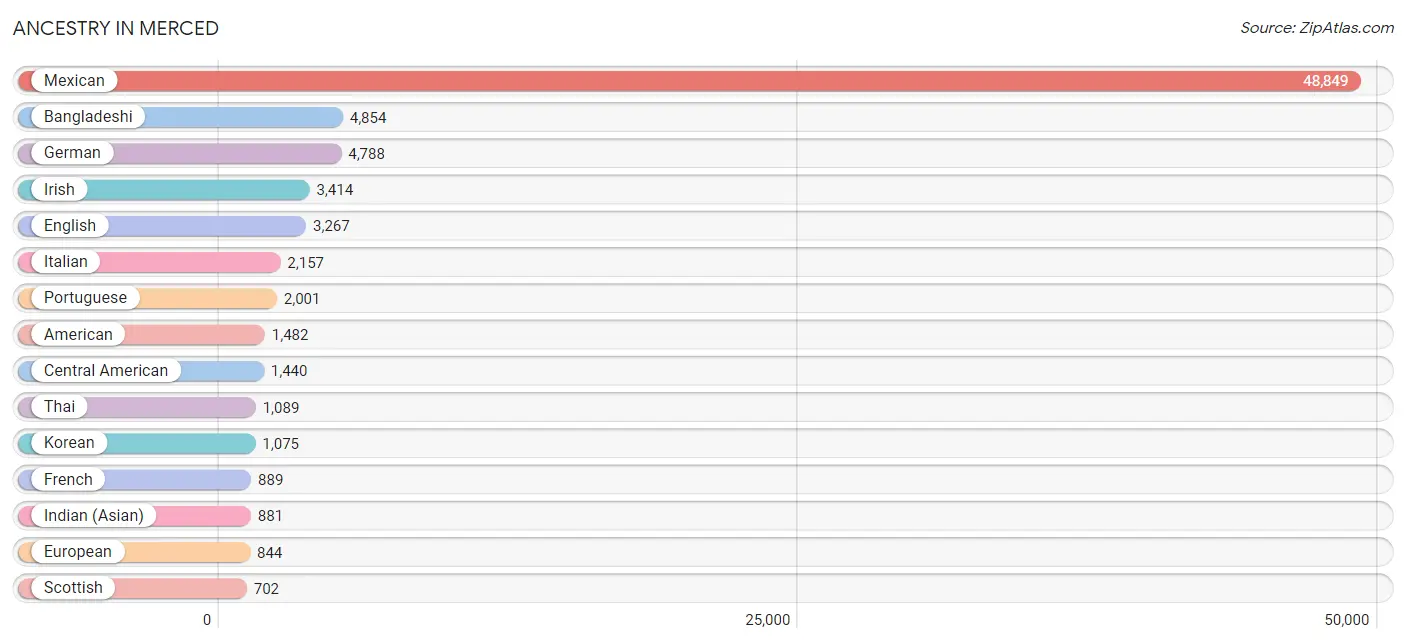
Ancestry in Merced
The most populous ancestries reported in Merced are Mexican (48,849 | 55.7%), Bangladeshi (4,854 | 5.5%), German (4,788 | 5.5%), Irish (3,414 | 3.9%), and English (3,267 | 3.7%), together accounting for 74.3% of all Merced residents.
| Ancestry | # Population | % Population |
| African | 108 | 0.1% |
| Aleut | 11 | 0.0% |
| American | 1,482 | 1.7% |
| Apache | 47 | 0.1% |
| Arab | 464 | 0.5% |
| Armenian | 43 | 0.1% |
| Australian | 61 | 0.1% |
| Austrian | 32 | 0.0% |
| Bangladeshi | 4,854 | 5.5% |
| Basque | 34 | 0.0% |
| Belgian | 5 | 0.0% |
| Bhutanese | 358 | 0.4% |
| Blackfeet | 35 | 0.0% |
| Bolivian | 1 | 0.0% |
| British | 209 | 0.2% |
| Burmese | 385 | 0.4% |
| Cajun | 14 | 0.0% |
| Cambodian | 21 | 0.0% |
| Canadian | 83 | 0.1% |
| Central American | 1,440 | 1.6% |
| Central American Indian | 19 | 0.0% |
| Cherokee | 377 | 0.4% |
| Cheyenne | 7 | 0.0% |
| Chilean | 5 | 0.0% |
| Chippewa | 21 | 0.0% |
| Choctaw | 77 | 0.1% |
| Colombian | 72 | 0.1% |
| Costa Rican | 418 | 0.5% |
| Creek | 26 | 0.0% |
| Croatian | 20 | 0.0% |
| Cuban | 117 | 0.1% |
| Czech | 31 | 0.0% |
| Czechoslovakian | 21 | 0.0% |
| Danish | 221 | 0.3% |
| Dutch | 456 | 0.5% |
| Dutch West Indian | 52 | 0.1% |
| Eastern European | 7 | 0.0% |
| Egyptian | 8 | 0.0% |
| English | 3,267 | 3.7% |
| Ethiopian | 9 | 0.0% |
| European | 844 | 1.0% |
| Fijian | 34 | 0.0% |
| Filipino | 30 | 0.0% |
| Finnish | 22 | 0.0% |
| French | 889 | 1.0% |
| French Canadian | 26 | 0.0% |
| German | 4,788 | 5.5% |
| German Russian | 44 | 0.1% |
| Greek | 34 | 0.0% |
| Guamanian / Chamorro | 9 | 0.0% |
| Guatemalan | 166 | 0.2% |
| Haitian | 4 | 0.0% |
| Honduran | 67 | 0.1% |
| Hungarian | 147 | 0.2% |
| Indian (Asian) | 881 | 1.0% |
| Iranian | 22 | 0.0% |
| Irish | 3,414 | 3.9% |
| Italian | 2,157 | 2.5% |
| Jamaican | 7 | 0.0% |
| Japanese | 79 | 0.1% |
| Jordanian | 2 | 0.0% |
| Korean | 1,075 | 1.2% |
| Laotian | 21 | 0.0% |
| Lebanese | 85 | 0.1% |
| Lithuanian | 45 | 0.1% |
| Malaysian | 498 | 0.6% |
| Mexican | 48,849 | 55.7% |
| Mexican American Indian | 252 | 0.3% |
| Mongolian | 10 | 0.0% |
| Native Hawaiian | 93 | 0.1% |
| Navajo | 33 | 0.0% |
| Nepalese | 489 | 0.6% |
| Nicaraguan | 71 | 0.1% |
| Northern European | 40 | 0.1% |
| Norwegian | 211 | 0.2% |
| Pakistani | 49 | 0.1% |
| Palestinian | 5 | 0.0% |
| Panamanian | 36 | 0.0% |
| Pennsylvania German | 9 | 0.0% |
| Peruvian | 24 | 0.0% |
| Polish | 258 | 0.3% |
| Portuguese | 2,001 | 2.3% |
| Potawatomi | 12 | 0.0% |
| Pueblo | 75 | 0.1% |
| Puerto Rican | 215 | 0.3% |
| Russian | 173 | 0.2% |
| Salvadoran | 675 | 0.8% |
| Samoan | 76 | 0.1% |
| Scandinavian | 114 | 0.1% |
| Scotch-Irish | 286 | 0.3% |
| Scottish | 702 | 0.8% |
| Serbian | 23 | 0.0% |
| Slavic | 3 | 0.0% |
| Slovene | 15 | 0.0% |
| Somali | 18 | 0.0% |
| South African | 18 | 0.0% |
| South American | 161 | 0.2% |
| South American Indian | 24 | 0.0% |
| Spaniard | 358 | 0.4% |
| Spanish | 147 | 0.2% |
| Sri Lankan | 416 | 0.5% |
| Subsaharan African | 161 | 0.2% |
| Swedish | 230 | 0.3% |
| Swiss | 33 | 0.0% |
| Syrian | 5 | 0.0% |
| Taiwanese | 35 | 0.0% |
| Thai | 1,089 | 1.2% |
| Tohono O'Odham | 7 | 0.0% |
| Turkish | 35 | 0.0% |
| Ukrainian | 29 | 0.0% |
| Uruguayan | 36 | 0.0% |
| Venezuelan | 23 | 0.0% |
| Vietnamese | 2 | 0.0% |
| Welsh | 256 | 0.3% |
| Yaqui | 256 | 0.3% |
| Yugoslavian | 44 | 0.1% | View All 116 Rows |
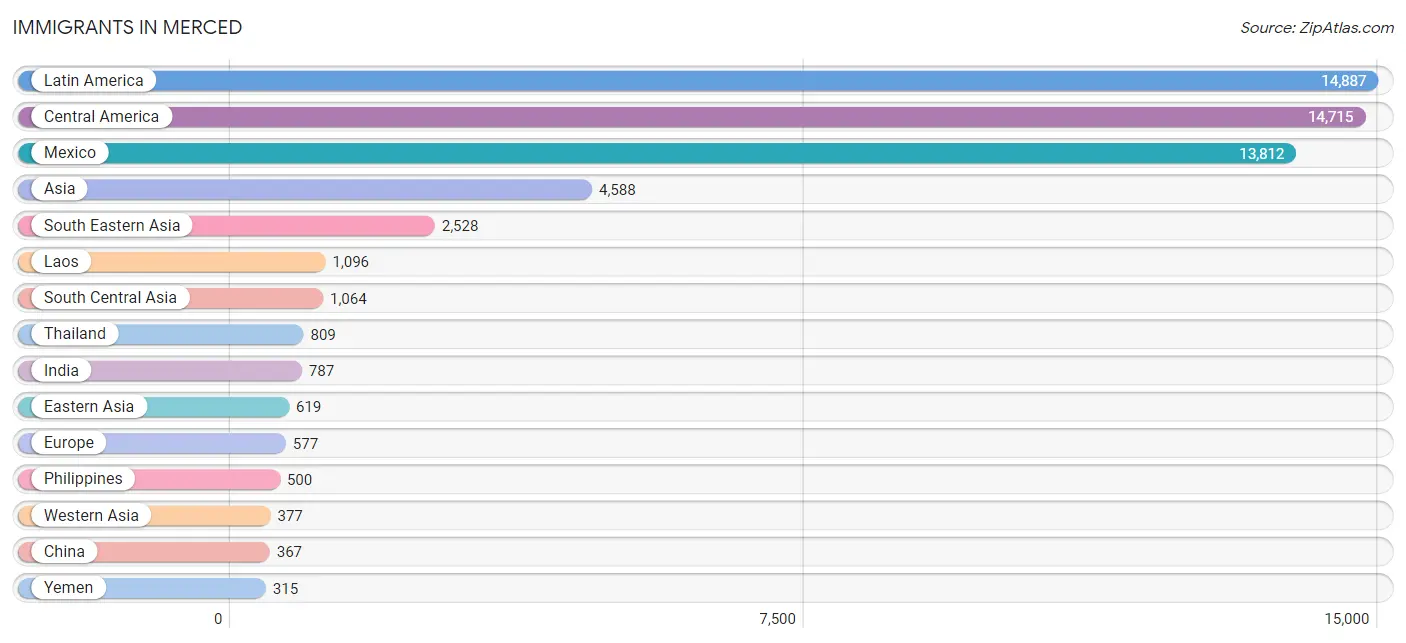
Immigrants in Merced
The most numerous immigrant groups reported in Merced came from Latin America (14,887 | 17.0%), Central America (14,715 | 16.8%), Mexico (13,812 | 15.8%), Asia (4,588 | 5.2%), and South Eastern Asia (2,528 | 2.9%), together accounting for 57.6% of all Merced residents.
| Immigration Origin | # Population | % Population |
| Afghanistan | 16 | 0.0% |
| Africa | 69 | 0.1% |
| Armenia | 9 | 0.0% |
| Asia | 4,588 | 5.2% |
| Azores | 40 | 0.1% |
| Bangladesh | 2 | 0.0% |
| Belgium | 4 | 0.0% |
| Brazil | 31 | 0.0% |
| Canada | 42 | 0.1% |
| Central America | 14,715 | 16.8% |
| Chile | 5 | 0.0% |
| China | 367 | 0.4% |
| Colombia | 53 | 0.1% |
| Costa Rica | 241 | 0.3% |
| Denmark | 5 | 0.0% |
| Eastern Africa | 26 | 0.0% |
| Eastern Asia | 619 | 0.7% |
| Eastern Europe | 61 | 0.1% |
| Egypt | 13 | 0.0% |
| El Salvador | 300 | 0.3% |
| England | 96 | 0.1% |
| Europe | 577 | 0.7% |
| Fiji | 63 | 0.1% |
| France | 11 | 0.0% |
| Germany | 111 | 0.1% |
| Guatemala | 246 | 0.3% |
| Honduras | 74 | 0.1% |
| India | 787 | 0.9% |
| Indonesia | 6 | 0.0% |
| Iran | 80 | 0.1% |
| Ireland | 11 | 0.0% |
| Italy | 9 | 0.0% |
| Japan | 75 | 0.1% |
| Jordan | 2 | 0.0% |
| Korea | 156 | 0.2% |
| Laos | 1,096 | 1.3% |
| Latin America | 14,887 | 17.0% |
| Latvia | 41 | 0.1% |
| Lebanon | 16 | 0.0% |
| Malaysia | 6 | 0.0% |
| Mexico | 13,812 | 15.8% |
| Netherlands | 9 | 0.0% |
| Nicaragua | 29 | 0.0% |
| Northern Africa | 18 | 0.0% |
| Northern Europe | 280 | 0.3% |
| Oceania | 163 | 0.2% |
| Pakistan | 179 | 0.2% |
| Panama | 13 | 0.0% |
| Peru | 24 | 0.0% |
| Philippines | 500 | 0.6% |
| Portugal | 68 | 0.1% |
| Russia | 8 | 0.0% |
| Scotland | 40 | 0.1% |
| Somalia | 18 | 0.0% |
| South Africa | 25 | 0.0% |
| South America | 172 | 0.2% |
| South Central Asia | 1,064 | 1.2% |
| South Eastern Asia | 2,528 | 2.9% |
| Southern Europe | 101 | 0.1% |
| Spain | 24 | 0.0% |
| Sweden | 114 | 0.1% |
| Taiwan | 56 | 0.1% |
| Thailand | 809 | 0.9% |
| Turkey | 35 | 0.0% |
| Ukraine | 12 | 0.0% |
| Uruguay | 36 | 0.0% |
| Venezuela | 23 | 0.0% |
| Vietnam | 111 | 0.1% |
| Western Asia | 377 | 0.4% |
| Western Europe | 135 | 0.2% |
| Yemen | 315 | 0.4% | View All 71 Rows |
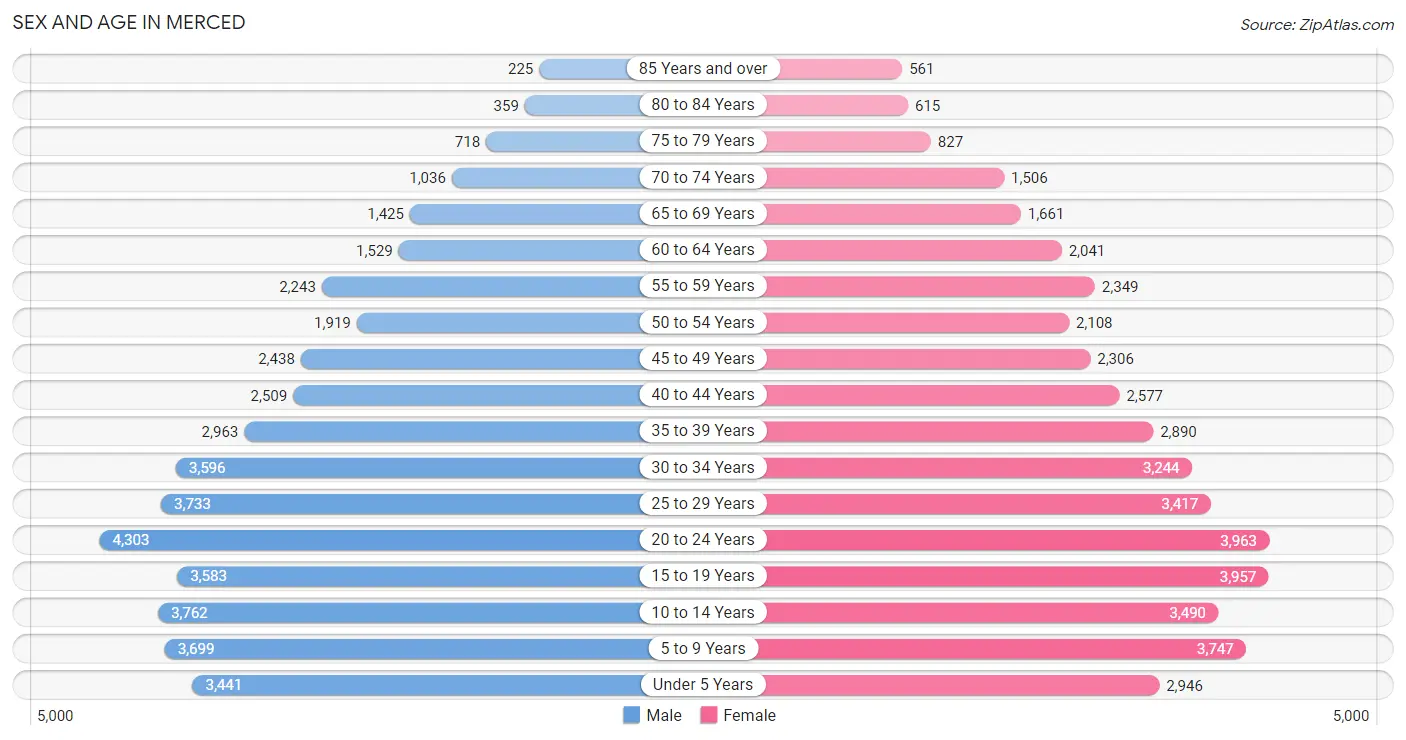
Sex and Age in Merced
Sex and Age in Merced
The most populous age groups in Merced are 20 to 24 Years (4,303 | 9.9%) for men and 20 to 24 Years (3,963 | 9.0%) for women.
| Age Bracket | Male | Female |
| Under 5 Years | 3,441 (7.9%) | 2,946 (6.7%) |
| 5 to 9 Years | 3,699 (8.5%) | 3,747 (8.5%) |
| 10 to 14 Years | 3,762 (8.6%) | 3,490 (7.9%) |
| 15 to 19 Years | 3,583 (8.2%) | 3,957 (8.9%) |
| 20 to 24 Years | 4,303 (9.9%) | 3,963 (9.0%) |
| 25 to 29 Years | 3,733 (8.6%) | 3,417 (7.7%) |
| 30 to 34 Years | 3,596 (8.3%) | 3,244 (7.3%) |
| 35 to 39 Years | 2,963 (6.8%) | 2,890 (6.5%) |
| 40 to 44 Years | 2,509 (5.8%) | 2,577 (5.8%) |
| 45 to 49 Years | 2,438 (5.6%) | 2,306 (5.2%) |
| 50 to 54 Years | 1,919 (4.4%) | 2,108 (4.8%) |
| 55 to 59 Years | 2,243 (5.2%) | 2,349 (5.3%) |
| 60 to 64 Years | 1,529 (3.5%) | 2,041 (4.6%) |
| 65 to 69 Years | 1,425 (3.3%) | 1,661 (3.8%) |
| 70 to 74 Years | 1,036 (2.4%) | 1,506 (3.4%) |
| 75 to 79 Years | 718 (1.7%) | 827 (1.9%) |
| 80 to 84 Years | 359 (0.8%) | 615 (1.4%) |
| 85 Years and over | 225 (0.5%) | 561 (1.3%) |
| Total | 43,481 (100.0%) | 44,205 (100.0%) |
Families and Households in Merced
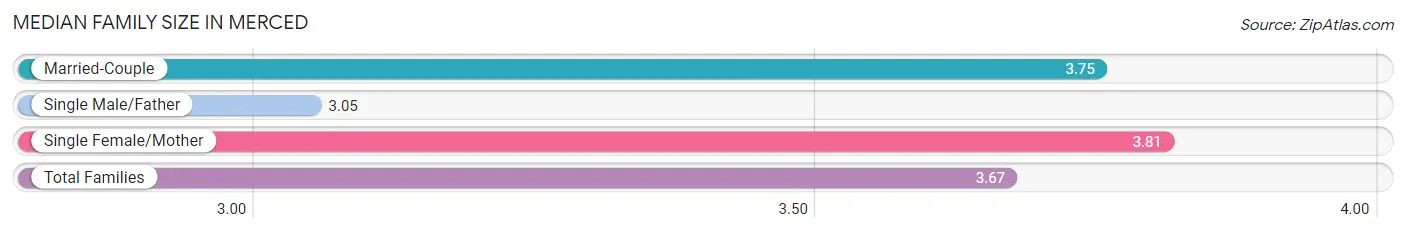
Median Family Size in Merced
The median family size in Merced is 3.67 persons per family, with single female/mother families (5,770 | 29.7%) accounting for the largest median family size of 3.81 persons per family. On the other hand, single male/father families (2,559 | 13.2%) represent the smallest median family size with 3.05 persons per family.
| Family Type | # Families | Family Size |
| Married-Couple | 11,077 (57.1%) | 3.75 |
| Single Male/Father | 2,559 (13.2%) | 3.05 |
| Single Female/Mother | 5,770 (29.7%) | 3.81 |
| Total Families | 19,406 (100.0%) | 3.67 |
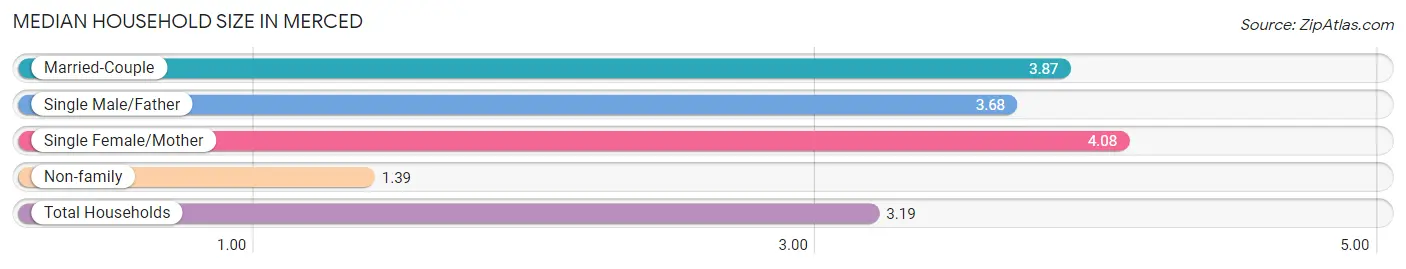
Median Household Size in Merced
The median household size in Merced is 3.19 persons per household, with single female/mother households (5,770 | 21.3%) accounting for the largest median household size of 4.08 persons per household. non-family households (7,678 | 28.3%) represent the smallest median household size with 1.39 persons per household.
| Household Type | # Households | Household Size |
| Married-Couple | 11,077 (40.9%) | 3.87 |
| Single Male/Father | 2,559 (9.5%) | 3.68 |
| Single Female/Mother | 5,770 (21.3%) | 4.08 |
| Non-family | 7,678 (28.3%) | 1.39 |
| Total Households | 27,084 (100.0%) | 3.19 |
Household Size by Marriage Status in Merced
Out of a total of 27,084 households in Merced, 19,406 (71.7%) are family households, while 7,678 (28.3%) are nonfamily households. The most numerous type of family households are 2-person households, comprising 6,024, and the most common type of nonfamily households are 1-person households, comprising 5,962.
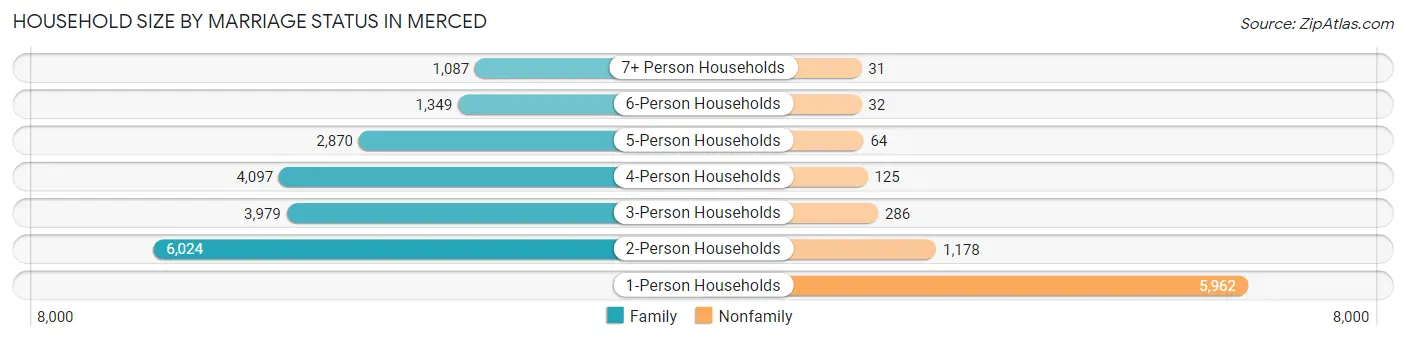
| Household Size | Family Households | Nonfamily Households |
| 1-Person Households | - | 5,962 (22.0%) |
| 2-Person Households | 6,024 (22.2%) | 1,178 (4.3%) |
| 3-Person Households | 3,979 (14.7%) | 286 (1.1%) |
| 4-Person Households | 4,097 (15.1%) | 125 (0.5%) |
| 5-Person Households | 2,870 (10.6%) | 64 (0.2%) |
| 6-Person Households | 1,349 (5.0%) | 32 (0.1%) |
| 7+ Person Households | 1,087 (4.0%) | 31 (0.1%) |
| Total | 19,406 (71.7%) | 7,678 (28.3%) |
Female Fertility in Merced
Fertility by Age in Merced
Average fertility rate in Merced is 64.0 births per 1,000 women. Women in the age bracket of 20 to 34 years have the highest fertility rate with 111.0 births per 1,000 women. Women in the age bracket of 20 to 34 years acount for 80.3% of all women with births.
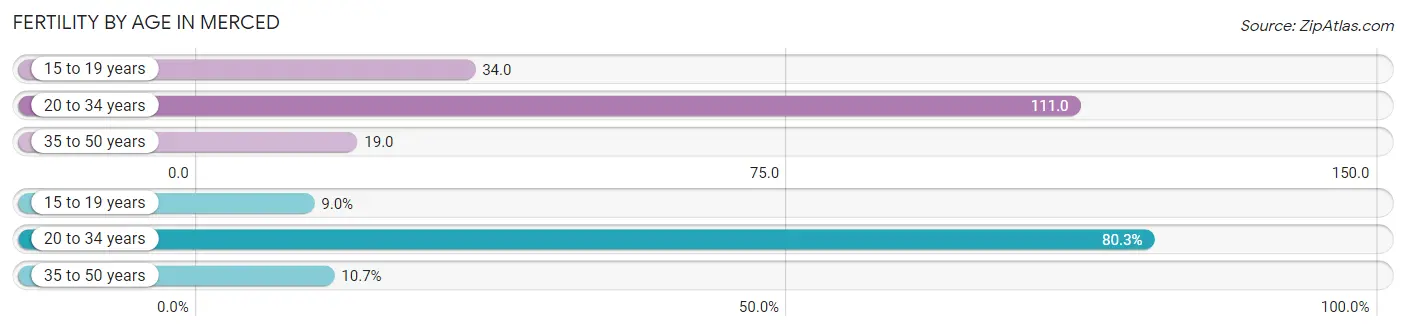
| Age Bracket | Women with Births | Births / 1,000 Women |
| 15 to 19 years | 133 (9.0%) | 34.0 |
| 20 to 34 years | 1,183 (80.3%) | 111.0 |
| 35 to 50 years | 158 (10.7%) | 19.0 |
| Total | 1,474 (100.0%) | 64.0 |
Fertility by Age by Marriage Status in Merced
50.5% of women with births (1,474) in Merced are married. The highest percentage of unmarried women with births falls into 15 to 19 years age bracket with 100.0% of them unmarried at the time of birth, while the lowest percentage of unmarried women with births belong to 35 to 50 years age bracket with 24.1% of them unmarried.
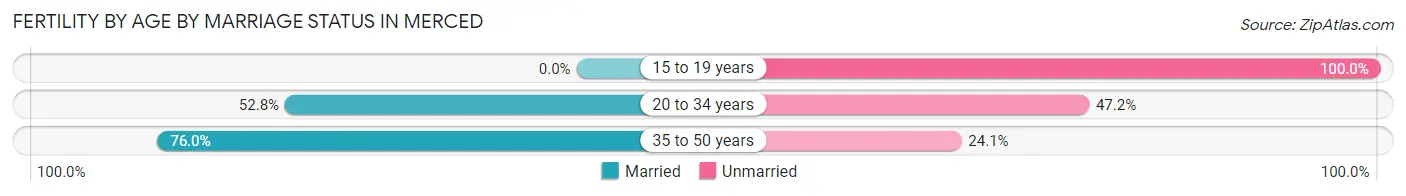
| Age Bracket | Married | Unmarried |
| 15 to 19 years | 0 (0.0%) | 133 (100.0%) |
| 20 to 34 years | 625 (52.8%) | 558 (47.2%) |
| 35 to 50 years | 120 (75.9%) | 38 (24.0%) |
| Total | 744 (50.5%) | 730 (49.5%) |
Fertility by Education in Merced
Average fertility rate in Merced is 64.0 births per 1,000 women. Women with the education attainment of college or associate's degree have the highest fertility rate of 88.0 births per 1,000 women, while women with the education attainment of less than high school have the lowest fertility at 19.0 births per 1,000 women. Women with the education attainment of college or associate's degree represent 53.3% of all women with births.
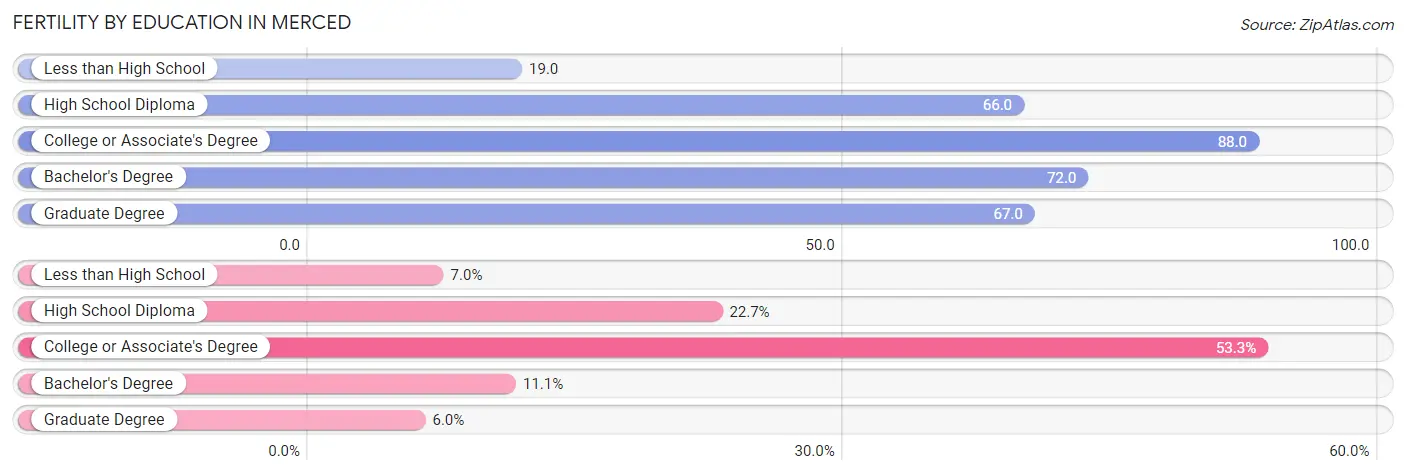
| Educational Attainment | Women with Births | Births / 1,000 Women |
| Less than High School | 103 (7.0%) | 19.0 |
| High School Diploma | 334 (22.7%) | 66.0 |
| College or Associate's Degree | 786 (53.3%) | 88.0 |
| Bachelor's Degree | 163 (11.1%) | 72.0 |
| Graduate Degree | 88 (6.0%) | 67.0 |
| Total | 1,474 (100.0%) | 64.0 |
Fertility by Education by Marriage Status in Merced
49.5% of women with births in Merced are unmarried. Women with the educational attainment of bachelor's degree are most likely to be married with 87.7% of them married at childbirth, while women with the educational attainment of high school diploma are least likely to be married with 73.1% of them unmarried at childbirth.
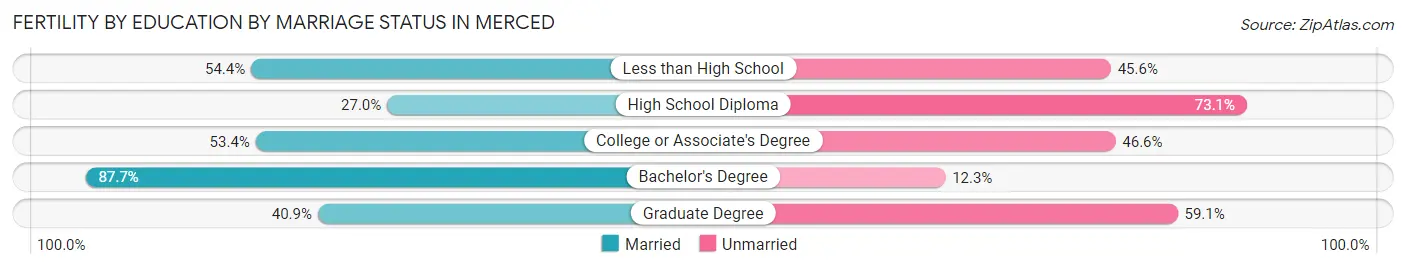
| Educational Attainment | Married | Unmarried |
| Less than High School | 56 (54.4%) | 47 (45.6%) |
| High School Diploma | 90 (27.0%) | 244 (73.1%) |
| College or Associate's Degree | 420 (53.4%) | 366 (46.6%) |
| Bachelor's Degree | 143 (87.7%) | 20 (12.3%) |
| Graduate Degree | 36 (40.9%) | 52 (59.1%) |
| Total | 744 (50.5%) | 730 (49.5%) |
Employment Characteristics in Merced
Employment by Class of Employer in Merced
Among the 33,087 employed individuals in Merced, private company employees (21,963 | 66.4%), local government employees (4,556 | 13.8%), and state government employees (2,108 | 6.4%) make up the most common classes of employment.
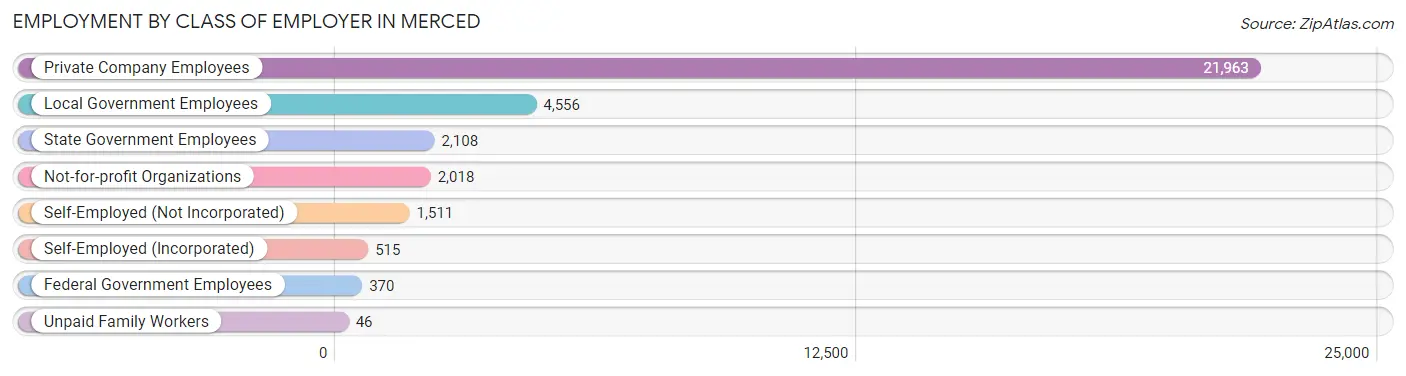
| Employer Class | # Employees | % Employees |
| Private Company Employees | 21,963 | 66.4% |
| Self-Employed (Incorporated) | 515 | 1.6% |
| Self-Employed (Not Incorporated) | 1,511 | 4.6% |
| Not-for-profit Organizations | 2,018 | 6.1% |
| Local Government Employees | 4,556 | 13.8% |
| State Government Employees | 2,108 | 6.4% |
| Federal Government Employees | 370 | 1.1% |
| Unpaid Family Workers | 46 | 0.1% |
| Total | 33,087 | 100.0% |
Employment Status by Age in Merced
According to the labor force statistics for Merced, out of the total population over 16 years of age (64,923), 60.9% or 39,538 individuals are in the labor force, with 12.6% or 4,982 of them unemployed. The age group with the highest labor force participation rate is 25 to 29 years, with 81.5% or 5,827 individuals in the labor force. Within the labor force, the 16 to 19 years age range has the highest percentage of unemployed individuals, with 36.2% or 596 of them being unemployed.
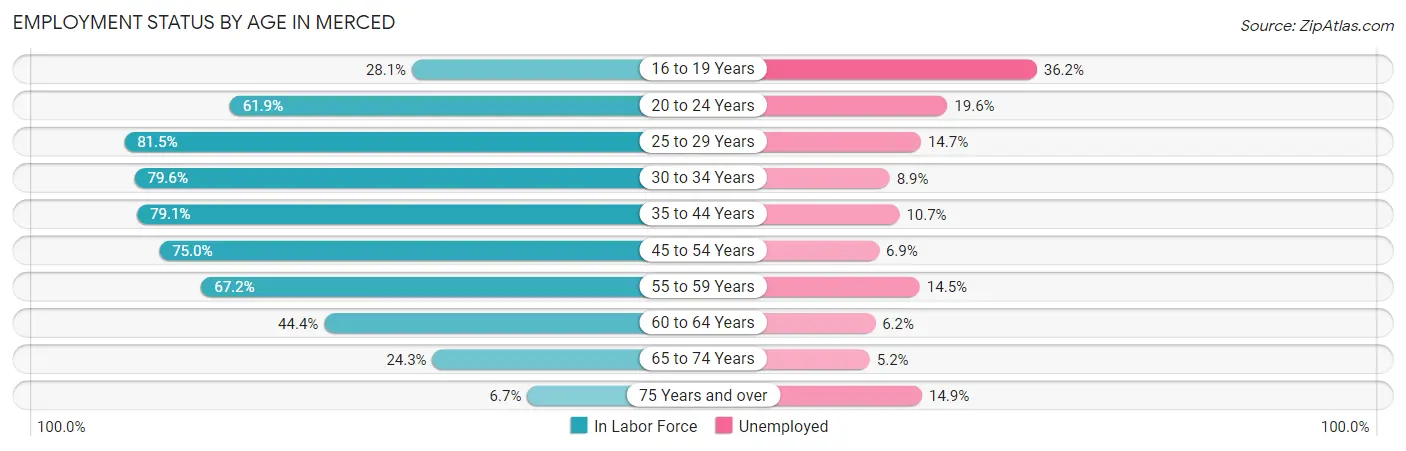
| Age Bracket | In Labor Force | Unemployed |
| 16 to 19 Years | 1,647 (28.1%) | 596 (36.2%) |
| 20 to 24 Years | 5,117 (61.9%) | 1,003 (19.6%) |
| 25 to 29 Years | 5,827 (81.5%) | 857 (14.7%) |
| 30 to 34 Years | 5,445 (79.6%) | 485 (8.9%) |
| 35 to 44 Years | 8,653 (79.1%) | 926 (10.7%) |
| 45 to 54 Years | 6,578 (75.0%) | 454 (6.9%) |
| 55 to 59 Years | 3,086 (67.2%) | 447 (14.5%) |
| 60 to 64 Years | 1,585 (44.4%) | 98 (6.2%) |
| 65 to 74 Years | 1,368 (24.3%) | 71 (5.2%) |
| 75 Years and over | 221 (6.7%) | 33 (14.9%) |
| Total | 39,538 (60.9%) | 4,982 (12.6%) |
Employment Status by Educational Attainment in Merced
According to labor force statistics for Merced, 74.5% of individuals (31,187) out of the total population between 25 and 64 years of age (41,862) are in the labor force, with 10.5% or 3,275 of them being unemployed. The group with the highest labor force participation rate are those with the educational attainment of bachelor's degree or higher, with 86.5% or 5,968 individuals in the labor force. Within the labor force, individuals with less than high school education have the highest percentage of unemployment, with 16.8% or 1,034 of them being unemployed.
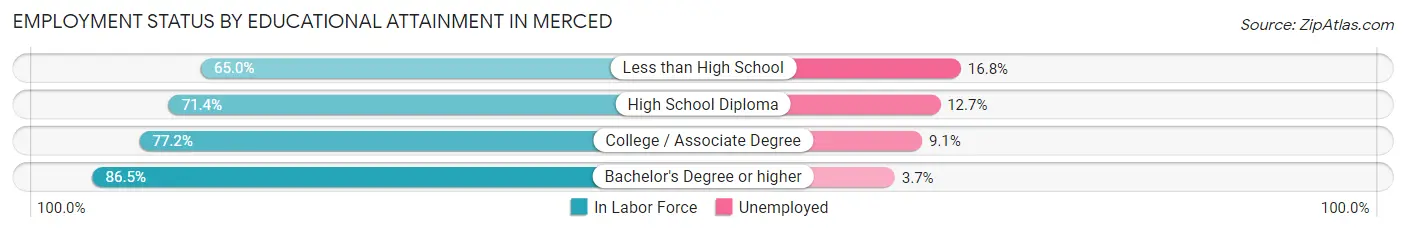
| Educational Attainment | In Labor Force | Unemployed |
| Less than High School | 6,157 (65.0%) | 1,591 (16.8%) |
| High School Diploma | 7,787 (71.4%) | 1,385 (12.7%) |
| College / Associate Degree | 11,259 (77.2%) | 1,327 (9.1%) |
| Bachelor's Degree or higher | 5,968 (86.5%) | 255 (3.7%) |
| Total | 31,187 (74.5%) | 4,396 (10.5%) |
Employment Occupations by Sex in Merced
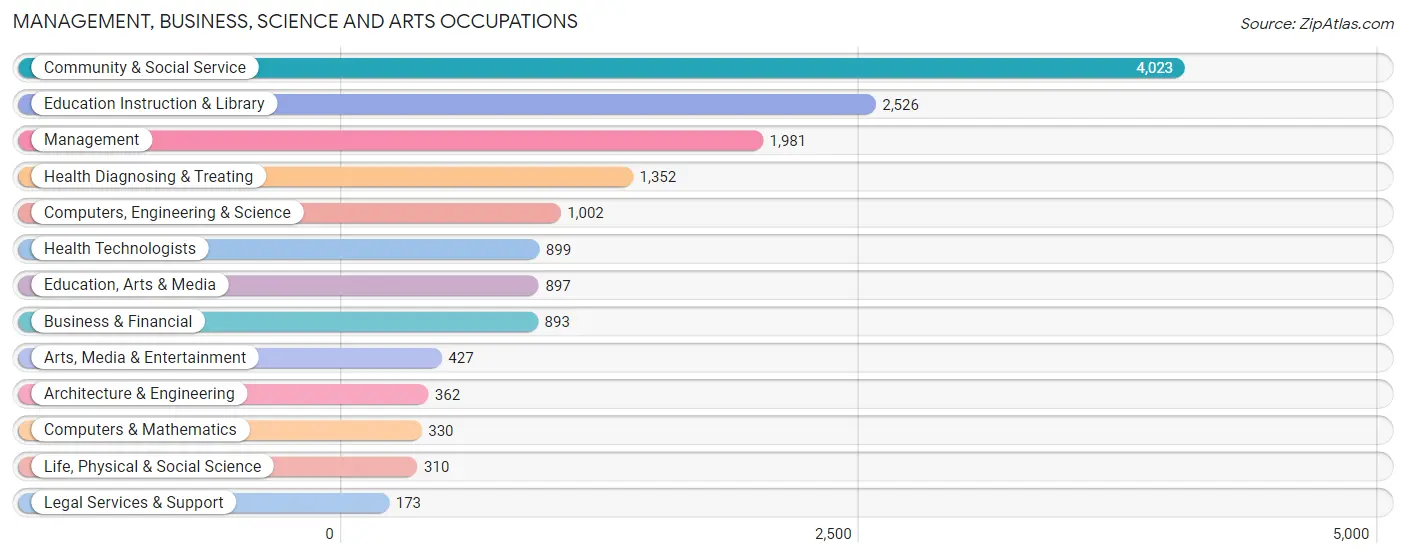
Management, Business, Science and Arts Occupations
The most common Management, Business, Science and Arts occupations in Merced are Community & Social Service (4,023 | 11.7%), Education Instruction & Library (2,526 | 7.3%), Management (1,981 | 5.7%), Health Diagnosing & Treating (1,352 | 3.9%), and Computers, Engineering & Science (1,002 | 2.9%).
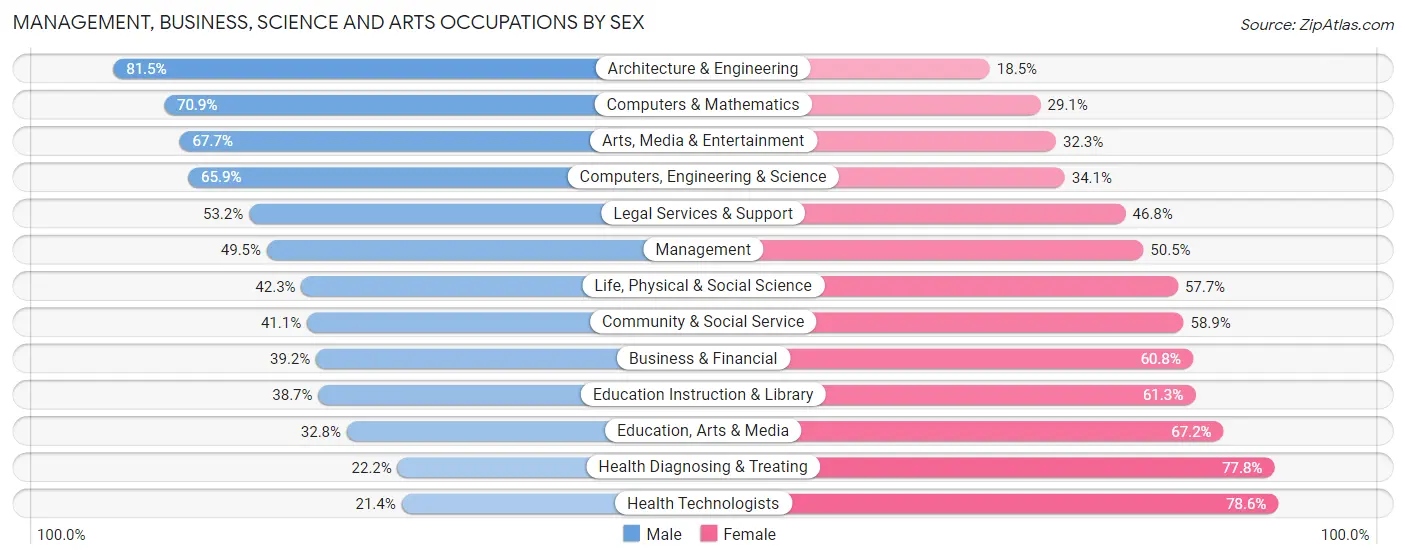
Management, Business, Science and Arts Occupations by Sex
Within the Management, Business, Science and Arts occupations in Merced, the most male-oriented occupations are Architecture & Engineering (81.5%), Computers & Mathematics (70.9%), and Arts, Media & Entertainment (67.7%), while the most female-oriented occupations are Health Technologists (78.6%), Health Diagnosing & Treating (77.8%), and Education, Arts & Media (67.2%).
| Occupation | Male | Female |
| Management | 980 (49.5%) | 1,001 (50.5%) |
| Business & Financial | 350 (39.2%) | 543 (60.8%) |
| Computers, Engineering & Science | 660 (65.9%) | 342 (34.1%) |
| Computers & Mathematics | 234 (70.9%) | 96 (29.1%) |
| Architecture & Engineering | 295 (81.5%) | 67 (18.5%) |
| Life, Physical & Social Science | 131 (42.3%) | 179 (57.7%) |
| Community & Social Service | 1,653 (41.1%) | 2,370 (58.9%) |
| Education, Arts & Media | 294 (32.8%) | 603 (67.2%) |
| Legal Services & Support | 92 (53.2%) | 81 (46.8%) |
| Education Instruction & Library | 978 (38.7%) | 1,548 (61.3%) |
| Arts, Media & Entertainment | 289 (67.7%) | 138 (32.3%) |
| Health Diagnosing & Treating | 300 (22.2%) | 1,052 (77.8%) |
| Health Technologists | 192 (21.4%) | 707 (78.6%) |
| Total (Category) | 3,943 (42.6%) | 5,308 (57.4%) |
| Total (Overall) | 19,879 (57.6%) | 14,650 (42.4%) |
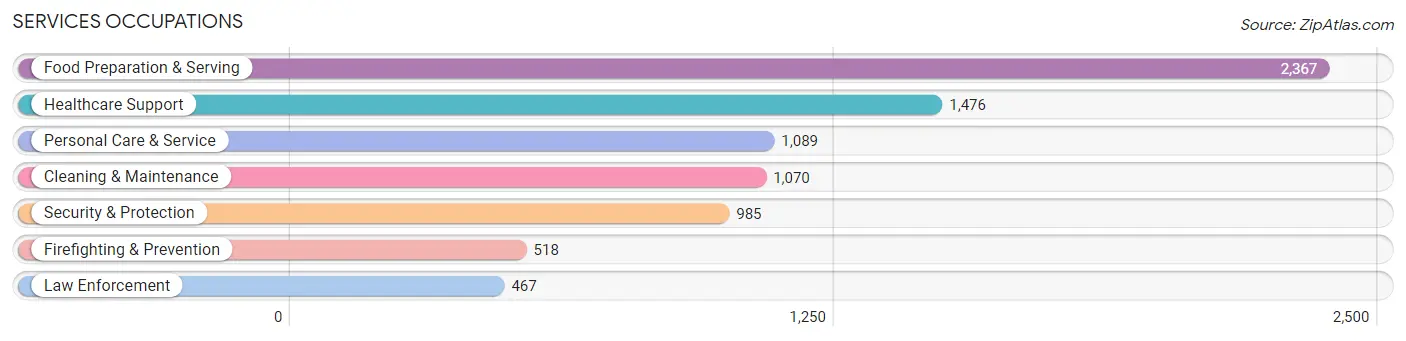
Services Occupations
The most common Services occupations in Merced are Food Preparation & Serving (2,367 | 6.9%), Healthcare Support (1,476 | 4.3%), Personal Care & Service (1,089 | 3.2%), Cleaning & Maintenance (1,070 | 3.1%), and Security & Protection (985 | 2.9%).
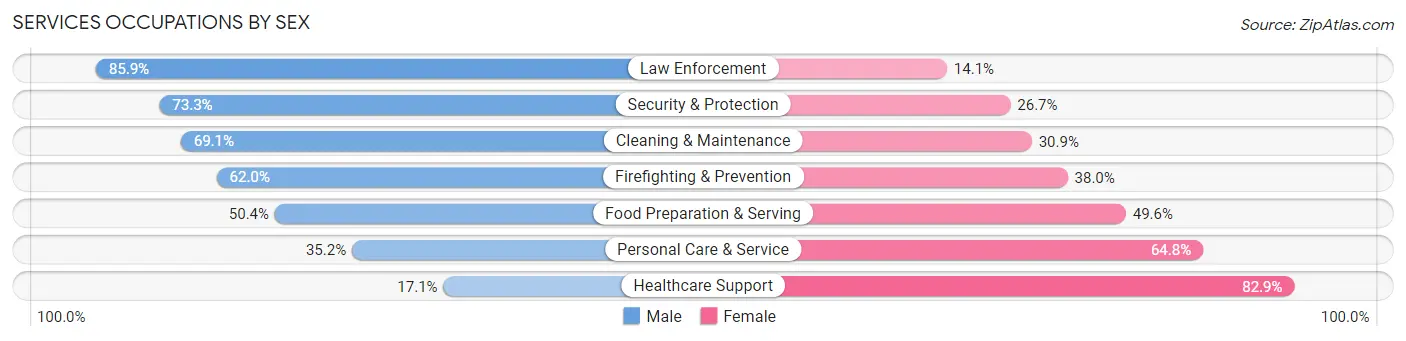
Services Occupations by Sex
Within the Services occupations in Merced, the most male-oriented occupations are Law Enforcement (85.9%), Security & Protection (73.3%), and Cleaning & Maintenance (69.1%), while the most female-oriented occupations are Healthcare Support (82.9%), Personal Care & Service (64.8%), and Food Preparation & Serving (49.6%).
| Occupation | Male | Female |
| Healthcare Support | 252 (17.1%) | 1,224 (82.9%) |
| Security & Protection | 722 (73.3%) | 263 (26.7%) |
| Firefighting & Prevention | 321 (62.0%) | 197 (38.0%) |
| Law Enforcement | 401 (85.9%) | 66 (14.1%) |
| Food Preparation & Serving | 1,194 (50.4%) | 1,173 (49.6%) |
| Cleaning & Maintenance | 739 (69.1%) | 331 (30.9%) |
| Personal Care & Service | 383 (35.2%) | 706 (64.8%) |
| Total (Category) | 3,290 (47.1%) | 3,697 (52.9%) |
| Total (Overall) | 19,879 (57.6%) | 14,650 (42.4%) |
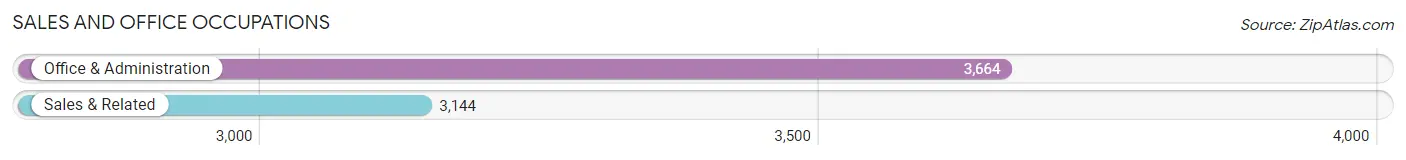
Sales and Office Occupations
The most common Sales and Office occupations in Merced are Office & Administration (3,664 | 10.6%), and Sales & Related (3,144 | 9.1%).
Sales and Office Occupations by Sex
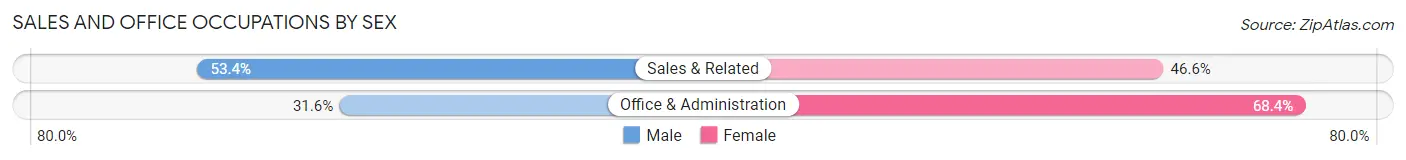
| Occupation | Male | Female |
| Sales & Related | 1,678 (53.4%) | 1,466 (46.6%) |
| Office & Administration | 1,159 (31.6%) | 2,505 (68.4%) |
| Total (Category) | 2,837 (41.7%) | 3,971 (58.3%) |
| Total (Overall) | 19,879 (57.6%) | 14,650 (42.4%) |
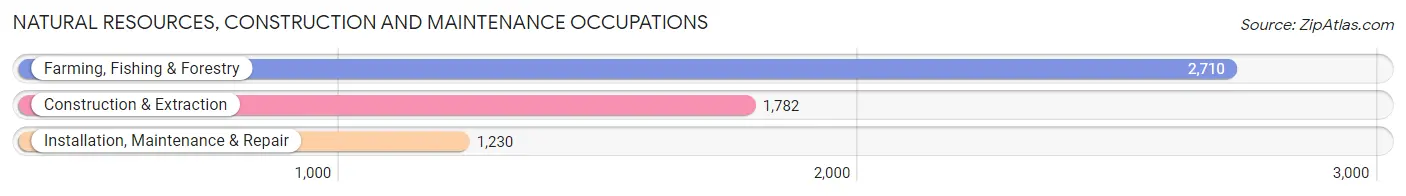
Natural Resources, Construction and Maintenance Occupations
The most common Natural Resources, Construction and Maintenance occupations in Merced are Farming, Fishing & Forestry (2,710 | 7.9%), Construction & Extraction (1,782 | 5.2%), and Installation, Maintenance & Repair (1,230 | 3.6%).
Natural Resources, Construction and Maintenance Occupations by Sex
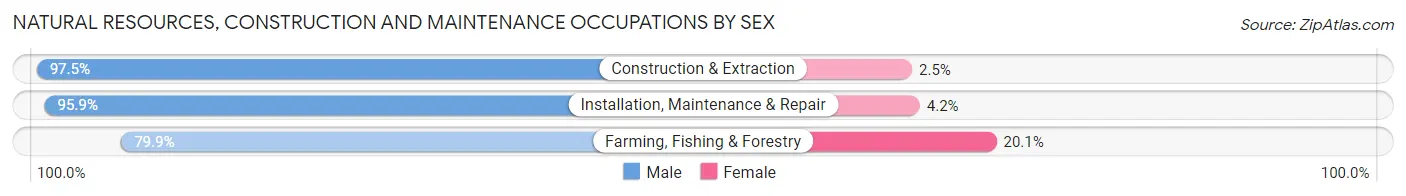
| Occupation | Male | Female |
| Farming, Fishing & Forestry | 2,165 (79.9%) | 545 (20.1%) |
| Construction & Extraction | 1,737 (97.5%) | 45 (2.5%) |
| Installation, Maintenance & Repair | 1,179 (95.9%) | 51 (4.2%) |
| Total (Category) | 5,081 (88.8%) | 641 (11.2%) |
| Total (Overall) | 19,879 (57.6%) | 14,650 (42.4%) |
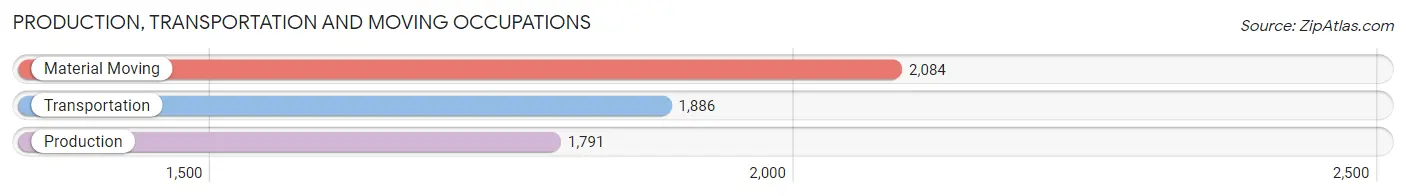
Production, Transportation and Moving Occupations
The most common Production, Transportation and Moving occupations in Merced are Material Moving (2,084 | 6.0%), Transportation (1,886 | 5.5%), and Production (1,791 | 5.2%).
Production, Transportation and Moving Occupations by Sex
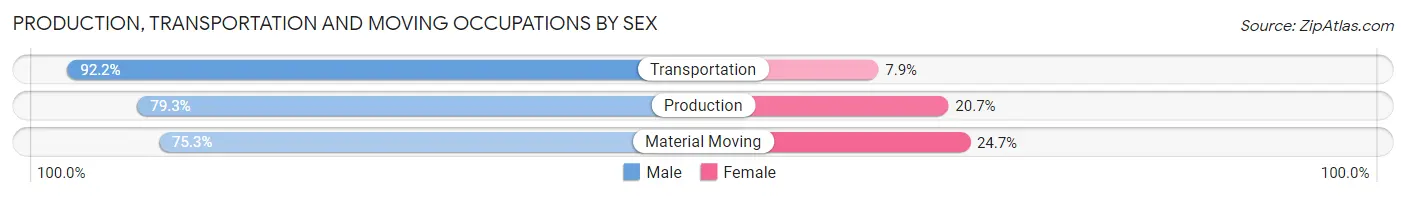
| Occupation | Male | Female |
| Production | 1,420 (79.3%) | 371 (20.7%) |
| Transportation | 1,738 (92.1%) | 148 (7.9%) |
| Material Moving | 1,570 (75.3%) | 514 (24.7%) |
| Total (Category) | 4,728 (82.1%) | 1,033 (17.9%) |
| Total (Overall) | 19,879 (57.6%) | 14,650 (42.4%) |
Employment Industries by Sex in Merced
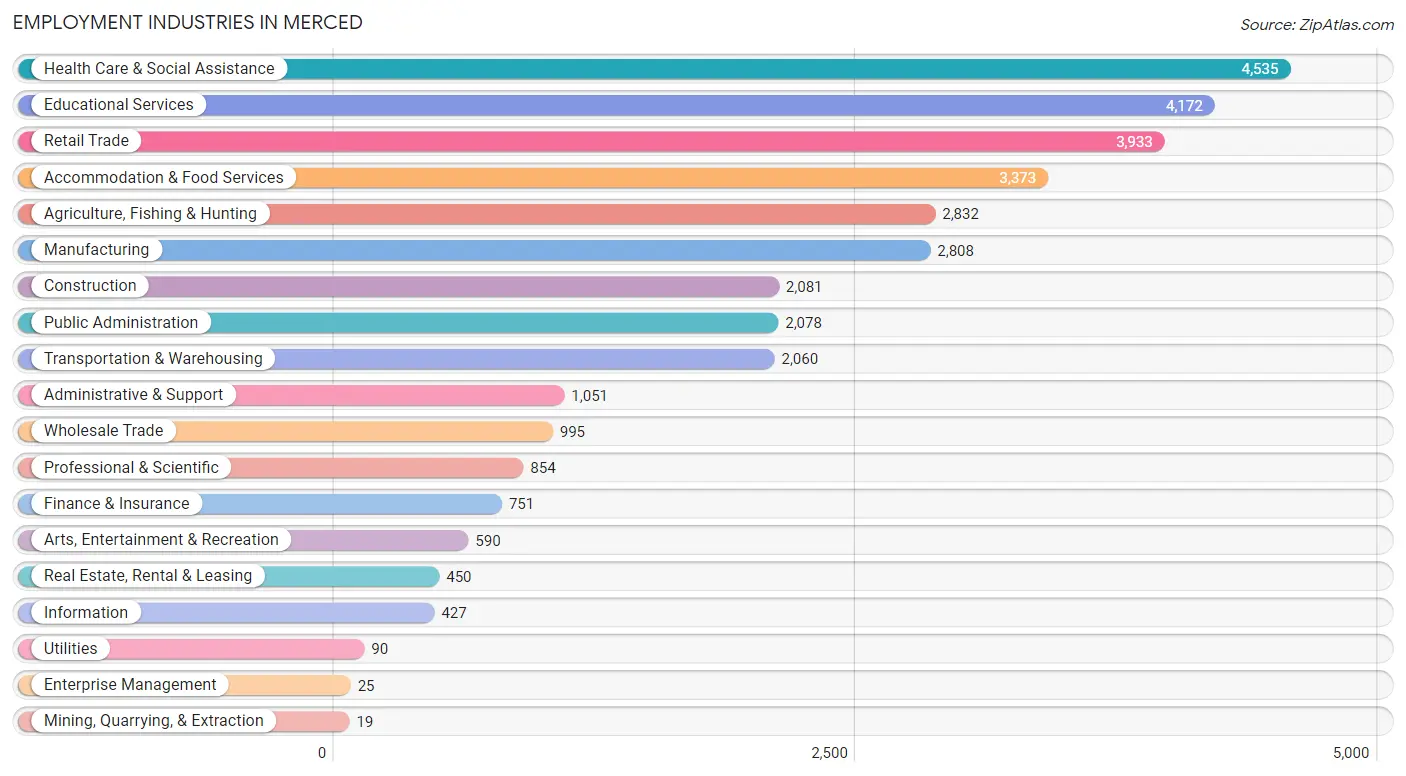
Employment Industries in Merced
The major employment industries in Merced include Health Care & Social Assistance (4,535 | 13.1%), Educational Services (4,172 | 12.1%), Retail Trade (3,933 | 11.4%), Accommodation & Food Services (3,373 | 9.8%), and Agriculture, Fishing & Hunting (2,832 | 8.2%).
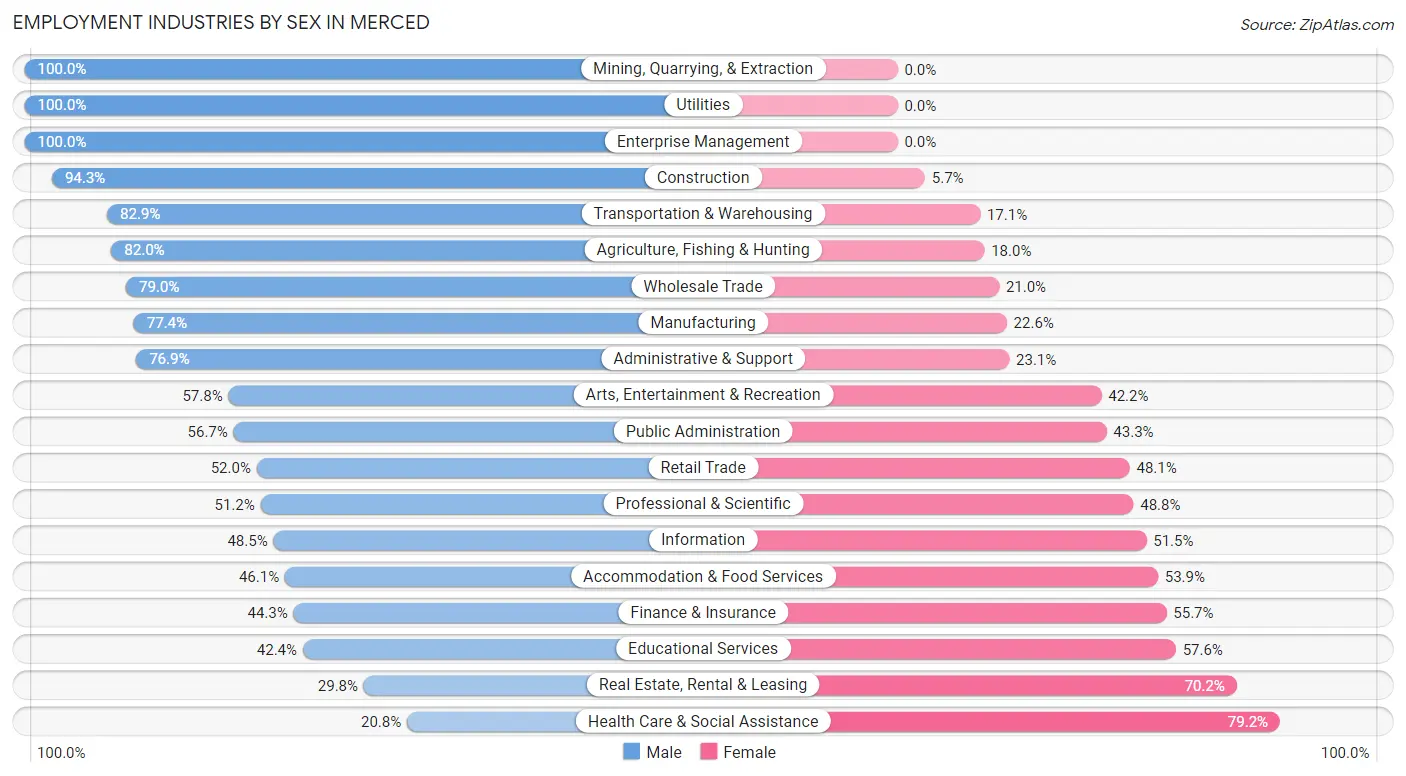
Employment Industries by Sex in Merced
The Merced industries that see more men than women are Mining, Quarrying, & Extraction (100.0%), Utilities (100.0%), and Enterprise Management (100.0%), whereas the industries that tend to have a higher number of women are Health Care & Social Assistance (79.2%), Real Estate, Rental & Leasing (70.2%), and Educational Services (57.6%).
| Industry | Male | Female |
| Agriculture, Fishing & Hunting | 2,323 (82.0%) | 509 (18.0%) |
| Mining, Quarrying, & Extraction | 19 (100.0%) | 0 (0.0%) |
| Construction | 1,963 (94.3%) | 118 (5.7%) |
| Manufacturing | 2,173 (77.4%) | 635 (22.6%) |
| Wholesale Trade | 786 (79.0%) | 209 (21.0%) |
| Retail Trade | 2,043 (51.9%) | 1,890 (48.0%) |
| Transportation & Warehousing | 1,708 (82.9%) | 352 (17.1%) |
| Utilities | 90 (100.0%) | 0 (0.0%) |
| Information | 207 (48.5%) | 220 (51.5%) |
| Finance & Insurance | 333 (44.3%) | 418 (55.7%) |
| Real Estate, Rental & Leasing | 134 (29.8%) | 316 (70.2%) |
| Professional & Scientific | 437 (51.2%) | 417 (48.8%) |
| Enterprise Management | 25 (100.0%) | 0 (0.0%) |
| Administrative & Support | 808 (76.9%) | 243 (23.1%) |
| Educational Services | 1,769 (42.4%) | 2,403 (57.6%) |
| Health Care & Social Assistance | 945 (20.8%) | 3,590 (79.2%) |
| Arts, Entertainment & Recreation | 341 (57.8%) | 249 (42.2%) |
| Accommodation & Food Services | 1,555 (46.1%) | 1,818 (53.9%) |
| Public Administration | 1,179 (56.7%) | 899 (43.3%) |
| Total | 19,879 (57.6%) | 14,650 (42.4%) |
Education in Merced
School Enrollment in Merced
The most common levels of schooling among the 28,454 students in Merced are college / undergraduate (7,427 | 26.1%), high school (6,133 | 21.5%), and elementary school (5,816 | 20.4%).
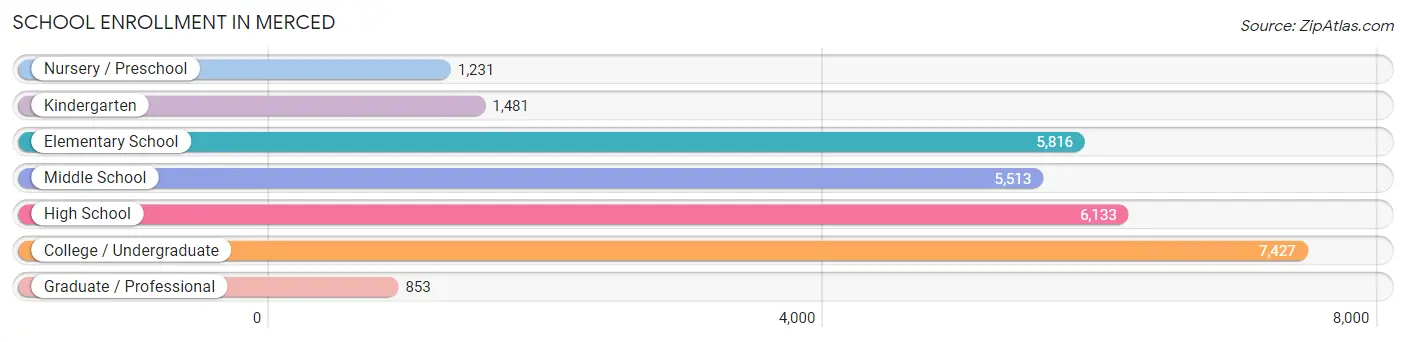
| School Level | # Students | % Students |
| Nursery / Preschool | 1,231 | 4.3% |
| Kindergarten | 1,481 | 5.2% |
| Elementary School | 5,816 | 20.4% |
| Middle School | 5,513 | 19.4% |
| High School | 6,133 | 21.5% |
| College / Undergraduate | 7,427 | 26.1% |
| Graduate / Professional | 853 | 3.0% |
| Total | 28,454 | 100.0% |
School Enrollment by Age by Funding Source in Merced
Out of a total of 28,454 students who are enrolled in schools in Merced, 1,480 (5.2%) attend a private institution, while the remaining 26,974 (94.8%) are enrolled in public schools. The age group of 3 to 4 year olds has the highest likelihood of being enrolled in private schools, with 205 (21.0% in the age bracket) enrolled. Conversely, the age group of 15 to 17 year olds has the lowest likelihood of being enrolled in a private school, with 4,379 (97.4% in the age bracket) attending a public institution.
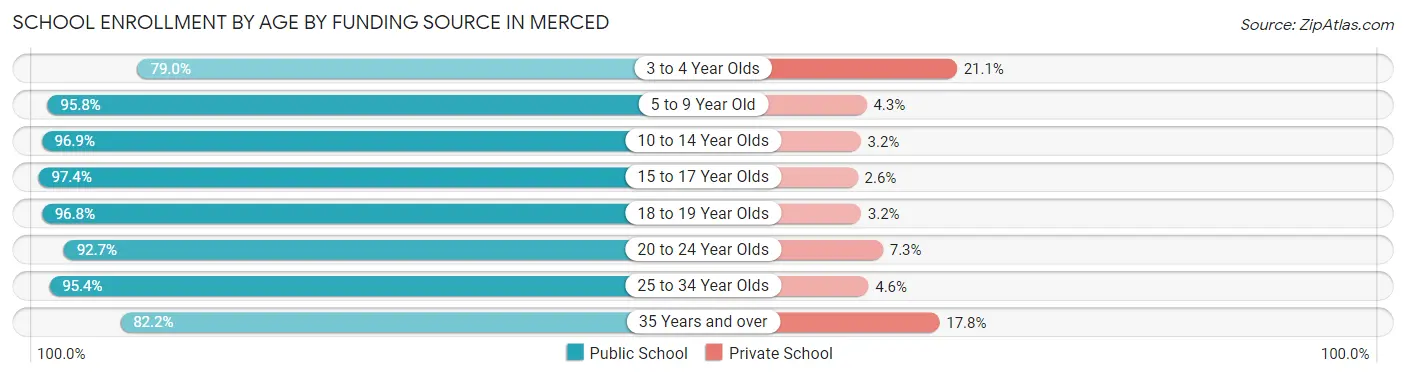
| Age Bracket | Public School | Private School |
| 3 to 4 Year Olds | 769 (78.9%) | 205 (21.0%) |
| 5 to 9 Year Old | 6,822 (95.8%) | 303 (4.3%) |
| 10 to 14 Year Olds | 6,925 (96.9%) | 225 (3.2%) |
| 15 to 17 Year Olds | 4,379 (97.4%) | 117 (2.6%) |
| 18 to 19 Year Olds | 1,903 (96.8%) | 63 (3.2%) |
| 20 to 24 Year Olds | 3,651 (92.7%) | 287 (7.3%) |
| 25 to 34 Year Olds | 1,664 (95.4%) | 80 (4.6%) |
| 35 Years and over | 872 (82.2%) | 189 (17.8%) |
| Total | 26,974 (94.8%) | 1,480 (5.2%) |
Educational Attainment by Field of Study in Merced
Education (1,235 | 13.6%), social sciences (986 | 10.8%), business (956 | 10.5%), liberal arts & history (942 | 10.3%), and arts & humanities (725 | 8.0%) are the most common fields of study among 9,117 individuals in Merced who have obtained a bachelor's degree or higher.
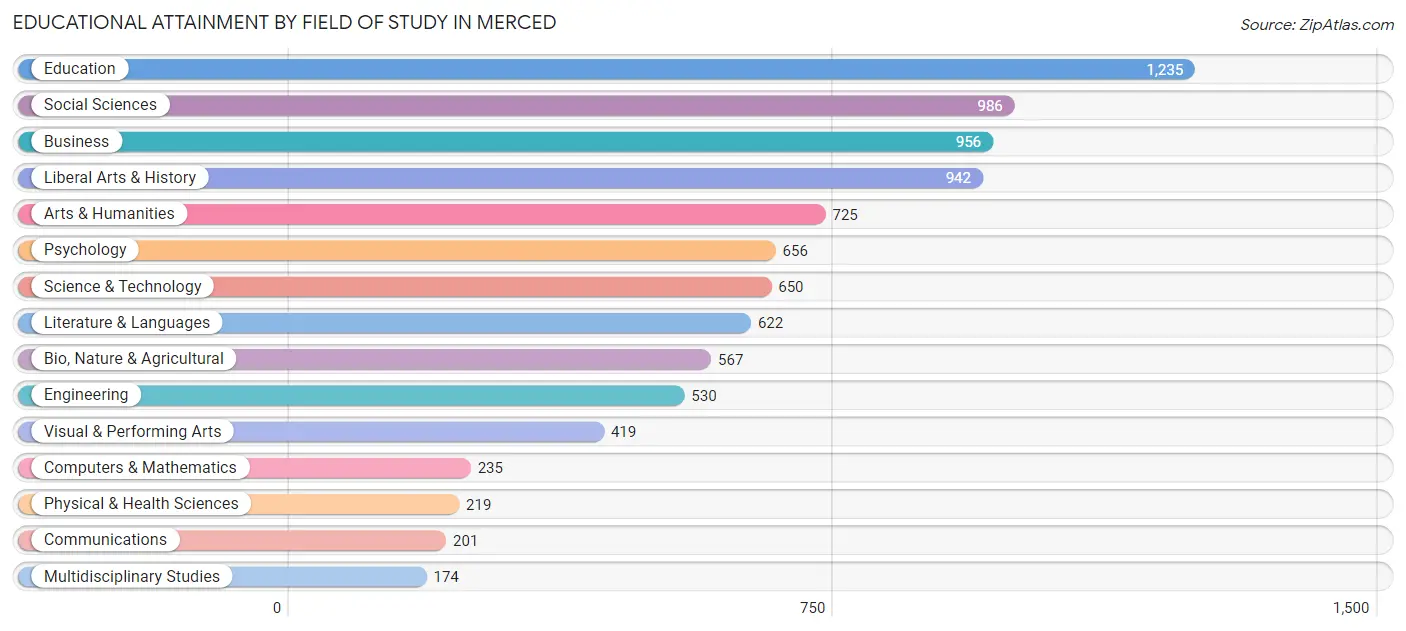
| Field of Study | # Graduates | % Graduates |
| Computers & Mathematics | 235 | 2.6% |
| Bio, Nature & Agricultural | 567 | 6.2% |
| Physical & Health Sciences | 219 | 2.4% |
| Psychology | 656 | 7.2% |
| Social Sciences | 986 | 10.8% |
| Engineering | 530 | 5.8% |
| Multidisciplinary Studies | 174 | 1.9% |
| Science & Technology | 650 | 7.1% |
| Business | 956 | 10.5% |
| Education | 1,235 | 13.6% |
| Literature & Languages | 622 | 6.8% |
| Liberal Arts & History | 942 | 10.3% |
| Visual & Performing Arts | 419 | 4.6% |
| Communications | 201 | 2.2% |
| Arts & Humanities | 725 | 8.0% |
| Total | 9,117 | 100.0% |
Transportation & Commute in Merced
Vehicle Availability by Sex in Merced
The most prevalent vehicle ownership categories in Merced are males with 2 vehicles (6,108, accounting for 31.6%) and females with 2 vehicles (4,887, making up 44.6%).
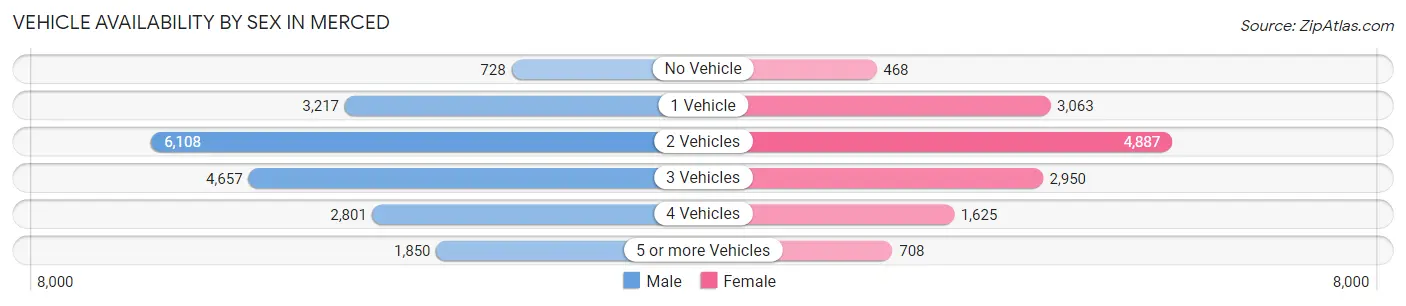
| Vehicles Available | Male | Female |
| No Vehicle | 728 (3.8%) | 468 (3.4%) |
| 1 Vehicle | 3,217 (16.6%) | 3,063 (22.4%) |
| 2 Vehicles | 6,108 (31.6%) | 4,887 (35.7%) |
| 3 Vehicles | 4,657 (24.0%) | 2,950 (21.5%) |
| 4 Vehicles | 2,801 (14.5%) | 1,625 (11.9%) |
| 5 or more Vehicles | 1,850 (9.6%) | 708 (5.2%) |
| Total | 19,361 (100.0%) | 13,701 (100.0%) |
Commute Time in Merced
The most frequently occuring commute durations in Merced are 10 to 14 minutes (6,966 commuters, 22.5%), 15 to 19 minutes (5,420 commuters, 17.5%), and 5 to 9 minutes (4,207 commuters, 13.6%).
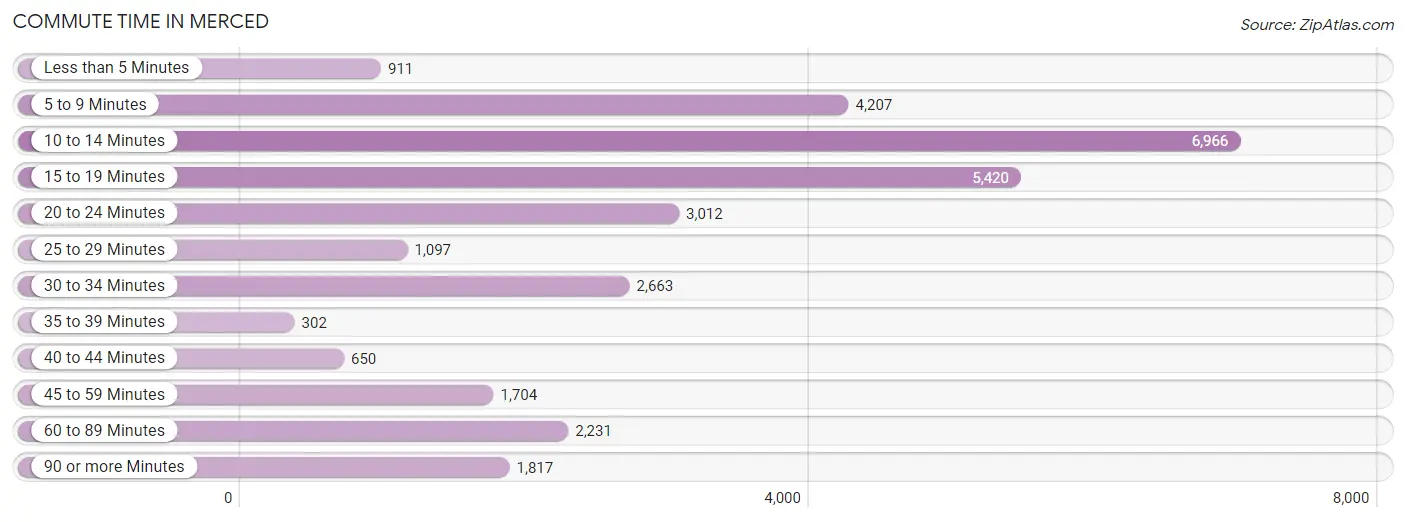
| Commute Time | # Commuters | % Commuters |
| Less than 5 Minutes | 911 | 2.9% |
| 5 to 9 Minutes | 4,207 | 13.6% |
| 10 to 14 Minutes | 6,966 | 22.5% |
| 15 to 19 Minutes | 5,420 | 17.5% |
| 20 to 24 Minutes | 3,012 | 9.7% |
| 25 to 29 Minutes | 1,097 | 3.5% |
| 30 to 34 Minutes | 2,663 | 8.6% |
| 35 to 39 Minutes | 302 | 1.0% |
| 40 to 44 Minutes | 650 | 2.1% |
| 45 to 59 Minutes | 1,704 | 5.5% |
| 60 to 89 Minutes | 2,231 | 7.2% |
| 90 or more Minutes | 1,817 | 5.9% |
Commute Time by Sex in Merced
The most common commute times in Merced are 10 to 14 minutes (3,322 commuters, 18.0%) for males and 10 to 14 minutes (3,644 commuters, 29.0%) for females.
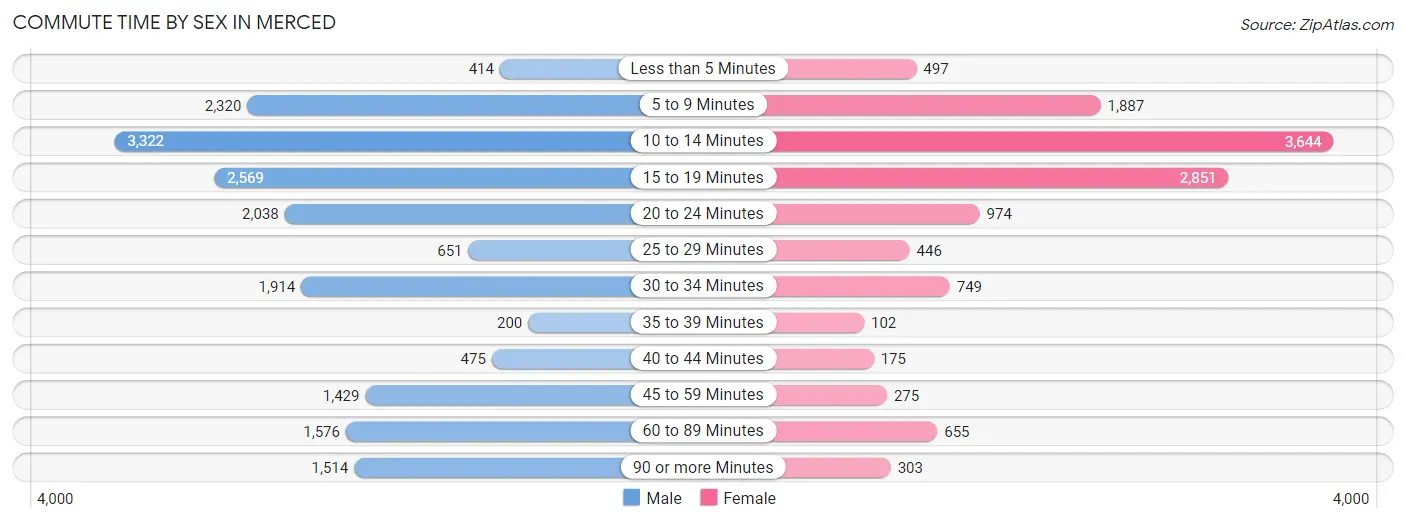
| Commute Time | Male | Female |
| Less than 5 Minutes | 414 (2.2%) | 497 (4.0%) |
| 5 to 9 Minutes | 2,320 (12.6%) | 1,887 (15.0%) |
| 10 to 14 Minutes | 3,322 (18.0%) | 3,644 (29.0%) |
| 15 to 19 Minutes | 2,569 (14.0%) | 2,851 (22.7%) |
| 20 to 24 Minutes | 2,038 (11.1%) | 974 (7.8%) |
| 25 to 29 Minutes | 651 (3.5%) | 446 (3.5%) |
| 30 to 34 Minutes | 1,914 (10.4%) | 749 (6.0%) |
| 35 to 39 Minutes | 200 (1.1%) | 102 (0.8%) |
| 40 to 44 Minutes | 475 (2.6%) | 175 (1.4%) |
| 45 to 59 Minutes | 1,429 (7.8%) | 275 (2.2%) |
| 60 to 89 Minutes | 1,576 (8.6%) | 655 (5.2%) |
| 90 or more Minutes | 1,514 (8.2%) | 303 (2.4%) |
Time of Departure to Work by Sex in Merced
The most frequent times of departure to work in Merced are 12:00 AM to 4:59 AM (2,357, 12.8%) for males and 7:30 AM to 7:59 AM (2,031, 16.2%) for females.
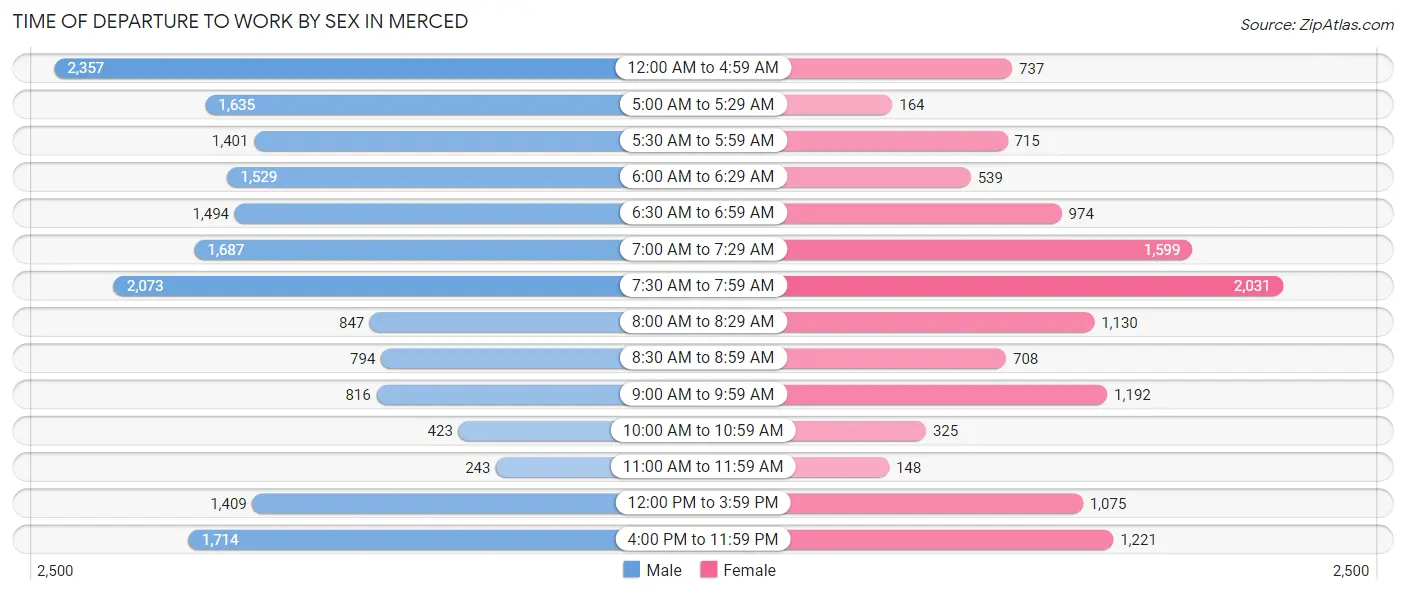
| Time of Departure | Male | Female |
| 12:00 AM to 4:59 AM | 2,357 (12.8%) | 737 (5.9%) |
| 5:00 AM to 5:29 AM | 1,635 (8.9%) | 164 (1.3%) |
| 5:30 AM to 5:59 AM | 1,401 (7.6%) | 715 (5.7%) |
| 6:00 AM to 6:29 AM | 1,529 (8.3%) | 539 (4.3%) |
| 6:30 AM to 6:59 AM | 1,494 (8.1%) | 974 (7.8%) |
| 7:00 AM to 7:29 AM | 1,687 (9.2%) | 1,599 (12.7%) |
| 7:30 AM to 7:59 AM | 2,073 (11.3%) | 2,031 (16.2%) |
| 8:00 AM to 8:29 AM | 847 (4.6%) | 1,130 (9.0%) |
| 8:30 AM to 8:59 AM | 794 (4.3%) | 708 (5.6%) |
| 9:00 AM to 9:59 AM | 816 (4.4%) | 1,192 (9.5%) |
| 10:00 AM to 10:59 AM | 423 (2.3%) | 325 (2.6%) |
| 11:00 AM to 11:59 AM | 243 (1.3%) | 148 (1.2%) |
| 12:00 PM to 3:59 PM | 1,409 (7.6%) | 1,075 (8.6%) |
| 4:00 PM to 11:59 PM | 1,714 (9.3%) | 1,221 (9.7%) |
| Total | 18,422 (100.0%) | 12,558 (100.0%) |
Housing Occupancy in Merced
Occupancy by Ownership in Merced
Of the total 27,084 dwellings in Merced, owner-occupied units account for 11,717 (43.3%), while renter-occupied units make up 15,367 (56.7%).
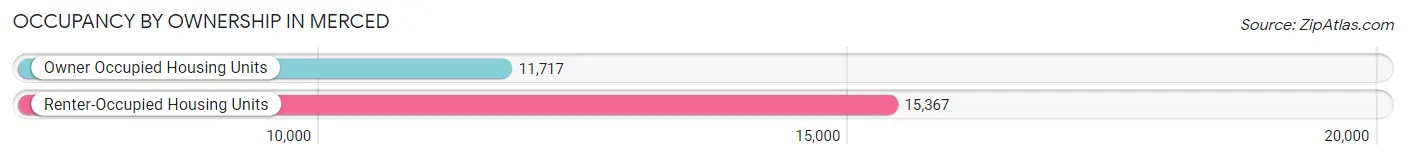
| Occupancy | # Housing Units | % Housing Units |
| Owner Occupied Housing Units | 11,717 | 43.3% |
| Renter-Occupied Housing Units | 15,367 | 56.7% |
| Total Occupied Housing Units | 27,084 | 100.0% |
Occupancy by Household Size in Merced
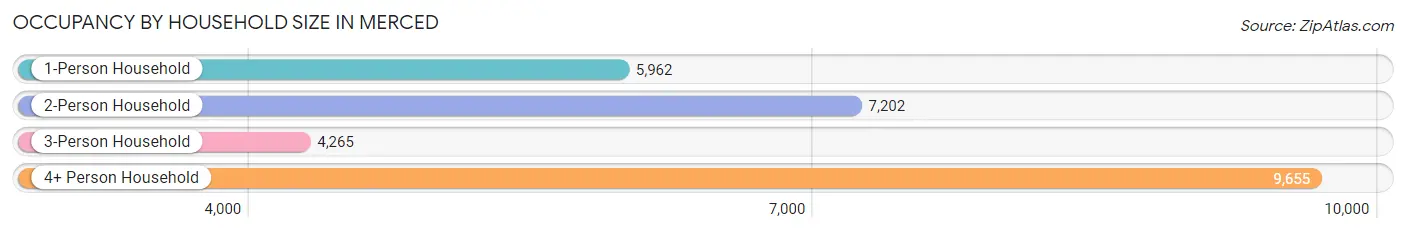
| Household Size | # Housing Units | % Housing Units |
| 1-Person Household | 5,962 | 22.0% |
| 2-Person Household | 7,202 | 26.6% |
| 3-Person Household | 4,265 | 15.8% |
| 4+ Person Household | 9,655 | 35.6% |
| Total Housing Units | 27,084 | 100.0% |
Occupancy by Ownership by Household Size in Merced
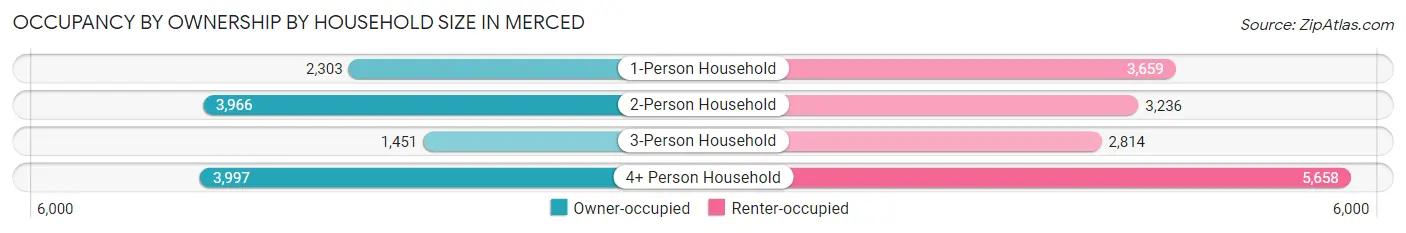
| Household Size | Owner-occupied | Renter-occupied |
| 1-Person Household | 2,303 (38.6%) | 3,659 (61.4%) |
| 2-Person Household | 3,966 (55.1%) | 3,236 (44.9%) |
| 3-Person Household | 1,451 (34.0%) | 2,814 (66.0%) |
| 4+ Person Household | 3,997 (41.4%) | 5,658 (58.6%) |
| Total Housing Units | 11,717 (43.3%) | 15,367 (56.7%) |
Occupancy by Educational Attainment in Merced
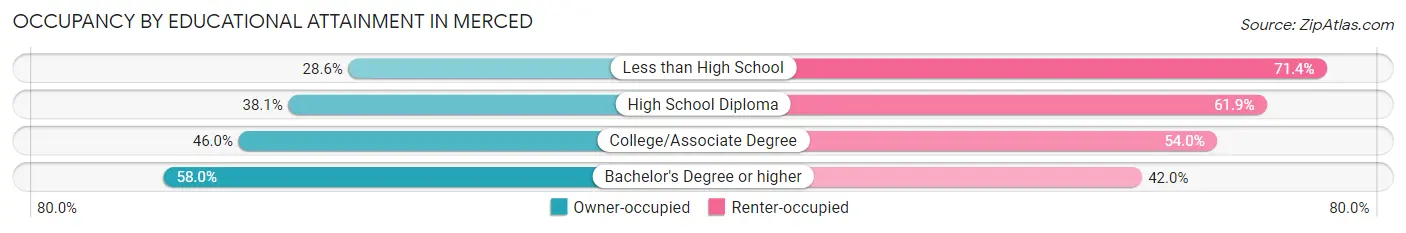
| Household Size | Owner-occupied | Renter-occupied |
| Less than High School | 1,564 (28.6%) | 3,905 (71.4%) |
| High School Diploma | 2,084 (38.1%) | 3,380 (61.9%) |
| College/Associate Degree | 4,986 (46.0%) | 5,846 (54.0%) |
| Bachelor's Degree or higher | 3,083 (58.0%) | 2,236 (42.0%) |
Occupancy by Age of Householder in Merced
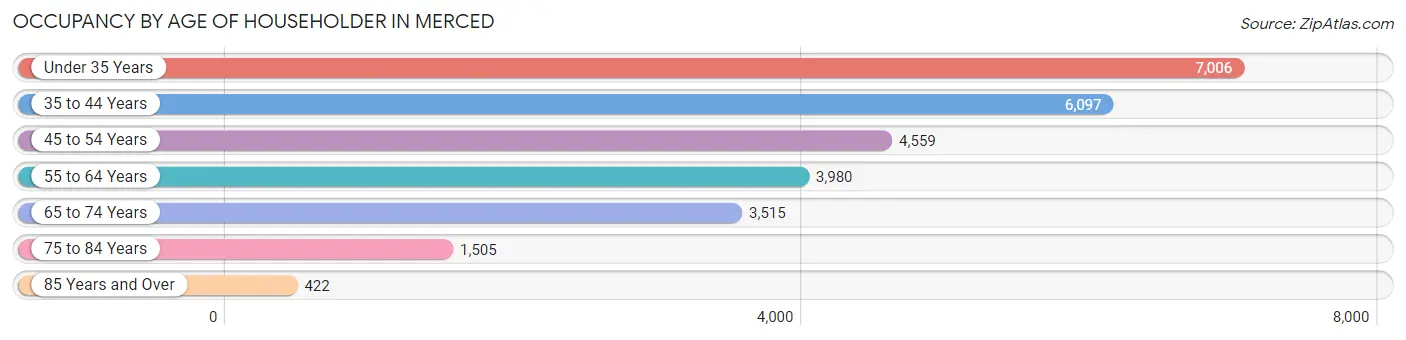
| Age Bracket | # Households | % Households |
| Under 35 Years | 7,006 | 25.9% |
| 35 to 44 Years | 6,097 | 22.5% |
| 45 to 54 Years | 4,559 | 16.8% |
| 55 to 64 Years | 3,980 | 14.7% |
| 65 to 74 Years | 3,515 | 13.0% |
| 75 to 84 Years | 1,505 | 5.6% |
| 85 Years and Over | 422 | 1.6% |
| Total | 27,084 | 100.0% |
Housing Finances in Merced
Median Income by Occupancy in Merced
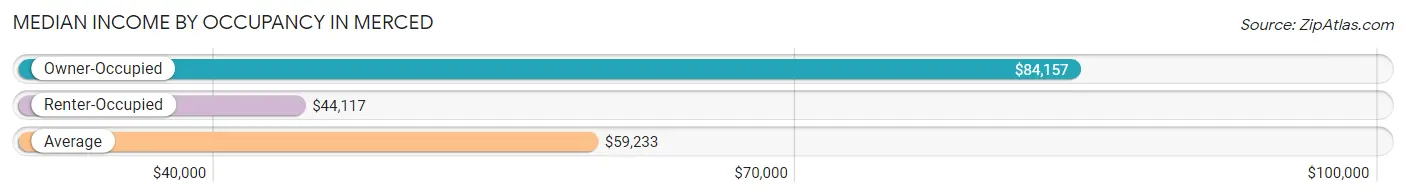
| Occupancy Type | # Households | Median Income |
| Owner-Occupied | 11,717 (43.3%) | $84,157 |
| Renter-Occupied | 15,367 (56.7%) | $44,117 |
| Average | 27,084 (100.0%) | $59,233 |
Occupancy by Householder Income Bracket in Merced
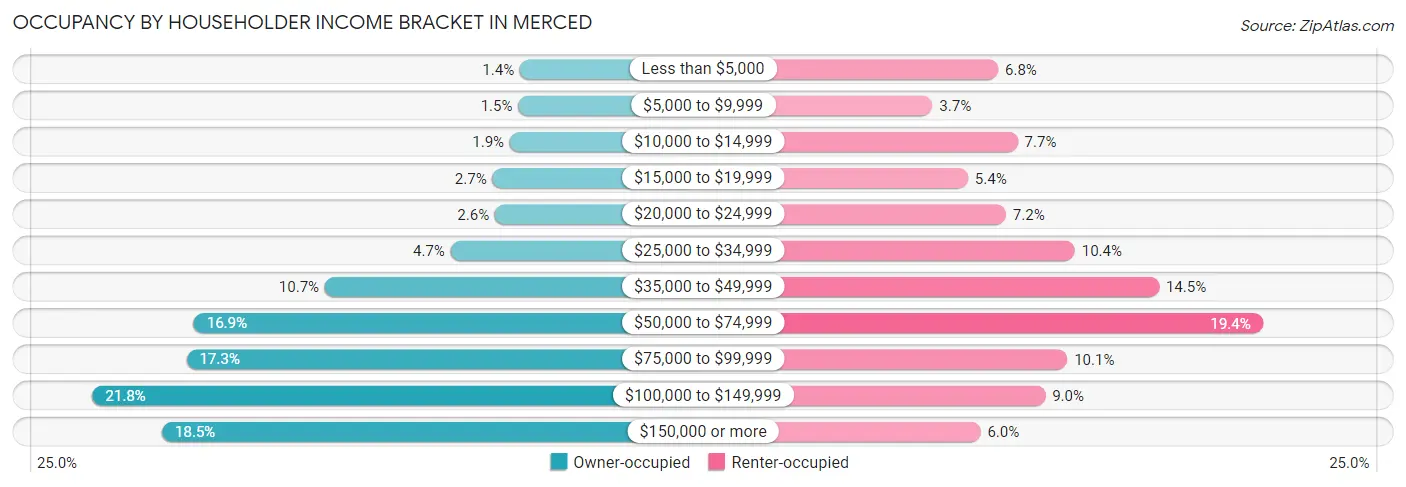
| Income Bracket | Owner-occupied | Renter-occupied |
| Less than $5,000 | 165 (1.4%) | 1,043 (6.8%) |
| $5,000 to $9,999 | 175 (1.5%) | 562 (3.7%) |
| $10,000 to $14,999 | 222 (1.9%) | 1,186 (7.7%) |
| $15,000 to $19,999 | 319 (2.7%) | 822 (5.3%) |
| $20,000 to $24,999 | 305 (2.6%) | 1,100 (7.2%) |
| $25,000 to $34,999 | 552 (4.7%) | 1,604 (10.4%) |
| $35,000 to $49,999 | 1,254 (10.7%) | 2,220 (14.4%) |
| $50,000 to $74,999 | 1,985 (16.9%) | 2,978 (19.4%) |
| $75,000 to $99,999 | 2,026 (17.3%) | 1,549 (10.1%) |
| $100,000 to $149,999 | 2,551 (21.8%) | 1,388 (9.0%) |
| $150,000 or more | 2,163 (18.5%) | 915 (5.9%) |
| Total | 11,717 (100.0%) | 15,367 (100.0%) |
Monthly Housing Cost Tiers in Merced
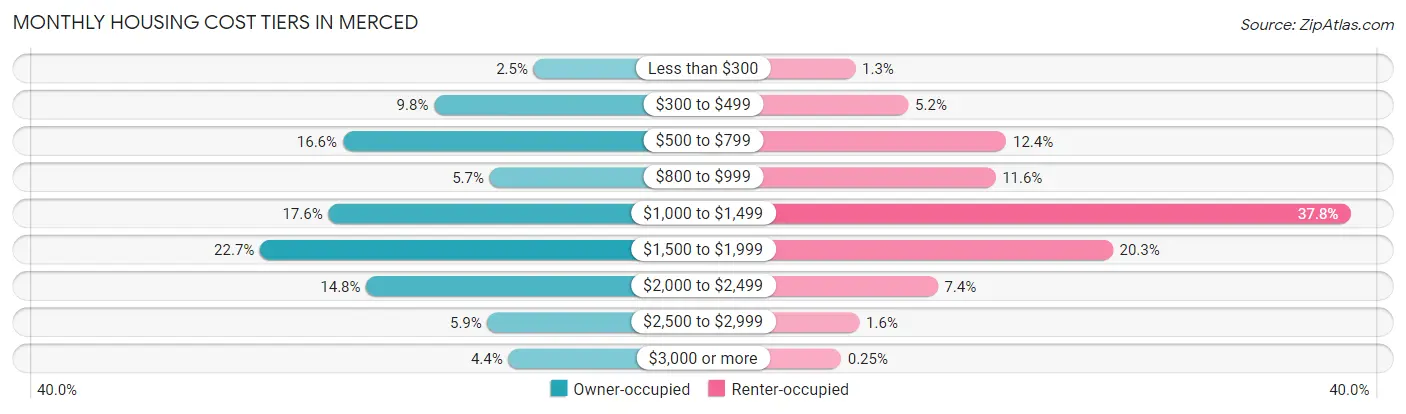
| Monthly Cost | Owner-occupied | Renter-occupied |
| Less than $300 | 293 (2.5%) | 200 (1.3%) |
| $300 to $499 | 1,152 (9.8%) | 800 (5.2%) |
| $500 to $799 | 1,940 (16.6%) | 1,909 (12.4%) |
| $800 to $999 | 673 (5.7%) | 1,786 (11.6%) |
| $1,000 to $1,499 | 2,065 (17.6%) | 5,803 (37.8%) |
| $1,500 to $1,999 | 2,654 (22.7%) | 3,114 (20.3%) |
| $2,000 to $2,499 | 1,738 (14.8%) | 1,133 (7.4%) |
| $2,500 to $2,999 | 691 (5.9%) | 246 (1.6%) |
| $3,000 or more | 511 (4.4%) | 39 (0.3%) |
| Total | 11,717 (100.0%) | 15,367 (100.0%) |
Physical Housing Characteristics in Merced
Housing Structures in Merced
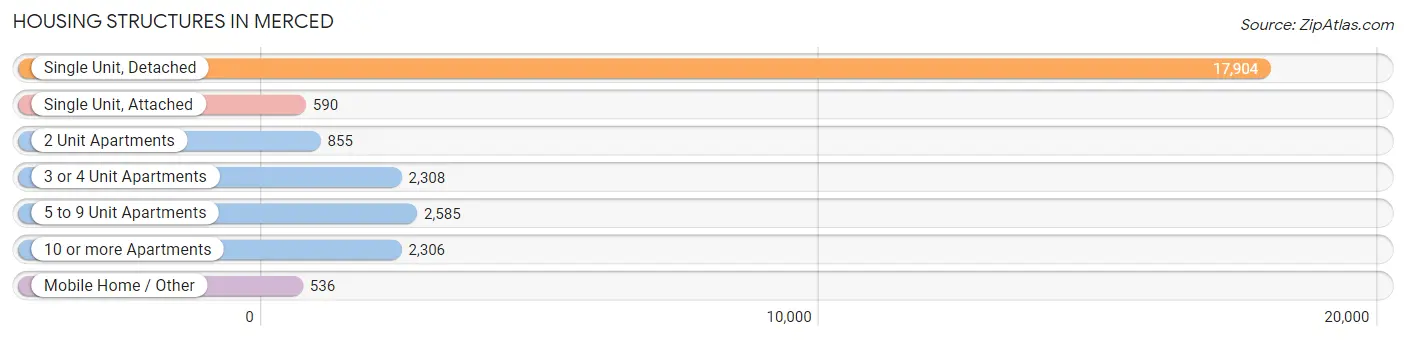
| Structure Type | # Housing Units | % Housing Units |
| Single Unit, Detached | 17,904 | 66.1% |
| Single Unit, Attached | 590 | 2.2% |
| 2 Unit Apartments | 855 | 3.2% |
| 3 or 4 Unit Apartments | 2,308 | 8.5% |
| 5 to 9 Unit Apartments | 2,585 | 9.5% |
| 10 or more Apartments | 2,306 | 8.5% |
| Mobile Home / Other | 536 | 2.0% |
| Total | 27,084 | 100.0% |
Housing Structures by Occupancy in Merced
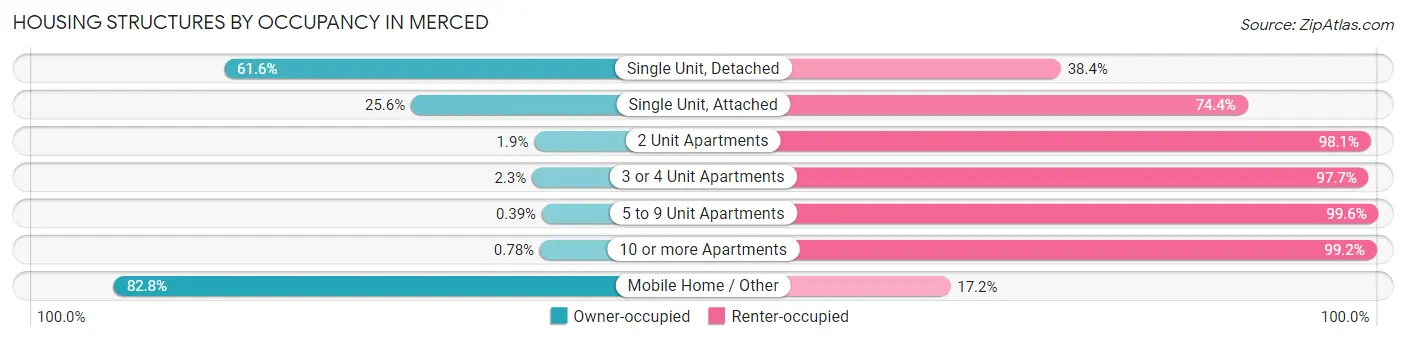
| Structure Type | Owner-occupied | Renter-occupied |
| Single Unit, Detached | 11,025 (61.6%) | 6,879 (38.4%) |
| Single Unit, Attached | 151 (25.6%) | 439 (74.4%) |
| 2 Unit Apartments | 16 (1.9%) | 839 (98.1%) |
| 3 or 4 Unit Apartments | 53 (2.3%) | 2,255 (97.7%) |
| 5 to 9 Unit Apartments | 10 (0.4%) | 2,575 (99.6%) |
| 10 or more Apartments | 18 (0.8%) | 2,288 (99.2%) |
| Mobile Home / Other | 444 (82.8%) | 92 (17.2%) |
| Total | 11,717 (43.3%) | 15,367 (56.7%) |
Housing Structures by Number of Rooms in Merced
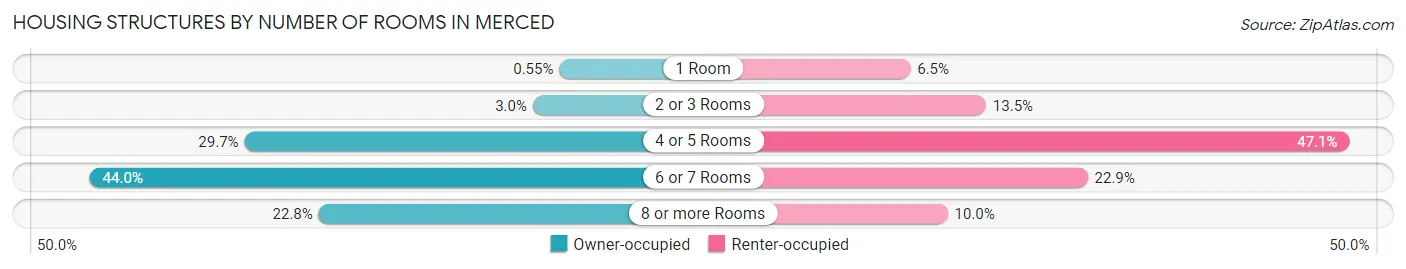
| Number of Rooms | Owner-occupied | Renter-occupied |
| 1 Room | 64 (0.5%) | 1,001 (6.5%) |
| 2 or 3 Rooms | 351 (3.0%) | 2,075 (13.5%) |
| 4 or 5 Rooms | 3,476 (29.7%) | 7,240 (47.1%) |
| 6 or 7 Rooms | 5,153 (44.0%) | 3,520 (22.9%) |
| 8 or more Rooms | 2,673 (22.8%) | 1,531 (10.0%) |
| Total | 11,717 (100.0%) | 15,367 (100.0%) |
Housing Structure by Heating Type in Merced
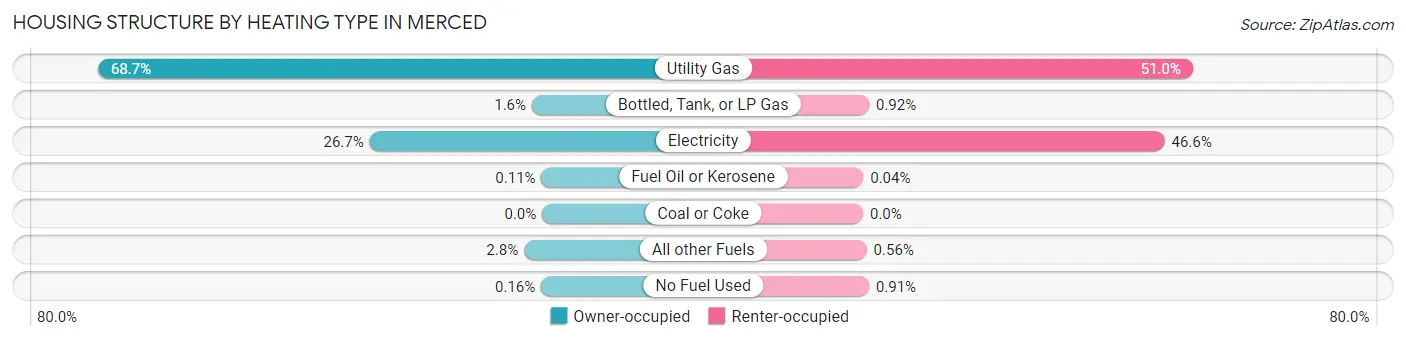
| Heating Type | Owner-occupied | Renter-occupied |
| Utility Gas | 8,047 (68.7%) | 7,832 (51.0%) |
| Bottled, Tank, or LP Gas | 185 (1.6%) | 141 (0.9%) |
| Electricity | 3,125 (26.7%) | 7,162 (46.6%) |
| Fuel Oil or Kerosene | 13 (0.1%) | 6 (0.0%) |
| Coal or Coke | 0 (0.0%) | 0 (0.0%) |
| All other Fuels | 328 (2.8%) | 86 (0.6%) |
| No Fuel Used | 19 (0.2%) | 140 (0.9%) |
| Total | 11,717 (100.0%) | 15,367 (100.0%) |
Household Vehicle Usage in Merced
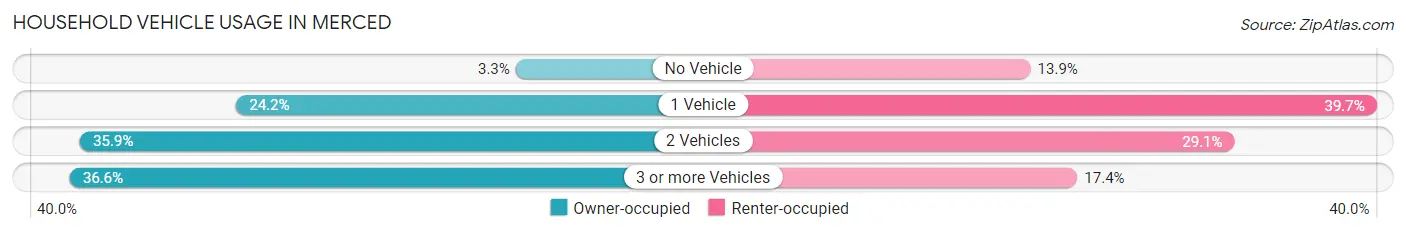
| Vehicles per Household | Owner-occupied | Renter-occupied |
| No Vehicle | 390 (3.3%) | 2,131 (13.9%) |
| 1 Vehicle | 2,834 (24.2%) | 6,100 (39.7%) |
| 2 Vehicles | 4,202 (35.9%) | 4,468 (29.1%) |
| 3 or more Vehicles | 4,291 (36.6%) | 2,668 (17.4%) |
| Total | 11,717 (100.0%) | 15,367 (100.0%) |
Real Estate & Mortgages in Merced
Real Estate and Mortgage Overview in Merced
| Characteristic | Without Mortgage | With Mortgage |
| Housing Units | 3,632 | 8,085 |
| Median Property Value | $304,500 | $331,700 |
| Median Household Income | $75,343 | $1,746 |
| Monthly Housing Costs | $568 | $511 |
| Real Estate Taxes | $1,794 | $265 |
Property Value by Mortgage Status in Merced
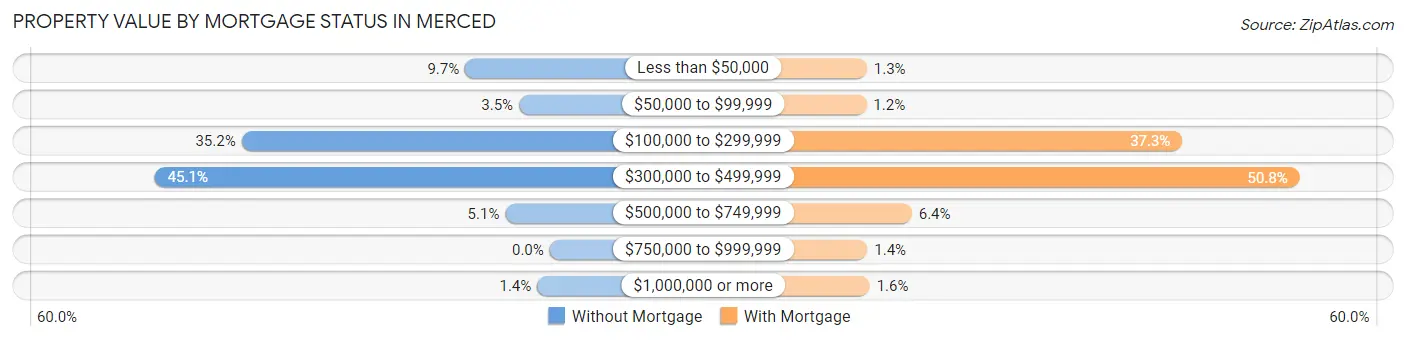
| Property Value | Without Mortgage | With Mortgage |
| Less than $50,000 | 351 (9.7%) | 104 (1.3%) |
| $50,000 to $99,999 | 127 (3.5%) | 100 (1.2%) |
| $100,000 to $299,999 | 1,279 (35.2%) | 3,018 (37.3%) |
| $300,000 to $499,999 | 1,639 (45.1%) | 4,103 (50.7%) |
| $500,000 to $749,999 | 184 (5.1%) | 520 (6.4%) |
| $750,000 to $999,999 | 0 (0.0%) | 109 (1.3%) |
| $1,000,000 or more | 52 (1.4%) | 131 (1.6%) |
| Total | 3,632 (100.0%) | 8,085 (100.0%) |
Household Income by Mortgage Status in Merced
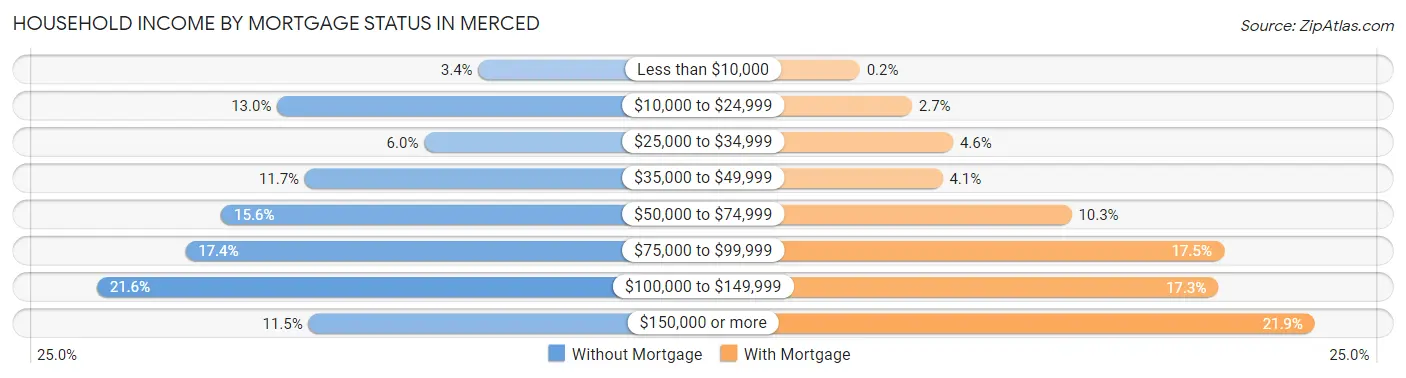
| Household Income | Without Mortgage | With Mortgage |
| Less than $10,000 | 123 (3.4%) | 16 (0.2%) |
| $10,000 to $24,999 | 471 (13.0%) | 217 (2.7%) |
| $25,000 to $34,999 | 217 (6.0%) | 375 (4.6%) |
| $35,000 to $49,999 | 423 (11.7%) | 335 (4.1%) |
| $50,000 to $74,999 | 568 (15.6%) | 831 (10.3%) |
| $75,000 to $99,999 | 630 (17.3%) | 1,417 (17.5%) |
| $100,000 to $149,999 | 783 (21.6%) | 1,396 (17.3%) |
| $150,000 or more | 417 (11.5%) | 1,768 (21.9%) |
| Total | 3,632 (100.0%) | 8,085 (100.0%) |
Property Value to Household Income Ratio in Merced
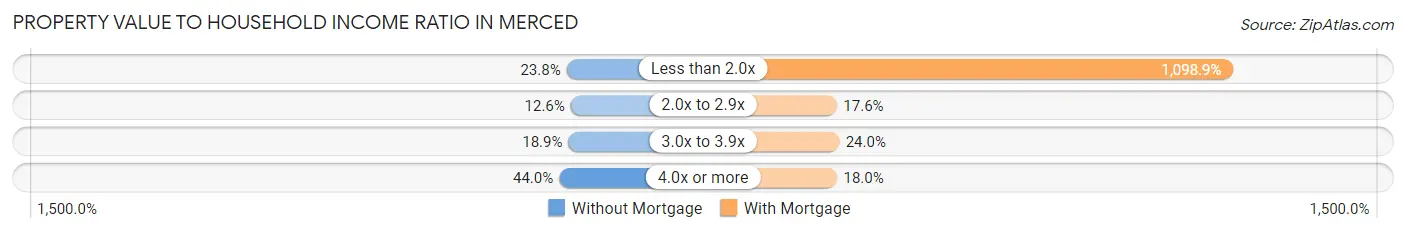
| Value-to-Income Ratio | Without Mortgage | With Mortgage |
| Less than 2.0x | 865 (23.8%) | 88,847 (1,098.9%) |
| 2.0x to 2.9x | 457 (12.6%) | 1,425 (17.6%) |
| 3.0x to 3.9x | 685 (18.9%) | 1,938 (24.0%) |
| 4.0x or more | 1,598 (44.0%) | 1,456 (18.0%) |
| Total | 3,632 (100.0%) | 8,085 (100.0%) |
Real Estate Taxes by Mortgage Status in Merced
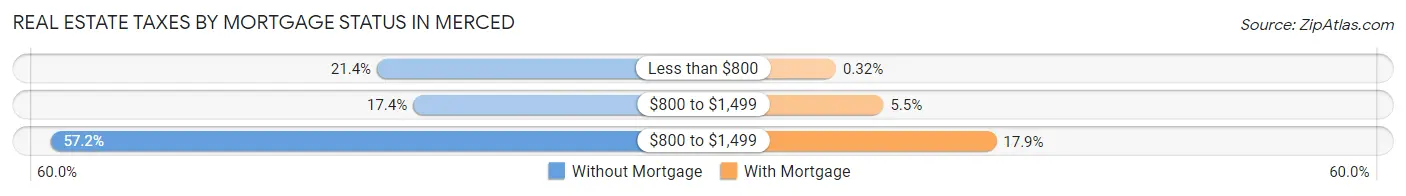
| Property Taxes | Without Mortgage | With Mortgage |
| Less than $800 | 777 (21.4%) | 26 (0.3%) |
| $800 to $1,499 | 633 (17.4%) | 447 (5.5%) |
| $800 to $1,499 | 2,076 (57.2%) | 1,447 (17.9%) |
| Total | 3,632 (100.0%) | 8,085 (100.0%) |
Health & Disability in Merced
Health Insurance Coverage by Age in Merced
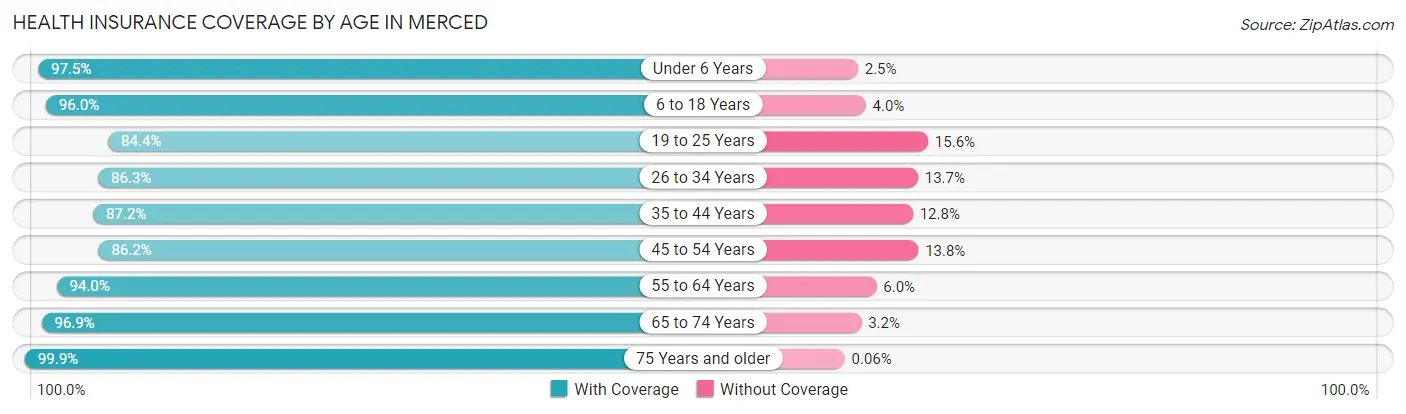
| Age Bracket | With Coverage | Without Coverage |
| Under 6 Years | 7,772 (97.5%) | 200 (2.5%) |
| 6 to 18 Years | 17,824 (96.0%) | 738 (4.0%) |
| 19 to 25 Years | 9,811 (84.4%) | 1,812 (15.6%) |
| 26 to 34 Years | 10,831 (86.3%) | 1,721 (13.7%) |
| 35 to 44 Years | 9,459 (87.2%) | 1,383 (12.8%) |
| 45 to 54 Years | 7,496 (86.2%) | 1,198 (13.8%) |
| 55 to 64 Years | 7,570 (94.0%) | 481 (6.0%) |
| 65 to 74 Years | 5,412 (96.9%) | 176 (3.2%) |
| 75 Years and older | 3,165 (99.9%) | 2 (0.1%) |
| Total | 79,340 (91.1%) | 7,711 (8.9%) |
Health Insurance Coverage by Citizenship Status in Merced
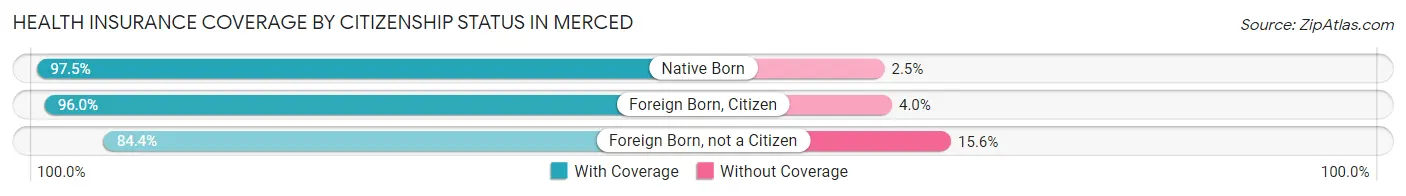
| Citizenship Status | With Coverage | Without Coverage |
| Native Born | 7,772 (97.5%) | 200 (2.5%) |
| Foreign Born, Citizen | 17,824 (96.0%) | 738 (4.0%) |
| Foreign Born, not a Citizen | 9,811 (84.4%) | 1,812 (15.6%) |
Health Insurance Coverage by Household Income in Merced
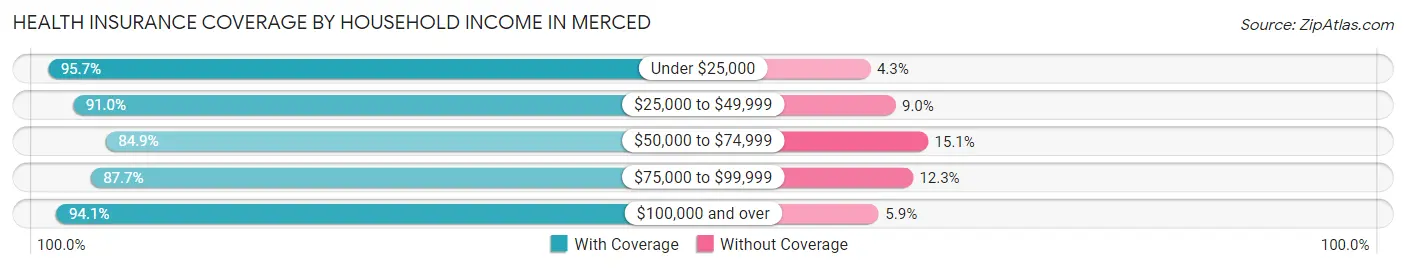
| Household Income | With Coverage | Without Coverage |
| Under $25,000 | 14,064 (95.7%) | 638 (4.3%) |
| $25,000 to $49,999 | 15,248 (91.0%) | 1,516 (9.0%) |
| $50,000 to $74,999 | 13,433 (84.9%) | 2,397 (15.1%) |
| $75,000 to $99,999 | 10,991 (87.7%) | 1,541 (12.3%) |
| $100,000 and over | 25,030 (94.1%) | 1,574 (5.9%) |
Public vs Private Health Insurance Coverage by Age in Merced
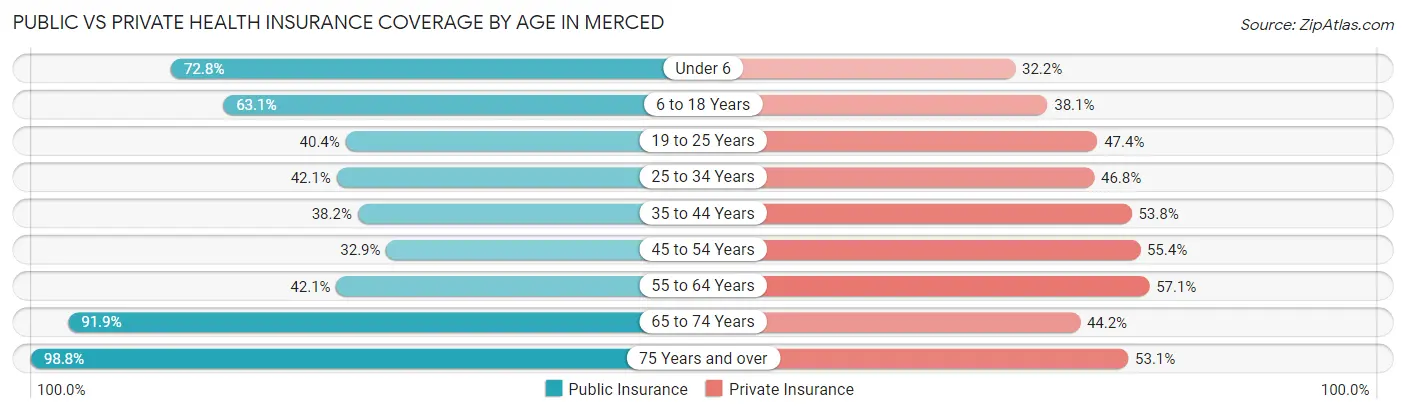
| Age Bracket | Public Insurance | Private Insurance |
| Under 6 | 5,805 (72.8%) | 2,563 (32.2%) |
| 6 to 18 Years | 11,717 (63.1%) | 7,080 (38.1%) |
| 19 to 25 Years | 4,698 (40.4%) | 5,510 (47.4%) |
| 25 to 34 Years | 5,281 (42.1%) | 5,877 (46.8%) |
| 35 to 44 Years | 4,138 (38.2%) | 5,830 (53.8%) |
| 45 to 54 Years | 2,856 (32.9%) | 4,812 (55.3%) |
| 55 to 64 Years | 3,391 (42.1%) | 4,594 (57.1%) |
| 65 to 74 Years | 5,135 (91.9%) | 2,470 (44.2%) |
| 75 Years and over | 3,130 (98.8%) | 1,683 (53.1%) |
| Total | 46,151 (53.0%) | 40,419 (46.4%) |
Disability Status by Sex by Age in Merced
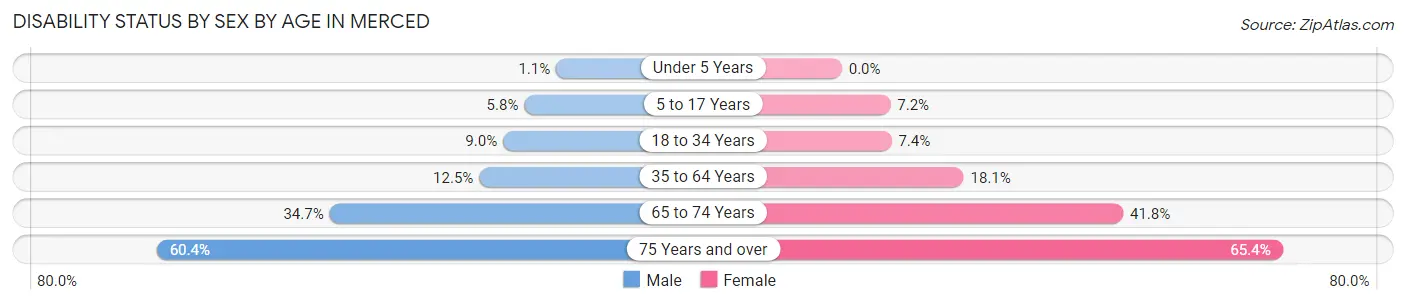
| Age Bracket | Male | Female |
| Under 5 Years | 37 (1.1%) | 0 (0.0%) |
| 5 to 17 Years | 557 (5.8%) | 695 (7.2%) |
| 18 to 34 Years | 1,160 (9.0%) | 895 (7.4%) |
| 35 to 64 Years | 1,675 (12.5%) | 2,567 (18.1%) |
| 65 to 74 Years | 847 (34.7%) | 1,315 (41.8%) |
| 75 Years and over | 756 (60.4%) | 1,253 (65.4%) |
Disability Class by Sex by Age in Merced
Disability Class: Hearing Difficulty
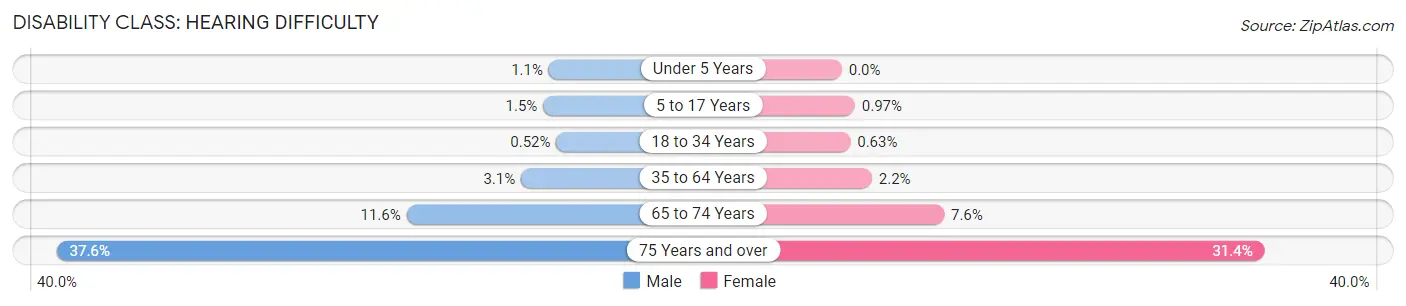
| Age Bracket | Male | Female |
| Under 5 Years | 37 (1.1%) | 0 (0.0%) |
| 5 to 17 Years | 144 (1.5%) | 93 (1.0%) |
| 18 to 34 Years | 67 (0.5%) | 77 (0.6%) |
| 35 to 64 Years | 421 (3.1%) | 317 (2.2%) |
| 65 to 74 Years | 284 (11.6%) | 239 (7.6%) |
| 75 Years and over | 471 (37.6%) | 601 (31.4%) |
Disability Class: Vision Difficulty
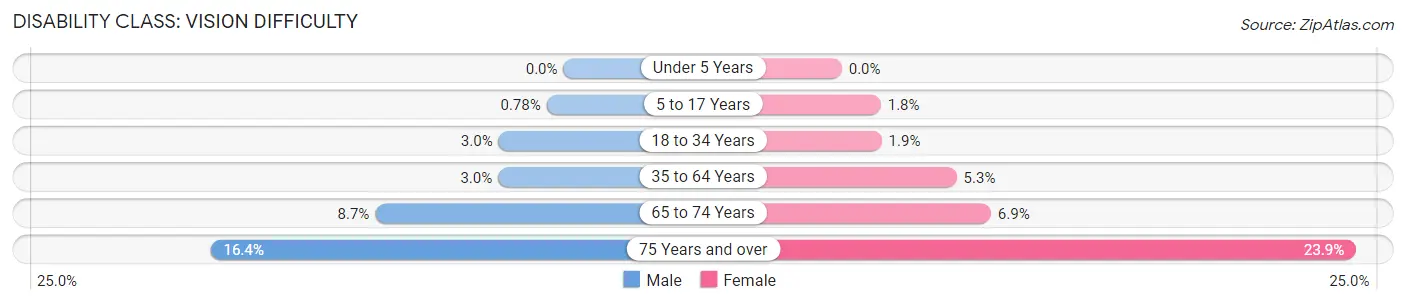
| Age Bracket | Male | Female |
| Under 5 Years | 0 (0.0%) | 0 (0.0%) |
| 5 to 17 Years | 75 (0.8%) | 174 (1.8%) |
| 18 to 34 Years | 389 (3.0%) | 225 (1.8%) |
| 35 to 64 Years | 406 (3.0%) | 756 (5.3%) |
| 65 to 74 Years | 213 (8.7%) | 218 (6.9%) |
| 75 Years and over | 205 (16.4%) | 457 (23.9%) |
Disability Class: Cognitive Difficulty
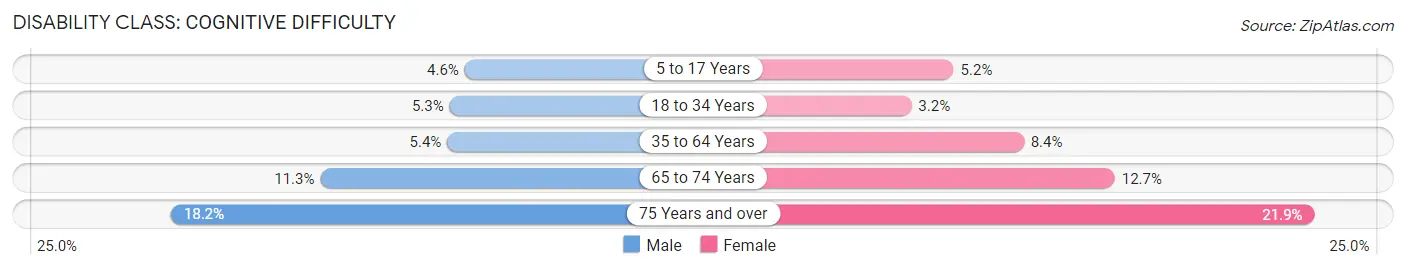
| Age Bracket | Male | Female |
| 5 to 17 Years | 439 (4.6%) | 500 (5.2%) |
| 18 to 34 Years | 683 (5.3%) | 393 (3.2%) |
| 35 to 64 Years | 722 (5.4%) | 1,198 (8.4%) |
| 65 to 74 Years | 275 (11.3%) | 399 (12.7%) |
| 75 Years and over | 228 (18.2%) | 420 (21.9%) |
Disability Class: Ambulatory Difficulty
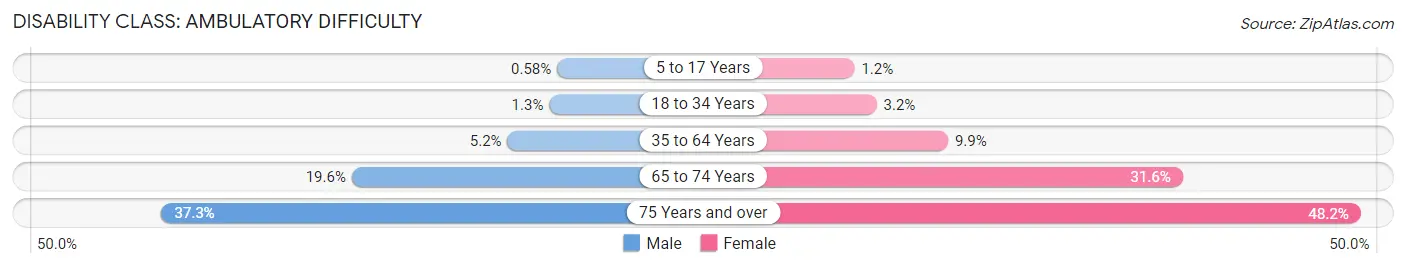
| Age Bracket | Male | Female |
| 5 to 17 Years | 56 (0.6%) | 114 (1.2%) |
| 18 to 34 Years | 169 (1.3%) | 392 (3.2%) |
| 35 to 64 Years | 695 (5.2%) | 1,398 (9.9%) |
| 65 to 74 Years | 479 (19.6%) | 996 (31.6%) |
| 75 Years and over | 467 (37.3%) | 922 (48.1%) |
Disability Class: Self-Care Difficulty
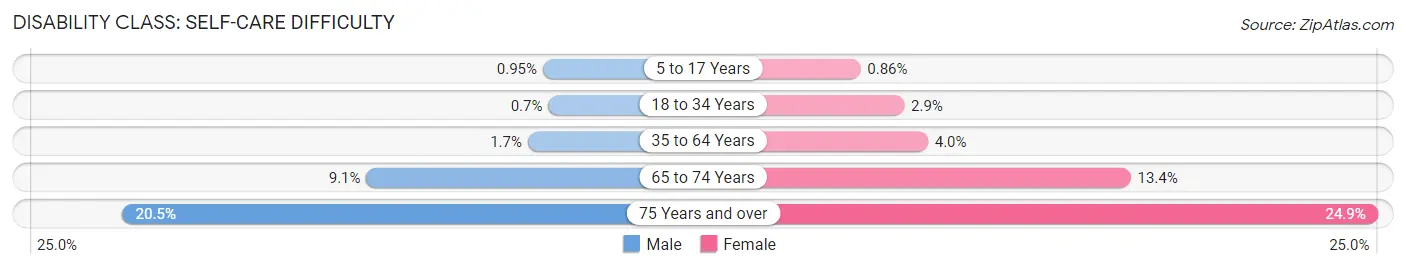
| Age Bracket | Male | Female |
| 5 to 17 Years | 91 (0.9%) | 83 (0.9%) |
| 18 to 34 Years | 90 (0.7%) | 351 (2.9%) |
| 35 to 64 Years | 221 (1.7%) | 566 (4.0%) |
| 65 to 74 Years | 223 (9.1%) | 422 (13.4%) |
| 75 Years and over | 256 (20.4%) | 476 (24.9%) |
Technology Access in Merced
Computing Device Access in Merced
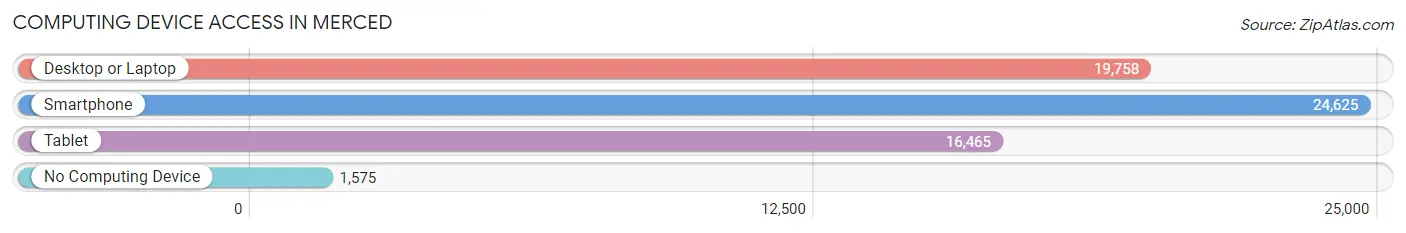
| Device Type | # Households | % Households |
| Desktop or Laptop | 19,758 | 73.0% |
| Smartphone | 24,625 | 90.9% |
| Tablet | 16,465 | 60.8% |
| No Computing Device | 1,575 | 5.8% |
| Total | 27,084 | 100.0% |
Internet Access in Merced
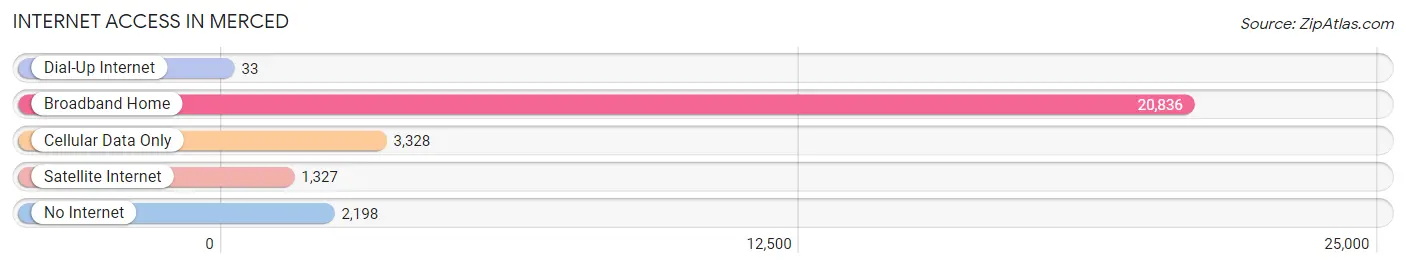
| Internet Type | # Households | % Households |
| Dial-Up Internet | 33 | 0.1% |
| Broadband Home | 20,836 | 76.9% |
| Cellular Data Only | 3,328 | 12.3% |
| Satellite Internet | 1,327 | 4.9% |
| No Internet | 2,198 | 8.1% |
| Total | 27,084 | 100.0% |
Merced Summary
Merced, California is a city located in the San Joaquin Valley of Central California. It is the county seat of Merced County and is situated in the northern part of the state, about 90 miles southeast of San Francisco. The city has a population of approximately 81,743 people, making it the 18th most populous city in California.
History
Merced was founded in 1872 by the Southern Pacific Railroad. The city was named after the Merced River, which was named by Spanish explorer Gabriel Moraga in 1806. The city was incorporated in 1889 and has since grown to become the county seat of Merced County.
The city has a rich history, having been the site of several important events in California’s history. In 1875, the first public school in the county was established in Merced. In 1876, the first county courthouse was built in the city. In 1877, the first post office was established in Merced. In 1879, the first newspaper in the county was published in Merced.
In the early 20th century, Merced was a major center for agriculture and the processing of agricultural products. The city was also a major hub for the railroad industry, with the Southern Pacific Railroad having a major presence in the city.
Geography
Merced is located in the San Joaquin Valley of Central California. It is situated in the northern part of the state, about 90 miles southeast of San Francisco. The city is located at an elevation of about 200 feet above sea level.
The city is bordered by the Merced River to the north, the San Joaquin River to the east, and the Tuolumne River to the south. The city is also bordered by the cities of Atwater to the north, Livingston to the east, and Los Banos to the south.
The city has a total area of about 10.5 square miles, of which 10.4 square miles is land and 0.1 square miles is water.
Economy
Merced’s economy is largely based on agriculture and the processing of agricultural products. The city is home to several large agricultural companies, including Foster Farms, Hilmar Cheese Company, and Sun-Maid Raisins.
The city is also home to several major employers, including the University of California, Merced, Mercy Medical Center, and the Merced County Office of Education.
Demographics
As of the 2010 census, Merced had a population of 81,743 people. The racial makeup of the city was 57.2% White, 4.2% African American, 1.3% Native American, 8.2% Asian, 0.2% Pacific Islander, 25.2% from other races, and 3.7% from two or more races. Hispanic or Latino of any race were 44.3% of the population.
The median income for a household in the city was $37,845, and the median income for a family was $45,919. The per capita income for the city was $17,845. About 18.2% of families and 22.3% of the population were below the poverty line, including 30.2% of those under age 18 and 11.2% of those age 65 or over.
Common Questions
What is Per Capita Income in Merced?
Per Capita income in Merced is $25,155.
What is the Median Family Income in Merced?
Median Family Income in Merced is $65,348.
What is the Median Household income in Merced?
Median Household Income in Merced is $59,233.
What is Income or Wage Gap in Merced?
Income or Wage Gap in Merced is 25.5%.
Women in Merced earn 74.5 cents for every dollar earned by a man.
What is Family Income Deficit in Merced?
Family Income Deficit in Merced is $12,066.
Families that are below poverty line in Merced earn $12,066 less on average than the poverty threshold level.
What is Inequality or Gini Index in Merced?
Inequality or Gini Index in Merced is 0.46.
What is the Total Population of Merced?
Total Population of Merced is 87,686.
What is the Total Male Population of Merced?
Total Male Population of Merced is 43,481.
What is the Total Female Population of Merced?
Total Female Population of Merced is 44,205.
What is the Ratio of Males per 100 Females in Merced?
There are 98.36 Males per 100 Females in Merced.
What is the Ratio of Females per 100 Males in Merced?
There are 101.67 Females per 100 Males in Merced.
What is the Median Population Age in Merced?
Median Population Age in Merced is 29.9 Years.
What is the Average Family Size in Merced
Average Family Size in Merced is 3.7 People.
What is the Average Household Size in Merced
Average Household Size in Merced is 3.2 People.
How Large is the Labor Force in Merced?
There are 39,538 People in the Labor Forcein in Merced.
What is the Percentage of People in the Labor Force in Merced?
60.9% of People are in the Labor Force in Merced.
What is the Unemployment Rate in Merced?
Unemployment Rate in Merced is 12.6%.