Oxnard, CA Map & Demographics
Oxnard Map
Oxnard Overview
$28,845
PER CAPITA INCOME
$89,908
AVG FAMILY INCOME
$90,409
AVG HOUSEHOLD INCOME
16.6%
WAGE / INCOME GAP [ % ]
83.4¢/ $1
WAGE / INCOME GAP [ $ ]
$11,332
FAMILY INCOME DEFICIT
0.39
INEQUALITY / GINI INDEX
202,279
TOTAL POPULATION
102,922
MALE POPULATION
99,357
FEMALE POPULATION
103.59
MALES / 100 FEMALES
96.54
FEMALES / 100 MALES
33.5
MEDIAN AGE
4.2
AVG FAMILY SIZE
3.9
AVG HOUSEHOLD SIZE
104,962
LABOR FORCE [ PEOPLE ]
67.8%
PERCENT IN LABOR FORCE
5.9%
UNEMPLOYMENT RATE
Oxnard Area Codes
Income in Oxnard
Income Overview in Oxnard
Per Capita Income in Oxnard is $28,845, while median incomes of families and households are $89,908 and $90,409 respectively.
| Characteristic | Number | Measure |
| Per Capita Income | 202,279 | $28,845 |
| Median Family Income | 40,775 | $89,908 |
| Mean Family Income | 40,775 | $106,045 |
| Median Household Income | 51,099 | $90,409 |
| Mean Household Income | 51,099 | $106,063 |
| Income Deficit | 40,775 | $11,332 |
| Wage / Income Gap (%) | 202,279 | 16.65% |
| Wage / Income Gap ($) | 202,279 | 83.35¢ per $1 |
| Gini / Inequality Index | 202,279 | 0.39 |
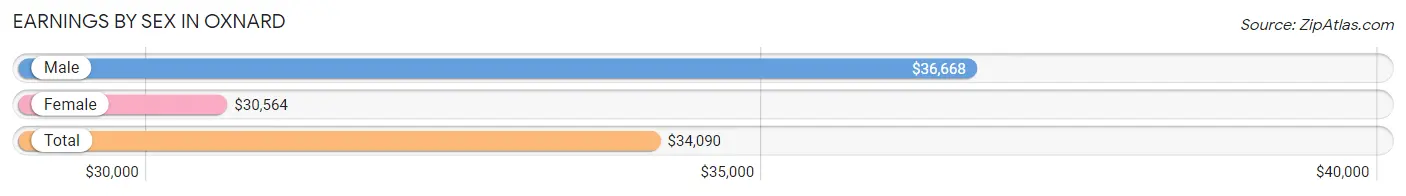
Earnings by Sex in Oxnard
Average Earnings in Oxnard are $34,090, $36,668 for men and $30,564 for women, a difference of 16.7%.
| Sex | Number | Average Earnings |
| Male | 59,465 (56.3%) | $36,668 |
| Female | 46,127 (43.7%) | $30,564 |
| Total | 105,592 (100.0%) | $34,090 |
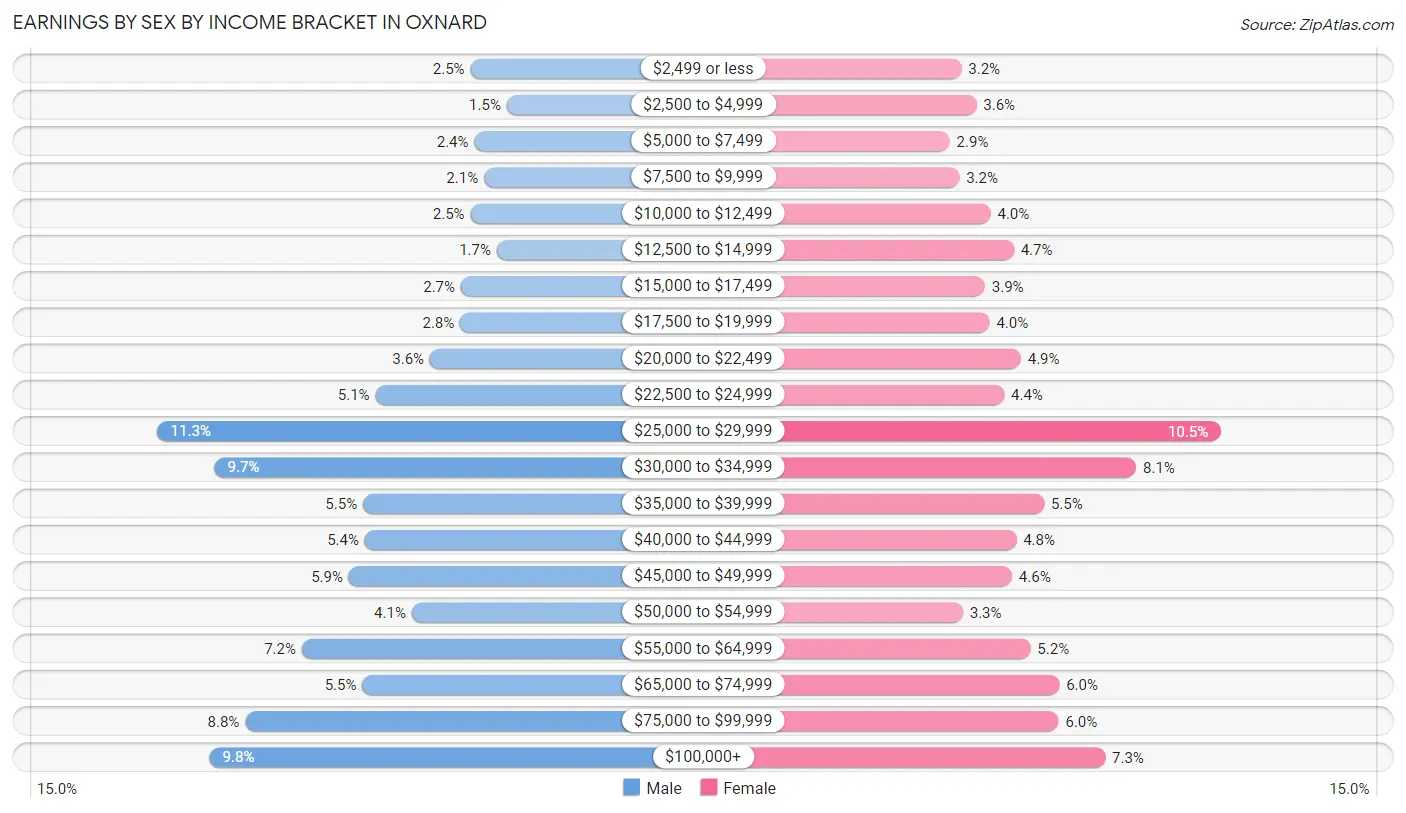
Earnings by Sex by Income Bracket in Oxnard
The most common earnings brackets in Oxnard are $25,000 to $29,999 for men (6,696 | 11.3%) and $25,000 to $29,999 for women (4,838 | 10.5%).
| Income | Male | Female |
| $2,499 or less | 1,466 (2.5%) | 1,487 (3.2%) |
| $2,500 to $4,999 | 863 (1.5%) | 1,678 (3.6%) |
| $5,000 to $7,499 | 1,403 (2.4%) | 1,335 (2.9%) |
| $7,500 to $9,999 | 1,243 (2.1%) | 1,456 (3.2%) |
| $10,000 to $12,499 | 1,471 (2.5%) | 1,864 (4.0%) |
| $12,500 to $14,999 | 1,030 (1.7%) | 2,162 (4.7%) |
| $15,000 to $17,499 | 1,627 (2.7%) | 1,790 (3.9%) |
| $17,500 to $19,999 | 1,642 (2.8%) | 1,850 (4.0%) |
| $20,000 to $22,499 | 2,148 (3.6%) | 2,254 (4.9%) |
| $22,500 to $24,999 | 3,057 (5.1%) | 2,039 (4.4%) |
| $25,000 to $29,999 | 6,696 (11.3%) | 4,838 (10.5%) |
| $30,000 to $34,999 | 5,746 (9.7%) | 3,751 (8.1%) |
| $35,000 to $39,999 | 3,264 (5.5%) | 2,555 (5.5%) |
| $40,000 to $44,999 | 3,234 (5.4%) | 2,194 (4.8%) |
| $45,000 to $49,999 | 3,504 (5.9%) | 2,140 (4.6%) |
| $50,000 to $54,999 | 2,450 (4.1%) | 1,505 (3.3%) |
| $55,000 to $64,999 | 4,285 (7.2%) | 2,379 (5.2%) |
| $65,000 to $74,999 | 3,277 (5.5%) | 2,754 (6.0%) |
| $75,000 to $99,999 | 5,232 (8.8%) | 2,746 (5.9%) |
| $100,000+ | 5,827 (9.8%) | 3,350 (7.3%) |
| Total | 59,465 (100.0%) | 46,127 (100.0%) |
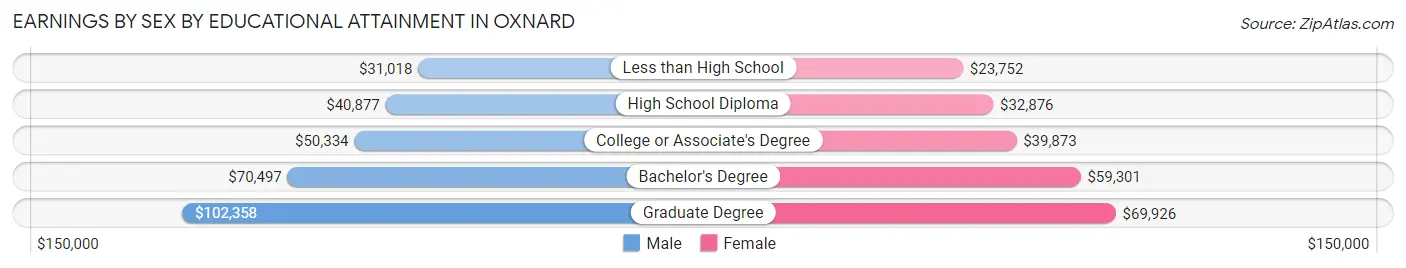
Earnings by Sex by Educational Attainment in Oxnard
Average earnings in Oxnard are $41,965 for men and $34,283 for women, a difference of 18.3%. Men with an educational attainment of graduate degree enjoy the highest average annual earnings of $102,358, while those with less than high school education earn the least with $31,018. Women with an educational attainment of graduate degree earn the most with the average annual earnings of $69,926, while those with less than high school education have the smallest earnings of $23,752.
| Educational Attainment | Male Income | Female Income |
| Less than High School | $31,018 | $23,752 |
| High School Diploma | $40,877 | $32,876 |
| College or Associate's Degree | $50,334 | $39,873 |
| Bachelor's Degree | $70,497 | $59,301 |
| Graduate Degree | $102,358 | $69,926 |
| Total | $41,965 | $34,283 |
Family Income in Oxnard
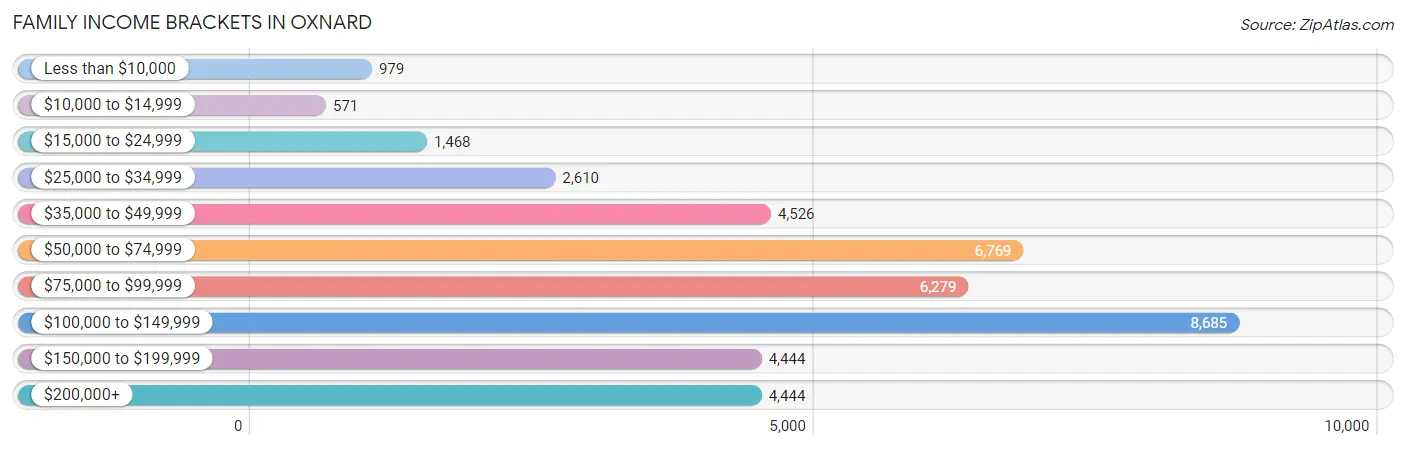
Family Income Brackets in Oxnard
According to the Oxnard family income data, there are 8,685 families falling into the $100,000 to $149,999 income range, which is the most common income bracket and makes up 21.3% of all families. Conversely, the $10,000 to $14,999 income bracket is the least frequent group with only 571 families (1.4%) belonging to this category.
| Income Bracket | # Families | % Families |
| Less than $10,000 | 979 | 2.4% |
| $10,000 to $14,999 | 571 | 1.4% |
| $15,000 to $24,999 | 1,468 | 3.6% |
| $25,000 to $34,999 | 2,610 | 6.4% |
| $35,000 to $49,999 | 4,526 | 11.1% |
| $50,000 to $74,999 | 6,769 | 16.6% |
| $75,000 to $99,999 | 6,279 | 15.4% |
| $100,000 to $149,999 | 8,685 | 21.3% |
| $150,000 to $199,999 | 4,444 | 10.9% |
| $200,000+ | 4,444 | 10.9% |
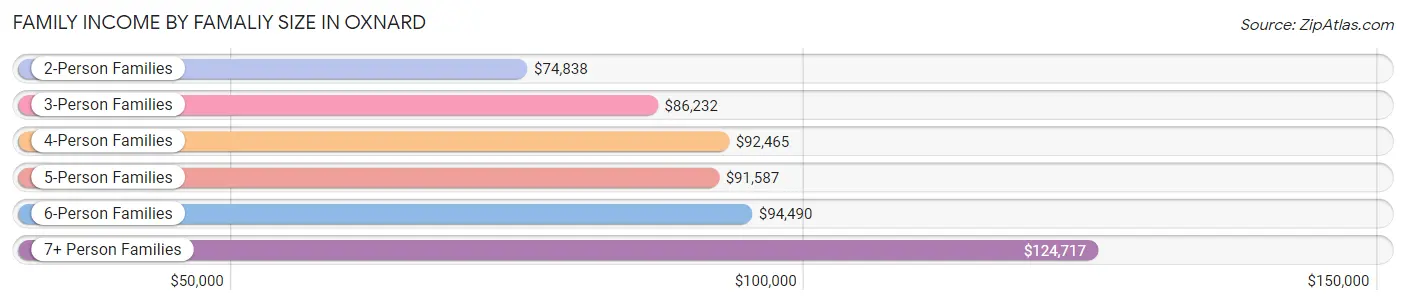
Family Income by Famaliy Size in Oxnard
7+ person families (3,160 | 7.7%) account for the highest median family income in Oxnard with $124,717 per family, while 2-person families (11,127 | 27.3%) have the highest median income of $37,419 per family member.
| Income Bracket | # Families | Median Income |
| 2-Person Families | 11,127 (27.3%) | $74,838 |
| 3-Person Families | 8,401 (20.6%) | $86,232 |
| 4-Person Families | 9,242 (22.7%) | $92,465 |
| 5-Person Families | 5,708 (14.0%) | $91,587 |
| 6-Person Families | 3,137 (7.7%) | $94,490 |
| 7+ Person Families | 3,160 (7.7%) | $124,717 |
| Total | 40,775 (100.0%) | $89,908 |
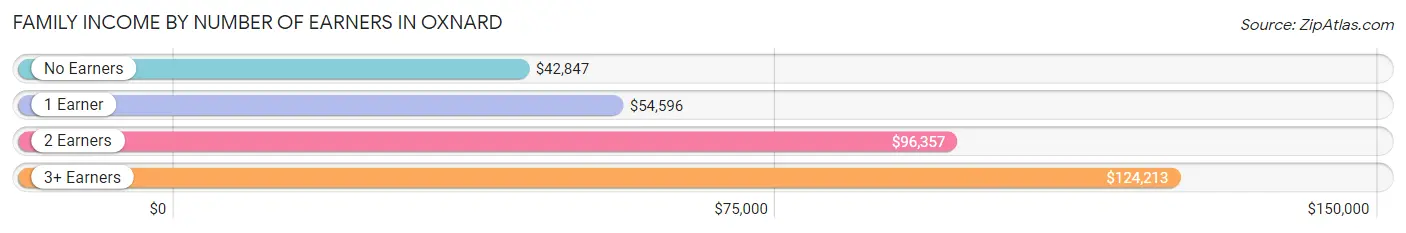
Family Income by Number of Earners in Oxnard
The median family income in Oxnard is $89,908, with families comprising 3+ earners (9,975) having the highest median family income of $124,213, while families with no earners (3,785) have the lowest median family income of $42,847, accounting for 24.5% and 9.3% of families, respectively.
| Number of Earners | # Families | Median Income |
| No Earners | 3,785 (9.3%) | $42,847 |
| 1 Earner | 12,196 (29.9%) | $54,596 |
| 2 Earners | 14,819 (36.3%) | $96,357 |
| 3+ Earners | 9,975 (24.5%) | $124,213 |
| Total | 40,775 (100.0%) | $89,908 |
Household Income in Oxnard
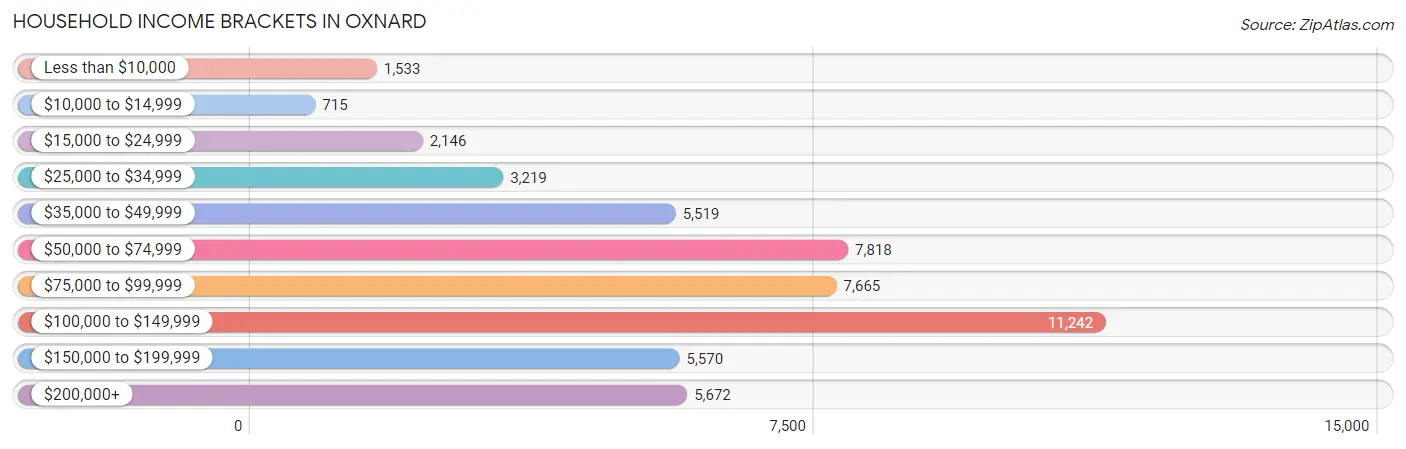
Household Income Brackets in Oxnard
With 11,242 households falling in the category, the $100,000 to $149,999 income range is the most frequent in Oxnard, accounting for 22.0% of all households. In contrast, only 715 households (1.4%) fall into the $10,000 to $14,999 income bracket, making it the least populous group.
| Income Bracket | # Households | % Households |
| Less than $10,000 | 1,533 | 3.0% |
| $10,000 to $14,999 | 715 | 1.4% |
| $15,000 to $24,999 | 2,146 | 4.2% |
| $25,000 to $34,999 | 3,219 | 6.3% |
| $35,000 to $49,999 | 5,519 | 10.8% |
| $50,000 to $74,999 | 7,818 | 15.3% |
| $75,000 to $99,999 | 7,665 | 15.0% |
| $100,000 to $149,999 | 11,242 | 22.0% |
| $150,000 to $199,999 | 5,570 | 10.9% |
| $200,000+ | 5,672 | 11.1% |
Household Income by Householder Age in Oxnard
The median household income in Oxnard is $90,409, with the highest median household income of $100,036 found in the 45 to 64 years age bracket for the primary householder. A total of 21,550 households (42.2%) fall into this category. Meanwhile, the 15 to 24 years age bracket for the primary householder has the lowest median household income of $67,356, with 1,157 households (2.3%) in this group.
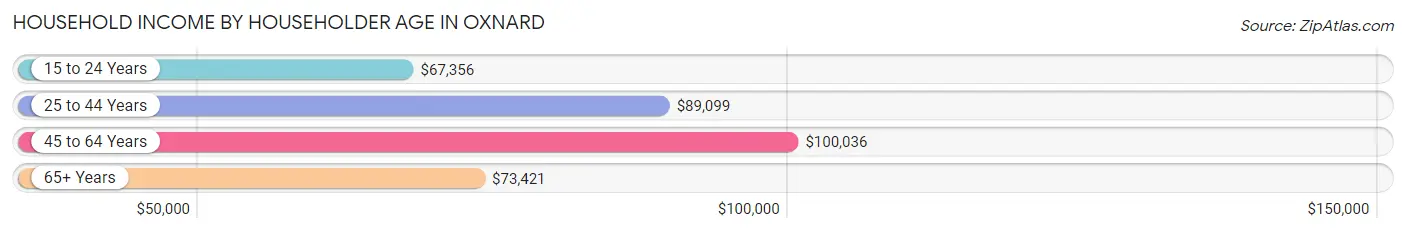
| Income Bracket | # Households | Median Income |
| 15 to 24 Years | 1,157 (2.3%) | $67,356 |
| 25 to 44 Years | 17,323 (33.9%) | $89,099 |
| 45 to 64 Years | 21,550 (42.2%) | $100,036 |
| 65+ Years | 11,069 (21.7%) | $73,421 |
| Total | 51,099 (100.0%) | $90,409 |
Poverty in Oxnard
Income Below Poverty by Sex and Age in Oxnard
With 9.8% poverty level for males and 11.6% for females among the residents of Oxnard, 6 to 11 year old males and 15 year old females are the most vulnerable to poverty, with 1,766 males (19.3%) and 438 females (23.4%) in their respective age groups living below the poverty level.
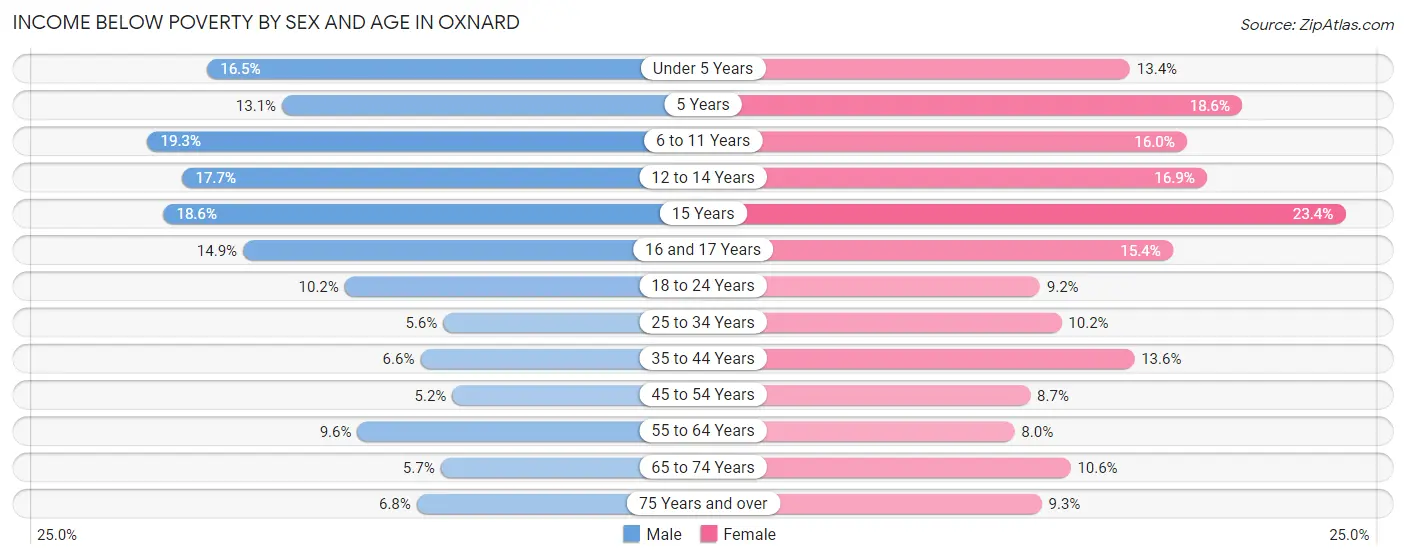
| Age Bracket | Male | Female |
| Under 5 Years | 971 (16.5%) | 832 (13.4%) |
| 5 Years | 159 (13.1%) | 373 (18.6%) |
| 6 to 11 Years | 1,766 (19.3%) | 1,249 (16.0%) |
| 12 to 14 Years | 997 (17.7%) | 695 (16.9%) |
| 15 Years | 297 (18.5%) | 438 (23.4%) |
| 16 and 17 Years | 422 (14.9%) | 419 (15.3%) |
| 18 to 24 Years | 1,122 (10.2%) | 924 (9.2%) |
| 25 to 34 Years | 893 (5.6%) | 1,535 (10.2%) |
| 35 to 44 Years | 955 (6.6%) | 1,816 (13.6%) |
| 45 to 54 Years | 672 (5.2%) | 1,079 (8.7%) |
| 55 to 64 Years | 1,069 (9.6%) | 867 (8.0%) |
| 65 to 74 Years | 351 (5.7%) | 708 (10.6%) |
| 75 Years and over | 255 (6.8%) | 451 (9.3%) |
| Total | 9,929 (9.8%) | 11,386 (11.6%) |
Income Above Poverty by Sex and Age in Oxnard
According to the poverty statistics in Oxnard, males aged 45 to 54 years and females aged 55 to 64 years are the age groups that are most secure financially, with 94.8% of males and 92.0% of females in these age groups living above the poverty line.
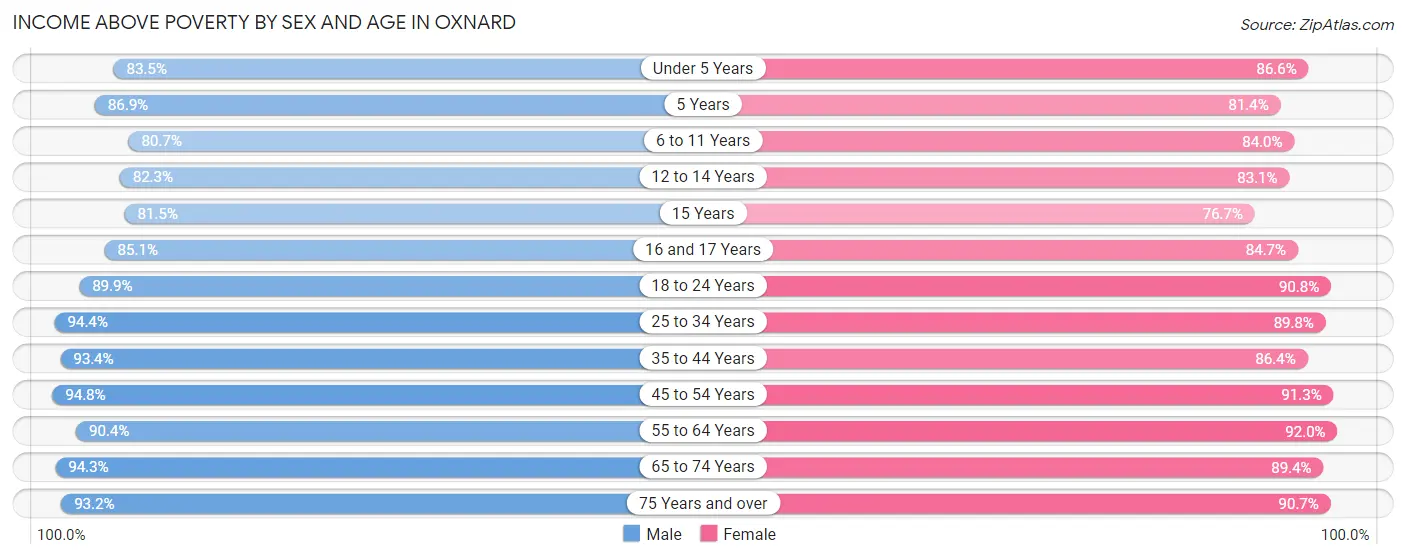
| Age Bracket | Male | Female |
| Under 5 Years | 4,907 (83.5%) | 5,389 (86.6%) |
| 5 Years | 1,058 (86.9%) | 1,637 (81.4%) |
| 6 to 11 Years | 7,389 (80.7%) | 6,556 (84.0%) |
| 12 to 14 Years | 4,645 (82.3%) | 3,409 (83.1%) |
| 15 Years | 1,304 (81.5%) | 1,438 (76.6%) |
| 16 and 17 Years | 2,416 (85.1%) | 2,311 (84.7%) |
| 18 to 24 Years | 9,929 (89.8%) | 9,128 (90.8%) |
| 25 to 34 Years | 15,101 (94.4%) | 13,523 (89.8%) |
| 35 to 44 Years | 13,435 (93.4%) | 11,565 (86.4%) |
| 45 to 54 Years | 12,355 (94.8%) | 11,264 (91.3%) |
| 55 to 64 Years | 10,109 (90.4%) | 9,958 (92.0%) |
| 65 to 74 Years | 5,805 (94.3%) | 5,967 (89.4%) |
| 75 Years and over | 3,490 (93.2%) | 4,412 (90.7%) |
| Total | 91,943 (90.2%) | 86,557 (88.4%) |
Income Below Poverty Among Married-Couple Families in Oxnard
The poverty statistics for married-couple families in Oxnard show that 5.7% or 1,539 of the total 27,236 families live below the poverty line. Families with 5 or more children have the highest poverty rate of 25.9%, comprising of 99 families. On the other hand, families with 1 or 2 children have the lowest poverty rate of 3.4%, which includes 373 families.
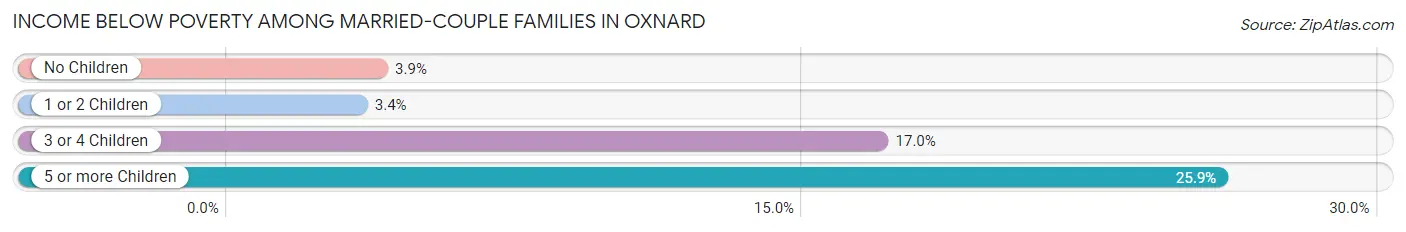
| Children | Above Poverty | Below Poverty |
| No Children | 11,934 (96.1%) | 487 (3.9%) |
| 1 or 2 Children | 10,646 (96.6%) | 373 (3.4%) |
| 3 or 4 Children | 2,833 (83.0%) | 580 (17.0%) |
| 5 or more Children | 284 (74.2%) | 99 (25.9%) |
| Total | 25,697 (94.4%) | 1,539 (5.7%) |
Income Below Poverty Among Single-Parent Households in Oxnard
According to the poverty data in Oxnard, 7.1% or 330 single-father households and 18.0% or 1,610 single-mother households are living below the poverty line. Among single-father households, those with 3 or 4 children have the highest poverty rate, with 94 households (22.7%) experiencing poverty. Likewise, among single-mother households, those with 3 or 4 children have the highest poverty rate, with 705 households (45.0%) falling below the poverty line.
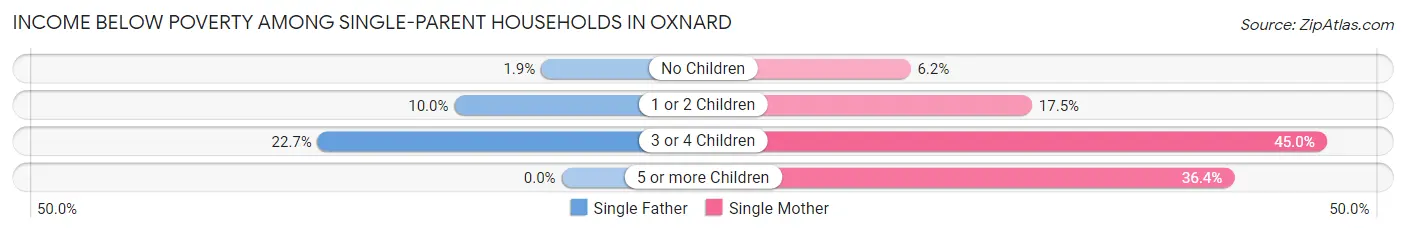
| Children | Single Father | Single Mother |
| No Children | 42 (1.9%) | 233 (6.2%) |
| 1 or 2 Children | 194 (10.0%) | 596 (17.5%) |
| 3 or 4 Children | 94 (22.7%) | 705 (45.0%) |
| 5 or more Children | 0 (0.0%) | 76 (36.4%) |
| Total | 330 (7.1%) | 1,610 (18.0%) |
Income Below Poverty Among Married-Couple vs Single-Parent Households in Oxnard
The poverty data for Oxnard shows that 1,539 of the married-couple family households (5.7%) and 1,940 of the single-parent households (14.3%) are living below the poverty level. Within the married-couple family households, those with 5 or more children have the highest poverty rate, with 99 households (25.9%) falling below the poverty line. Among the single-parent households, those with 3 or 4 children have the highest poverty rate, with 799 household (40.3%) living below poverty.
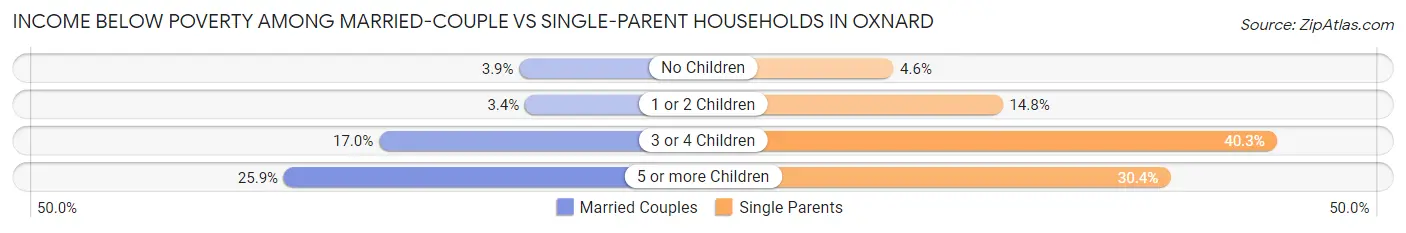
| Children | Married-Couple Families | Single-Parent Households |
| No Children | 487 (3.9%) | 275 (4.6%) |
| 1 or 2 Children | 373 (3.4%) | 790 (14.8%) |
| 3 or 4 Children | 580 (17.0%) | 799 (40.3%) |
| 5 or more Children | 99 (25.9%) | 76 (30.4%) |
| Total | 1,539 (5.7%) | 1,940 (14.3%) |
Race in Oxnard
The most populous races in Oxnard are Hispanic or Latino (153,325 | 75.8%), White / Caucasian (95,943 | 47.4%), and Two or more Races (54,698 | 27.0%).
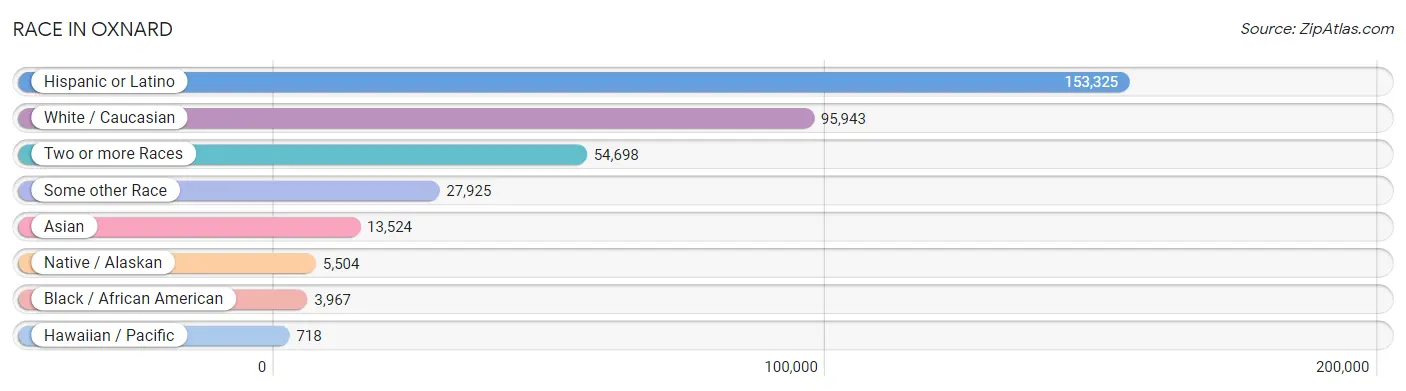
| Race | # Population | % Population |
| Asian | 13,524 | 6.7% |
| Black / African American | 3,967 | 2.0% |
| Hawaiian / Pacific | 718 | 0.4% |
| Hispanic or Latino | 153,325 | 75.8% |
| Native / Alaskan | 5,504 | 2.7% |
| White / Caucasian | 95,943 | 47.4% |
| Two or more Races | 54,698 | 27.0% |
| Some other Race | 27,925 | 13.8% |
| Total | 202,279 | 100.0% |
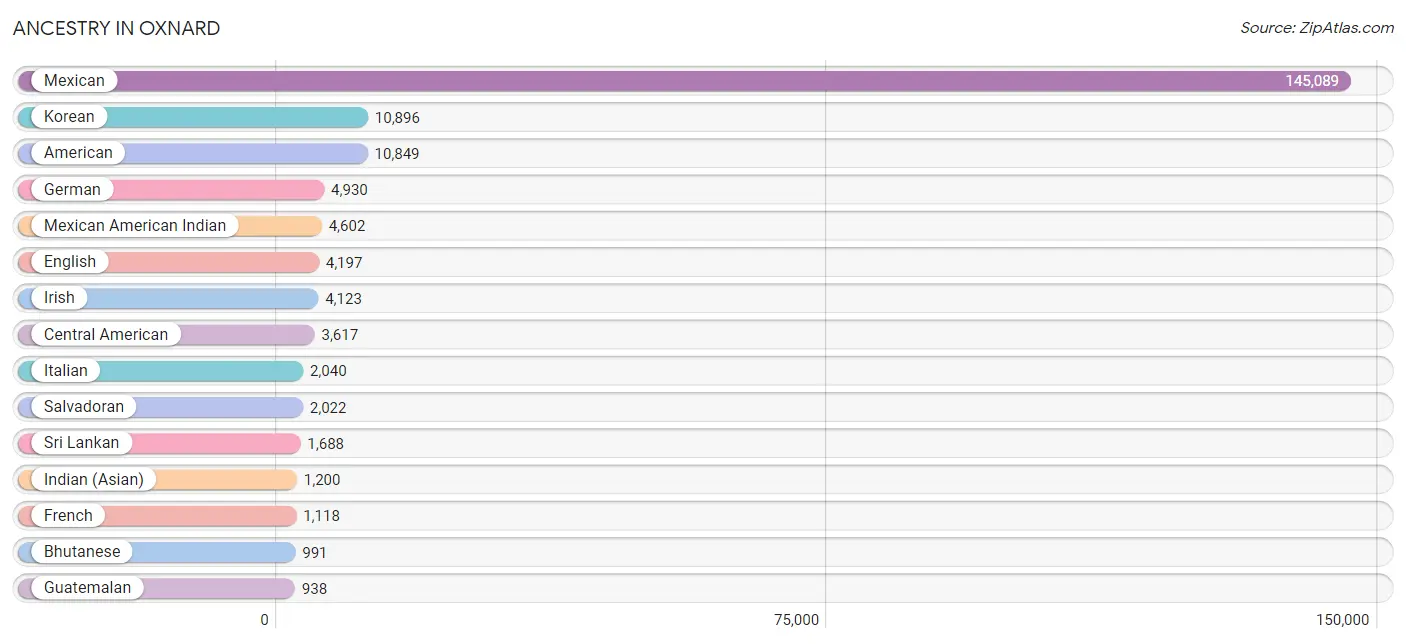
Ancestry in Oxnard
The most populous ancestries reported in Oxnard are Mexican (145,089 | 71.7%), Korean (10,896 | 5.4%), American (10,849 | 5.4%), German (4,930 | 2.4%), and Mexican American Indian (4,602 | 2.3%), together accounting for 87.2% of all Oxnard residents.
| Ancestry | # Population | % Population |
| African | 209 | 0.1% |
| Albanian | 42 | 0.0% |
| American | 10,849 | 5.4% |
| Apache | 234 | 0.1% |
| Arab | 384 | 0.2% |
| Argentinean | 165 | 0.1% |
| Armenian | 46 | 0.0% |
| Australian | 97 | 0.1% |
| Austrian | 83 | 0.0% |
| Barbadian | 19 | 0.0% |
| Basque | 17 | 0.0% |
| Belgian | 9 | 0.0% |
| Belizean | 14 | 0.0% |
| Bhutanese | 991 | 0.5% |
| Blackfeet | 91 | 0.0% |
| Bolivian | 55 | 0.0% |
| Brazilian | 42 | 0.0% |
| British | 197 | 0.1% |
| Burmese | 911 | 0.4% |
| Cambodian | 9 | 0.0% |
| Canadian | 84 | 0.0% |
| Celtic | 7 | 0.0% |
| Central American | 3,617 | 1.8% |
| Central American Indian | 429 | 0.2% |
| Cherokee | 216 | 0.1% |
| Chickasaw | 53 | 0.0% |
| Chilean | 84 | 0.0% |
| Chippewa | 24 | 0.0% |
| Choctaw | 148 | 0.1% |
| Colombian | 268 | 0.1% |
| Costa Rican | 293 | 0.1% |
| Croatian | 153 | 0.1% |
| Cuban | 200 | 0.1% |
| Czech | 443 | 0.2% |
| Czechoslovakian | 60 | 0.0% |
| Danish | 123 | 0.1% |
| Dutch | 458 | 0.2% |
| Dutch West Indian | 29 | 0.0% |
| Eastern European | 222 | 0.1% |
| Ecuadorian | 56 | 0.0% |
| Egyptian | 221 | 0.1% |
| English | 4,197 | 2.1% |
| Estonian | 12 | 0.0% |
| Ethiopian | 6 | 0.0% |
| European | 772 | 0.4% |
| Filipino | 13 | 0.0% |
| Finnish | 51 | 0.0% |
| French | 1,118 | 0.5% |
| French Canadian | 215 | 0.1% |
| German | 4,930 | 2.4% |
| Ghanaian | 7 | 0.0% |
| Greek | 142 | 0.1% |
| Guamanian / Chamorro | 132 | 0.1% |
| Guatemalan | 938 | 0.5% |
| Honduran | 173 | 0.1% |
| Hungarian | 373 | 0.2% |
| Icelander | 10 | 0.0% |
| Indian (Asian) | 1,200 | 0.6% |
| Indonesian | 7 | 0.0% |
| Iranian | 262 | 0.1% |
| Irish | 4,123 | 2.0% |
| Israeli | 9 | 0.0% |
| Italian | 2,040 | 1.0% |
| Jamaican | 188 | 0.1% |
| Japanese | 220 | 0.1% |
| Korean | 10,896 | 5.4% |
| Laotian | 189 | 0.1% |
| Latvian | 51 | 0.0% |
| Lebanese | 65 | 0.0% |
| Lithuanian | 43 | 0.0% |
| Malaysian | 92 | 0.1% |
| Mexican | 145,089 | 71.7% |
| Mexican American Indian | 4,602 | 2.3% |
| Mongolian | 12 | 0.0% |
| Native Hawaiian | 503 | 0.3% |
| Navajo | 69 | 0.0% |
| Nepalese | 20 | 0.0% |
| Nicaraguan | 101 | 0.1% |
| Nigerian | 35 | 0.0% |
| Northern European | 40 | 0.0% |
| Norwegian | 651 | 0.3% |
| Pakistani | 100 | 0.1% |
| Palestinian | 7 | 0.0% |
| Panamanian | 90 | 0.0% |
| Peruvian | 264 | 0.1% |
| Polish | 769 | 0.4% |
| Portuguese | 812 | 0.4% |
| Puerto Rican | 747 | 0.4% |
| Puget Sound Salish | 5 | 0.0% |
| Romanian | 72 | 0.0% |
| Russian | 757 | 0.4% |
| Salvadoran | 2,022 | 1.0% |
| Samoan | 182 | 0.1% |
| Scandinavian | 172 | 0.1% |
| Scotch-Irish | 403 | 0.2% |
| Scottish | 669 | 0.3% |
| Serbian | 20 | 0.0% |
| Sioux | 100 | 0.1% |
| Slovak | 84 | 0.0% |
| Slovene | 31 | 0.0% |
| South African | 146 | 0.1% |
| South American | 917 | 0.4% |
| South American Indian | 7 | 0.0% |
| Spaniard | 756 | 0.4% |
| Spanish | 339 | 0.2% |
| Spanish American | 3 | 0.0% |
| Spanish American Indian | 37 | 0.0% |
| Sri Lankan | 1,688 | 0.8% |
| Subsaharan African | 413 | 0.2% |
| Swedish | 795 | 0.4% |
| Swiss | 111 | 0.1% |
| Syrian | 70 | 0.0% |
| Thai | 543 | 0.3% |
| Tohono O'Odham | 6 | 0.0% |
| Tongan | 55 | 0.0% |
| Trinidadian and Tobagonian | 64 | 0.0% |
| Turkish | 8 | 0.0% |
| Ukrainian | 106 | 0.1% |
| Uruguayan | 8 | 0.0% |
| Venezuelan | 17 | 0.0% |
| Welsh | 251 | 0.1% |
| West Indian | 19 | 0.0% |
| Yaqui | 121 | 0.1% |
| Yugoslavian | 25 | 0.0% | View All 124 Rows |
Immigrants in Oxnard
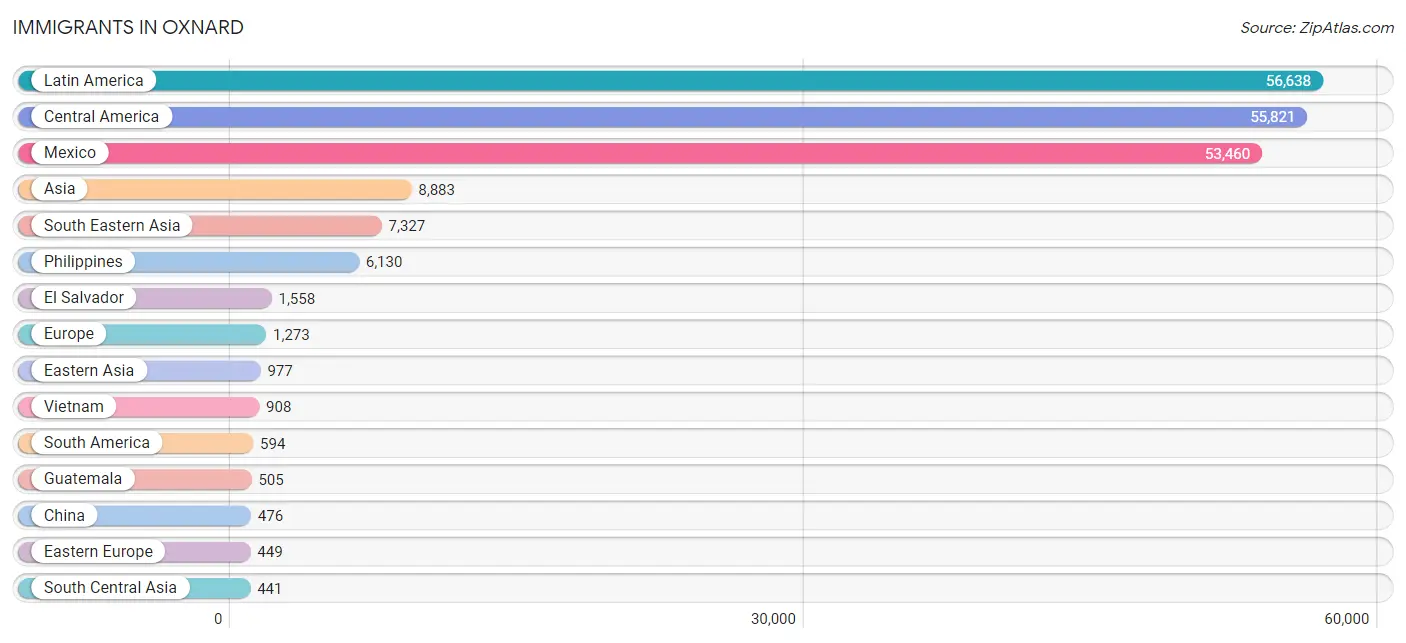
The most numerous immigrant groups reported in Oxnard came from Latin America (56,638 | 28.0%), Central America (55,821 | 27.6%), Mexico (53,460 | 26.4%), Asia (8,883 | 4.4%), and South Eastern Asia (7,327 | 3.6%), together accounting for 90.0% of all Oxnard residents.
| Immigration Origin | # Population | % Population |
| Africa | 243 | 0.1% |
| Albania | 25 | 0.0% |
| Argentina | 63 | 0.0% |
| Asia | 8,883 | 4.4% |
| Australia | 35 | 0.0% |
| Bangladesh | 15 | 0.0% |
| Barbados | 41 | 0.0% |
| Belarus | 14 | 0.0% |
| Belgium | 9 | 0.0% |
| Belize | 14 | 0.0% |
| Bolivia | 43 | 0.0% |
| Brazil | 42 | 0.0% |
| Cambodia | 128 | 0.1% |
| Canada | 161 | 0.1% |
| Caribbean | 223 | 0.1% |
| Central America | 55,821 | 27.6% |
| Chile | 35 | 0.0% |
| China | 476 | 0.2% |
| Colombia | 155 | 0.1% |
| Costa Rica | 78 | 0.0% |
| Cuba | 36 | 0.0% |
| Czechoslovakia | 57 | 0.0% |
| Eastern Africa | 33 | 0.0% |
| Eastern Asia | 977 | 0.5% |
| Eastern Europe | 449 | 0.2% |
| Ecuador | 44 | 0.0% |
| Egypt | 128 | 0.1% |
| El Salvador | 1,558 | 0.8% |
| England | 144 | 0.1% |
| Ethiopia | 6 | 0.0% |
| Europe | 1,273 | 0.6% |
| Fiji | 4 | 0.0% |
| France | 61 | 0.0% |
| Germany | 269 | 0.1% |
| Guatemala | 505 | 0.3% |
| Guyana | 12 | 0.0% |
| Honduras | 127 | 0.1% |
| Hong Kong | 33 | 0.0% |
| Hungary | 58 | 0.0% |
| India | 220 | 0.1% |
| Indonesia | 15 | 0.0% |
| Iran | 157 | 0.1% |
| Ireland | 6 | 0.0% |
| Israel | 57 | 0.0% |
| Italy | 3 | 0.0% |
| Jamaica | 46 | 0.0% |
| Japan | 254 | 0.1% |
| Jordan | 7 | 0.0% |
| Kenya | 27 | 0.0% |
| Korea | 247 | 0.1% |
| Laos | 83 | 0.0% |
| Latin America | 56,638 | 28.0% |
| Lebanon | 31 | 0.0% |
| Mexico | 53,460 | 26.4% |
| Micronesia | 91 | 0.0% |
| Middle Africa | 10 | 0.0% |
| Netherlands | 6 | 0.0% |
| Nicaragua | 28 | 0.0% |
| Northern Africa | 128 | 0.1% |
| Northern Europe | 232 | 0.1% |
| Oceania | 147 | 0.1% |
| Pakistan | 5 | 0.0% |
| Panama | 51 | 0.0% |
| Peru | 157 | 0.1% |
| Philippines | 6,130 | 3.0% |
| Poland | 68 | 0.0% |
| Portugal | 224 | 0.1% |
| Romania | 28 | 0.0% |
| Russia | 78 | 0.0% |
| Scotland | 27 | 0.0% |
| Serbia | 20 | 0.0% |
| Sierra Leone | 39 | 0.0% |
| Singapore | 10 | 0.0% |
| South Africa | 33 | 0.0% |
| South America | 594 | 0.3% |
| South Central Asia | 441 | 0.2% |
| South Eastern Asia | 7,327 | 3.6% |
| Southern Europe | 246 | 0.1% |
| Spain | 19 | 0.0% |
| Sri Lanka | 1 | 0.0% |
| Sweden | 11 | 0.0% |
| Switzerland | 1 | 0.0% |
| Syria | 26 | 0.0% |
| Taiwan | 111 | 0.1% |
| Thailand | 53 | 0.0% |
| Trinidad and Tobago | 90 | 0.0% |
| Turkey | 3 | 0.0% |
| Ukraine | 66 | 0.0% |
| Uruguay | 8 | 0.0% |
| Venezuela | 35 | 0.0% |
| Vietnam | 908 | 0.4% |
| Western Africa | 39 | 0.0% |
| Western Asia | 138 | 0.1% |
| Western Europe | 346 | 0.2% | View All 94 Rows |
Sex and Age in Oxnard
Sex and Age in Oxnard
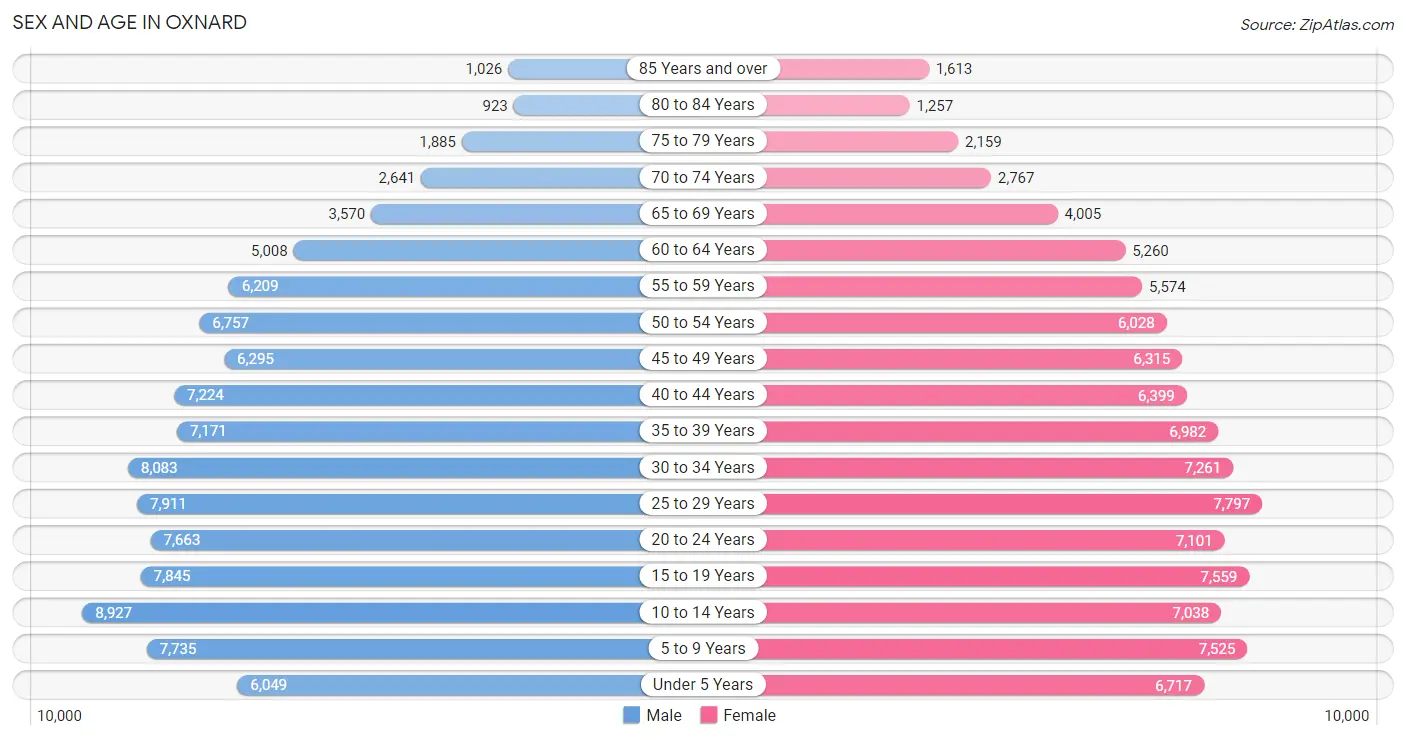
The most populous age groups in Oxnard are 10 to 14 Years (8,927 | 8.7%) for men and 25 to 29 Years (7,797 | 7.9%) for women.
| Age Bracket | Male | Female |
| Under 5 Years | 6,049 (5.9%) | 6,717 (6.8%) |
| 5 to 9 Years | 7,735 (7.5%) | 7,525 (7.6%) |
| 10 to 14 Years | 8,927 (8.7%) | 7,038 (7.1%) |
| 15 to 19 Years | 7,845 (7.6%) | 7,559 (7.6%) |
| 20 to 24 Years | 7,663 (7.4%) | 7,101 (7.1%) |
| 25 to 29 Years | 7,911 (7.7%) | 7,797 (7.9%) |
| 30 to 34 Years | 8,083 (7.9%) | 7,261 (7.3%) |
| 35 to 39 Years | 7,171 (7.0%) | 6,982 (7.0%) |
| 40 to 44 Years | 7,224 (7.0%) | 6,399 (6.4%) |
| 45 to 49 Years | 6,295 (6.1%) | 6,315 (6.4%) |
| 50 to 54 Years | 6,757 (6.6%) | 6,028 (6.1%) |
| 55 to 59 Years | 6,209 (6.0%) | 5,574 (5.6%) |
| 60 to 64 Years | 5,008 (4.9%) | 5,260 (5.3%) |
| 65 to 69 Years | 3,570 (3.5%) | 4,005 (4.0%) |
| 70 to 74 Years | 2,641 (2.6%) | 2,767 (2.8%) |
| 75 to 79 Years | 1,885 (1.8%) | 2,159 (2.2%) |
| 80 to 84 Years | 923 (0.9%) | 1,257 (1.3%) |
| 85 Years and over | 1,026 (1.0%) | 1,613 (1.6%) |
| Total | 102,922 (100.0%) | 99,357 (100.0%) |
Families and Households in Oxnard
Median Family Size in Oxnard
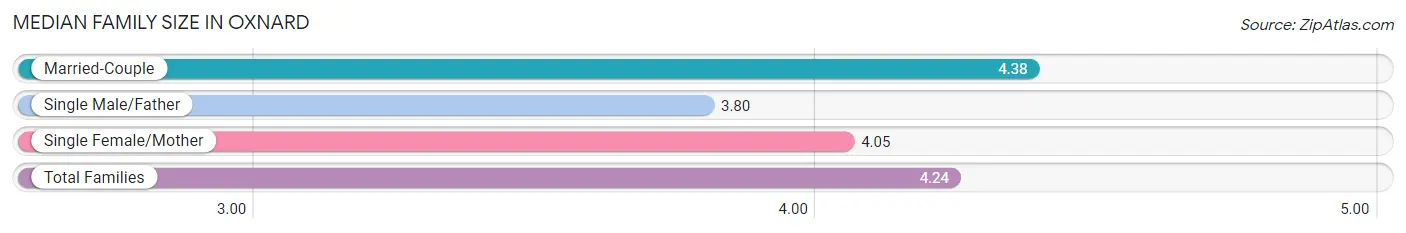
The median family size in Oxnard is 4.24 persons per family, with married-couple families (27,236 | 66.8%) accounting for the largest median family size of 4.38 persons per family. On the other hand, single male/father families (4,614 | 11.3%) represent the smallest median family size with 3.80 persons per family.
| Family Type | # Families | Family Size |
| Married-Couple | 27,236 (66.8%) | 4.38 |
| Single Male/Father | 4,614 (11.3%) | 3.80 |
| Single Female/Mother | 8,925 (21.9%) | 4.05 |
| Total Families | 40,775 (100.0%) | 4.24 |
Median Household Size in Oxnard
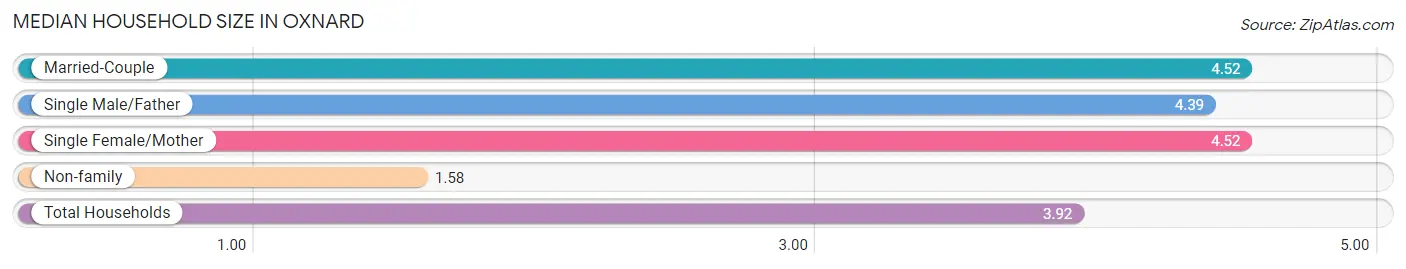
The median household size in Oxnard is 3.92 persons per household, with married-couple households (27,236 | 53.3%) accounting for the largest median household size of 4.52 persons per household. non-family households (10,324 | 20.2%) represent the smallest median household size with 1.58 persons per household.
| Household Type | # Households | Household Size |
| Married-Couple | 27,236 (53.3%) | 4.52 |
| Single Male/Father | 4,614 (9.0%) | 4.39 |
| Single Female/Mother | 8,925 (17.5%) | 4.52 |
| Non-family | 10,324 (20.2%) | 1.58 |
| Total Households | 51,099 (100.0%) | 3.92 |
Household Size by Marriage Status in Oxnard
Out of a total of 51,099 households in Oxnard, 40,775 (79.8%) are family households, while 10,324 (20.2%) are nonfamily households. The most numerous type of family households are 2-person households, comprising 10,028, and the most common type of nonfamily households are 1-person households, comprising 7,147.
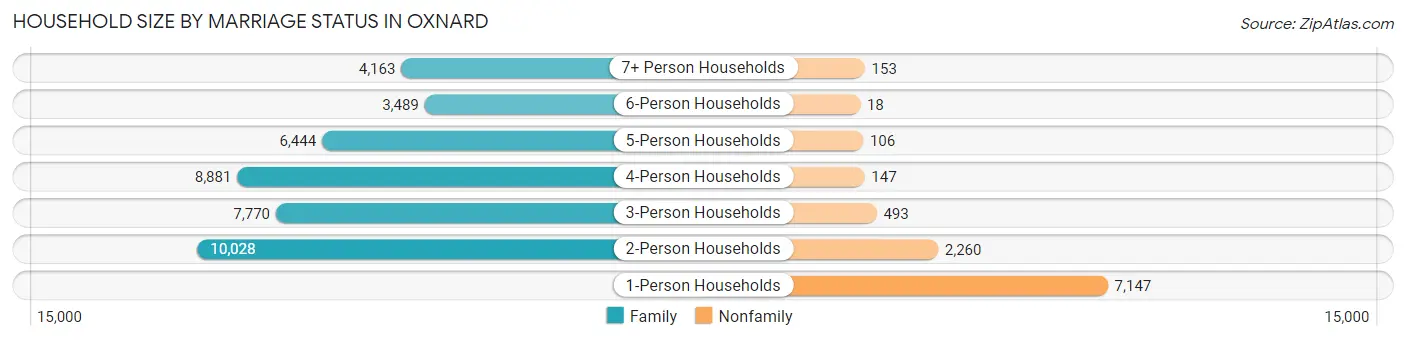
| Household Size | Family Households | Nonfamily Households |
| 1-Person Households | - | 7,147 (14.0%) |
| 2-Person Households | 10,028 (19.6%) | 2,260 (4.4%) |
| 3-Person Households | 7,770 (15.2%) | 493 (1.0%) |
| 4-Person Households | 8,881 (17.4%) | 147 (0.3%) |
| 5-Person Households | 6,444 (12.6%) | 106 (0.2%) |
| 6-Person Households | 3,489 (6.8%) | 18 (0.0%) |
| 7+ Person Households | 4,163 (8.2%) | 153 (0.3%) |
| Total | 40,775 (79.8%) | 10,324 (20.2%) |
Female Fertility in Oxnard
Fertility by Age in Oxnard
Average fertility rate in Oxnard is 47.0 births per 1,000 women. Women in the age bracket of 20 to 34 years have the highest fertility rate with 67.0 births per 1,000 women. Women in the age bracket of 20 to 34 years acount for 62.1% of all women with births.
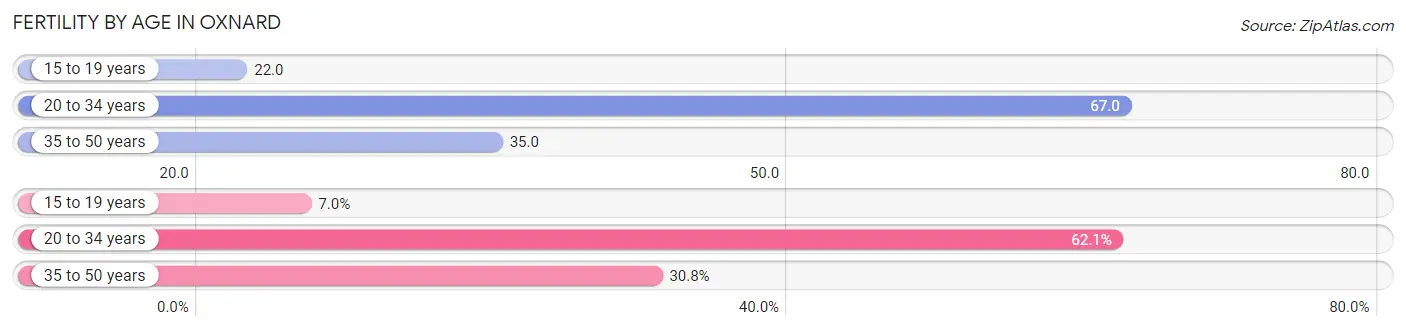
| Age Bracket | Women with Births | Births / 1,000 Women |
| 15 to 19 years | 168 (7.0%) | 22.0 |
| 20 to 34 years | 1,487 (62.1%) | 67.0 |
| 35 to 50 years | 738 (30.8%) | 35.0 |
| Total | 2,393 (100.0%) | 47.0 |
Fertility by Age by Marriage Status in Oxnard
57.6% of women with births (2,393) in Oxnard are married. The highest percentage of unmarried women with births falls into 20 to 34 years age bracket with 51.3% of them unmarried at the time of birth, while the lowest percentage of unmarried women with births belong to 35 to 50 years age bracket with 23.4% of them unmarried.
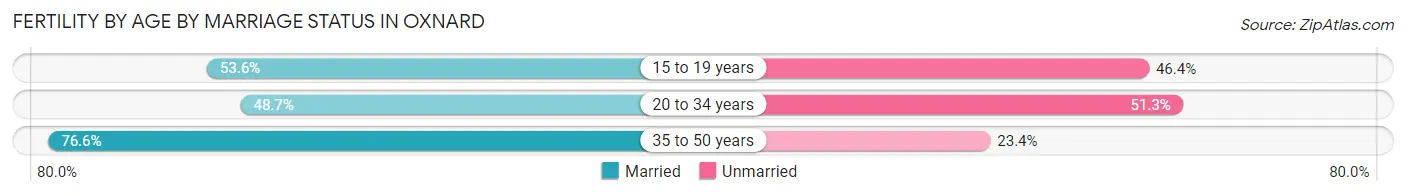
| Age Bracket | Married | Unmarried |
| 15 to 19 years | 90 (53.6%) | 78 (46.4%) |
| 20 to 34 years | 724 (48.7%) | 763 (51.3%) |
| 35 to 50 years | 565 (76.6%) | 173 (23.4%) |
| Total | 1,378 (57.6%) | 1,015 (42.4%) |
Fertility by Education in Oxnard
Average fertility rate in Oxnard is 47.0 births per 1,000 women. Women with the education attainment of high school diploma have the highest fertility rate of 62.0 births per 1,000 women, while women with the education attainment of less than high school have the lowest fertility at 34.0 births per 1,000 women. Women with the education attainment of high school diploma represent 33.2% of all women with births.
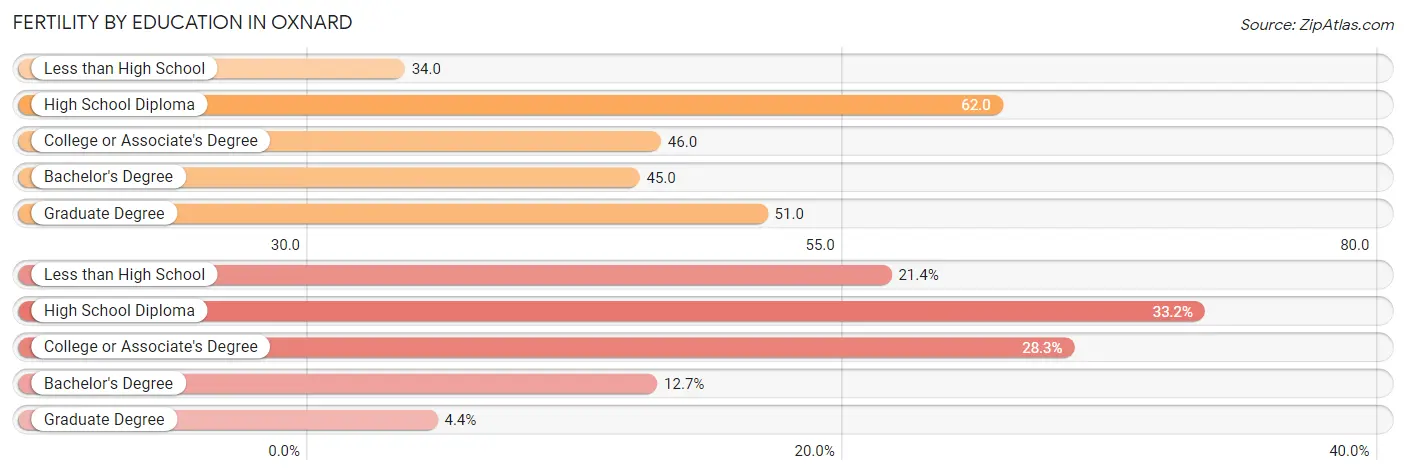
| Educational Attainment | Women with Births | Births / 1,000 Women |
| Less than High School | 513 (21.4%) | 34.0 |
| High School Diploma | 794 (33.2%) | 62.0 |
| College or Associate's Degree | 677 (28.3%) | 46.0 |
| Bachelor's Degree | 303 (12.7%) | 45.0 |
| Graduate Degree | 106 (4.4%) | 51.0 |
| Total | 2,393 (100.0%) | 47.0 |
Fertility by Education by Marriage Status in Oxnard
42.4% of women with births in Oxnard are unmarried. Women with the educational attainment of bachelor's degree are most likely to be married with 84.5% of them married at childbirth, while women with the educational attainment of college or associate's degree are least likely to be married with 58.8% of them unmarried at childbirth.
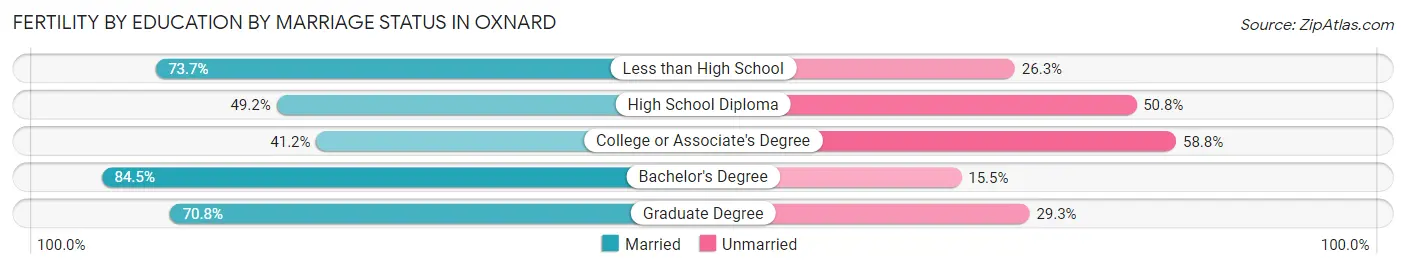
| Educational Attainment | Married | Unmarried |
| Less than High School | 378 (73.7%) | 135 (26.3%) |
| High School Diploma | 391 (49.2%) | 403 (50.8%) |
| College or Associate's Degree | 279 (41.2%) | 398 (58.8%) |
| Bachelor's Degree | 256 (84.5%) | 47 (15.5%) |
| Graduate Degree | 75 (70.8%) | 31 (29.2%) |
| Total | 1,378 (57.6%) | 1,015 (42.4%) |
Employment Characteristics in Oxnard
Employment by Class of Employer in Oxnard
Among the 95,928 employed individuals in Oxnard, private company employees (72,500 | 75.6%), local government employees (6,856 | 7.1%), and self-employed (not incorporated) (4,656 | 4.9%) make up the most common classes of employment.
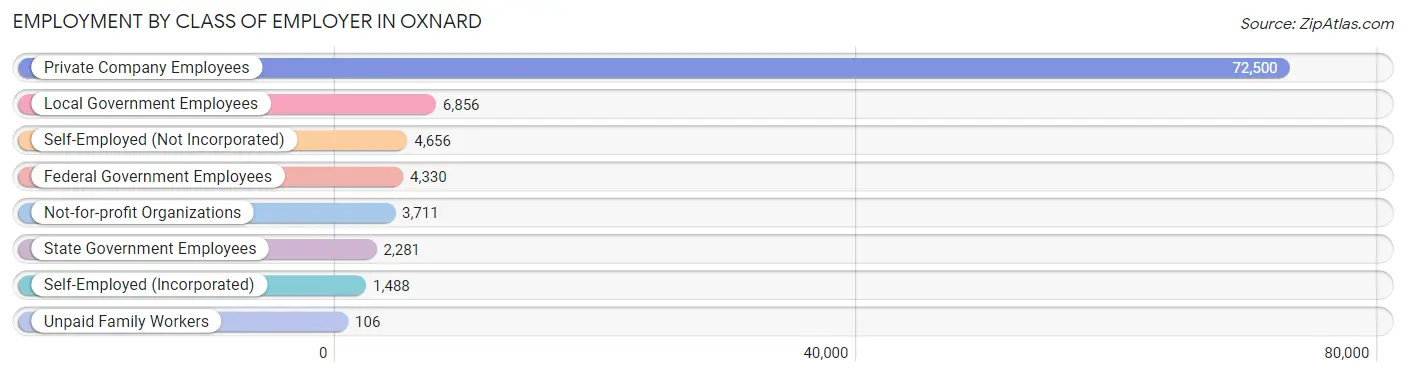
| Employer Class | # Employees | % Employees |
| Private Company Employees | 72,500 | 75.6% |
| Self-Employed (Incorporated) | 1,488 | 1.5% |
| Self-Employed (Not Incorporated) | 4,656 | 4.9% |
| Not-for-profit Organizations | 3,711 | 3.9% |
| Local Government Employees | 6,856 | 7.1% |
| State Government Employees | 2,281 | 2.4% |
| Federal Government Employees | 4,330 | 4.5% |
| Unpaid Family Workers | 106 | 0.1% |
| Total | 95,928 | 100.0% |
Employment Status by Age in Oxnard
According to the labor force statistics for Oxnard, out of the total population over 16 years of age (154,811), 67.8% or 104,962 individuals are in the labor force, with 5.9% or 6,193 of them unemployed. The age group with the highest labor force participation rate is 25 to 29 years, with 86.6% or 13,603 individuals in the labor force. Within the labor force, the 16 to 19 years age range has the highest percentage of unemployed individuals, with 15.2% or 589 of them being unemployed.
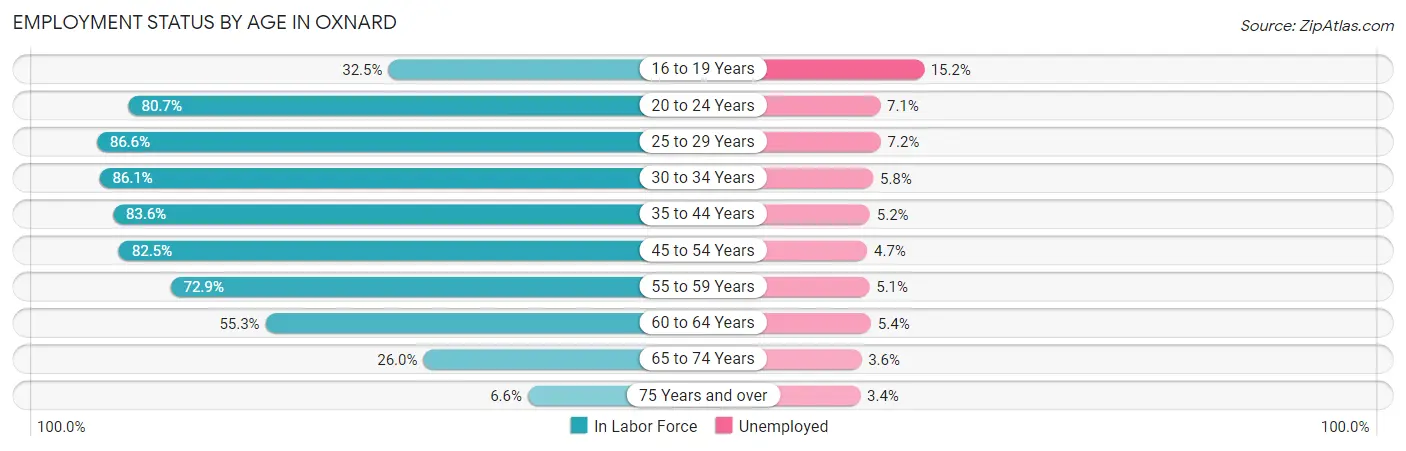
| Age Bracket | In Labor Force | Unemployed |
| 16 to 19 Years | 3,876 (32.5%) | 589 (15.2%) |
| 20 to 24 Years | 11,915 (80.7%) | 846 (7.1%) |
| 25 to 29 Years | 13,603 (86.6%) | 979 (7.2%) |
| 30 to 34 Years | 13,211 (86.1%) | 766 (5.8%) |
| 35 to 44 Years | 23,221 (83.6%) | 1,207 (5.2%) |
| 45 to 54 Years | 20,951 (82.5%) | 985 (4.7%) |
| 55 to 59 Years | 8,590 (72.9%) | 438 (5.1%) |
| 60 to 64 Years | 5,678 (55.3%) | 307 (5.4%) |
| 65 to 74 Years | 3,376 (26.0%) | 122 (3.6%) |
| 75 Years and over | 585 (6.6%) | 20 (3.4%) |
| Total | 104,962 (67.8%) | 6,193 (5.9%) |
Employment Status by Educational Attainment in Oxnard
According to labor force statistics for Oxnard, 80.2% of individuals (85,232) out of the total population between 25 and 64 years of age (106,274) are in the labor force, with 5.5% or 4,688 of them being unemployed. The group with the highest labor force participation rate are those with the educational attainment of bachelor's degree or higher, with 87.7% or 17,529 individuals in the labor force. Within the labor force, individuals with less than high school education have the highest percentage of unemployment, with 5.9% or 1,400 of them being unemployed.
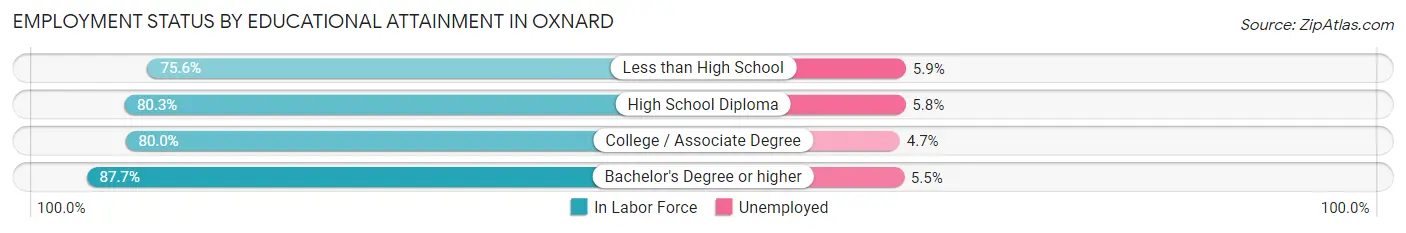
| Educational Attainment | In Labor Force | Unemployed |
| Less than High School | 23,721 (75.6%) | 1,851 (5.9%) |
| High School Diploma | 22,656 (80.3%) | 1,636 (5.8%) |
| College / Associate Degree | 21,356 (80.0%) | 1,255 (4.7%) |
| Bachelor's Degree or higher | 17,529 (87.7%) | 1,099 (5.5%) |
| Total | 85,232 (80.2%) | 5,845 (5.5%) |
Employment Occupations by Sex in Oxnard
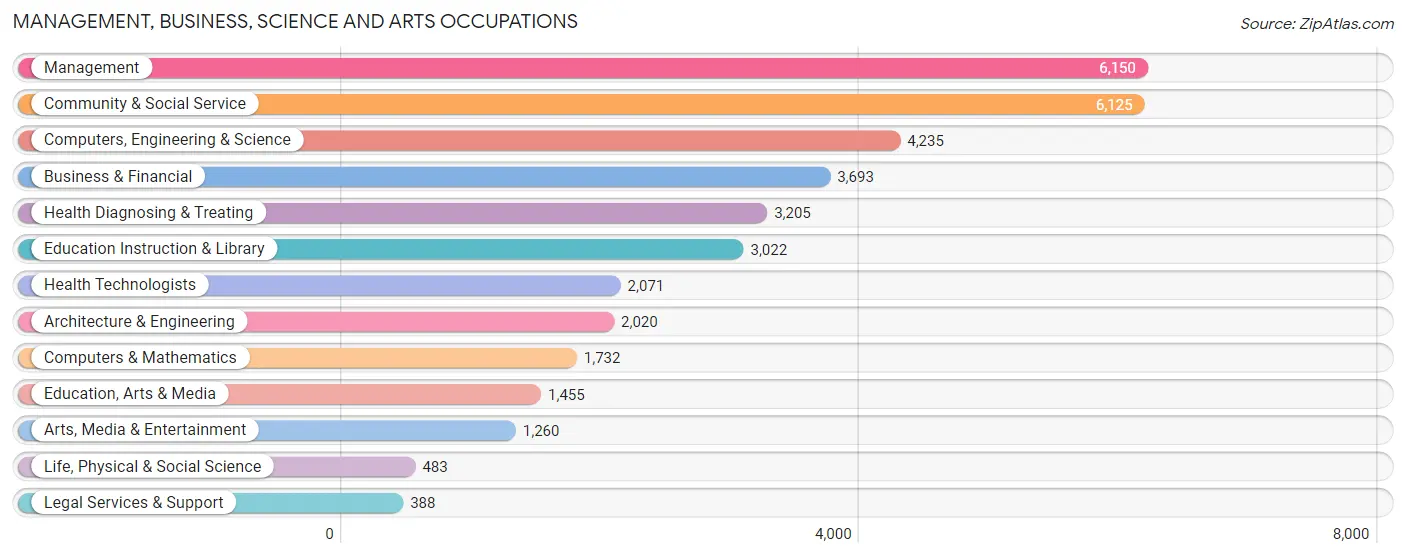
Management, Business, Science and Arts Occupations
The most common Management, Business, Science and Arts occupations in Oxnard are Management (6,150 | 6.3%), Community & Social Service (6,125 | 6.2%), Computers, Engineering & Science (4,235 | 4.3%), Business & Financial (3,693 | 3.8%), and Health Diagnosing & Treating (3,205 | 3.3%).
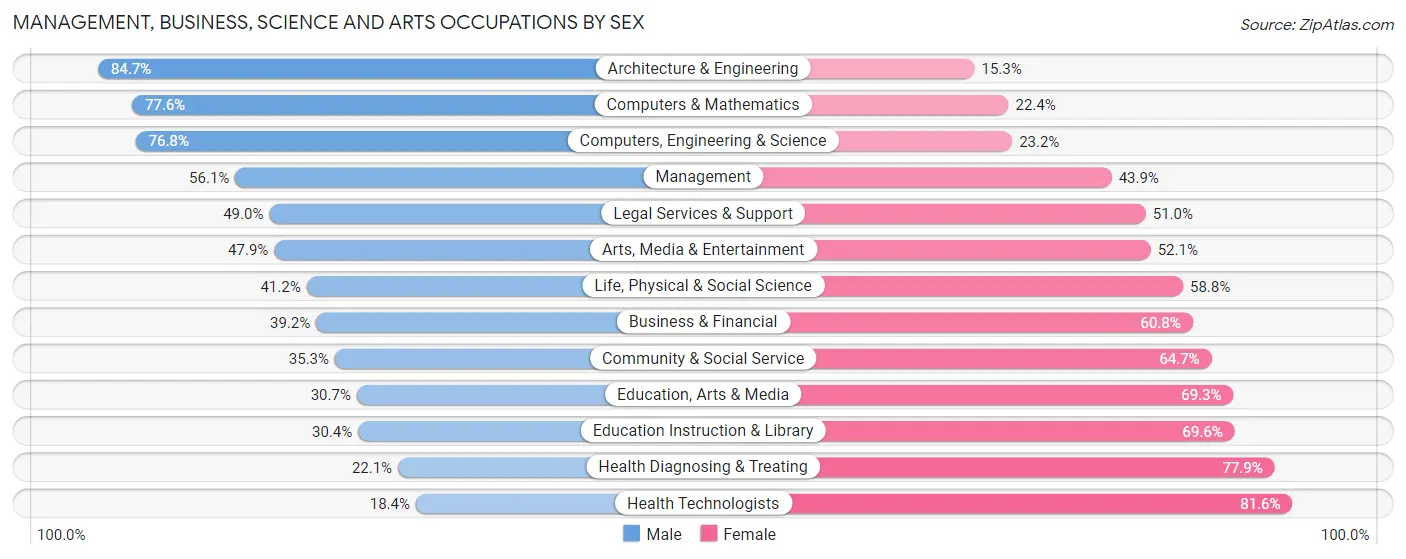
Management, Business, Science and Arts Occupations by Sex
Within the Management, Business, Science and Arts occupations in Oxnard, the most male-oriented occupations are Architecture & Engineering (84.7%), Computers & Mathematics (77.6%), and Computers, Engineering & Science (76.8%), while the most female-oriented occupations are Health Technologists (81.6%), Health Diagnosing & Treating (77.9%), and Education Instruction & Library (69.6%).
| Occupation | Male | Female |
| Management | 3,449 (56.1%) | 2,701 (43.9%) |
| Business & Financial | 1,448 (39.2%) | 2,245 (60.8%) |
| Computers, Engineering & Science | 3,254 (76.8%) | 981 (23.2%) |
| Computers & Mathematics | 1,344 (77.6%) | 388 (22.4%) |
| Architecture & Engineering | 1,711 (84.7%) | 309 (15.3%) |
| Life, Physical & Social Science | 199 (41.2%) | 284 (58.8%) |
| Community & Social Service | 2,161 (35.3%) | 3,964 (64.7%) |
| Education, Arts & Media | 447 (30.7%) | 1,008 (69.3%) |
| Legal Services & Support | 190 (49.0%) | 198 (51.0%) |
| Education Instruction & Library | 920 (30.4%) | 2,102 (69.6%) |
| Arts, Media & Entertainment | 604 (47.9%) | 656 (52.1%) |
| Health Diagnosing & Treating | 709 (22.1%) | 2,496 (77.9%) |
| Health Technologists | 381 (18.4%) | 1,690 (81.6%) |
| Total (Category) | 11,021 (47.1%) | 12,387 (52.9%) |
| Total (Overall) | 55,597 (56.7%) | 42,538 (43.3%) |
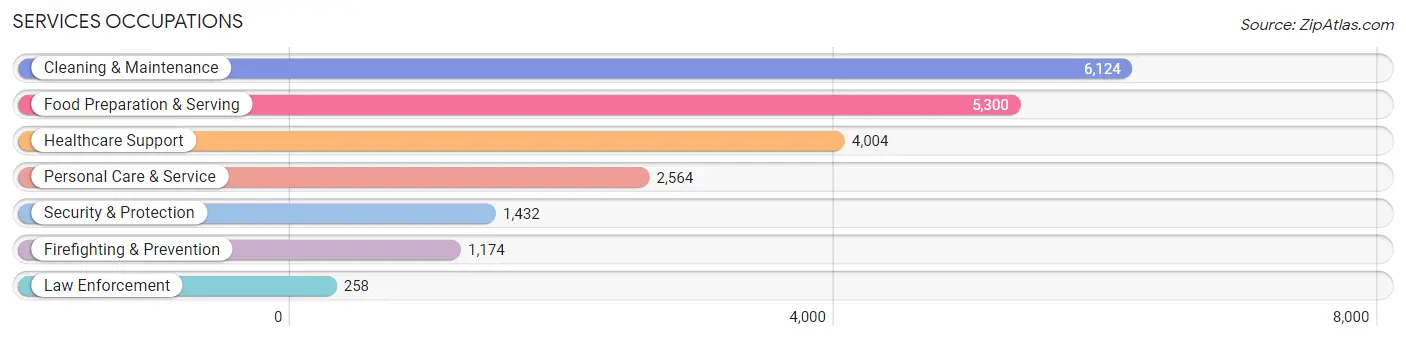
Services Occupations
The most common Services occupations in Oxnard are Cleaning & Maintenance (6,124 | 6.2%), Food Preparation & Serving (5,300 | 5.4%), Healthcare Support (4,004 | 4.1%), Personal Care & Service (2,564 | 2.6%), and Security & Protection (1,432 | 1.5%).
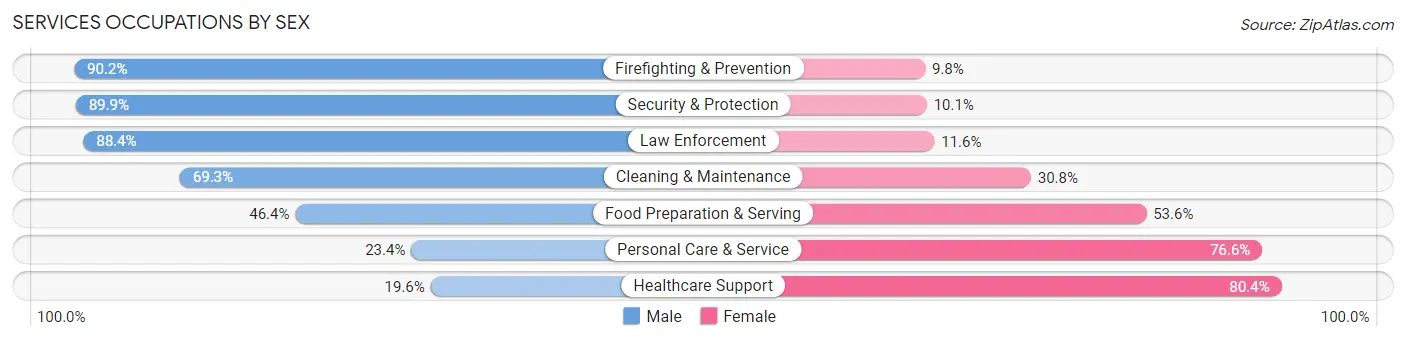
Services Occupations by Sex
Within the Services occupations in Oxnard, the most male-oriented occupations are Firefighting & Prevention (90.2%), Security & Protection (89.9%), and Law Enforcement (88.4%), while the most female-oriented occupations are Healthcare Support (80.4%), Personal Care & Service (76.6%), and Food Preparation & Serving (53.6%).
| Occupation | Male | Female |
| Healthcare Support | 785 (19.6%) | 3,219 (80.4%) |
| Security & Protection | 1,287 (89.9%) | 145 (10.1%) |
| Firefighting & Prevention | 1,059 (90.2%) | 115 (9.8%) |
| Law Enforcement | 228 (88.4%) | 30 (11.6%) |
| Food Preparation & Serving | 2,459 (46.4%) | 2,841 (53.6%) |
| Cleaning & Maintenance | 4,241 (69.3%) | 1,883 (30.7%) |
| Personal Care & Service | 601 (23.4%) | 1,963 (76.6%) |
| Total (Category) | 9,373 (48.2%) | 10,051 (51.7%) |
| Total (Overall) | 55,597 (56.7%) | 42,538 (43.3%) |
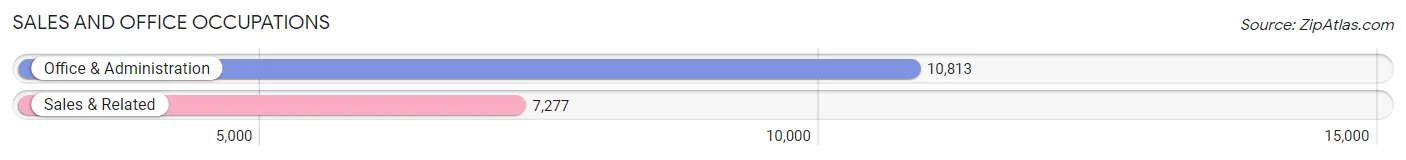
Sales and Office Occupations
The most common Sales and Office occupations in Oxnard are Office & Administration (10,813 | 11.0%), and Sales & Related (7,277 | 7.4%).
Sales and Office Occupations by Sex
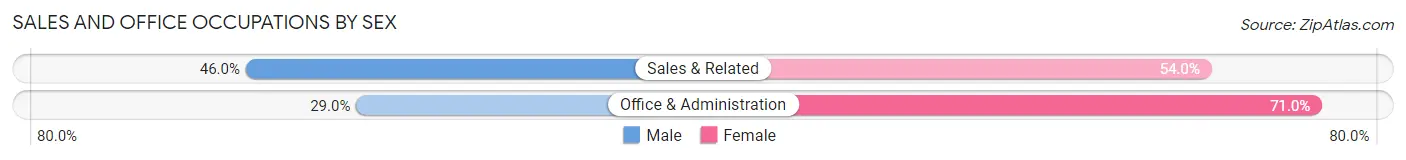
| Occupation | Male | Female |
| Sales & Related | 3,345 (46.0%) | 3,932 (54.0%) |
| Office & Administration | 3,134 (29.0%) | 7,679 (71.0%) |
| Total (Category) | 6,479 (35.8%) | 11,611 (64.2%) |
| Total (Overall) | 55,597 (56.7%) | 42,538 (43.3%) |
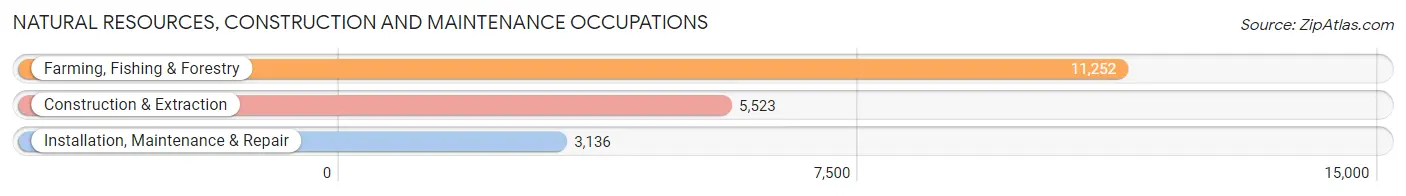
Natural Resources, Construction and Maintenance Occupations
The most common Natural Resources, Construction and Maintenance occupations in Oxnard are Farming, Fishing & Forestry (11,252 | 11.5%), Construction & Extraction (5,523 | 5.6%), and Installation, Maintenance & Repair (3,136 | 3.2%).
Natural Resources, Construction and Maintenance Occupations by Sex
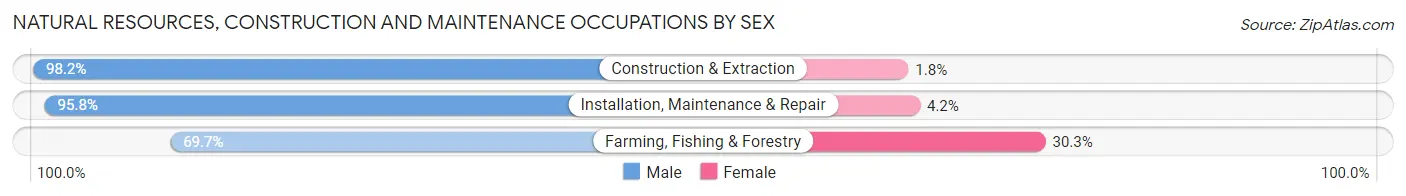
| Occupation | Male | Female |
| Farming, Fishing & Forestry | 7,843 (69.7%) | 3,409 (30.3%) |
| Construction & Extraction | 5,425 (98.2%) | 98 (1.8%) |
| Installation, Maintenance & Repair | 3,005 (95.8%) | 131 (4.2%) |
| Total (Category) | 16,273 (81.7%) | 3,638 (18.3%) |
| Total (Overall) | 55,597 (56.7%) | 42,538 (43.3%) |
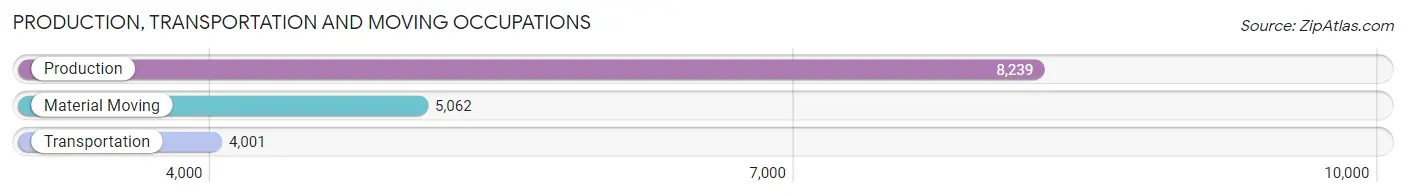
Production, Transportation and Moving Occupations
The most common Production, Transportation and Moving occupations in Oxnard are Production (8,239 | 8.4%), Material Moving (5,062 | 5.2%), and Transportation (4,001 | 4.1%).
Production, Transportation and Moving Occupations by Sex
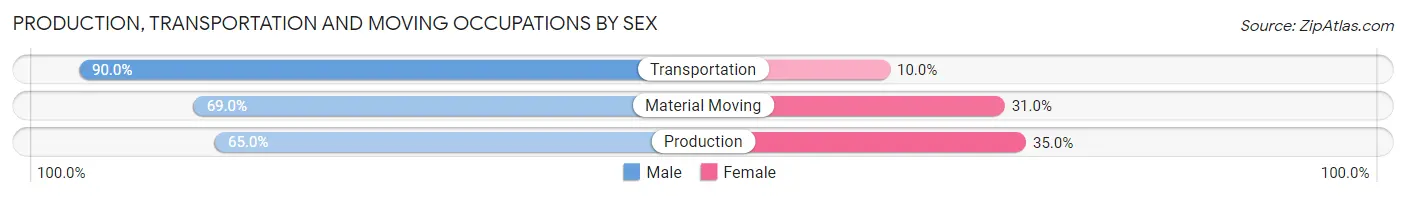
| Occupation | Male | Female |
| Production | 5,359 (65.0%) | 2,880 (35.0%) |
| Transportation | 3,601 (90.0%) | 400 (10.0%) |
| Material Moving | 3,491 (69.0%) | 1,571 (31.0%) |
| Total (Category) | 12,451 (72.0%) | 4,851 (28.0%) |
| Total (Overall) | 55,597 (56.7%) | 42,538 (43.3%) |
Employment Industries by Sex in Oxnard
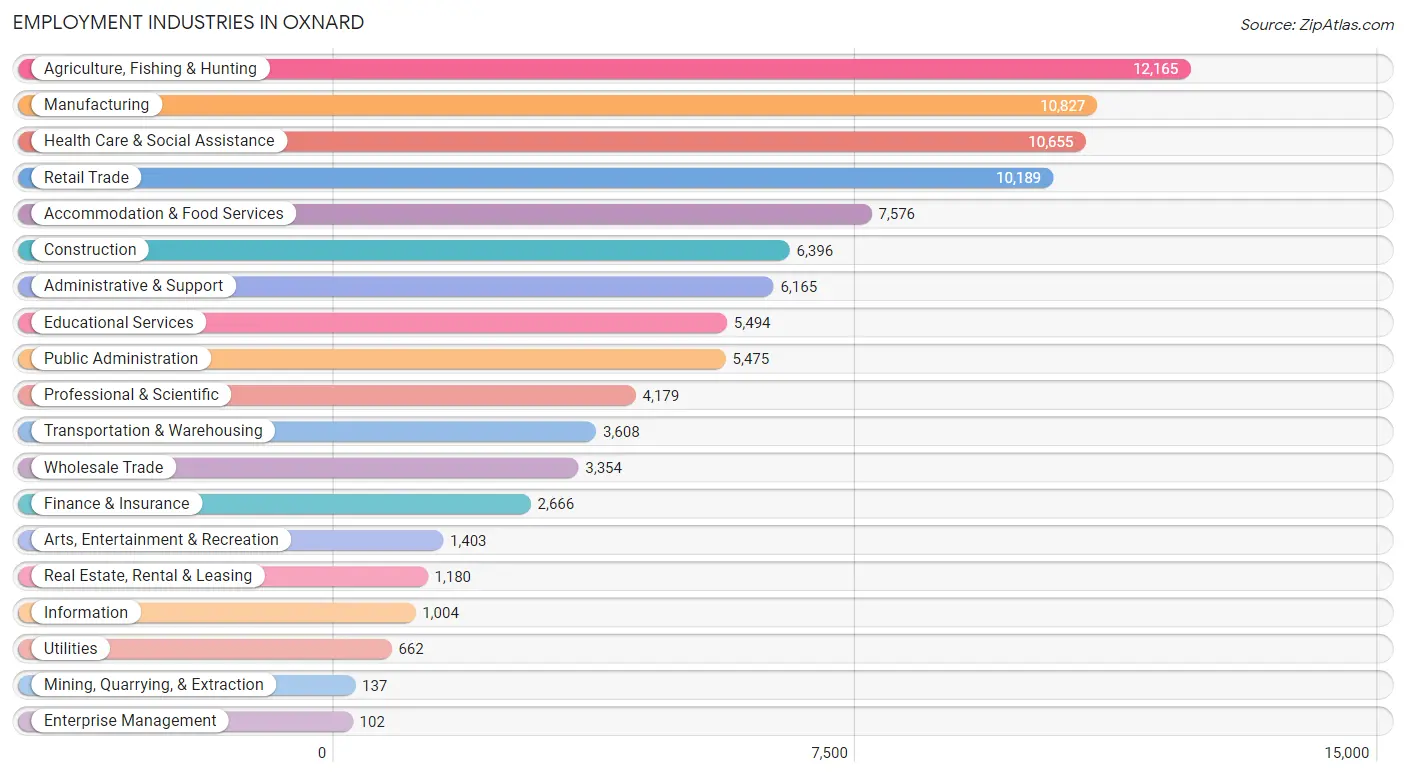
Employment Industries in Oxnard
The major employment industries in Oxnard include Agriculture, Fishing & Hunting (12,165 | 12.4%), Manufacturing (10,827 | 11.0%), Health Care & Social Assistance (10,655 | 10.9%), Retail Trade (10,189 | 10.4%), and Accommodation & Food Services (7,576 | 7.7%).
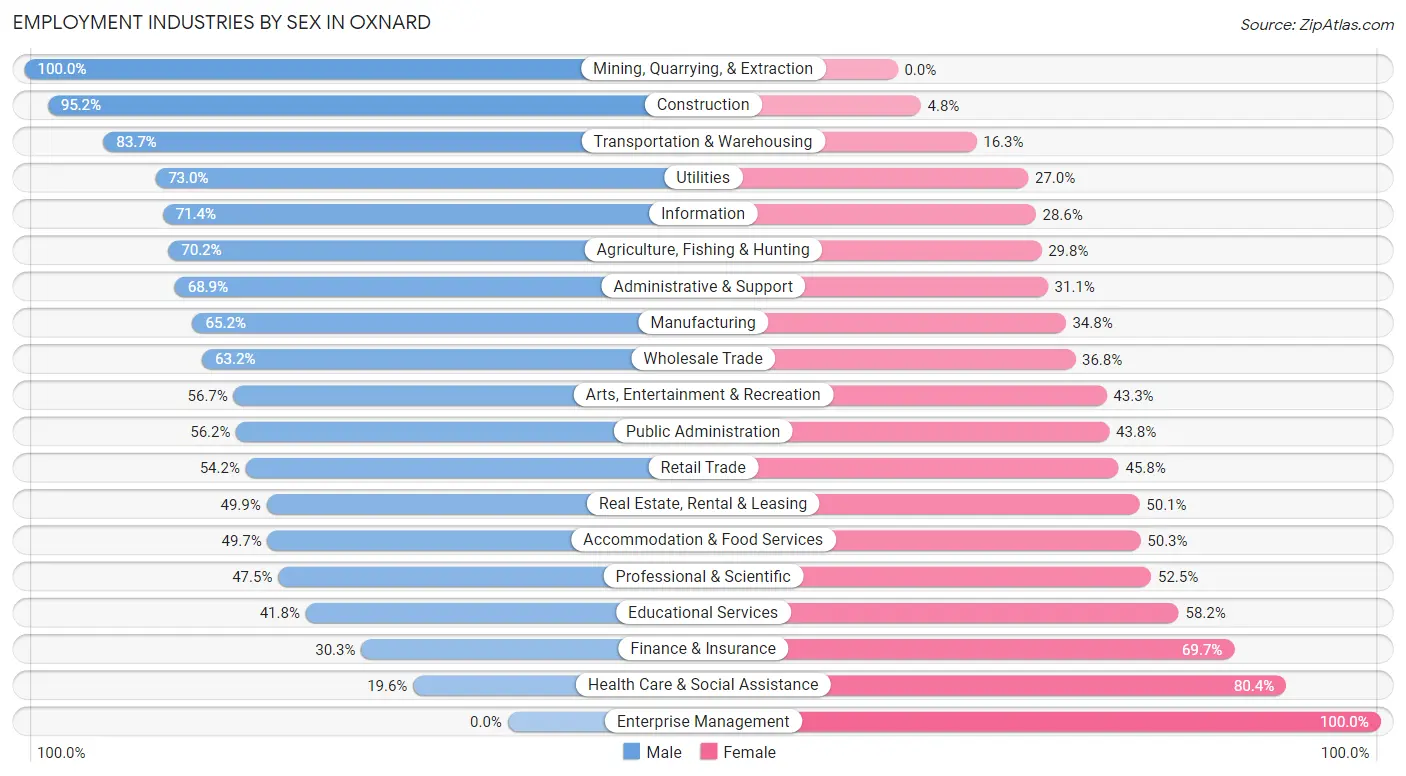
Employment Industries by Sex in Oxnard
The Oxnard industries that see more men than women are Mining, Quarrying, & Extraction (100.0%), Construction (95.2%), and Transportation & Warehousing (83.7%), whereas the industries that tend to have a higher number of women are Enterprise Management (100.0%), Health Care & Social Assistance (80.4%), and Finance & Insurance (69.7%).
| Industry | Male | Female |
| Agriculture, Fishing & Hunting | 8,544 (70.2%) | 3,621 (29.8%) |
| Mining, Quarrying, & Extraction | 137 (100.0%) | 0 (0.0%) |
| Construction | 6,089 (95.2%) | 307 (4.8%) |
| Manufacturing | 7,060 (65.2%) | 3,767 (34.8%) |
| Wholesale Trade | 2,121 (63.2%) | 1,233 (36.8%) |
| Retail Trade | 5,525 (54.2%) | 4,664 (45.8%) |
| Transportation & Warehousing | 3,019 (83.7%) | 589 (16.3%) |
| Utilities | 483 (73.0%) | 179 (27.0%) |
| Information | 717 (71.4%) | 287 (28.6%) |
| Finance & Insurance | 808 (30.3%) | 1,858 (69.7%) |
| Real Estate, Rental & Leasing | 589 (49.9%) | 591 (50.1%) |
| Professional & Scientific | 1,985 (47.5%) | 2,194 (52.5%) |
| Enterprise Management | 0 (0.0%) | 102 (100.0%) |
| Administrative & Support | 4,248 (68.9%) | 1,917 (31.1%) |
| Educational Services | 2,297 (41.8%) | 3,197 (58.2%) |
| Health Care & Social Assistance | 2,085 (19.6%) | 8,570 (80.4%) |
| Arts, Entertainment & Recreation | 796 (56.7%) | 607 (43.3%) |
| Accommodation & Food Services | 3,766 (49.7%) | 3,810 (50.3%) |
| Public Administration | 3,076 (56.2%) | 2,399 (43.8%) |
| Total | 55,597 (56.7%) | 42,538 (43.3%) |
Education in Oxnard
School Enrollment in Oxnard
The most common levels of schooling among the 55,017 students in Oxnard are high school (12,932 | 23.5%), middle school (12,377 | 22.5%), and elementary school (11,494 | 20.9%).
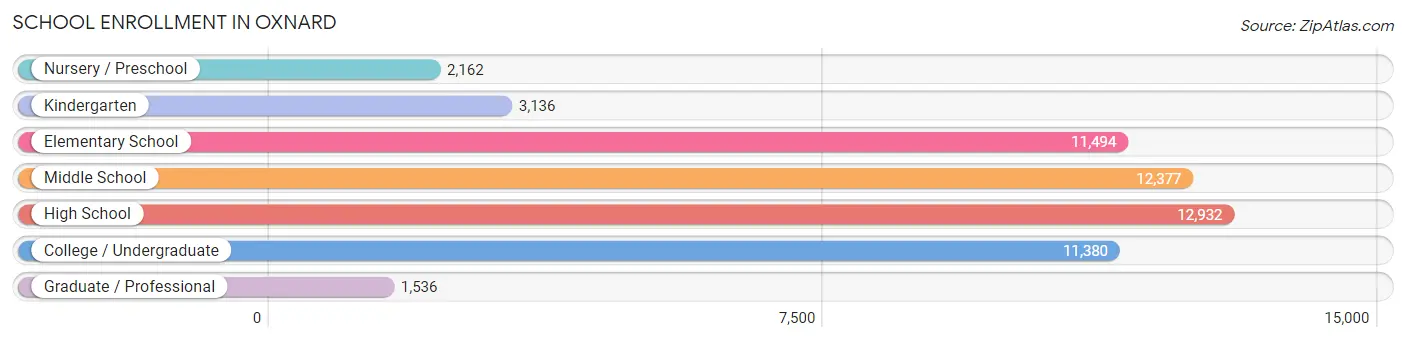
| School Level | # Students | % Students |
| Nursery / Preschool | 2,162 | 3.9% |
| Kindergarten | 3,136 | 5.7% |
| Elementary School | 11,494 | 20.9% |
| Middle School | 12,377 | 22.5% |
| High School | 12,932 | 23.5% |
| College / Undergraduate | 11,380 | 20.7% |
| Graduate / Professional | 1,536 | 2.8% |
| Total | 55,017 | 100.0% |
School Enrollment by Age by Funding Source in Oxnard
Out of a total of 55,017 students who are enrolled in schools in Oxnard, 3,466 (6.3%) attend a private institution, while the remaining 51,551 (93.7%) are enrolled in public schools. The age group of 3 to 4 year olds has the highest likelihood of being enrolled in private schools, with 406 (26.5% in the age bracket) enrolled. Conversely, the age group of 15 to 17 year olds has the lowest likelihood of being enrolled in a private school, with 8,537 (98.0% in the age bracket) attending a public institution.
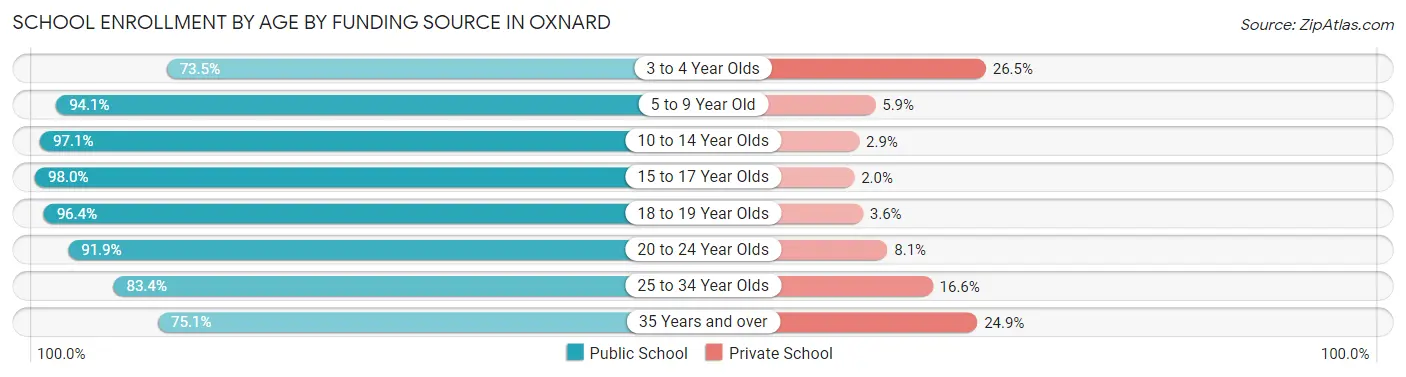
| Age Bracket | Public School | Private School |
| 3 to 4 Year Olds | 1,127 (73.5%) | 406 (26.5%) |
| 5 to 9 Year Old | 13,561 (94.1%) | 849 (5.9%) |
| 10 to 14 Year Olds | 15,386 (97.1%) | 454 (2.9%) |
| 15 to 17 Year Olds | 8,537 (98.0%) | 172 (2.0%) |
| 18 to 19 Year Olds | 3,944 (96.4%) | 146 (3.6%) |
| 20 to 24 Year Olds | 5,067 (91.9%) | 449 (8.1%) |
| 25 to 34 Year Olds | 2,386 (83.4%) | 474 (16.6%) |
| 35 Years and over | 1,547 (75.1%) | 512 (24.9%) |
| Total | 51,551 (93.7%) | 3,466 (6.3%) |
Educational Attainment by Field of Study in Oxnard
Business (4,417 | 17.1%), science & technology (3,106 | 12.0%), engineering (2,660 | 10.3%), education (2,374 | 9.2%), and social sciences (2,331 | 9.0%) are the most common fields of study among 25,890 individuals in Oxnard who have obtained a bachelor's degree or higher.
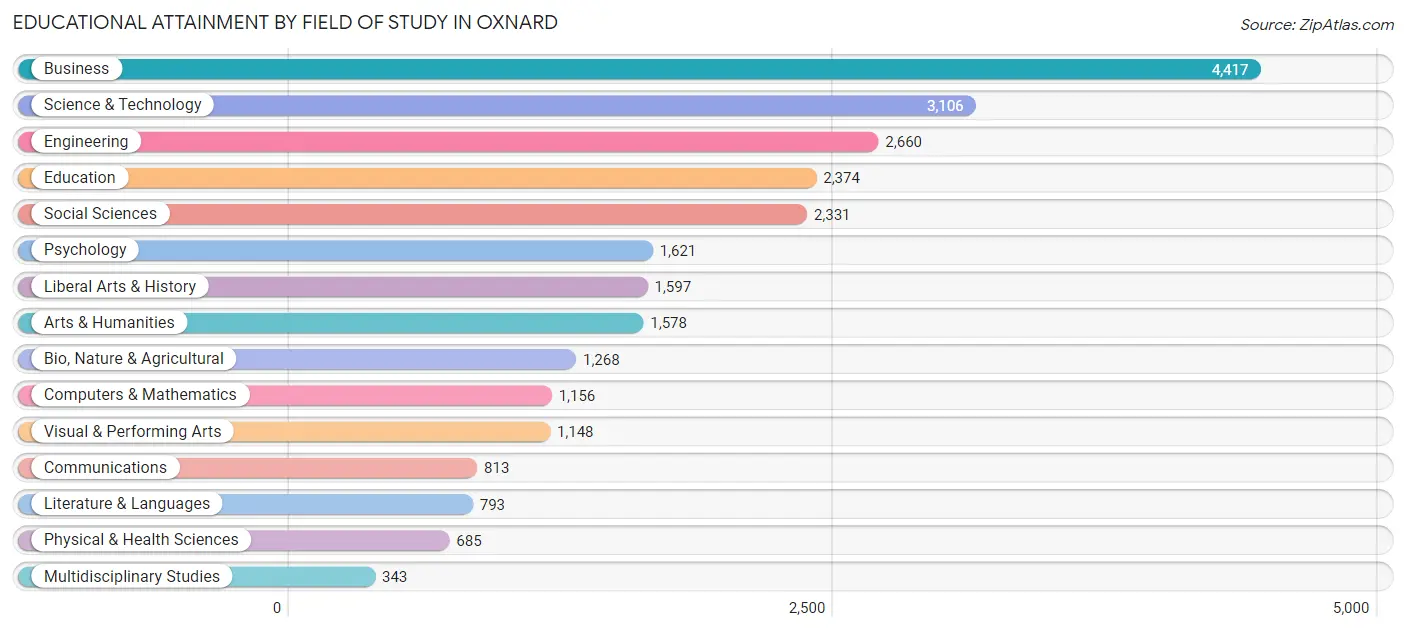
| Field of Study | # Graduates | % Graduates |
| Computers & Mathematics | 1,156 | 4.5% |
| Bio, Nature & Agricultural | 1,268 | 4.9% |
| Physical & Health Sciences | 685 | 2.6% |
| Psychology | 1,621 | 6.3% |
| Social Sciences | 2,331 | 9.0% |
| Engineering | 2,660 | 10.3% |
| Multidisciplinary Studies | 343 | 1.3% |
| Science & Technology | 3,106 | 12.0% |
| Business | 4,417 | 17.1% |
| Education | 2,374 | 9.2% |
| Literature & Languages | 793 | 3.1% |
| Liberal Arts & History | 1,597 | 6.2% |
| Visual & Performing Arts | 1,148 | 4.4% |
| Communications | 813 | 3.1% |
| Arts & Humanities | 1,578 | 6.1% |
| Total | 25,890 | 100.0% |
Transportation & Commute in Oxnard
Vehicle Availability by Sex in Oxnard
The most prevalent vehicle ownership categories in Oxnard are males with 2 vehicles (15,551, accounting for 28.8%) and females with 2 vehicles (12,044, making up 37.9%).
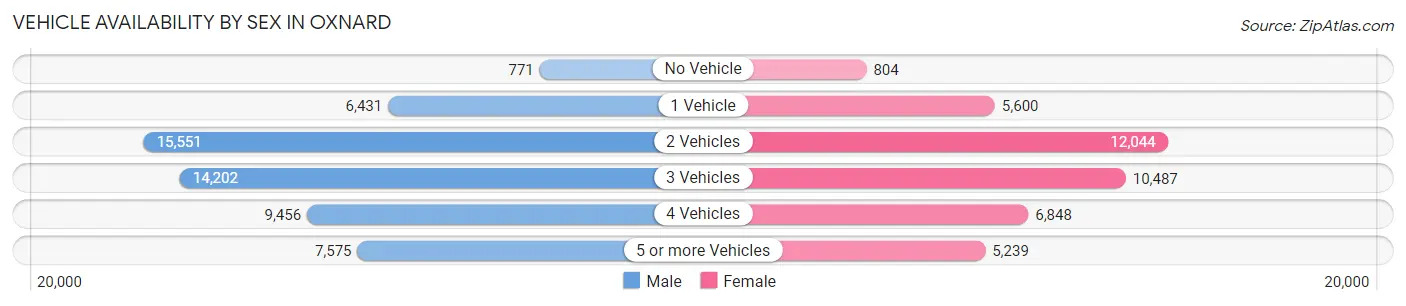
| Vehicles Available | Male | Female |
| No Vehicle | 771 (1.4%) | 804 (2.0%) |
| 1 Vehicle | 6,431 (11.9%) | 5,600 (13.7%) |
| 2 Vehicles | 15,551 (28.8%) | 12,044 (29.4%) |
| 3 Vehicles | 14,202 (26.3%) | 10,487 (25.6%) |
| 4 Vehicles | 9,456 (17.5%) | 6,848 (16.7%) |
| 5 or more Vehicles | 7,575 (14.0%) | 5,239 (12.8%) |
| Total | 53,986 (100.0%) | 41,022 (100.0%) |
Commute Time in Oxnard
The most frequently occuring commute durations in Oxnard are 25 to 29 minutes (37,312 commuters, 41.2%), 15 to 19 minutes (10,215 commuters, 11.3%), and 30 to 34 minutes (9,325 commuters, 10.3%).
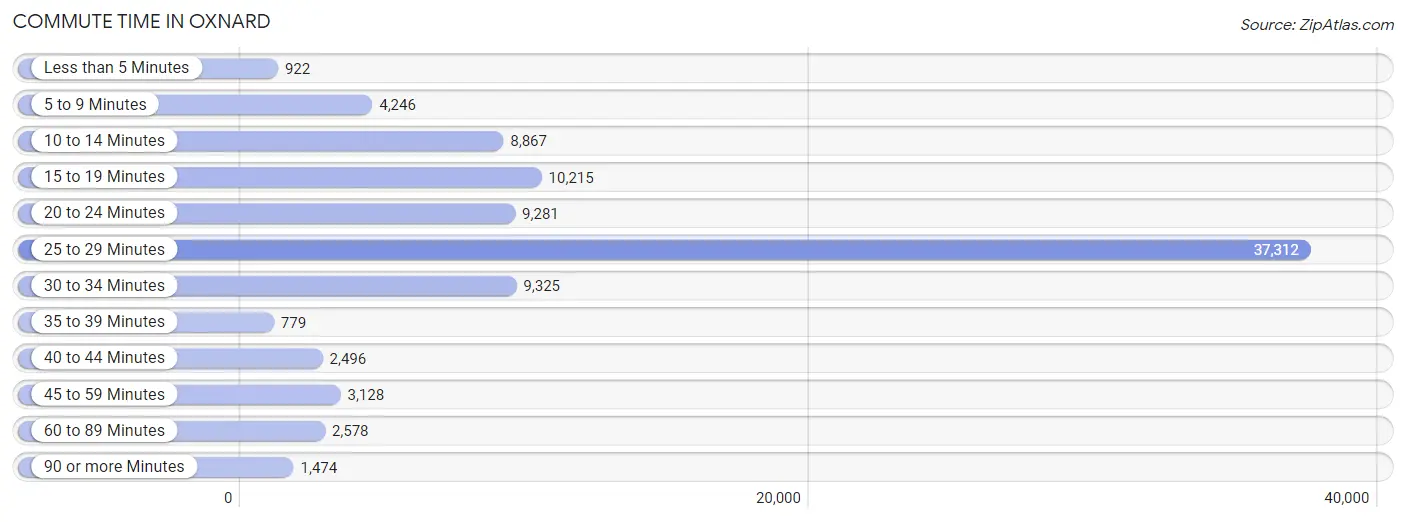
| Commute Time | # Commuters | % Commuters |
| Less than 5 Minutes | 922 | 1.0% |
| 5 to 9 Minutes | 4,246 | 4.7% |
| 10 to 14 Minutes | 8,867 | 9.8% |
| 15 to 19 Minutes | 10,215 | 11.3% |
| 20 to 24 Minutes | 9,281 | 10.2% |
| 25 to 29 Minutes | 37,312 | 41.2% |
| 30 to 34 Minutes | 9,325 | 10.3% |
| 35 to 39 Minutes | 779 | 0.9% |
| 40 to 44 Minutes | 2,496 | 2.8% |
| 45 to 59 Minutes | 3,128 | 3.5% |
| 60 to 89 Minutes | 2,578 | 2.8% |
| 90 or more Minutes | 1,474 | 1.6% |
Commute Time by Sex in Oxnard
The most common commute times in Oxnard are 25 to 29 minutes (23,340 commuters, 44.8%) for males and 25 to 29 minutes (13,972 commuters, 36.3%) for females.
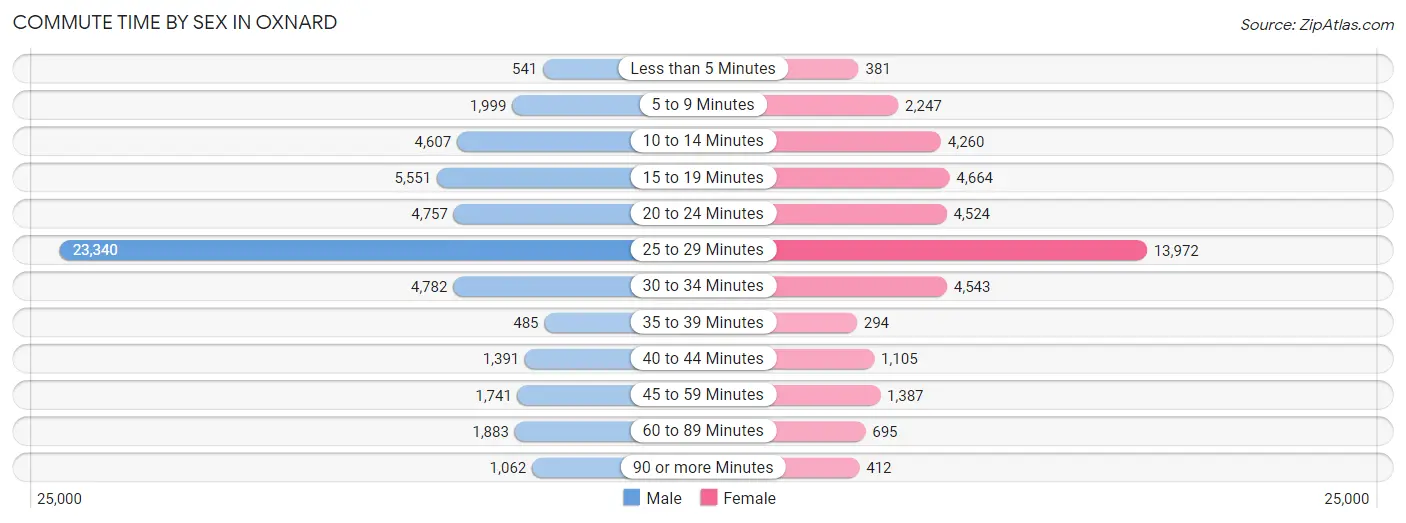
| Commute Time | Male | Female |
| Less than 5 Minutes | 541 (1.0%) | 381 (1.0%) |
| 5 to 9 Minutes | 1,999 (3.8%) | 2,247 (5.8%) |
| 10 to 14 Minutes | 4,607 (8.8%) | 4,260 (11.1%) |
| 15 to 19 Minutes | 5,551 (10.6%) | 4,664 (12.1%) |
| 20 to 24 Minutes | 4,757 (9.1%) | 4,524 (11.8%) |
| 25 to 29 Minutes | 23,340 (44.8%) | 13,972 (36.3%) |
| 30 to 34 Minutes | 4,782 (9.2%) | 4,543 (11.8%) |
| 35 to 39 Minutes | 485 (0.9%) | 294 (0.8%) |
| 40 to 44 Minutes | 1,391 (2.7%) | 1,105 (2.9%) |
| 45 to 59 Minutes | 1,741 (3.3%) | 1,387 (3.6%) |
| 60 to 89 Minutes | 1,883 (3.6%) | 695 (1.8%) |
| 90 or more Minutes | 1,062 (2.0%) | 412 (1.1%) |
Time of Departure to Work by Sex in Oxnard
The most frequent times of departure to work in Oxnard are 6:00 AM to 6:29 AM (8,588, 16.5%) for males and 7:30 AM to 7:59 AM (5,217, 13.6%) for females.
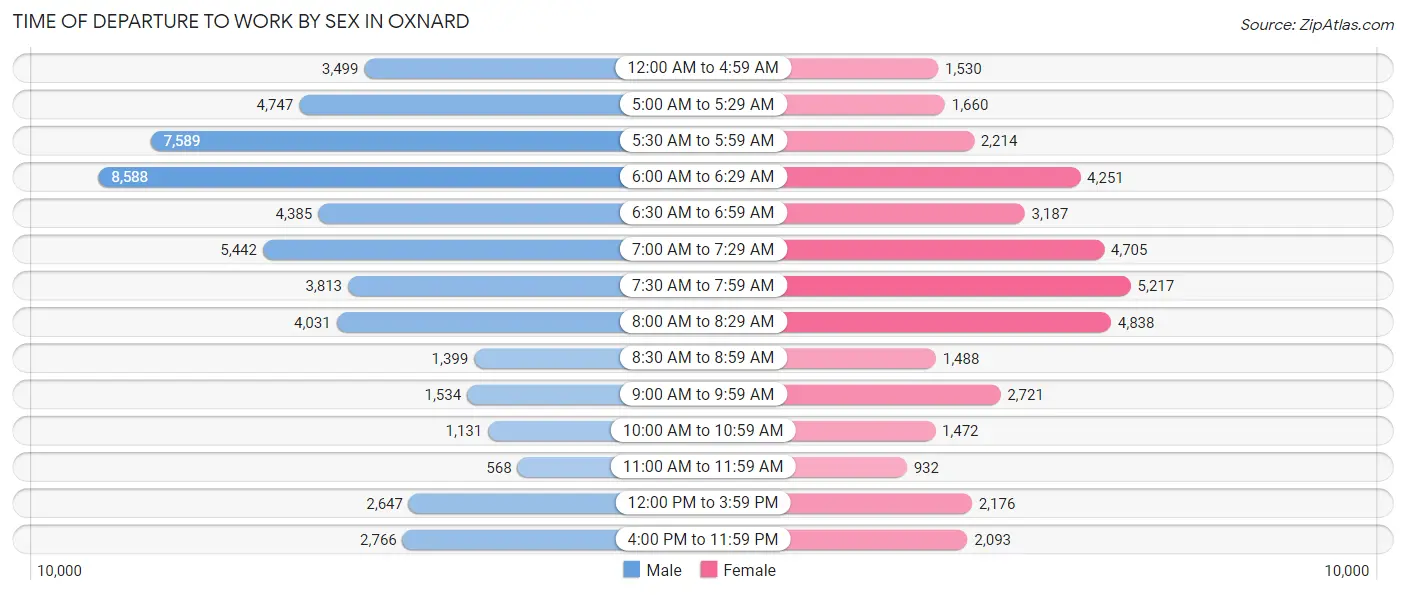
| Time of Departure | Male | Female |
| 12:00 AM to 4:59 AM | 3,499 (6.7%) | 1,530 (4.0%) |
| 5:00 AM to 5:29 AM | 4,747 (9.1%) | 1,660 (4.3%) |
| 5:30 AM to 5:59 AM | 7,589 (14.6%) | 2,214 (5.8%) |
| 6:00 AM to 6:29 AM | 8,588 (16.5%) | 4,251 (11.1%) |
| 6:30 AM to 6:59 AM | 4,385 (8.4%) | 3,187 (8.3%) |
| 7:00 AM to 7:29 AM | 5,442 (10.4%) | 4,705 (12.2%) |
| 7:30 AM to 7:59 AM | 3,813 (7.3%) | 5,217 (13.6%) |
| 8:00 AM to 8:29 AM | 4,031 (7.7%) | 4,838 (12.6%) |
| 8:30 AM to 8:59 AM | 1,399 (2.7%) | 1,488 (3.9%) |
| 9:00 AM to 9:59 AM | 1,534 (2.9%) | 2,721 (7.1%) |
| 10:00 AM to 10:59 AM | 1,131 (2.2%) | 1,472 (3.8%) |
| 11:00 AM to 11:59 AM | 568 (1.1%) | 932 (2.4%) |
| 12:00 PM to 3:59 PM | 2,647 (5.1%) | 2,176 (5.7%) |
| 4:00 PM to 11:59 PM | 2,766 (5.3%) | 2,093 (5.4%) |
| Total | 52,139 (100.0%) | 38,484 (100.0%) |
Housing Occupancy in Oxnard
Occupancy by Ownership in Oxnard
Of the total 51,099 dwellings in Oxnard, owner-occupied units account for 27,886 (54.6%), while renter-occupied units make up 23,213 (45.4%).
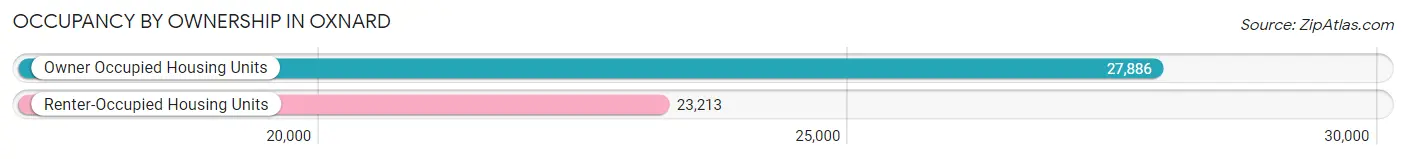
| Occupancy | # Housing Units | % Housing Units |
| Owner Occupied Housing Units | 27,886 | 54.6% |
| Renter-Occupied Housing Units | 23,213 | 45.4% |
| Total Occupied Housing Units | 51,099 | 100.0% |
Occupancy by Household Size in Oxnard
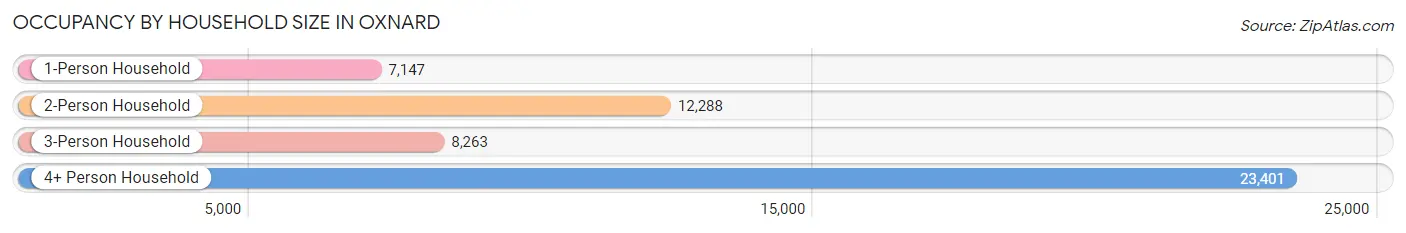
| Household Size | # Housing Units | % Housing Units |
| 1-Person Household | 7,147 | 14.0% |
| 2-Person Household | 12,288 | 24.0% |
| 3-Person Household | 8,263 | 16.2% |
| 4+ Person Household | 23,401 | 45.8% |
| Total Housing Units | 51,099 | 100.0% |
Occupancy by Ownership by Household Size in Oxnard
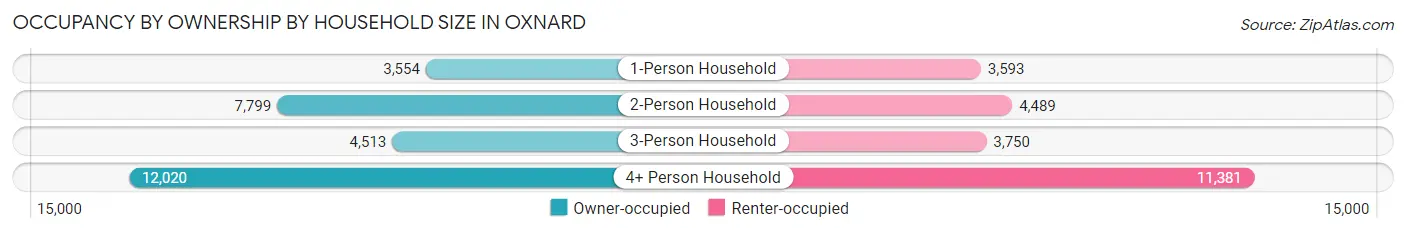
| Household Size | Owner-occupied | Renter-occupied |
| 1-Person Household | 3,554 (49.7%) | 3,593 (50.3%) |
| 2-Person Household | 7,799 (63.5%) | 4,489 (36.5%) |
| 3-Person Household | 4,513 (54.6%) | 3,750 (45.4%) |
| 4+ Person Household | 12,020 (51.4%) | 11,381 (48.6%) |
| Total Housing Units | 27,886 (54.6%) | 23,213 (45.4%) |
Occupancy by Educational Attainment in Oxnard
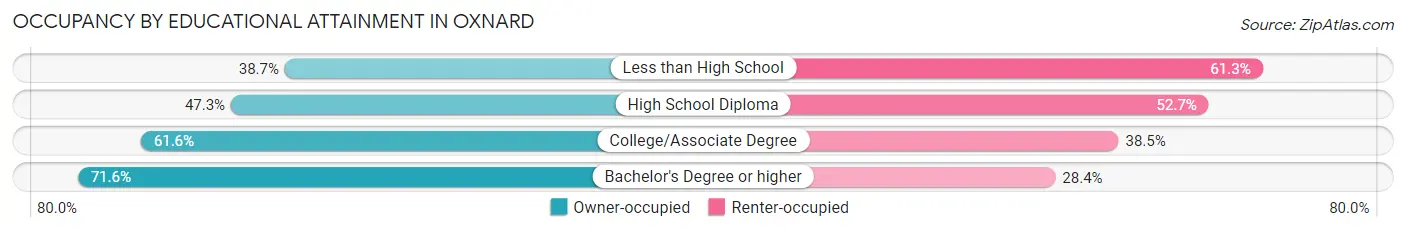
| Household Size | Owner-occupied | Renter-occupied |
| Less than High School | 5,284 (38.7%) | 8,360 (61.3%) |
| High School Diploma | 5,368 (47.3%) | 5,989 (52.7%) |
| College/Associate Degree | 8,877 (61.6%) | 5,545 (38.5%) |
| Bachelor's Degree or higher | 8,357 (71.6%) | 3,319 (28.4%) |
Occupancy by Age of Householder in Oxnard
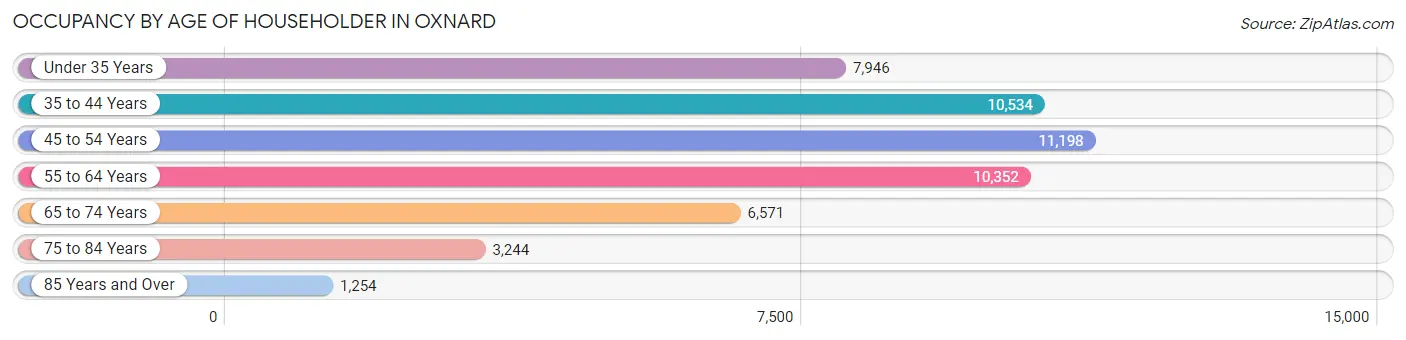
| Age Bracket | # Households | % Households |
| Under 35 Years | 7,946 | 15.5% |
| 35 to 44 Years | 10,534 | 20.6% |
| 45 to 54 Years | 11,198 | 21.9% |
| 55 to 64 Years | 10,352 | 20.3% |
| 65 to 74 Years | 6,571 | 12.9% |
| 75 to 84 Years | 3,244 | 6.4% |
| 85 Years and Over | 1,254 | 2.5% |
| Total | 51,099 | 100.0% |
Housing Finances in Oxnard
Median Income by Occupancy in Oxnard
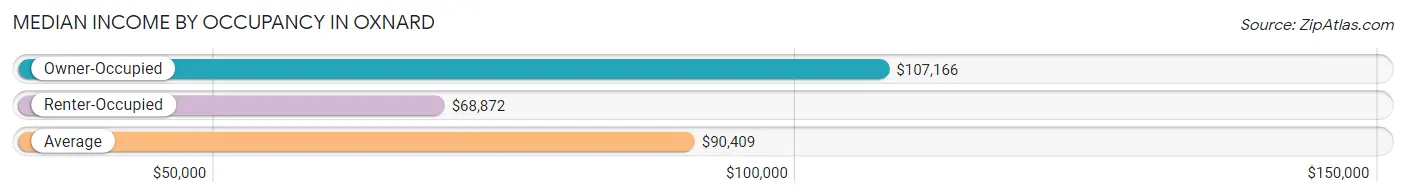
| Occupancy Type | # Households | Median Income |
| Owner-Occupied | 27,886 (54.6%) | $107,166 |
| Renter-Occupied | 23,213 (45.4%) | $68,872 |
| Average | 51,099 (100.0%) | $90,409 |
Occupancy by Householder Income Bracket in Oxnard
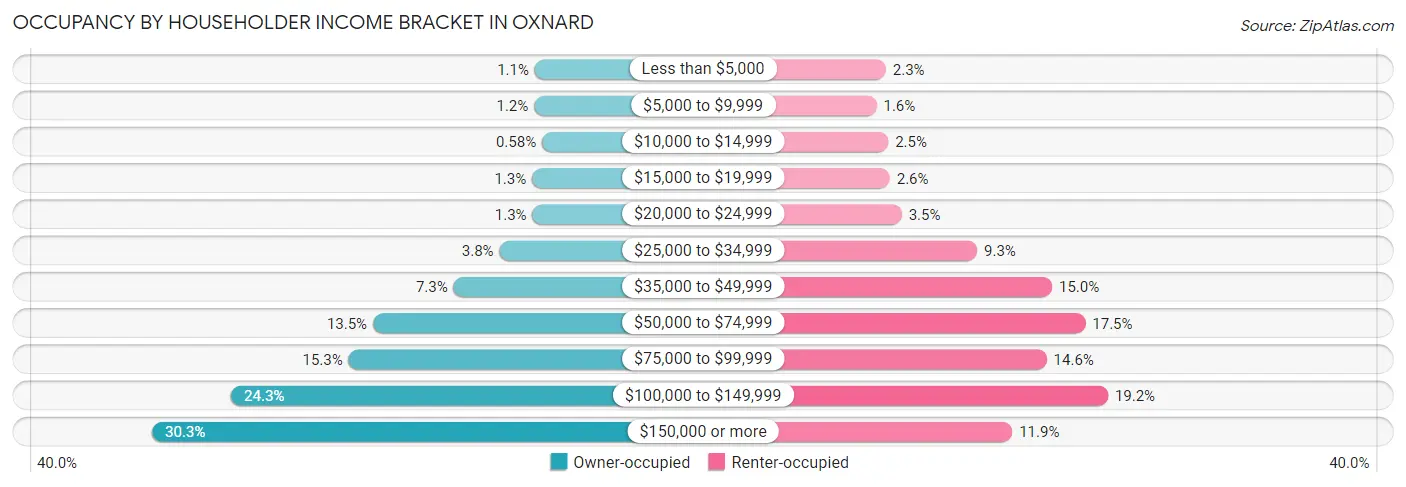
| Income Bracket | Owner-occupied | Renter-occupied |
| Less than $5,000 | 315 (1.1%) | 537 (2.3%) |
| $5,000 to $9,999 | 330 (1.2%) | 372 (1.6%) |
| $10,000 to $14,999 | 161 (0.6%) | 578 (2.5%) |
| $15,000 to $19,999 | 375 (1.3%) | 607 (2.6%) |
| $20,000 to $24,999 | 364 (1.3%) | 816 (3.5%) |
| $25,000 to $34,999 | 1,065 (3.8%) | 2,150 (9.3%) |
| $35,000 to $49,999 | 2,041 (7.3%) | 3,476 (15.0%) |
| $50,000 to $74,999 | 3,753 (13.5%) | 4,064 (17.5%) |
| $75,000 to $99,999 | 4,272 (15.3%) | 3,379 (14.6%) |
| $100,000 to $149,999 | 6,764 (24.3%) | 4,463 (19.2%) |
| $150,000 or more | 8,446 (30.3%) | 2,771 (11.9%) |
| Total | 27,886 (100.0%) | 23,213 (100.0%) |
Monthly Housing Cost Tiers in Oxnard
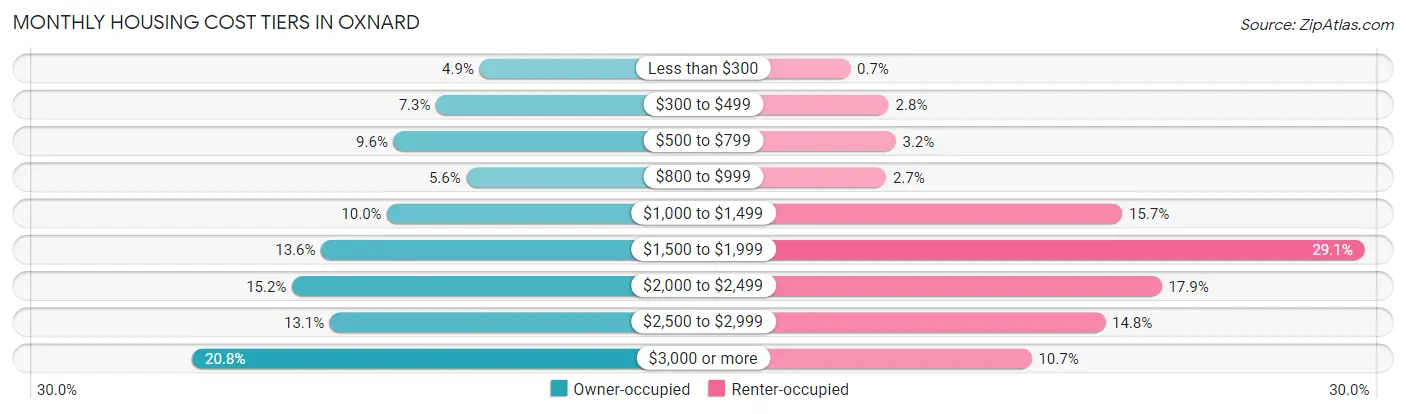
| Monthly Cost | Owner-occupied | Renter-occupied |
| Less than $300 | 1,355 (4.9%) | 162 (0.7%) |
| $300 to $499 | 2,025 (7.3%) | 657 (2.8%) |
| $500 to $799 | 2,680 (9.6%) | 746 (3.2%) |
| $800 to $999 | 1,560 (5.6%) | 621 (2.7%) |
| $1,000 to $1,499 | 2,778 (10.0%) | 3,650 (15.7%) |
| $1,500 to $1,999 | 3,796 (13.6%) | 6,757 (29.1%) |
| $2,000 to $2,499 | 4,244 (15.2%) | 4,155 (17.9%) |
| $2,500 to $2,999 | 3,662 (13.1%) | 3,431 (14.8%) |
| $3,000 or more | 5,786 (20.7%) | 2,489 (10.7%) |
| Total | 27,886 (100.0%) | 23,213 (100.0%) |
Physical Housing Characteristics in Oxnard
Housing Structures in Oxnard
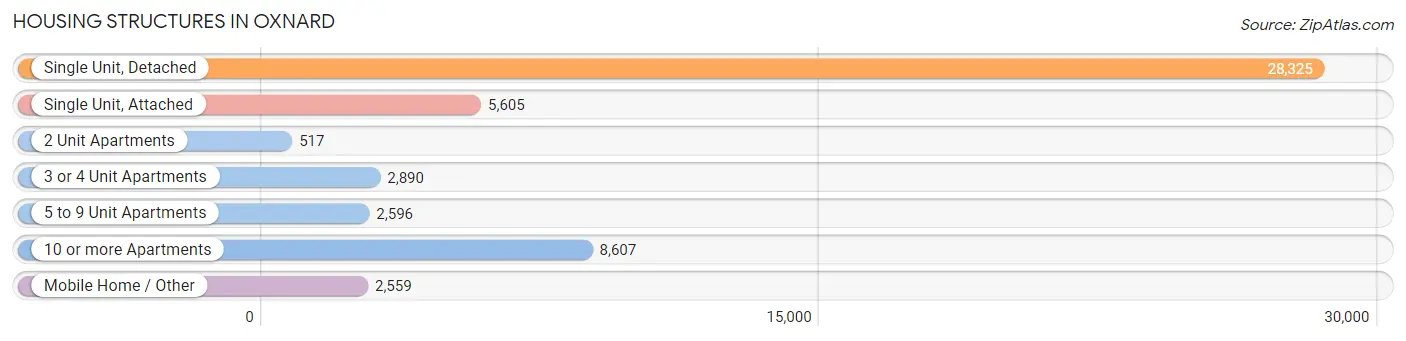
| Structure Type | # Housing Units | % Housing Units |
| Single Unit, Detached | 28,325 | 55.4% |
| Single Unit, Attached | 5,605 | 11.0% |
| 2 Unit Apartments | 517 | 1.0% |
| 3 or 4 Unit Apartments | 2,890 | 5.7% |
| 5 to 9 Unit Apartments | 2,596 | 5.1% |
| 10 or more Apartments | 8,607 | 16.8% |
| Mobile Home / Other | 2,559 | 5.0% |
| Total | 51,099 | 100.0% |
Housing Structures by Occupancy in Oxnard
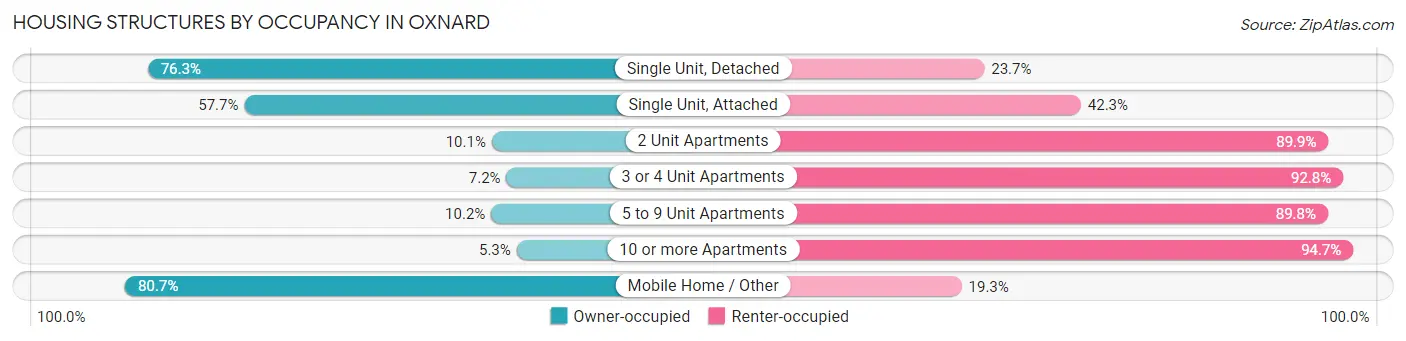
| Structure Type | Owner-occupied | Renter-occupied |
| Single Unit, Detached | 21,609 (76.3%) | 6,716 (23.7%) |
| Single Unit, Attached | 3,234 (57.7%) | 2,371 (42.3%) |
| 2 Unit Apartments | 52 (10.1%) | 465 (89.9%) |
| 3 or 4 Unit Apartments | 209 (7.2%) | 2,681 (92.8%) |
| 5 to 9 Unit Apartments | 264 (10.2%) | 2,332 (89.8%) |
| 10 or more Apartments | 454 (5.3%) | 8,153 (94.7%) |
| Mobile Home / Other | 2,064 (80.7%) | 495 (19.3%) |
| Total | 27,886 (54.6%) | 23,213 (45.4%) |
Housing Structures by Number of Rooms in Oxnard
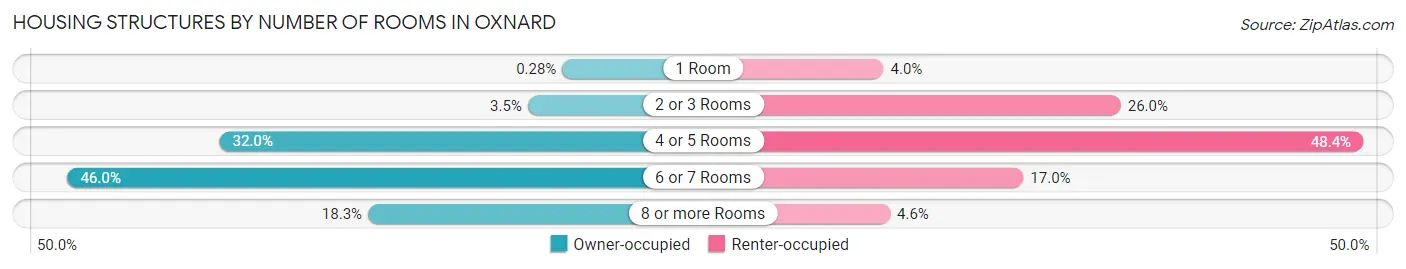
| Number of Rooms | Owner-occupied | Renter-occupied |
| 1 Room | 79 (0.3%) | 938 (4.0%) |
| 2 or 3 Rooms | 968 (3.5%) | 6,030 (26.0%) |
| 4 or 5 Rooms | 8,915 (32.0%) | 11,227 (48.4%) |
| 6 or 7 Rooms | 12,835 (46.0%) | 3,940 (17.0%) |
| 8 or more Rooms | 5,089 (18.2%) | 1,078 (4.6%) |
| Total | 27,886 (100.0%) | 23,213 (100.0%) |
Housing Structure by Heating Type in Oxnard
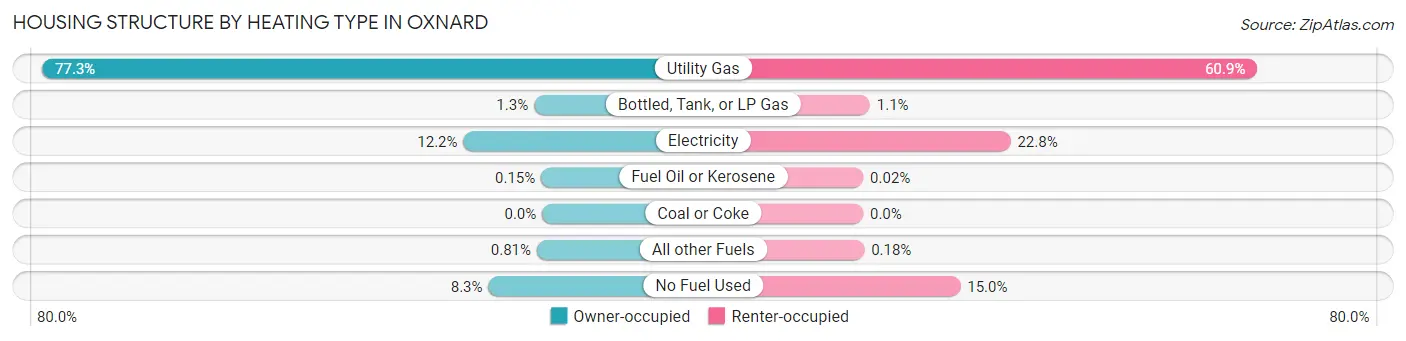
| Heating Type | Owner-occupied | Renter-occupied |
| Utility Gas | 21,559 (77.3%) | 14,143 (60.9%) |
| Bottled, Tank, or LP Gas | 348 (1.3%) | 244 (1.1%) |
| Electricity | 3,394 (12.2%) | 5,291 (22.8%) |
| Fuel Oil or Kerosene | 41 (0.2%) | 5 (0.0%) |
| Coal or Coke | 0 (0.0%) | 0 (0.0%) |
| All other Fuels | 226 (0.8%) | 42 (0.2%) |
| No Fuel Used | 2,318 (8.3%) | 3,488 (15.0%) |
| Total | 27,886 (100.0%) | 23,213 (100.0%) |
Household Vehicle Usage in Oxnard
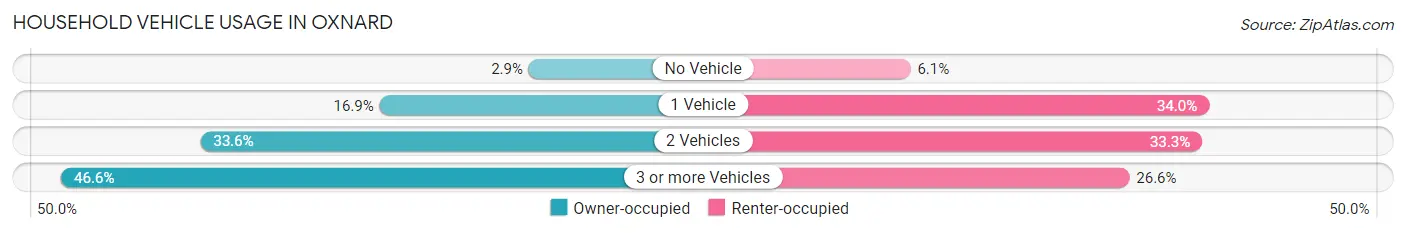
| Vehicles per Household | Owner-occupied | Renter-occupied |
| No Vehicle | 818 (2.9%) | 1,420 (6.1%) |
| 1 Vehicle | 4,704 (16.9%) | 7,891 (34.0%) |
| 2 Vehicles | 9,371 (33.6%) | 7,738 (33.3%) |
| 3 or more Vehicles | 12,993 (46.6%) | 6,164 (26.6%) |
| Total | 27,886 (100.0%) | 23,213 (100.0%) |
Real Estate & Mortgages in Oxnard
Real Estate and Mortgage Overview in Oxnard
| Characteristic | Without Mortgage | With Mortgage |
| Housing Units | 9,232 | 18,654 |
| Median Property Value | $521,800 | $609,000 |
| Median Household Income | $85,224 | $6,476 |
| Monthly Housing Costs | $642 | $5,748 |
| Real Estate Taxes | $2,823 | $305 |
Property Value by Mortgage Status in Oxnard
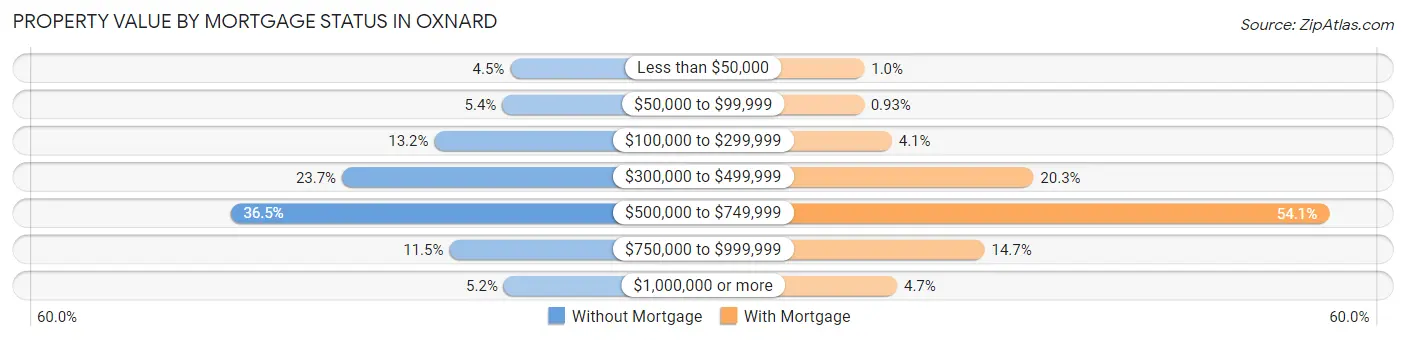
| Property Value | Without Mortgage | With Mortgage |
| Less than $50,000 | 415 (4.5%) | 187 (1.0%) |
| $50,000 to $99,999 | 500 (5.4%) | 173 (0.9%) |
| $100,000 to $299,999 | 1,217 (13.2%) | 773 (4.1%) |
| $300,000 to $499,999 | 2,191 (23.7%) | 3,792 (20.3%) |
| $500,000 to $749,999 | 3,367 (36.5%) | 10,095 (54.1%) |
| $750,000 to $999,999 | 1,058 (11.5%) | 2,750 (14.7%) |
| $1,000,000 or more | 484 (5.2%) | 884 (4.7%) |
| Total | 9,232 (100.0%) | 18,654 (100.0%) |
Household Income by Mortgage Status in Oxnard
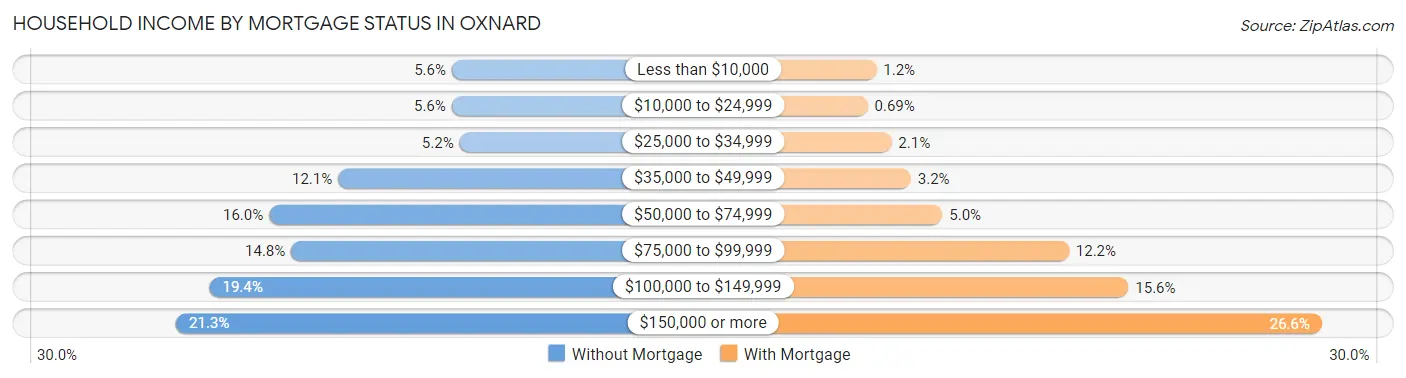
| Household Income | Without Mortgage | With Mortgage |
| Less than $10,000 | 516 (5.6%) | 222 (1.2%) |
| $10,000 to $24,999 | 517 (5.6%) | 129 (0.7%) |
| $25,000 to $34,999 | 475 (5.1%) | 383 (2.1%) |
| $35,000 to $49,999 | 1,116 (12.1%) | 590 (3.2%) |
| $50,000 to $74,999 | 1,480 (16.0%) | 925 (5.0%) |
| $75,000 to $99,999 | 1,364 (14.8%) | 2,273 (12.2%) |
| $100,000 to $149,999 | 1,794 (19.4%) | 2,908 (15.6%) |
| $150,000 or more | 1,970 (21.3%) | 4,970 (26.6%) |
| Total | 9,232 (100.0%) | 18,654 (100.0%) |
Property Value to Household Income Ratio in Oxnard
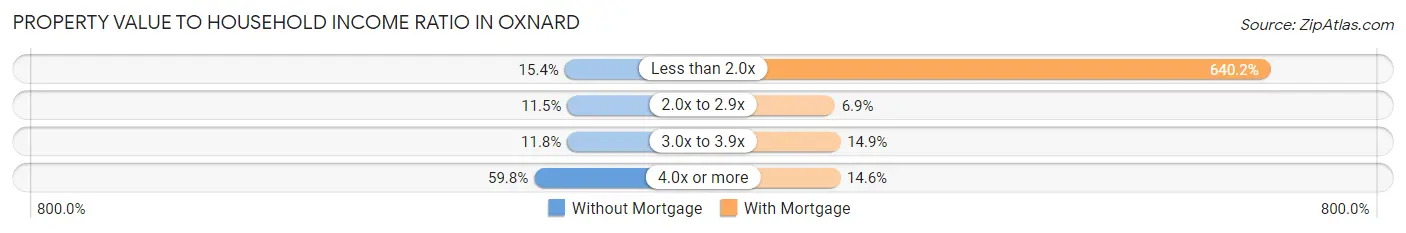
| Value-to-Income Ratio | Without Mortgage | With Mortgage |
| Less than 2.0x | 1,419 (15.4%) | 119,419 (640.2%) |
| 2.0x to 2.9x | 1,062 (11.5%) | 1,292 (6.9%) |
| 3.0x to 3.9x | 1,089 (11.8%) | 2,779 (14.9%) |
| 4.0x or more | 5,519 (59.8%) | 2,719 (14.6%) |
| Total | 9,232 (100.0%) | 18,654 (100.0%) |
Real Estate Taxes by Mortgage Status in Oxnard
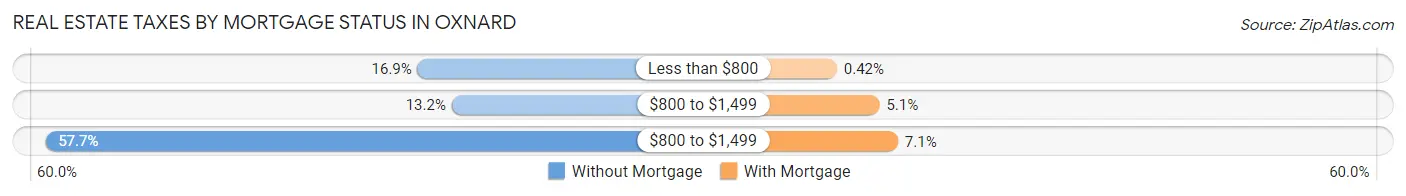
| Property Taxes | Without Mortgage | With Mortgage |
| Less than $800 | 1,563 (16.9%) | 78 (0.4%) |
| $800 to $1,499 | 1,218 (13.2%) | 949 (5.1%) |
| $800 to $1,499 | 5,331 (57.7%) | 1,327 (7.1%) |
| Total | 9,232 (100.0%) | 18,654 (100.0%) |
Health & Disability in Oxnard
Health Insurance Coverage by Age in Oxnard
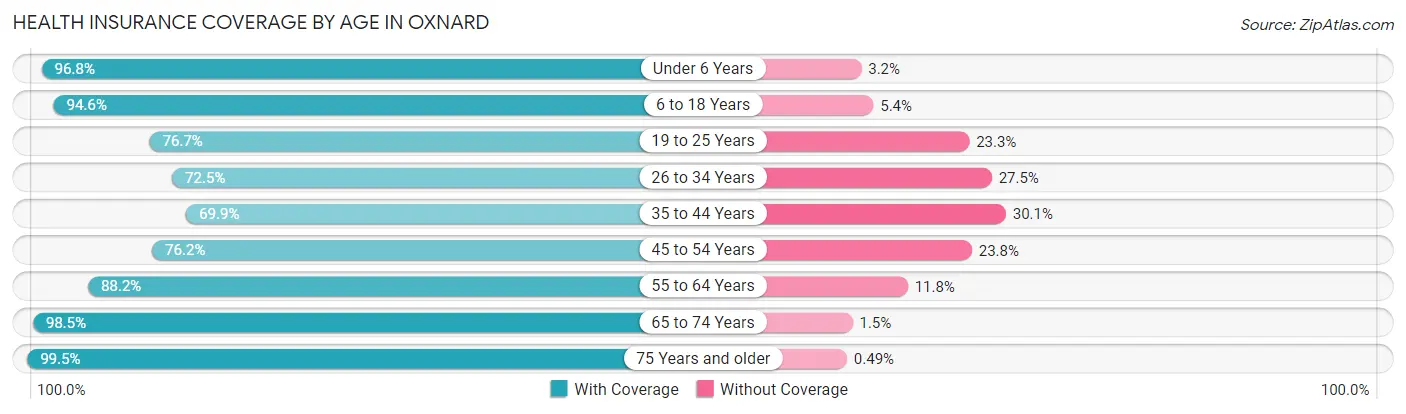
| Age Bracket | With Coverage | Without Coverage |
| Under 6 Years | 15,654 (96.8%) | 513 (3.2%) |
| 6 to 18 Years | 37,908 (94.6%) | 2,169 (5.4%) |
| 19 to 25 Years | 16,152 (76.7%) | 4,904 (23.3%) |
| 26 to 34 Years | 19,830 (72.5%) | 7,518 (27.5%) |
| 35 to 44 Years | 19,364 (69.9%) | 8,341 (30.1%) |
| 45 to 54 Years | 19,316 (76.2%) | 6,026 (23.8%) |
| 55 to 64 Years | 19,390 (88.2%) | 2,599 (11.8%) |
| 65 to 74 Years | 12,635 (98.5%) | 196 (1.5%) |
| 75 Years and older | 8,566 (99.5%) | 42 (0.5%) |
| Total | 168,815 (83.9%) | 32,308 (16.1%) |
Health Insurance Coverage by Citizenship Status in Oxnard
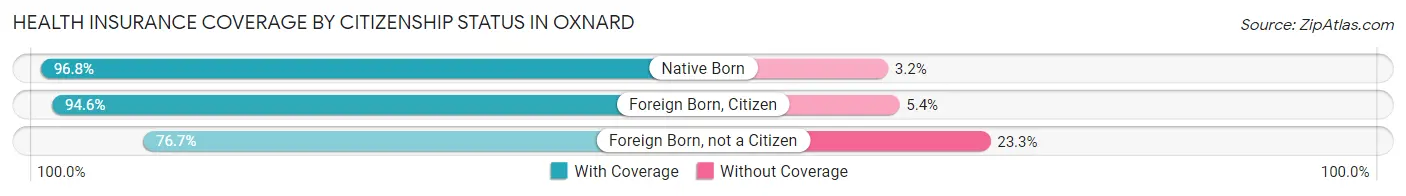
| Citizenship Status | With Coverage | Without Coverage |
| Native Born | 15,654 (96.8%) | 513 (3.2%) |
| Foreign Born, Citizen | 37,908 (94.6%) | 2,169 (5.4%) |
| Foreign Born, not a Citizen | 16,152 (76.7%) | 4,904 (23.3%) |
Health Insurance Coverage by Household Income in Oxnard
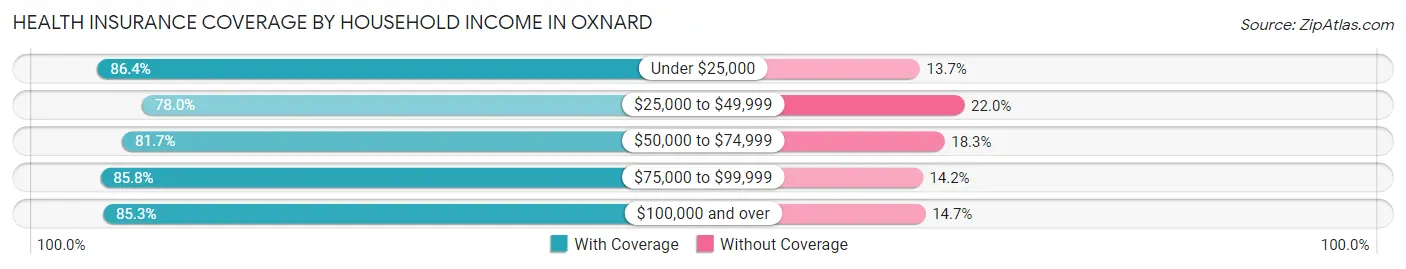
| Household Income | With Coverage | Without Coverage |
| Under $25,000 | 9,030 (86.4%) | 1,427 (13.7%) |
| $25,000 to $49,999 | 22,224 (78.0%) | 6,266 (22.0%) |
| $50,000 to $74,999 | 23,677 (81.7%) | 5,290 (18.3%) |
| $75,000 to $99,999 | 25,019 (85.8%) | 4,131 (14.2%) |
| $100,000 and over | 87,346 (85.3%) | 15,042 (14.7%) |
Public vs Private Health Insurance Coverage by Age in Oxnard
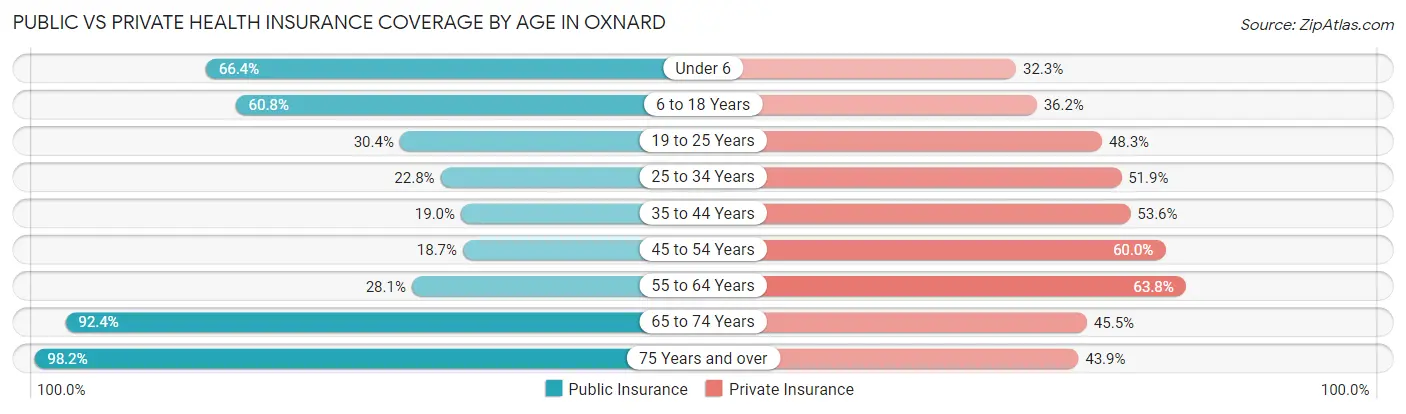
| Age Bracket | Public Insurance | Private Insurance |
| Under 6 | 10,727 (66.3%) | 5,228 (32.3%) |
| 6 to 18 Years | 24,379 (60.8%) | 14,499 (36.2%) |
| 19 to 25 Years | 6,394 (30.4%) | 10,167 (48.3%) |
| 25 to 34 Years | 6,240 (22.8%) | 14,186 (51.9%) |
| 35 to 44 Years | 5,269 (19.0%) | 14,840 (53.6%) |
| 45 to 54 Years | 4,727 (18.6%) | 15,211 (60.0%) |
| 55 to 64 Years | 6,188 (28.1%) | 14,031 (63.8%) |
| 65 to 74 Years | 11,859 (92.4%) | 5,838 (45.5%) |
| 75 Years and over | 8,452 (98.2%) | 3,779 (43.9%) |
| Total | 84,235 (41.9%) | 97,779 (48.6%) |
Disability Status by Sex by Age in Oxnard
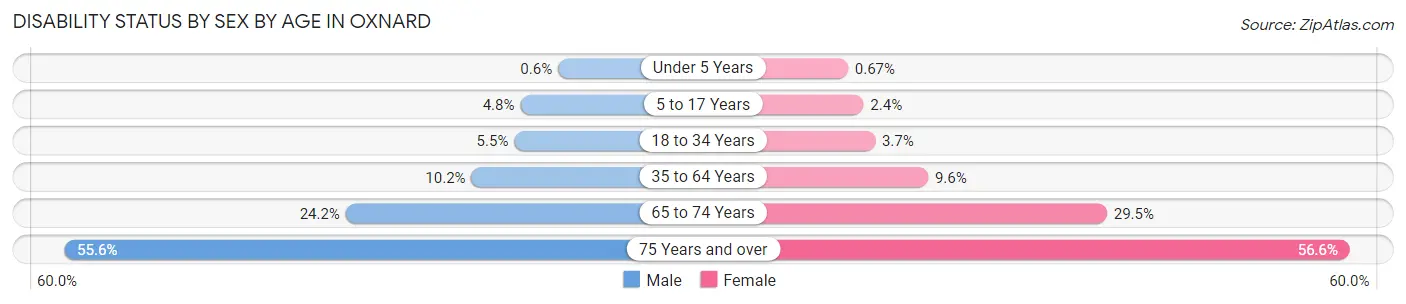
| Age Bracket | Male | Female |
| Under 5 Years | 36 (0.6%) | 45 (0.7%) |
| 5 to 17 Years | 1,010 (4.8%) | 462 (2.4%) |
| 18 to 34 Years | 1,464 (5.5%) | 918 (3.7%) |
| 35 to 64 Years | 3,943 (10.2%) | 3,508 (9.6%) |
| 65 to 74 Years | 1,492 (24.2%) | 1,970 (29.5%) |
| 75 Years and over | 2,082 (55.6%) | 2,751 (56.6%) |
Disability Class by Sex by Age in Oxnard
Disability Class: Hearing Difficulty
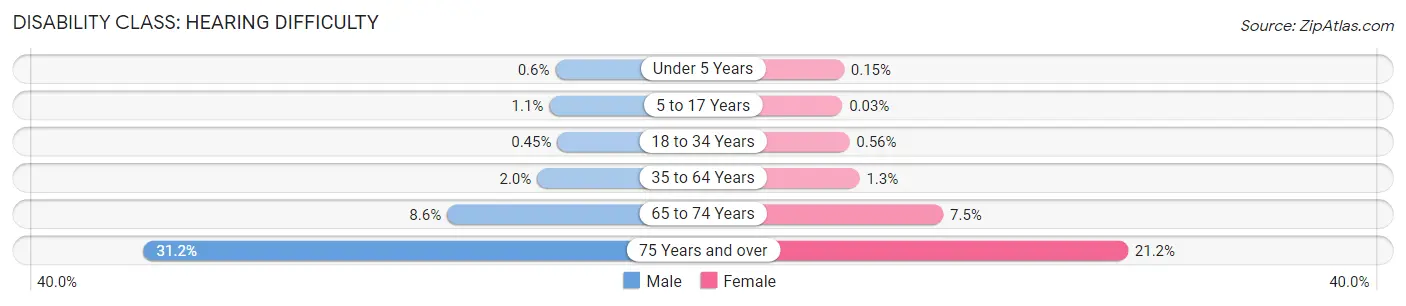
| Age Bracket | Male | Female |
| Under 5 Years | 36 (0.6%) | 10 (0.2%) |
| 5 to 17 Years | 222 (1.1%) | 5 (0.0%) |
| 18 to 34 Years | 120 (0.4%) | 138 (0.6%) |
| 35 to 64 Years | 752 (1.9%) | 477 (1.3%) |
| 65 to 74 Years | 532 (8.6%) | 502 (7.5%) |
| 75 Years and over | 1,167 (31.2%) | 1,033 (21.2%) |
Disability Class: Vision Difficulty
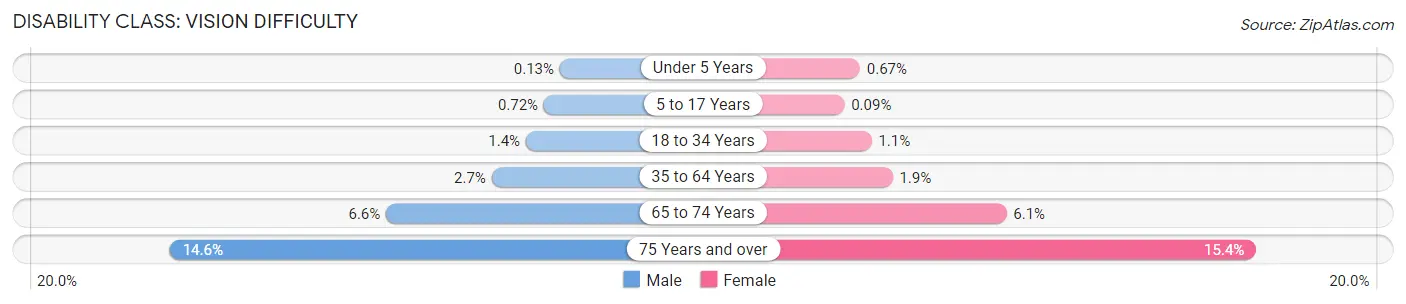
| Age Bracket | Male | Female |
| Under 5 Years | 8 (0.1%) | 45 (0.7%) |
| 5 to 17 Years | 151 (0.7%) | 18 (0.1%) |
| 18 to 34 Years | 372 (1.4%) | 274 (1.1%) |
| 35 to 64 Years | 1,024 (2.7%) | 688 (1.9%) |
| 65 to 74 Years | 405 (6.6%) | 408 (6.1%) |
| 75 Years and over | 547 (14.6%) | 748 (15.4%) |
Disability Class: Cognitive Difficulty
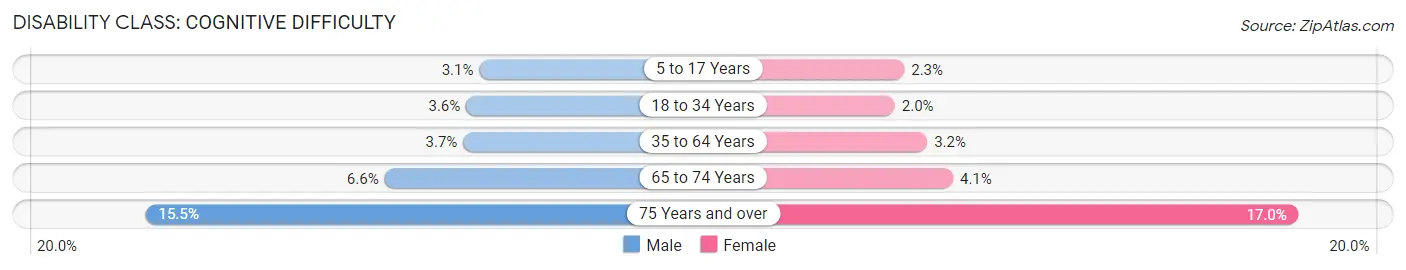
| Age Bracket | Male | Female |
| 5 to 17 Years | 658 (3.1%) | 444 (2.3%) |
| 18 to 34 Years | 966 (3.6%) | 490 (2.0%) |
| 35 to 64 Years | 1,431 (3.7%) | 1,157 (3.2%) |
| 65 to 74 Years | 409 (6.6%) | 276 (4.1%) |
| 75 Years and over | 581 (15.5%) | 825 (17.0%) |
Disability Class: Ambulatory Difficulty
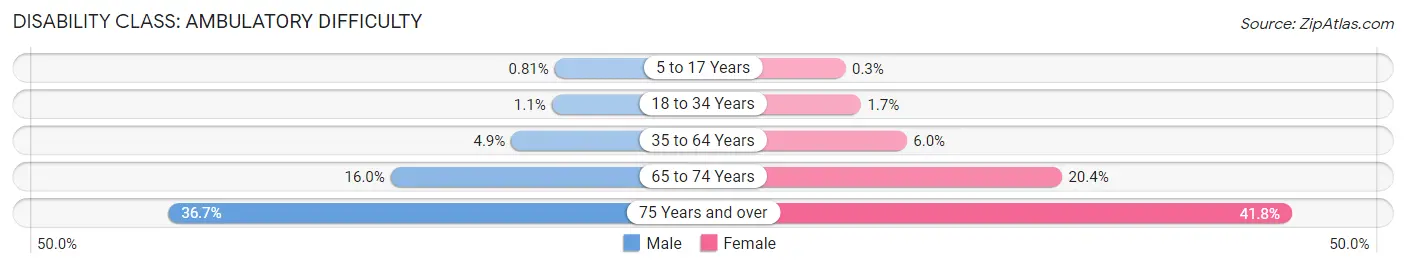
| Age Bracket | Male | Female |
| 5 to 17 Years | 171 (0.8%) | 58 (0.3%) |
| 18 to 34 Years | 294 (1.1%) | 430 (1.7%) |
| 35 to 64 Years | 1,868 (4.9%) | 2,189 (6.0%) |
| 65 to 74 Years | 987 (16.0%) | 1,361 (20.4%) |
| 75 Years and over | 1,373 (36.7%) | 2,031 (41.8%) |
Disability Class: Self-Care Difficulty
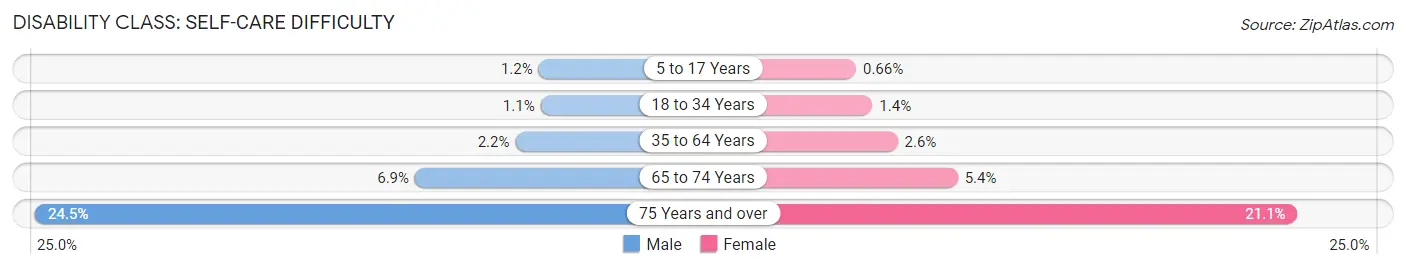
| Age Bracket | Male | Female |
| 5 to 17 Years | 242 (1.1%) | 127 (0.7%) |
| 18 to 34 Years | 284 (1.1%) | 353 (1.4%) |
| 35 to 64 Years | 858 (2.2%) | 946 (2.6%) |
| 65 to 74 Years | 424 (6.9%) | 359 (5.4%) |
| 75 Years and over | 918 (24.5%) | 1,028 (21.1%) |
Technology Access in Oxnard
Computing Device Access in Oxnard
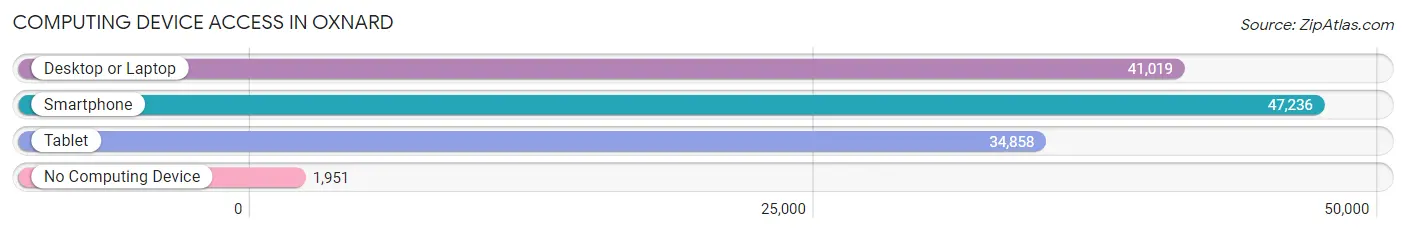
| Device Type | # Households | % Households |
| Desktop or Laptop | 41,019 | 80.3% |
| Smartphone | 47,236 | 92.4% |
| Tablet | 34,858 | 68.2% |
| No Computing Device | 1,951 | 3.8% |
| Total | 51,099 | 100.0% |
Internet Access in Oxnard
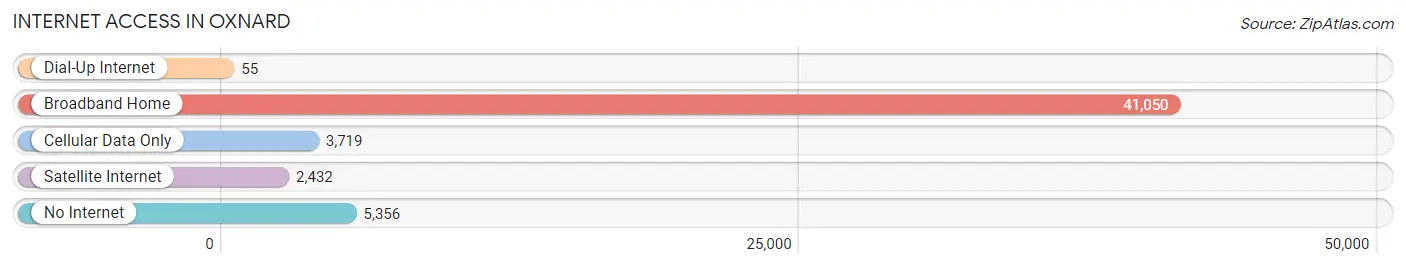
| Internet Type | # Households | % Households |
| Dial-Up Internet | 55 | 0.1% |
| Broadband Home | 41,050 | 80.3% |
| Cellular Data Only | 3,719 | 7.3% |
| Satellite Internet | 2,432 | 4.8% |
| No Internet | 5,356 | 10.5% |
| Total | 51,099 | 100.0% |
Oxnard Summary
Oxnard is a city located in Ventura County, California, United States. It is located along the coast of the Pacific Ocean, approximately 60 miles northwest of Los Angeles. The city has a population of over 200,000 people, making it the most populous city in Ventura County. Oxnard is the 19th most populous city in California and the most populous city in the Oxnard-Thousand Oaks-Ventura metropolitan area.
Geography
Oxnard is located on the Oxnard Plain, an area of coastal plain situated between the Santa Clara River Valley and the Santa Monica Mountains. The city is bordered by the cities of Port Hueneme to the west, Camarillo to the east, and Ventura to the south. The city is also bordered by the Pacific Ocean to the south and west. The city has a total area of 49.2 square miles, of which 48.2 square miles is land and 1.0 square mile is water.
Climate
Oxnard has a Mediterranean climate, with mild, wet winters and hot, dry summers. The average annual temperature is 64°F, with an average high of 72°F and an average low of 56°F. The average annual precipitation is 13.2 inches, with most of the precipitation occurring between November and March.
Demographics
As of the 2010 census, there were 197,899 people, 63,913 households, and 45,205 families residing in the city. The population density was 4,084.3 people per square mile. The racial makeup of the city was 57.2% White, 4.3% African American, 1.2% Native American, 8.6% Asian, 0.3% Pacific Islander, 25.1% from other races, and 3.3% from two or more races. Hispanic or Latino of any race were 50.2% of the population.
Economy
Oxnard is a major agricultural center, with a large number of farms and ranches located in the area. The city is also home to a number of manufacturing and technology companies, including Amgen, Baxter Healthcare, and Rockwell Collins. The Port of Hueneme is located in Oxnard and is the only deep-water port between Los Angeles and San Francisco. The port is a major economic engine for the city, providing jobs and economic activity.
History
The area that is now Oxnard was originally inhabited by the Chumash people, who were hunter-gatherers. The area was first explored by Europeans in 1542, when Spanish explorer Juan Rodriguez Cabrillo arrived in the area. The area was later settled by the Spanish in the late 1700s, and the city of Oxnard was founded in 1903. The city was named after Henry Oxnard, a local rancher.
Oxnard experienced rapid growth in the early 20th century, due to the development of the agricultural and manufacturing industries. The city was incorporated in 1903 and experienced a population boom in the 1950s and 1960s. The city has continued to grow in recent years, with a population of over 200,000 people.
Common Questions
What is Per Capita Income in Oxnard?
Per Capita income in Oxnard is $28,845.
What is the Median Family Income in Oxnard?
Median Family Income in Oxnard is $89,908.
What is the Median Household income in Oxnard?
Median Household Income in Oxnard is $90,409.
What is Income or Wage Gap in Oxnard?
Income or Wage Gap in Oxnard is 16.6%.
Women in Oxnard earn 83.4 cents for every dollar earned by a man.
What is Family Income Deficit in Oxnard?
Family Income Deficit in Oxnard is $11,332.
Families that are below poverty line in Oxnard earn $11,332 less on average than the poverty threshold level.
What is Inequality or Gini Index in Oxnard?
Inequality or Gini Index in Oxnard is 0.39.
What is the Total Population of Oxnard?
Total Population of Oxnard is 202,279.
What is the Total Male Population of Oxnard?
Total Male Population of Oxnard is 102,922.
What is the Total Female Population of Oxnard?
Total Female Population of Oxnard is 99,357.
What is the Ratio of Males per 100 Females in Oxnard?
There are 103.59 Males per 100 Females in Oxnard.
What is the Ratio of Females per 100 Males in Oxnard?
There are 96.54 Females per 100 Males in Oxnard.
What is the Median Population Age in Oxnard?
Median Population Age in Oxnard is 33.5 Years.
What is the Average Family Size in Oxnard
Average Family Size in Oxnard is 4.2 People.
What is the Average Household Size in Oxnard
Average Household Size in Oxnard is 3.9 People.
How Large is the Labor Force in Oxnard?
There are 104,962 People in the Labor Forcein in Oxnard.
What is the Percentage of People in the Labor Force in Oxnard?
67.8% of People are in the Labor Force in Oxnard.
What is the Unemployment Rate in Oxnard?
Unemployment Rate in Oxnard is 5.9%.