Cities with the Largest Black / African American Community in Illinois
RELATED REPORTS & OPTIONS
Black / African American
Illinois
Compare Cities
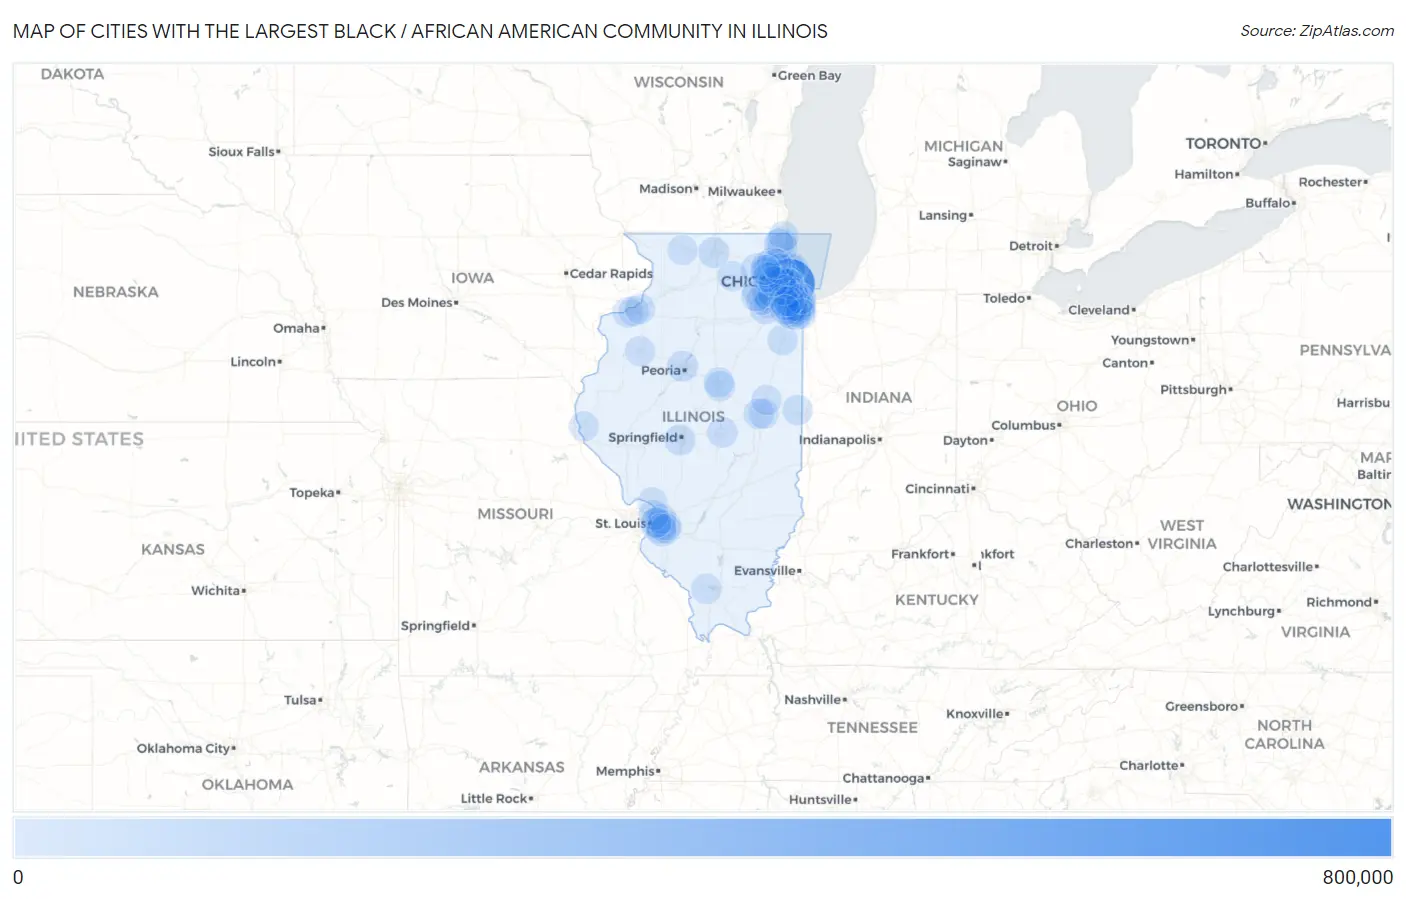
Map of Cities with the Largest Black / African American Community in Illinois
0
800,000
Cities with the Largest Black / African American Community in Illinois
| City | Black / African American | vs State | vs National | |
| 1. | Chicago | 784,078 | 1,774,605(44.18%)#1 | 41,288,572(1.90%)#2 |
| 2. | Rockford | 32,531 | 1,774,605(1.83%)#2 | 41,288,572(0.08%)#145 |
| 3. | Peoria | 29,886 | 1,774,605(1.68%)#3 | 41,288,572(0.07%)#159 |
| 4. | Joliet | 25,759 | 1,774,605(1.45%)#4 | 41,288,572(0.06%)#189 |
| 5. | Calumet City | 25,517 | 1,774,605(1.44%)#5 | 41,288,572(0.06%)#195 |
| 6. | Springfield | 23,151 | 1,774,605(1.30%)#6 | 41,288,572(0.06%)#223 |
| 7. | Dolton | 19,409 | 1,774,605(1.09%)#7 | 41,288,572(0.05%)#266 |
| 8. | Aurora | 19,343 | 1,774,605(1.09%)#8 | 41,288,572(0.05%)#267 |
| 9. | East St Louis | 17,773 | 1,774,605(1.00%)#9 | 41,288,572(0.04%)#293 |
| 10. | South Holland | 17,097 | 1,774,605(0.96%)#10 | 41,288,572(0.04%)#305 |
| 11. | Decatur | 17,064 | 1,774,605(0.96%)#11 | 41,288,572(0.04%)#310 |
| 12. | Waukegan | 16,244 | 1,774,605(0.92%)#12 | 41,288,572(0.04%)#326 |
| 13. | Champaign | 15,246 | 1,774,605(0.86%)#13 | 41,288,572(0.04%)#344 |
| 14. | Matteson | 15,194 | 1,774,605(0.86%)#14 | 41,288,572(0.04%)#347 |
| 15. | Park Forest | 15,007 | 1,774,605(0.85%)#15 | 41,288,572(0.04%)#350 |
| 16. | Country Club Hills | 14,728 | 1,774,605(0.83%)#16 | 41,288,572(0.04%)#359 |
| 17. | Maywood | 14,167 | 1,774,605(0.80%)#17 | 41,288,572(0.03%)#372 |
| 18. | Lansing | 13,661 | 1,774,605(0.77%)#18 | 41,288,572(0.03%)#385 |
| 19. | Bellwood | 13,374 | 1,774,605(0.75%)#19 | 41,288,572(0.03%)#393 |
| 20. | Cahokia Heights | 13,336 | 1,774,605(0.75%)#20 | 41,288,572(0.03%)#395 |
| 21. | Bolingbrook | 13,192 | 1,774,605(0.74%)#21 | 41,288,572(0.03%)#404 |
| 22. | Belleville | 12,897 | 1,774,605(0.73%)#22 | 41,288,572(0.03%)#418 |
| 23. | Evanston | 12,756 | 1,774,605(0.72%)#23 | 41,288,572(0.03%)#424 |
| 24. | Hazel Crest | 11,897 | 1,774,605(0.67%)#24 | 41,288,572(0.03%)#459 |
| 25. | Harvey | 11,812 | 1,774,605(0.67%)#25 | 41,288,572(0.03%)#466 |
| 26. | Richton Park | 11,497 | 1,774,605(0.65%)#26 | 41,288,572(0.03%)#480 |
| 27. | Chicago Heights | 11,009 | 1,774,605(0.62%)#27 | 41,288,572(0.03%)#499 |
| 28. | Oak Park | 10,244 | 1,774,605(0.58%)#28 | 41,288,572(0.02%)#537 |
| 29. | Kankakee | 10,213 | 1,774,605(0.58%)#29 | 41,288,572(0.02%)#541 |
| 30. | Homewood | 9,944 | 1,774,605(0.56%)#30 | 41,288,572(0.02%)#558 |
| 31. | Danville | 9,627 | 1,774,605(0.54%)#31 | 41,288,572(0.02%)#577 |
| 32. | Riverdale | 9,223 | 1,774,605(0.52%)#32 | 41,288,572(0.02%)#609 |
| 33. | Markham | 8,527 | 1,774,605(0.48%)#33 | 41,288,572(0.02%)#658 |
| 34. | North Chicago | 7,908 | 1,774,605(0.45%)#34 | 41,288,572(0.02%)#714 |
| 35. | Blue Island | 7,695 | 1,774,605(0.43%)#35 | 41,288,572(0.02%)#734 |
| 36. | Bloomington | 7,492 | 1,774,605(0.42%)#36 | 41,288,572(0.02%)#755 |
| 37. | Naperville | 6,883 | 1,774,605(0.39%)#37 | 41,288,572(0.02%)#803 |
| 38. | Normal | 6,712 | 1,774,605(0.38%)#38 | 41,288,572(0.02%)#817 |
| 39. | Sauk Village | 6,617 | 1,774,605(0.37%)#39 | 41,288,572(0.02%)#827 |
| 40. | Urbana | 6,565 | 1,774,605(0.37%)#40 | 41,288,572(0.02%)#834 |
| 41. | Lynwood | 6,416 | 1,774,605(0.36%)#41 | 41,288,572(0.02%)#849 |
| 42. | Rock Island | 6,366 | 1,774,605(0.36%)#42 | 41,288,572(0.02%)#855 |
| 43. | Alton | 6,343 | 1,774,605(0.36%)#43 | 41,288,572(0.02%)#859 |
| 44. | Skokie | 6,300 | 1,774,605(0.36%)#44 | 41,288,572(0.02%)#864 |
| 45. | University Park | 6,273 | 1,774,605(0.35%)#45 | 41,288,572(0.02%)#867 |
| 46. | Calumet Park | 6,234 | 1,774,605(0.35%)#46 | 41,288,572(0.02%)#874 |
| 47. | Elgin | 6,164 | 1,774,605(0.35%)#47 | 41,288,572(0.01%)#885 |
| 48. | Carbondale | 6,052 | 1,774,605(0.34%)#48 | 41,288,572(0.01%)#899 |
| 49. | Flossmoor | 5,961 | 1,774,605(0.34%)#49 | 41,288,572(0.01%)#908 |
| 50. | Dekalb | 5,959 | 1,774,605(0.34%)#50 | 41,288,572(0.01%)#909 |
| 51. | Zion | 5,817 | 1,774,605(0.33%)#51 | 41,288,572(0.01%)#929 |
| 52. | Glenwood | 5,474 | 1,774,605(0.31%)#52 | 41,288,572(0.01%)#980 |
| 53. | Broadview | 5,461 | 1,774,605(0.31%)#53 | 41,288,572(0.01%)#984 |
| 54. | Berwyn | 4,992 | 1,774,605(0.28%)#54 | 41,288,572(0.01%)#1,059 |
| 55. | Fairview Heights | 4,951 | 1,774,605(0.28%)#55 | 41,288,572(0.01%)#1,066 |
| 56. | Oak Lawn | 4,683 | 1,774,605(0.26%)#56 | 41,288,572(0.01%)#1,114 |
| 57. | Evergreen Park | 4,551 | 1,774,605(0.26%)#57 | 41,288,572(0.01%)#1,145 |
| 58. | Romeoville | 4,488 | 1,774,605(0.25%)#58 | 41,288,572(0.01%)#1,154 |
| 59. | Schaumburg | 4,462 | 1,774,605(0.25%)#59 | 41,288,572(0.01%)#1,161 |
| 60. | Alsip | 4,366 | 1,774,605(0.25%)#60 | 41,288,572(0.01%)#1,181 |
| 61. | Crest Hill | 4,333 | 1,774,605(0.24%)#61 | 41,288,572(0.01%)#1,189 |
| 62. | Robbins | 4,226 | 1,774,605(0.24%)#62 | 41,288,572(0.01%)#1,225 |
| 63. | Plainfield | 4,196 | 1,774,605(0.24%)#63 | 41,288,572(0.01%)#1,232 |
| 64. | Hillside | 4,101 | 1,774,605(0.23%)#64 | 41,288,572(0.01%)#1,248 |
| 65. | O Fallon | 4,077 | 1,774,605(0.23%)#65 | 41,288,572(0.01%)#1,259 |
| 66. | Moline | 3,993 | 1,774,605(0.23%)#66 | 41,288,572(0.01%)#1,291 |
| 67. | Olympia Fields | 3,899 | 1,774,605(0.22%)#67 | 41,288,572(0.01%)#1,316 |
| 68. | East Moline | 3,845 | 1,774,605(0.22%)#68 | 41,288,572(0.01%)#1,329 |
| 69. | Galesburg | 3,822 | 1,774,605(0.22%)#69 | 41,288,572(0.01%)#1,337 |
| 70. | Collinsville | 3,811 | 1,774,605(0.21%)#70 | 41,288,572(0.01%)#1,340 |
| 71. | Woodridge | 3,720 | 1,774,605(0.21%)#71 | 41,288,572(0.01%)#1,366 |
| 72. | Glendale Heights | 3,609 | 1,774,605(0.20%)#72 | 41,288,572(0.01%)#1,394 |
| 73. | Forest Park | 3,578 | 1,774,605(0.20%)#73 | 41,288,572(0.01%)#1,403 |
| 74. | Oswego | 3,535 | 1,774,605(0.20%)#74 | 41,288,572(0.01%)#1,415 |
| 75. | Tinley Park | 3,379 | 1,774,605(0.19%)#75 | 41,288,572(0.01%)#1,460 |
| 76. | Freeport | 3,348 | 1,774,605(0.19%)#76 | 41,288,572(0.01%)#1,478 |
| 77. | Westchester | 3,244 | 1,774,605(0.18%)#77 | 41,288,572(0.01%)#1,518 |
| 78. | Granite City | 3,101 | 1,774,605(0.17%)#78 | 41,288,572(0.01%)#1,574 |
| 79. | Swansea | 3,064 | 1,774,605(0.17%)#79 | 41,288,572(0.01%)#1,593 |
| 80. | Palatine | 3,058 | 1,774,605(0.17%)#80 | 41,288,572(0.01%)#1,597 |
| 81. | Cicero | 3,045 | 1,774,605(0.17%)#81 | 41,288,572(0.01%)#1,601 |
| 82. | Shiloh | 3,039 | 1,774,605(0.17%)#82 | 41,288,572(0.01%)#1,604 |
| 83. | Crete | 2,975 | 1,774,605(0.17%)#83 | 41,288,572(0.01%)#1,632 |
| 84. | Hanover Park | 2,865 | 1,774,605(0.16%)#84 | 41,288,572(0.01%)#1,675 |
| 85. | Rantoul | 2,864 | 1,774,605(0.16%)#85 | 41,288,572(0.01%)#1,677 |
| 86. | Hoffman Estates | 2,812 | 1,774,605(0.16%)#86 | 41,288,572(0.01%)#1,696 |
| 87. | Justice | 2,710 | 1,774,605(0.15%)#87 | 41,288,572(0.01%)#1,734 |
| 88. | Carol Stream | 2,697 | 1,774,605(0.15%)#88 | 41,288,572(0.01%)#1,743 |
| 89. | Burnham | 2,634 | 1,774,605(0.15%)#89 | 41,288,572(0.01%)#1,777 |
| 90. | Orland Park | 2,493 | 1,774,605(0.14%)#90 | 41,288,572(0.01%)#1,867 |
| 91. | Quincy | 2,448 | 1,774,605(0.14%)#91 | 41,288,572(0.01%)#1,895 |
| 92. | Gurnee | 2,347 | 1,774,605(0.13%)#92 | 41,288,572(0.01%)#1,958 |
| 93. | Des Plaines | 2,346 | 1,774,605(0.13%)#93 | 41,288,572(0.01%)#1,960 |
| 94. | Washington Park | 2,161 | 1,774,605(0.12%)#94 | 41,288,572(0.01%)#2,079 |
| 95. | Lombard | 2,132 | 1,774,605(0.12%)#95 | 41,288,572(0.01%)#2,106 |
| 96. | Arlington Heights | 2,123 | 1,774,605(0.12%)#96 | 41,288,572(0.01%)#2,116 |
| 97. | Streamwood | 2,112 | 1,774,605(0.12%)#97 | 41,288,572(0.01%)#2,128 |
| 98. | Willowbrook | 2,031 | 1,774,605(0.11%)#98 | 41,288,572(0.00%)#2,196 |
| 99. | Oak Forest | 1,999 | 1,774,605(0.11%)#99 | 41,288,572(0.00%)#2,218 |
| 100. | Frankfort | 1,971 | 1,774,605(0.11%)#100 | 41,288,572(0.00%)#2,243 |
Common Questions
What are the Top 10 Cities with the Largest Black / African American Community in Illinois?
Top 10 Cities with the Largest Black / African American Community in Illinois are:
#1
784,078
#2
32,531
#3
29,886
#4
25,759
#5
25,517
#6
23,151
#7
19,409
#8
19,343
#9
17,773
#10
17,097
What city has the Largest Black / African American Community in Illinois?
Chicago has the Largest Black / African American Community in Illinois with 784,078.
What is the Total Black / African American Population in the State of Illinois?
Total Black / African American Population in Illinois is 1,774,605.
What is the Total Black / African American Population in the United States?
Total Black / African American Population in the United States is 41,288,572.