Carmichael, CA Map & Demographics
Carmichael Map
Carmichael Overview
$45,855
PER CAPITA INCOME
$97,240
AVG FAMILY INCOME
$80,138
AVG HOUSEHOLD INCOME
18.8%
WAGE / INCOME GAP [ % ]
81.2¢/ $1
WAGE / INCOME GAP [ $ ]
$11,044
FAMILY INCOME DEFICIT
0.46
INEQUALITY / GINI INDEX
78,144
TOTAL POPULATION
38,080
MALE POPULATION
40,064
FEMALE POPULATION
95.05
MALES / 100 FEMALES
105.21
FEMALES / 100 MALES
41.0
MEDIAN AGE
3.0
AVG FAMILY SIZE
2.4
AVG HOUSEHOLD SIZE
39,146
LABOR FORCE [ PEOPLE ]
60.4%
PERCENT IN LABOR FORCE
5.5%
UNEMPLOYMENT RATE
Carmichael Zip Codes
Carmichael Area Codes
Income in Carmichael
Income Overview in Carmichael
Per Capita Income in Carmichael is $45,855, while median incomes of families and households are $97,240 and $80,138 respectively.
| Characteristic | Number | Measure |
| Per Capita Income | 78,144 | $45,855 |
| Median Family Income | 19,412 | $97,240 |
| Mean Family Income | 19,412 | $129,568 |
| Median Household Income | 31,528 | $80,138 |
| Mean Household Income | 31,528 | $110,659 |
| Income Deficit | 19,412 | $11,044 |
| Wage / Income Gap (%) | 78,144 | 18.76% |
| Wage / Income Gap ($) | 78,144 | 81.24¢ per $1 |
| Gini / Inequality Index | 78,144 | 0.46 |
Earnings by Sex in Carmichael
Average Earnings in Carmichael are $45,282, $49,003 for men and $39,812 for women, a difference of 18.8%.
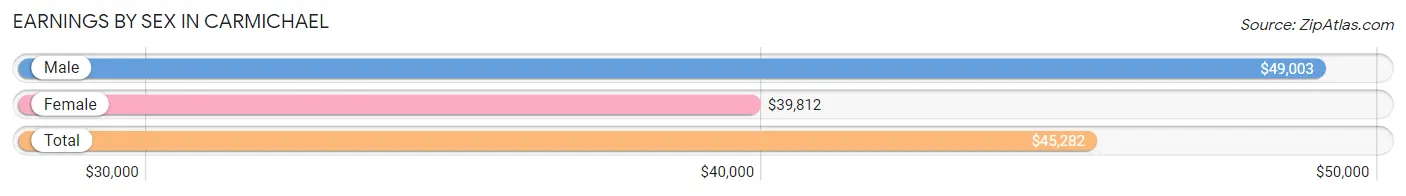
| Sex | Number | Average Earnings |
| Male | 21,448 (53.2%) | $49,003 |
| Female | 18,886 (46.8%) | $39,812 |
| Total | 40,334 (100.0%) | $45,282 |
Earnings by Sex by Income Bracket in Carmichael
The most common earnings brackets in Carmichael are $100,000+ for men (4,450 | 20.7%) and $100,000+ for women (2,534 | 13.4%).
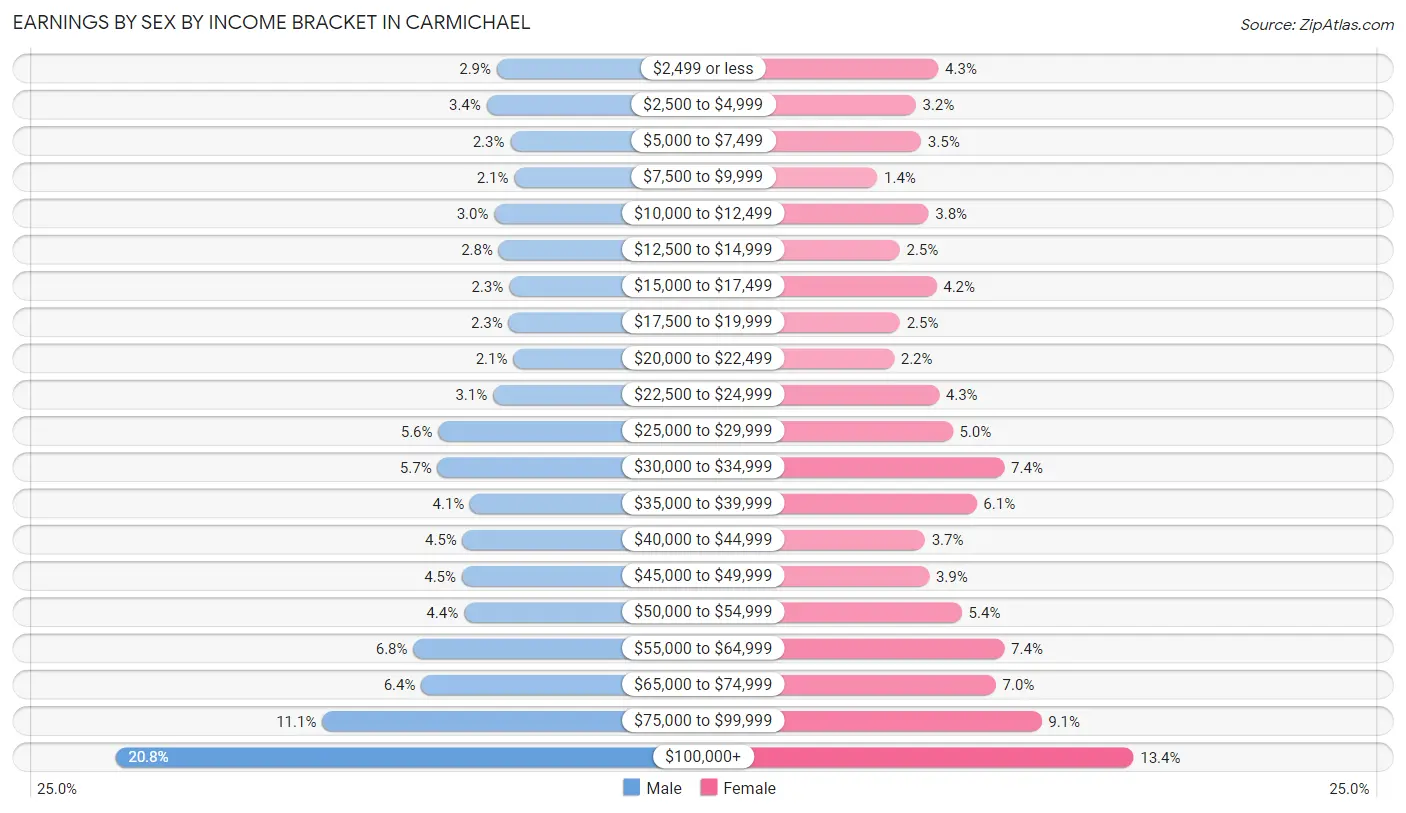
| Income | Male | Female |
| $2,499 or less | 617 (2.9%) | 809 (4.3%) |
| $2,500 to $4,999 | 720 (3.4%) | 609 (3.2%) |
| $5,000 to $7,499 | 483 (2.2%) | 655 (3.5%) |
| $7,500 to $9,999 | 442 (2.1%) | 268 (1.4%) |
| $10,000 to $12,499 | 644 (3.0%) | 721 (3.8%) |
| $12,500 to $14,999 | 599 (2.8%) | 466 (2.5%) |
| $15,000 to $17,499 | 495 (2.3%) | 791 (4.2%) |
| $17,500 to $19,999 | 499 (2.3%) | 468 (2.5%) |
| $20,000 to $22,499 | 452 (2.1%) | 416 (2.2%) |
| $22,500 to $24,999 | 657 (3.1%) | 814 (4.3%) |
| $25,000 to $29,999 | 1,205 (5.6%) | 934 (5.0%) |
| $30,000 to $34,999 | 1,215 (5.7%) | 1,391 (7.4%) |
| $35,000 to $39,999 | 886 (4.1%) | 1,147 (6.1%) |
| $40,000 to $44,999 | 961 (4.5%) | 689 (3.6%) |
| $45,000 to $49,999 | 969 (4.5%) | 728 (3.8%) |
| $50,000 to $54,999 | 947 (4.4%) | 1,017 (5.4%) |
| $55,000 to $64,999 | 1,456 (6.8%) | 1,391 (7.4%) |
| $65,000 to $74,999 | 1,378 (6.4%) | 1,317 (7.0%) |
| $75,000 to $99,999 | 2,373 (11.1%) | 1,721 (9.1%) |
| $100,000+ | 4,450 (20.7%) | 2,534 (13.4%) |
| Total | 21,448 (100.0%) | 18,886 (100.0%) |
Earnings by Sex by Educational Attainment in Carmichael
Average earnings in Carmichael are $55,786 for men and $47,554 for women, a difference of 14.8%. Men with an educational attainment of graduate degree enjoy the highest average annual earnings of $104,361, while those with less than high school education earn the least with $29,416. Women with an educational attainment of graduate degree earn the most with the average annual earnings of $80,347, while those with less than high school education have the smallest earnings of $23,822.
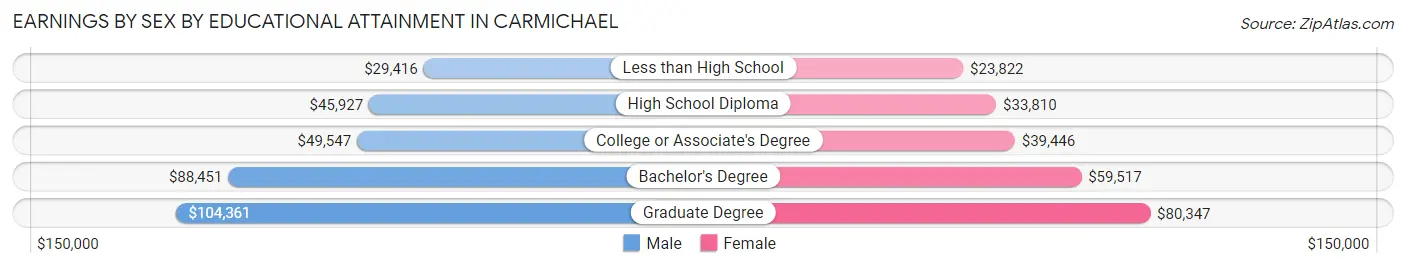
| Educational Attainment | Male Income | Female Income |
| Less than High School | $29,416 | $23,822 |
| High School Diploma | $45,927 | $33,810 |
| College or Associate's Degree | $49,547 | $39,446 |
| Bachelor's Degree | $88,451 | $59,517 |
| Graduate Degree | $104,361 | $80,347 |
| Total | $55,786 | $47,554 |
Family Income in Carmichael
Family Income Brackets in Carmichael
According to the Carmichael family income data, there are 3,785 families falling into the $100,000 to $149,999 income range, which is the most common income bracket and makes up 19.5% of all families. Conversely, the $10,000 to $14,999 income bracket is the least frequent group with only 369 families (1.9%) belonging to this category.
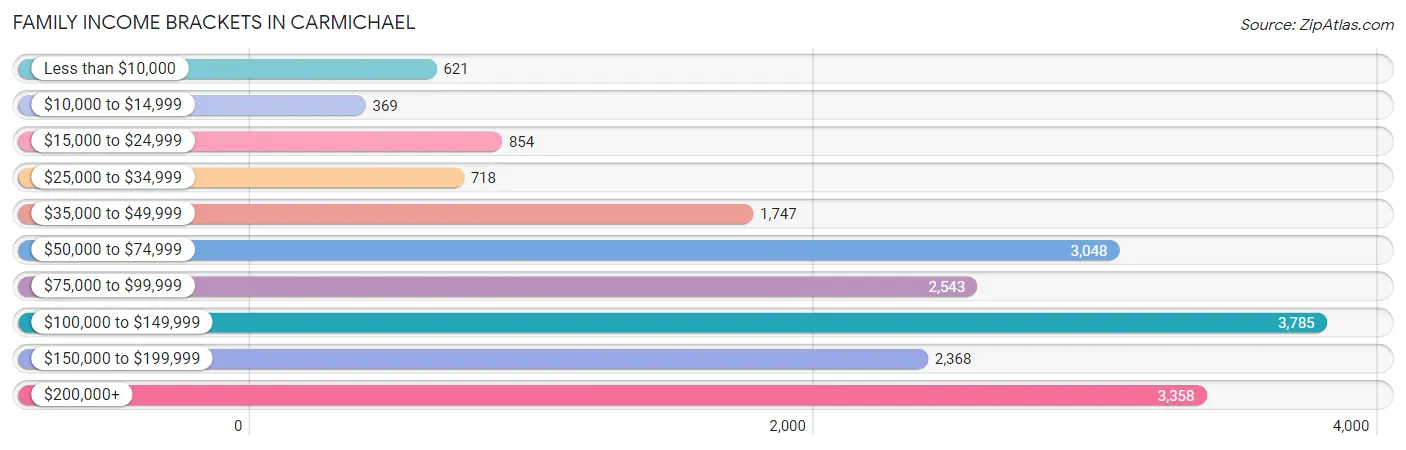
| Income Bracket | # Families | % Families |
| Less than $10,000 | 621 | 3.2% |
| $10,000 to $14,999 | 369 | 1.9% |
| $15,000 to $24,999 | 854 | 4.4% |
| $25,000 to $34,999 | 718 | 3.7% |
| $35,000 to $49,999 | 1,747 | 9.0% |
| $50,000 to $74,999 | 3,048 | 15.7% |
| $75,000 to $99,999 | 2,543 | 13.1% |
| $100,000 to $149,999 | 3,785 | 19.5% |
| $150,000 to $199,999 | 2,368 | 12.2% |
| $200,000+ | 3,358 | 17.3% |
Family Income by Famaliy Size in Carmichael
4-person families (3,743 | 19.3%) account for the highest median family income in Carmichael with $115,725 per family, while 2-person families (9,399 | 48.4%) have the highest median income of $43,462 per family member.
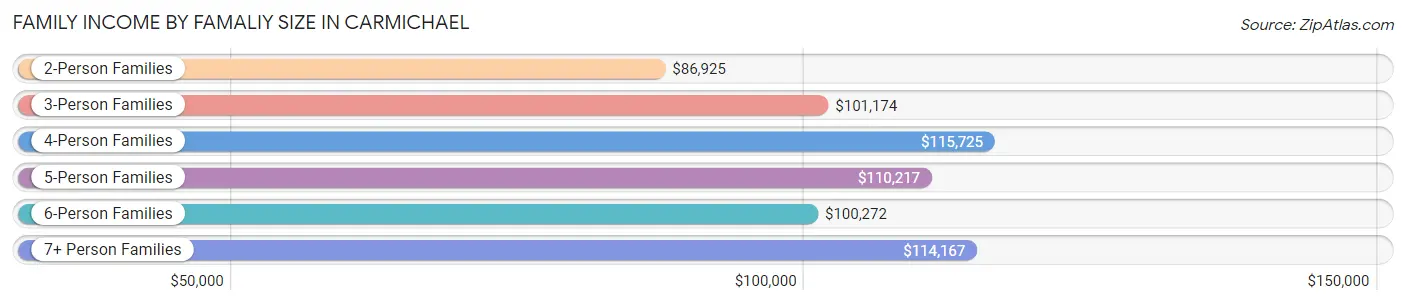
| Income Bracket | # Families | Median Income |
| 2-Person Families | 9,399 (48.4%) | $86,925 |
| 3-Person Families | 4,523 (23.3%) | $101,174 |
| 4-Person Families | 3,743 (19.3%) | $115,725 |
| 5-Person Families | 1,142 (5.9%) | $110,217 |
| 6-Person Families | 477 (2.5%) | $100,272 |
| 7+ Person Families | 128 (0.7%) | $114,167 |
| Total | 19,412 (100.0%) | $97,240 |
Family Income by Number of Earners in Carmichael
The median family income in Carmichael is $97,240, with families comprising 3+ earners (1,840) having the highest median family income of $157,195, while families with 1 earner (6,561) have the lowest median family income of $66,868, accounting for 9.5% and 33.8% of families, respectively.
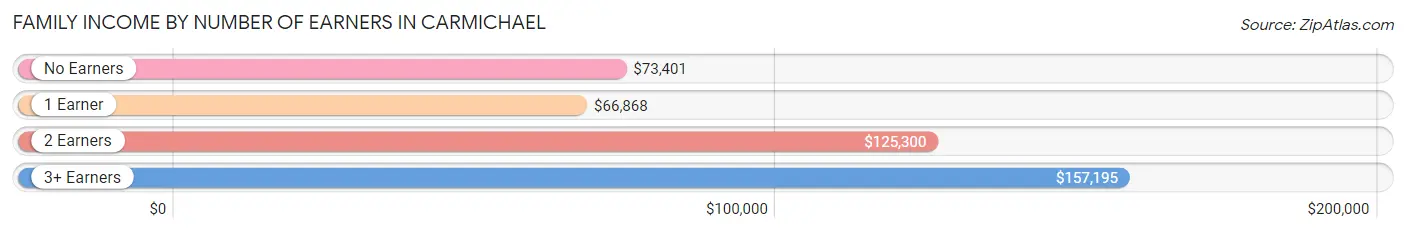
| Number of Earners | # Families | Median Income |
| No Earners | 3,385 (17.4%) | $73,401 |
| 1 Earner | 6,561 (33.8%) | $66,868 |
| 2 Earners | 7,626 (39.3%) | $125,300 |
| 3+ Earners | 1,840 (9.5%) | $157,195 |
| Total | 19,412 (100.0%) | $97,240 |
Household Income in Carmichael
Household Income Brackets in Carmichael
With 5,707 households falling in the category, the $100,000 to $149,999 income range is the most frequent in Carmichael, accounting for 18.1% of all households. In contrast, only 1,009 households (3.2%) fall into the $10,000 to $14,999 income bracket, making it the least populous group.
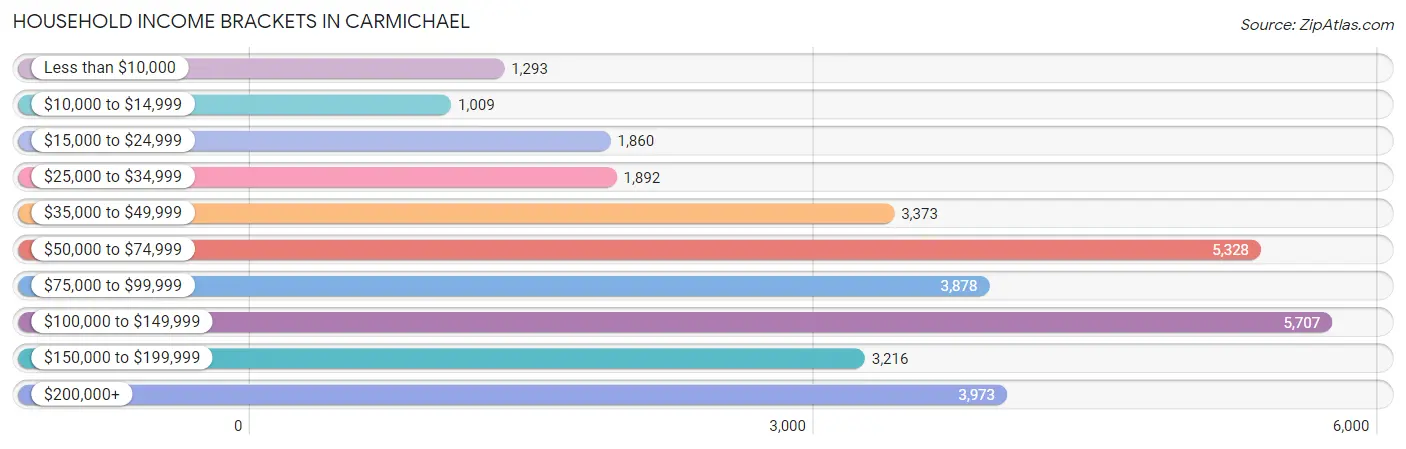
| Income Bracket | # Households | % Households |
| Less than $10,000 | 1,293 | 4.1% |
| $10,000 to $14,999 | 1,009 | 3.2% |
| $15,000 to $24,999 | 1,860 | 5.9% |
| $25,000 to $34,999 | 1,892 | 6.0% |
| $35,000 to $49,999 | 3,373 | 10.7% |
| $50,000 to $74,999 | 5,328 | 16.9% |
| $75,000 to $99,999 | 3,878 | 12.3% |
| $100,000 to $149,999 | 5,707 | 18.1% |
| $150,000 to $199,999 | 3,216 | 10.2% |
| $200,000+ | 3,973 | 12.6% |
Household Income by Householder Age in Carmichael
The median household income in Carmichael is $80,138, with the highest median household income of $103,190 found in the 45 to 64 years age bracket for the primary householder. A total of 11,399 households (36.2%) fall into this category. Meanwhile, the 15 to 24 years age bracket for the primary householder has the lowest median household income of $48,411, with 851 households (2.7%) in this group.
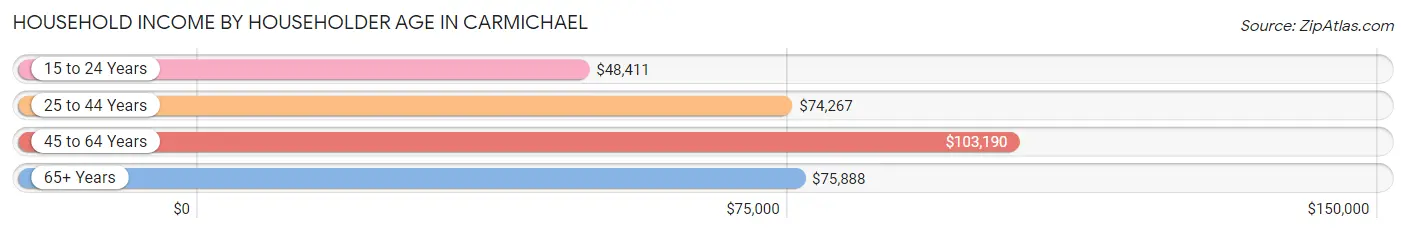
| Income Bracket | # Households | Median Income |
| 15 to 24 Years | 851 (2.7%) | $48,411 |
| 25 to 44 Years | 9,833 (31.2%) | $74,267 |
| 45 to 64 Years | 11,399 (36.2%) | $103,190 |
| 65+ Years | 9,445 (30.0%) | $75,888 |
| Total | 31,528 (100.0%) | $80,138 |
Poverty in Carmichael
Income Below Poverty by Sex and Age in Carmichael
With 11.1% poverty level for males and 12.8% for females among the residents of Carmichael, under 5 year old males and 5 year old females are the most vulnerable to poverty, with 517 males (23.9%) and 103 females (24.6%) in their respective age groups living below the poverty level.
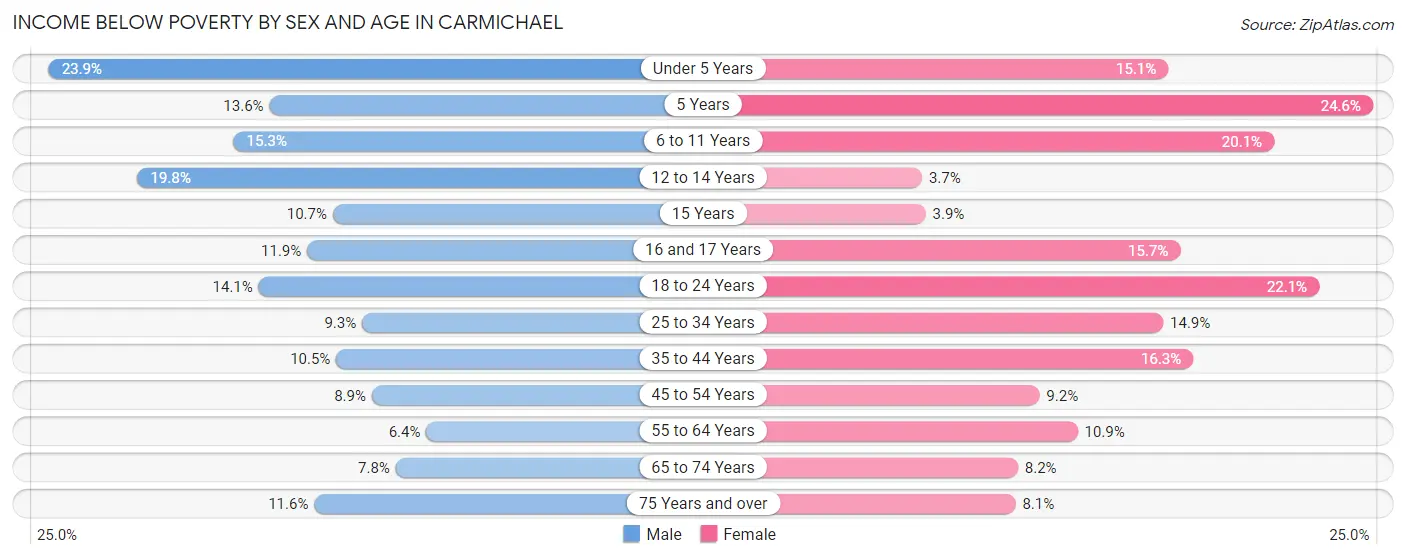
| Age Bracket | Male | Female |
| Under 5 Years | 517 (23.9%) | 279 (15.1%) |
| 5 Years | 57 (13.6%) | 103 (24.6%) |
| 6 to 11 Years | 316 (15.3%) | 493 (20.1%) |
| 12 to 14 Years | 280 (19.8%) | 47 (3.7%) |
| 15 Years | 55 (10.7%) | 21 (3.9%) |
| 16 and 17 Years | 109 (11.9%) | 138 (15.7%) |
| 18 to 24 Years | 468 (14.1%) | 651 (22.1%) |
| 25 to 34 Years | 602 (9.3%) | 803 (14.9%) |
| 35 to 44 Years | 487 (10.5%) | 783 (16.3%) |
| 45 to 54 Years | 367 (8.9%) | 398 (9.2%) |
| 55 to 64 Years | 344 (6.4%) | 617 (10.9%) |
| 65 to 74 Years | 276 (7.8%) | 391 (8.2%) |
| 75 Years and over | 314 (11.6%) | 327 (8.1%) |
| Total | 4,192 (11.1%) | 5,051 (12.8%) |
Income Above Poverty by Sex and Age in Carmichael
According to the poverty statistics in Carmichael, males aged 55 to 64 years and females aged 12 to 14 years are the age groups that are most secure financially, with 93.6% of males and 96.3% of females in these age groups living above the poverty line.
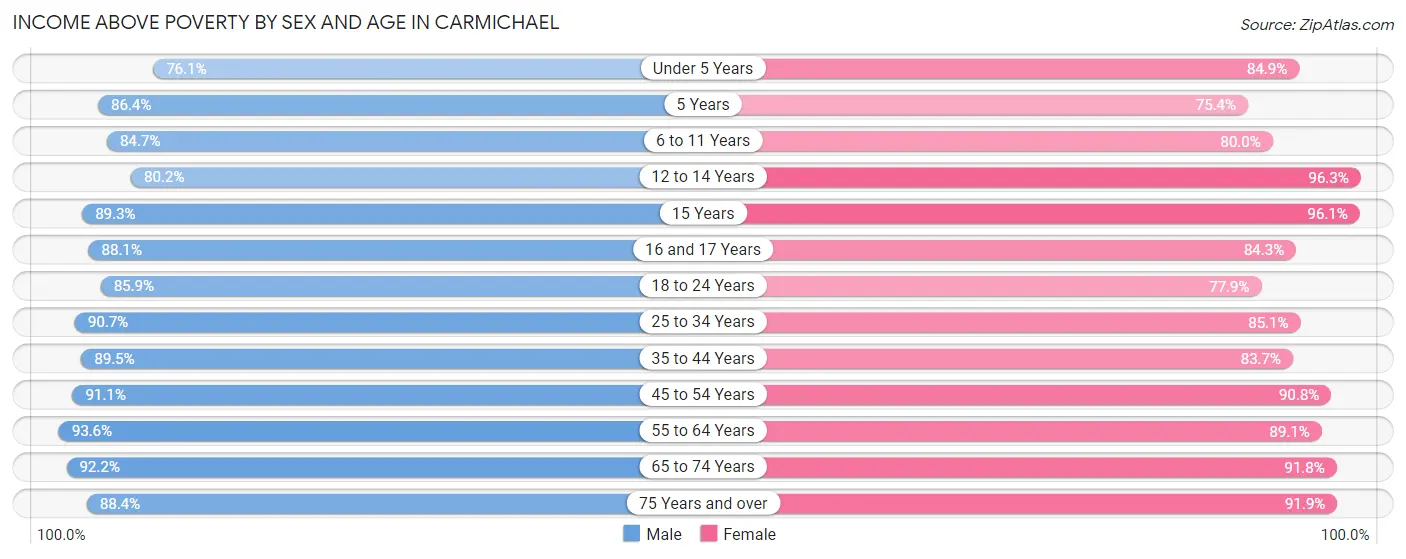
| Age Bracket | Male | Female |
| Under 5 Years | 1,648 (76.1%) | 1,564 (84.9%) |
| 5 Years | 361 (86.4%) | 315 (75.4%) |
| 6 to 11 Years | 1,750 (84.7%) | 1,966 (79.9%) |
| 12 to 14 Years | 1,137 (80.2%) | 1,216 (96.3%) |
| 15 Years | 459 (89.3%) | 519 (96.1%) |
| 16 and 17 Years | 808 (88.1%) | 741 (84.3%) |
| 18 to 24 Years | 2,842 (85.9%) | 2,290 (77.9%) |
| 25 to 34 Years | 5,843 (90.7%) | 4,583 (85.1%) |
| 35 to 44 Years | 4,135 (89.5%) | 4,020 (83.7%) |
| 45 to 54 Years | 3,761 (91.1%) | 3,943 (90.8%) |
| 55 to 64 Years | 5,061 (93.6%) | 5,025 (89.1%) |
| 65 to 74 Years | 3,272 (92.2%) | 4,392 (91.8%) |
| 75 Years and over | 2,403 (88.4%) | 3,731 (91.9%) |
| Total | 33,480 (88.9%) | 34,305 (87.2%) |
Income Below Poverty Among Married-Couple Families in Carmichael
The poverty statistics for married-couple families in Carmichael show that 6.1% or 850 of the total 13,839 families live below the poverty line. Families with 3 or 4 children have the highest poverty rate of 16.8%, comprising of 134 families. On the other hand, families with 5 or more children have the lowest poverty rate of 0.0%, which includes 0 families.
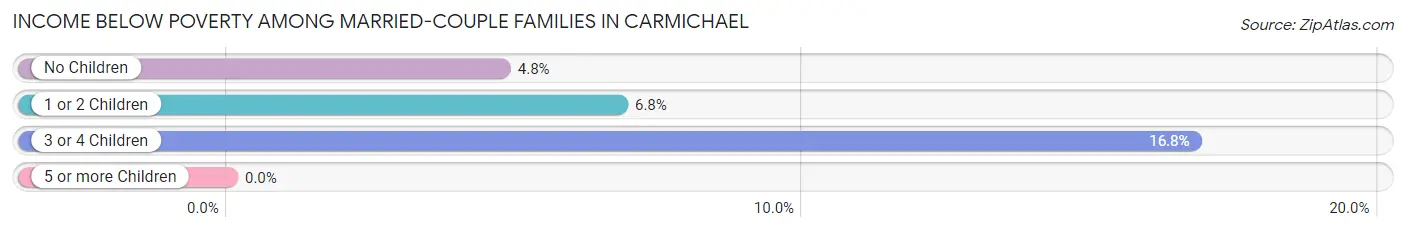
| Children | Above Poverty | Below Poverty |
| No Children | 7,795 (95.3%) | 389 (4.8%) |
| 1 or 2 Children | 4,491 (93.2%) | 327 (6.8%) |
| 3 or 4 Children | 665 (83.2%) | 134 (16.8%) |
| 5 or more Children | 38 (100.0%) | 0 (0.0%) |
| Total | 12,989 (93.9%) | 850 (6.1%) |
Income Below Poverty Among Single-Parent Households in Carmichael
According to the poverty data in Carmichael, 3.6% or 62 single-father households and 20.3% or 784 single-mother households are living below the poverty line. Among single-father households, those with 5 or more children have the highest poverty rate, with 5 households (29.4%) experiencing poverty. Likewise, among single-mother households, those with 3 or 4 children have the highest poverty rate, with 153 households (65.7%) falling below the poverty line.
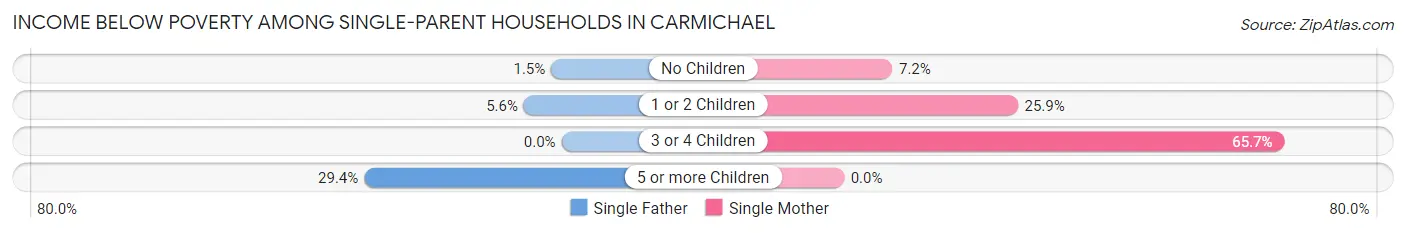
| Children | Single Father | Single Mother |
| No Children | 13 (1.5%) | 120 (7.2%) |
| 1 or 2 Children | 44 (5.6%) | 511 (25.9%) |
| 3 or 4 Children | 0 (0.0%) | 153 (65.7%) |
| 5 or more Children | 5 (29.4%) | 0 (0.0%) |
| Total | 62 (3.6%) | 784 (20.3%) |
Income Below Poverty Among Married-Couple vs Single-Parent Households in Carmichael
The poverty data for Carmichael shows that 850 of the married-couple family households (6.1%) and 846 of the single-parent households (15.2%) are living below the poverty level. Within the married-couple family households, those with 3 or 4 children have the highest poverty rate, with 134 households (16.8%) falling below the poverty line. Among the single-parent households, those with 3 or 4 children have the highest poverty rate, with 153 household (52.6%) living below poverty.
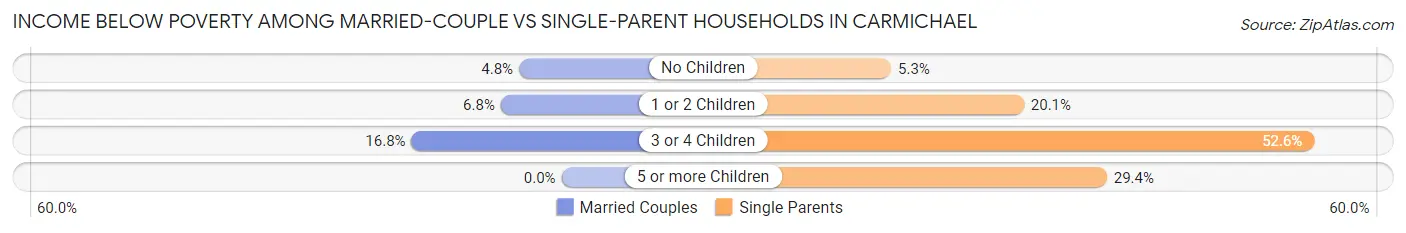
| Children | Married-Couple Families | Single-Parent Households |
| No Children | 389 (4.8%) | 133 (5.3%) |
| 1 or 2 Children | 327 (6.8%) | 555 (20.1%) |
| 3 or 4 Children | 134 (16.8%) | 153 (52.6%) |
| 5 or more Children | 0 (0.0%) | 5 (29.4%) |
| Total | 850 (6.1%) | 846 (15.2%) |
Race in Carmichael
The most populous races in Carmichael are White / Caucasian (55,978 | 71.6%), Hispanic or Latino (12,046 | 15.4%), and Two or more Races (7,602 | 9.7%).
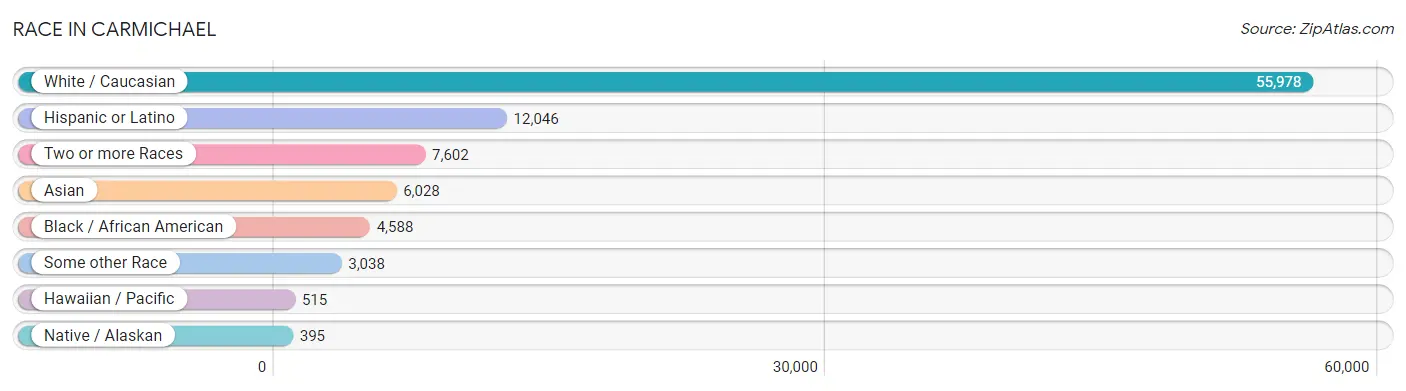
| Race | # Population | % Population |
| Asian | 6,028 | 7.7% |
| Black / African American | 4,588 | 5.9% |
| Hawaiian / Pacific | 515 | 0.7% |
| Hispanic or Latino | 12,046 | 15.4% |
| Native / Alaskan | 395 | 0.5% |
| White / Caucasian | 55,978 | 71.6% |
| Two or more Races | 7,602 | 9.7% |
| Some other Race | 3,038 | 3.9% |
| Total | 78,144 | 100.0% |
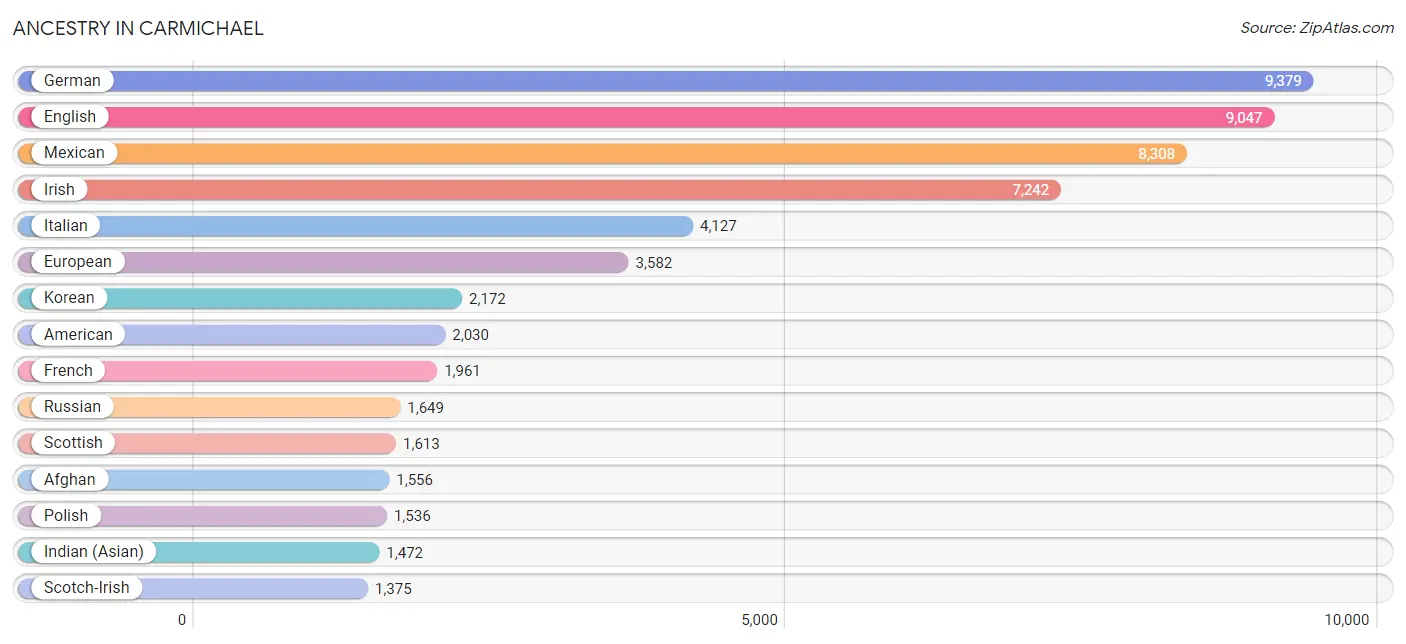
Ancestry in Carmichael
The most populous ancestries reported in Carmichael are German (9,379 | 12.0%), English (9,047 | 11.6%), Mexican (8,308 | 10.6%), Irish (7,242 | 9.3%), and Italian (4,127 | 5.3%), together accounting for 48.8% of all Carmichael residents.
| Ancestry | # Population | % Population |
| Afghan | 1,556 | 2.0% |
| African | 340 | 0.4% |
| Albanian | 89 | 0.1% |
| Aleut | 18 | 0.0% |
| American | 2,030 | 2.6% |
| Apache | 10 | 0.0% |
| Arab | 826 | 1.1% |
| Arapaho | 38 | 0.1% |
| Argentinean | 98 | 0.1% |
| Armenian | 354 | 0.4% |
| Australian | 123 | 0.2% |
| Austrian | 79 | 0.1% |
| Bangladeshi | 82 | 0.1% |
| Basque | 47 | 0.1% |
| Bhutanese | 777 | 1.0% |
| Blackfeet | 88 | 0.1% |
| Bolivian | 12 | 0.0% |
| Brazilian | 21 | 0.0% |
| British | 504 | 0.6% |
| Bulgarian | 56 | 0.1% |
| Burmese | 689 | 0.9% |
| Cambodian | 24 | 0.0% |
| Canadian | 103 | 0.1% |
| Celtic | 10 | 0.0% |
| Central American | 647 | 0.8% |
| Central American Indian | 127 | 0.2% |
| Cherokee | 516 | 0.7% |
| Chippewa | 14 | 0.0% |
| Choctaw | 223 | 0.3% |
| Colombian | 254 | 0.3% |
| Cree | 33 | 0.0% |
| Creek | 13 | 0.0% |
| Croatian | 98 | 0.1% |
| Cuban | 196 | 0.3% |
| Czech | 412 | 0.5% |
| Czechoslovakian | 23 | 0.0% |
| Danish | 803 | 1.0% |
| Dutch | 733 | 0.9% |
| Eastern European | 186 | 0.2% |
| Ecuadorian | 31 | 0.0% |
| English | 9,047 | 11.6% |
| Ethiopian | 336 | 0.4% |
| European | 3,582 | 4.6% |
| Filipino | 84 | 0.1% |
| Finnish | 285 | 0.4% |
| French | 1,961 | 2.5% |
| French Canadian | 262 | 0.3% |
| German | 9,379 | 12.0% |
| Greek | 529 | 0.7% |
| Guamanian / Chamorro | 125 | 0.2% |
| Guatemalan | 263 | 0.3% |
| Hungarian | 385 | 0.5% |
| Icelander | 21 | 0.0% |
| Indian (Asian) | 1,472 | 1.9% |
| Iranian | 381 | 0.5% |
| Iraqi | 157 | 0.2% |
| Irish | 7,242 | 9.3% |
| Iroquois | 23 | 0.0% |
| Italian | 4,127 | 5.3% |
| Jamaican | 130 | 0.2% |
| Japanese | 23 | 0.0% |
| Jordanian | 25 | 0.0% |
| Korean | 2,172 | 2.8% |
| Laotian | 86 | 0.1% |
| Latvian | 47 | 0.1% |
| Lebanese | 47 | 0.1% |
| Liberian | 48 | 0.1% |
| Lithuanian | 69 | 0.1% |
| Malaysian | 29 | 0.0% |
| Maltese | 7 | 0.0% |
| Mexican | 8,308 | 10.6% |
| Mexican American Indian | 80 | 0.1% |
| Mongolian | 13 | 0.0% |
| Native Hawaiian | 71 | 0.1% |
| Navajo | 4 | 0.0% |
| Nepalese | 33 | 0.0% |
| Nicaraguan | 50 | 0.1% |
| Nigerian | 71 | 0.1% |
| Northern European | 295 | 0.4% |
| Norwegian | 1,238 | 1.6% |
| Osage | 6 | 0.0% |
| Pakistani | 177 | 0.2% |
| Palestinian | 25 | 0.0% |
| Panamanian | 38 | 0.1% |
| Paraguayan | 12 | 0.0% |
| Peruvian | 16 | 0.0% |
| Polish | 1,536 | 2.0% |
| Portuguese | 1,154 | 1.5% |
| Potawatomi | 10 | 0.0% |
| Pueblo | 246 | 0.3% |
| Puerto Rican | 756 | 1.0% |
| Romanian | 760 | 1.0% |
| Russian | 1,649 | 2.1% |
| Salvadoran | 296 | 0.4% |
| Samoan | 271 | 0.4% |
| Scandinavian | 163 | 0.2% |
| Scotch-Irish | 1,375 | 1.8% |
| Scottish | 1,613 | 2.1% |
| Serbian | 171 | 0.2% |
| Sioux | 37 | 0.1% |
| Slavic | 221 | 0.3% |
| Slovak | 24 | 0.0% |
| Slovene | 11 | 0.0% |
| South African | 47 | 0.1% |
| South American | 461 | 0.6% |
| Spaniard | 719 | 0.9% |
| Spanish | 633 | 0.8% |
| Sri Lankan | 647 | 0.8% |
| Subsaharan African | 868 | 1.1% |
| Swedish | 1,094 | 1.4% |
| Swiss | 507 | 0.6% |
| Syrian | 86 | 0.1% |
| Thai | 681 | 0.9% |
| Tohono O'Odham | 12 | 0.0% |
| Tongan | 72 | 0.1% |
| Trinidadian and Tobagonian | 71 | 0.1% |
| Turkish | 5 | 0.0% |
| Ukrainian | 1,165 | 1.5% |
| Ute | 9 | 0.0% |
| Venezuelan | 38 | 0.1% |
| Vietnamese | 15 | 0.0% |
| Welsh | 981 | 1.3% |
| West Indian | 4 | 0.0% |
| Yakama | 17 | 0.0% |
| Yaqui | 16 | 0.0% |
| Yugoslavian | 562 | 0.7% | View All 126 Rows |
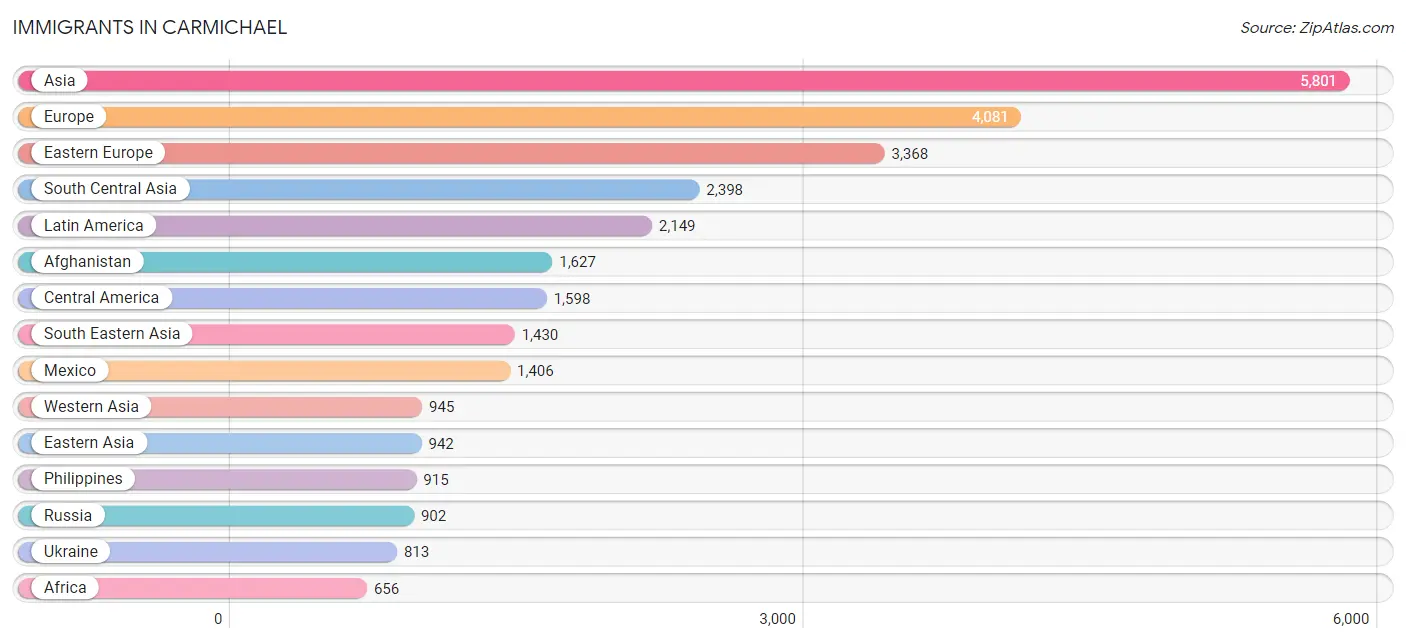
Immigrants in Carmichael
The most numerous immigrant groups reported in Carmichael came from Asia (5,801 | 7.4%), Europe (4,081 | 5.2%), Eastern Europe (3,368 | 4.3%), South Central Asia (2,398 | 3.1%), and Latin America (2,149 | 2.8%), together accounting for 22.8% of all Carmichael residents.
| Immigration Origin | # Population | % Population |
| Afghanistan | 1,627 | 2.1% |
| Africa | 656 | 0.8% |
| Argentina | 66 | 0.1% |
| Armenia | 193 | 0.3% |
| Asia | 5,801 | 7.4% |
| Australia | 97 | 0.1% |
| Bangladesh | 15 | 0.0% |
| Belarus | 247 | 0.3% |
| Belgium | 14 | 0.0% |
| Bolivia | 12 | 0.0% |
| Bosnia and Herzegovina | 384 | 0.5% |
| Brazil | 131 | 0.2% |
| Bulgaria | 19 | 0.0% |
| Canada | 197 | 0.3% |
| Caribbean | 255 | 0.3% |
| Central America | 1,598 | 2.0% |
| China | 515 | 0.7% |
| Colombia | 49 | 0.1% |
| Cuba | 154 | 0.2% |
| Czechoslovakia | 8 | 0.0% |
| Eastern Africa | 451 | 0.6% |
| Eastern Asia | 942 | 1.2% |
| Eastern Europe | 3,368 | 4.3% |
| Ecuador | 9 | 0.0% |
| El Salvador | 85 | 0.1% |
| England | 103 | 0.1% |
| Eritrea | 48 | 0.1% |
| Ethiopia | 286 | 0.4% |
| Europe | 4,081 | 5.2% |
| Fiji | 36 | 0.1% |
| France | 45 | 0.1% |
| Germany | 212 | 0.3% |
| Ghana | 9 | 0.0% |
| Greece | 62 | 0.1% |
| Guatemala | 39 | 0.1% |
| Hong Kong | 69 | 0.1% |
| Hungary | 38 | 0.1% |
| India | 284 | 0.4% |
| Indonesia | 61 | 0.1% |
| Iran | 354 | 0.4% |
| Iraq | 493 | 0.6% |
| Ireland | 8 | 0.0% |
| Israel | 48 | 0.1% |
| Italy | 154 | 0.2% |
| Jamaica | 18 | 0.0% |
| Japan | 81 | 0.1% |
| Jordan | 25 | 0.0% |
| Kazakhstan | 9 | 0.0% |
| Kenya | 38 | 0.1% |
| Korea | 332 | 0.4% |
| Laos | 21 | 0.0% |
| Latin America | 2,149 | 2.8% |
| Latvia | 13 | 0.0% |
| Mexico | 1,406 | 1.8% |
| Micronesia | 23 | 0.0% |
| Moldova | 515 | 0.7% |
| Nicaragua | 40 | 0.1% |
| Nigeria | 55 | 0.1% |
| Northern Africa | 23 | 0.0% |
| Northern Europe | 205 | 0.3% |
| Oceania | 164 | 0.2% |
| Pakistan | 28 | 0.0% |
| Panama | 28 | 0.0% |
| Philippines | 915 | 1.2% |
| Poland | 49 | 0.1% |
| Romania | 148 | 0.2% |
| Russia | 902 | 1.1% |
| Saudi Arabia | 41 | 0.1% |
| Serbia | 83 | 0.1% |
| Somalia | 32 | 0.0% |
| South Africa | 85 | 0.1% |
| South America | 296 | 0.4% |
| South Central Asia | 2,398 | 3.1% |
| South Eastern Asia | 1,430 | 1.8% |
| Southern Europe | 226 | 0.3% |
| Spain | 10 | 0.0% |
| Sri Lanka | 9 | 0.0% |
| Sweden | 24 | 0.0% |
| Switzerland | 11 | 0.0% |
| Syria | 30 | 0.0% |
| Taiwan | 115 | 0.2% |
| Thailand | 105 | 0.1% |
| Trinidad and Tobago | 79 | 0.1% |
| Turkey | 32 | 0.0% |
| Ukraine | 813 | 1.0% |
| Uzbekistan | 72 | 0.1% |
| Venezuela | 17 | 0.0% |
| Vietnam | 328 | 0.4% |
| Western Africa | 64 | 0.1% |
| Western Asia | 945 | 1.2% |
| Western Europe | 282 | 0.4% | View All 91 Rows |
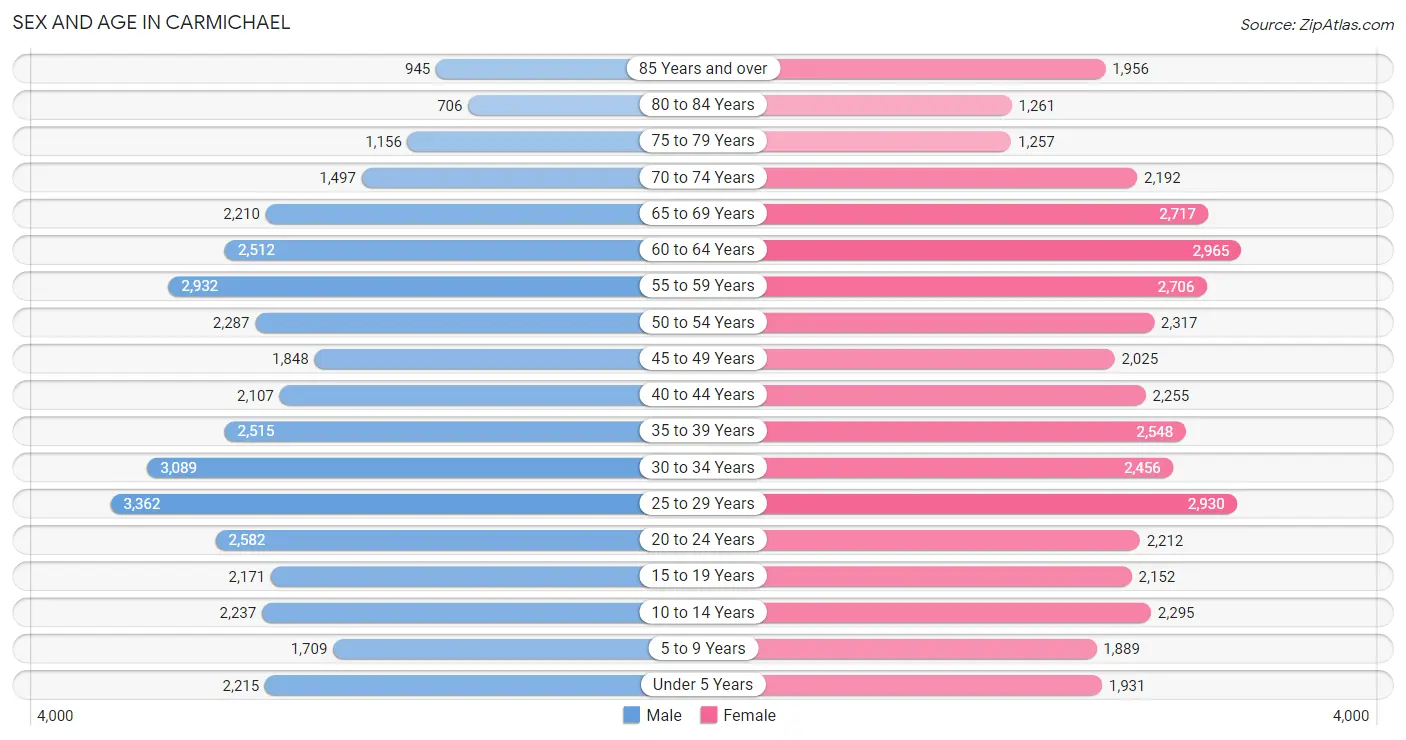
Sex and Age in Carmichael
Sex and Age in Carmichael
The most populous age groups in Carmichael are 25 to 29 Years (3,362 | 8.8%) for men and 60 to 64 Years (2,965 | 7.4%) for women.
| Age Bracket | Male | Female |
| Under 5 Years | 2,215 (5.8%) | 1,931 (4.8%) |
| 5 to 9 Years | 1,709 (4.5%) | 1,889 (4.7%) |
| 10 to 14 Years | 2,237 (5.9%) | 2,295 (5.7%) |
| 15 to 19 Years | 2,171 (5.7%) | 2,152 (5.4%) |
| 20 to 24 Years | 2,582 (6.8%) | 2,212 (5.5%) |
| 25 to 29 Years | 3,362 (8.8%) | 2,930 (7.3%) |
| 30 to 34 Years | 3,089 (8.1%) | 2,456 (6.1%) |
| 35 to 39 Years | 2,515 (6.6%) | 2,548 (6.4%) |
| 40 to 44 Years | 2,107 (5.5%) | 2,255 (5.6%) |
| 45 to 49 Years | 1,848 (4.9%) | 2,025 (5.1%) |
| 50 to 54 Years | 2,287 (6.0%) | 2,317 (5.8%) |
| 55 to 59 Years | 2,932 (7.7%) | 2,706 (6.8%) |
| 60 to 64 Years | 2,512 (6.6%) | 2,965 (7.4%) |
| 65 to 69 Years | 2,210 (5.8%) | 2,717 (6.8%) |
| 70 to 74 Years | 1,497 (3.9%) | 2,192 (5.5%) |
| 75 to 79 Years | 1,156 (3.0%) | 1,257 (3.1%) |
| 80 to 84 Years | 706 (1.8%) | 1,261 (3.2%) |
| 85 Years and over | 945 (2.5%) | 1,956 (4.9%) |
| Total | 38,080 (100.0%) | 40,064 (100.0%) |
Families and Households in Carmichael
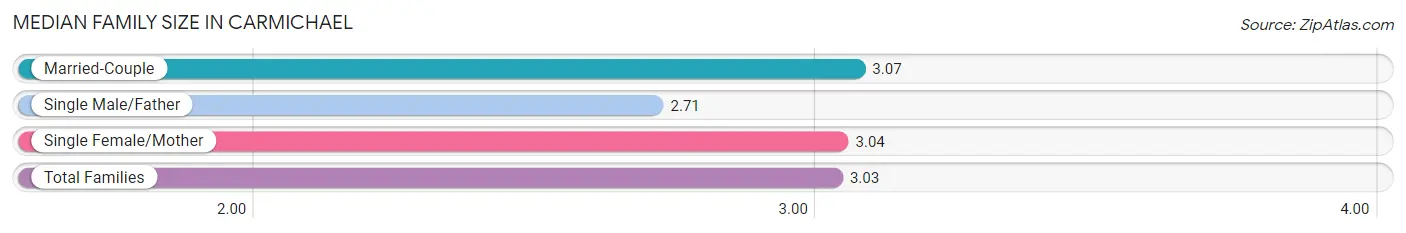
Median Family Size in Carmichael
The median family size in Carmichael is 3.03 persons per family, with married-couple families (13,839 | 71.3%) accounting for the largest median family size of 3.07 persons per family. On the other hand, single male/father families (1,703 | 8.8%) represent the smallest median family size with 2.71 persons per family.
| Family Type | # Families | Family Size |
| Married-Couple | 13,839 (71.3%) | 3.07 |
| Single Male/Father | 1,703 (8.8%) | 2.71 |
| Single Female/Mother | 3,870 (19.9%) | 3.04 |
| Total Families | 19,412 (100.0%) | 3.03 |
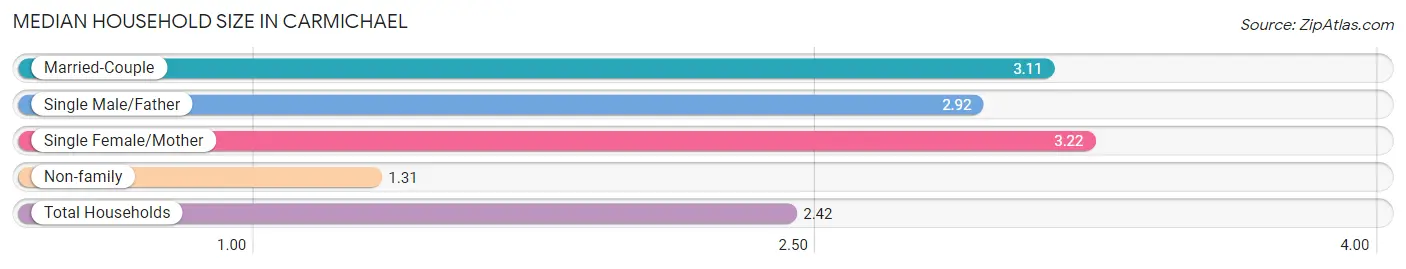
Median Household Size in Carmichael
The median household size in Carmichael is 2.42 persons per household, with single female/mother households (3,870 | 12.3%) accounting for the largest median household size of 3.22 persons per household. non-family households (12,116 | 38.4%) represent the smallest median household size with 1.31 persons per household.
| Household Type | # Households | Household Size |
| Married-Couple | 13,839 (43.9%) | 3.11 |
| Single Male/Father | 1,703 (5.4%) | 2.92 |
| Single Female/Mother | 3,870 (12.3%) | 3.22 |
| Non-family | 12,116 (38.4%) | 1.31 |
| Total Households | 31,528 (100.0%) | 2.42 |
Household Size by Marriage Status in Carmichael
Out of a total of 31,528 households in Carmichael, 19,412 (61.6%) are family households, while 12,116 (38.4%) are nonfamily households. The most numerous type of family households are 2-person households, comprising 8,868, and the most common type of nonfamily households are 1-person households, comprising 9,080.
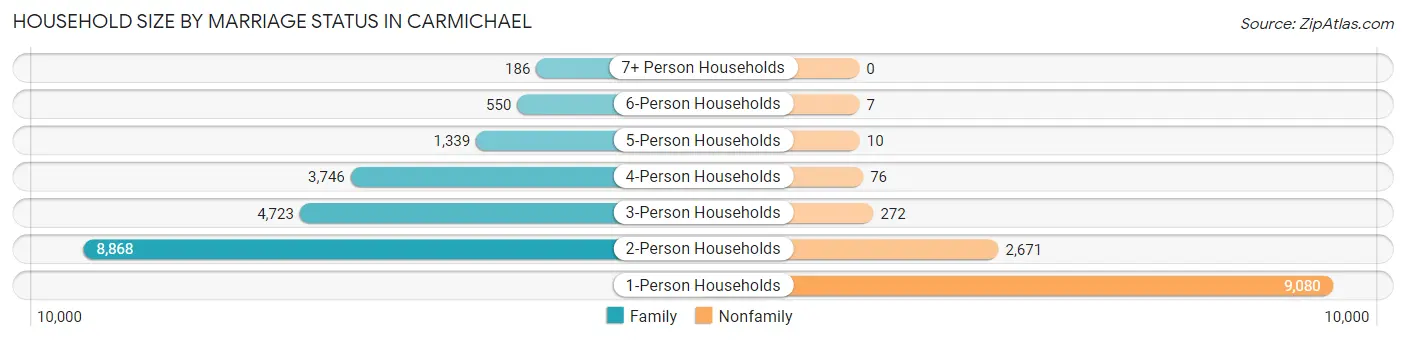
| Household Size | Family Households | Nonfamily Households |
| 1-Person Households | - | 9,080 (28.8%) |
| 2-Person Households | 8,868 (28.1%) | 2,671 (8.5%) |
| 3-Person Households | 4,723 (15.0%) | 272 (0.9%) |
| 4-Person Households | 3,746 (11.9%) | 76 (0.2%) |
| 5-Person Households | 1,339 (4.3%) | 10 (0.0%) |
| 6-Person Households | 550 (1.7%) | 7 (0.0%) |
| 7+ Person Households | 186 (0.6%) | 0 (0.0%) |
| Total | 19,412 (61.6%) | 12,116 (38.4%) |
Female Fertility in Carmichael
Fertility by Age in Carmichael
Average fertility rate in Carmichael is 39.0 births per 1,000 women. Women in the age bracket of 20 to 34 years have the highest fertility rate with 53.0 births per 1,000 women. Women in the age bracket of 20 to 34 years acount for 60.6% of all women with births.
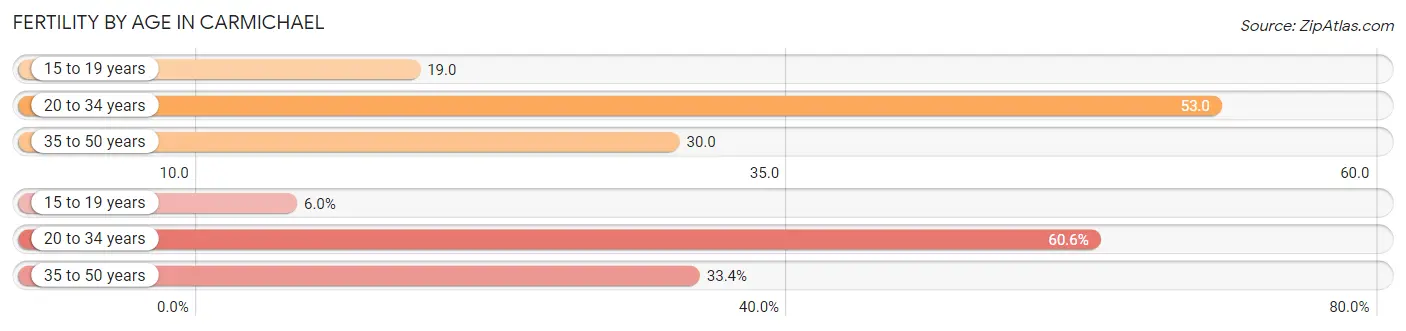
| Age Bracket | Women with Births | Births / 1,000 Women |
| 15 to 19 years | 40 (6.0%) | 19.0 |
| 20 to 34 years | 401 (60.6%) | 53.0 |
| 35 to 50 years | 221 (33.4%) | 30.0 |
| Total | 662 (100.0%) | 39.0 |
Fertility by Age by Marriage Status in Carmichael
71.5% of women with births (662) in Carmichael are married. The highest percentage of unmarried women with births falls into 15 to 19 years age bracket with 47.5% of them unmarried at the time of birth, while the lowest percentage of unmarried women with births belong to 20 to 34 years age bracket with 21.5% of them unmarried.
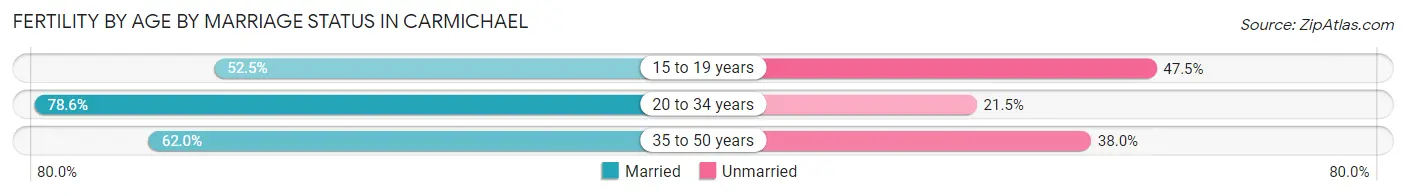
| Age Bracket | Married | Unmarried |
| 15 to 19 years | 21 (52.5%) | 19 (47.5%) |
| 20 to 34 years | 315 (78.5%) | 86 (21.4%) |
| 35 to 50 years | 137 (62.0%) | 84 (38.0%) |
| Total | 473 (71.5%) | 189 (28.5%) |
Fertility by Education in Carmichael
Average fertility rate in Carmichael is 39.0 births per 1,000 women. Women with the education attainment of high school diploma have the highest fertility rate of 50.0 births per 1,000 women, while women with the education attainment of graduate degree have the lowest fertility at 8.0 births per 1,000 women. Women with the education attainment of college or associate's degree represent 44.9% of all women with births.
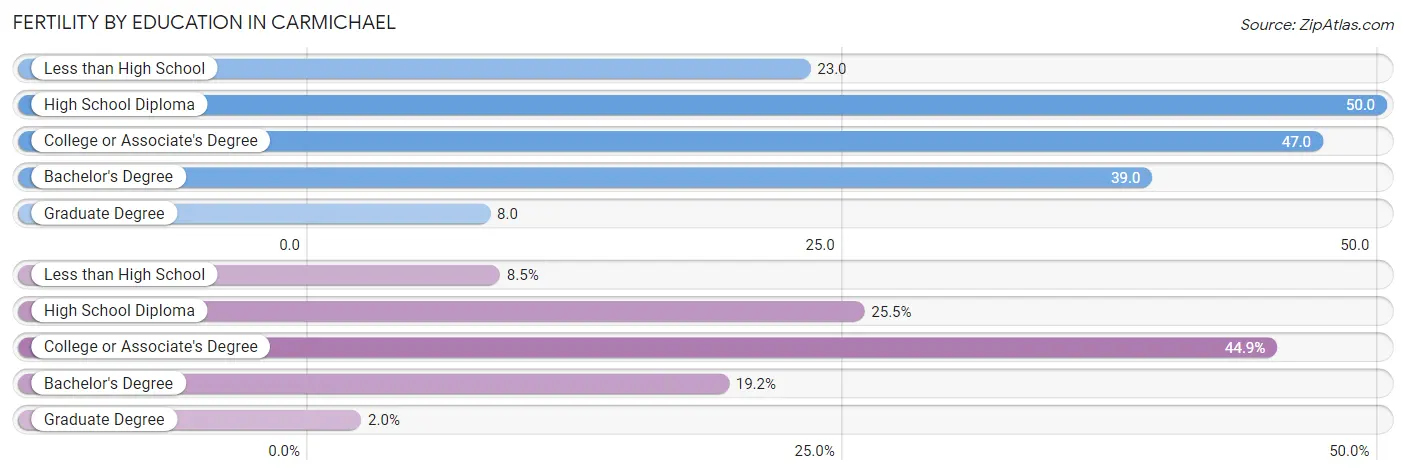
| Educational Attainment | Women with Births | Births / 1,000 Women |
| Less than High School | 56 (8.5%) | 23.0 |
| High School Diploma | 169 (25.5%) | 50.0 |
| College or Associate's Degree | 297 (44.9%) | 47.0 |
| Bachelor's Degree | 127 (19.2%) | 39.0 |
| Graduate Degree | 13 (2.0%) | 8.0 |
| Total | 662 (100.0%) | 39.0 |
Fertility by Education by Marriage Status in Carmichael
28.5% of women with births in Carmichael are unmarried. Women with the educational attainment of bachelor's degree are most likely to be married with 100.0% of them married at childbirth, while women with the educational attainment of high school diploma are least likely to be married with 49.1% of them unmarried at childbirth.
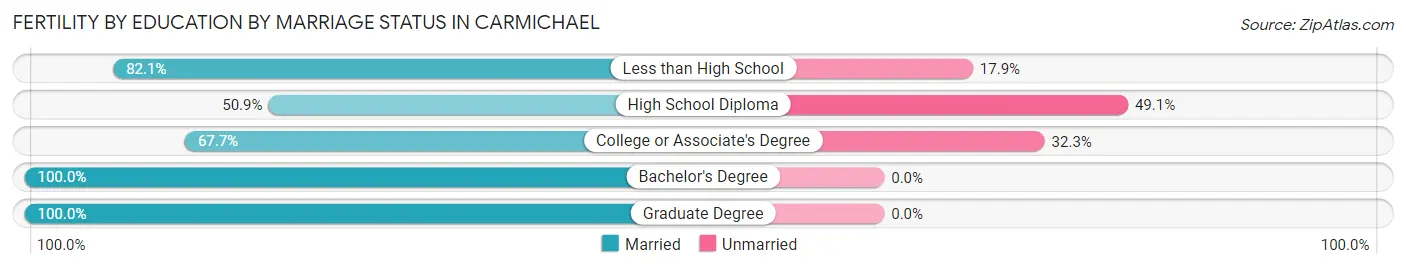
| Educational Attainment | Married | Unmarried |
| Less than High School | 46 (82.1%) | 10 (17.9%) |
| High School Diploma | 86 (50.9%) | 83 (49.1%) |
| College or Associate's Degree | 201 (67.7%) | 96 (32.3%) |
| Bachelor's Degree | 127 (100.0%) | 0 (0.0%) |
| Graduate Degree | 13 (100.0%) | 0 (0.0%) |
| Total | 473 (71.5%) | 189 (28.5%) |
Employment Characteristics in Carmichael
Employment by Class of Employer in Carmichael
Among the 35,936 employed individuals in Carmichael, private company employees (21,096 | 58.7%), state government employees (3,694 | 10.3%), and not-for-profit organizations (3,263 | 9.1%) make up the most common classes of employment.
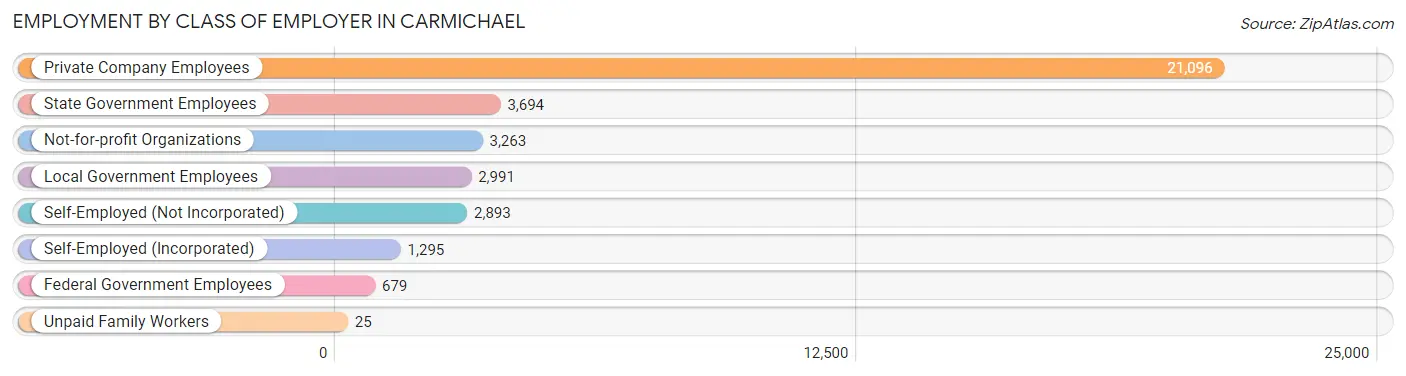
| Employer Class | # Employees | % Employees |
| Private Company Employees | 21,096 | 58.7% |
| Self-Employed (Incorporated) | 1,295 | 3.6% |
| Self-Employed (Not Incorporated) | 2,893 | 8.1% |
| Not-for-profit Organizations | 3,263 | 9.1% |
| Local Government Employees | 2,991 | 8.3% |
| State Government Employees | 3,694 | 10.3% |
| Federal Government Employees | 679 | 1.9% |
| Unpaid Family Workers | 25 | 0.1% |
| Total | 35,936 | 100.0% |
Employment Status by Age in Carmichael
According to the labor force statistics for Carmichael, out of the total population over 16 years of age (64,811), 60.4% or 39,146 individuals are in the labor force, with 5.5% or 2,153 of them unemployed. The age group with the highest labor force participation rate is 25 to 29 years, with 81.8% or 5,147 individuals in the labor force. Within the labor force, the 16 to 19 years age range has the highest percentage of unemployed individuals, with 16.3% or 179 of them being unemployed.
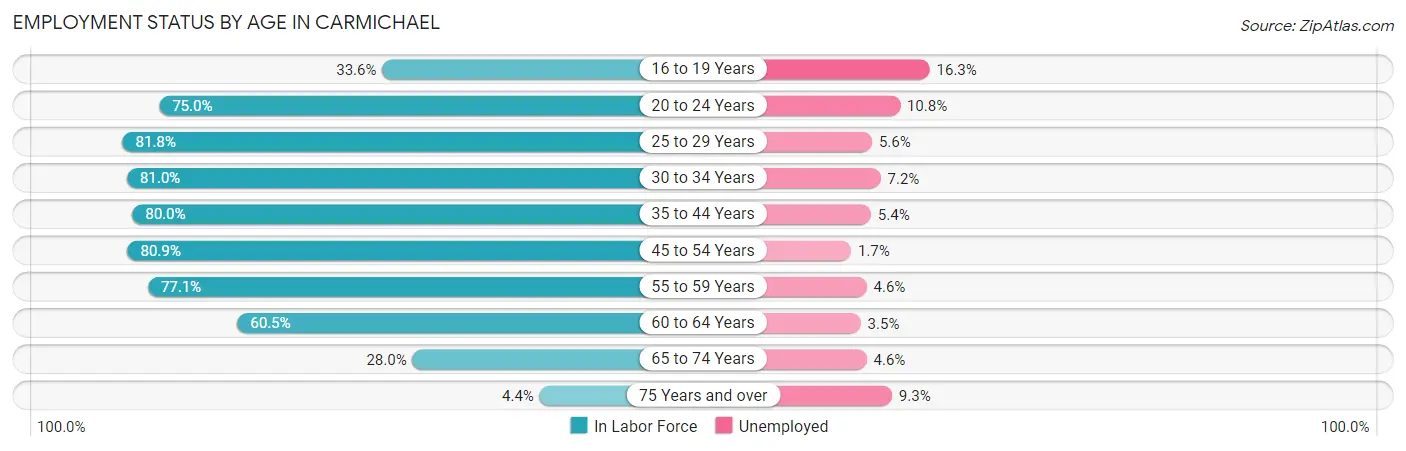
| Age Bracket | In Labor Force | Unemployed |
| 16 to 19 Years | 1,097 (33.6%) | 179 (16.3%) |
| 20 to 24 Years | 3,596 (75.0%) | 388 (10.8%) |
| 25 to 29 Years | 5,147 (81.8%) | 288 (5.6%) |
| 30 to 34 Years | 4,491 (81.0%) | 323 (7.2%) |
| 35 to 44 Years | 7,540 (80.0%) | 407 (5.4%) |
| 45 to 54 Years | 6,858 (80.9%) | 117 (1.7%) |
| 55 to 59 Years | 4,347 (77.1%) | 200 (4.6%) |
| 60 to 64 Years | 3,314 (60.5%) | 116 (3.5%) |
| 65 to 74 Years | 2,412 (28.0%) | 111 (4.6%) |
| 75 Years and over | 320 (4.4%) | 30 (9.3%) |
| Total | 39,146 (60.4%) | 2,153 (5.5%) |
Employment Status by Educational Attainment in Carmichael
According to labor force statistics for Carmichael, 77.6% of individuals (31,703) out of the total population between 25 and 64 years of age (40,854) are in the labor force, with 4.6% or 1,458 of them being unemployed. The group with the highest labor force participation rate are those with the educational attainment of bachelor's degree or higher, with 85.3% or 11,887 individuals in the labor force. Within the labor force, individuals with less than high school education have the highest percentage of unemployment, with 8.5% or 125 of them being unemployed.
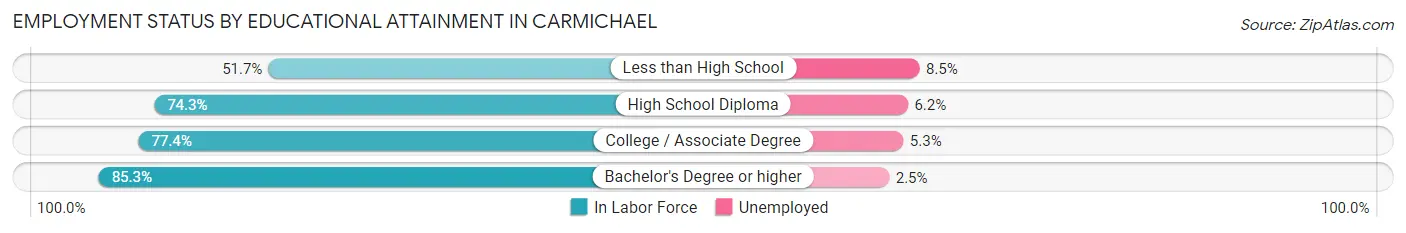
| Educational Attainment | In Labor Force | Unemployed |
| Less than High School | 1,476 (51.7%) | 243 (8.5%) |
| High School Diploma | 7,308 (74.3%) | 610 (6.2%) |
| College / Associate Degree | 11,012 (77.4%) | 754 (5.3%) |
| Bachelor's Degree or higher | 11,887 (85.3%) | 348 (2.5%) |
| Total | 31,703 (77.6%) | 1,879 (4.6%) |
Employment Occupations by Sex in Carmichael
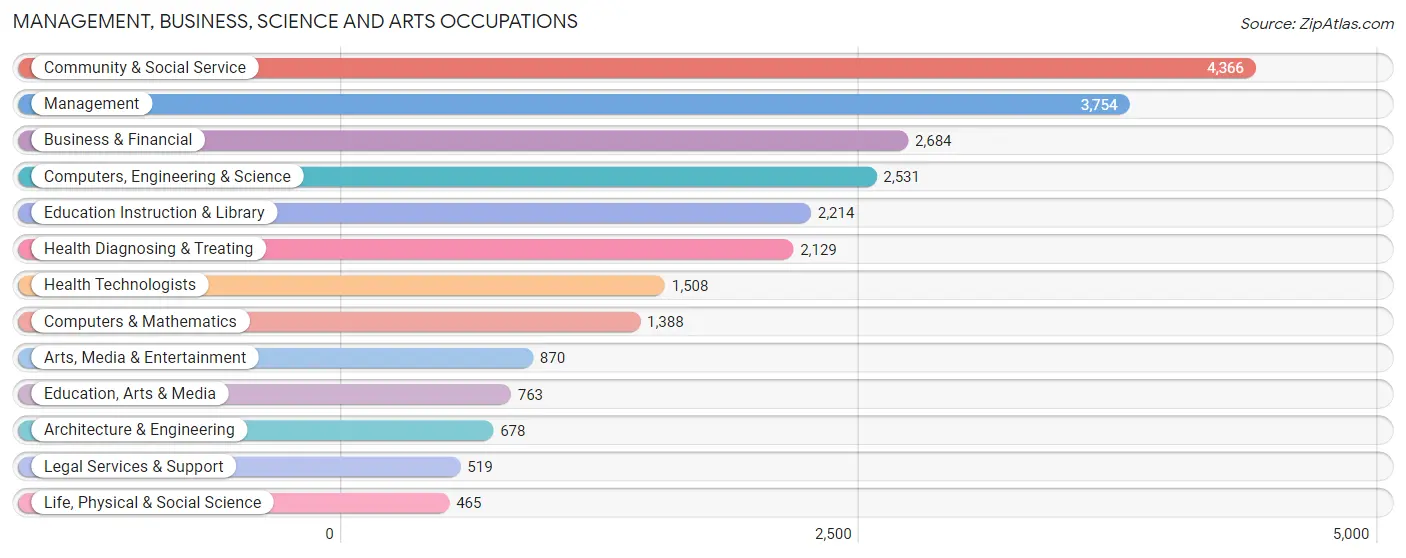
Management, Business, Science and Arts Occupations
The most common Management, Business, Science and Arts occupations in Carmichael are Community & Social Service (4,366 | 11.8%), Management (3,754 | 10.2%), Business & Financial (2,684 | 7.3%), Computers, Engineering & Science (2,531 | 6.9%), and Education Instruction & Library (2,214 | 6.0%).
Management, Business, Science and Arts Occupations by Sex
Within the Management, Business, Science and Arts occupations in Carmichael, the most male-oriented occupations are Computers & Mathematics (82.0%), Architecture & Engineering (78.8%), and Computers, Engineering & Science (74.5%), while the most female-oriented occupations are Education Instruction & Library (74.0%), Community & Social Service (65.7%), and Health Diagnosing & Treating (63.7%).
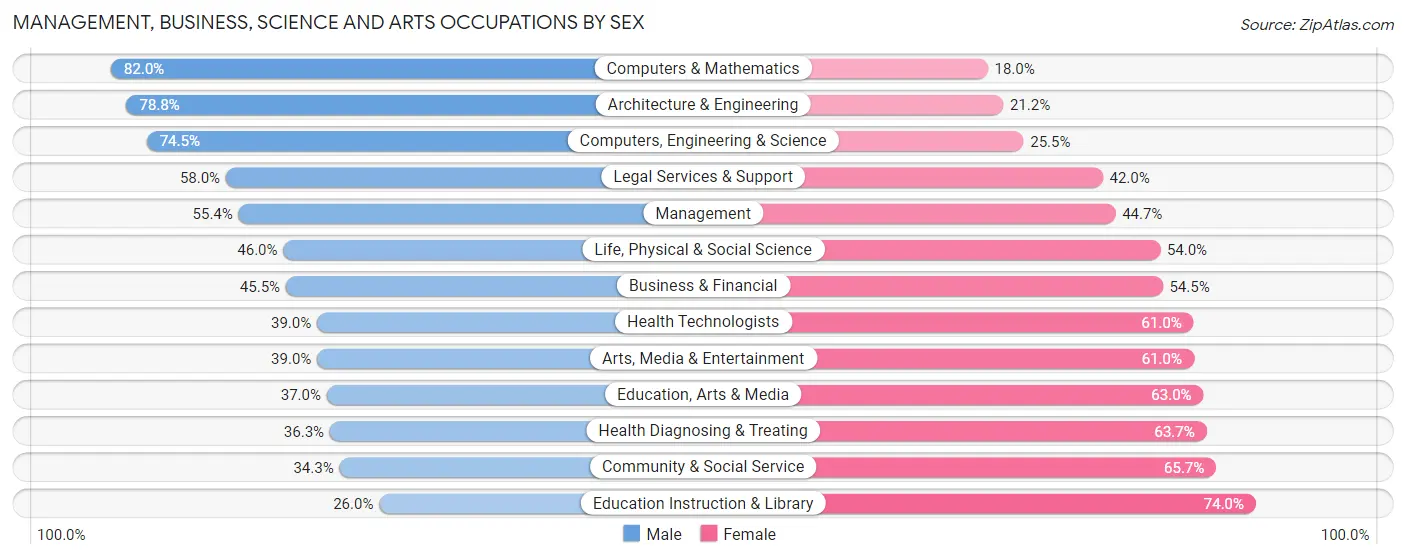
| Occupation | Male | Female |
| Management | 2,078 (55.3%) | 1,676 (44.7%) |
| Business & Financial | 1,221 (45.5%) | 1,463 (54.5%) |
| Computers, Engineering & Science | 1,886 (74.5%) | 645 (25.5%) |
| Computers & Mathematics | 1,138 (82.0%) | 250 (18.0%) |
| Architecture & Engineering | 534 (78.8%) | 144 (21.2%) |
| Life, Physical & Social Science | 214 (46.0%) | 251 (54.0%) |
| Community & Social Service | 1,498 (34.3%) | 2,868 (65.7%) |
| Education, Arts & Media | 282 (37.0%) | 481 (63.0%) |
| Legal Services & Support | 301 (58.0%) | 218 (42.0%) |
| Education Instruction & Library | 576 (26.0%) | 1,638 (74.0%) |
| Arts, Media & Entertainment | 339 (39.0%) | 531 (61.0%) |
| Health Diagnosing & Treating | 773 (36.3%) | 1,356 (63.7%) |
| Health Technologists | 588 (39.0%) | 920 (61.0%) |
| Total (Category) | 7,456 (48.2%) | 8,008 (51.8%) |
| Total (Overall) | 19,703 (53.3%) | 17,230 (46.7%) |
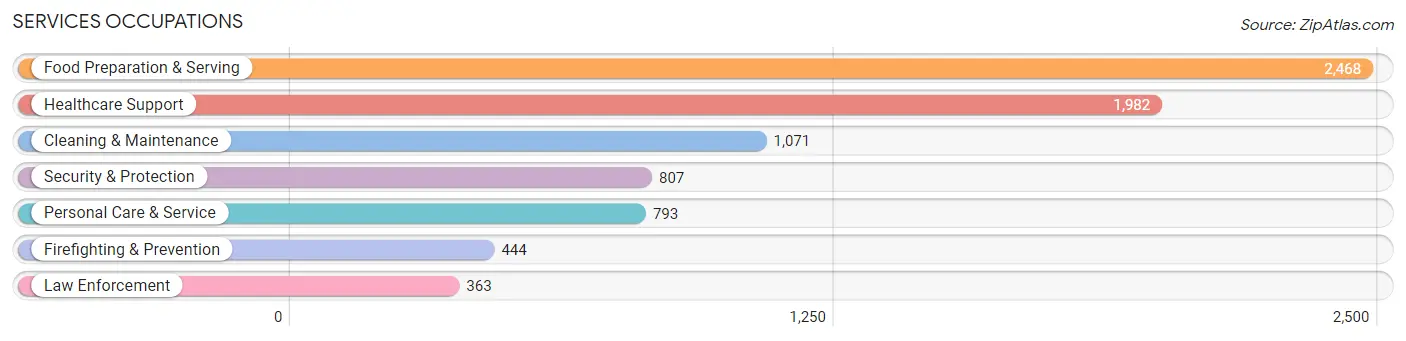
Services Occupations
The most common Services occupations in Carmichael are Food Preparation & Serving (2,468 | 6.7%), Healthcare Support (1,982 | 5.4%), Cleaning & Maintenance (1,071 | 2.9%), Security & Protection (807 | 2.2%), and Personal Care & Service (793 | 2.1%).
Services Occupations by Sex
Within the Services occupations in Carmichael, the most male-oriented occupations are Law Enforcement (89.0%), Security & Protection (88.1%), and Firefighting & Prevention (87.4%), while the most female-oriented occupations are Personal Care & Service (80.2%), Healthcare Support (77.1%), and Food Preparation & Serving (47.0%).
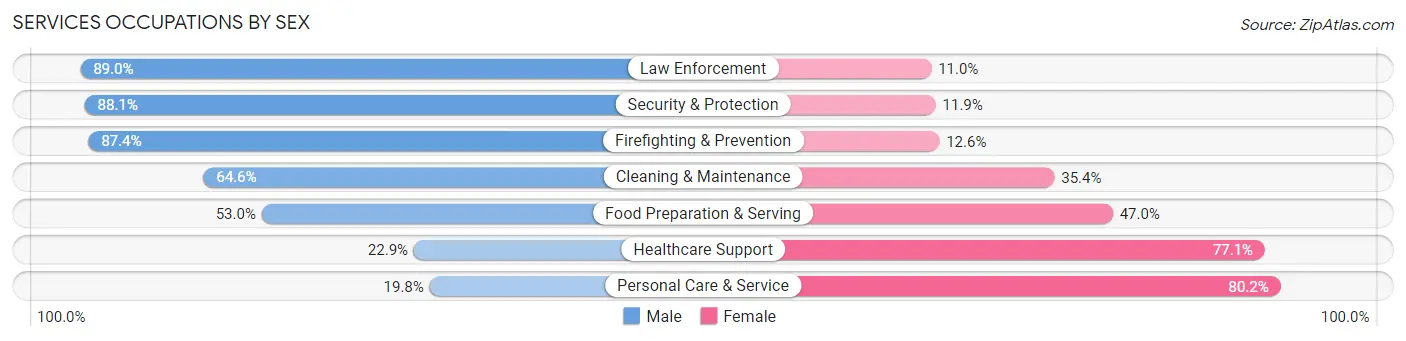
| Occupation | Male | Female |
| Healthcare Support | 454 (22.9%) | 1,528 (77.1%) |
| Security & Protection | 711 (88.1%) | 96 (11.9%) |
| Firefighting & Prevention | 388 (87.4%) | 56 (12.6%) |
| Law Enforcement | 323 (89.0%) | 40 (11.0%) |
| Food Preparation & Serving | 1,309 (53.0%) | 1,159 (47.0%) |
| Cleaning & Maintenance | 692 (64.6%) | 379 (35.4%) |
| Personal Care & Service | 157 (19.8%) | 636 (80.2%) |
| Total (Category) | 3,323 (46.7%) | 3,798 (53.3%) |
| Total (Overall) | 19,703 (53.3%) | 17,230 (46.7%) |
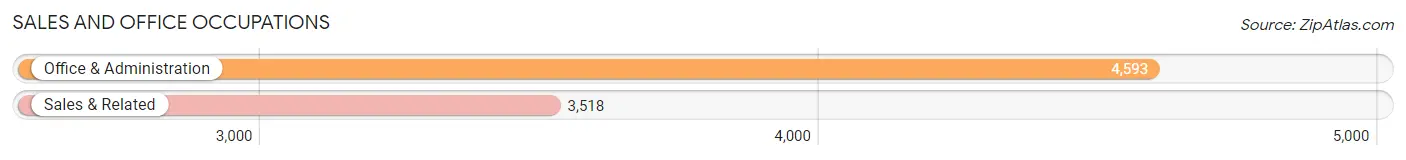
Sales and Office Occupations
The most common Sales and Office occupations in Carmichael are Office & Administration (4,593 | 12.4%), and Sales & Related (3,518 | 9.5%).
Sales and Office Occupations by Sex
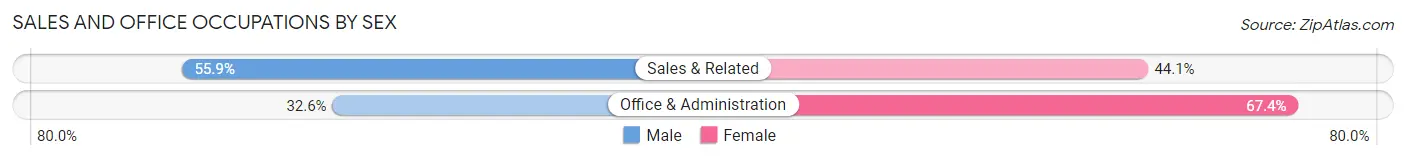
| Occupation | Male | Female |
| Sales & Related | 1,965 (55.9%) | 1,553 (44.1%) |
| Office & Administration | 1,499 (32.6%) | 3,094 (67.4%) |
| Total (Category) | 3,464 (42.7%) | 4,647 (57.3%) |
| Total (Overall) | 19,703 (53.3%) | 17,230 (46.7%) |
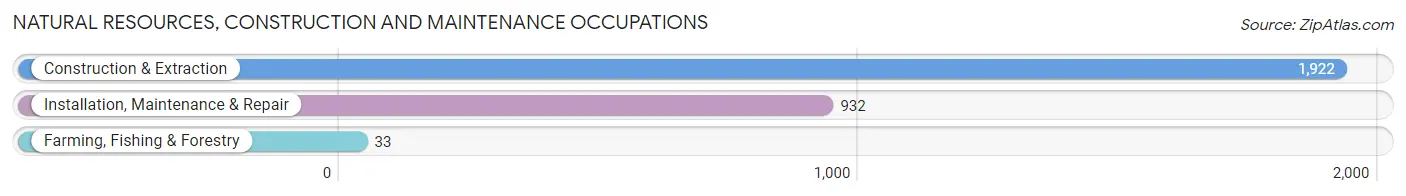
Natural Resources, Construction and Maintenance Occupations
The most common Natural Resources, Construction and Maintenance occupations in Carmichael are Construction & Extraction (1,922 | 5.2%), Installation, Maintenance & Repair (932 | 2.5%), and Farming, Fishing & Forestry (33 | 0.1%).
Natural Resources, Construction and Maintenance Occupations by Sex
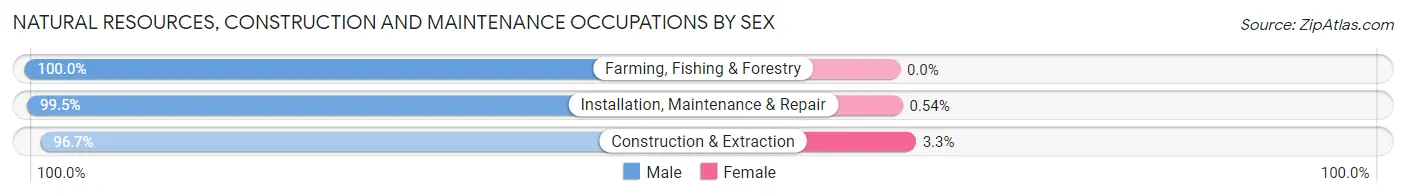
| Occupation | Male | Female |
| Farming, Fishing & Forestry | 33 (100.0%) | 0 (0.0%) |
| Construction & Extraction | 1,859 (96.7%) | 63 (3.3%) |
| Installation, Maintenance & Repair | 927 (99.5%) | 5 (0.5%) |
| Total (Category) | 2,819 (97.6%) | 68 (2.4%) |
| Total (Overall) | 19,703 (53.3%) | 17,230 (46.7%) |
Production, Transportation and Moving Occupations
The most common Production, Transportation and Moving occupations in Carmichael are Material Moving (1,122 | 3.0%), Production (1,115 | 3.0%), and Transportation (1,113 | 3.0%).
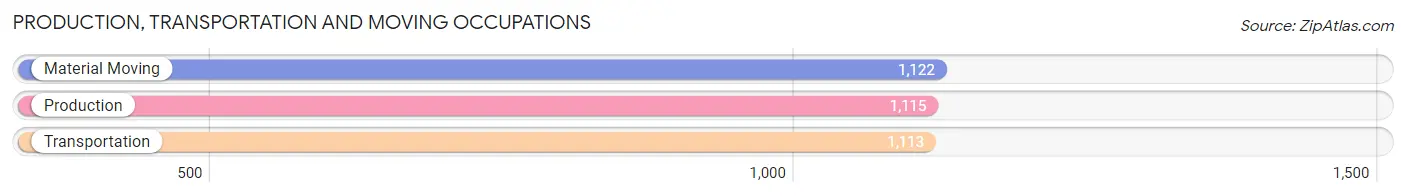
Production, Transportation and Moving Occupations by Sex
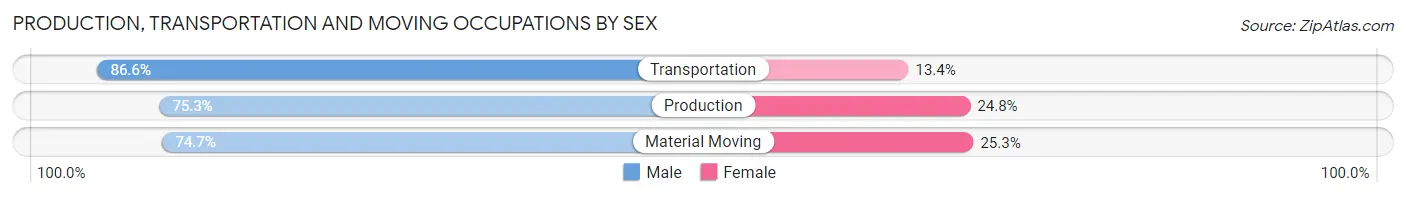
| Occupation | Male | Female |
| Production | 839 (75.2%) | 276 (24.7%) |
| Transportation | 964 (86.6%) | 149 (13.4%) |
| Material Moving | 838 (74.7%) | 284 (25.3%) |
| Total (Category) | 2,641 (78.8%) | 709 (21.2%) |
| Total (Overall) | 19,703 (53.3%) | 17,230 (46.7%) |
Employment Industries by Sex in Carmichael
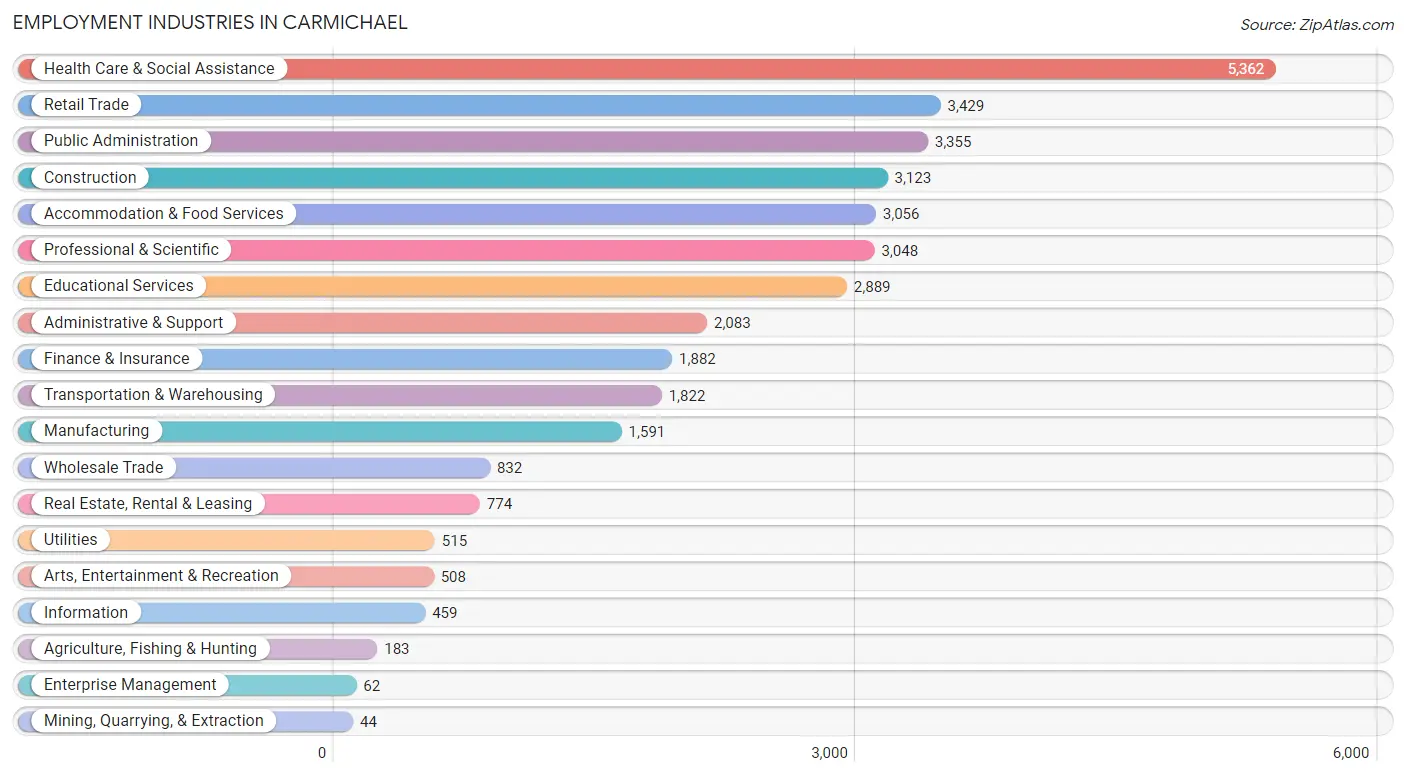
Employment Industries in Carmichael
The major employment industries in Carmichael include Health Care & Social Assistance (5,362 | 14.5%), Retail Trade (3,429 | 9.3%), Public Administration (3,355 | 9.1%), Construction (3,123 | 8.5%), and Accommodation & Food Services (3,056 | 8.3%).
Employment Industries by Sex in Carmichael
The Carmichael industries that see more men than women are Mining, Quarrying, & Extraction (100.0%), Agriculture, Fishing & Hunting (95.6%), and Construction (87.4%), whereas the industries that tend to have a higher number of women are Health Care & Social Assistance (73.3%), Educational Services (65.5%), and Finance & Insurance (58.0%).
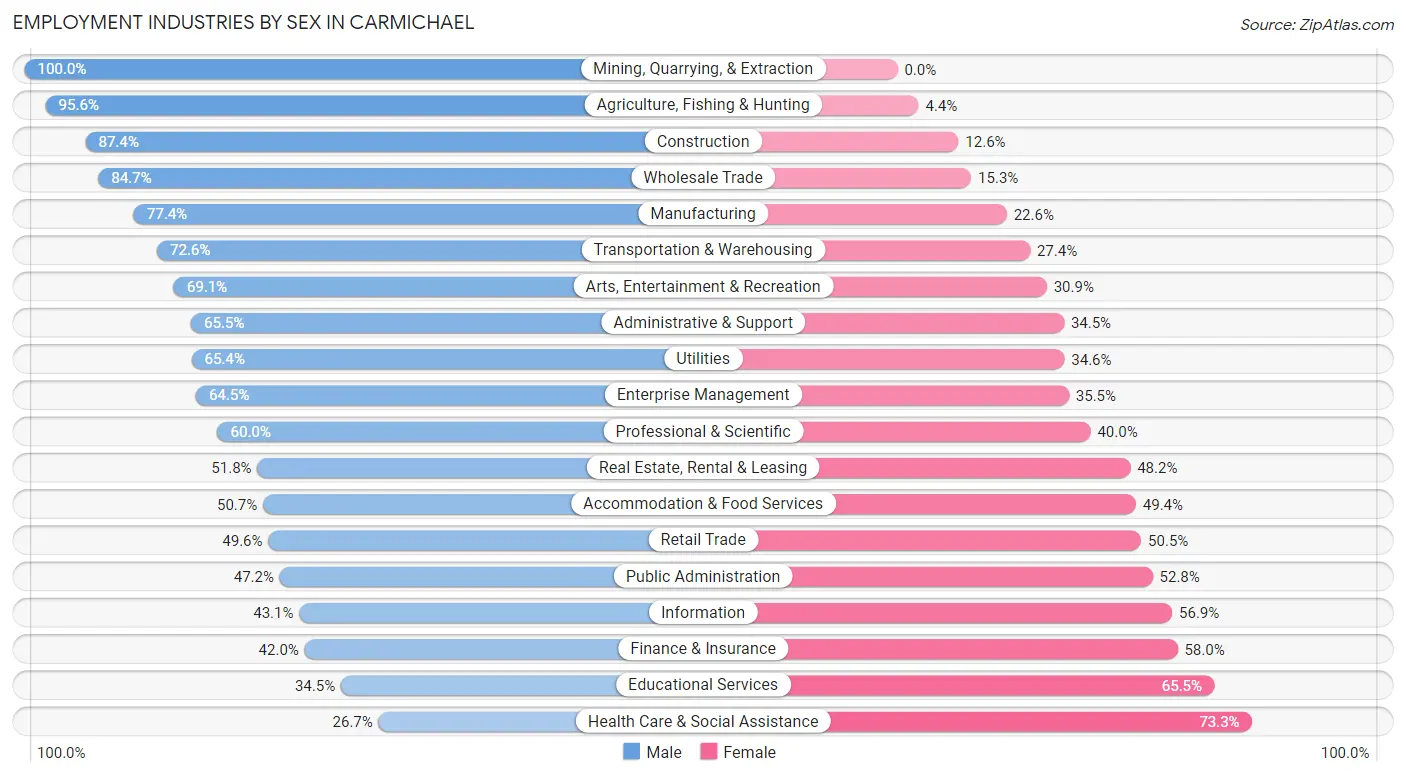
| Industry | Male | Female |
| Agriculture, Fishing & Hunting | 175 (95.6%) | 8 (4.4%) |
| Mining, Quarrying, & Extraction | 44 (100.0%) | 0 (0.0%) |
| Construction | 2,729 (87.4%) | 394 (12.6%) |
| Manufacturing | 1,231 (77.4%) | 360 (22.6%) |
| Wholesale Trade | 705 (84.7%) | 127 (15.3%) |
| Retail Trade | 1,699 (49.5%) | 1,730 (50.4%) |
| Transportation & Warehousing | 1,322 (72.6%) | 500 (27.4%) |
| Utilities | 337 (65.4%) | 178 (34.6%) |
| Information | 198 (43.1%) | 261 (56.9%) |
| Finance & Insurance | 791 (42.0%) | 1,091 (58.0%) |
| Real Estate, Rental & Leasing | 401 (51.8%) | 373 (48.2%) |
| Professional & Scientific | 1,830 (60.0%) | 1,218 (40.0%) |
| Enterprise Management | 40 (64.5%) | 22 (35.5%) |
| Administrative & Support | 1,365 (65.5%) | 718 (34.5%) |
| Educational Services | 997 (34.5%) | 1,892 (65.5%) |
| Health Care & Social Assistance | 1,433 (26.7%) | 3,929 (73.3%) |
| Arts, Entertainment & Recreation | 351 (69.1%) | 157 (30.9%) |
| Accommodation & Food Services | 1,548 (50.6%) | 1,508 (49.3%) |
| Public Administration | 1,583 (47.2%) | 1,772 (52.8%) |
| Total | 19,703 (53.3%) | 17,230 (46.7%) |
Education in Carmichael
School Enrollment in Carmichael
The most common levels of schooling among the 16,378 students in Carmichael are college / undergraduate (4,487 | 27.4%), high school (3,929 | 24.0%), and middle school (3,136 | 19.2%).
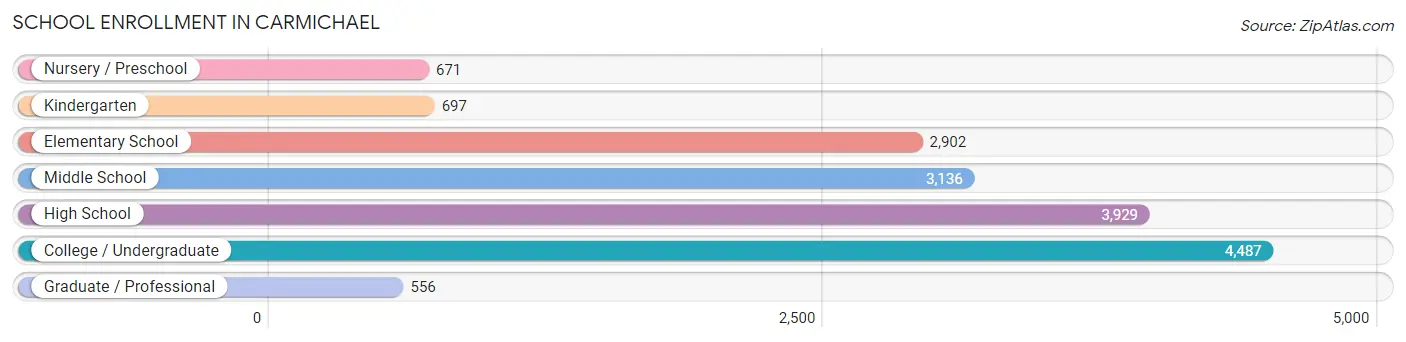
| School Level | # Students | % Students |
| Nursery / Preschool | 671 | 4.1% |
| Kindergarten | 697 | 4.3% |
| Elementary School | 2,902 | 17.7% |
| Middle School | 3,136 | 19.2% |
| High School | 3,929 | 24.0% |
| College / Undergraduate | 4,487 | 27.4% |
| Graduate / Professional | 556 | 3.4% |
| Total | 16,378 | 100.0% |
School Enrollment by Age by Funding Source in Carmichael
Out of a total of 16,378 students who are enrolled in schools in Carmichael, 2,408 (14.7%) attend a private institution, while the remaining 13,970 (85.3%) are enrolled in public schools. The age group of 3 to 4 year olds has the highest likelihood of being enrolled in private schools, with 220 (41.3% in the age bracket) enrolled. Conversely, the age group of 18 to 19 year olds has the lowest likelihood of being enrolled in a private school, with 1,022 (98.4% in the age bracket) attending a public institution.
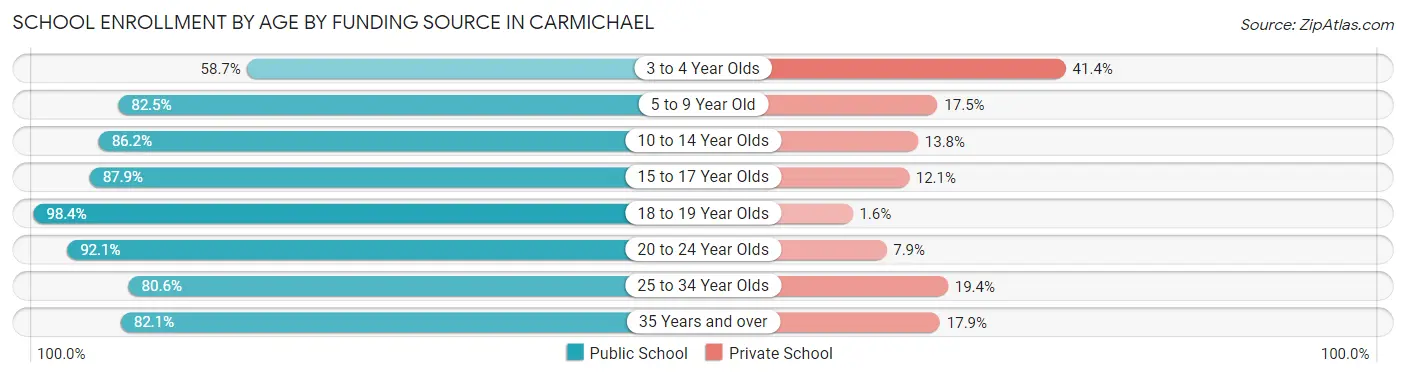
| Age Bracket | Public School | Private School |
| 3 to 4 Year Olds | 312 (58.7%) | 220 (41.3%) |
| 5 to 9 Year Old | 2,752 (82.5%) | 582 (17.5%) |
| 10 to 14 Year Olds | 3,672 (86.2%) | 589 (13.8%) |
| 15 to 17 Year Olds | 2,397 (87.9%) | 331 (12.1%) |
| 18 to 19 Year Olds | 1,022 (98.4%) | 17 (1.6%) |
| 20 to 24 Year Olds | 1,508 (92.1%) | 130 (7.9%) |
| 25 to 34 Year Olds | 1,210 (80.6%) | 291 (19.4%) |
| 35 Years and over | 1,104 (82.1%) | 241 (17.9%) |
| Total | 13,970 (85.3%) | 2,408 (14.7%) |
Educational Attainment by Field of Study in Carmichael
Business (3,551 | 16.6%), social sciences (2,432 | 11.4%), bio, nature & agricultural (1,890 | 8.8%), science & technology (1,736 | 8.1%), and arts & humanities (1,683 | 7.9%) are the most common fields of study among 21,429 individuals in Carmichael who have obtained a bachelor's degree or higher.
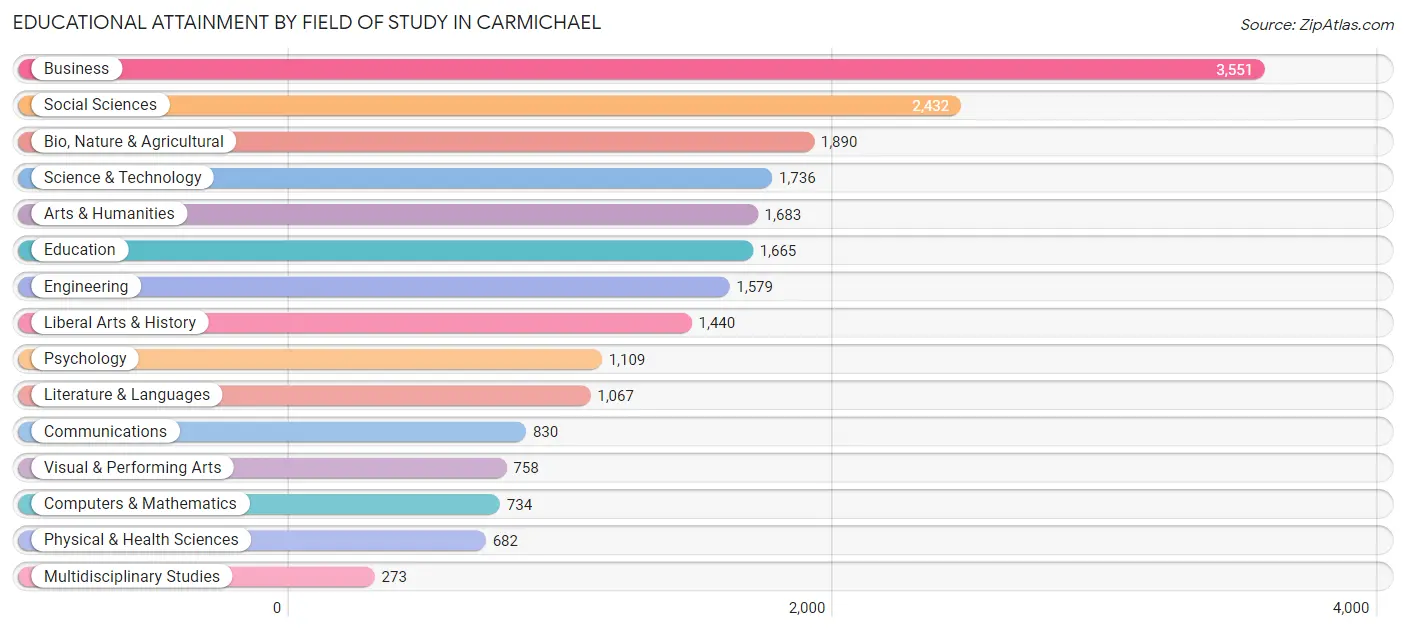
| Field of Study | # Graduates | % Graduates |
| Computers & Mathematics | 734 | 3.4% |
| Bio, Nature & Agricultural | 1,890 | 8.8% |
| Physical & Health Sciences | 682 | 3.2% |
| Psychology | 1,109 | 5.2% |
| Social Sciences | 2,432 | 11.4% |
| Engineering | 1,579 | 7.4% |
| Multidisciplinary Studies | 273 | 1.3% |
| Science & Technology | 1,736 | 8.1% |
| Business | 3,551 | 16.6% |
| Education | 1,665 | 7.8% |
| Literature & Languages | 1,067 | 5.0% |
| Liberal Arts & History | 1,440 | 6.7% |
| Visual & Performing Arts | 758 | 3.5% |
| Communications | 830 | 3.9% |
| Arts & Humanities | 1,683 | 7.9% |
| Total | 21,429 | 100.0% |
Transportation & Commute in Carmichael
Vehicle Availability by Sex in Carmichael
The most prevalent vehicle ownership categories in Carmichael are males with 2 vehicles (8,540, accounting for 44.3%) and females with 2 vehicles (6,681, making up 51.5%).
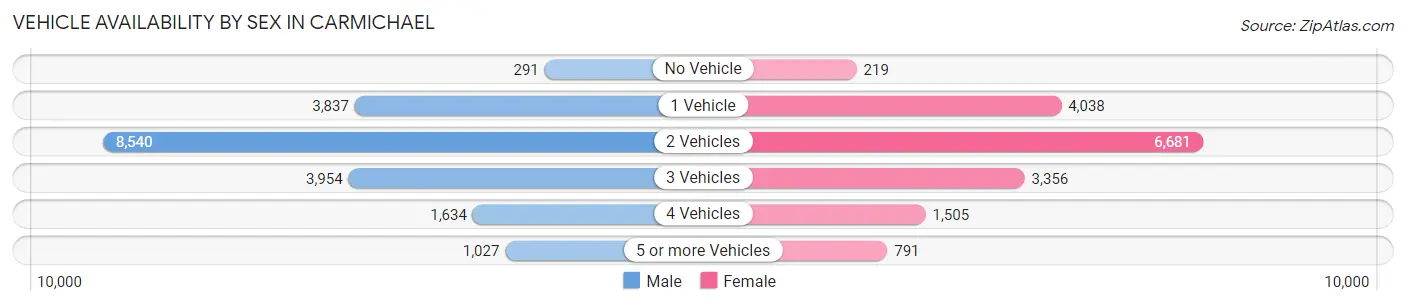
| Vehicles Available | Male | Female |
| No Vehicle | 291 (1.5%) | 219 (1.3%) |
| 1 Vehicle | 3,837 (19.9%) | 4,038 (24.3%) |
| 2 Vehicles | 8,540 (44.3%) | 6,681 (40.3%) |
| 3 Vehicles | 3,954 (20.5%) | 3,356 (20.2%) |
| 4 Vehicles | 1,634 (8.5%) | 1,505 (9.1%) |
| 5 or more Vehicles | 1,027 (5.3%) | 791 (4.8%) |
| Total | 19,283 (100.0%) | 16,590 (100.0%) |
Commute Time in Carmichael
The most frequently occuring commute durations in Carmichael are 20 to 24 minutes (6,374 commuters, 21.5%), 30 to 34 minutes (5,386 commuters, 18.2%), and 15 to 19 minutes (4,460 commuters, 15.0%).
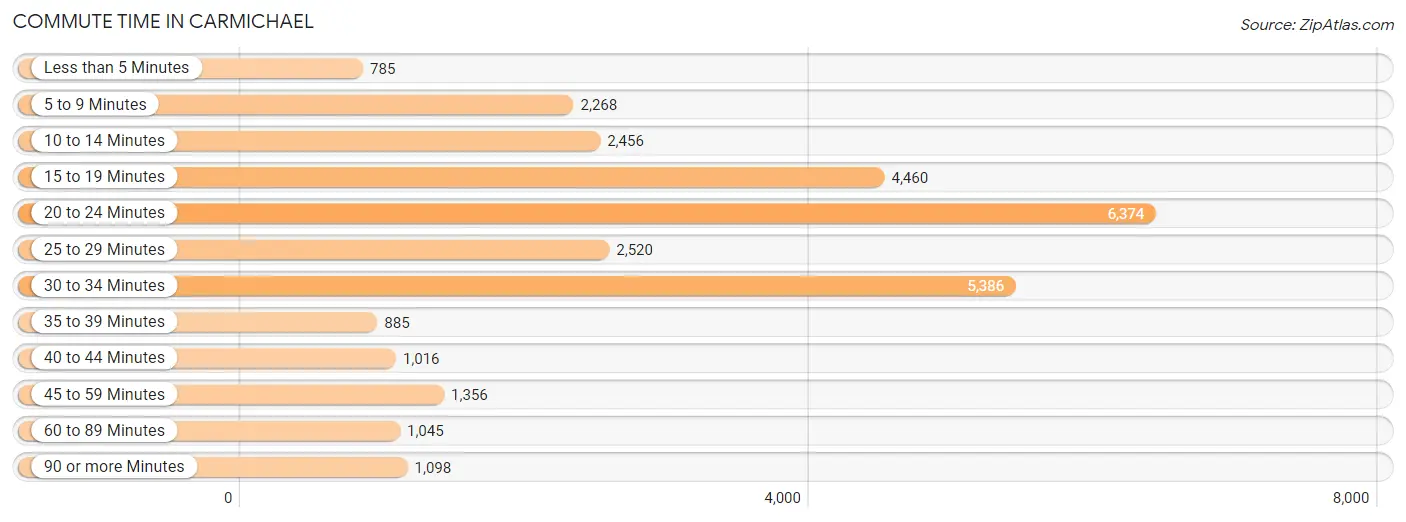
| Commute Time | # Commuters | % Commuters |
| Less than 5 Minutes | 785 | 2.6% |
| 5 to 9 Minutes | 2,268 | 7.6% |
| 10 to 14 Minutes | 2,456 | 8.3% |
| 15 to 19 Minutes | 4,460 | 15.0% |
| 20 to 24 Minutes | 6,374 | 21.5% |
| 25 to 29 Minutes | 2,520 | 8.5% |
| 30 to 34 Minutes | 5,386 | 18.2% |
| 35 to 39 Minutes | 885 | 3.0% |
| 40 to 44 Minutes | 1,016 | 3.4% |
| 45 to 59 Minutes | 1,356 | 4.6% |
| 60 to 89 Minutes | 1,045 | 3.5% |
| 90 or more Minutes | 1,098 | 3.7% |
Commute Time by Sex in Carmichael
The most common commute times in Carmichael are 20 to 24 minutes (3,622 commuters, 22.0%) for males and 20 to 24 minutes (2,752 commuters, 20.8%) for females.
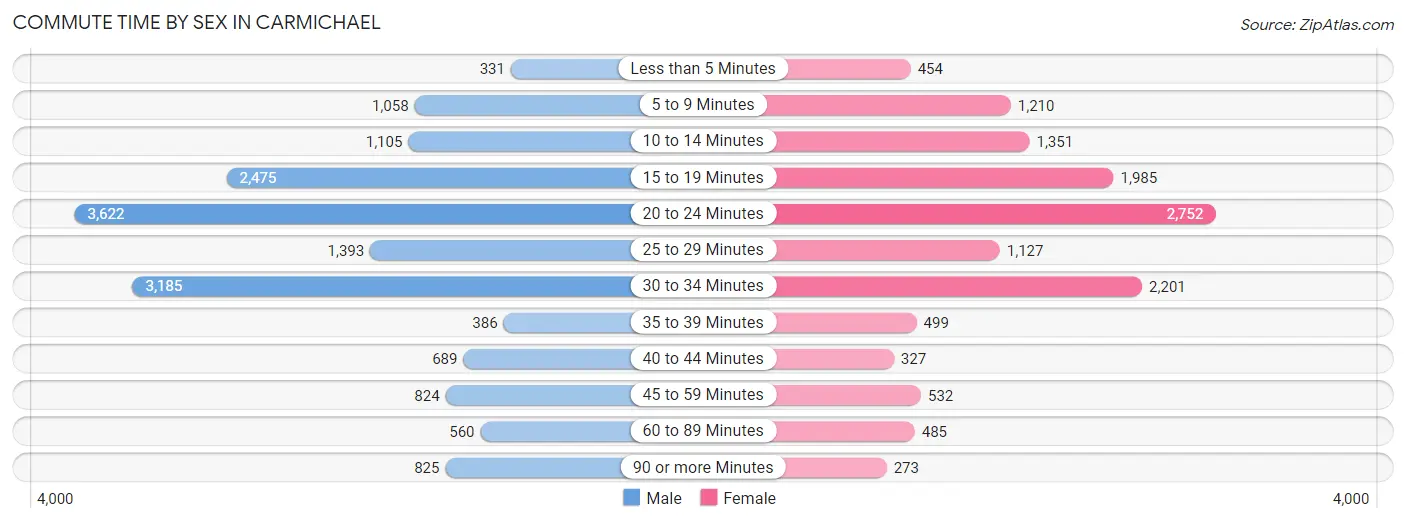
| Commute Time | Male | Female |
| Less than 5 Minutes | 331 (2.0%) | 454 (3.4%) |
| 5 to 9 Minutes | 1,058 (6.4%) | 1,210 (9.2%) |
| 10 to 14 Minutes | 1,105 (6.7%) | 1,351 (10.2%) |
| 15 to 19 Minutes | 2,475 (15.0%) | 1,985 (15.0%) |
| 20 to 24 Minutes | 3,622 (22.0%) | 2,752 (20.8%) |
| 25 to 29 Minutes | 1,393 (8.5%) | 1,127 (8.5%) |
| 30 to 34 Minutes | 3,185 (19.4%) | 2,201 (16.7%) |
| 35 to 39 Minutes | 386 (2.4%) | 499 (3.8%) |
| 40 to 44 Minutes | 689 (4.2%) | 327 (2.5%) |
| 45 to 59 Minutes | 824 (5.0%) | 532 (4.0%) |
| 60 to 89 Minutes | 560 (3.4%) | 485 (3.7%) |
| 90 or more Minutes | 825 (5.0%) | 273 (2.1%) |
Time of Departure to Work by Sex in Carmichael
The most frequent times of departure to work in Carmichael are 7:00 AM to 7:29 AM (2,309, 14.0%) for males and 7:30 AM to 7:59 AM (2,265, 17.2%) for females.
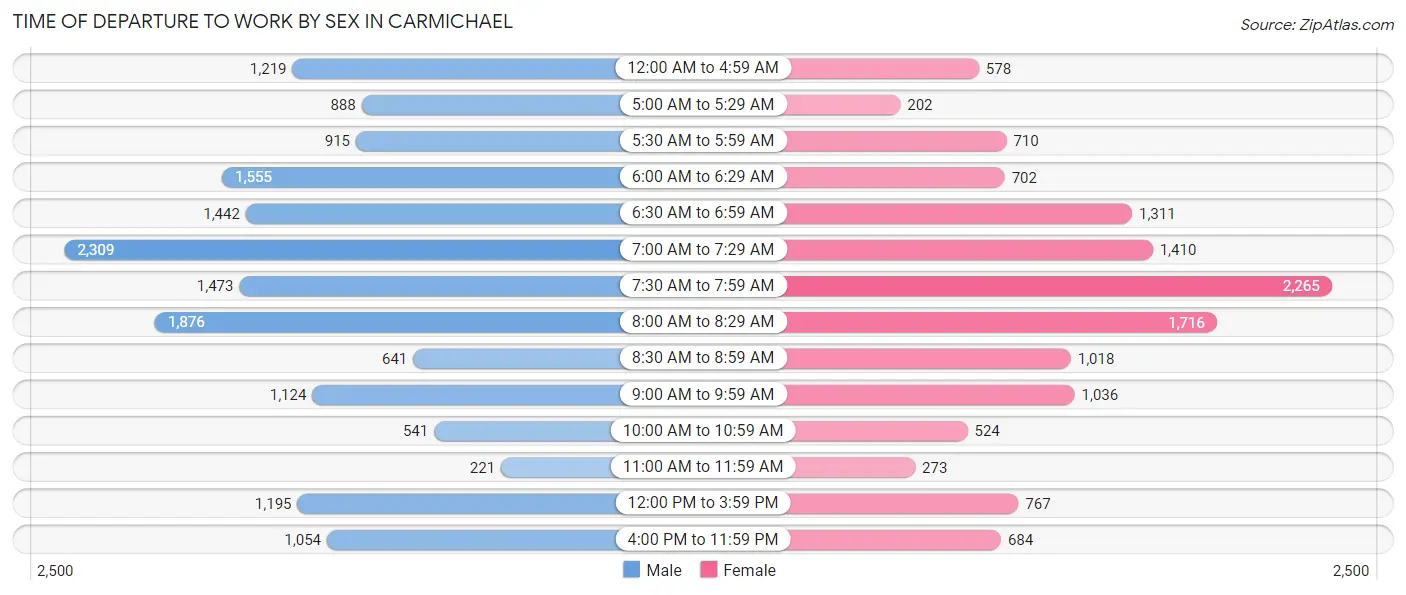
| Time of Departure | Male | Female |
| 12:00 AM to 4:59 AM | 1,219 (7.4%) | 578 (4.4%) |
| 5:00 AM to 5:29 AM | 888 (5.4%) | 202 (1.5%) |
| 5:30 AM to 5:59 AM | 915 (5.6%) | 710 (5.4%) |
| 6:00 AM to 6:29 AM | 1,555 (9.5%) | 702 (5.3%) |
| 6:30 AM to 6:59 AM | 1,442 (8.8%) | 1,311 (9.9%) |
| 7:00 AM to 7:29 AM | 2,309 (14.0%) | 1,410 (10.7%) |
| 7:30 AM to 7:59 AM | 1,473 (8.9%) | 2,265 (17.2%) |
| 8:00 AM to 8:29 AM | 1,876 (11.4%) | 1,716 (13.0%) |
| 8:30 AM to 8:59 AM | 641 (3.9%) | 1,018 (7.7%) |
| 9:00 AM to 9:59 AM | 1,124 (6.8%) | 1,036 (7.9%) |
| 10:00 AM to 10:59 AM | 541 (3.3%) | 524 (4.0%) |
| 11:00 AM to 11:59 AM | 221 (1.3%) | 273 (2.1%) |
| 12:00 PM to 3:59 PM | 1,195 (7.3%) | 767 (5.8%) |
| 4:00 PM to 11:59 PM | 1,054 (6.4%) | 684 (5.2%) |
| Total | 16,453 (100.0%) | 13,196 (100.0%) |
Housing Occupancy in Carmichael
Occupancy by Ownership in Carmichael
Of the total 31,528 dwellings in Carmichael, owner-occupied units account for 16,720 (53.0%), while renter-occupied units make up 14,808 (47.0%).
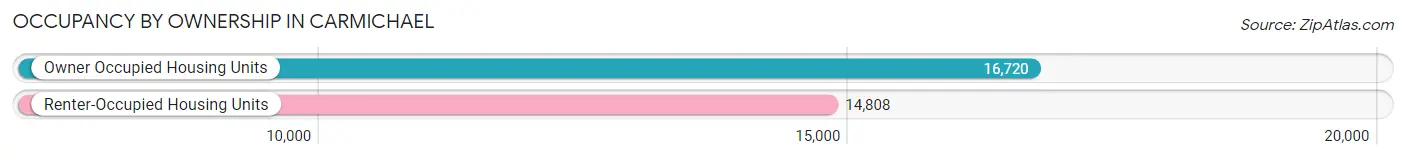
| Occupancy | # Housing Units | % Housing Units |
| Owner Occupied Housing Units | 16,720 | 53.0% |
| Renter-Occupied Housing Units | 14,808 | 47.0% |
| Total Occupied Housing Units | 31,528 | 100.0% |
Occupancy by Household Size in Carmichael
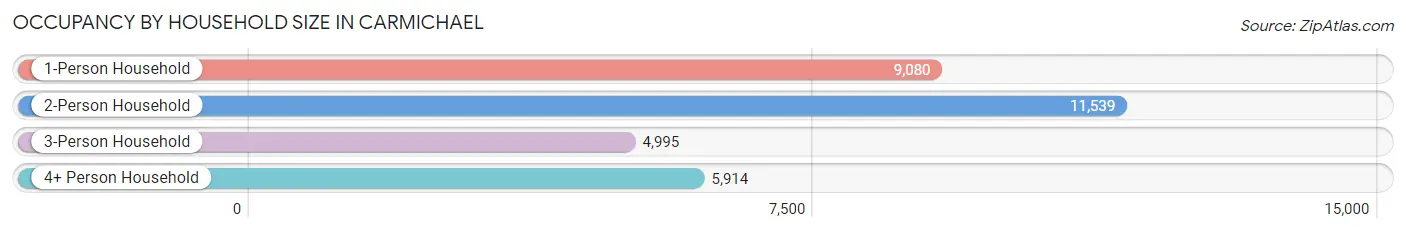
| Household Size | # Housing Units | % Housing Units |
| 1-Person Household | 9,080 | 28.8% |
| 2-Person Household | 11,539 | 36.6% |
| 3-Person Household | 4,995 | 15.8% |
| 4+ Person Household | 5,914 | 18.8% |
| Total Housing Units | 31,528 | 100.0% |
Occupancy by Ownership by Household Size in Carmichael
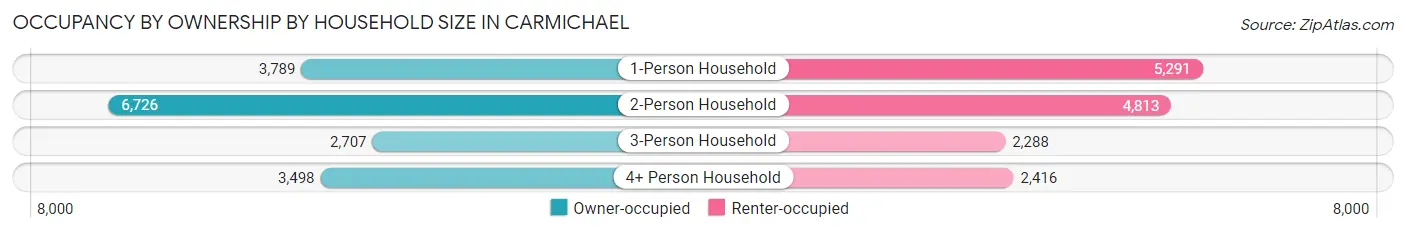
| Household Size | Owner-occupied | Renter-occupied |
| 1-Person Household | 3,789 (41.7%) | 5,291 (58.3%) |
| 2-Person Household | 6,726 (58.3%) | 4,813 (41.7%) |
| 3-Person Household | 2,707 (54.2%) | 2,288 (45.8%) |
| 4+ Person Household | 3,498 (59.2%) | 2,416 (40.8%) |
| Total Housing Units | 16,720 (53.0%) | 14,808 (47.0%) |
Occupancy by Educational Attainment in Carmichael
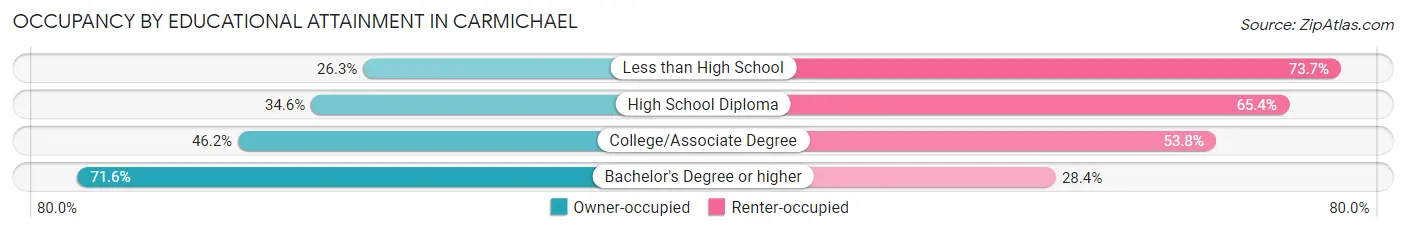
| Household Size | Owner-occupied | Renter-occupied |
| Less than High School | 369 (26.3%) | 1,034 (73.7%) |
| High School Diploma | 2,107 (34.6%) | 3,987 (65.4%) |
| College/Associate Degree | 5,386 (46.2%) | 6,281 (53.8%) |
| Bachelor's Degree or higher | 8,858 (71.6%) | 3,506 (28.4%) |
Occupancy by Age of Householder in Carmichael
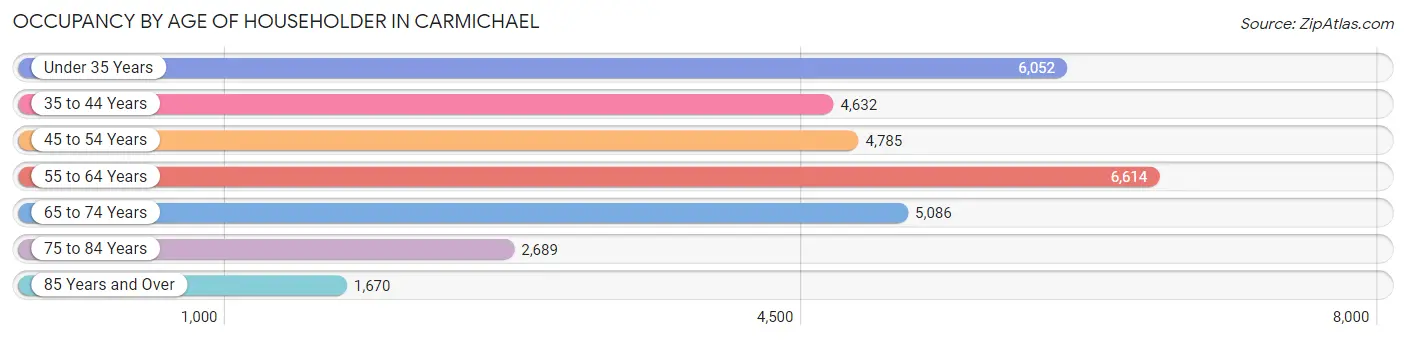
| Age Bracket | # Households | % Households |
| Under 35 Years | 6,052 | 19.2% |
| 35 to 44 Years | 4,632 | 14.7% |
| 45 to 54 Years | 4,785 | 15.2% |
| 55 to 64 Years | 6,614 | 21.0% |
| 65 to 74 Years | 5,086 | 16.1% |
| 75 to 84 Years | 2,689 | 8.5% |
| 85 Years and Over | 1,670 | 5.3% |
| Total | 31,528 | 100.0% |
Housing Finances in Carmichael
Median Income by Occupancy in Carmichael
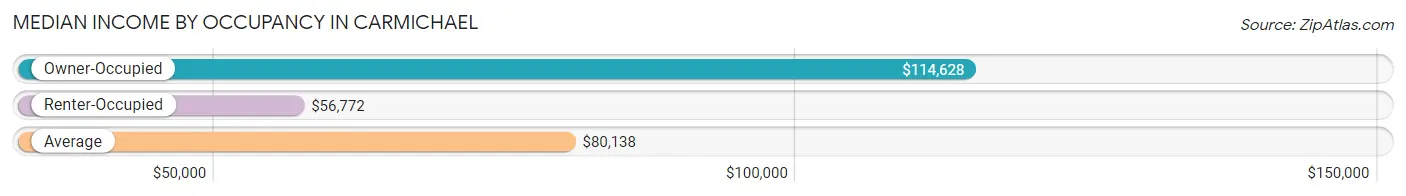
| Occupancy Type | # Households | Median Income |
| Owner-Occupied | 16,720 (53.0%) | $114,628 |
| Renter-Occupied | 14,808 (47.0%) | $56,772 |
| Average | 31,528 (100.0%) | $80,138 |
Occupancy by Householder Income Bracket in Carmichael
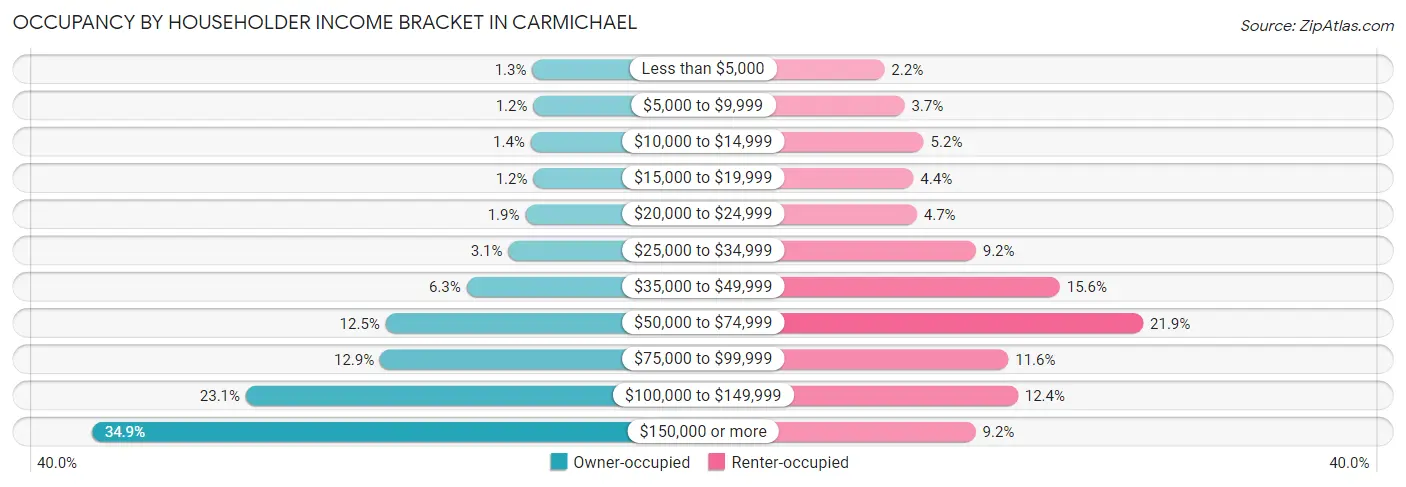
| Income Bracket | Owner-occupied | Renter-occupied |
| Less than $5,000 | 221 (1.3%) | 326 (2.2%) |
| $5,000 to $9,999 | 208 (1.2%) | 553 (3.7%) |
| $10,000 to $14,999 | 241 (1.4%) | 769 (5.2%) |
| $15,000 to $19,999 | 208 (1.2%) | 653 (4.4%) |
| $20,000 to $24,999 | 309 (1.8%) | 692 (4.7%) |
| $25,000 to $34,999 | 525 (3.1%) | 1,357 (9.2%) |
| $35,000 to $49,999 | 1,058 (6.3%) | 2,304 (15.6%) |
| $50,000 to $74,999 | 2,088 (12.5%) | 3,245 (21.9%) |
| $75,000 to $99,999 | 2,161 (12.9%) | 1,723 (11.6%) |
| $100,000 to $149,999 | 3,869 (23.1%) | 1,831 (12.4%) |
| $150,000 or more | 5,832 (34.9%) | 1,355 (9.1%) |
| Total | 16,720 (100.0%) | 14,808 (100.0%) |
Monthly Housing Cost Tiers in Carmichael
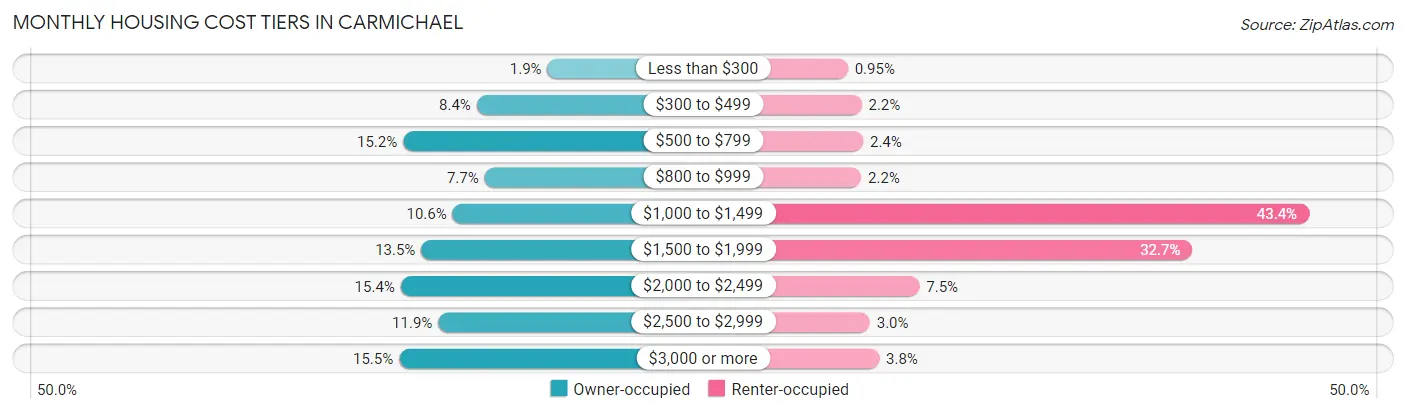
| Monthly Cost | Owner-occupied | Renter-occupied |
| Less than $300 | 312 (1.9%) | 140 (0.9%) |
| $300 to $499 | 1,401 (8.4%) | 329 (2.2%) |
| $500 to $799 | 2,535 (15.2%) | 349 (2.4%) |
| $800 to $999 | 1,280 (7.7%) | 323 (2.2%) |
| $1,000 to $1,499 | 1,773 (10.6%) | 6,427 (43.4%) |
| $1,500 to $1,999 | 2,256 (13.5%) | 4,837 (32.7%) |
| $2,000 to $2,499 | 2,572 (15.4%) | 1,116 (7.5%) |
| $2,500 to $2,999 | 1,994 (11.9%) | 442 (3.0%) |
| $3,000 or more | 2,597 (15.5%) | 569 (3.8%) |
| Total | 16,720 (100.0%) | 14,808 (100.0%) |
Physical Housing Characteristics in Carmichael
Housing Structures in Carmichael
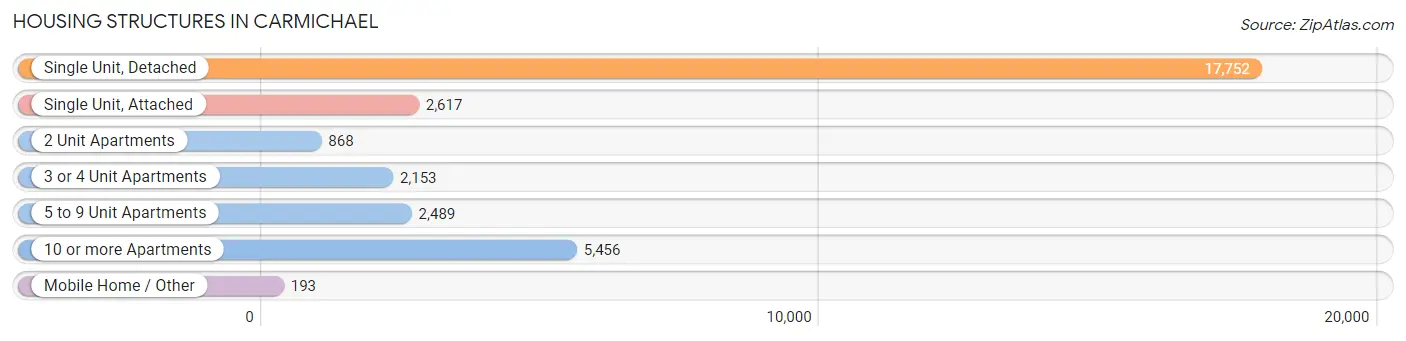
| Structure Type | # Housing Units | % Housing Units |
| Single Unit, Detached | 17,752 | 56.3% |
| Single Unit, Attached | 2,617 | 8.3% |
| 2 Unit Apartments | 868 | 2.8% |
| 3 or 4 Unit Apartments | 2,153 | 6.8% |
| 5 to 9 Unit Apartments | 2,489 | 7.9% |
| 10 or more Apartments | 5,456 | 17.3% |
| Mobile Home / Other | 193 | 0.6% |
| Total | 31,528 | 100.0% |
Housing Structures by Occupancy in Carmichael
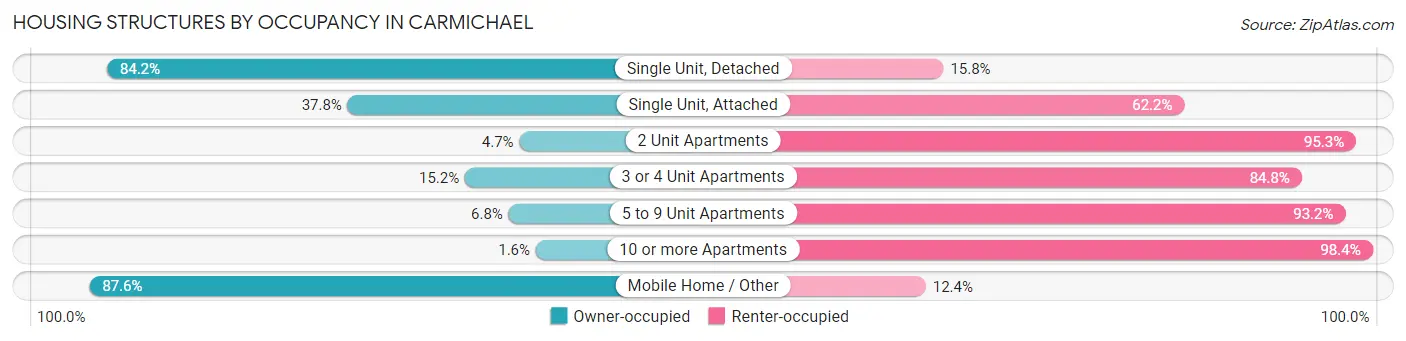
| Structure Type | Owner-occupied | Renter-occupied |
| Single Unit, Detached | 14,940 (84.2%) | 2,812 (15.8%) |
| Single Unit, Attached | 989 (37.8%) | 1,628 (62.2%) |
| 2 Unit Apartments | 41 (4.7%) | 827 (95.3%) |
| 3 or 4 Unit Apartments | 327 (15.2%) | 1,826 (84.8%) |
| 5 to 9 Unit Apartments | 169 (6.8%) | 2,320 (93.2%) |
| 10 or more Apartments | 85 (1.6%) | 5,371 (98.4%) |
| Mobile Home / Other | 169 (87.6%) | 24 (12.4%) |
| Total | 16,720 (53.0%) | 14,808 (47.0%) |
Housing Structures by Number of Rooms in Carmichael
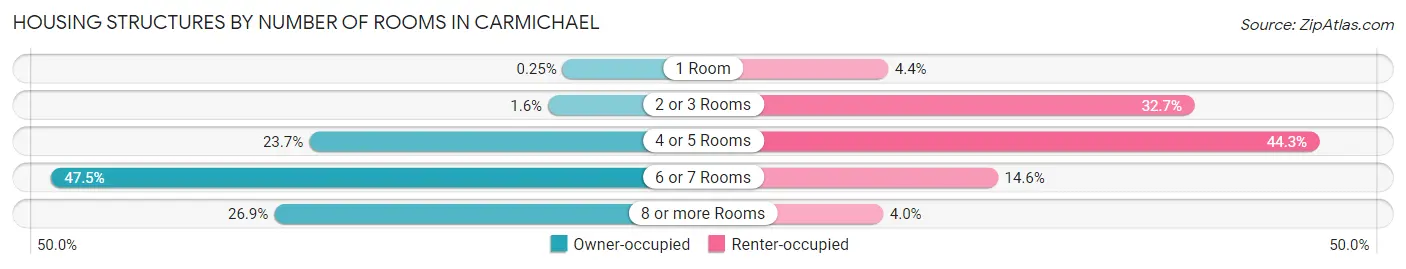
| Number of Rooms | Owner-occupied | Renter-occupied |
| 1 Room | 41 (0.3%) | 656 (4.4%) |
| 2 or 3 Rooms | 268 (1.6%) | 4,845 (32.7%) |
| 4 or 5 Rooms | 3,963 (23.7%) | 6,560 (44.3%) |
| 6 or 7 Rooms | 7,946 (47.5%) | 2,159 (14.6%) |
| 8 or more Rooms | 4,502 (26.9%) | 588 (4.0%) |
| Total | 16,720 (100.0%) | 14,808 (100.0%) |
Housing Structure by Heating Type in Carmichael
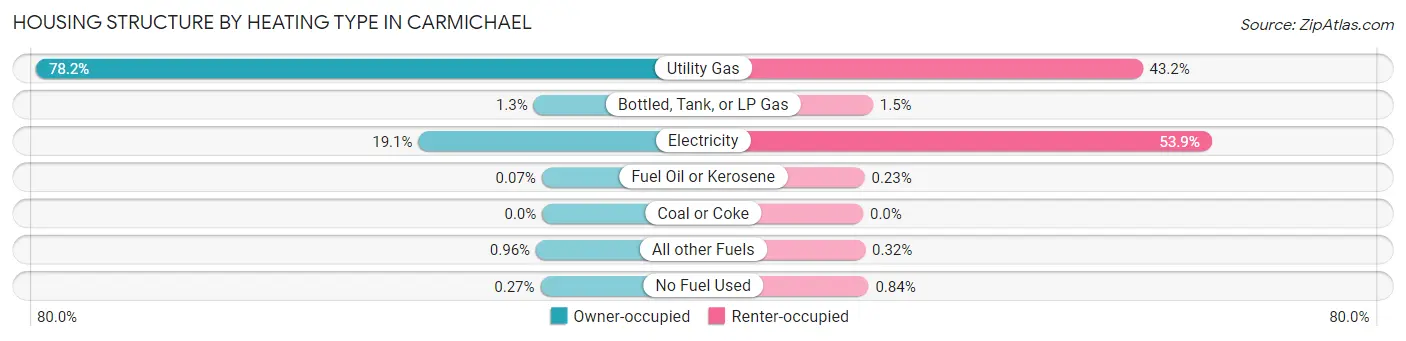
| Heating Type | Owner-occupied | Renter-occupied |
| Utility Gas | 13,082 (78.2%) | 6,399 (43.2%) |
| Bottled, Tank, or LP Gas | 221 (1.3%) | 225 (1.5%) |
| Electricity | 3,201 (19.1%) | 7,978 (53.9%) |
| Fuel Oil or Kerosene | 11 (0.1%) | 34 (0.2%) |
| Coal or Coke | 0 (0.0%) | 0 (0.0%) |
| All other Fuels | 160 (1.0%) | 47 (0.3%) |
| No Fuel Used | 45 (0.3%) | 125 (0.8%) |
| Total | 16,720 (100.0%) | 14,808 (100.0%) |
Household Vehicle Usage in Carmichael
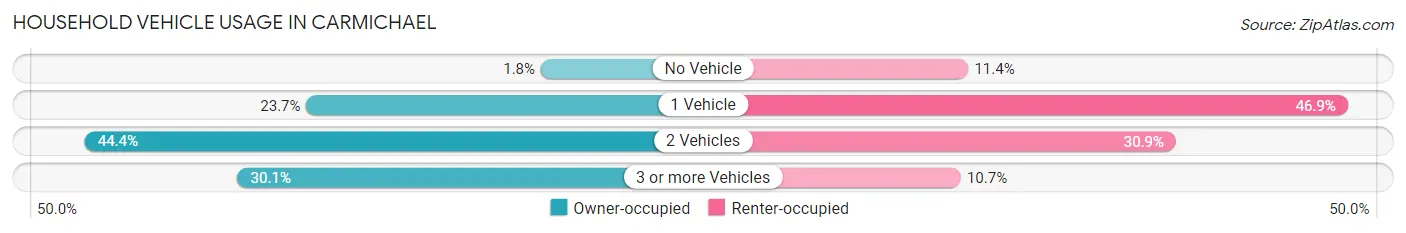
| Vehicles per Household | Owner-occupied | Renter-occupied |
| No Vehicle | 303 (1.8%) | 1,694 (11.4%) |
| 1 Vehicle | 3,962 (23.7%) | 6,949 (46.9%) |
| 2 Vehicles | 7,420 (44.4%) | 4,574 (30.9%) |
| 3 or more Vehicles | 5,035 (30.1%) | 1,591 (10.7%) |
| Total | 16,720 (100.0%) | 14,808 (100.0%) |
Real Estate & Mortgages in Carmichael
Real Estate and Mortgage Overview in Carmichael
| Characteristic | Without Mortgage | With Mortgage |
| Housing Units | 5,983 | 10,737 |
| Median Property Value | $482,700 | $502,200 |
| Median Household Income | $91,654 | $4,428 |
| Monthly Housing Costs | $664 | $2,589 |
| Real Estate Taxes | $2,609 | $104 |
Property Value by Mortgage Status in Carmichael
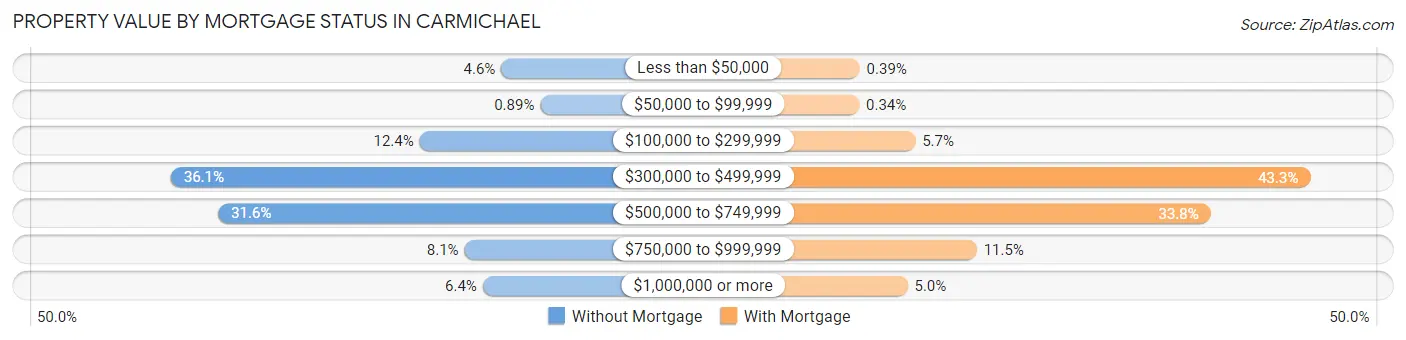
| Property Value | Without Mortgage | With Mortgage |
| Less than $50,000 | 276 (4.6%) | 42 (0.4%) |
| $50,000 to $99,999 | 53 (0.9%) | 36 (0.3%) |
| $100,000 to $299,999 | 741 (12.4%) | 610 (5.7%) |
| $300,000 to $499,999 | 2,158 (36.1%) | 4,649 (43.3%) |
| $500,000 to $749,999 | 1,889 (31.6%) | 3,630 (33.8%) |
| $750,000 to $999,999 | 485 (8.1%) | 1,239 (11.5%) |
| $1,000,000 or more | 381 (6.4%) | 531 (5.0%) |
| Total | 5,983 (100.0%) | 10,737 (100.0%) |
Household Income by Mortgage Status in Carmichael
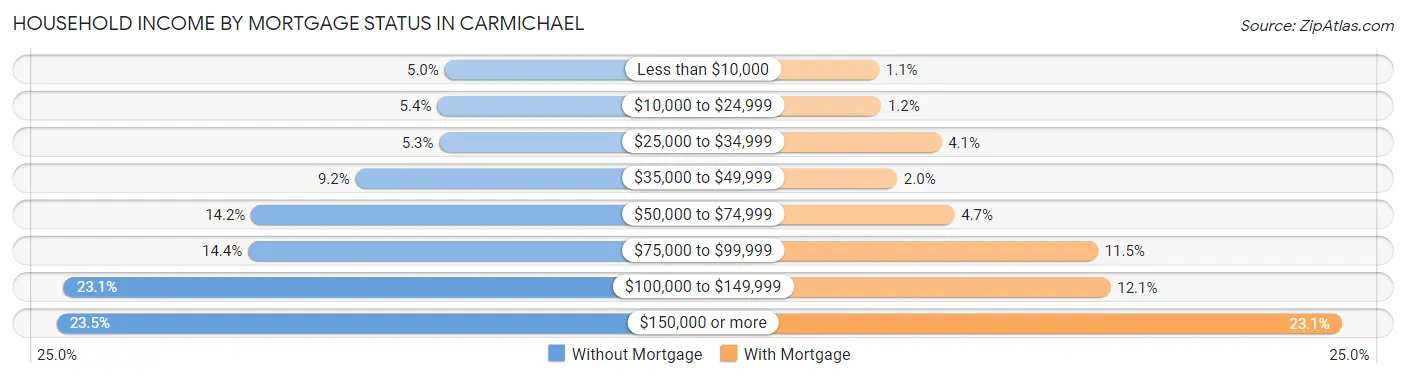
| Household Income | Without Mortgage | With Mortgage |
| Less than $10,000 | 299 (5.0%) | 119 (1.1%) |
| $10,000 to $24,999 | 320 (5.3%) | 130 (1.2%) |
| $25,000 to $34,999 | 314 (5.2%) | 438 (4.1%) |
| $35,000 to $49,999 | 553 (9.2%) | 211 (2.0%) |
| $50,000 to $74,999 | 850 (14.2%) | 505 (4.7%) |
| $75,000 to $99,999 | 859 (14.4%) | 1,238 (11.5%) |
| $100,000 to $149,999 | 1,384 (23.1%) | 1,302 (12.1%) |
| $150,000 or more | 1,404 (23.5%) | 2,485 (23.1%) |
| Total | 5,983 (100.0%) | 10,737 (100.0%) |
Property Value to Household Income Ratio in Carmichael
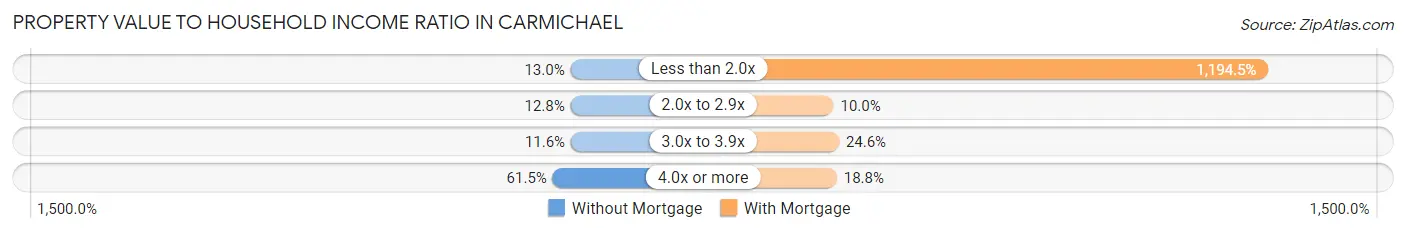
| Value-to-Income Ratio | Without Mortgage | With Mortgage |
| Less than 2.0x | 775 (13.0%) | 128,256 (1,194.5%) |
| 2.0x to 2.9x | 763 (12.8%) | 1,069 (10.0%) |
| 3.0x to 3.9x | 695 (11.6%) | 2,642 (24.6%) |
| 4.0x or more | 3,677 (61.5%) | 2,022 (18.8%) |
| Total | 5,983 (100.0%) | 10,737 (100.0%) |
Real Estate Taxes by Mortgage Status in Carmichael
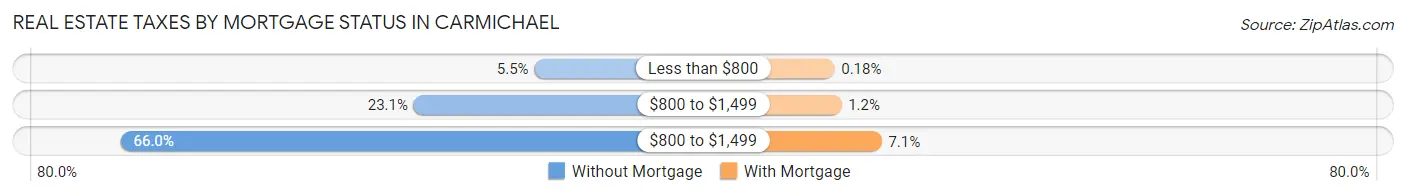
| Property Taxes | Without Mortgage | With Mortgage |
| Less than $800 | 329 (5.5%) | 19 (0.2%) |
| $800 to $1,499 | 1,384 (23.1%) | 128 (1.2%) |
| $800 to $1,499 | 3,947 (66.0%) | 759 (7.1%) |
| Total | 5,983 (100.0%) | 10,737 (100.0%) |
Health & Disability in Carmichael
Health Insurance Coverage by Age in Carmichael
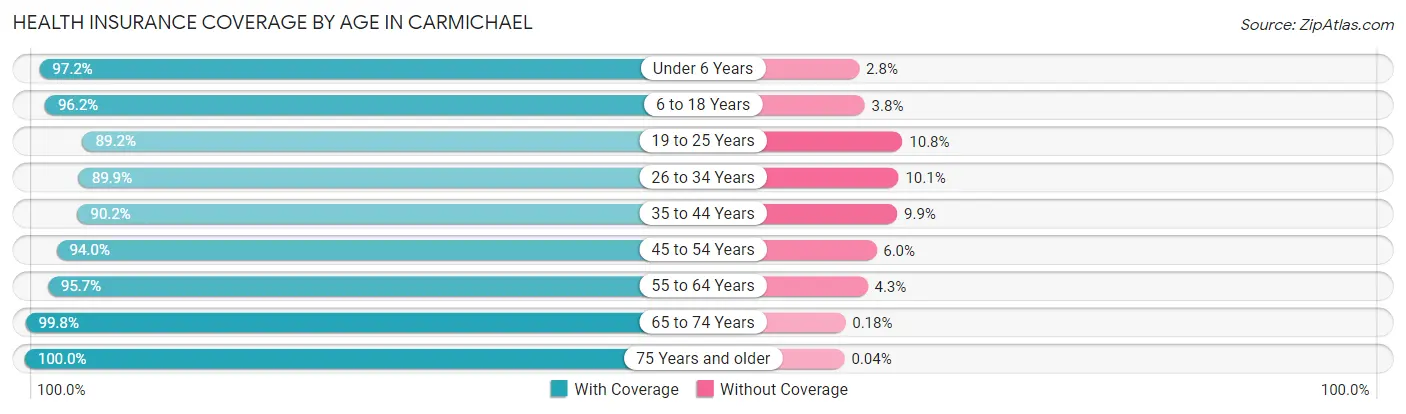
| Age Bracket | With Coverage | Without Coverage |
| Under 6 Years | 4,843 (97.2%) | 138 (2.8%) |
| 6 to 18 Years | 10,539 (96.2%) | 416 (3.8%) |
| 19 to 25 Years | 5,952 (89.2%) | 723 (10.8%) |
| 26 to 34 Years | 9,500 (89.9%) | 1,069 (10.1%) |
| 35 to 44 Years | 8,478 (90.1%) | 926 (9.9%) |
| 45 to 54 Years | 7,964 (94.0%) | 505 (6.0%) |
| 55 to 64 Years | 10,569 (95.7%) | 478 (4.3%) |
| 65 to 74 Years | 8,316 (99.8%) | 15 (0.2%) |
| 75 Years and older | 6,772 (100.0%) | 3 (0.0%) |
| Total | 72,933 (94.5%) | 4,273 (5.5%) |
Health Insurance Coverage by Citizenship Status in Carmichael
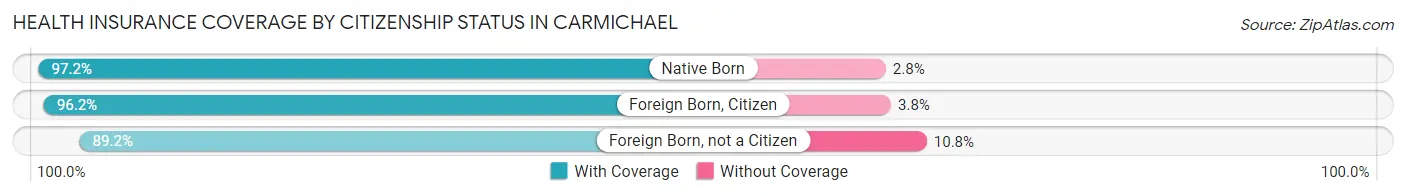
| Citizenship Status | With Coverage | Without Coverage |
| Native Born | 4,843 (97.2%) | 138 (2.8%) |
| Foreign Born, Citizen | 10,539 (96.2%) | 416 (3.8%) |
| Foreign Born, not a Citizen | 5,952 (89.2%) | 723 (10.8%) |
Health Insurance Coverage by Household Income in Carmichael
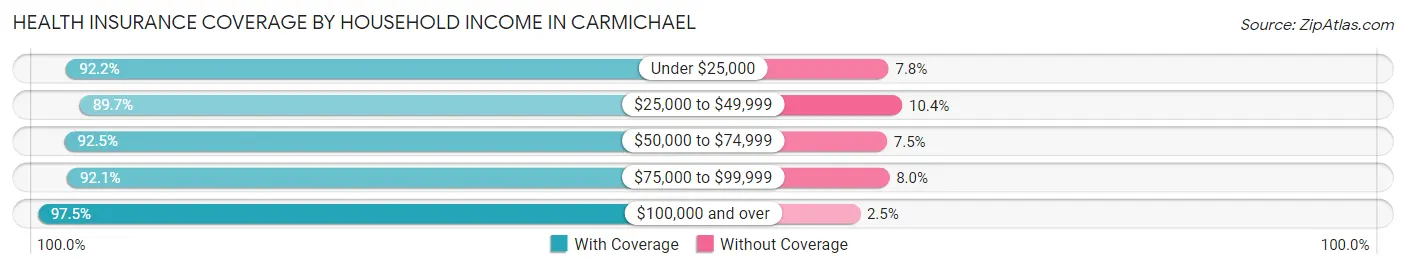
| Household Income | With Coverage | Without Coverage |
| Under $25,000 | 7,163 (92.2%) | 608 (7.8%) |
| $25,000 to $49,999 | 9,416 (89.6%) | 1,087 (10.3%) |
| $50,000 to $74,999 | 11,021 (92.5%) | 894 (7.5%) |
| $75,000 to $99,999 | 8,944 (92.0%) | 772 (8.0%) |
| $100,000 and over | 35,489 (97.5%) | 894 (2.5%) |
Public vs Private Health Insurance Coverage by Age in Carmichael
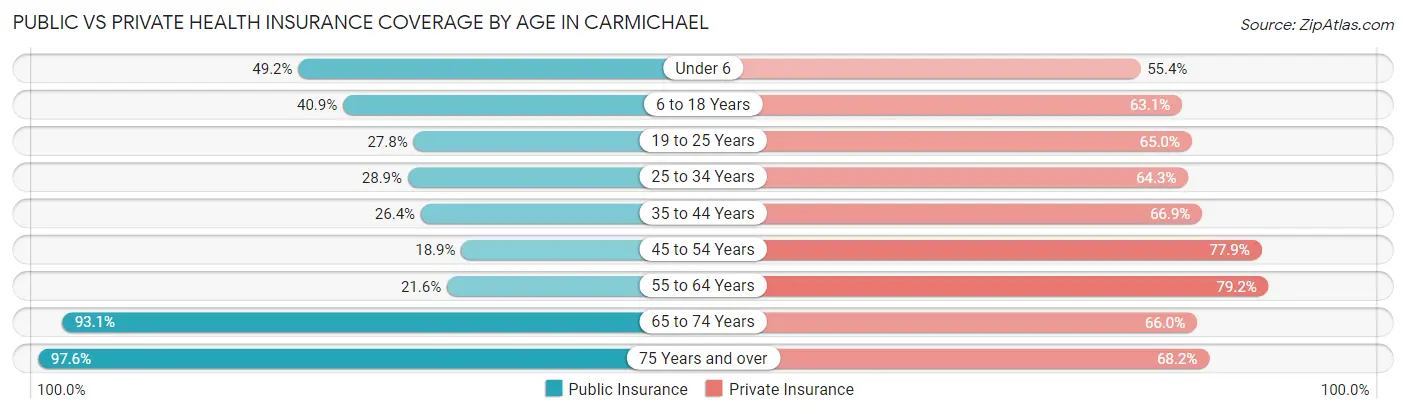
| Age Bracket | Public Insurance | Private Insurance |
| Under 6 | 2,450 (49.2%) | 2,759 (55.4%) |
| 6 to 18 Years | 4,480 (40.9%) | 6,917 (63.1%) |
| 19 to 25 Years | 1,857 (27.8%) | 4,337 (65.0%) |
| 25 to 34 Years | 3,050 (28.9%) | 6,796 (64.3%) |
| 35 to 44 Years | 2,486 (26.4%) | 6,290 (66.9%) |
| 45 to 54 Years | 1,604 (18.9%) | 6,599 (77.9%) |
| 55 to 64 Years | 2,386 (21.6%) | 8,751 (79.2%) |
| 65 to 74 Years | 7,757 (93.1%) | 5,494 (65.9%) |
| 75 Years and over | 6,609 (97.6%) | 4,620 (68.2%) |
| Total | 32,679 (42.3%) | 52,563 (68.1%) |
Disability Status by Sex by Age in Carmichael
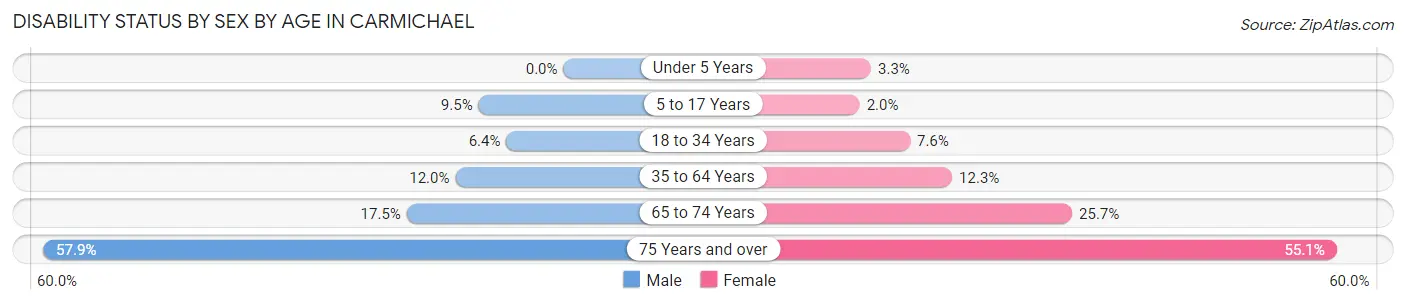
| Age Bracket | Male | Female |
| Under 5 Years | 0 (0.0%) | 63 (3.3%) |
| 5 to 17 Years | 508 (9.5%) | 112 (2.0%) |
| 18 to 34 Years | 619 (6.4%) | 631 (7.6%) |
| 35 to 64 Years | 1,703 (12.0%) | 1,815 (12.3%) |
| 65 to 74 Years | 619 (17.4%) | 1,227 (25.7%) |
| 75 Years and over | 1,574 (57.9%) | 2,236 (55.1%) |
Disability Class by Sex by Age in Carmichael
Disability Class: Hearing Difficulty
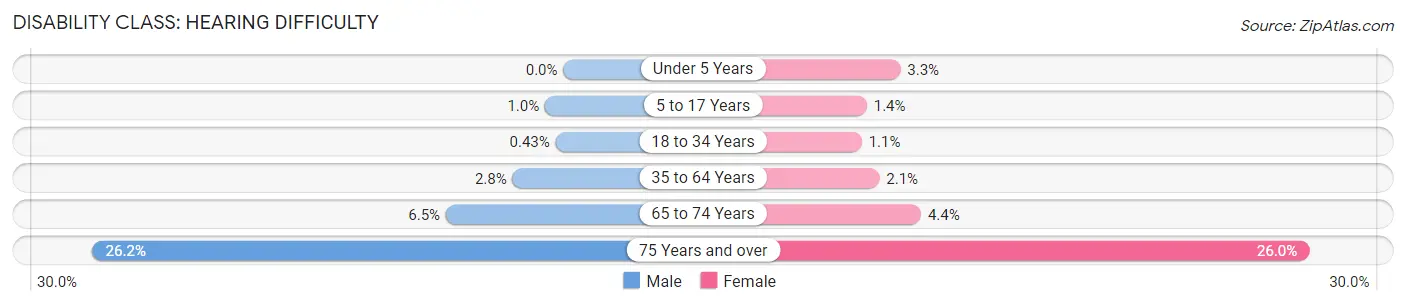
| Age Bracket | Male | Female |
| Under 5 Years | 0 (0.0%) | 63 (3.3%) |
| 5 to 17 Years | 55 (1.0%) | 78 (1.4%) |
| 18 to 34 Years | 42 (0.4%) | 92 (1.1%) |
| 35 to 64 Years | 401 (2.8%) | 308 (2.1%) |
| 65 to 74 Years | 232 (6.5%) | 211 (4.4%) |
| 75 Years and over | 712 (26.2%) | 1,056 (26.0%) |
Disability Class: Vision Difficulty
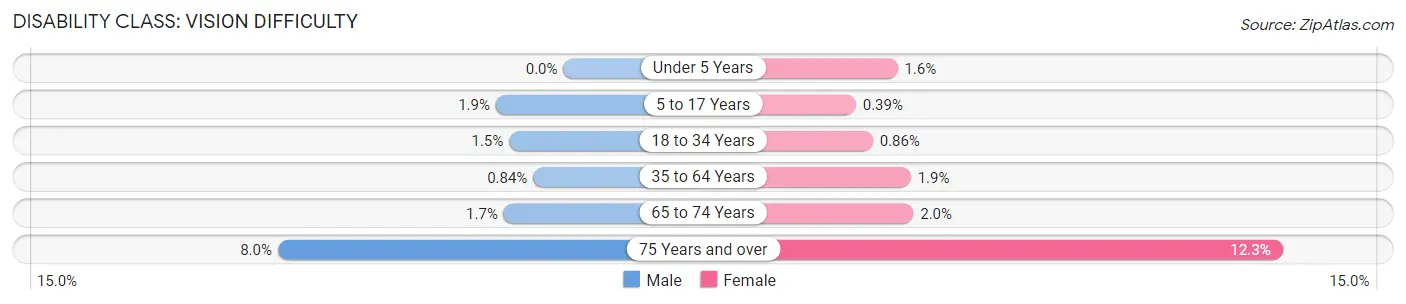
| Age Bracket | Male | Female |
| Under 5 Years | 0 (0.0%) | 30 (1.5%) |
| 5 to 17 Years | 101 (1.9%) | 22 (0.4%) |
| 18 to 34 Years | 147 (1.5%) | 71 (0.9%) |
| 35 to 64 Years | 119 (0.8%) | 284 (1.9%) |
| 65 to 74 Years | 59 (1.7%) | 95 (2.0%) |
| 75 Years and over | 216 (8.0%) | 498 (12.3%) |
Disability Class: Cognitive Difficulty
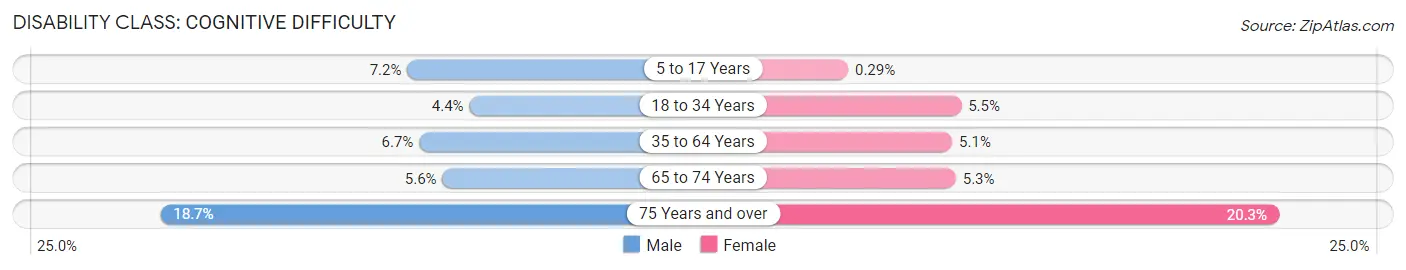
| Age Bracket | Male | Female |
| 5 to 17 Years | 389 (7.2%) | 16 (0.3%) |
| 18 to 34 Years | 425 (4.4%) | 460 (5.5%) |
| 35 to 64 Years | 947 (6.7%) | 756 (5.1%) |
| 65 to 74 Years | 199 (5.6%) | 253 (5.3%) |
| 75 Years and over | 508 (18.7%) | 823 (20.3%) |
Disability Class: Ambulatory Difficulty
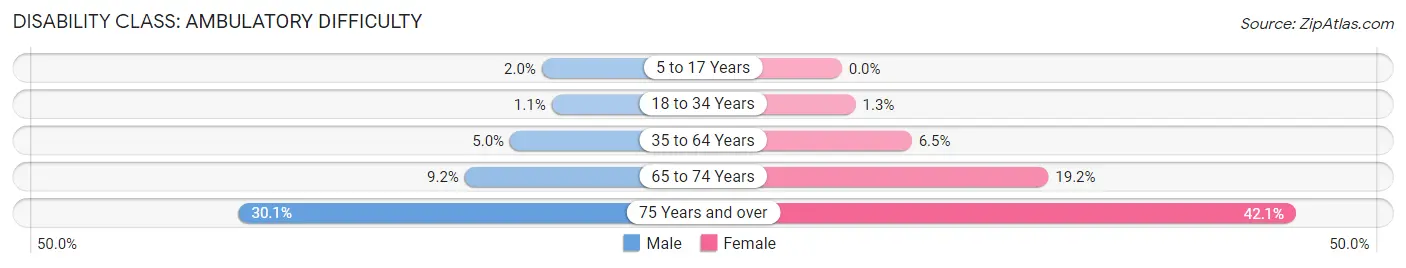
| Age Bracket | Male | Female |
| 5 to 17 Years | 108 (2.0%) | 0 (0.0%) |
| 18 to 34 Years | 107 (1.1%) | 106 (1.3%) |
| 35 to 64 Years | 702 (5.0%) | 958 (6.5%) |
| 65 to 74 Years | 325 (9.2%) | 917 (19.2%) |
| 75 Years and over | 819 (30.1%) | 1,710 (42.1%) |
Disability Class: Self-Care Difficulty
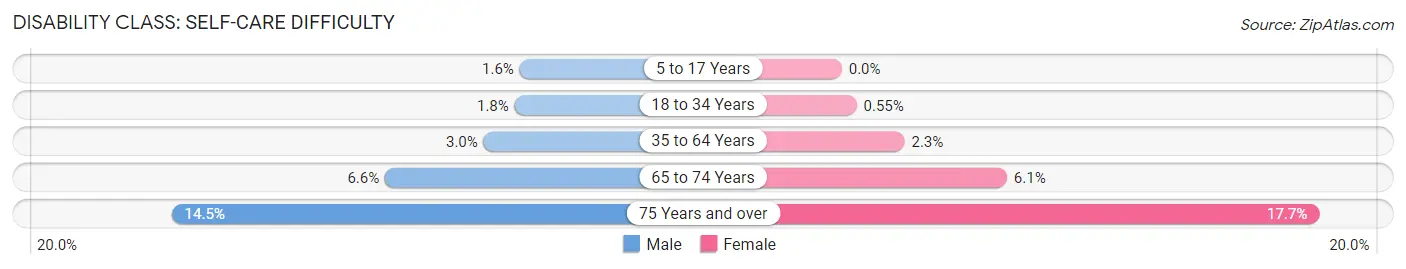
| Age Bracket | Male | Female |
| 5 to 17 Years | 87 (1.6%) | 0 (0.0%) |
| 18 to 34 Years | 177 (1.8%) | 46 (0.5%) |
| 35 to 64 Years | 419 (3.0%) | 344 (2.3%) |
| 65 to 74 Years | 235 (6.6%) | 293 (6.1%) |
| 75 Years and over | 395 (14.5%) | 719 (17.7%) |
Technology Access in Carmichael
Computing Device Access in Carmichael
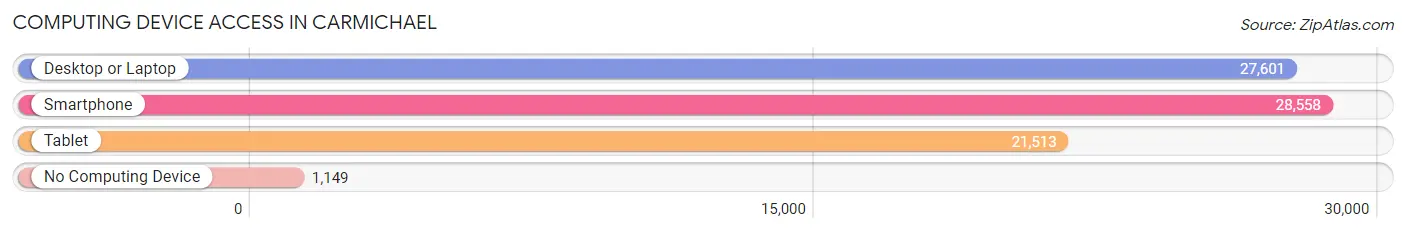
| Device Type | # Households | % Households |
| Desktop or Laptop | 27,601 | 87.5% |
| Smartphone | 28,558 | 90.6% |
| Tablet | 21,513 | 68.2% |
| No Computing Device | 1,149 | 3.6% |
| Total | 31,528 | 100.0% |
Internet Access in Carmichael
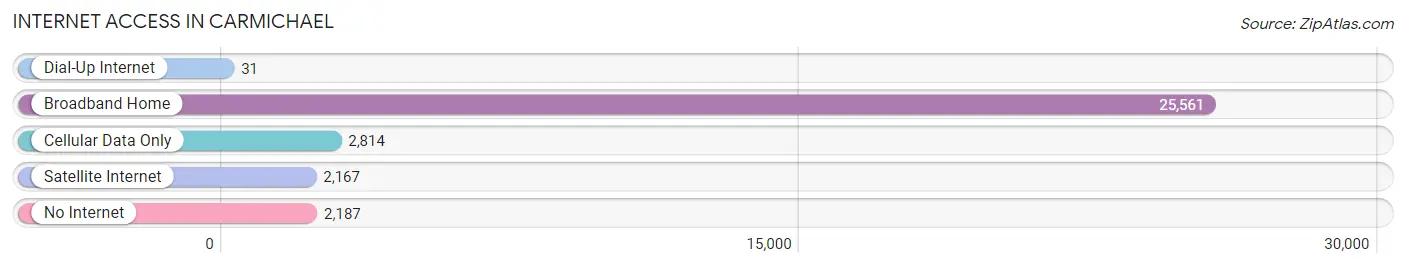
| Internet Type | # Households | % Households |
| Dial-Up Internet | 31 | 0.1% |
| Broadband Home | 25,561 | 81.1% |
| Cellular Data Only | 2,814 | 8.9% |
| Satellite Internet | 2,167 | 6.9% |
| No Internet | 2,187 | 6.9% |
| Total | 31,528 | 100.0% |
Carmichael Summary
Carmichael is a census-designated place located in Sacramento County, California. It is a suburb of the state capital, Sacramento, and is located approximately 15 miles northeast of the city. The population of Carmichael was 61,762 as of the 2010 census.
History
Carmichael was founded in 1906 by Daniel W. Carmichael, a Scottish immigrant who had previously worked in the lumber industry in Oregon. He purchased a large parcel of land in the area and began to develop it into a farming community. The town was named after him and was incorporated in 1910.
In the early years, Carmichael was a rural farming community, with the main crops being wheat, barley, and hay. The town also had a few small businesses, including a general store, a blacksmith shop, and a post office.
In the 1950s, the town began to experience rapid growth as the population of Sacramento increased and people began to move to the suburbs. This growth was fueled by the construction of Interstate 80, which provided easy access to the city.
Geography
Carmichael is located in the Central Valley of California, approximately 15 miles northeast of Sacramento. It is bordered by the cities of Citrus Heights to the north, Fair Oaks to the east, and Rancho Cordova to the south. The American River runs along the western edge of the town.
The town has a total area of 8.3 square miles, all of which is land. The elevation of Carmichael is approximately 100 feet above sea level.
Economy
Carmichael is primarily a residential community, with most of its residents commuting to nearby cities for work. The town does have a few small businesses, including restaurants, retail stores, and professional services.
The largest employer in the town is the Sacramento County government, which employs over 1,000 people in the area. Other major employers include the local school district, the local hospital, and the local fire department.
Demographics
As of the 2010 census, the population of Carmichael was 61,762. The racial makeup of the town was 75.3% White, 8.2% African American, 0.7% Native American, 8.2% Asian, 0.2% Pacific Islander, and 4.3% from other races. Hispanic or Latino of any race were 16.2% of the population.
The median household income in Carmichael was $60,945, and the median family income was $68,945. The per capita income was $30,945. About 8.2% of families and 10.3% of the population were below the poverty line.
Carmichael is served by the San Juan Unified School District, which includes seven elementary schools, two middle schools, and two high schools. The town is also home to a branch of the Sacramento Public Library.
Common Questions
What is Per Capita Income in Carmichael?
Per Capita income in Carmichael is $45,855.
What is the Median Family Income in Carmichael?
Median Family Income in Carmichael is $97,240.
What is the Median Household income in Carmichael?
Median Household Income in Carmichael is $80,138.
What is Income or Wage Gap in Carmichael?
Income or Wage Gap in Carmichael is 18.8%.
Women in Carmichael earn 81.2 cents for every dollar earned by a man.
What is Family Income Deficit in Carmichael?
Family Income Deficit in Carmichael is $11,044.
Families that are below poverty line in Carmichael earn $11,044 less on average than the poverty threshold level.
What is Inequality or Gini Index in Carmichael?
Inequality or Gini Index in Carmichael is 0.46.
What is the Total Population of Carmichael?
Total Population of Carmichael is 78,144.
What is the Total Male Population of Carmichael?
Total Male Population of Carmichael is 38,080.
What is the Total Female Population of Carmichael?
Total Female Population of Carmichael is 40,064.
What is the Ratio of Males per 100 Females in Carmichael?
There are 95.05 Males per 100 Females in Carmichael.
What is the Ratio of Females per 100 Males in Carmichael?
There are 105.21 Females per 100 Males in Carmichael.
What is the Median Population Age in Carmichael?
Median Population Age in Carmichael is 41.0 Years.
What is the Average Family Size in Carmichael
Average Family Size in Carmichael is 3.0 People.
What is the Average Household Size in Carmichael
Average Household Size in Carmichael is 2.4 People.
How Large is the Labor Force in Carmichael?
There are 39,146 People in the Labor Forcein in Carmichael.
What is the Percentage of People in the Labor Force in Carmichael?
60.4% of People are in the Labor Force in Carmichael.
What is the Unemployment Rate in Carmichael?
Unemployment Rate in Carmichael is 5.5%.