Ontario, CA Map & Demographics
Ontario Map
Ontario Overview
$29,332
PER CAPITA INCOME
$83,022
AVG FAMILY INCOME
$78,070
AVG HOUSEHOLD INCOME
24.1%
WAGE / INCOME GAP [ % ]
75.9¢/ $1
WAGE / INCOME GAP [ $ ]
$11,213
FAMILY INCOME DEFICIT
0.40
INEQUALITY / GINI INDEX
176,326
TOTAL POPULATION
87,095
MALE POPULATION
89,231
FEMALE POPULATION
97.61
MALES / 100 FEMALES
102.45
FEMALES / 100 MALES
32.6
MEDIAN AGE
3.8
AVG FAMILY SIZE
3.4
AVG HOUSEHOLD SIZE
91,723
LABOR FORCE [ PEOPLE ]
66.6%
PERCENT IN LABOR FORCE
5.8%
UNEMPLOYMENT RATE
Income in Ontario
Income Overview in Ontario
Per Capita Income in Ontario is $29,332, while median incomes of families and households are $83,022 and $78,070 respectively.
| Characteristic | Number | Measure |
| Per Capita Income | 176,326 | $29,332 |
| Median Family Income | 39,888 | $83,022 |
| Mean Family Income | 39,888 | $99,544 |
| Median Household Income | 51,760 | $78,070 |
| Mean Household Income | 51,760 | $96,281 |
| Income Deficit | 39,888 | $11,213 |
| Wage / Income Gap (%) | 176,326 | 24.12% |
| Wage / Income Gap ($) | 176,326 | 75.88¢ per $1 |
| Gini / Inequality Index | 176,326 | 0.40 |
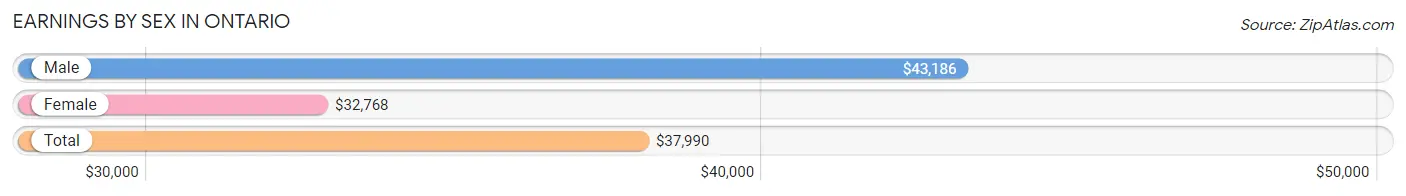
Earnings by Sex in Ontario
Average Earnings in Ontario are $37,990, $43,186 for men and $32,768 for women, a difference of 24.1%.
| Sex | Number | Average Earnings |
| Male | 50,716 (54.8%) | $43,186 |
| Female | 41,797 (45.2%) | $32,768 |
| Total | 92,513 (100.0%) | $37,990 |
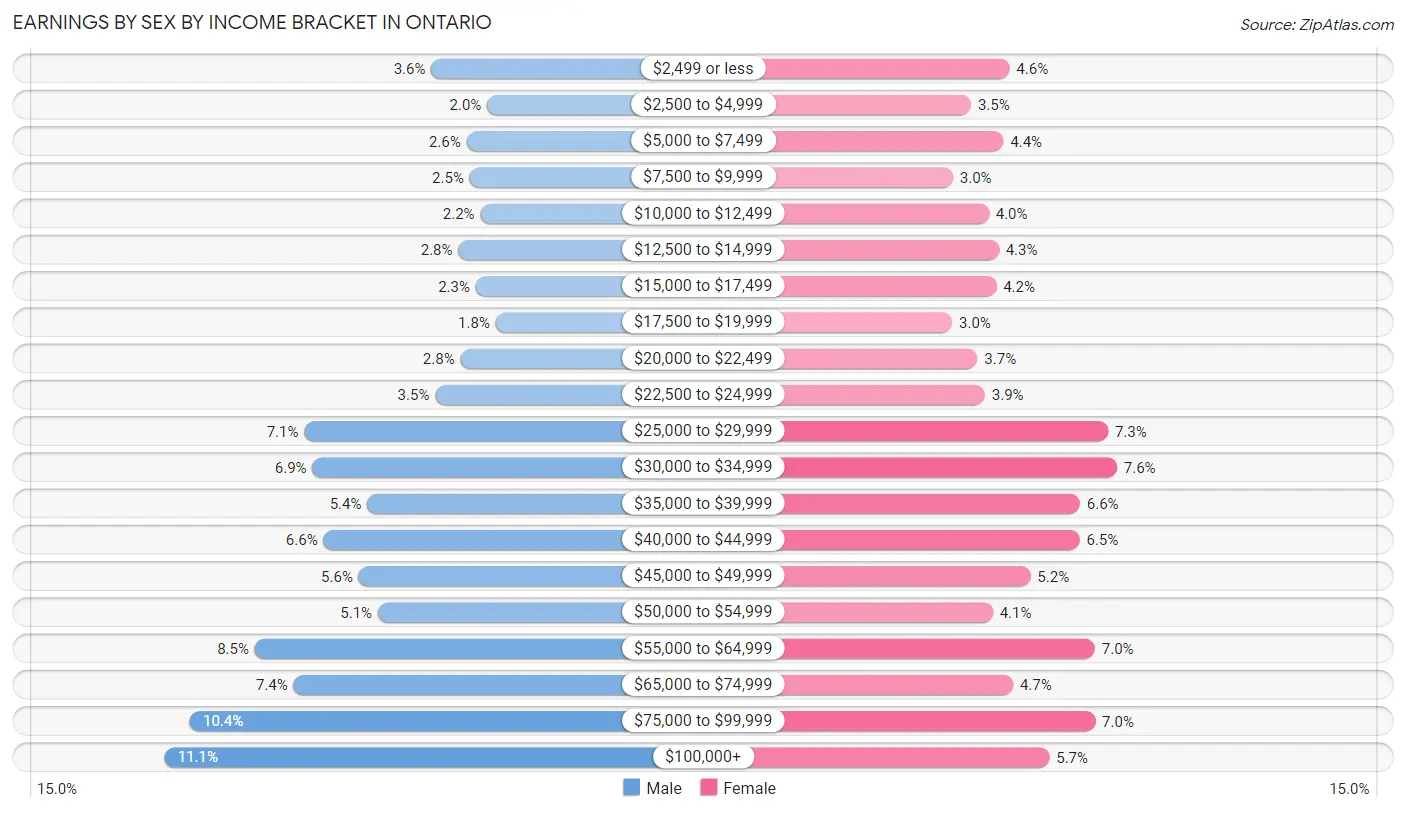
Earnings by Sex by Income Bracket in Ontario
The most common earnings brackets in Ontario are $100,000+ for men (5,608 | 11.1%) and $30,000 to $34,999 for women (3,171 | 7.6%).
| Income | Male | Female |
| $2,499 or less | 1,810 (3.6%) | 1,911 (4.6%) |
| $2,500 to $4,999 | 1,013 (2.0%) | 1,458 (3.5%) |
| $5,000 to $7,499 | 1,307 (2.6%) | 1,839 (4.4%) |
| $7,500 to $9,999 | 1,261 (2.5%) | 1,247 (3.0%) |
| $10,000 to $12,499 | 1,111 (2.2%) | 1,668 (4.0%) |
| $12,500 to $14,999 | 1,425 (2.8%) | 1,785 (4.3%) |
| $15,000 to $17,499 | 1,176 (2.3%) | 1,756 (4.2%) |
| $17,500 to $19,999 | 891 (1.8%) | 1,236 (3.0%) |
| $20,000 to $22,499 | 1,397 (2.8%) | 1,536 (3.7%) |
| $22,500 to $24,999 | 1,757 (3.5%) | 1,622 (3.9%) |
| $25,000 to $29,999 | 3,623 (7.1%) | 3,067 (7.3%) |
| $30,000 to $34,999 | 3,506 (6.9%) | 3,171 (7.6%) |
| $35,000 to $39,999 | 2,724 (5.4%) | 2,737 (6.6%) |
| $40,000 to $44,999 | 3,346 (6.6%) | 2,732 (6.5%) |
| $45,000 to $49,999 | 2,844 (5.6%) | 2,157 (5.2%) |
| $50,000 to $54,999 | 2,569 (5.1%) | 1,714 (4.1%) |
| $55,000 to $64,999 | 4,326 (8.5%) | 2,913 (7.0%) |
| $65,000 to $74,999 | 3,771 (7.4%) | 1,954 (4.7%) |
| $75,000 to $99,999 | 5,251 (10.3%) | 2,917 (7.0%) |
| $100,000+ | 5,608 (11.1%) | 2,377 (5.7%) |
| Total | 50,716 (100.0%) | 41,797 (100.0%) |
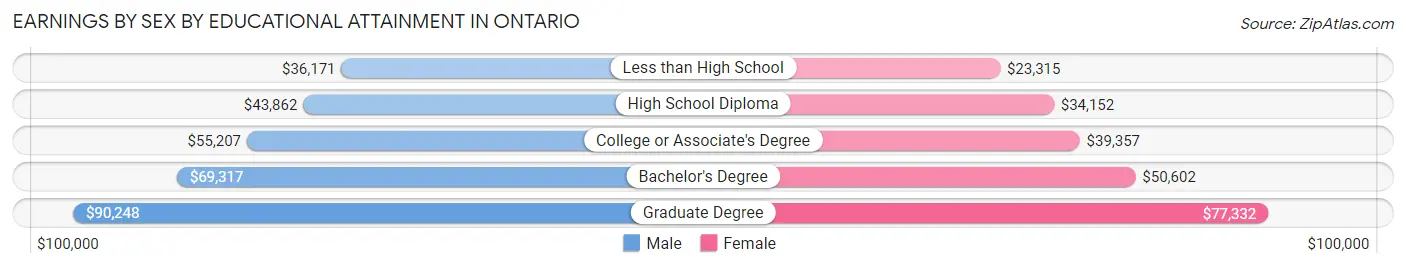
Earnings by Sex by Educational Attainment in Ontario
Average earnings in Ontario are $48,812 for men and $37,564 for women, a difference of 23.0%. Men with an educational attainment of graduate degree enjoy the highest average annual earnings of $90,248, while those with less than high school education earn the least with $36,171. Women with an educational attainment of graduate degree earn the most with the average annual earnings of $77,332, while those with less than high school education have the smallest earnings of $23,315.
| Educational Attainment | Male Income | Female Income |
| Less than High School | $36,171 | $23,315 |
| High School Diploma | $43,862 | $34,152 |
| College or Associate's Degree | $55,207 | $39,357 |
| Bachelor's Degree | $69,317 | $50,602 |
| Graduate Degree | $90,248 | $77,332 |
| Total | $48,812 | $37,564 |
Family Income in Ontario
Family Income Brackets in Ontario
According to the Ontario family income data, there are 8,656 families falling into the $100,000 to $149,999 income range, which is the most common income bracket and makes up 21.7% of all families. Conversely, the $10,000 to $14,999 income bracket is the least frequent group with only 798 families (2.0%) belonging to this category.
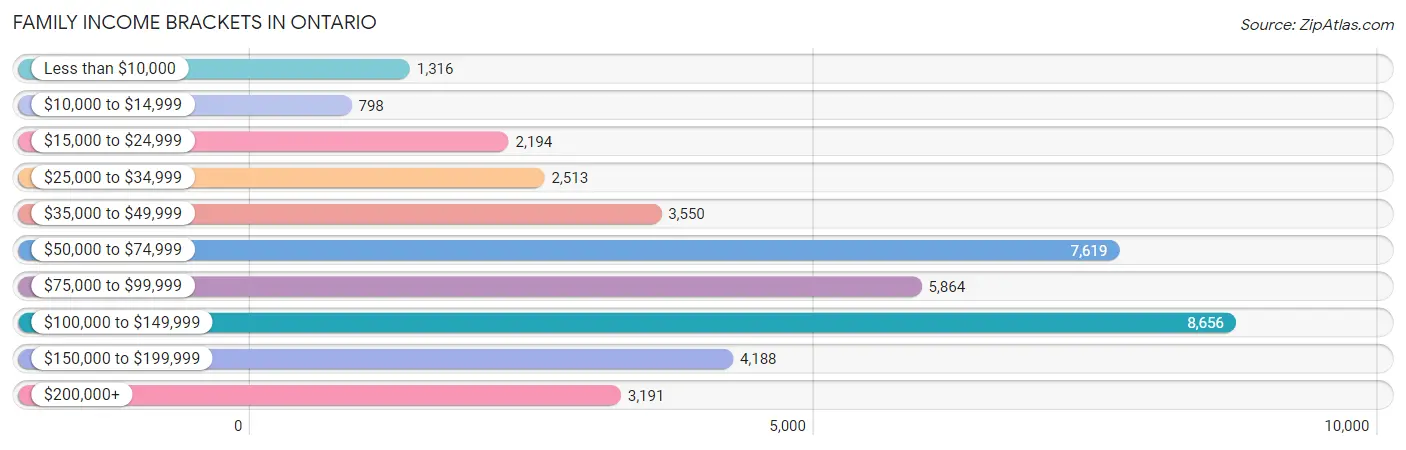
| Income Bracket | # Families | % Families |
| Less than $10,000 | 1,316 | 3.3% |
| $10,000 to $14,999 | 798 | 2.0% |
| $15,000 to $24,999 | 2,194 | 5.5% |
| $25,000 to $34,999 | 2,513 | 6.3% |
| $35,000 to $49,999 | 3,550 | 8.9% |
| $50,000 to $74,999 | 7,619 | 19.1% |
| $75,000 to $99,999 | 5,864 | 14.7% |
| $100,000 to $149,999 | 8,656 | 21.7% |
| $150,000 to $199,999 | 4,188 | 10.5% |
| $200,000+ | 3,191 | 8.0% |
Family Income by Famaliy Size in Ontario
7+ person families (1,926 | 4.8%) account for the highest median family income in Ontario with $121,824 per family, while 2-person families (12,076 | 30.3%) have the highest median income of $35,046 per family member.
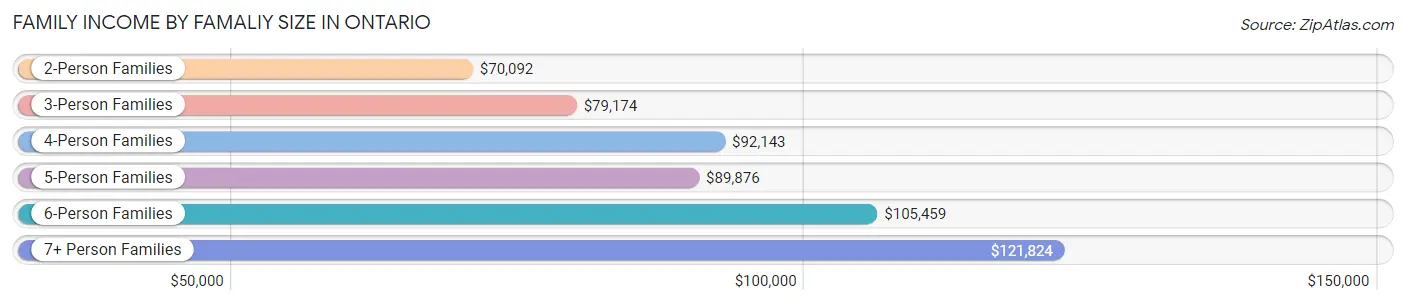
| Income Bracket | # Families | Median Income |
| 2-Person Families | 12,076 (30.3%) | $70,092 |
| 3-Person Families | 9,350 (23.4%) | $79,174 |
| 4-Person Families | 7,980 (20.0%) | $92,143 |
| 5-Person Families | 5,794 (14.5%) | $89,876 |
| 6-Person Families | 2,762 (6.9%) | $105,459 |
| 7+ Person Families | 1,926 (4.8%) | $121,824 |
| Total | 39,888 (100.0%) | $83,022 |
Family Income by Number of Earners in Ontario
The median family income in Ontario is $83,022, with families comprising 3+ earners (8,018) having the highest median family income of $137,972, while families with no earners (3,567) have the lowest median family income of $32,885, accounting for 20.1% and 8.9% of families, respectively.
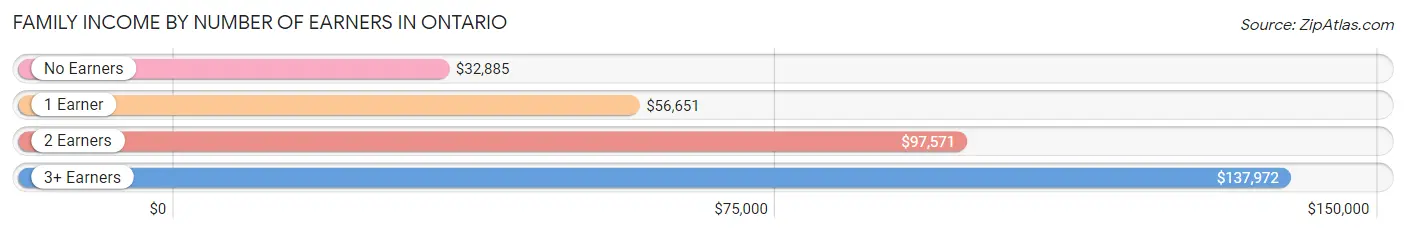
| Number of Earners | # Families | Median Income |
| No Earners | 3,567 (8.9%) | $32,885 |
| 1 Earner | 12,531 (31.4%) | $56,651 |
| 2 Earners | 15,772 (39.5%) | $97,571 |
| 3+ Earners | 8,018 (20.1%) | $137,972 |
| Total | 39,888 (100.0%) | $83,022 |
Household Income in Ontario
Household Income Brackets in Ontario
With 10,352 households falling in the category, the $100,000 to $149,999 income range is the most frequent in Ontario, accounting for 20.0% of all households. In contrast, only 1,242 households (2.4%) fall into the $10,000 to $14,999 income bracket, making it the least populous group.
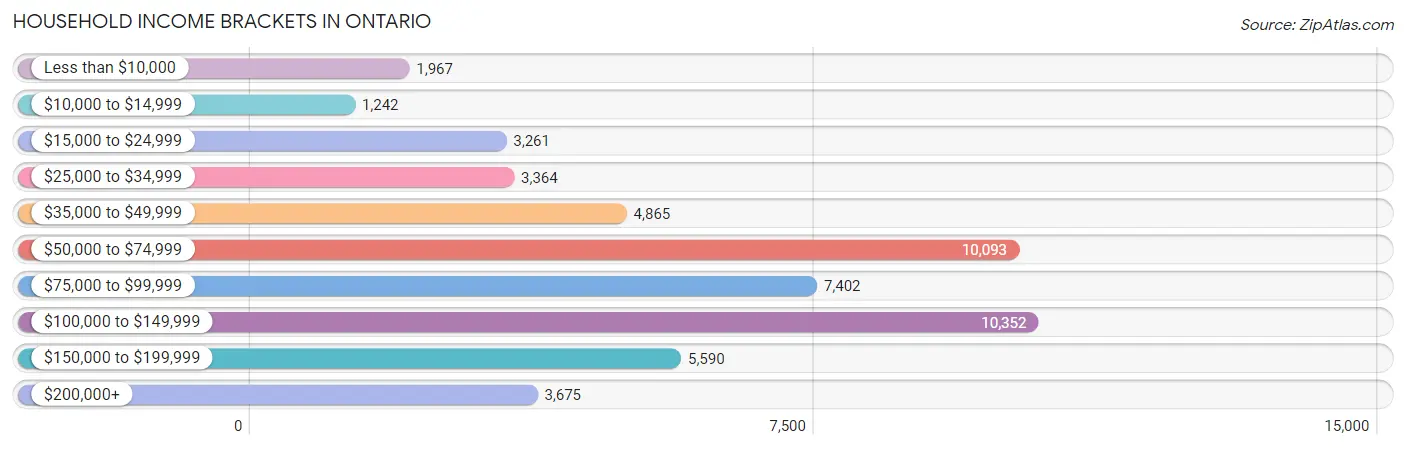
| Income Bracket | # Households | % Households |
| Less than $10,000 | 1,967 | 3.8% |
| $10,000 to $14,999 | 1,242 | 2.4% |
| $15,000 to $24,999 | 3,261 | 6.3% |
| $25,000 to $34,999 | 3,364 | 6.5% |
| $35,000 to $49,999 | 4,865 | 9.4% |
| $50,000 to $74,999 | 10,093 | 19.5% |
| $75,000 to $99,999 | 7,402 | 14.3% |
| $100,000 to $149,999 | 10,352 | 20.0% |
| $150,000 to $199,999 | 5,590 | 10.8% |
| $200,000+ | 3,675 | 7.1% |
Household Income by Householder Age in Ontario
The median household income in Ontario is $78,070, with the highest median household income of $89,744 found in the 45 to 64 years age bracket for the primary householder. A total of 19,715 households (38.1%) fall into this category. Meanwhile, the 15 to 24 years age bracket for the primary householder has the lowest median household income of $43,542, with 1,970 households (3.8%) in this group.
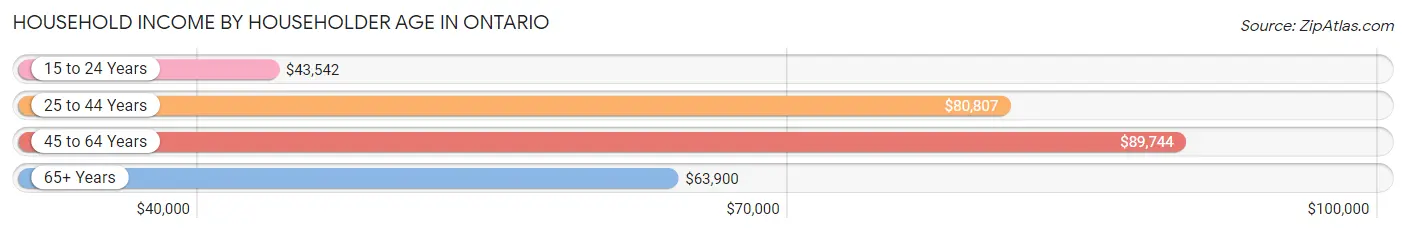
| Income Bracket | # Households | Median Income |
| 15 to 24 Years | 1,970 (3.8%) | $43,542 |
| 25 to 44 Years | 20,689 (40.0%) | $80,807 |
| 45 to 64 Years | 19,715 (38.1%) | $89,744 |
| 65+ Years | 9,386 (18.1%) | $63,900 |
| Total | 51,760 (100.0%) | $78,070 |
Poverty in Ontario
Income Below Poverty by Sex and Age in Ontario
With 11.5% poverty level for males and 14.3% for females among the residents of Ontario, 5 year old males and 15 year old females are the most vulnerable to poverty, with 219 males (22.5%) and 307 females (23.5%) in their respective age groups living below the poverty level.
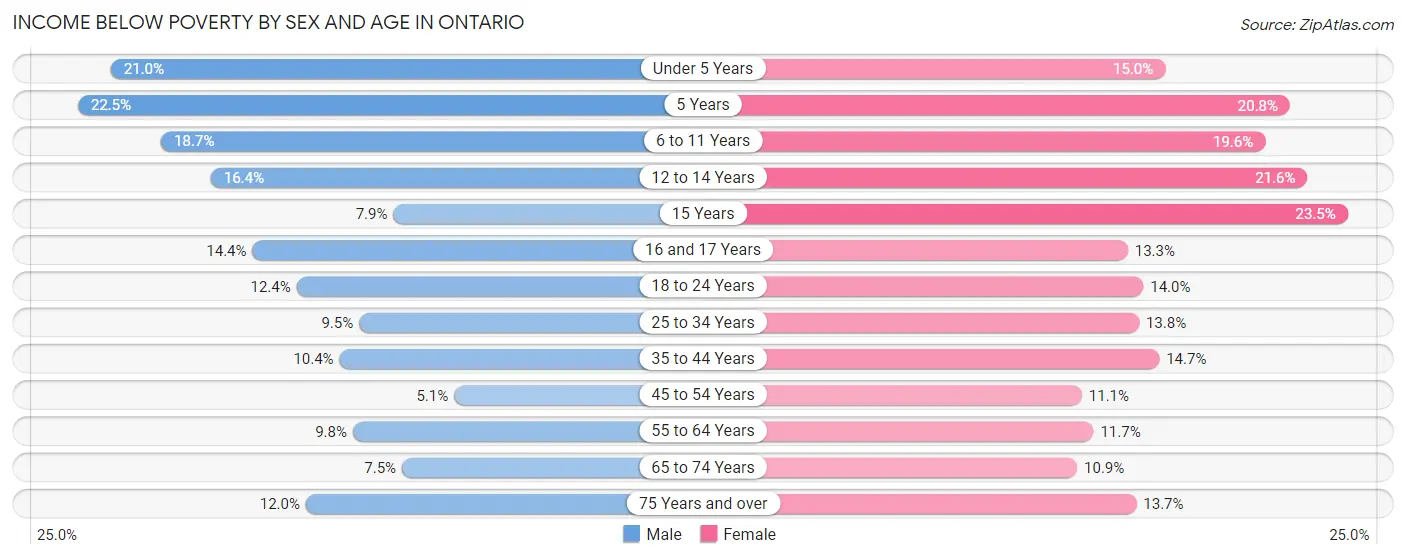
| Age Bracket | Male | Female |
| Under 5 Years | 1,170 (21.0%) | 877 (15.0%) |
| 5 Years | 219 (22.5%) | 304 (20.8%) |
| 6 to 11 Years | 1,324 (18.7%) | 1,432 (19.6%) |
| 12 to 14 Years | 591 (16.4%) | 779 (21.6%) |
| 15 Years | 81 (7.9%) | 307 (23.5%) |
| 16 and 17 Years | 396 (14.4%) | 337 (13.3%) |
| 18 to 24 Years | 1,314 (12.4%) | 1,254 (14.0%) |
| 25 to 34 Years | 1,489 (9.5%) | 2,139 (13.8%) |
| 35 to 44 Years | 1,259 (10.4%) | 1,750 (14.7%) |
| 45 to 54 Years | 525 (5.1%) | 1,181 (11.1%) |
| 55 to 64 Years | 866 (9.8%) | 1,172 (11.7%) |
| 65 to 74 Years | 394 (7.5%) | 637 (10.9%) |
| 75 Years and over | 297 (11.9%) | 505 (13.7%) |
| Total | 9,925 (11.5%) | 12,674 (14.3%) |
Income Above Poverty by Sex and Age in Ontario
According to the poverty statistics in Ontario, males aged 45 to 54 years and females aged 65 to 74 years are the age groups that are most secure financially, with 94.9% of males and 89.1% of females in these age groups living above the poverty line.
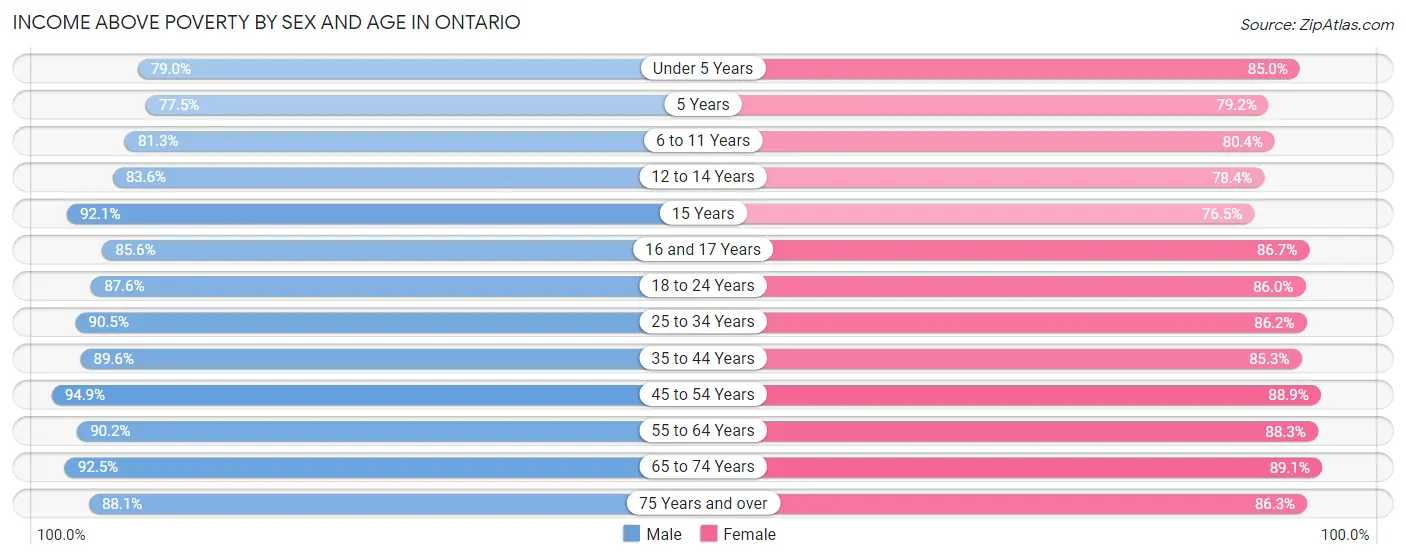
| Age Bracket | Male | Female |
| Under 5 Years | 4,401 (79.0%) | 4,971 (85.0%) |
| 5 Years | 753 (77.5%) | 1,158 (79.2%) |
| 6 to 11 Years | 5,768 (81.3%) | 5,859 (80.4%) |
| 12 to 14 Years | 3,021 (83.6%) | 2,827 (78.4%) |
| 15 Years | 945 (92.1%) | 1,001 (76.5%) |
| 16 and 17 Years | 2,349 (85.6%) | 2,203 (86.7%) |
| 18 to 24 Years | 9,298 (87.6%) | 7,711 (86.0%) |
| 25 to 34 Years | 14,211 (90.5%) | 13,371 (86.2%) |
| 35 to 44 Years | 10,863 (89.6%) | 10,133 (85.3%) |
| 45 to 54 Years | 9,833 (94.9%) | 9,423 (88.9%) |
| 55 to 64 Years | 8,002 (90.2%) | 8,861 (88.3%) |
| 65 to 74 Years | 4,868 (92.5%) | 5,198 (89.1%) |
| 75 Years and over | 2,189 (88.0%) | 3,188 (86.3%) |
| Total | 76,501 (88.5%) | 75,904 (85.7%) |
Income Below Poverty Among Married-Couple Families in Ontario
The poverty statistics for married-couple families in Ontario show that 6.9% or 1,743 of the total 25,398 families live below the poverty line. Families with 5 or more children have the highest poverty rate of 35.8%, comprising of 93 families. On the other hand, families with 1 or 2 children have the lowest poverty rate of 5.2%, which includes 506 families.
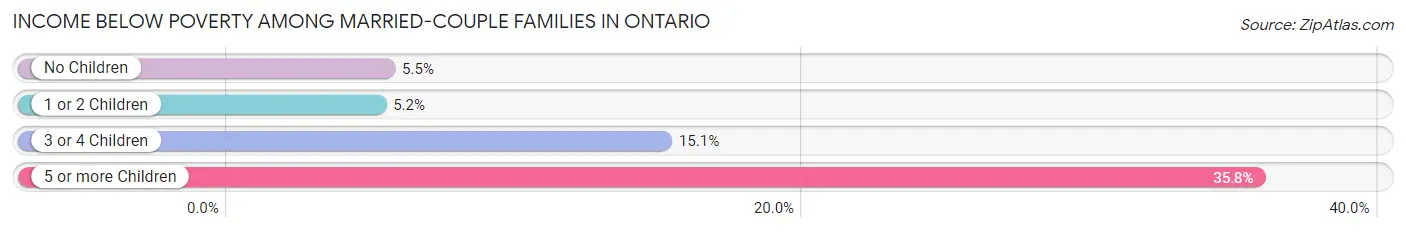
| Children | Above Poverty | Below Poverty |
| No Children | 11,487 (94.5%) | 665 (5.5%) |
| 1 or 2 Children | 9,309 (94.8%) | 506 (5.2%) |
| 3 or 4 Children | 2,692 (84.9%) | 479 (15.1%) |
| 5 or more Children | 167 (64.2%) | 93 (35.8%) |
| Total | 23,655 (93.1%) | 1,743 (6.9%) |
Income Below Poverty Among Single-Parent Households in Ontario
According to the poverty data in Ontario, 12.2% or 612 single-father households and 21.7% or 2,053 single-mother households are living below the poverty line. Among single-father households, those with 5 or more children have the highest poverty rate, with 8 households (38.1%) experiencing poverty. Likewise, among single-mother households, those with 5 or more children have the highest poverty rate, with 84 households (78.5%) falling below the poverty line.
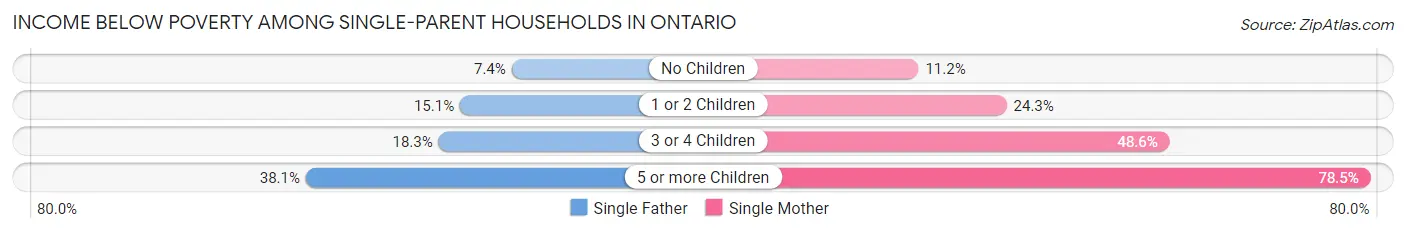
| Children | Single Father | Single Mother |
| No Children | 159 (7.4%) | 478 (11.2%) |
| 1 or 2 Children | 375 (15.1%) | 972 (24.3%) |
| 3 or 4 Children | 70 (18.3%) | 519 (48.5%) |
| 5 or more Children | 8 (38.1%) | 84 (78.5%) |
| Total | 612 (12.2%) | 2,053 (21.7%) |
Income Below Poverty Among Married-Couple vs Single-Parent Households in Ontario
The poverty data for Ontario shows that 1,743 of the married-couple family households (6.9%) and 2,665 of the single-parent households (18.4%) are living below the poverty level. Within the married-couple family households, those with 5 or more children have the highest poverty rate, with 93 households (35.8%) falling below the poverty line. Among the single-parent households, those with 5 or more children have the highest poverty rate, with 92 household (71.9%) living below poverty.
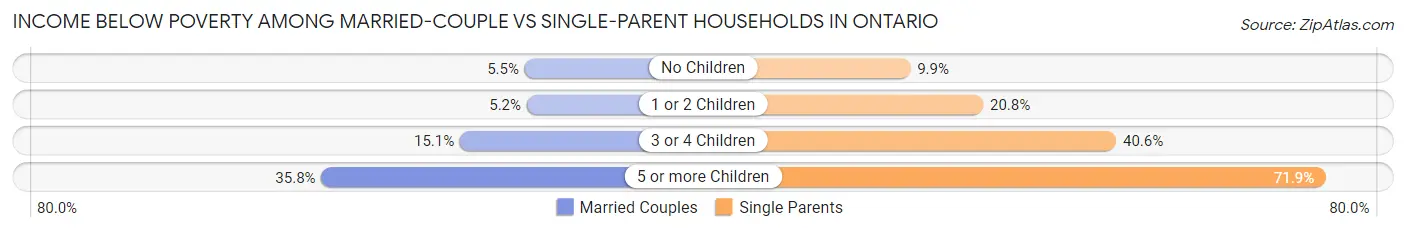
| Children | Married-Couple Families | Single-Parent Households |
| No Children | 665 (5.5%) | 637 (9.9%) |
| 1 or 2 Children | 506 (5.2%) | 1,347 (20.8%) |
| 3 or 4 Children | 479 (15.1%) | 589 (40.6%) |
| 5 or more Children | 93 (35.8%) | 92 (71.9%) |
| Total | 1,743 (6.9%) | 2,665 (18.4%) |
Race in Ontario
The most populous races in Ontario are Hispanic or Latino (123,804 | 70.2%), White / Caucasian (61,881 | 35.1%), and Some other Race (49,378 | 28.0%).
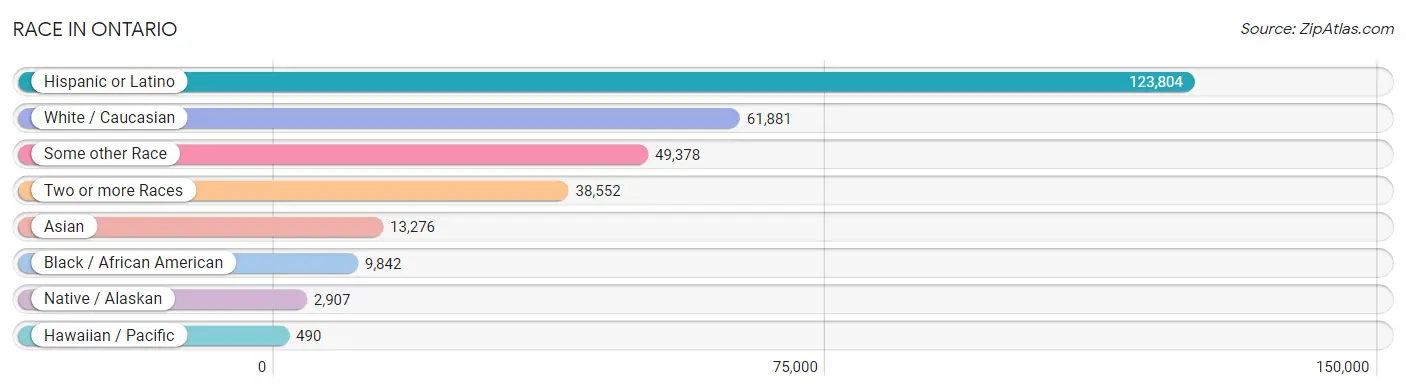
| Race | # Population | % Population |
| Asian | 13,276 | 7.5% |
| Black / African American | 9,842 | 5.6% |
| Hawaiian / Pacific | 490 | 0.3% |
| Hispanic or Latino | 123,804 | 70.2% |
| Native / Alaskan | 2,907 | 1.7% |
| White / Caucasian | 61,881 | 35.1% |
| Two or more Races | 38,552 | 21.9% |
| Some other Race | 49,378 | 28.0% |
| Total | 176,326 | 100.0% |
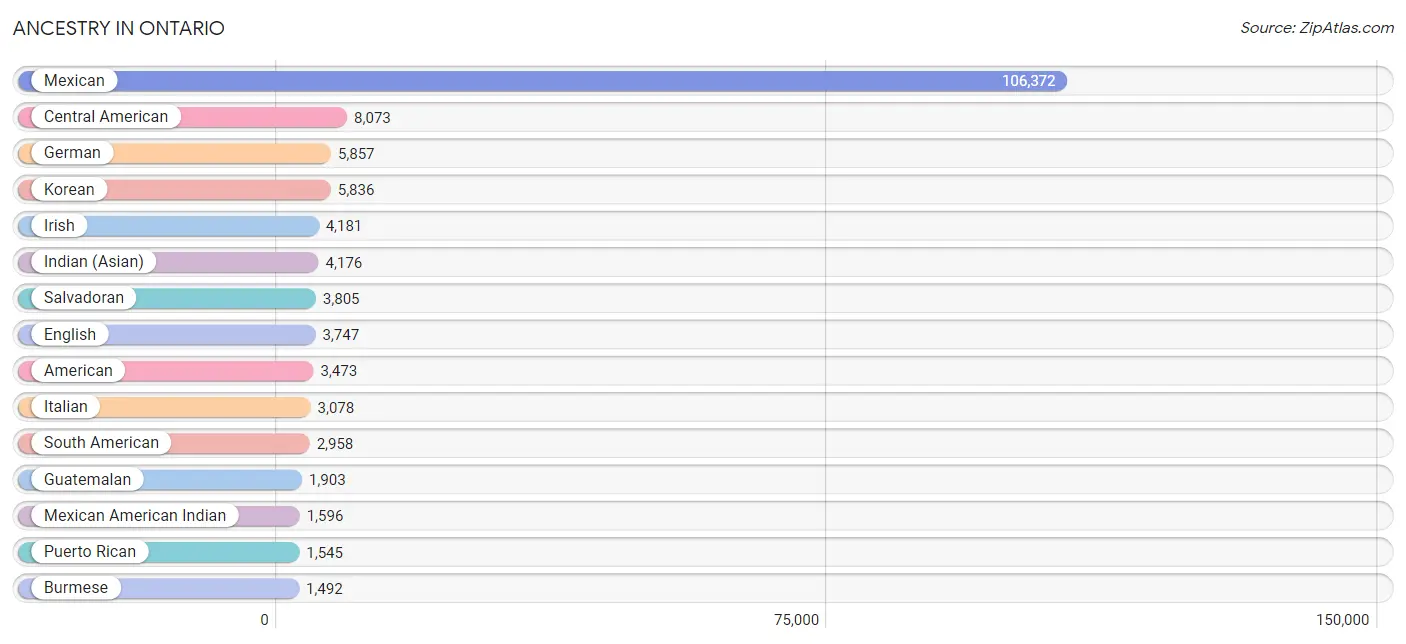
Ancestry in Ontario
The most populous ancestries reported in Ontario are Mexican (106,372 | 60.3%), Central American (8,073 | 4.6%), German (5,857 | 3.3%), Korean (5,836 | 3.3%), and Irish (4,181 | 2.4%), together accounting for 73.9% of all Ontario residents.
| Ancestry | # Population | % Population |
| Afghan | 67 | 0.0% |
| African | 771 | 0.4% |
| Aleut | 52 | 0.0% |
| American | 3,473 | 2.0% |
| Apache | 90 | 0.1% |
| Arab | 868 | 0.5% |
| Arapaho | 38 | 0.0% |
| Argentinean | 422 | 0.2% |
| Armenian | 402 | 0.2% |
| Assyrian / Chaldean / Syriac | 17 | 0.0% |
| Austrian | 88 | 0.1% |
| Bangladeshi | 120 | 0.1% |
| Barbadian | 36 | 0.0% |
| Basque | 129 | 0.1% |
| Belizean | 57 | 0.0% |
| Bhutanese | 547 | 0.3% |
| Bolivian | 153 | 0.1% |
| Brazilian | 49 | 0.0% |
| British | 353 | 0.2% |
| British West Indian | 29 | 0.0% |
| Burmese | 1,492 | 0.9% |
| Canadian | 125 | 0.1% |
| Cape Verdean | 8 | 0.0% |
| Celtic | 8 | 0.0% |
| Central American | 8,073 | 4.6% |
| Central American Indian | 300 | 0.2% |
| Cherokee | 500 | 0.3% |
| Chilean | 72 | 0.0% |
| Chippewa | 17 | 0.0% |
| Choctaw | 108 | 0.1% |
| Colombian | 703 | 0.4% |
| Comanche | 2 | 0.0% |
| Costa Rican | 145 | 0.1% |
| Creek | 75 | 0.0% |
| Croatian | 31 | 0.0% |
| Cuban | 1,002 | 0.6% |
| Czech | 85 | 0.1% |
| Czechoslovakian | 23 | 0.0% |
| Danish | 198 | 0.1% |
| Delaware | 13 | 0.0% |
| Dominican | 101 | 0.1% |
| Dutch | 1,348 | 0.8% |
| Eastern European | 64 | 0.0% |
| Ecuadorian | 376 | 0.2% |
| Egyptian | 401 | 0.2% |
| English | 3,747 | 2.1% |
| Ethiopian | 9 | 0.0% |
| European | 1,125 | 0.6% |
| Filipino | 393 | 0.2% |
| Finnish | 55 | 0.0% |
| French | 1,157 | 0.7% |
| French Canadian | 139 | 0.1% |
| German | 5,857 | 3.3% |
| Ghanaian | 140 | 0.1% |
| Greek | 59 | 0.0% |
| Guamanian / Chamorro | 3 | 0.0% |
| Guatemalan | 1,903 | 1.1% |
| Guyanese | 15 | 0.0% |
| Haitian | 8 | 0.0% |
| Honduran | 1,190 | 0.7% |
| Hungarian | 229 | 0.1% |
| Icelander | 7 | 0.0% |
| Indian (Asian) | 4,176 | 2.4% |
| Indonesian | 124 | 0.1% |
| Inupiat | 9 | 0.0% |
| Iranian | 29 | 0.0% |
| Irish | 4,181 | 2.4% |
| Iroquois | 52 | 0.0% |
| Israeli | 19 | 0.0% |
| Italian | 3,078 | 1.8% |
| Jamaican | 39 | 0.0% |
| Japanese | 406 | 0.2% |
| Jordanian | 15 | 0.0% |
| Kenyan | 22 | 0.0% |
| Korean | 5,836 | 3.3% |
| Laotian | 390 | 0.2% |
| Lebanese | 94 | 0.1% |
| Lithuanian | 28 | 0.0% |
| Luxembourger | 3 | 0.0% |
| Malaysian | 22 | 0.0% |
| Mexican | 106,372 | 60.3% |
| Mexican American Indian | 1,596 | 0.9% |
| Mongolian | 18 | 0.0% |
| Native Hawaiian | 528 | 0.3% |
| Navajo | 41 | 0.0% |
| Nicaraguan | 981 | 0.6% |
| Nigerian | 381 | 0.2% |
| Northern European | 35 | 0.0% |
| Norwegian | 548 | 0.3% |
| Osage | 22 | 0.0% |
| Pakistani | 168 | 0.1% |
| Palestinian | 161 | 0.1% |
| Panamanian | 49 | 0.0% |
| Paraguayan | 62 | 0.0% |
| Peruvian | 1,151 | 0.6% |
| Pima | 93 | 0.1% |
| Polish | 948 | 0.5% |
| Portuguese | 712 | 0.4% |
| Pueblo | 262 | 0.2% |
| Puerto Rican | 1,545 | 0.9% |
| Romanian | 52 | 0.0% |
| Russian | 136 | 0.1% |
| Salvadoran | 3,805 | 2.2% |
| Samoan | 203 | 0.1% |
| Scandinavian | 106 | 0.1% |
| Scotch-Irish | 512 | 0.3% |
| Scottish | 652 | 0.4% |
| Serbian | 111 | 0.1% |
| Sioux | 17 | 0.0% |
| Slovak | 84 | 0.1% |
| Slovene | 16 | 0.0% |
| South African | 105 | 0.1% |
| South American | 2,958 | 1.7% |
| South American Indian | 114 | 0.1% |
| Spaniard | 759 | 0.4% |
| Spanish | 416 | 0.2% |
| Spanish American | 14 | 0.0% |
| Spanish American Indian | 66 | 0.0% |
| Sri Lankan | 1,467 | 0.8% |
| Subsaharan African | 1,451 | 0.8% |
| Swedish | 597 | 0.3% |
| Swiss | 14 | 0.0% |
| Syrian | 24 | 0.0% |
| Thai | 948 | 0.5% |
| Tongan | 607 | 0.3% |
| Trinidadian and Tobagonian | 34 | 0.0% |
| Turkish | 7 | 0.0% |
| Ukrainian | 90 | 0.1% |
| Venezuelan | 19 | 0.0% |
| Welsh | 355 | 0.2% |
| West Indian | 59 | 0.0% |
| Yaqui | 38 | 0.0% |
| Zimbabwean | 1 | 0.0% | View All 133 Rows |
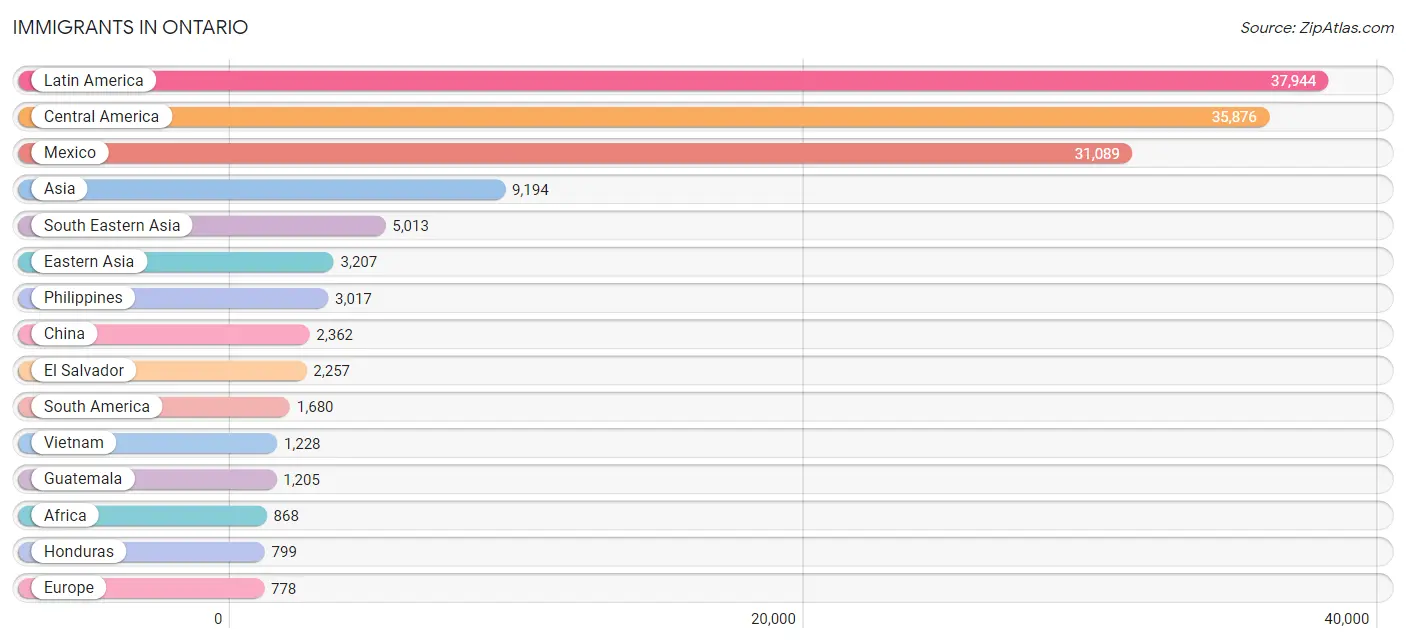
Immigrants in Ontario
The most numerous immigrant groups reported in Ontario came from Latin America (37,944 | 21.5%), Central America (35,876 | 20.3%), Mexico (31,089 | 17.6%), Asia (9,194 | 5.2%), and South Eastern Asia (5,013 | 2.8%), together accounting for 67.5% of all Ontario residents.
| Immigration Origin | # Population | % Population |
| Afghanistan | 43 | 0.0% |
| Africa | 868 | 0.5% |
| Argentina | 202 | 0.1% |
| Asia | 9,194 | 5.2% |
| Australia | 25 | 0.0% |
| Austria | 11 | 0.0% |
| Azores | 20 | 0.0% |
| Bangladesh | 6 | 0.0% |
| Belize | 74 | 0.0% |
| Brazil | 138 | 0.1% |
| Cambodia | 141 | 0.1% |
| Canada | 188 | 0.1% |
| Caribbean | 388 | 0.2% |
| Central America | 35,876 | 20.3% |
| Chile | 36 | 0.0% |
| China | 2,362 | 1.3% |
| Colombia | 350 | 0.2% |
| Costa Rica | 48 | 0.0% |
| Cuba | 341 | 0.2% |
| Denmark | 14 | 0.0% |
| Dominican Republic | 28 | 0.0% |
| Eastern Africa | 106 | 0.1% |
| Eastern Asia | 3,207 | 1.8% |
| Eastern Europe | 172 | 0.1% |
| Ecuador | 133 | 0.1% |
| Egypt | 290 | 0.2% |
| El Salvador | 2,257 | 1.3% |
| England | 79 | 0.0% |
| Ethiopia | 26 | 0.0% |
| Europe | 778 | 0.4% |
| France | 48 | 0.0% |
| Germany | 147 | 0.1% |
| Ghana | 110 | 0.1% |
| Guatemala | 1,205 | 0.7% |
| Guyana | 8 | 0.0% |
| Haiti | 8 | 0.0% |
| Honduras | 799 | 0.4% |
| Hong Kong | 243 | 0.1% |
| Hungary | 28 | 0.0% |
| India | 323 | 0.2% |
| Indonesia | 273 | 0.2% |
| Iran | 136 | 0.1% |
| Iraq | 27 | 0.0% |
| Italy | 8 | 0.0% |
| Japan | 114 | 0.1% |
| Jordan | 35 | 0.0% |
| Kenya | 22 | 0.0% |
| Korea | 722 | 0.4% |
| Kuwait | 7 | 0.0% |
| Laos | 24 | 0.0% |
| Latin America | 37,944 | 21.5% |
| Malaysia | 63 | 0.0% |
| Mexico | 31,089 | 17.6% |
| Morocco | 22 | 0.0% |
| Nepal | 56 | 0.0% |
| Netherlands | 85 | 0.1% |
| Nicaragua | 383 | 0.2% |
| Nigeria | 323 | 0.2% |
| Northern Africa | 321 | 0.2% |
| Northern Europe | 138 | 0.1% |
| Oceania | 37 | 0.0% |
| Pakistan | 75 | 0.0% |
| Panama | 19 | 0.0% |
| Peru | 639 | 0.4% |
| Philippines | 3,017 | 1.7% |
| Poland | 3 | 0.0% |
| Portugal | 63 | 0.0% |
| Romania | 9 | 0.0% |
| Russia | 33 | 0.0% |
| Saudi Arabia | 107 | 0.1% |
| Sierra Leone | 8 | 0.0% |
| South America | 1,680 | 0.9% |
| South Central Asia | 762 | 0.4% |
| South Eastern Asia | 5,013 | 2.8% |
| Southern Europe | 177 | 0.1% |
| Spain | 106 | 0.1% |
| Sri Lanka | 123 | 0.1% |
| Sweden | 11 | 0.0% |
| Taiwan | 471 | 0.3% |
| Thailand | 97 | 0.1% |
| Ukraine | 49 | 0.0% |
| Venezuela | 145 | 0.1% |
| Vietnam | 1,228 | 0.7% |
| Western Africa | 441 | 0.3% |
| Western Asia | 193 | 0.1% |
| Western Europe | 291 | 0.2% |
| Zimbabwe | 11 | 0.0% | View All 87 Rows |
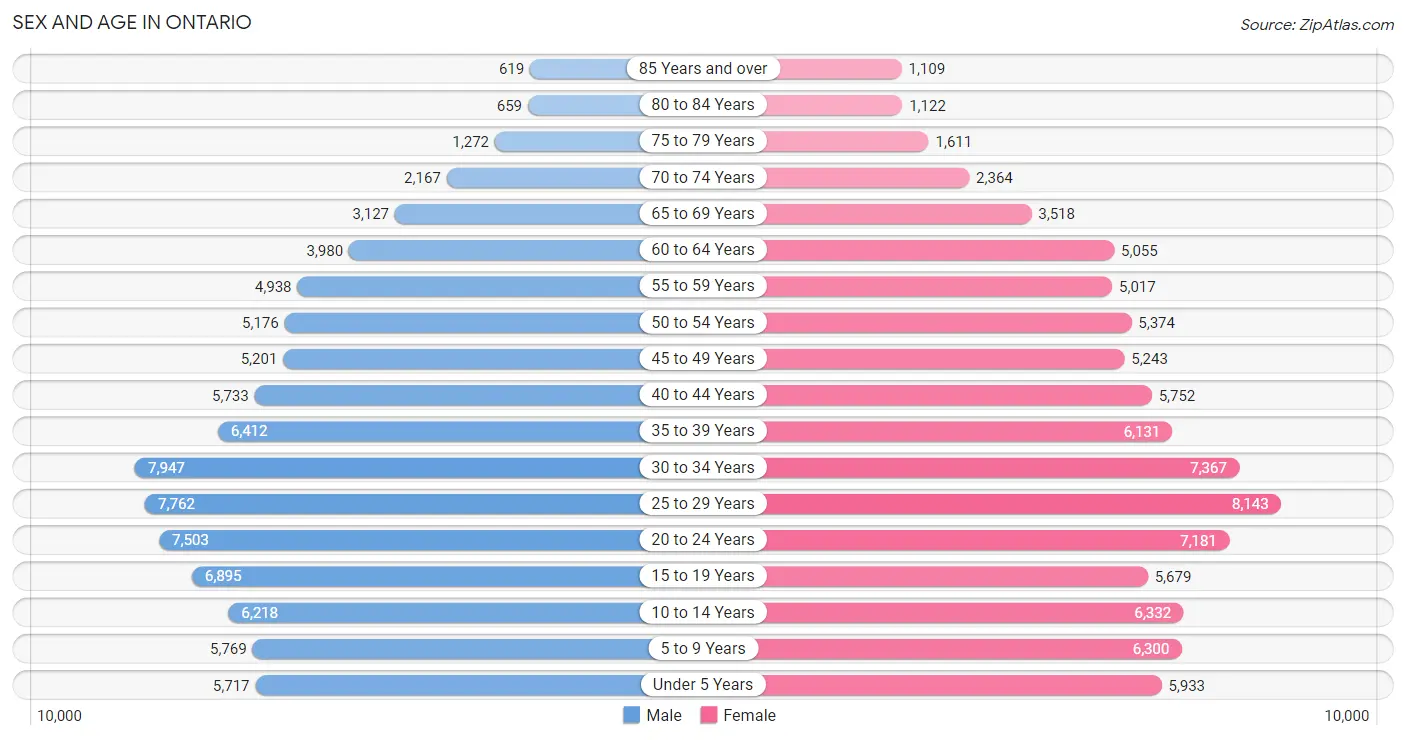
Sex and Age in Ontario
Sex and Age in Ontario
The most populous age groups in Ontario are 30 to 34 Years (7,947 | 9.1%) for men and 25 to 29 Years (8,143 | 9.1%) for women.
| Age Bracket | Male | Female |
| Under 5 Years | 5,717 (6.6%) | 5,933 (6.7%) |
| 5 to 9 Years | 5,769 (6.6%) | 6,300 (7.1%) |
| 10 to 14 Years | 6,218 (7.1%) | 6,332 (7.1%) |
| 15 to 19 Years | 6,895 (7.9%) | 5,679 (6.4%) |
| 20 to 24 Years | 7,503 (8.6%) | 7,181 (8.1%) |
| 25 to 29 Years | 7,762 (8.9%) | 8,143 (9.1%) |
| 30 to 34 Years | 7,947 (9.1%) | 7,367 (8.3%) |
| 35 to 39 Years | 6,412 (7.4%) | 6,131 (6.9%) |
| 40 to 44 Years | 5,733 (6.6%) | 5,752 (6.5%) |
| 45 to 49 Years | 5,201 (6.0%) | 5,243 (5.9%) |
| 50 to 54 Years | 5,176 (5.9%) | 5,374 (6.0%) |
| 55 to 59 Years | 4,938 (5.7%) | 5,017 (5.6%) |
| 60 to 64 Years | 3,980 (4.6%) | 5,055 (5.7%) |
| 65 to 69 Years | 3,127 (3.6%) | 3,518 (3.9%) |
| 70 to 74 Years | 2,167 (2.5%) | 2,364 (2.6%) |
| 75 to 79 Years | 1,272 (1.5%) | 1,611 (1.8%) |
| 80 to 84 Years | 659 (0.8%) | 1,122 (1.3%) |
| 85 Years and over | 619 (0.7%) | 1,109 (1.2%) |
| Total | 87,095 (100.0%) | 89,231 (100.0%) |
Families and Households in Ontario
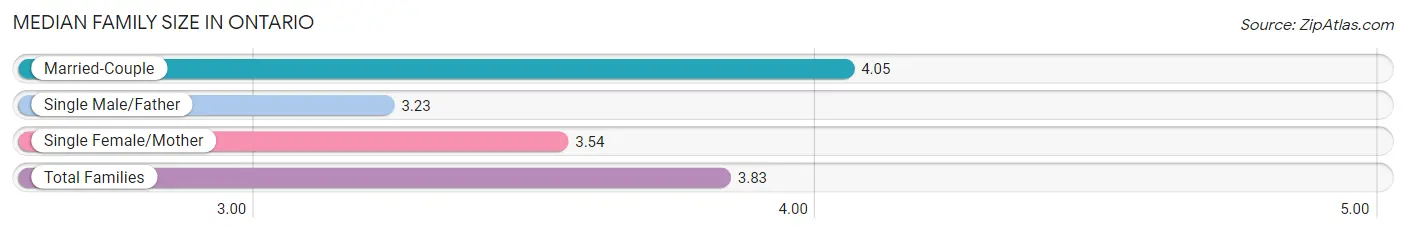
Median Family Size in Ontario
The median family size in Ontario is 3.83 persons per family, with married-couple families (25,398 | 63.7%) accounting for the largest median family size of 4.05 persons per family. On the other hand, single male/father families (5,024 | 12.6%) represent the smallest median family size with 3.23 persons per family.
| Family Type | # Families | Family Size |
| Married-Couple | 25,398 (63.7%) | 4.05 |
| Single Male/Father | 5,024 (12.6%) | 3.23 |
| Single Female/Mother | 9,466 (23.7%) | 3.54 |
| Total Families | 39,888 (100.0%) | 3.83 |
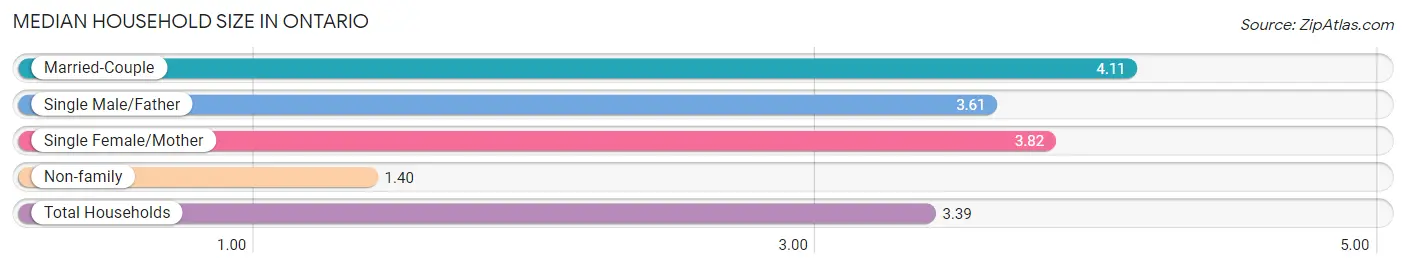
Median Household Size in Ontario
The median household size in Ontario is 3.39 persons per household, with married-couple households (25,398 | 49.1%) accounting for the largest median household size of 4.11 persons per household. non-family households (11,872 | 22.9%) represent the smallest median household size with 1.40 persons per household.
| Household Type | # Households | Household Size |
| Married-Couple | 25,398 (49.1%) | 4.11 |
| Single Male/Father | 5,024 (9.7%) | 3.61 |
| Single Female/Mother | 9,466 (18.3%) | 3.82 |
| Non-family | 11,872 (22.9%) | 1.40 |
| Total Households | 51,760 (100.0%) | 3.39 |
Household Size by Marriage Status in Ontario
Out of a total of 51,760 households in Ontario, 39,888 (77.1%) are family households, while 11,872 (22.9%) are nonfamily households. The most numerous type of family households are 2-person households, comprising 10,628, and the most common type of nonfamily households are 1-person households, comprising 8,695.
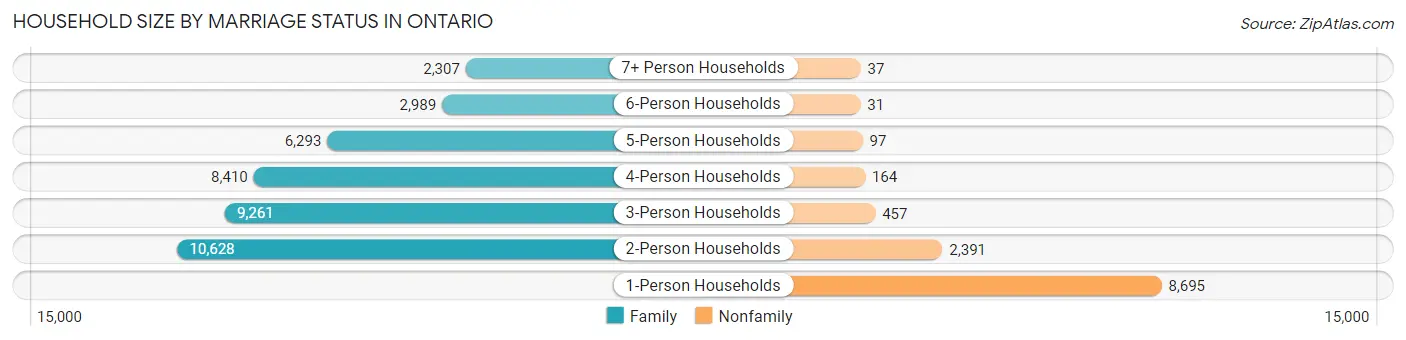
| Household Size | Family Households | Nonfamily Households |
| 1-Person Households | - | 8,695 (16.8%) |
| 2-Person Households | 10,628 (20.5%) | 2,391 (4.6%) |
| 3-Person Households | 9,261 (17.9%) | 457 (0.9%) |
| 4-Person Households | 8,410 (16.3%) | 164 (0.3%) |
| 5-Person Households | 6,293 (12.2%) | 97 (0.2%) |
| 6-Person Households | 2,989 (5.8%) | 31 (0.1%) |
| 7+ Person Households | 2,307 (4.5%) | 37 (0.1%) |
| Total | 39,888 (77.1%) | 11,872 (22.9%) |
Female Fertility in Ontario
Fertility by Age in Ontario
Average fertility rate in Ontario is 61.0 births per 1,000 women. Women in the age bracket of 20 to 34 years have the highest fertility rate with 94.0 births per 1,000 women. Women in the age bracket of 20 to 34 years acount for 74.9% of all women with births.
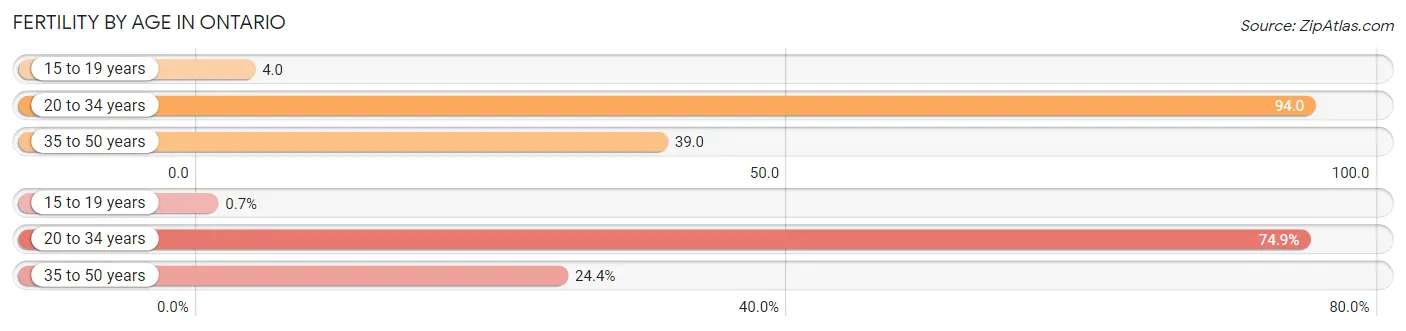
| Age Bracket | Women with Births | Births / 1,000 Women |
| 15 to 19 years | 20 (0.7%) | 4.0 |
| 20 to 34 years | 2,138 (74.9%) | 94.0 |
| 35 to 50 years | 698 (24.4%) | 39.0 |
| Total | 2,856 (100.0%) | 61.0 |
Fertility by Age by Marriage Status in Ontario
61.5% of women with births (2,856) in Ontario are married. The highest percentage of unmarried women with births falls into 15 to 19 years age bracket with 70.0% of them unmarried at the time of birth, while the lowest percentage of unmarried women with births belong to 35 to 50 years age bracket with 20.9% of them unmarried.
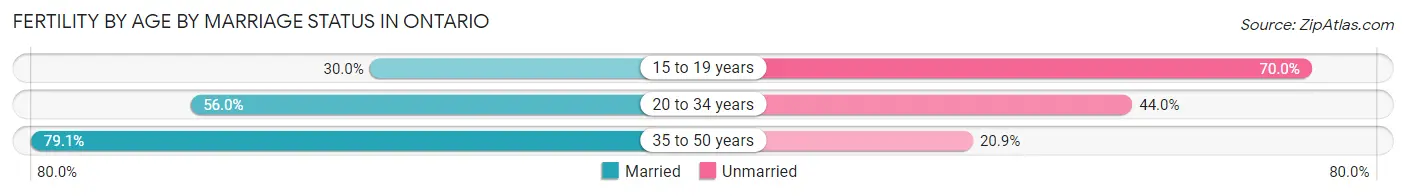
| Age Bracket | Married | Unmarried |
| 15 to 19 years | 6 (30.0%) | 14 (70.0%) |
| 20 to 34 years | 1,197 (56.0%) | 941 (44.0%) |
| 35 to 50 years | 552 (79.1%) | 146 (20.9%) |
| Total | 1,756 (61.5%) | 1,100 (38.5%) |
Fertility by Education in Ontario
Average fertility rate in Ontario is 61.0 births per 1,000 women. Women with the education attainment of high school diploma have the highest fertility rate of 72.0 births per 1,000 women, while women with the education attainment of less than high school have the lowest fertility at 43.0 births per 1,000 women. Women with the education attainment of college or associate's degree represent 35.9% of all women with births.
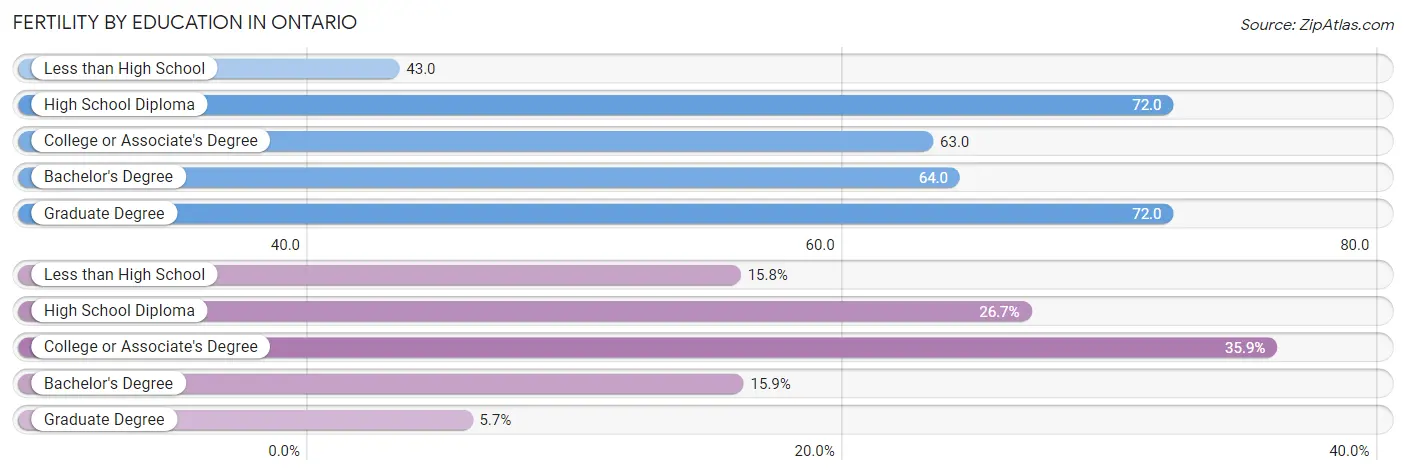
| Educational Attainment | Women with Births | Births / 1,000 Women |
| Less than High School | 451 (15.8%) | 43.0 |
| High School Diploma | 762 (26.7%) | 72.0 |
| College or Associate's Degree | 1,025 (35.9%) | 63.0 |
| Bachelor's Degree | 454 (15.9%) | 64.0 |
| Graduate Degree | 164 (5.7%) | 72.0 |
| Total | 2,856 (100.0%) | 61.0 |
Fertility by Education by Marriage Status in Ontario
38.5% of women with births in Ontario are unmarried. Women with the educational attainment of graduate degree are most likely to be married with 100.0% of them married at childbirth, while women with the educational attainment of high school diploma are least likely to be married with 47.4% of them unmarried at childbirth.
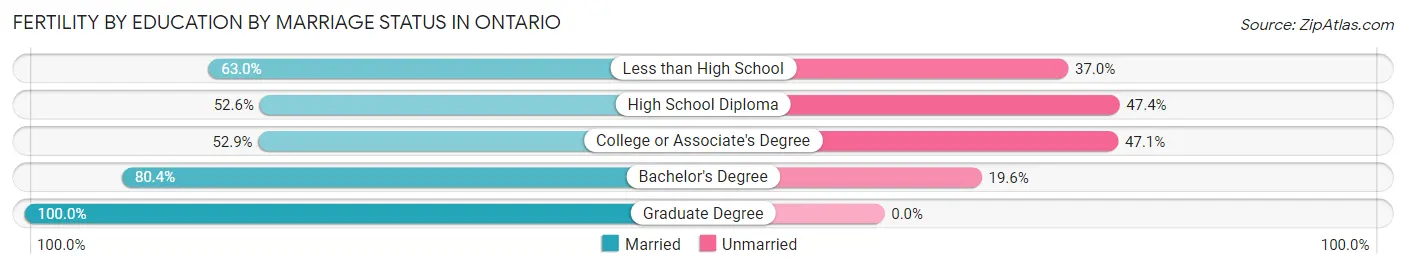
| Educational Attainment | Married | Unmarried |
| Less than High School | 284 (63.0%) | 167 (37.0%) |
| High School Diploma | 401 (52.6%) | 361 (47.4%) |
| College or Associate's Degree | 542 (52.9%) | 483 (47.1%) |
| Bachelor's Degree | 365 (80.4%) | 89 (19.6%) |
| Graduate Degree | 164 (100.0%) | 0 (0.0%) |
| Total | 1,756 (61.5%) | 1,100 (38.5%) |
Employment Characteristics in Ontario
Employment by Class of Employer in Ontario
Among the 84,008 employed individuals in Ontario, private company employees (61,961 | 73.8%), local government employees (6,333 | 7.5%), and not-for-profit organizations (5,518 | 6.6%) make up the most common classes of employment.
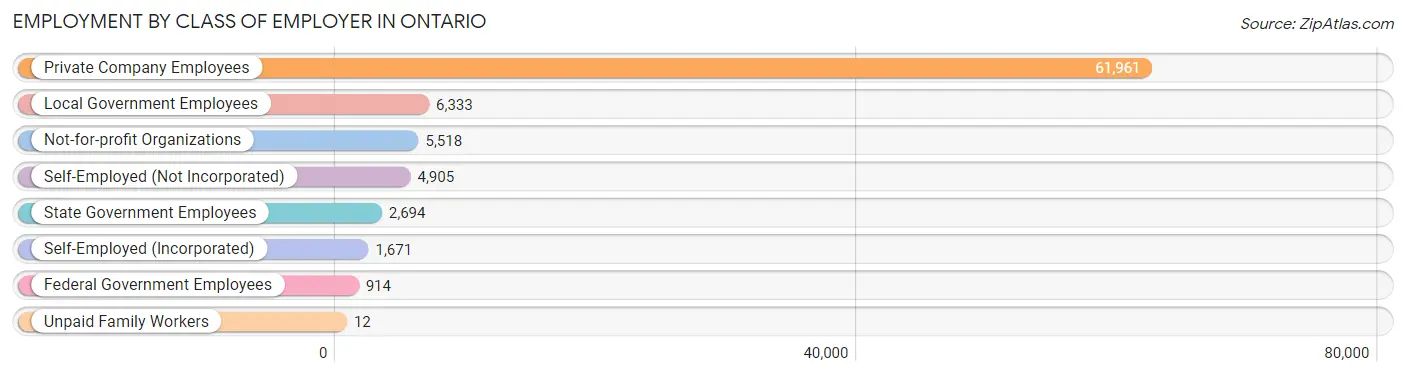
| Employer Class | # Employees | % Employees |
| Private Company Employees | 61,961 | 73.8% |
| Self-Employed (Incorporated) | 1,671 | 2.0% |
| Self-Employed (Not Incorporated) | 4,905 | 5.8% |
| Not-for-profit Organizations | 5,518 | 6.6% |
| Local Government Employees | 6,333 | 7.5% |
| State Government Employees | 2,694 | 3.2% |
| Federal Government Employees | 914 | 1.1% |
| Unpaid Family Workers | 12 | 0.0% |
| Total | 84,008 | 100.0% |
Employment Status by Age in Ontario
According to the labor force statistics for Ontario, out of the total population over 16 years of age (137,722), 66.6% or 91,723 individuals are in the labor force, with 5.8% or 5,320 of them unemployed. The age group with the highest labor force participation rate is 35 to 44 years, with 82.3% or 19,775 individuals in the labor force. Within the labor force, the 16 to 19 years age range has the highest percentage of unemployed individuals, with 19.2% or 678 of them being unemployed.
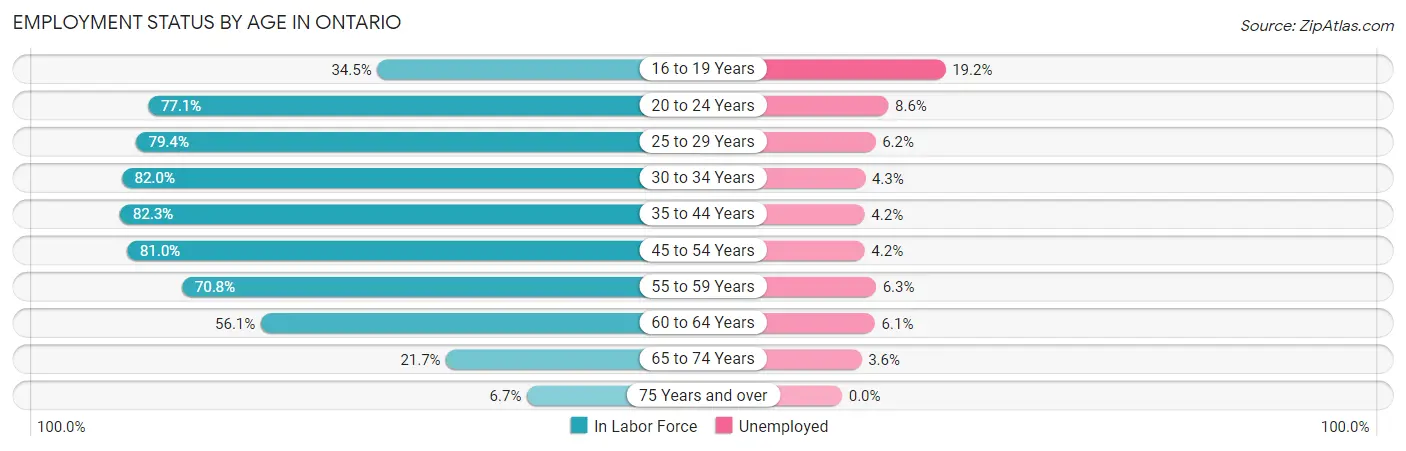
| Age Bracket | In Labor Force | Unemployed |
| 16 to 19 Years | 3,532 (34.5%) | 678 (19.2%) |
| 20 to 24 Years | 11,321 (77.1%) | 974 (8.6%) |
| 25 to 29 Years | 12,629 (79.4%) | 783 (6.2%) |
| 30 to 34 Years | 12,557 (82.0%) | 540 (4.3%) |
| 35 to 44 Years | 19,775 (82.3%) | 831 (4.2%) |
| 45 to 54 Years | 17,005 (81.0%) | 714 (4.2%) |
| 55 to 59 Years | 7,048 (70.8%) | 444 (6.3%) |
| 60 to 64 Years | 5,069 (56.1%) | 309 (6.1%) |
| 65 to 74 Years | 2,425 (21.7%) | 87 (3.6%) |
| 75 Years and over | 428 (6.7%) | 0 (0.0%) |
| Total | 91,723 (66.6%) | 5,320 (5.8%) |
Employment Status by Educational Attainment in Ontario
According to labor force statistics for Ontario, 77.8% of individuals (74,090) out of the total population between 25 and 64 years of age (95,231) are in the labor force, with 4.9% or 3,630 of them being unemployed. The group with the highest labor force participation rate are those with the educational attainment of bachelor's degree or higher, with 86.7% or 16,302 individuals in the labor force. Within the labor force, individuals with less than high school education have the highest percentage of unemployment, with 7.0% or 1,029 of them being unemployed.
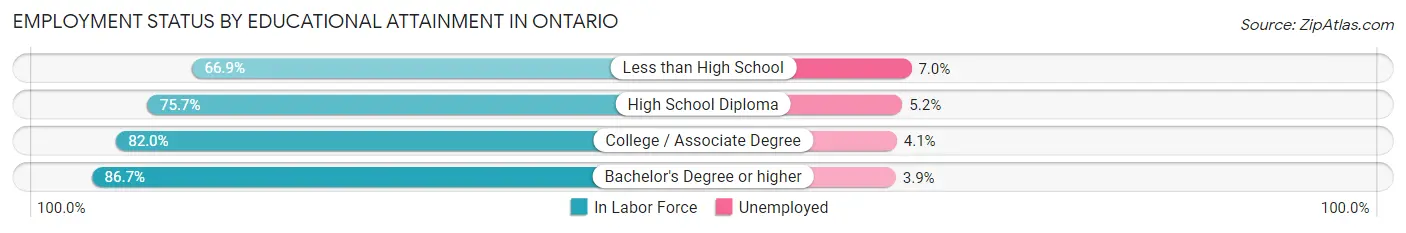
| Educational Attainment | In Labor Force | Unemployed |
| Less than High School | 14,703 (66.9%) | 1,538 (7.0%) |
| High School Diploma | 18,972 (75.7%) | 1,303 (5.2%) |
| College / Associate Degree | 24,098 (82.0%) | 1,205 (4.1%) |
| Bachelor's Degree or higher | 16,302 (86.7%) | 733 (3.9%) |
| Total | 74,090 (77.8%) | 4,666 (4.9%) |
Employment Occupations by Sex in Ontario
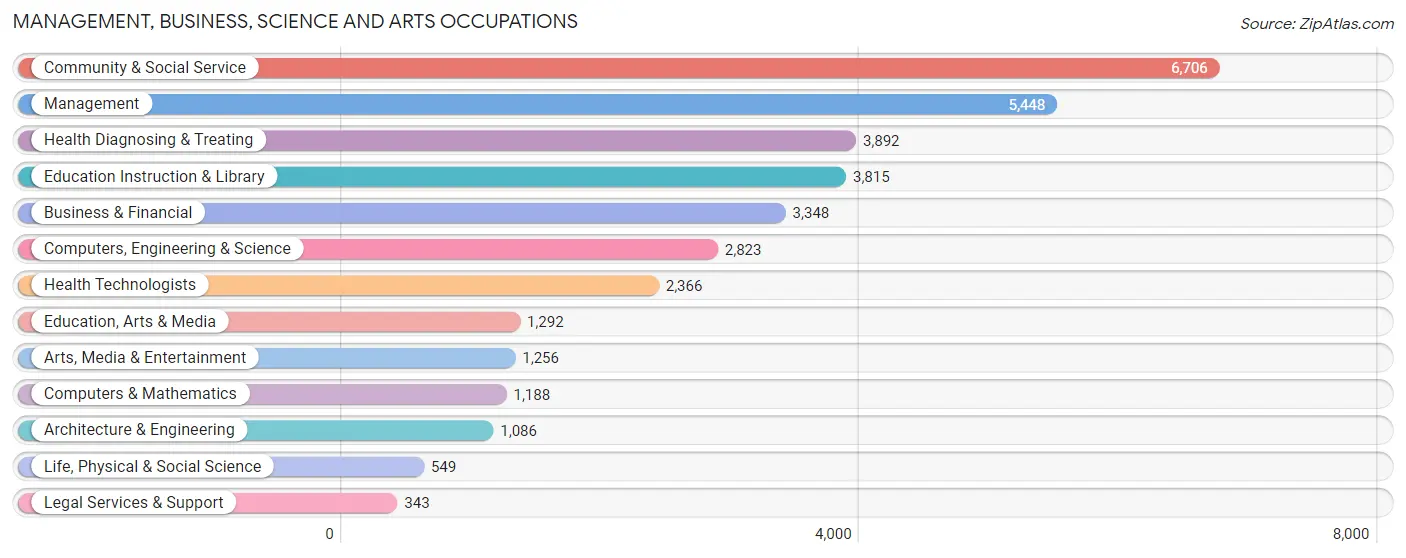
Management, Business, Science and Arts Occupations
The most common Management, Business, Science and Arts occupations in Ontario are Community & Social Service (6,706 | 7.8%), Management (5,448 | 6.3%), Health Diagnosing & Treating (3,892 | 4.5%), Education Instruction & Library (3,815 | 4.4%), and Business & Financial (3,348 | 3.9%).
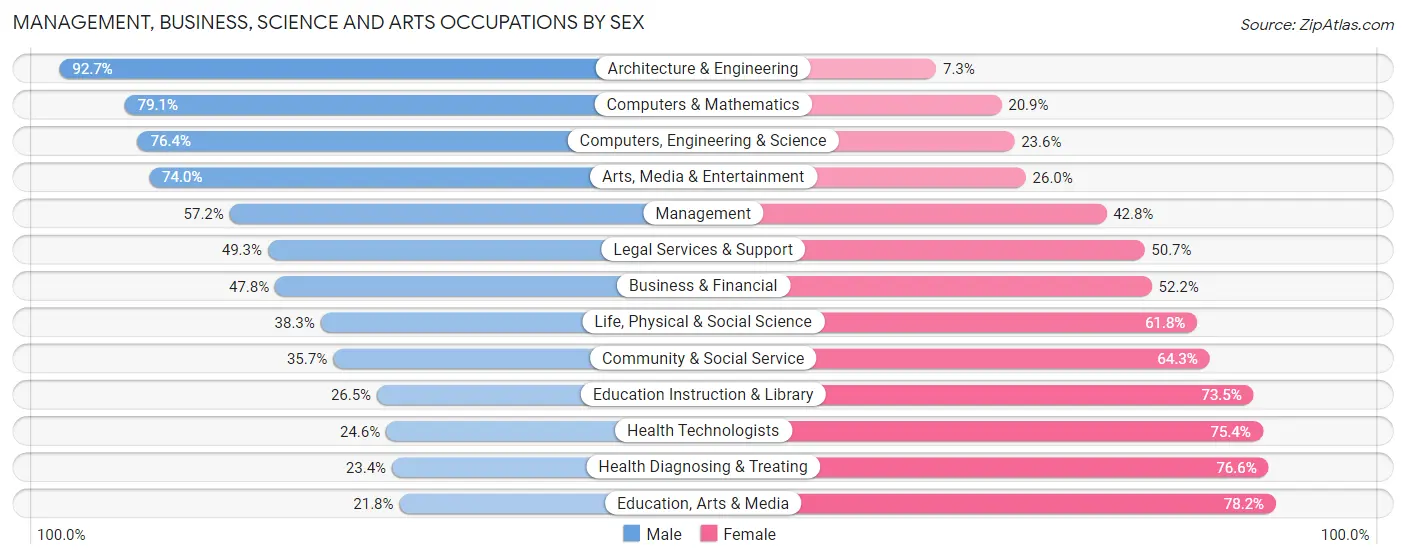
Management, Business, Science and Arts Occupations by Sex
Within the Management, Business, Science and Arts occupations in Ontario, the most male-oriented occupations are Architecture & Engineering (92.7%), Computers & Mathematics (79.1%), and Computers, Engineering & Science (76.4%), while the most female-oriented occupations are Education, Arts & Media (78.2%), Health Diagnosing & Treating (76.6%), and Health Technologists (75.4%).
| Occupation | Male | Female |
| Management | 3,118 (57.2%) | 2,330 (42.8%) |
| Business & Financial | 1,599 (47.8%) | 1,749 (52.2%) |
| Computers, Engineering & Science | 2,157 (76.4%) | 666 (23.6%) |
| Computers & Mathematics | 940 (79.1%) | 248 (20.9%) |
| Architecture & Engineering | 1,007 (92.7%) | 79 (7.3%) |
| Life, Physical & Social Science | 210 (38.3%) | 339 (61.8%) |
| Community & Social Service | 2,392 (35.7%) | 4,314 (64.3%) |
| Education, Arts & Media | 282 (21.8%) | 1,010 (78.2%) |
| Legal Services & Support | 169 (49.3%) | 174 (50.7%) |
| Education Instruction & Library | 1,011 (26.5%) | 2,804 (73.5%) |
| Arts, Media & Entertainment | 930 (74.0%) | 326 (26.0%) |
| Health Diagnosing & Treating | 910 (23.4%) | 2,982 (76.6%) |
| Health Technologists | 582 (24.6%) | 1,784 (75.4%) |
| Total (Category) | 10,176 (45.8%) | 12,041 (54.2%) |
| Total (Overall) | 47,697 (55.2%) | 38,709 (44.8%) |
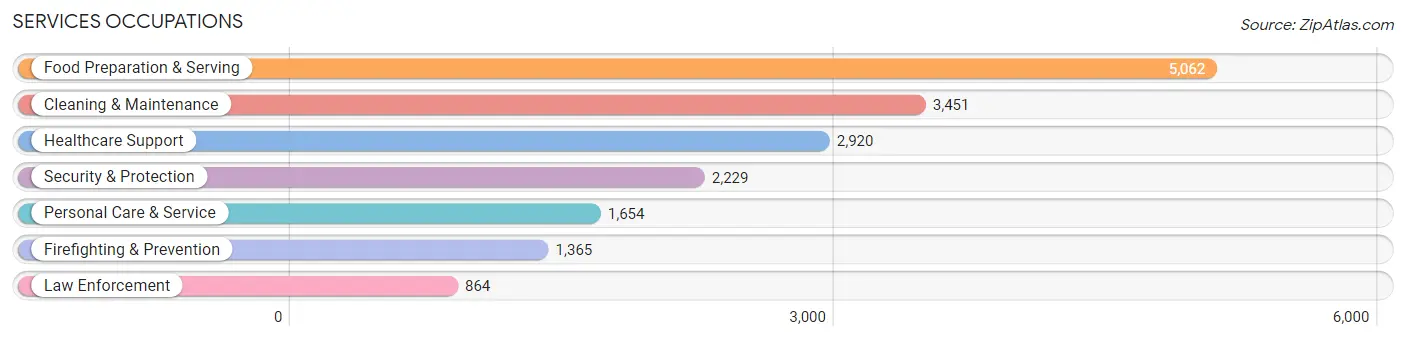
Services Occupations
The most common Services occupations in Ontario are Food Preparation & Serving (5,062 | 5.9%), Cleaning & Maintenance (3,451 | 4.0%), Healthcare Support (2,920 | 3.4%), Security & Protection (2,229 | 2.6%), and Personal Care & Service (1,654 | 1.9%).
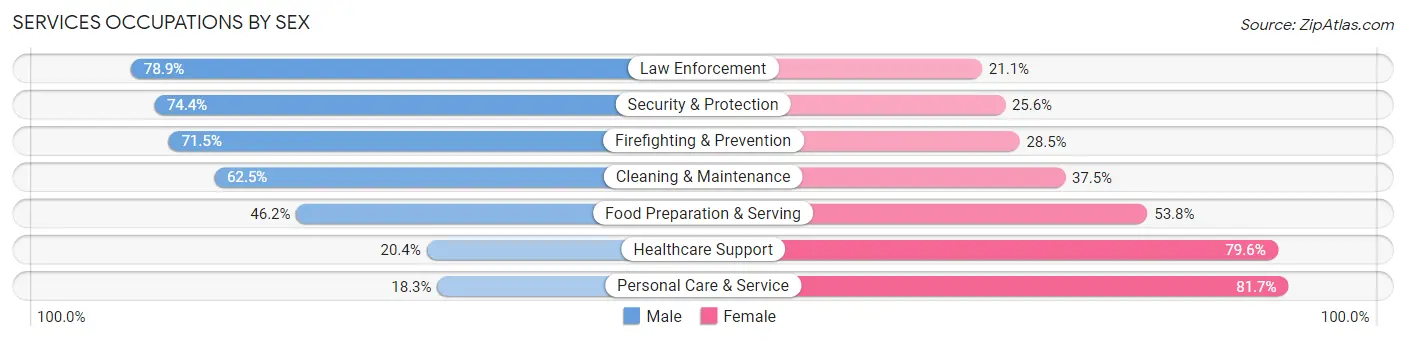
Services Occupations by Sex
Within the Services occupations in Ontario, the most male-oriented occupations are Law Enforcement (78.9%), Security & Protection (74.4%), and Firefighting & Prevention (71.5%), while the most female-oriented occupations are Personal Care & Service (81.7%), Healthcare Support (79.6%), and Food Preparation & Serving (53.8%).
| Occupation | Male | Female |
| Healthcare Support | 596 (20.4%) | 2,324 (79.6%) |
| Security & Protection | 1,658 (74.4%) | 571 (25.6%) |
| Firefighting & Prevention | 976 (71.5%) | 389 (28.5%) |
| Law Enforcement | 682 (78.9%) | 182 (21.1%) |
| Food Preparation & Serving | 2,338 (46.2%) | 2,724 (53.8%) |
| Cleaning & Maintenance | 2,157 (62.5%) | 1,294 (37.5%) |
| Personal Care & Service | 302 (18.3%) | 1,352 (81.7%) |
| Total (Category) | 7,051 (46.0%) | 8,265 (54.0%) |
| Total (Overall) | 47,697 (55.2%) | 38,709 (44.8%) |
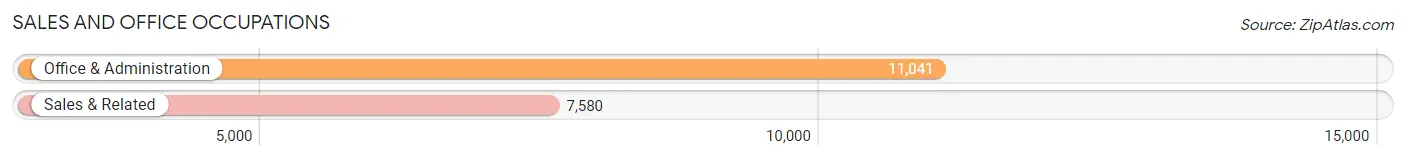
Sales and Office Occupations
The most common Sales and Office occupations in Ontario are Office & Administration (11,041 | 12.8%), and Sales & Related (7,580 | 8.8%).
Sales and Office Occupations by Sex
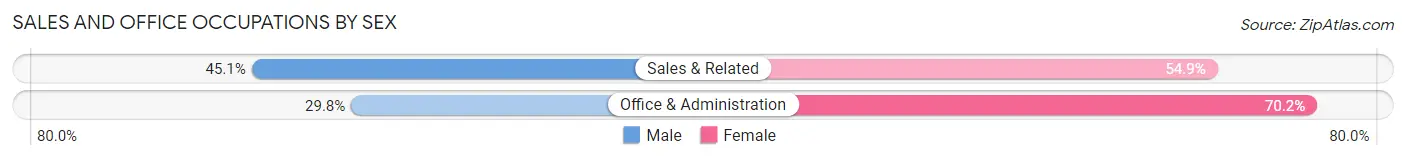
| Occupation | Male | Female |
| Sales & Related | 3,418 (45.1%) | 4,162 (54.9%) |
| Office & Administration | 3,287 (29.8%) | 7,754 (70.2%) |
| Total (Category) | 6,705 (36.0%) | 11,916 (64.0%) |
| Total (Overall) | 47,697 (55.2%) | 38,709 (44.8%) |
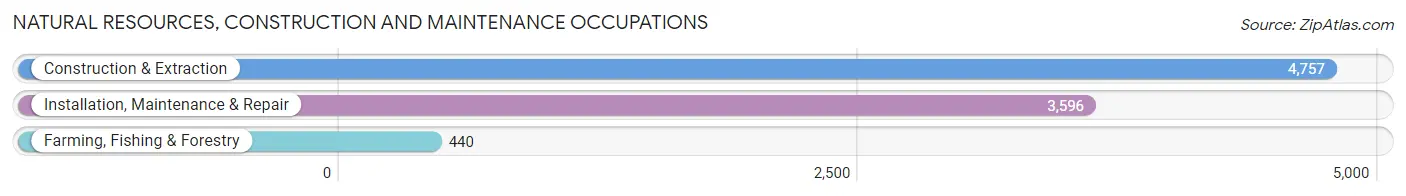
Natural Resources, Construction and Maintenance Occupations
The most common Natural Resources, Construction and Maintenance occupations in Ontario are Construction & Extraction (4,757 | 5.5%), Installation, Maintenance & Repair (3,596 | 4.2%), and Farming, Fishing & Forestry (440 | 0.5%).
Natural Resources, Construction and Maintenance Occupations by Sex
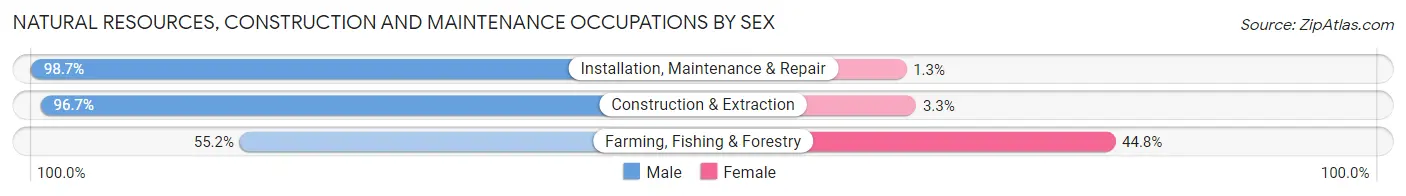
| Occupation | Male | Female |
| Farming, Fishing & Forestry | 243 (55.2%) | 197 (44.8%) |
| Construction & Extraction | 4,598 (96.7%) | 159 (3.3%) |
| Installation, Maintenance & Repair | 3,549 (98.7%) | 47 (1.3%) |
| Total (Category) | 8,390 (95.4%) | 403 (4.6%) |
| Total (Overall) | 47,697 (55.2%) | 38,709 (44.8%) |
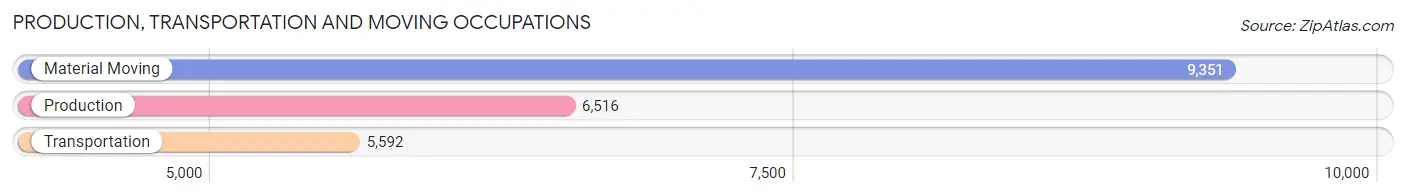
Production, Transportation and Moving Occupations
The most common Production, Transportation and Moving occupations in Ontario are Material Moving (9,351 | 10.8%), Production (6,516 | 7.5%), and Transportation (5,592 | 6.5%).
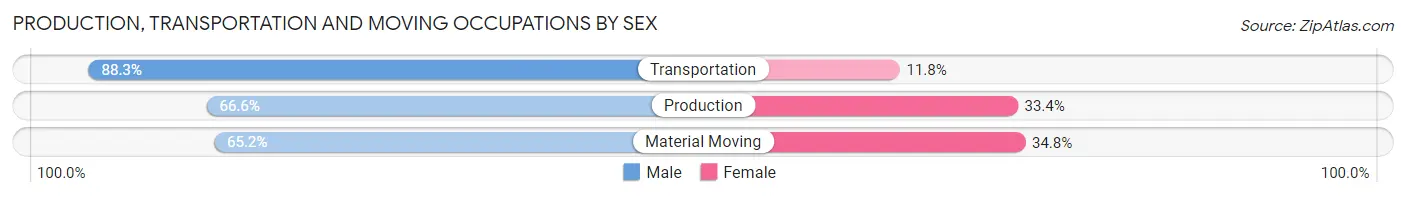
Production, Transportation and Moving Occupations by Sex
| Occupation | Male | Female |
| Production | 4,340 (66.6%) | 2,176 (33.4%) |
| Transportation | 4,935 (88.2%) | 657 (11.7%) |
| Material Moving | 6,100 (65.2%) | 3,251 (34.8%) |
| Total (Category) | 15,375 (71.7%) | 6,084 (28.3%) |
| Total (Overall) | 47,697 (55.2%) | 38,709 (44.8%) |
Employment Industries by Sex in Ontario
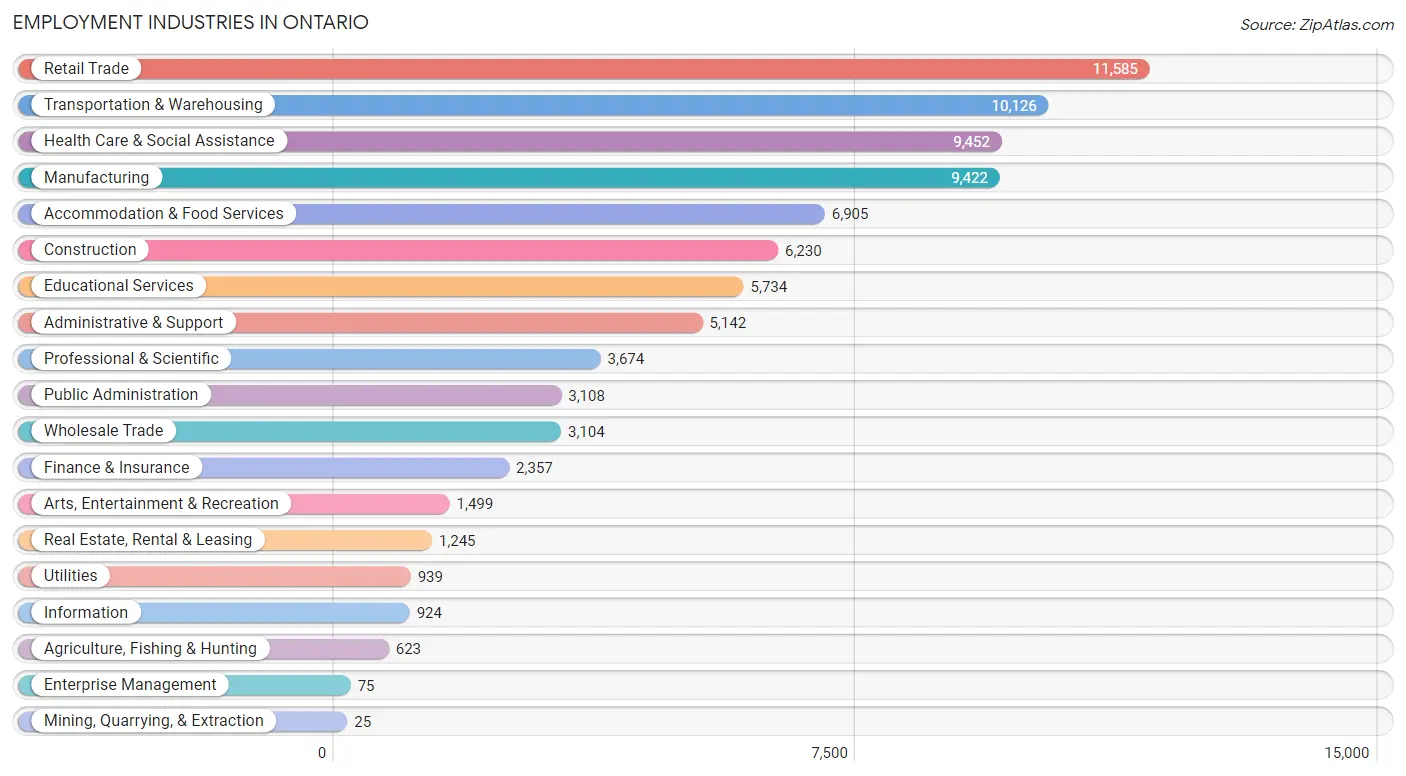
Employment Industries in Ontario
The major employment industries in Ontario include Retail Trade (11,585 | 13.4%), Transportation & Warehousing (10,126 | 11.7%), Health Care & Social Assistance (9,452 | 10.9%), Manufacturing (9,422 | 10.9%), and Accommodation & Food Services (6,905 | 8.0%).
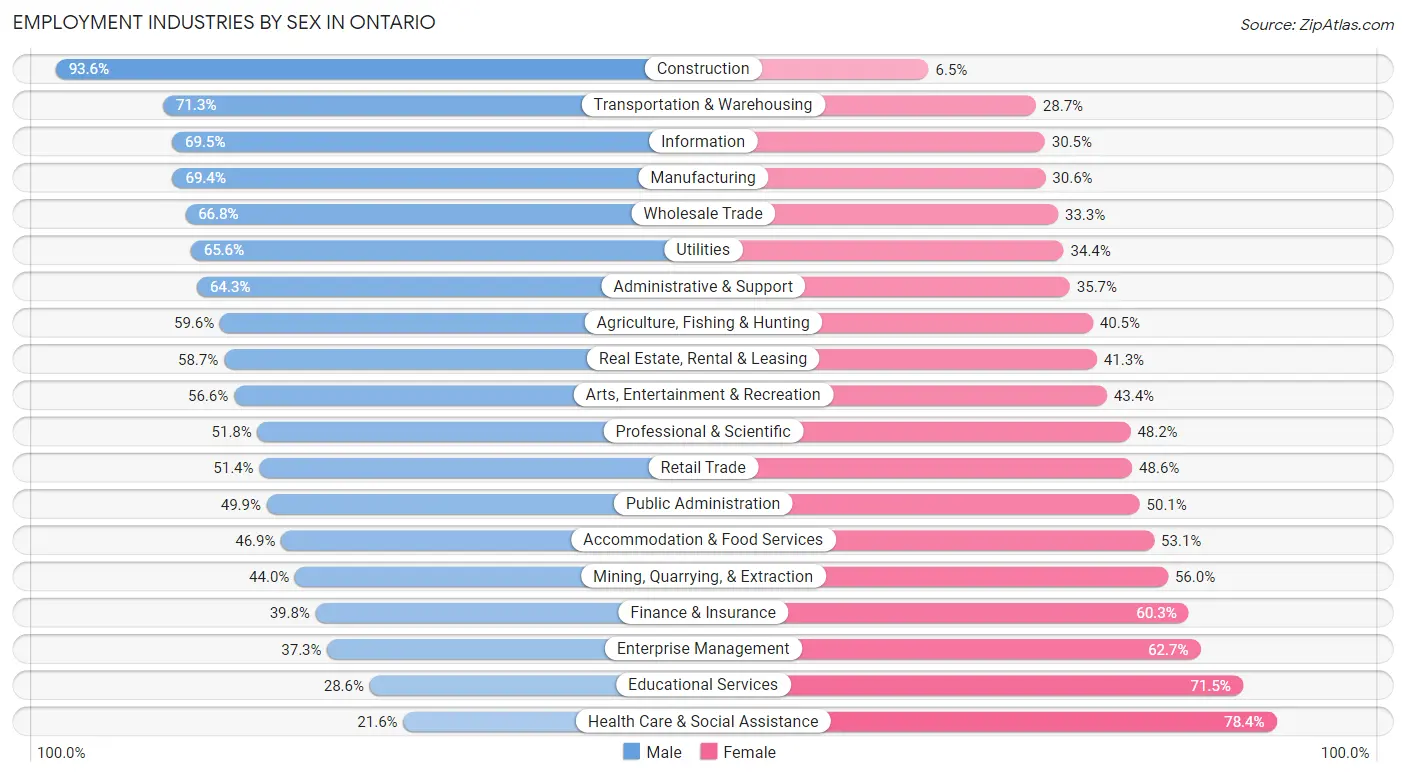
Employment Industries by Sex in Ontario
The Ontario industries that see more men than women are Construction (93.5%), Transportation & Warehousing (71.3%), and Information (69.5%), whereas the industries that tend to have a higher number of women are Health Care & Social Assistance (78.4%), Educational Services (71.5%), and Enterprise Management (62.7%).
| Industry | Male | Female |
| Agriculture, Fishing & Hunting | 371 (59.6%) | 252 (40.5%) |
| Mining, Quarrying, & Extraction | 11 (44.0%) | 14 (56.0%) |
| Construction | 5,828 (93.5%) | 402 (6.5%) |
| Manufacturing | 6,536 (69.4%) | 2,886 (30.6%) |
| Wholesale Trade | 2,072 (66.7%) | 1,032 (33.3%) |
| Retail Trade | 5,956 (51.4%) | 5,629 (48.6%) |
| Transportation & Warehousing | 7,224 (71.3%) | 2,902 (28.7%) |
| Utilities | 616 (65.6%) | 323 (34.4%) |
| Information | 642 (69.5%) | 282 (30.5%) |
| Finance & Insurance | 937 (39.8%) | 1,420 (60.3%) |
| Real Estate, Rental & Leasing | 731 (58.7%) | 514 (41.3%) |
| Professional & Scientific | 1,902 (51.8%) | 1,772 (48.2%) |
| Enterprise Management | 28 (37.3%) | 47 (62.7%) |
| Administrative & Support | 3,307 (64.3%) | 1,835 (35.7%) |
| Educational Services | 1,637 (28.5%) | 4,097 (71.5%) |
| Health Care & Social Assistance | 2,041 (21.6%) | 7,411 (78.4%) |
| Arts, Entertainment & Recreation | 849 (56.6%) | 650 (43.4%) |
| Accommodation & Food Services | 3,236 (46.9%) | 3,669 (53.1%) |
| Public Administration | 1,550 (49.9%) | 1,558 (50.1%) |
| Total | 47,697 (55.2%) | 38,709 (44.8%) |
Education in Ontario
School Enrollment in Ontario
The most common levels of schooling among the 49,850 students in Ontario are college / undergraduate (12,505 | 25.1%), high school (11,028 | 22.1%), and middle school (9,685 | 19.4%).
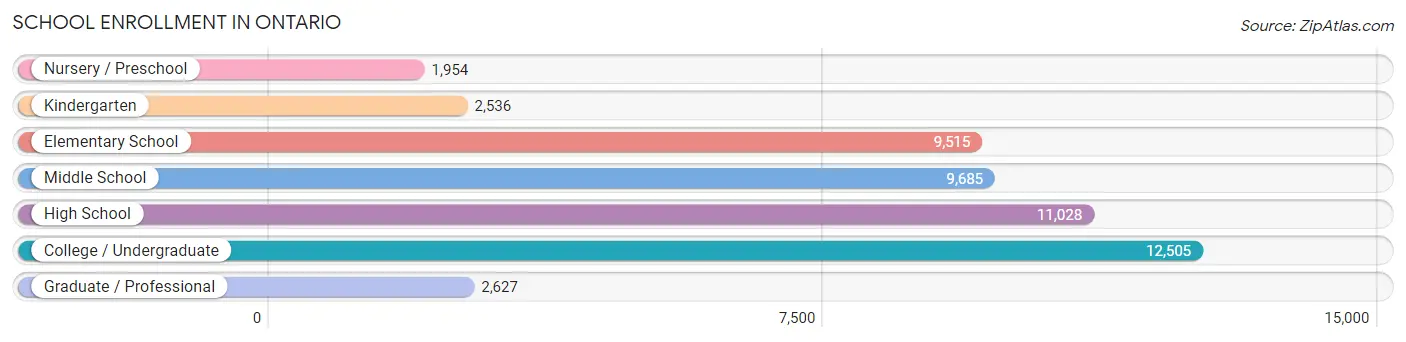
| School Level | # Students | % Students |
| Nursery / Preschool | 1,954 | 3.9% |
| Kindergarten | 2,536 | 5.1% |
| Elementary School | 9,515 | 19.1% |
| Middle School | 9,685 | 19.4% |
| High School | 11,028 | 22.1% |
| College / Undergraduate | 12,505 | 25.1% |
| Graduate / Professional | 2,627 | 5.3% |
| Total | 49,850 | 100.0% |
School Enrollment by Age by Funding Source in Ontario
Out of a total of 49,850 students who are enrolled in schools in Ontario, 5,035 (10.1%) attend a private institution, while the remaining 44,815 (89.9%) are enrolled in public schools. The age group of 35 years and over has the highest likelihood of being enrolled in private schools, with 724 (27.5% in the age bracket) enrolled. Conversely, the age group of 15 to 17 year olds has the lowest likelihood of being enrolled in a private school, with 7,143 (96.6% in the age bracket) attending a public institution.
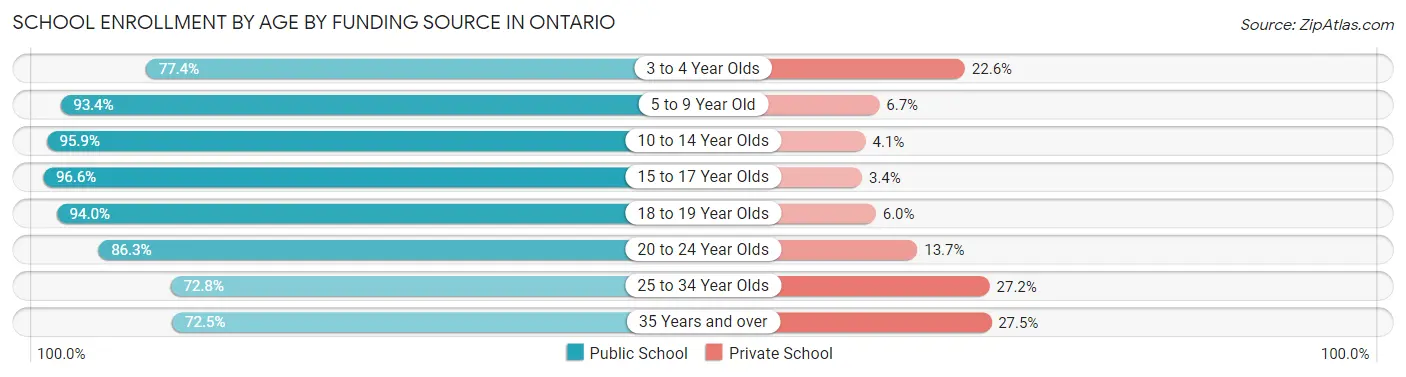
| Age Bracket | Public School | Private School |
| 3 to 4 Year Olds | 1,169 (77.4%) | 341 (22.6%) |
| 5 to 9 Year Old | 10,811 (93.3%) | 770 (6.7%) |
| 10 to 14 Year Olds | 11,862 (95.9%) | 504 (4.1%) |
| 15 to 17 Year Olds | 7,143 (96.6%) | 253 (3.4%) |
| 18 to 19 Year Olds | 2,956 (94.0%) | 188 (6.0%) |
| 20 to 24 Year Olds | 5,076 (86.3%) | 807 (13.7%) |
| 25 to 34 Year Olds | 3,885 (72.8%) | 1,450 (27.2%) |
| 35 Years and over | 1,911 (72.5%) | 724 (27.5%) |
| Total | 44,815 (89.9%) | 5,035 (10.1%) |
Educational Attainment by Field of Study in Ontario
Business (4,768 | 20.7%), science & technology (2,578 | 11.2%), arts & humanities (2,181 | 9.5%), social sciences (1,847 | 8.0%), and education (1,544 | 6.7%) are the most common fields of study among 22,995 individuals in Ontario who have obtained a bachelor's degree or higher.
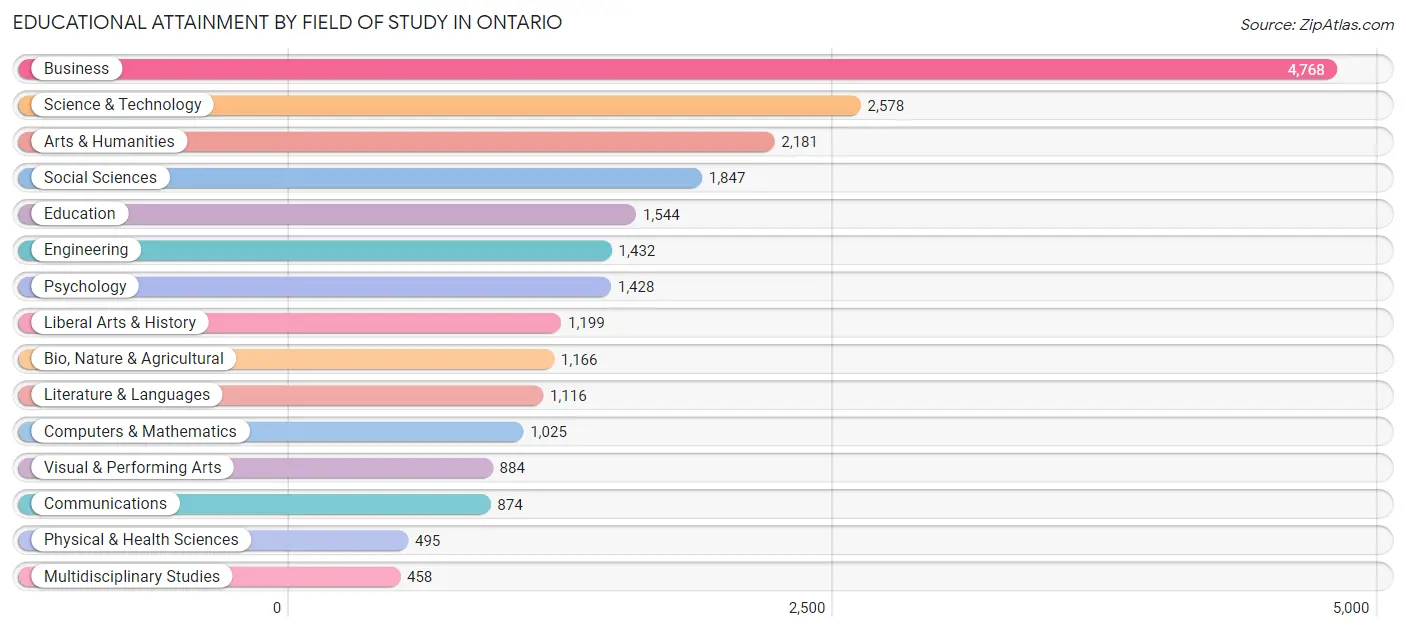
| Field of Study | # Graduates | % Graduates |
| Computers & Mathematics | 1,025 | 4.5% |
| Bio, Nature & Agricultural | 1,166 | 5.1% |
| Physical & Health Sciences | 495 | 2.1% |
| Psychology | 1,428 | 6.2% |
| Social Sciences | 1,847 | 8.0% |
| Engineering | 1,432 | 6.2% |
| Multidisciplinary Studies | 458 | 2.0% |
| Science & Technology | 2,578 | 11.2% |
| Business | 4,768 | 20.7% |
| Education | 1,544 | 6.7% |
| Literature & Languages | 1,116 | 4.9% |
| Liberal Arts & History | 1,199 | 5.2% |
| Visual & Performing Arts | 884 | 3.8% |
| Communications | 874 | 3.8% |
| Arts & Humanities | 2,181 | 9.5% |
| Total | 22,995 | 100.0% |
Transportation & Commute in Ontario
Vehicle Availability by Sex in Ontario
The most prevalent vehicle ownership categories in Ontario are males with 2 vehicles (15,907, accounting for 34.3%) and females with 2 vehicles (12,958, making up 42.4%).
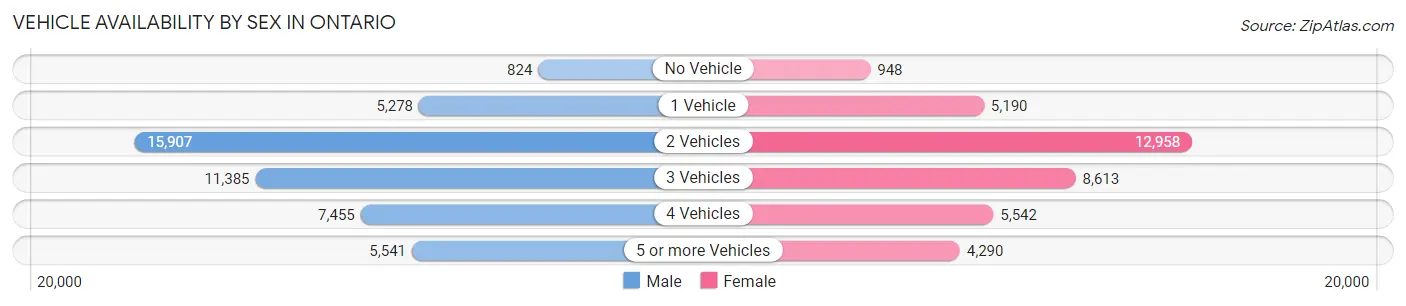
| Vehicles Available | Male | Female |
| No Vehicle | 824 (1.8%) | 948 (2.5%) |
| 1 Vehicle | 5,278 (11.4%) | 5,190 (13.8%) |
| 2 Vehicles | 15,907 (34.3%) | 12,958 (34.5%) |
| 3 Vehicles | 11,385 (24.5%) | 8,613 (22.9%) |
| 4 Vehicles | 7,455 (16.1%) | 5,542 (14.8%) |
| 5 or more Vehicles | 5,541 (11.9%) | 4,290 (11.4%) |
| Total | 46,390 (100.0%) | 37,541 (100.0%) |
Commute Time in Ontario
The most frequently occuring commute durations in Ontario are 20 to 24 minutes (12,350 commuters, 15.7%), 15 to 19 minutes (12,213 commuters, 15.5%), and 30 to 34 minutes (10,710 commuters, 13.6%).
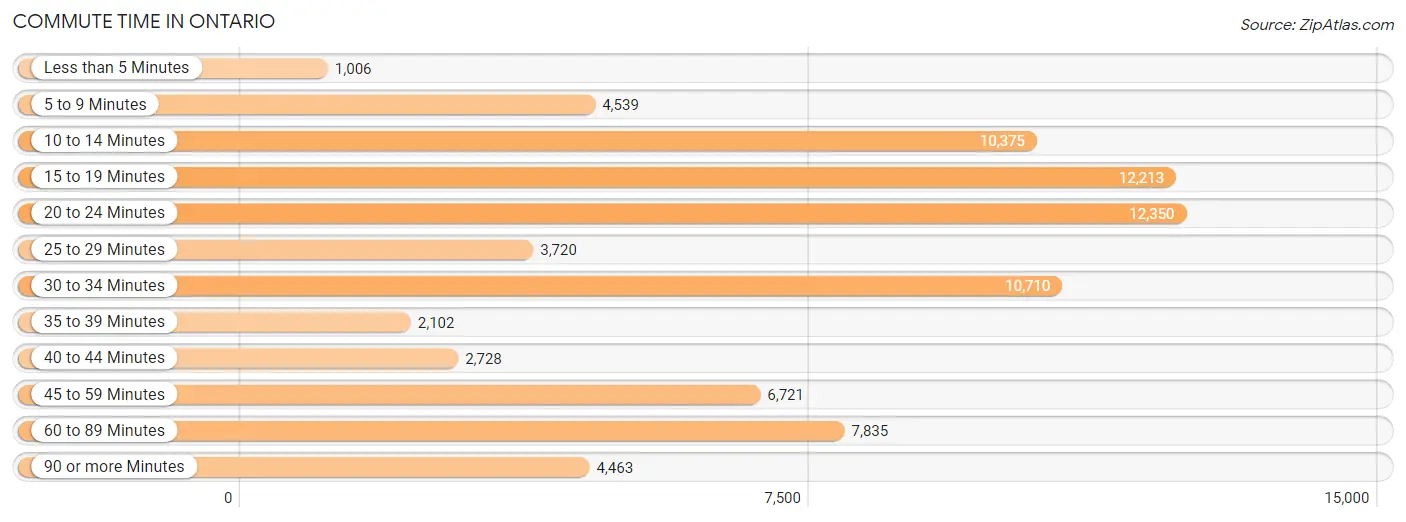
| Commute Time | # Commuters | % Commuters |
| Less than 5 Minutes | 1,006 | 1.3% |
| 5 to 9 Minutes | 4,539 | 5.8% |
| 10 to 14 Minutes | 10,375 | 13.2% |
| 15 to 19 Minutes | 12,213 | 15.5% |
| 20 to 24 Minutes | 12,350 | 15.7% |
| 25 to 29 Minutes | 3,720 | 4.7% |
| 30 to 34 Minutes | 10,710 | 13.6% |
| 35 to 39 Minutes | 2,102 | 2.7% |
| 40 to 44 Minutes | 2,728 | 3.5% |
| 45 to 59 Minutes | 6,721 | 8.5% |
| 60 to 89 Minutes | 7,835 | 10.0% |
| 90 or more Minutes | 4,463 | 5.7% |
Commute Time by Sex in Ontario
The most common commute times in Ontario are 15 to 19 minutes (6,510 commuters, 14.8%) for males and 20 to 24 minutes (6,015 commuters, 17.3%) for females.
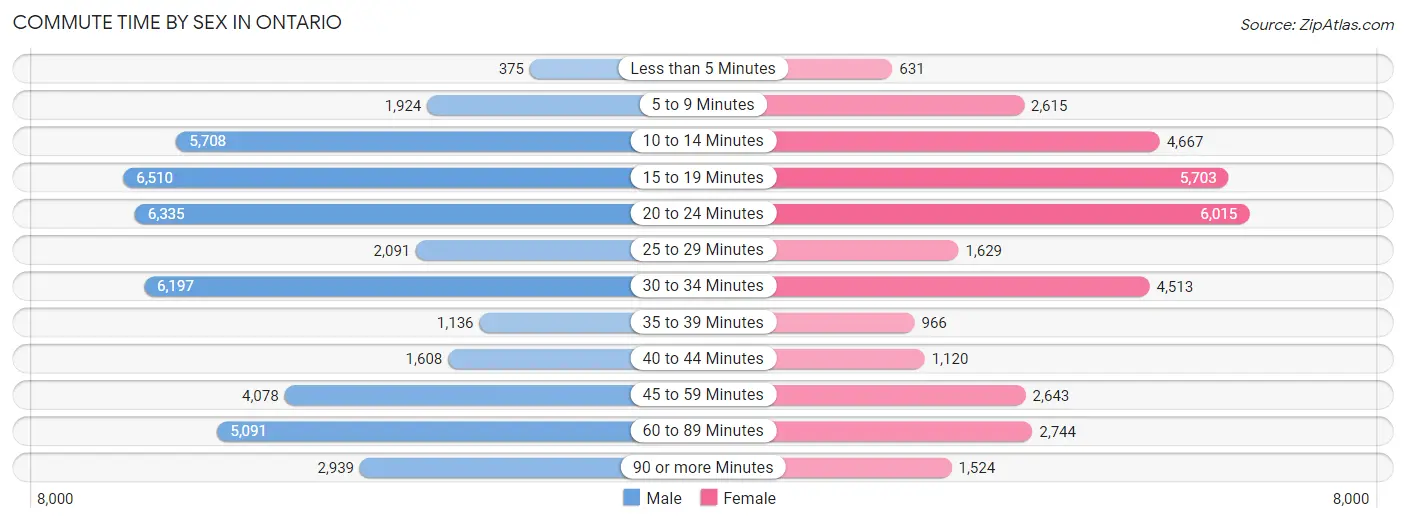
| Commute Time | Male | Female |
| Less than 5 Minutes | 375 (0.9%) | 631 (1.8%) |
| 5 to 9 Minutes | 1,924 (4.4%) | 2,615 (7.5%) |
| 10 to 14 Minutes | 5,708 (13.0%) | 4,667 (13.4%) |
| 15 to 19 Minutes | 6,510 (14.8%) | 5,703 (16.4%) |
| 20 to 24 Minutes | 6,335 (14.4%) | 6,015 (17.3%) |
| 25 to 29 Minutes | 2,091 (4.8%) | 1,629 (4.7%) |
| 30 to 34 Minutes | 6,197 (14.1%) | 4,513 (13.0%) |
| 35 to 39 Minutes | 1,136 (2.6%) | 966 (2.8%) |
| 40 to 44 Minutes | 1,608 (3.7%) | 1,120 (3.2%) |
| 45 to 59 Minutes | 4,078 (9.3%) | 2,643 (7.6%) |
| 60 to 89 Minutes | 5,091 (11.6%) | 2,744 (7.9%) |
| 90 or more Minutes | 2,939 (6.7%) | 1,524 (4.4%) |
Time of Departure to Work by Sex in Ontario
The most frequent times of departure to work in Ontario are 12:00 AM to 4:59 AM (6,277, 14.3%) for males and 7:00 AM to 7:29 AM (4,539, 13.1%) for females.
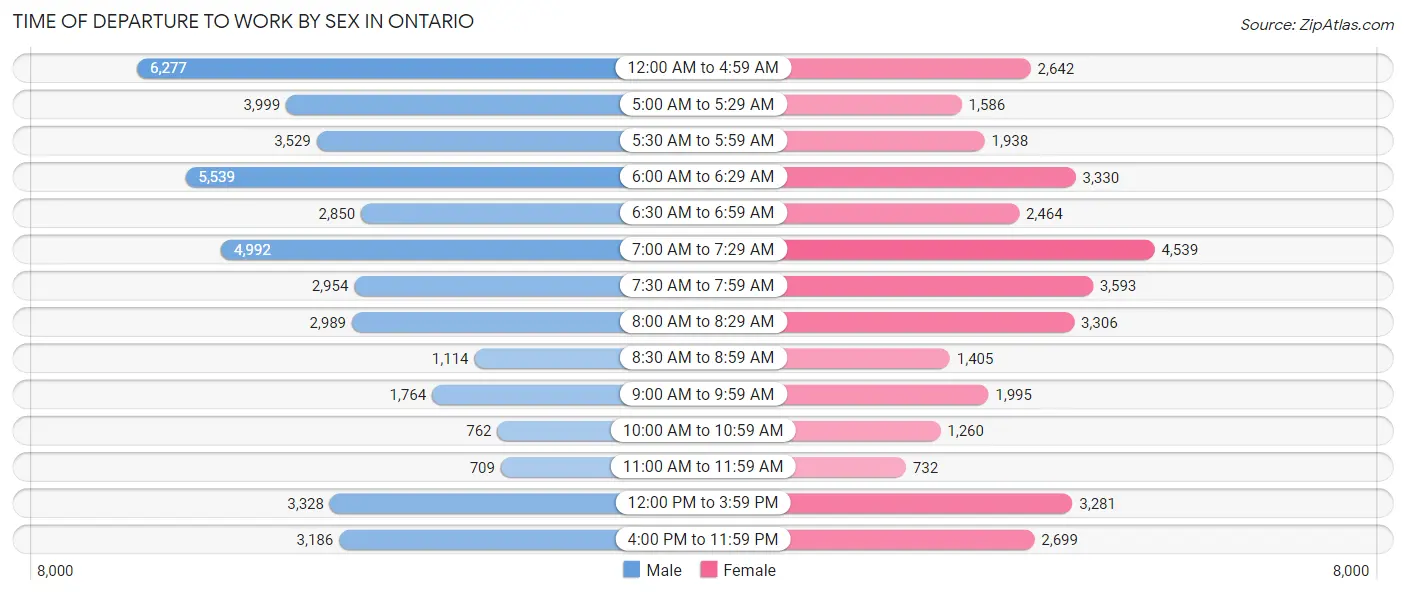
| Time of Departure | Male | Female |
| 12:00 AM to 4:59 AM | 6,277 (14.3%) | 2,642 (7.6%) |
| 5:00 AM to 5:29 AM | 3,999 (9.1%) | 1,586 (4.6%) |
| 5:30 AM to 5:59 AM | 3,529 (8.0%) | 1,938 (5.6%) |
| 6:00 AM to 6:29 AM | 5,539 (12.6%) | 3,330 (9.6%) |
| 6:30 AM to 6:59 AM | 2,850 (6.5%) | 2,464 (7.1%) |
| 7:00 AM to 7:29 AM | 4,992 (11.4%) | 4,539 (13.1%) |
| 7:30 AM to 7:59 AM | 2,954 (6.7%) | 3,593 (10.3%) |
| 8:00 AM to 8:29 AM | 2,989 (6.8%) | 3,306 (9.5%) |
| 8:30 AM to 8:59 AM | 1,114 (2.5%) | 1,405 (4.0%) |
| 9:00 AM to 9:59 AM | 1,764 (4.0%) | 1,995 (5.7%) |
| 10:00 AM to 10:59 AM | 762 (1.7%) | 1,260 (3.6%) |
| 11:00 AM to 11:59 AM | 709 (1.6%) | 732 (2.1%) |
| 12:00 PM to 3:59 PM | 3,328 (7.6%) | 3,281 (9.4%) |
| 4:00 PM to 11:59 PM | 3,186 (7.2%) | 2,699 (7.8%) |
| Total | 43,992 (100.0%) | 34,770 (100.0%) |
Housing Occupancy in Ontario
Occupancy by Ownership in Ontario
Of the total 51,760 dwellings in Ontario, owner-occupied units account for 28,810 (55.7%), while renter-occupied units make up 22,950 (44.3%).
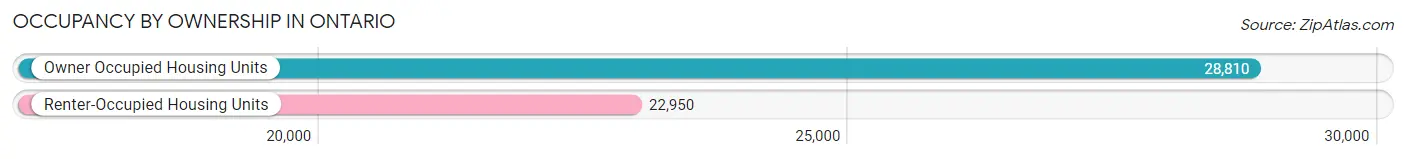
| Occupancy | # Housing Units | % Housing Units |
| Owner Occupied Housing Units | 28,810 | 55.7% |
| Renter-Occupied Housing Units | 22,950 | 44.3% |
| Total Occupied Housing Units | 51,760 | 100.0% |
Occupancy by Household Size in Ontario
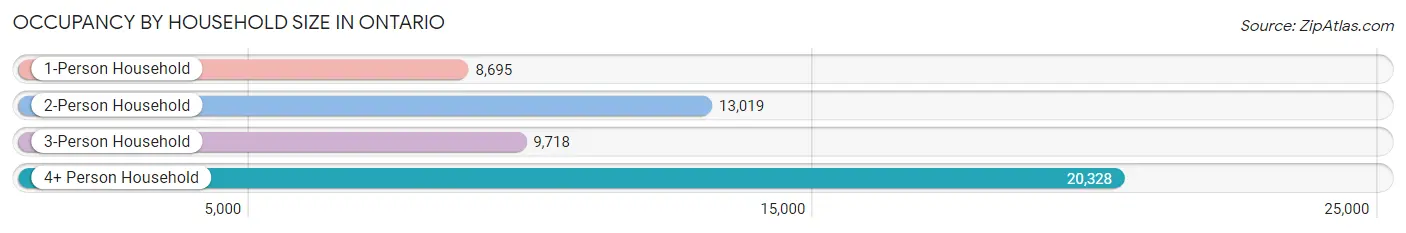
| Household Size | # Housing Units | % Housing Units |
| 1-Person Household | 8,695 | 16.8% |
| 2-Person Household | 13,019 | 25.2% |
| 3-Person Household | 9,718 | 18.8% |
| 4+ Person Household | 20,328 | 39.3% |
| Total Housing Units | 51,760 | 100.0% |
Occupancy by Ownership by Household Size in Ontario
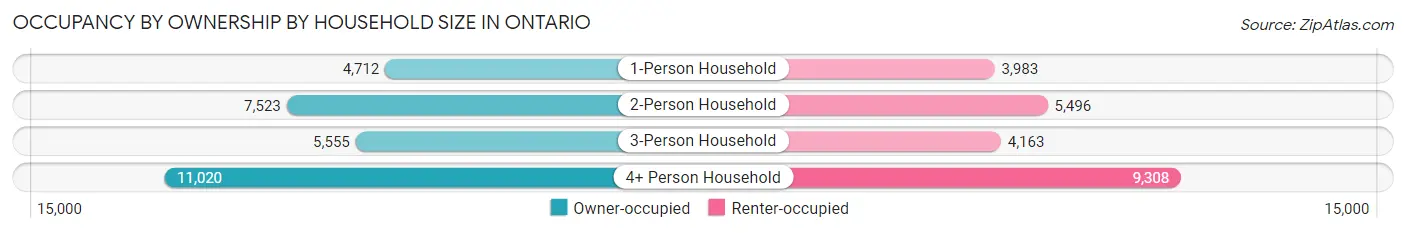
| Household Size | Owner-occupied | Renter-occupied |
| 1-Person Household | 4,712 (54.2%) | 3,983 (45.8%) |
| 2-Person Household | 7,523 (57.8%) | 5,496 (42.2%) |
| 3-Person Household | 5,555 (57.2%) | 4,163 (42.8%) |
| 4+ Person Household | 11,020 (54.2%) | 9,308 (45.8%) |
| Total Housing Units | 28,810 (55.7%) | 22,950 (44.3%) |
Occupancy by Educational Attainment in Ontario
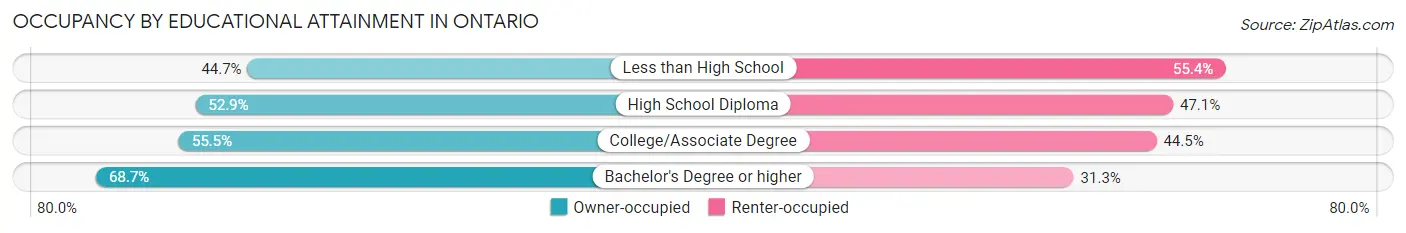
| Household Size | Owner-occupied | Renter-occupied |
| Less than High School | 4,476 (44.7%) | 5,548 (55.3%) |
| High School Diploma | 6,331 (52.9%) | 5,635 (47.1%) |
| College/Associate Degree | 10,323 (55.5%) | 8,265 (44.5%) |
| Bachelor's Degree or higher | 7,680 (68.7%) | 3,502 (31.3%) |
Occupancy by Age of Householder in Ontario
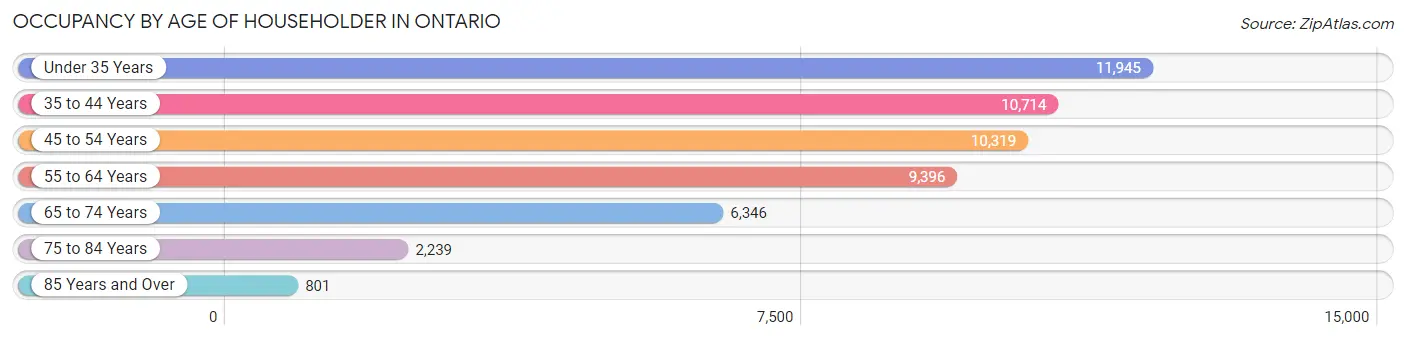
| Age Bracket | # Households | % Households |
| Under 35 Years | 11,945 | 23.1% |
| 35 to 44 Years | 10,714 | 20.7% |
| 45 to 54 Years | 10,319 | 19.9% |
| 55 to 64 Years | 9,396 | 18.1% |
| 65 to 74 Years | 6,346 | 12.3% |
| 75 to 84 Years | 2,239 | 4.3% |
| 85 Years and Over | 801 | 1.5% |
| Total | 51,760 | 100.0% |
Housing Finances in Ontario
Median Income by Occupancy in Ontario
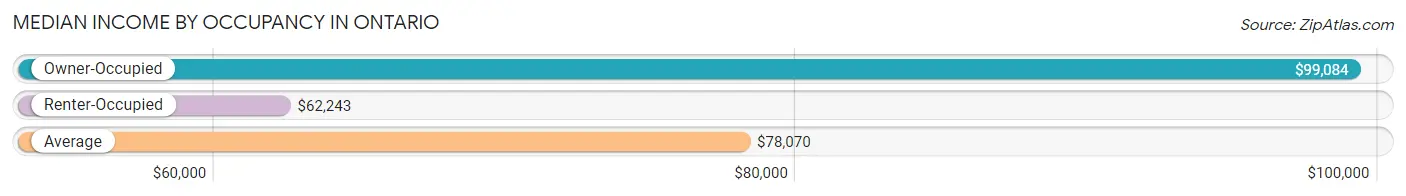
| Occupancy Type | # Households | Median Income |
| Owner-Occupied | 28,810 (55.7%) | $99,084 |
| Renter-Occupied | 22,950 (44.3%) | $62,243 |
| Average | 51,760 (100.0%) | $78,070 |
Occupancy by Householder Income Bracket in Ontario
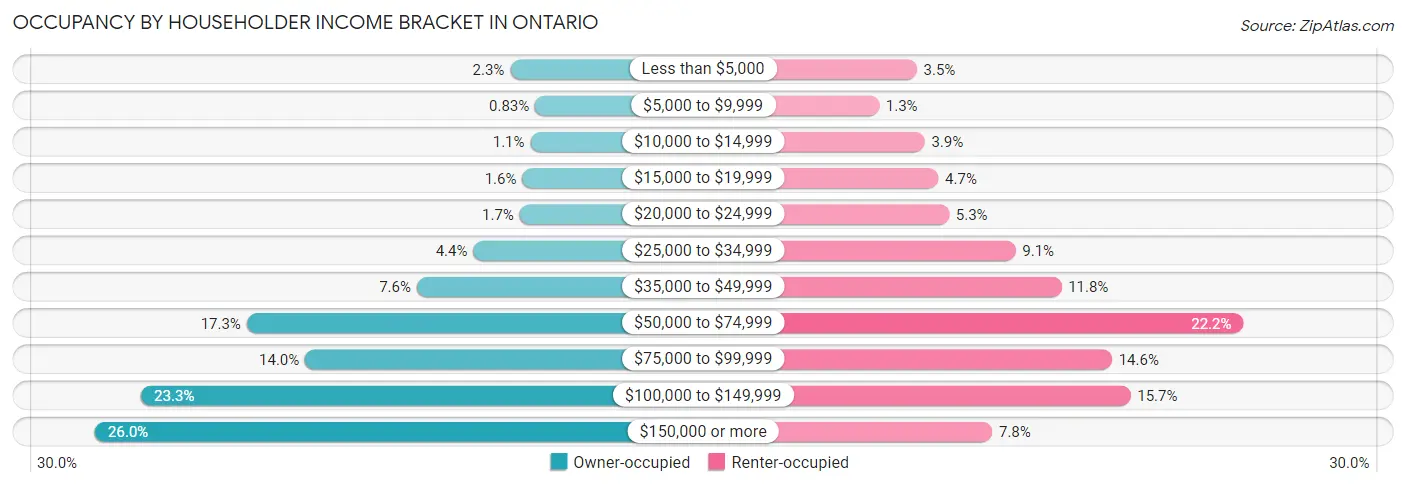
| Income Bracket | Owner-occupied | Renter-occupied |
| Less than $5,000 | 647 (2.2%) | 802 (3.5%) |
| $5,000 to $9,999 | 238 (0.8%) | 305 (1.3%) |
| $10,000 to $14,999 | 318 (1.1%) | 904 (3.9%) |
| $15,000 to $19,999 | 448 (1.6%) | 1,084 (4.7%) |
| $20,000 to $24,999 | 494 (1.7%) | 1,224 (5.3%) |
| $25,000 to $34,999 | 1,255 (4.4%) | 2,096 (9.1%) |
| $35,000 to $49,999 | 2,188 (7.6%) | 2,697 (11.7%) |
| $50,000 to $74,999 | 4,987 (17.3%) | 5,086 (22.2%) |
| $75,000 to $99,999 | 4,026 (14.0%) | 3,359 (14.6%) |
| $100,000 to $149,999 | 6,723 (23.3%) | 3,604 (15.7%) |
| $150,000 or more | 7,486 (26.0%) | 1,789 (7.8%) |
| Total | 28,810 (100.0%) | 22,950 (100.0%) |
Monthly Housing Cost Tiers in Ontario
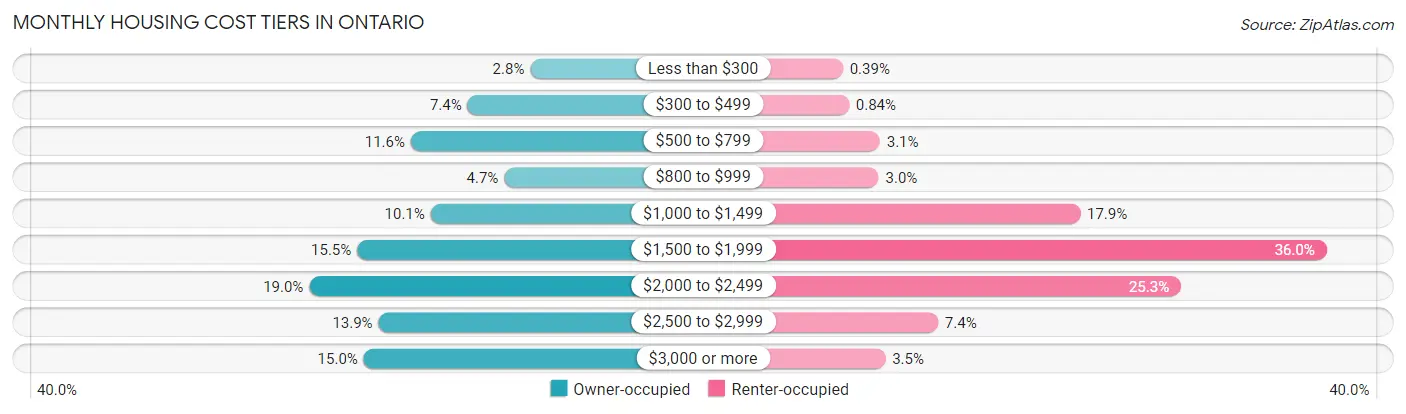
| Monthly Cost | Owner-occupied | Renter-occupied |
| Less than $300 | 796 (2.8%) | 90 (0.4%) |
| $300 to $499 | 2,127 (7.4%) | 193 (0.8%) |
| $500 to $799 | 3,331 (11.6%) | 715 (3.1%) |
| $800 to $999 | 1,348 (4.7%) | 695 (3.0%) |
| $1,000 to $1,499 | 2,910 (10.1%) | 4,101 (17.9%) |
| $1,500 to $1,999 | 4,467 (15.5%) | 8,269 (36.0%) |
| $2,000 to $2,499 | 5,486 (19.0%) | 5,807 (25.3%) |
| $2,500 to $2,999 | 4,016 (13.9%) | 1,698 (7.4%) |
| $3,000 or more | 4,329 (15.0%) | 808 (3.5%) |
| Total | 28,810 (100.0%) | 22,950 (100.0%) |
Physical Housing Characteristics in Ontario
Housing Structures in Ontario
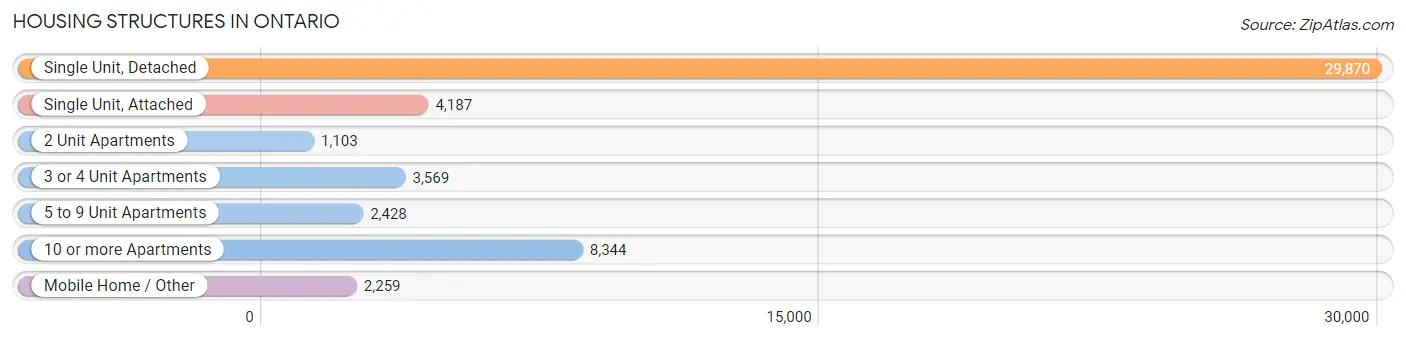
| Structure Type | # Housing Units | % Housing Units |
| Single Unit, Detached | 29,870 | 57.7% |
| Single Unit, Attached | 4,187 | 8.1% |
| 2 Unit Apartments | 1,103 | 2.1% |
| 3 or 4 Unit Apartments | 3,569 | 6.9% |
| 5 to 9 Unit Apartments | 2,428 | 4.7% |
| 10 or more Apartments | 8,344 | 16.1% |
| Mobile Home / Other | 2,259 | 4.4% |
| Total | 51,760 | 100.0% |
Housing Structures by Occupancy in Ontario
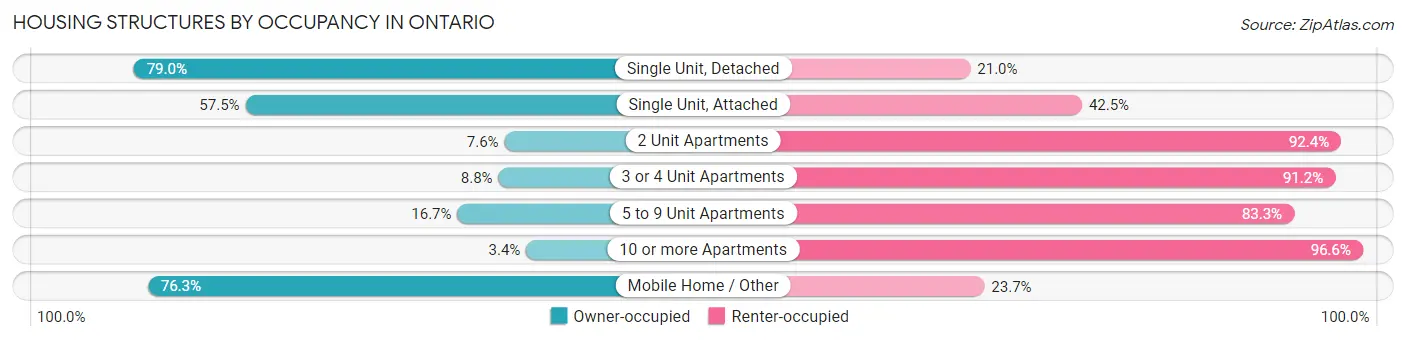
| Structure Type | Owner-occupied | Renter-occupied |
| Single Unit, Detached | 23,592 (79.0%) | 6,278 (21.0%) |
| Single Unit, Attached | 2,407 (57.5%) | 1,780 (42.5%) |
| 2 Unit Apartments | 84 (7.6%) | 1,019 (92.4%) |
| 3 or 4 Unit Apartments | 313 (8.8%) | 3,256 (91.2%) |
| 5 to 9 Unit Apartments | 405 (16.7%) | 2,023 (83.3%) |
| 10 or more Apartments | 286 (3.4%) | 8,058 (96.6%) |
| Mobile Home / Other | 1,723 (76.3%) | 536 (23.7%) |
| Total | 28,810 (55.7%) | 22,950 (44.3%) |
Housing Structures by Number of Rooms in Ontario
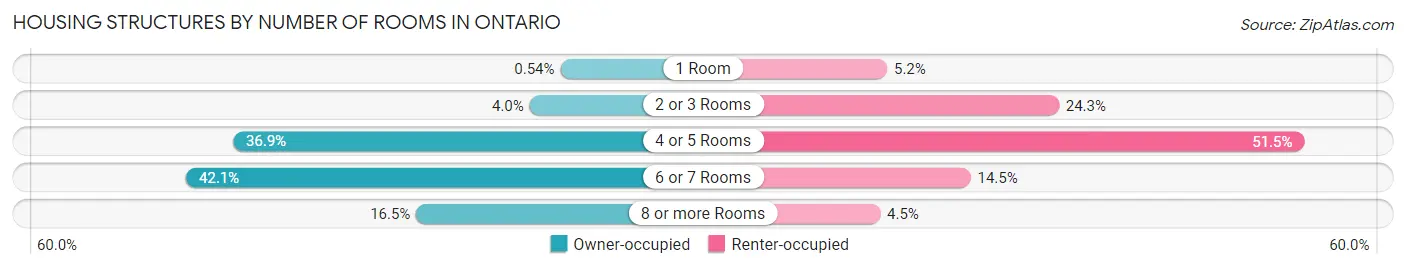
| Number of Rooms | Owner-occupied | Renter-occupied |
| 1 Room | 155 (0.5%) | 1,201 (5.2%) |
| 2 or 3 Rooms | 1,137 (4.0%) | 5,574 (24.3%) |
| 4 or 5 Rooms | 10,626 (36.9%) | 11,825 (51.5%) |
| 6 or 7 Rooms | 12,126 (42.1%) | 3,327 (14.5%) |
| 8 or more Rooms | 4,766 (16.5%) | 1,023 (4.5%) |
| Total | 28,810 (100.0%) | 22,950 (100.0%) |
Housing Structure by Heating Type in Ontario
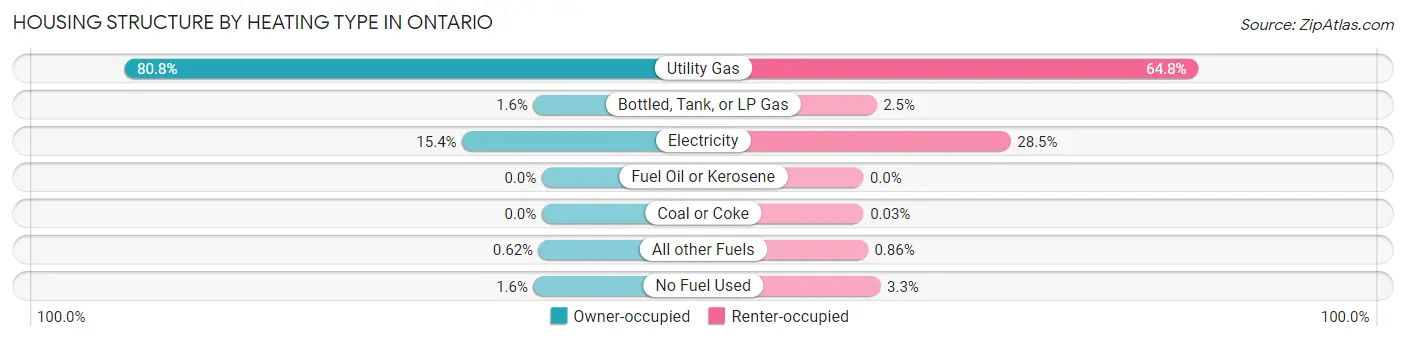
| Heating Type | Owner-occupied | Renter-occupied |
| Utility Gas | 23,269 (80.8%) | 14,872 (64.8%) |
| Bottled, Tank, or LP Gas | 461 (1.6%) | 582 (2.5%) |
| Electricity | 4,438 (15.4%) | 6,533 (28.5%) |
| Fuel Oil or Kerosene | 0 (0.0%) | 0 (0.0%) |
| Coal or Coke | 0 (0.0%) | 7 (0.0%) |
| All other Fuels | 178 (0.6%) | 198 (0.9%) |
| No Fuel Used | 464 (1.6%) | 758 (3.3%) |
| Total | 28,810 (100.0%) | 22,950 (100.0%) |
Household Vehicle Usage in Ontario
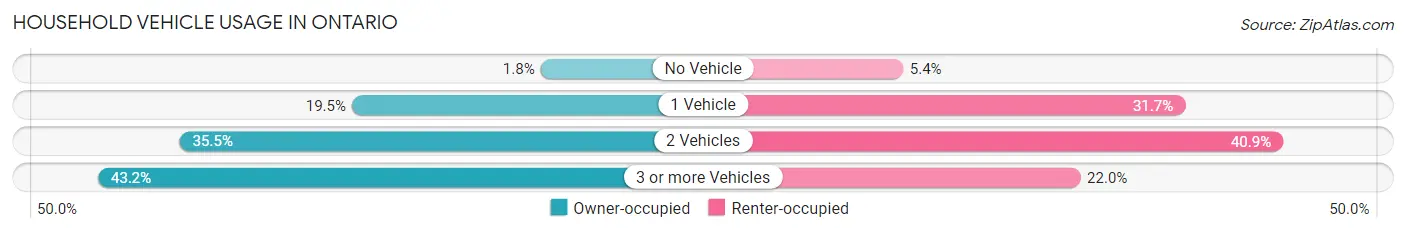
| Vehicles per Household | Owner-occupied | Renter-occupied |
| No Vehicle | 531 (1.8%) | 1,241 (5.4%) |
| 1 Vehicle | 5,606 (19.5%) | 7,285 (31.7%) |
| 2 Vehicles | 10,239 (35.5%) | 9,384 (40.9%) |
| 3 or more Vehicles | 12,434 (43.2%) | 5,040 (22.0%) |
| Total | 28,810 (100.0%) | 22,950 (100.0%) |
Real Estate & Mortgages in Ontario
Real Estate and Mortgage Overview in Ontario
| Characteristic | Without Mortgage | With Mortgage |
| Housing Units | 7,872 | 20,938 |
| Median Property Value | $458,000 | $536,400 |
| Median Household Income | $72,575 | $6,255 |
| Monthly Housing Costs | $605 | $4,322 |
| Real Estate Taxes | $2,375 | $338 |
Property Value by Mortgage Status in Ontario
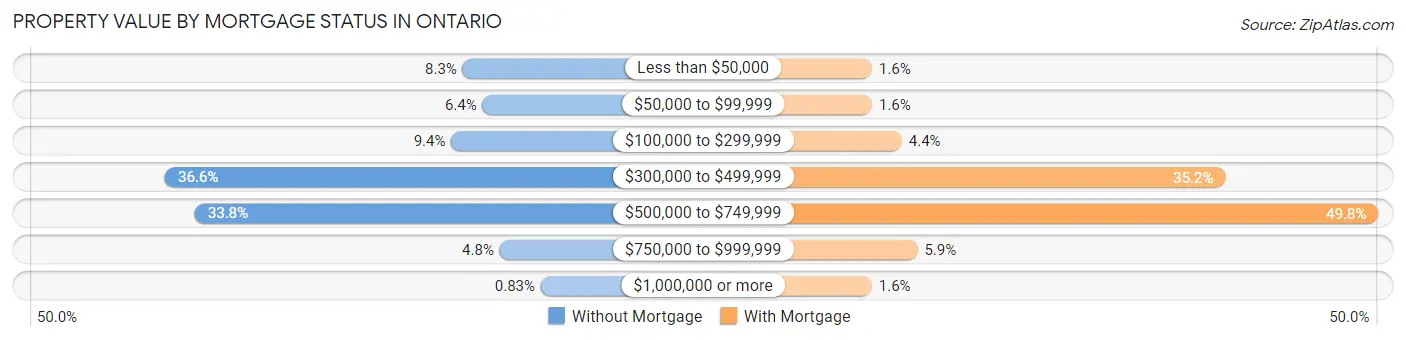
| Property Value | Without Mortgage | With Mortgage |
| Less than $50,000 | 652 (8.3%) | 329 (1.6%) |
| $50,000 to $99,999 | 502 (6.4%) | 329 (1.6%) |
| $100,000 to $299,999 | 737 (9.4%) | 923 (4.4%) |
| $300,000 to $499,999 | 2,883 (36.6%) | 7,372 (35.2%) |
| $500,000 to $749,999 | 2,659 (33.8%) | 10,425 (49.8%) |
| $750,000 to $999,999 | 374 (4.8%) | 1,236 (5.9%) |
| $1,000,000 or more | 65 (0.8%) | 324 (1.5%) |
| Total | 7,872 (100.0%) | 20,938 (100.0%) |
Household Income by Mortgage Status in Ontario
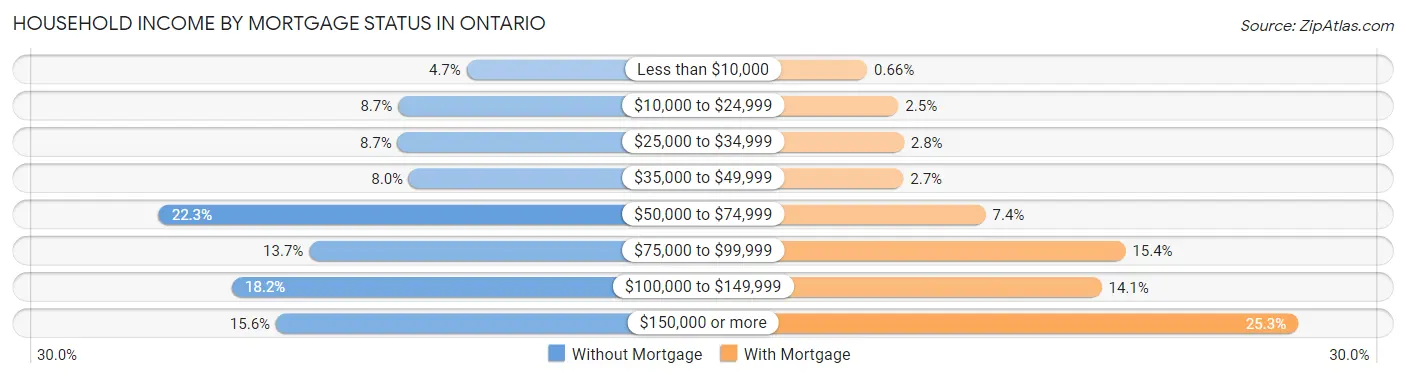
| Household Income | Without Mortgage | With Mortgage |
| Less than $10,000 | 373 (4.7%) | 139 (0.7%) |
| $10,000 to $24,999 | 682 (8.7%) | 512 (2.5%) |
| $25,000 to $34,999 | 684 (8.7%) | 578 (2.8%) |
| $35,000 to $49,999 | 633 (8.0%) | 571 (2.7%) |
| $50,000 to $74,999 | 1,758 (22.3%) | 1,555 (7.4%) |
| $75,000 to $99,999 | 1,082 (13.7%) | 3,229 (15.4%) |
| $100,000 to $149,999 | 1,429 (18.1%) | 2,944 (14.1%) |
| $150,000 or more | 1,231 (15.6%) | 5,294 (25.3%) |
| Total | 7,872 (100.0%) | 20,938 (100.0%) |
Property Value to Household Income Ratio in Ontario
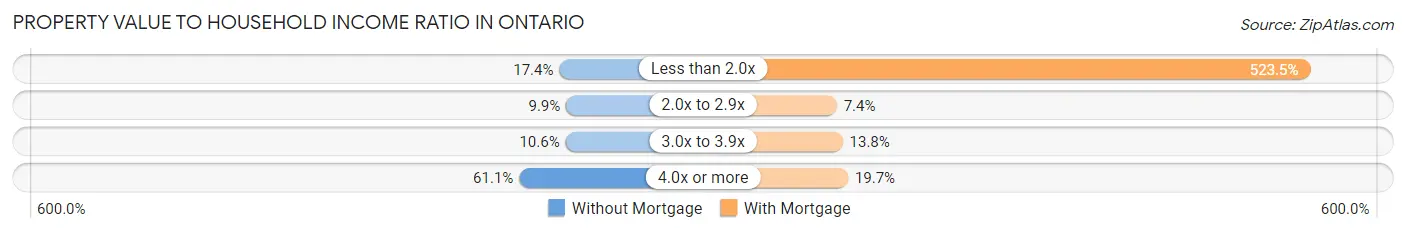
| Value-to-Income Ratio | Without Mortgage | With Mortgage |
| Less than 2.0x | 1,367 (17.4%) | 109,602 (523.5%) |
| 2.0x to 2.9x | 782 (9.9%) | 1,555 (7.4%) |
| 3.0x to 3.9x | 837 (10.6%) | 2,896 (13.8%) |
| 4.0x or more | 4,809 (61.1%) | 4,116 (19.7%) |
| Total | 7,872 (100.0%) | 20,938 (100.0%) |
Real Estate Taxes by Mortgage Status in Ontario
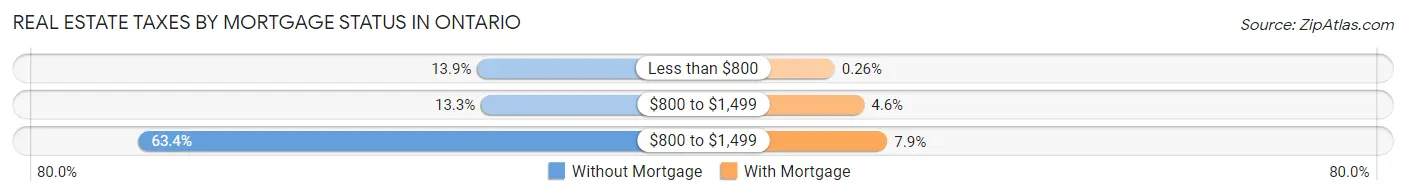
| Property Taxes | Without Mortgage | With Mortgage |
| Less than $800 | 1,091 (13.9%) | 55 (0.3%) |
| $800 to $1,499 | 1,048 (13.3%) | 957 (4.6%) |
| $800 to $1,499 | 4,987 (63.3%) | 1,663 (7.9%) |
| Total | 7,872 (100.0%) | 20,938 (100.0%) |
Health & Disability in Ontario
Health Insurance Coverage by Age in Ontario
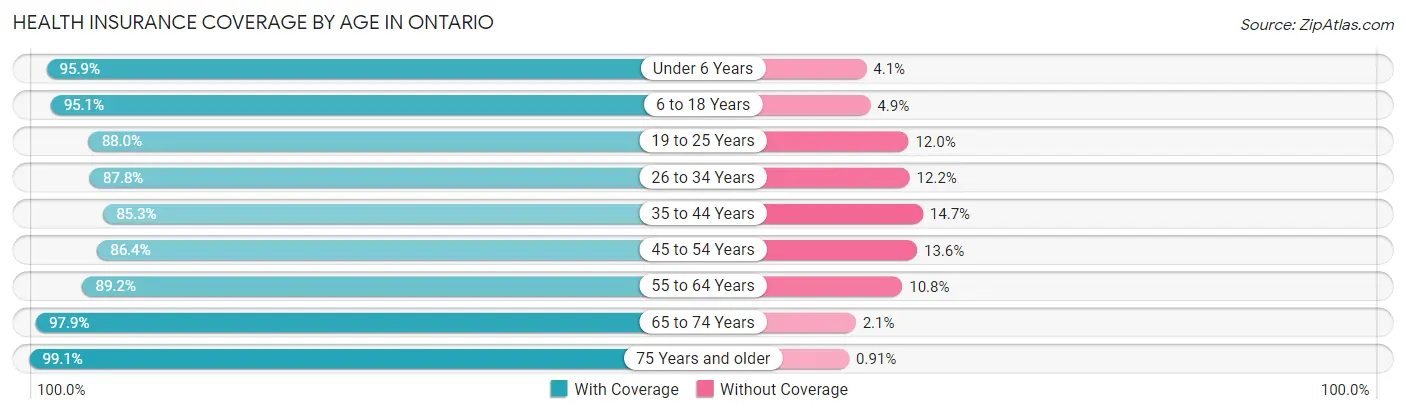
| Age Bracket | With Coverage | Without Coverage |
| Under 6 Years | 13,540 (95.9%) | 580 (4.1%) |
| 6 to 18 Years | 31,062 (95.1%) | 1,591 (4.9%) |
| 19 to 25 Years | 17,598 (88.0%) | 2,393 (12.0%) |
| 26 to 34 Years | 24,538 (87.8%) | 3,405 (12.2%) |
| 35 to 44 Years | 20,487 (85.3%) | 3,518 (14.7%) |
| 45 to 54 Years | 18,120 (86.4%) | 2,842 (13.6%) |
| 55 to 64 Years | 16,856 (89.2%) | 2,045 (10.8%) |
| 65 to 74 Years | 10,861 (97.9%) | 236 (2.1%) |
| 75 Years and older | 6,123 (99.1%) | 56 (0.9%) |
| Total | 159,185 (90.5%) | 16,666 (9.5%) |
Health Insurance Coverage by Citizenship Status in Ontario
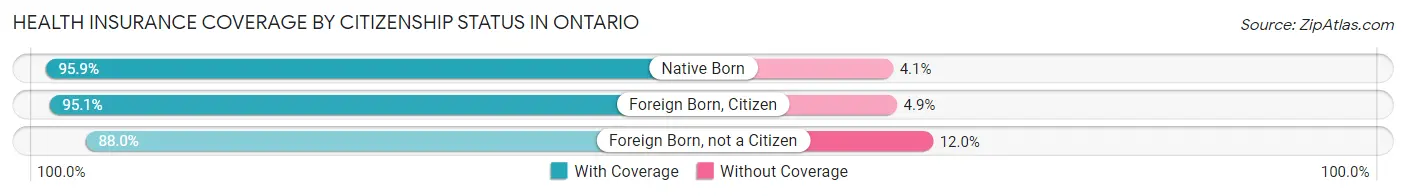
| Citizenship Status | With Coverage | Without Coverage |
| Native Born | 13,540 (95.9%) | 580 (4.1%) |
| Foreign Born, Citizen | 31,062 (95.1%) | 1,591 (4.9%) |
| Foreign Born, not a Citizen | 17,598 (88.0%) | 2,393 (12.0%) |
Health Insurance Coverage by Household Income in Ontario
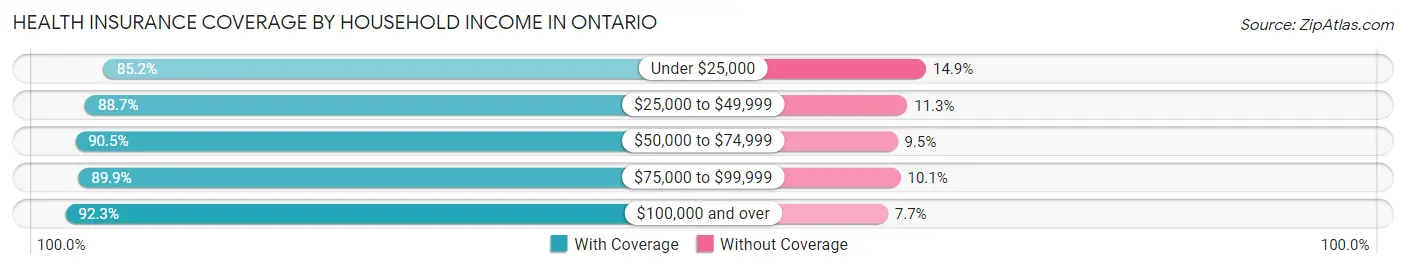
| Household Income | With Coverage | Without Coverage |
| Under $25,000 | 13,020 (85.2%) | 2,271 (14.8%) |
| $25,000 to $49,999 | 20,781 (88.7%) | 2,657 (11.3%) |
| $50,000 to $74,999 | 28,976 (90.5%) | 3,039 (9.5%) |
| $75,000 to $99,999 | 23,566 (89.9%) | 2,640 (10.1%) |
| $100,000 and over | 72,391 (92.3%) | 6,034 (7.7%) |
Public vs Private Health Insurance Coverage by Age in Ontario
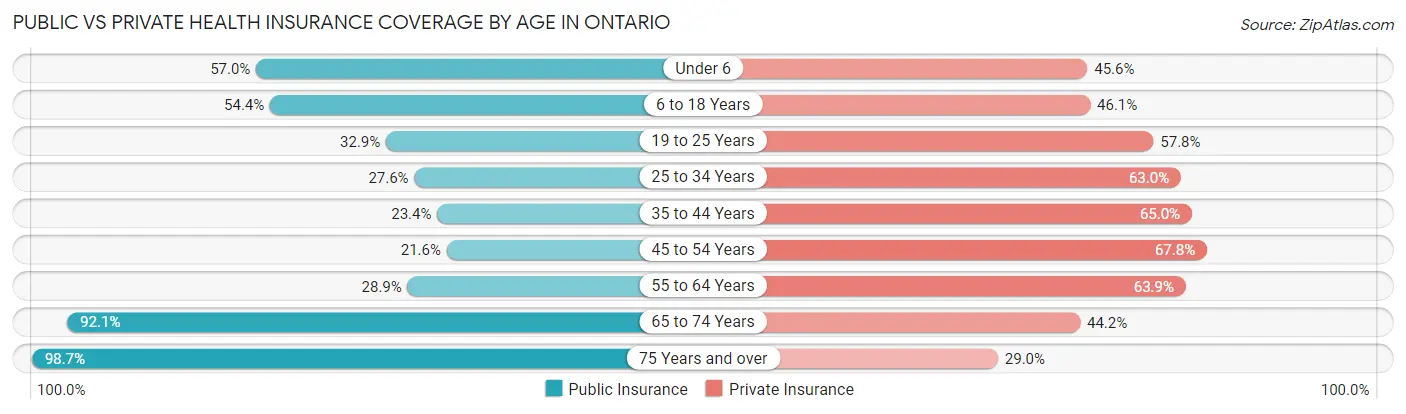
| Age Bracket | Public Insurance | Private Insurance |
| Under 6 | 8,050 (57.0%) | 6,434 (45.6%) |
| 6 to 18 Years | 17,773 (54.4%) | 15,051 (46.1%) |
| 19 to 25 Years | 6,578 (32.9%) | 11,560 (57.8%) |
| 25 to 34 Years | 7,723 (27.6%) | 17,590 (62.9%) |
| 35 to 44 Years | 5,616 (23.4%) | 15,601 (65.0%) |
| 45 to 54 Years | 4,534 (21.6%) | 14,208 (67.8%) |
| 55 to 64 Years | 5,465 (28.9%) | 12,068 (63.8%) |
| 65 to 74 Years | 10,219 (92.1%) | 4,907 (44.2%) |
| 75 Years and over | 6,097 (98.7%) | 1,790 (29.0%) |
| Total | 72,055 (41.0%) | 99,209 (56.4%) |
Disability Status by Sex by Age in Ontario
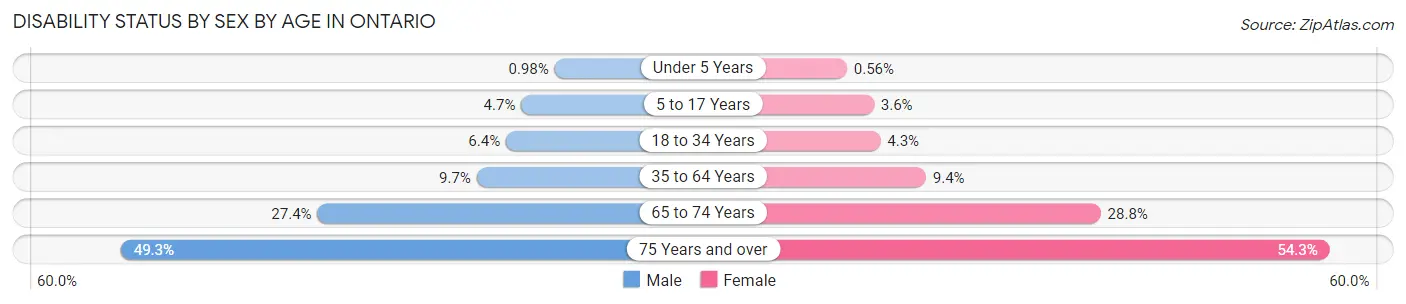
| Age Bracket | Male | Female |
| Under 5 Years | 56 (1.0%) | 33 (0.6%) |
| 5 to 17 Years | 739 (4.7%) | 588 (3.6%) |
| 18 to 34 Years | 1,682 (6.4%) | 1,052 (4.3%) |
| 35 to 64 Years | 3,026 (9.7%) | 3,045 (9.4%) |
| 65 to 74 Years | 1,441 (27.4%) | 1,682 (28.8%) |
| 75 Years and over | 1,225 (49.3%) | 2,006 (54.3%) |
Disability Class by Sex by Age in Ontario
Disability Class: Hearing Difficulty
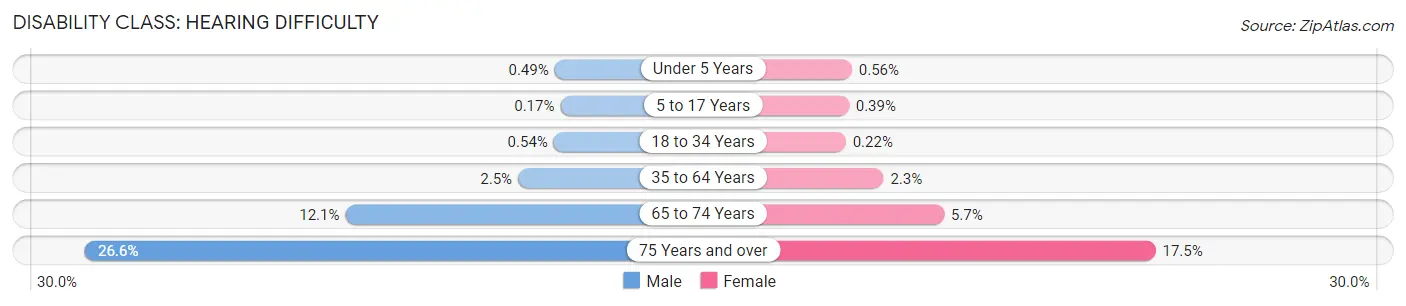
| Age Bracket | Male | Female |
| Under 5 Years | 28 (0.5%) | 33 (0.6%) |
| 5 to 17 Years | 26 (0.2%) | 64 (0.4%) |
| 18 to 34 Years | 142 (0.5%) | 55 (0.2%) |
| 35 to 64 Years | 793 (2.5%) | 756 (2.3%) |
| 65 to 74 Years | 639 (12.1%) | 332 (5.7%) |
| 75 Years and over | 662 (26.6%) | 645 (17.5%) |
Disability Class: Vision Difficulty
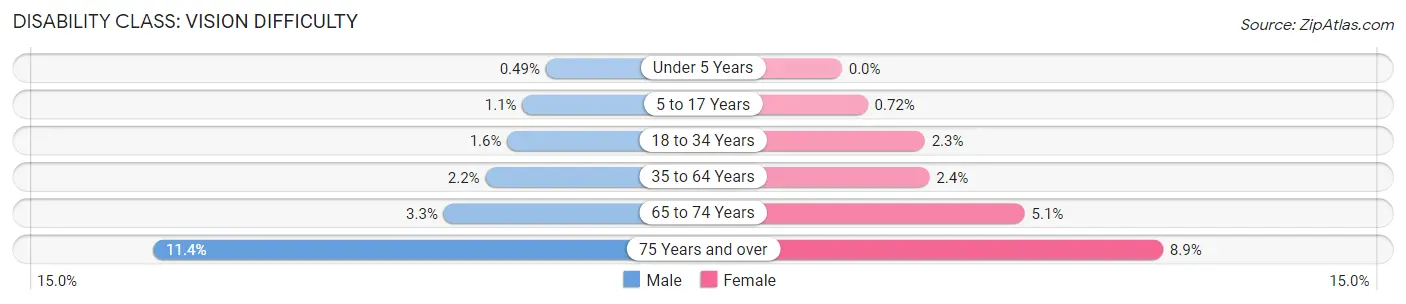
| Age Bracket | Male | Female |
| Under 5 Years | 28 (0.5%) | 0 (0.0%) |
| 5 to 17 Years | 180 (1.1%) | 118 (0.7%) |
| 18 to 34 Years | 411 (1.6%) | 567 (2.3%) |
| 35 to 64 Years | 681 (2.2%) | 795 (2.4%) |
| 65 to 74 Years | 175 (3.3%) | 297 (5.1%) |
| 75 Years and over | 284 (11.4%) | 330 (8.9%) |
Disability Class: Cognitive Difficulty
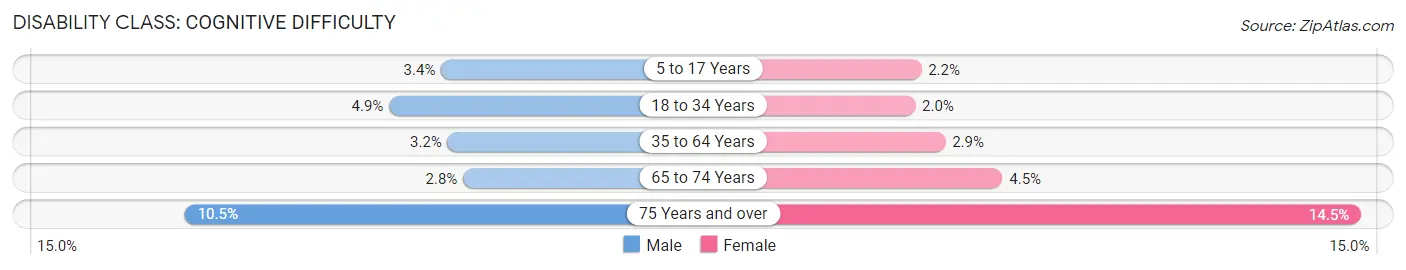
| Age Bracket | Male | Female |
| 5 to 17 Years | 535 (3.4%) | 364 (2.2%) |
| 18 to 34 Years | 1,276 (4.9%) | 500 (2.0%) |
| 35 to 64 Years | 1,008 (3.2%) | 936 (2.9%) |
| 65 to 74 Years | 147 (2.8%) | 261 (4.5%) |
| 75 Years and over | 262 (10.5%) | 534 (14.5%) |
Disability Class: Ambulatory Difficulty
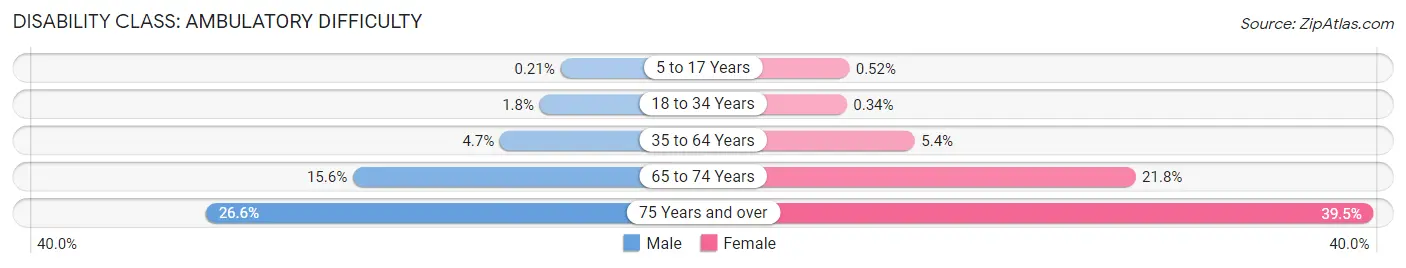
| Age Bracket | Male | Female |
| 5 to 17 Years | 33 (0.2%) | 86 (0.5%) |
| 18 to 34 Years | 460 (1.8%) | 84 (0.3%) |
| 35 to 64 Years | 1,474 (4.7%) | 1,754 (5.4%) |
| 65 to 74 Years | 822 (15.6%) | 1,271 (21.8%) |
| 75 Years and over | 660 (26.6%) | 1,458 (39.5%) |
Disability Class: Self-Care Difficulty
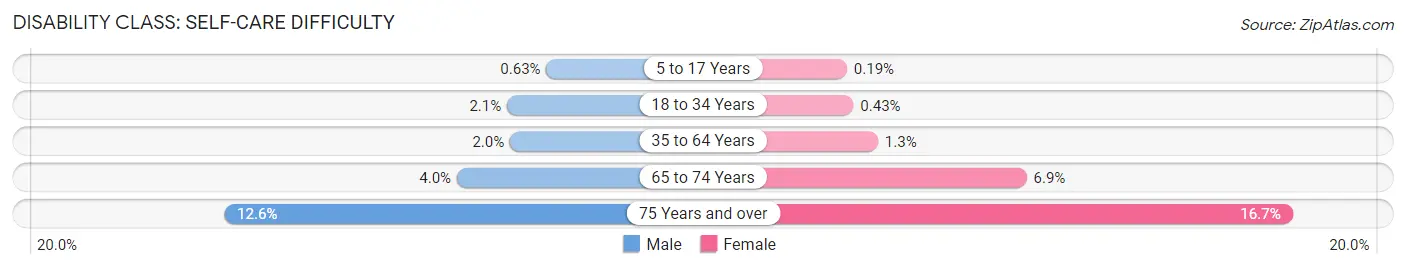
| Age Bracket | Male | Female |
| 5 to 17 Years | 100 (0.6%) | 31 (0.2%) |
| 18 to 34 Years | 551 (2.1%) | 105 (0.4%) |
| 35 to 64 Years | 621 (2.0%) | 436 (1.3%) |
| 65 to 74 Years | 208 (4.0%) | 400 (6.9%) |
| 75 Years and over | 313 (12.6%) | 618 (16.7%) |
Technology Access in Ontario
Computing Device Access in Ontario
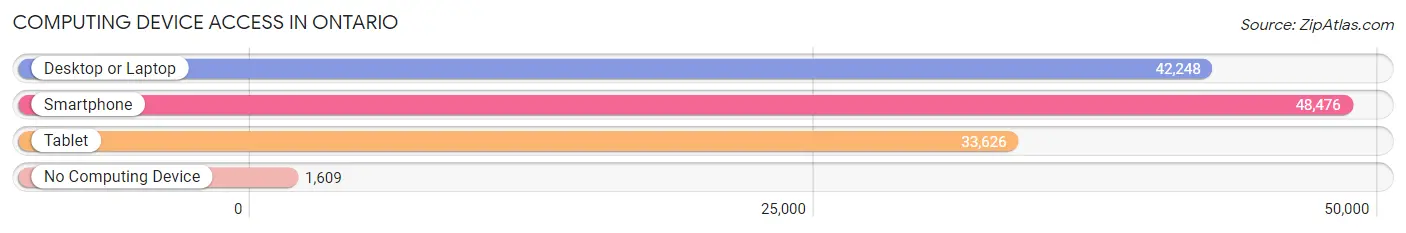
| Device Type | # Households | % Households |
| Desktop or Laptop | 42,248 | 81.6% |
| Smartphone | 48,476 | 93.7% |
| Tablet | 33,626 | 65.0% |
| No Computing Device | 1,609 | 3.1% |
| Total | 51,760 | 100.0% |
Internet Access in Ontario
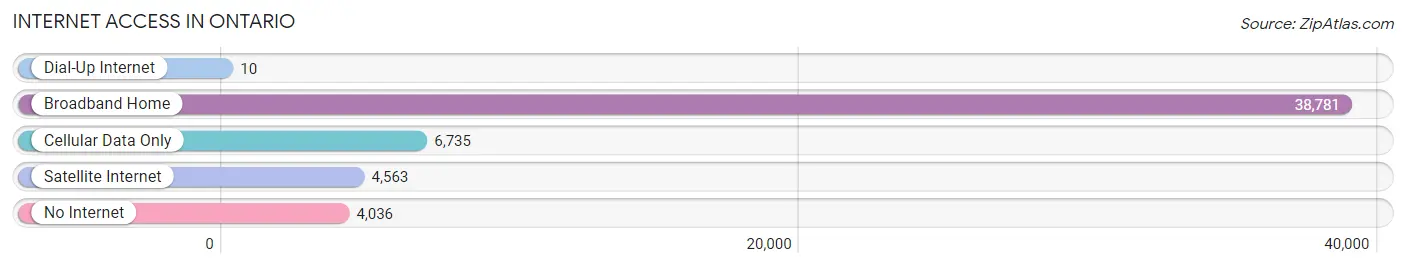
| Internet Type | # Households | % Households |
| Dial-Up Internet | 10 | 0.0% |
| Broadband Home | 38,781 | 74.9% |
| Cellular Data Only | 6,735 | 13.0% |
| Satellite Internet | 4,563 | 8.8% |
| No Internet | 4,036 | 7.8% |
| Total | 51,760 | 100.0% |
Ontario Summary
Ontario is a city located in southwestern San Bernardino County, California, United States. It lies in the western part of the Inland Empire region, approximately 35 miles east of downtown Los Angeles. As of the 2010 census, the city had a population of 163,924, making it the fourth-largest city in the county and the tenth-largest in the state.
History
The area that is now Ontario was first settled by Native Americans of the Tongva and Serrano tribes. The first Europeans to settle in the area were the Spanish, who established the Mission San Gabriel Arcángel in 1771. The area was part of the Rancho Cucamonga, a Mexican land grant, until 1819, when it was acquired by the Lugo family. In 1882, the area was incorporated as the city of Ontario.
Geography
Ontario is located in southwestern San Bernardino County, California, at an elevation of 876 feet. It is situated in the western part of the Inland Empire region, approximately 35 miles east of downtown Los Angeles. The city is bordered by the cities of Chino to the west, Upland to the north, and Fontana to the south. The city is also bordered by the San Bernardino National Forest to the east.
The city covers an area of 50.1 square miles, of which 49.9 square miles is land and 0.2 square miles is water. The city is located in the semi-arid Cucamonga Valley, which is part of the larger Inland Empire region. The city is located in the foothills of the San Gabriel Mountains, which rise to the east.
Economy
Ontario is a major economic center in the Inland Empire region. The city is home to the Ontario International Airport, which is the 15th busiest airport in the United States. The airport is a major hub for cargo and passenger traffic, and is a major economic driver for the region.
The city is also home to several major employers, including the Ontario Mills shopping mall, the Ontario Convention Center, and the Ontario Medical Center. The city is also home to several major manufacturing and distribution centers, including the Nestle USA headquarters, the Frito-Lay distribution center, and the Coca-Cola bottling plant.
Demographics
As of the 2010 census, the city had a population of 163,924. The racial makeup of the city was 57.2% White, 5.2% African American, 1.2% Native American, 8.2% Asian, 0.3% Pacific Islander, 24.3% from other races, and 3.7% from two or more races. Hispanic or Latino of any race were 47.2% of the population.
The median household income in the city was $50,945, and the median family income was $58,945. The per capita income in the city was $22,845. About 16.2% of the population was below the poverty line.
Common Questions
What is Per Capita Income in Ontario?
Per Capita income in Ontario is $29,332.
What is the Median Family Income in Ontario?
Median Family Income in Ontario is $83,022.
What is the Median Household income in Ontario?
Median Household Income in Ontario is $78,070.
What is Income or Wage Gap in Ontario?
Income or Wage Gap in Ontario is 24.1%.
Women in Ontario earn 75.9 cents for every dollar earned by a man.
What is Family Income Deficit in Ontario?
Family Income Deficit in Ontario is $11,213.
Families that are below poverty line in Ontario earn $11,213 less on average than the poverty threshold level.
What is Inequality or Gini Index in Ontario?
Inequality or Gini Index in Ontario is 0.40.
What is the Total Population of Ontario?
Total Population of Ontario is 176,326.
What is the Total Male Population of Ontario?
Total Male Population of Ontario is 87,095.
What is the Total Female Population of Ontario?
Total Female Population of Ontario is 89,231.
What is the Ratio of Males per 100 Females in Ontario?
There are 97.61 Males per 100 Females in Ontario.
What is the Ratio of Females per 100 Males in Ontario?
There are 102.45 Females per 100 Males in Ontario.
What is the Median Population Age in Ontario?
Median Population Age in Ontario is 32.6 Years.
What is the Average Family Size in Ontario
Average Family Size in Ontario is 3.8 People.
What is the Average Household Size in Ontario
Average Household Size in Ontario is 3.4 People.
How Large is the Labor Force in Ontario?
There are 91,723 People in the Labor Forcein in Ontario.
What is the Percentage of People in the Labor Force in Ontario?
66.6% of People are in the Labor Force in Ontario.
What is the Unemployment Rate in Ontario?
Unemployment Rate in Ontario is 5.8%.