Cities with the Largest Black / African American Community in Michigan
RELATED REPORTS & OPTIONS
Black / African American
Michigan
Compare Cities
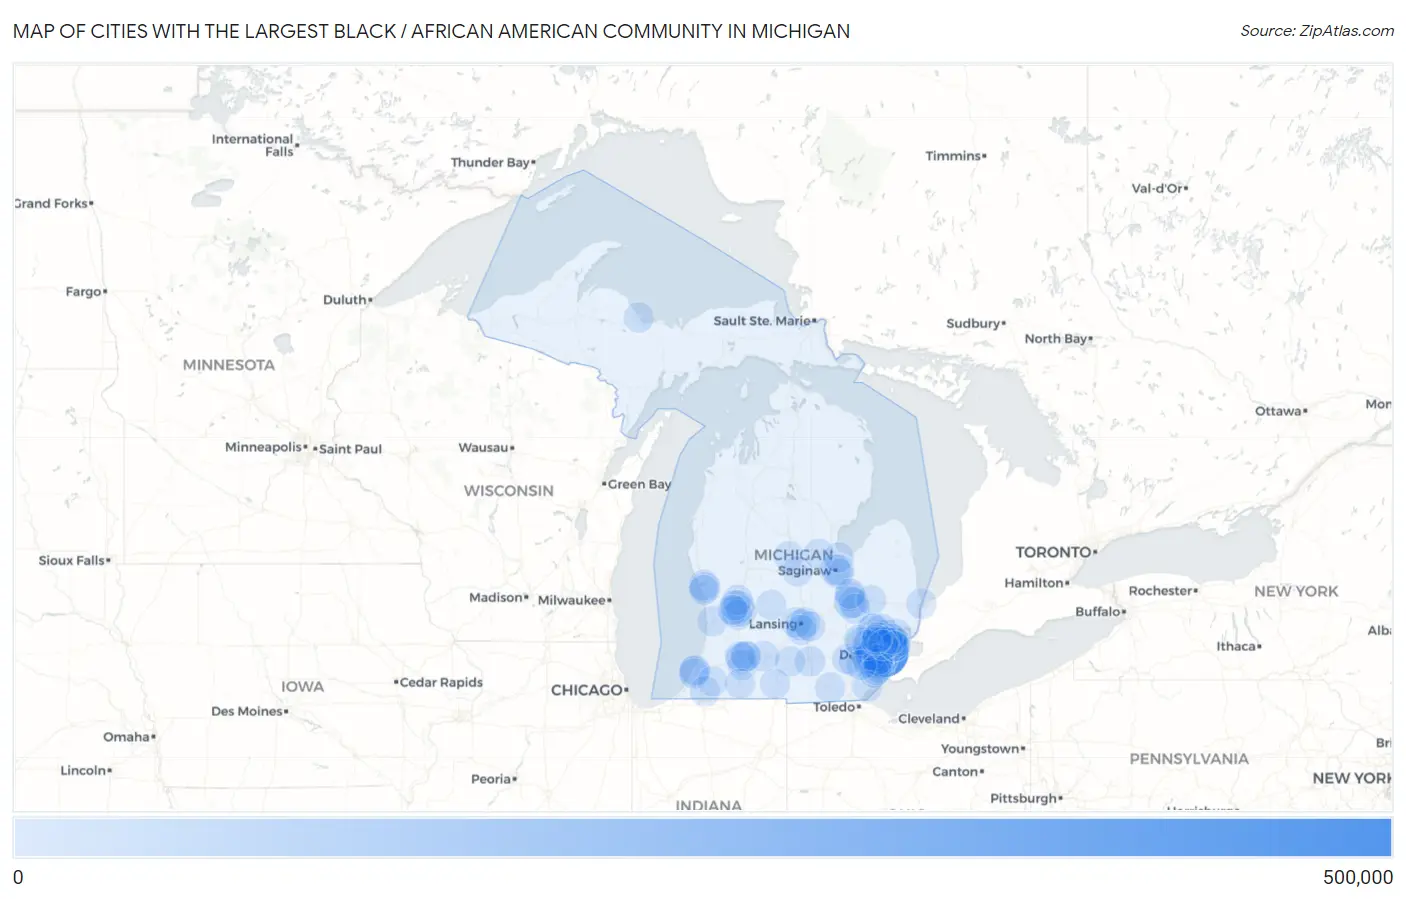
Map of Cities with the Largest Black / African American Community in Michigan
0
500,000
Cities with the Largest Black / African American Community in Michigan
| City | Black / African American | vs State | vs National | |
| 1. | Detroit | 495,533 | 1,363,539(36.34%)#1 | 41,288,572(1.20%)#5 |
| 2. | Southfield | 49,680 | 1,363,539(3.64%)#2 | 41,288,572(0.12%)#95 |
| 3. | Flint | 46,091 | 1,363,539(3.38%)#3 | 41,288,572(0.11%)#99 |
| 4. | Grand Rapids | 35,425 | 1,363,539(2.60%)#4 | 41,288,572(0.09%)#131 |
| 5. | Pontiac | 30,389 | 1,363,539(2.23%)#5 | 41,288,572(0.07%)#156 |
| 6. | Warren | 27,510 | 1,363,539(2.02%)#6 | 41,288,572(0.07%)#177 |
| 7. | Lansing | 26,796 | 1,363,539(1.97%)#7 | 41,288,572(0.06%)#184 |
| 8. | Saginaw | 20,222 | 1,363,539(1.48%)#8 | 41,288,572(0.05%)#256 |
| 9. | Inkster | 19,304 | 1,363,539(1.42%)#9 | 41,288,572(0.05%)#269 |
| 10. | Westland | 18,887 | 1,363,539(1.39%)#10 | 41,288,572(0.05%)#275 |
| 11. | Eastpointe | 18,104 | 1,363,539(1.33%)#11 | 41,288,572(0.04%)#288 |
| 12. | Kalamazoo | 16,232 | 1,363,539(1.19%)#12 | 41,288,572(0.04%)#327 |
| 13. | Oak Park | 15,715 | 1,363,539(1.15%)#13 | 41,288,572(0.04%)#337 |
| 14. | Farmington Hills | 14,863 | 1,363,539(1.09%)#14 | 41,288,572(0.04%)#353 |
| 15. | Taylor | 12,794 | 1,363,539(0.94%)#15 | 41,288,572(0.03%)#422 |
| 16. | Muskegon | 11,842 | 1,363,539(0.87%)#16 | 41,288,572(0.03%)#464 |
| 17. | Romulus | 11,385 | 1,363,539(0.83%)#17 | 41,288,572(0.03%)#483 |
| 18. | Roseville | 10,831 | 1,363,539(0.79%)#18 | 41,288,572(0.03%)#511 |
| 19. | Kentwood | 10,328 | 1,363,539(0.76%)#19 | 41,288,572(0.03%)#533 |
| 20. | Harper Woods | 9,770 | 1,363,539(0.72%)#20 | 41,288,572(0.02%)#568 |
| 21. | Battle Creek | 8,528 | 1,363,539(0.63%)#21 | 41,288,572(0.02%)#657 |
| 22. | Ann Arbor | 8,047 | 1,363,539(0.59%)#22 | 41,288,572(0.02%)#700 |
| 23. | Highland Park | 7,959 | 1,363,539(0.58%)#23 | 41,288,572(0.02%)#707 |
| 24. | Benton Harbor | 7,953 | 1,363,539(0.58%)#24 | 41,288,572(0.02%)#709 |
| 25. | Sterling Heights | 7,873 | 1,363,539(0.58%)#25 | 41,288,572(0.02%)#718 |
| 26. | Wyoming | 7,717 | 1,363,539(0.57%)#26 | 41,288,572(0.02%)#732 |
| 27. | Muskegon Heights | 7,602 | 1,363,539(0.56%)#27 | 41,288,572(0.02%)#746 |
| 28. | Jackson | 6,432 | 1,363,539(0.47%)#28 | 41,288,572(0.02%)#845 |
| 29. | Beecher | 5,723 | 1,363,539(0.42%)#29 | 41,288,572(0.01%)#941 |
| 30. | Novi | 5,312 | 1,363,539(0.39%)#30 | 41,288,572(0.01%)#1,006 |
| 31. | Dearborn Heights | 5,296 | 1,363,539(0.39%)#31 | 41,288,572(0.01%)#1,010 |
| 32. | Ypsilanti | 4,861 | 1,363,539(0.36%)#32 | 41,288,572(0.01%)#1,079 |
| 33. | Buena Vista | 4,457 | 1,363,539(0.33%)#33 | 41,288,572(0.01%)#1,162 |
| 34. | Livonia | 4,283 | 1,363,539(0.31%)#34 | 41,288,572(0.01%)#1,205 |
| 35. | Wayne | 4,128 | 1,363,539(0.30%)#35 | 41,288,572(0.01%)#1,246 |
| 36. | Ecorse | 4,057 | 1,363,539(0.30%)#36 | 41,288,572(0.01%)#1,266 |
| 37. | Lincoln Park | 3,843 | 1,363,539(0.28%)#37 | 41,288,572(0.01%)#1,330 |
| 38. | Mount Clemens | 3,772 | 1,363,539(0.28%)#38 | 41,288,572(0.01%)#1,351 |
| 39. | Dearborn | 3,558 | 1,363,539(0.26%)#39 | 41,288,572(0.01%)#1,409 |
| 40. | Troy | 3,503 | 1,363,539(0.26%)#40 | 41,288,572(0.01%)#1,423 |
| 41. | Waverly | 3,478 | 1,363,539(0.26%)#41 | 41,288,572(0.01%)#1,430 |
| 42. | Auburn Hills | 3,427 | 1,363,539(0.25%)#42 | 41,288,572(0.01%)#1,450 |
| 43. | East Lansing | 3,383 | 1,363,539(0.25%)#43 | 41,288,572(0.01%)#1,458 |
| 44. | St Clair Shores | 3,372 | 1,363,539(0.25%)#44 | 41,288,572(0.01%)#1,464 |
| 45. | River Rouge | 3,330 | 1,363,539(0.24%)#45 | 41,288,572(0.01%)#1,491 |
| 46. | Royal Oak | 3,221 | 1,363,539(0.24%)#46 | 41,288,572(0.01%)#1,535 |
| 47. | Burton | 2,865 | 1,363,539(0.21%)#47 | 41,288,572(0.01%)#1,676 |
| 48. | Hamtramck | 2,717 | 1,363,539(0.20%)#48 | 41,288,572(0.01%)#1,727 |
| 49. | Lathrup Village | 2,701 | 1,363,539(0.20%)#49 | 41,288,572(0.01%)#1,740 |
| 50. | Fair Plain | 2,678 | 1,363,539(0.20%)#50 | 41,288,572(0.01%)#1,753 |
| 51. | Rochester Hills | 2,643 | 1,363,539(0.19%)#51 | 41,288,572(0.01%)#1,775 |
| 52. | Center Line | 2,628 | 1,363,539(0.19%)#52 | 41,288,572(0.01%)#1,780 |
| 53. | Portage | 2,554 | 1,363,539(0.19%)#53 | 41,288,572(0.01%)#1,826 |
| 54. | Bridgeport | 2,541 | 1,363,539(0.19%)#54 | 41,288,572(0.01%)#1,838 |
| 55. | Port Huron | 2,351 | 1,363,539(0.17%)#55 | 41,288,572(0.01%)#1,954 |
| 56. | Cutlerville | 2,341 | 1,363,539(0.17%)#56 | 41,288,572(0.01%)#1,963 |
| 57. | Southgate | 2,320 | 1,363,539(0.17%)#57 | 41,288,572(0.01%)#1,977 |
| 58. | Holt | 2,229 | 1,363,539(0.16%)#58 | 41,288,572(0.01%)#2,024 |
| 59. | Benton Heights | 2,162 | 1,363,539(0.16%)#59 | 41,288,572(0.01%)#2,077 |
| 60. | Albion | 2,134 | 1,363,539(0.16%)#60 | 41,288,572(0.01%)#2,103 |
| 61. | Madison Heights | 2,094 | 1,363,539(0.15%)#61 | 41,288,572(0.01%)#2,139 |
| 62. | Eastwood | 1,961 | 1,363,539(0.14%)#62 | 41,288,572(0.00%)#2,250 |
| 63. | Holland | 1,928 | 1,363,539(0.14%)#63 | 41,288,572(0.00%)#2,278 |
| 64. | St Louis | 1,896 | 1,363,539(0.14%)#64 | 41,288,572(0.00%)#2,311 |
| 65. | Ionia | 1,873 | 1,363,539(0.14%)#65 | 41,288,572(0.00%)#2,328 |
| 66. | Melvindale | 1,793 | 1,363,539(0.13%)#66 | 41,288,572(0.00%)#2,389 |
| 67. | Garden City | 1,667 | 1,363,539(0.12%)#67 | 41,288,572(0.00%)#2,481 |
| 68. | Niles | 1,597 | 1,363,539(0.12%)#68 | 41,288,572(0.00%)#2,560 |
| 69. | Wixom | 1,573 | 1,363,539(0.12%)#69 | 41,288,572(0.00%)#2,587 |
| 70. | Okemos | 1,560 | 1,363,539(0.11%)#70 | 41,288,572(0.00%)#2,599 |
| 71. | Hazel Park | 1,425 | 1,363,539(0.10%)#71 | 41,288,572(0.00%)#2,767 |
| 72. | Monroe | 1,299 | 1,363,539(0.10%)#72 | 41,288,572(0.00%)#2,916 |
| 73. | Grand Blanc | 1,269 | 1,363,539(0.09%)#73 | 41,288,572(0.00%)#2,962 |
| 74. | Allen Park | 1,230 | 1,363,539(0.09%)#74 | 41,288,572(0.00%)#3,004 |
| 75. | Flat Rock | 1,167 | 1,363,539(0.09%)#75 | 41,288,572(0.00%)#3,109 |
| 76. | Ferndale | 1,122 | 1,363,539(0.08%)#76 | 41,288,572(0.00%)#3,191 |
| 77. | Comstock Park | 1,094 | 1,363,539(0.08%)#77 | 41,288,572(0.00%)#3,240 |
| 78. | Mount Pleasant | 1,082 | 1,363,539(0.08%)#78 | 41,288,572(0.00%)#3,262 |
| 79. | Mount Morris | 1,043 | 1,363,539(0.08%)#79 | 41,288,572(0.00%)#3,349 |
| 80. | Fraser | 1,018 | 1,363,539(0.07%)#80 | 41,288,572(0.00%)#3,387 |
| 81. | Bay City | 1,011 | 1,363,539(0.07%)#81 | 41,288,572(0.00%)#3,403 |
| 82. | Riverview | 1,001 | 1,363,539(0.07%)#82 | 41,288,572(0.00%)#3,426 |
| 83. | Midland | 999 | 1,363,539(0.07%)#83 | 41,288,572(0.00%)#3,429 |
| 84. | Farmington | 953 | 1,363,539(0.07%)#84 | 41,288,572(0.00%)#3,521 |
| 85. | Westwood | 951 | 1,363,539(0.07%)#85 | 41,288,572(0.00%)#3,525 |
| 86. | Grosse Pointe Woods | 922 | 1,363,539(0.07%)#86 | 41,288,572(0.00%)#3,586 |
| 87. | Comstock Northwest | 917 | 1,363,539(0.07%)#87 | 41,288,572(0.00%)#3,599 |
| 88. | Norton Shores | 897 | 1,363,539(0.07%)#88 | 41,288,572(0.00%)#3,637 |
| 89. | Lapeer | 885 | 1,363,539(0.06%)#89 | 41,288,572(0.00%)#3,662 |
| 90. | Woodhaven | 817 | 1,363,539(0.06%)#90 | 41,288,572(0.00%)#3,845 |
| 91. | Adrian | 816 | 1,363,539(0.06%)#91 | 41,288,572(0.00%)#3,846 |
| 92. | Three Rivers | 812 | 1,363,539(0.06%)#92 | 41,288,572(0.00%)#3,856 |
| 93. | Dowagiac | 755 | 1,363,539(0.06%)#93 | 41,288,572(0.00%)#3,990 |
| 94. | Belleville | 731 | 1,363,539(0.05%)#94 | 41,288,572(0.00%)#4,065 |
| 95. | Walker | 708 | 1,363,539(0.05%)#95 | 41,288,572(0.00%)#4,123 |
| 96. | Grandville | 696 | 1,363,539(0.05%)#96 | 41,288,572(0.00%)#4,164 |
| 97. | Coldwater | 695 | 1,363,539(0.05%)#97 | 41,288,572(0.00%)#4,166 |
| 98. | Beverly Hills | 695 | 1,363,539(0.05%)#98 | 41,288,572(0.00%)#4,167 |
| 99. | Birmingham | 694 | 1,363,539(0.05%)#99 | 41,288,572(0.00%)#4,169 |
| 100. | Marquette | 688 | 1,363,539(0.05%)#100 | 41,288,572(0.00%)#4,191 |
Common Questions
What are the Top 10 Cities with the Largest Black / African American Community in Michigan?
Top 10 Cities with the Largest Black / African American Community in Michigan are:
#1
495,533
#2
49,680
#3
46,091
#4
35,425
#5
30,389
#6
27,510
#7
26,796
#8
20,222
#9
19,304
#10
18,887
What city has the Largest Black / African American Community in Michigan?
Detroit has the Largest Black / African American Community in Michigan with 495,533.
What is the Total Black / African American Population in the State of Michigan?
Total Black / African American Population in Michigan is 1,363,539.
What is the Total Black / African American Population in the United States?
Total Black / African American Population in the United States is 41,288,572.