San Diego, CA Map & Demographics
San Diego Map
San Diego Overview
$51,368
PER CAPITA INCOME
$115,908
AVG FAMILY INCOME
$98,657
AVG HOUSEHOLD INCOME
25.2%
WAGE / INCOME GAP [ % ]
74.8¢/ $1
WAGE / INCOME GAP [ $ ]
$10,783
FAMILY INCOME DEFICIT
0.46
INEQUALITY / GINI INDEX
1,383,987
TOTAL POPULATION
706,494
MALE POPULATION
677,493
FEMALE POPULATION
104.28
MALES / 100 FEMALES
95.90
FEMALES / 100 MALES
35.8
MEDIAN AGE
3.2
AVG FAMILY SIZE
2.6
AVG HOUSEHOLD SIZE
783,143
LABOR FORCE [ PEOPLE ]
68.1%
PERCENT IN LABOR FORCE
6.1%
UNEMPLOYMENT RATE
San Diego Zip Codes
Income in San Diego
Income Overview in San Diego
Per Capita Income in San Diego is $51,368, while median incomes of families and households are $115,908 and $98,657 respectively.
| Characteristic | Number | Measure |
| Per Capita Income | 1,383,987 | $51,368 |
| Median Family Income | 308,175 | $115,908 |
| Mean Family Income | 308,175 | $153,967 |
| Median Household Income | 515,475 | $98,657 |
| Mean Household Income | 515,475 | $132,533 |
| Income Deficit | 308,175 | $10,783 |
| Wage / Income Gap (%) | 1,383,987 | 25.17% |
| Wage / Income Gap ($) | 1,383,987 | 74.83¢ per $1 |
| Gini / Inequality Index | 1,383,987 | 0.46 |
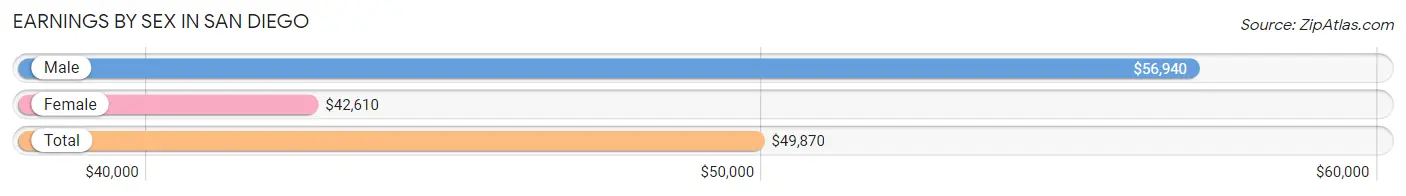
Earnings by Sex in San Diego
Average Earnings in San Diego are $49,870, $56,940 for men and $42,610 for women, a difference of 25.2%.
| Sex | Number | Average Earnings |
| Male | 441,423 (55.0%) | $56,940 |
| Female | 360,938 (45.0%) | $42,610 |
| Total | 802,361 (100.0%) | $49,870 |
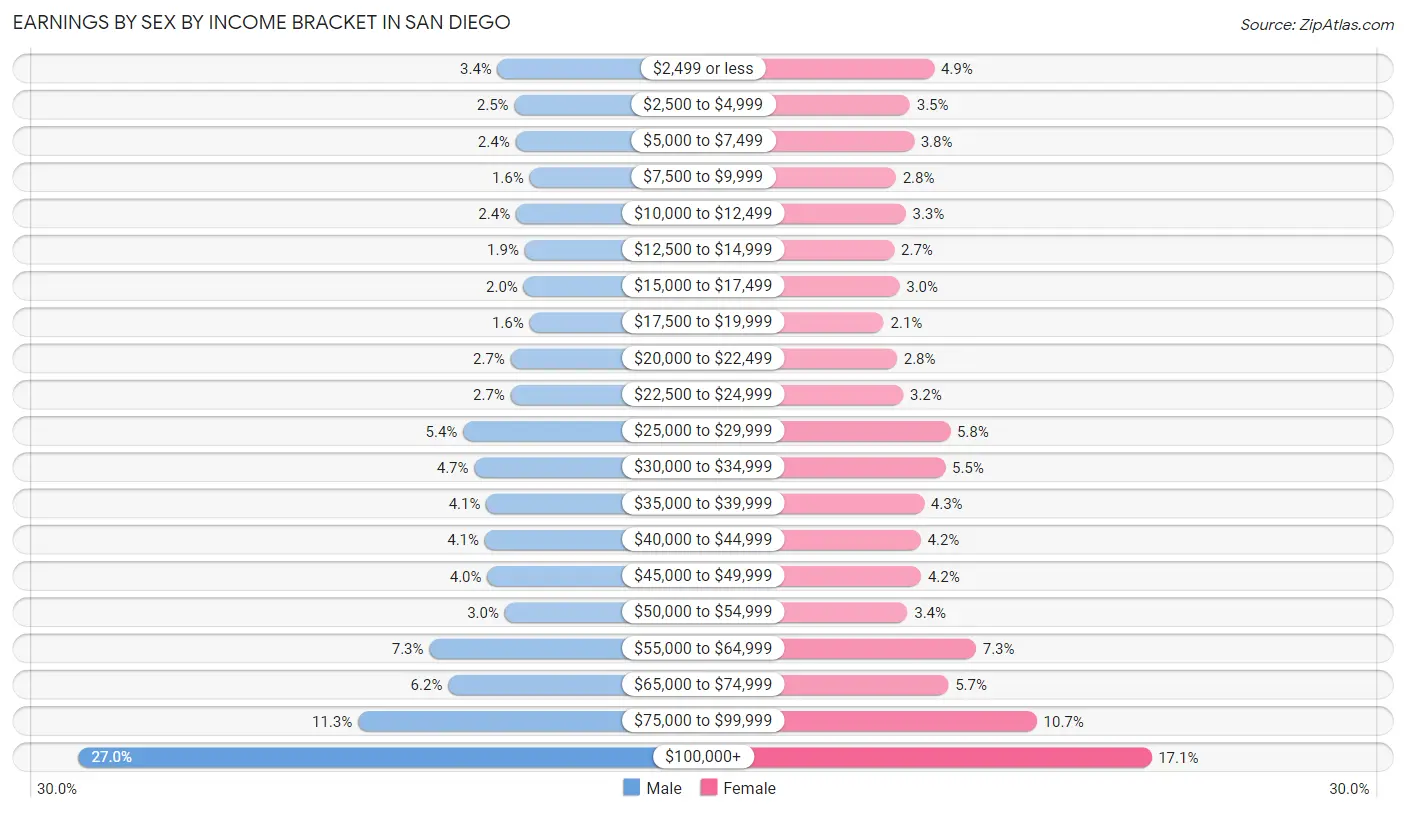
Earnings by Sex by Income Bracket in San Diego
The most common earnings brackets in San Diego are $100,000+ for men (119,003 | 27.0%) and $100,000+ for women (61,756 | 17.1%).
| Income | Male | Female |
| $2,499 or less | 15,035 (3.4%) | 17,681 (4.9%) |
| $2,500 to $4,999 | 10,907 (2.5%) | 12,779 (3.5%) |
| $5,000 to $7,499 | 10,650 (2.4%) | 13,582 (3.8%) |
| $7,500 to $9,999 | 7,129 (1.6%) | 9,929 (2.8%) |
| $10,000 to $12,499 | 10,495 (2.4%) | 11,917 (3.3%) |
| $12,500 to $14,999 | 8,343 (1.9%) | 9,591 (2.7%) |
| $15,000 to $17,499 | 8,622 (1.9%) | 10,633 (2.9%) |
| $17,500 to $19,999 | 7,143 (1.6%) | 7,483 (2.1%) |
| $20,000 to $22,499 | 11,819 (2.7%) | 10,159 (2.8%) |
| $22,500 to $24,999 | 11,832 (2.7%) | 11,400 (3.2%) |
| $25,000 to $29,999 | 23,620 (5.3%) | 20,924 (5.8%) |
| $30,000 to $34,999 | 20,825 (4.7%) | 19,935 (5.5%) |
| $35,000 to $39,999 | 17,864 (4.1%) | 15,611 (4.3%) |
| $40,000 to $44,999 | 18,237 (4.1%) | 14,978 (4.2%) |
| $45,000 to $49,999 | 17,610 (4.0%) | 15,063 (4.2%) |
| $50,000 to $54,999 | 13,286 (3.0%) | 12,273 (3.4%) |
| $55,000 to $64,999 | 31,985 (7.2%) | 26,162 (7.2%) |
| $65,000 to $74,999 | 27,313 (6.2%) | 20,557 (5.7%) |
| $75,000 to $99,999 | 49,705 (11.3%) | 38,525 (10.7%) |
| $100,000+ | 119,003 (27.0%) | 61,756 (17.1%) |
| Total | 441,423 (100.0%) | 360,938 (100.0%) |
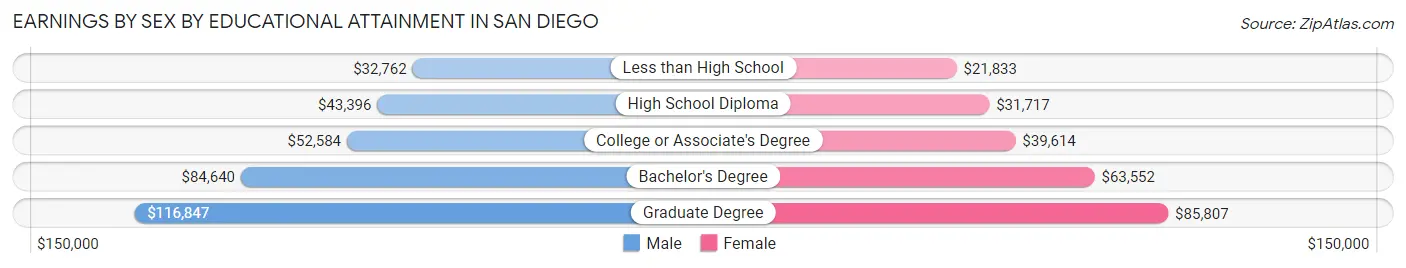
Earnings by Sex by Educational Attainment in San Diego
Average earnings in San Diego are $66,031 for men and $50,352 for women, a difference of 23.7%. Men with an educational attainment of graduate degree enjoy the highest average annual earnings of $116,847, while those with less than high school education earn the least with $32,762. Women with an educational attainment of graduate degree earn the most with the average annual earnings of $85,807, while those with less than high school education have the smallest earnings of $21,833.
| Educational Attainment | Male Income | Female Income |
| Less than High School | $32,762 | $21,833 |
| High School Diploma | $43,396 | $31,717 |
| College or Associate's Degree | $52,584 | $39,614 |
| Bachelor's Degree | $84,640 | $63,552 |
| Graduate Degree | $116,847 | $85,807 |
| Total | $66,031 | $50,352 |
Family Income in San Diego
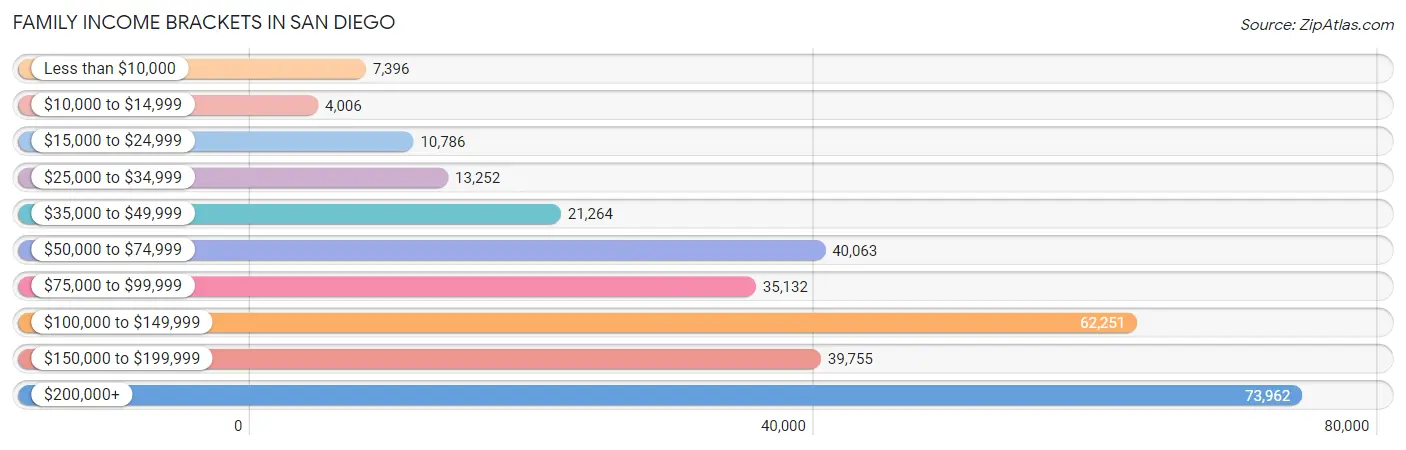
Family Income Brackets in San Diego
According to the San Diego family income data, there are 73,962 families falling into the $200,000+ income range, which is the most common income bracket and makes up 24.0% of all families. Conversely, the $10,000 to $14,999 income bracket is the least frequent group with only 4,006 families (1.3%) belonging to this category.
| Income Bracket | # Families | % Families |
| Less than $10,000 | 7,396 | 2.4% |
| $10,000 to $14,999 | 4,006 | 1.3% |
| $15,000 to $24,999 | 10,786 | 3.5% |
| $25,000 to $34,999 | 13,252 | 4.3% |
| $35,000 to $49,999 | 21,264 | 6.9% |
| $50,000 to $74,999 | 40,063 | 13.0% |
| $75,000 to $99,999 | 35,132 | 11.4% |
| $100,000 to $149,999 | 62,251 | 20.2% |
| $150,000 to $199,999 | 39,755 | 12.9% |
| $200,000+ | 73,962 | 24.0% |
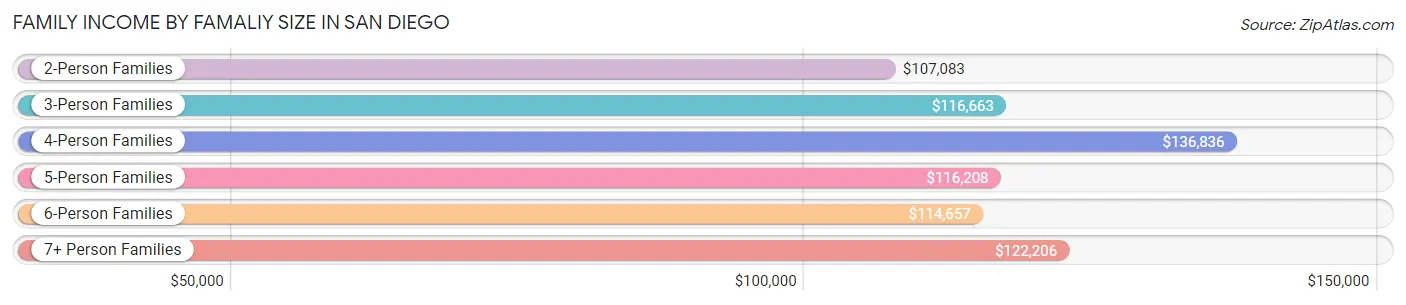
Family Income by Famaliy Size in San Diego
4-person families (60,195 | 19.5%) account for the highest median family income in San Diego with $136,836 per family, while 2-person families (137,741 | 44.7%) have the highest median income of $53,542 per family member.
| Income Bracket | # Families | Median Income |
| 2-Person Families | 137,741 (44.7%) | $107,083 |
| 3-Person Families | 70,347 (22.8%) | $116,663 |
| 4-Person Families | 60,195 (19.5%) | $136,836 |
| 5-Person Families | 24,805 (8.1%) | $116,208 |
| 6-Person Families | 8,842 (2.9%) | $114,657 |
| 7+ Person Families | 6,245 (2.0%) | $122,206 |
| Total | 308,175 (100.0%) | $115,908 |
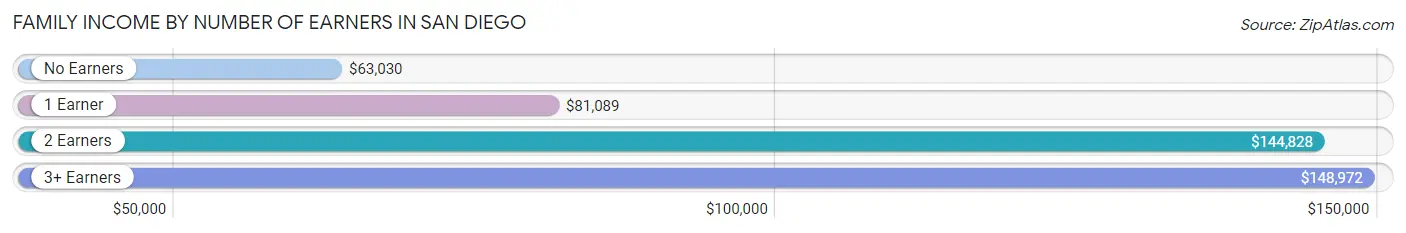
Family Income by Number of Earners in San Diego
The median family income in San Diego is $115,908, with families comprising 3+ earners (35,778) having the highest median family income of $148,972, while families with no earners (36,164) have the lowest median family income of $63,030, accounting for 11.6% and 11.7% of families, respectively.
| Number of Earners | # Families | Median Income |
| No Earners | 36,164 (11.7%) | $63,030 |
| 1 Earner | 97,739 (31.7%) | $81,089 |
| 2 Earners | 138,494 (44.9%) | $144,828 |
| 3+ Earners | 35,778 (11.6%) | $148,972 |
| Total | 308,175 (100.0%) | $115,908 |
Household Income in San Diego
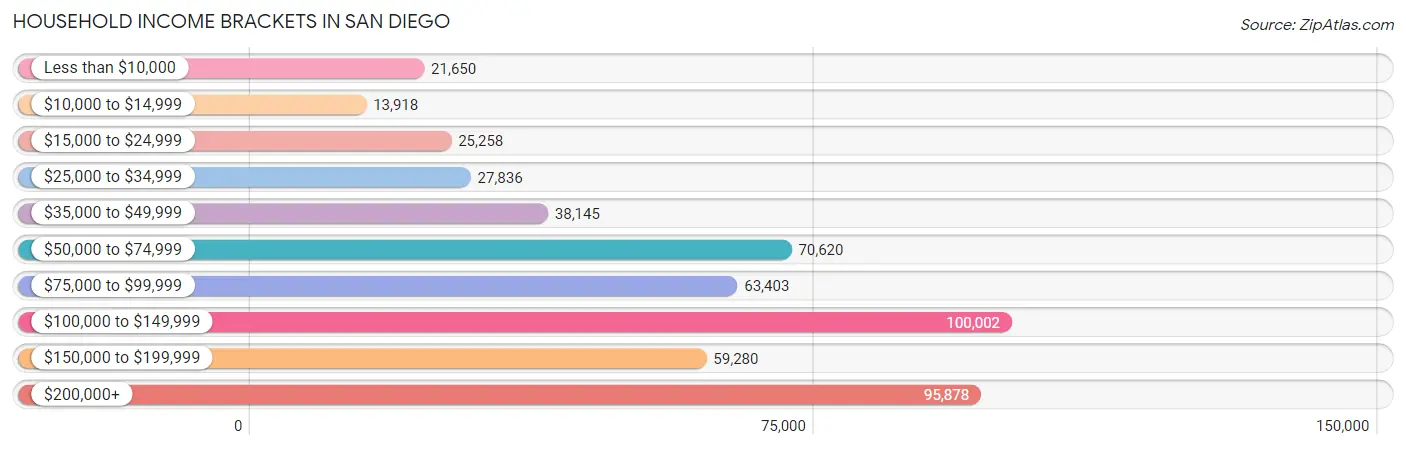
Household Income Brackets in San Diego
With 100,002 households falling in the category, the $100,000 to $149,999 income range is the most frequent in San Diego, accounting for 19.4% of all households. In contrast, only 13,918 households (2.7%) fall into the $10,000 to $14,999 income bracket, making it the least populous group.
| Income Bracket | # Households | % Households |
| Less than $10,000 | 21,650 | 4.2% |
| $10,000 to $14,999 | 13,918 | 2.7% |
| $15,000 to $24,999 | 25,258 | 4.9% |
| $25,000 to $34,999 | 27,836 | 5.4% |
| $35,000 to $49,999 | 38,145 | 7.4% |
| $50,000 to $74,999 | 70,620 | 13.7% |
| $75,000 to $99,999 | 63,403 | 12.3% |
| $100,000 to $149,999 | 100,002 | 19.4% |
| $150,000 to $199,999 | 59,280 | 11.5% |
| $200,000+ | 95,878 | 18.6% |
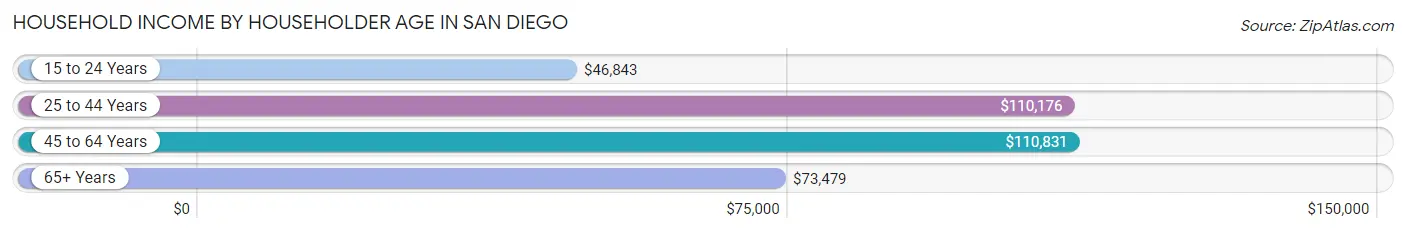
Household Income by Householder Age in San Diego
The median household income in San Diego is $98,657, with the highest median household income of $110,831 found in the 45 to 64 years age bracket for the primary householder. A total of 170,737 households (33.1%) fall into this category. Meanwhile, the 15 to 24 years age bracket for the primary householder has the lowest median household income of $46,843, with 22,445 households (4.3%) in this group.
| Income Bracket | # Households | Median Income |
| 15 to 24 Years | 22,445 (4.3%) | $46,843 |
| 25 to 44 Years | 211,012 (40.9%) | $110,176 |
| 45 to 64 Years | 170,737 (33.1%) | $110,831 |
| 65+ Years | 111,281 (21.6%) | $73,479 |
| Total | 515,475 (100.0%) | $98,657 |
Poverty in San Diego
Income Below Poverty by Sex and Age in San Diego
With 10.5% poverty level for males and 12.3% for females among the residents of San Diego, 18 to 24 year old males and 18 to 24 year old females are the most vulnerable to poverty, with 15,218 males (23.3%) and 15,973 females (26.8%) in their respective age groups living below the poverty level.
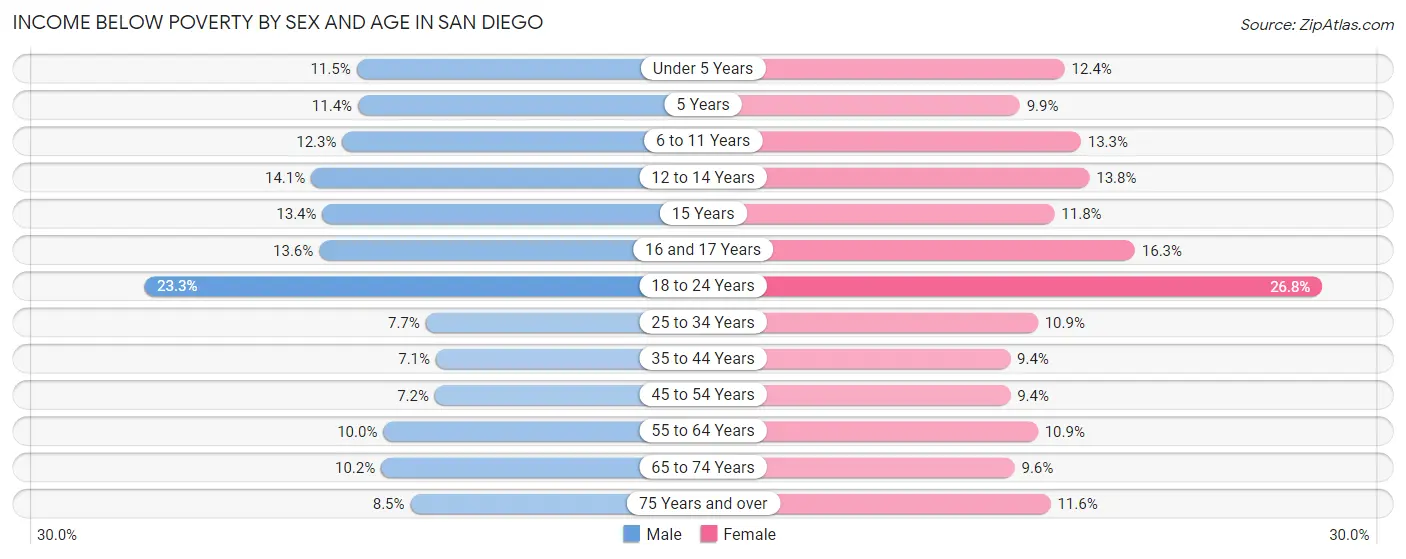
| Age Bracket | Male | Female |
| Under 5 Years | 4,204 (11.5%) | 4,640 (12.4%) |
| 5 Years | 930 (11.4%) | 580 (9.9%) |
| 6 to 11 Years | 5,389 (12.3%) | 5,417 (13.3%) |
| 12 to 14 Years | 3,326 (14.1%) | 2,978 (13.8%) |
| 15 Years | 1,031 (13.4%) | 750 (11.8%) |
| 16 and 17 Years | 1,911 (13.6%) | 2,309 (16.3%) |
| 18 to 24 Years | 15,218 (23.3%) | 15,973 (26.8%) |
| 25 to 34 Years | 10,181 (7.7%) | 13,265 (10.9%) |
| 35 to 44 Years | 7,306 (7.1%) | 8,911 (9.4%) |
| 45 to 54 Years | 6,159 (7.2%) | 7,597 (9.4%) |
| 55 to 64 Years | 7,583 (10.0%) | 8,162 (10.9%) |
| 65 to 74 Years | 5,221 (10.2%) | 5,717 (9.6%) |
| 75 Years and over | 2,874 (8.5%) | 5,187 (11.6%) |
| Total | 71,333 (10.5%) | 81,486 (12.3%) |
Income Above Poverty by Sex and Age in San Diego
According to the poverty statistics in San Diego, males aged 35 to 44 years and females aged 35 to 44 years are the age groups that are most secure financially, with 92.9% of males and 90.6% of females in these age groups living above the poverty line.
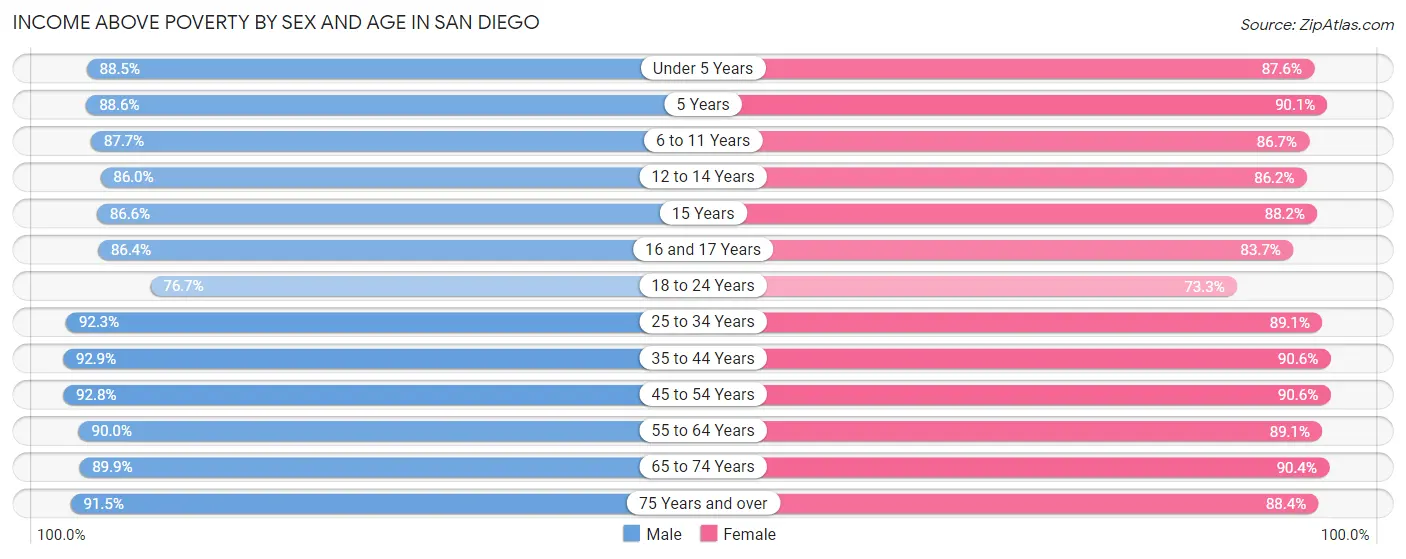
| Age Bracket | Male | Female |
| Under 5 Years | 32,296 (88.5%) | 32,751 (87.6%) |
| 5 Years | 7,201 (88.6%) | 5,272 (90.1%) |
| 6 to 11 Years | 38,376 (87.7%) | 35,278 (86.7%) |
| 12 to 14 Years | 20,340 (86.0%) | 18,632 (86.2%) |
| 15 Years | 6,653 (86.6%) | 5,585 (88.2%) |
| 16 and 17 Years | 12,140 (86.4%) | 11,838 (83.7%) |
| 18 to 24 Years | 49,987 (76.7%) | 43,732 (73.3%) |
| 25 to 34 Years | 122,600 (92.3%) | 108,351 (89.1%) |
| 35 to 44 Years | 95,664 (92.9%) | 86,160 (90.6%) |
| 45 to 54 Years | 79,813 (92.8%) | 73,352 (90.6%) |
| 55 to 64 Years | 68,026 (90.0%) | 66,666 (89.1%) |
| 65 to 74 Years | 46,225 (89.8%) | 53,681 (90.4%) |
| 75 Years and over | 30,842 (91.5%) | 39,464 (88.4%) |
| Total | 610,163 (89.5%) | 580,762 (87.7%) |
Income Below Poverty Among Married-Couple Families in San Diego
The poverty statistics for married-couple families in San Diego show that 4.2% or 9,720 of the total 231,023 families live below the poverty line. Families with 5 or more children have the highest poverty rate of 35.3%, comprising of 297 families. On the other hand, families with no children have the lowest poverty rate of 3.2%, which includes 4,121 families.
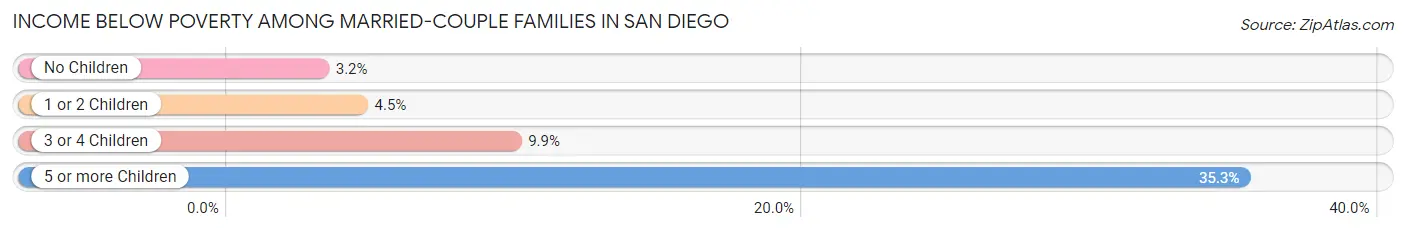
| Children | Above Poverty | Below Poverty |
| No Children | 126,377 (96.8%) | 4,121 (3.2%) |
| 1 or 2 Children | 80,802 (95.5%) | 3,817 (4.5%) |
| 3 or 4 Children | 13,579 (90.1%) | 1,485 (9.9%) |
| 5 or more Children | 545 (64.7%) | 297 (35.3%) |
| Total | 221,303 (95.8%) | 9,720 (4.2%) |
Income Below Poverty Among Single-Parent Households in San Diego
According to the poverty data in San Diego, 9.5% or 2,188 single-father households and 18.2% or 9,852 single-mother households are living below the poverty line. Among single-father households, those with 5 or more children have the highest poverty rate, with 25 households (39.1%) experiencing poverty. Likewise, among single-mother households, those with 5 or more children have the highest poverty rate, with 314 households (84.9%) falling below the poverty line.
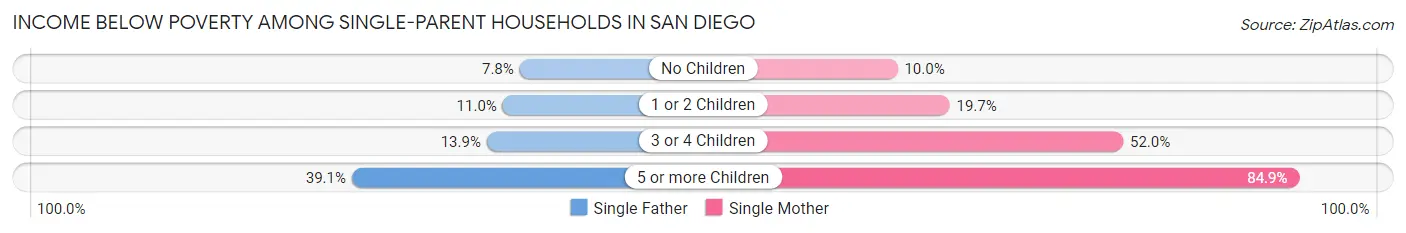
| Children | Single Father | Single Mother |
| No Children | 972 (7.8%) | 2,450 (10.0%) |
| 1 or 2 Children | 1,044 (11.0%) | 4,951 (19.7%) |
| 3 or 4 Children | 147 (13.9%) | 2,137 (52.0%) |
| 5 or more Children | 25 (39.1%) | 314 (84.9%) |
| Total | 2,188 (9.5%) | 9,852 (18.2%) |
Income Below Poverty Among Married-Couple vs Single-Parent Households in San Diego
The poverty data for San Diego shows that 9,720 of the married-couple family households (4.2%) and 12,040 of the single-parent households (15.6%) are living below the poverty level. Within the married-couple family households, those with 5 or more children have the highest poverty rate, with 297 households (35.3%) falling below the poverty line. Among the single-parent households, those with 5 or more children have the highest poverty rate, with 339 household (78.1%) living below poverty.
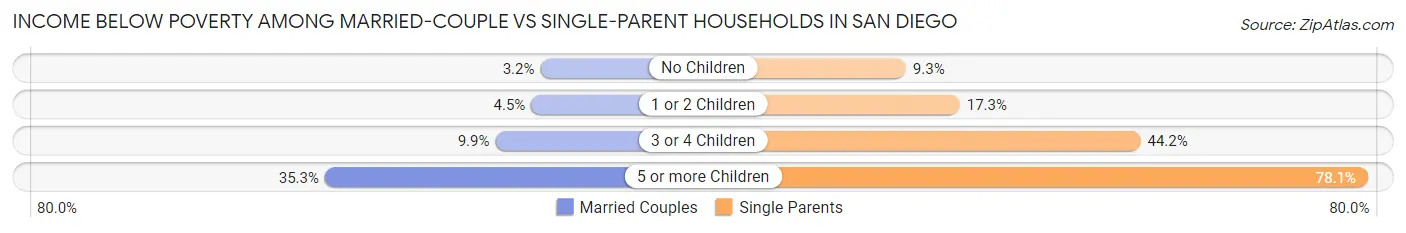
| Children | Married-Couple Families | Single-Parent Households |
| No Children | 4,121 (3.2%) | 3,422 (9.3%) |
| 1 or 2 Children | 3,817 (4.5%) | 5,995 (17.3%) |
| 3 or 4 Children | 1,485 (9.9%) | 2,284 (44.2%) |
| 5 or more Children | 297 (35.3%) | 339 (78.1%) |
| Total | 9,720 (4.2%) | 12,040 (15.6%) |
Race in San Diego
The most populous races in San Diego are White / Caucasian (753,945 | 54.5%), Hispanic or Latino (416,630 | 30.1%), and Asian (240,252 | 17.4%).
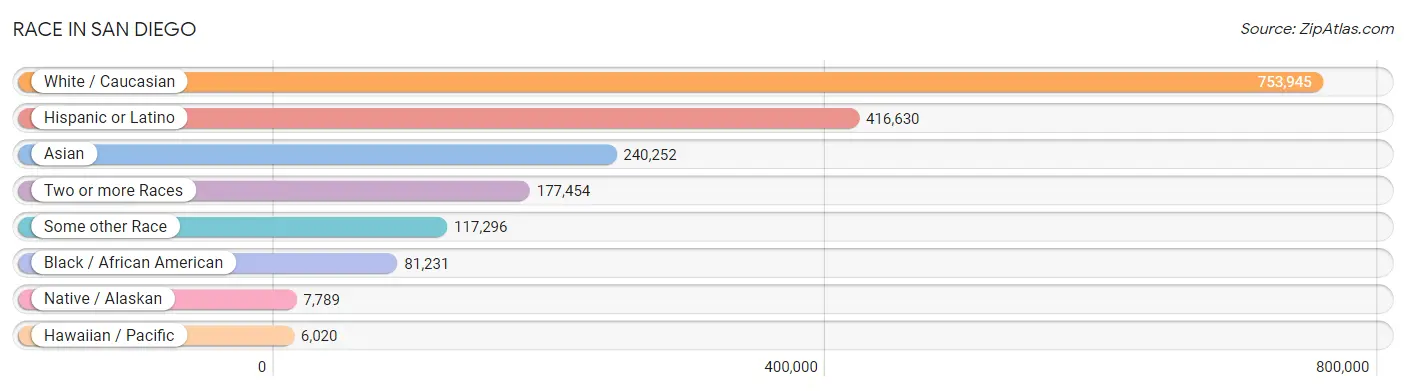
| Race | # Population | % Population |
| Asian | 240,252 | 17.4% |
| Black / African American | 81,231 | 5.9% |
| Hawaiian / Pacific | 6,020 | 0.4% |
| Hispanic or Latino | 416,630 | 30.1% |
| Native / Alaskan | 7,789 | 0.6% |
| White / Caucasian | 753,945 | 54.5% |
| Two or more Races | 177,454 | 12.8% |
| Some other Race | 117,296 | 8.5% |
| Total | 1,383,987 | 100.0% |
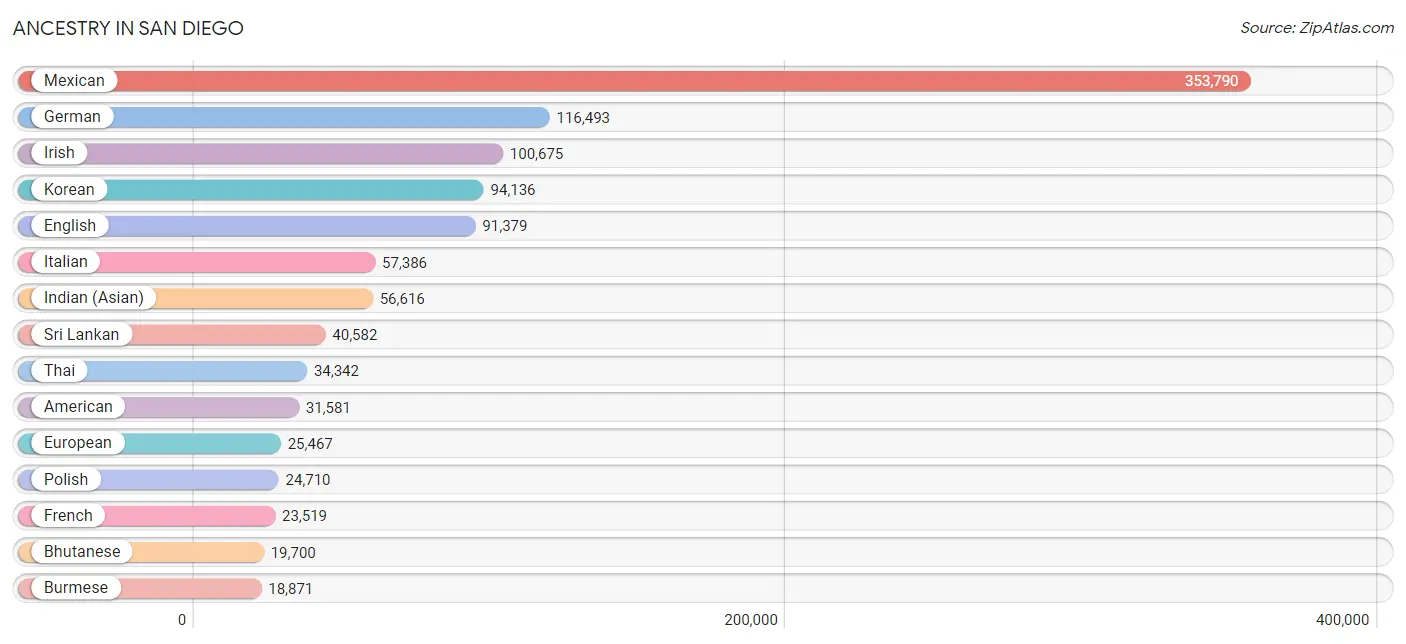
Ancestry in San Diego
The most populous ancestries reported in San Diego are Mexican (353,790 | 25.6%), German (116,493 | 8.4%), Irish (100,675 | 7.3%), Korean (94,136 | 6.8%), and English (91,379 | 6.6%), together accounting for 54.6% of all San Diego residents.
| Ancestry | # Population | % Population |
| Afghan | 1,766 | 0.1% |
| African | 5,342 | 0.4% |
| Alaska Native | 44 | 0.0% |
| Alaskan Athabascan | 10 | 0.0% |
| Albanian | 447 | 0.0% |
| Aleut | 19 | 0.0% |
| Alsatian | 4 | 0.0% |
| American | 31,581 | 2.3% |
| Apache | 500 | 0.0% |
| Arab | 11,953 | 0.9% |
| Arapaho | 4 | 0.0% |
| Argentinean | 1,785 | 0.1% |
| Armenian | 2,421 | 0.2% |
| Assyrian / Chaldean / Syriac | 671 | 0.1% |
| Australian | 434 | 0.0% |
| Austrian | 2,428 | 0.2% |
| Bahamian | 73 | 0.0% |
| Bangladeshi | 1,003 | 0.1% |
| Barbadian | 135 | 0.0% |
| Basque | 619 | 0.0% |
| Belgian | 1,077 | 0.1% |
| Belizean | 128 | 0.0% |
| Bermudan | 38 | 0.0% |
| Bhutanese | 19,700 | 1.4% |
| Blackfeet | 673 | 0.1% |
| Bolivian | 213 | 0.0% |
| Brazilian | 3,888 | 0.3% |
| British | 9,573 | 0.7% |
| British West Indian | 211 | 0.0% |
| Bulgarian | 1,183 | 0.1% |
| Burmese | 18,871 | 1.4% |
| Cajun | 28 | 0.0% |
| Cambodian | 152 | 0.0% |
| Canadian | 2,924 | 0.2% |
| Cape Verdean | 141 | 0.0% |
| Celtic | 104 | 0.0% |
| Central American | 12,342 | 0.9% |
| Central American Indian | 1,153 | 0.1% |
| Cherokee | 2,791 | 0.2% |
| Chickasaw | 215 | 0.0% |
| Chilean | 2,535 | 0.2% |
| Chinese | 117 | 0.0% |
| Chippewa | 259 | 0.0% |
| Choctaw | 1,333 | 0.1% |
| Colombian | 5,430 | 0.4% |
| Colville | 15 | 0.0% |
| Comanche | 71 | 0.0% |
| Costa Rican | 601 | 0.0% |
| Cree | 41 | 0.0% |
| Creek | 134 | 0.0% |
| Croatian | 1,475 | 0.1% |
| Crow | 13 | 0.0% |
| Cuban | 3,890 | 0.3% |
| Cypriot | 217 | 0.0% |
| Czech | 3,488 | 0.3% |
| Czechoslovakian | 751 | 0.1% |
| Danish | 5,788 | 0.4% |
| Delaware | 88 | 0.0% |
| Dominican | 1,713 | 0.1% |
| Dutch | 10,416 | 0.7% |
| Dutch West Indian | 7 | 0.0% |
| Eastern European | 6,403 | 0.5% |
| Ecuadorian | 1,267 | 0.1% |
| Egyptian | 1,402 | 0.1% |
| English | 91,379 | 6.6% |
| Estonian | 417 | 0.0% |
| Ethiopian | 3,074 | 0.2% |
| European | 25,467 | 1.8% |
| Fijian | 175 | 0.0% |
| Filipino | 4,660 | 0.3% |
| Finnish | 2,129 | 0.2% |
| French | 23,519 | 1.7% |
| French American Indian | 62 | 0.0% |
| French Canadian | 4,060 | 0.3% |
| German | 116,493 | 8.4% |
| German Russian | 12 | 0.0% |
| Ghanaian | 133 | 0.0% |
| Greek | 6,371 | 0.5% |
| Guamanian / Chamorro | 4,081 | 0.3% |
| Guatemalan | 4,458 | 0.3% |
| Guyanese | 137 | 0.0% |
| Haitian | 1,148 | 0.1% |
| Honduran | 992 | 0.1% |
| Hopi | 25 | 0.0% |
| Houma | 4 | 0.0% |
| Hungarian | 5,642 | 0.4% |
| Icelander | 175 | 0.0% |
| Indian (Asian) | 56,616 | 4.1% |
| Indonesian | 1,228 | 0.1% |
| Inupiat | 9 | 0.0% |
| Iranian | 9,043 | 0.6% |
| Iraqi | 1,129 | 0.1% |
| Irish | 100,675 | 7.3% |
| Iroquois | 194 | 0.0% |
| Israeli | 1,445 | 0.1% |
| Italian | 57,386 | 4.2% |
| Jamaican | 1,705 | 0.1% |
| Japanese | 6,080 | 0.4% |
| Jordanian | 250 | 0.0% |
| Kenyan | 310 | 0.0% |
| Kiowa | 24 | 0.0% |
| Korean | 94,136 | 6.8% |
| Laotian | 1,445 | 0.1% |
| Latvian | 411 | 0.0% |
| Lebanese | 3,064 | 0.2% |
| Liberian | 61 | 0.0% |
| Lithuanian | 3,031 | 0.2% |
| Lumbee | 25 | 0.0% |
| Luxembourger | 368 | 0.0% |
| Macedonian | 247 | 0.0% |
| Malaysian | 7,269 | 0.5% |
| Maltese | 184 | 0.0% |
| Menominee | 48 | 0.0% |
| Mexican | 353,790 | 25.6% |
| Mexican American Indian | 3,420 | 0.3% |
| Mongolian | 201 | 0.0% |
| Moroccan | 526 | 0.0% |
| Native Hawaiian | 3,465 | 0.3% |
| Navajo | 591 | 0.0% |
| Nepalese | 81 | 0.0% |
| New Zealander | 149 | 0.0% |
| Nicaraguan | 935 | 0.1% |
| Nigerian | 1,223 | 0.1% |
| Northern European | 3,292 | 0.2% |
| Norwegian | 13,628 | 1.0% |
| Okinawan | 17 | 0.0% |
| Osage | 111 | 0.0% |
| Ottawa | 11 | 0.0% |
| Paiute | 6 | 0.0% |
| Pakistani | 3,116 | 0.2% |
| Palestinian | 957 | 0.1% |
| Panamanian | 996 | 0.1% |
| Paraguayan | 48 | 0.0% |
| Pennsylvania German | 134 | 0.0% |
| Peruvian | 2,779 | 0.2% |
| Pima | 53 | 0.0% |
| Polish | 24,710 | 1.8% |
| Portuguese | 9,676 | 0.7% |
| Potawatomi | 97 | 0.0% |
| Pueblo | 302 | 0.0% |
| Puerto Rican | 11,452 | 0.8% |
| Romanian | 2,291 | 0.2% |
| Russian | 14,775 | 1.1% |
| Salvadoran | 4,242 | 0.3% |
| Samoan | 2,103 | 0.2% |
| Scandinavian | 4,569 | 0.3% |
| Scotch-Irish | 7,047 | 0.5% |
| Scottish | 18,442 | 1.3% |
| Seminole | 208 | 0.0% |
| Serbian | 1,185 | 0.1% |
| Shoshone | 28 | 0.0% |
| Sierra Leonean | 42 | 0.0% |
| Sioux | 767 | 0.1% |
| Slavic | 357 | 0.0% |
| Slovak | 1,825 | 0.1% |
| Slovene | 473 | 0.0% |
| Somali | 3,076 | 0.2% |
| South African | 1,136 | 0.1% |
| South American | 15,517 | 1.1% |
| South American Indian | 229 | 0.0% |
| Soviet Union | 60 | 0.0% |
| Spaniard | 6,329 | 0.5% |
| Spanish | 4,348 | 0.3% |
| Spanish American | 85 | 0.0% |
| Spanish American Indian | 106 | 0.0% |
| Sri Lankan | 40,582 | 2.9% |
| Subsaharan African | 16,642 | 1.2% |
| Sudanese | 1,015 | 0.1% |
| Swedish | 15,658 | 1.1% |
| Swiss | 3,749 | 0.3% |
| Syrian | 867 | 0.1% |
| Thai | 34,342 | 2.5% |
| Tlingit-Haida | 229 | 0.0% |
| Tohono O'Odham | 51 | 0.0% |
| Tongan | 328 | 0.0% |
| Trinidadian and Tobagonian | 200 | 0.0% |
| Tsimshian | 34 | 0.0% |
| Turkish | 1,502 | 0.1% |
| Ugandan | 347 | 0.0% |
| Ukrainian | 5,009 | 0.4% |
| Uruguayan | 388 | 0.0% |
| Ute | 13 | 0.0% |
| Venezuelan | 995 | 0.1% |
| Vietnamese | 513 | 0.0% |
| Welsh | 6,389 | 0.5% |
| West Indian | 440 | 0.0% |
| Yaqui | 812 | 0.1% |
| Yugoslavian | 606 | 0.0% |
| Yuman | 69 | 0.0% |
| Zimbabwean | 100 | 0.0% | View All 190 Rows |
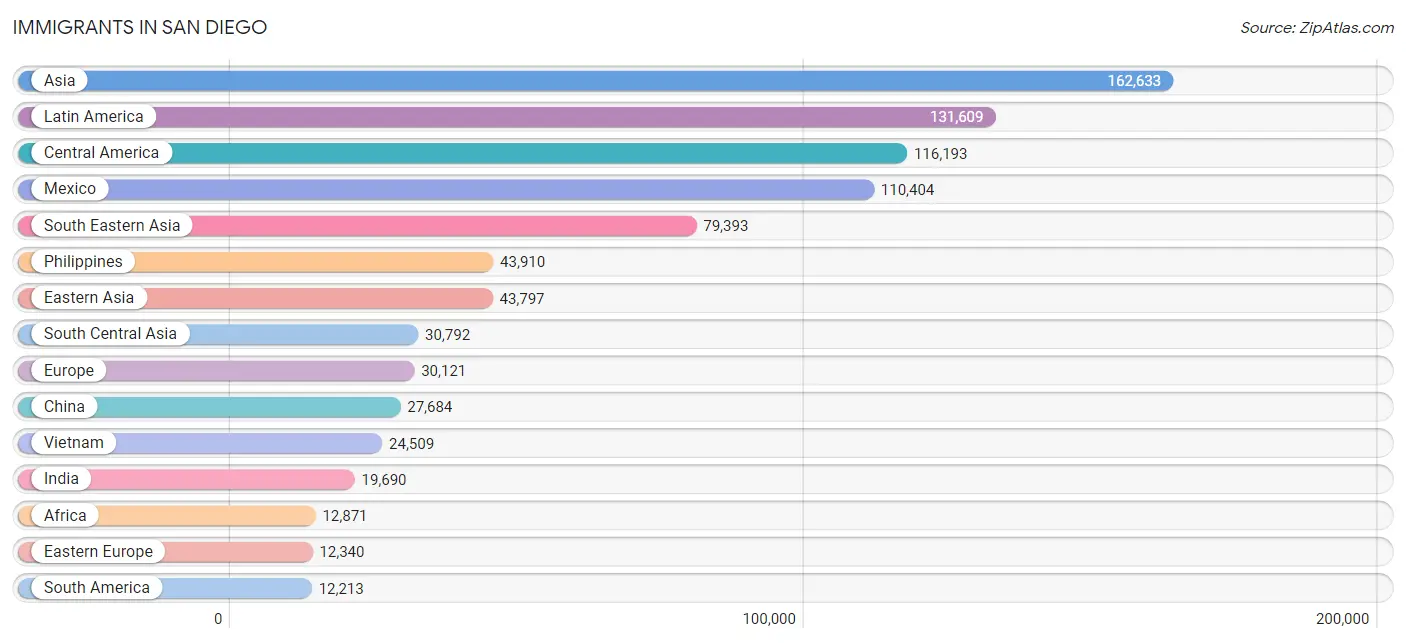
Immigrants in San Diego
The most numerous immigrant groups reported in San Diego came from Asia (162,633 | 11.7%), Latin America (131,609 | 9.5%), Central America (116,193 | 8.4%), Mexico (110,404 | 8.0%), and South Eastern Asia (79,393 | 5.7%), together accounting for 43.4% of all San Diego residents.
| Immigration Origin | # Population | % Population |
| Afghanistan | 1,305 | 0.1% |
| Africa | 12,871 | 0.9% |
| Albania | 262 | 0.0% |
| Argentina | 1,021 | 0.1% |
| Armenia | 355 | 0.0% |
| Asia | 162,633 | 11.7% |
| Australia | 963 | 0.1% |
| Austria | 232 | 0.0% |
| Azores | 40 | 0.0% |
| Bahamas | 15 | 0.0% |
| Bangladesh | 500 | 0.0% |
| Barbados | 9 | 0.0% |
| Belarus | 389 | 0.0% |
| Belgium | 359 | 0.0% |
| Belize | 130 | 0.0% |
| Bolivia | 174 | 0.0% |
| Bosnia and Herzegovina | 378 | 0.0% |
| Brazil | 4,289 | 0.3% |
| Bulgaria | 867 | 0.1% |
| Cambodia | 2,030 | 0.2% |
| Cameroon | 178 | 0.0% |
| Canada | 5,175 | 0.4% |
| Caribbean | 3,203 | 0.2% |
| Central America | 116,193 | 8.4% |
| Chile | 662 | 0.1% |
| China | 27,684 | 2.0% |
| Colombia | 3,162 | 0.2% |
| Congo | 242 | 0.0% |
| Costa Rica | 199 | 0.0% |
| Croatia | 60 | 0.0% |
| Cuba | 952 | 0.1% |
| Czechoslovakia | 543 | 0.0% |
| Denmark | 238 | 0.0% |
| Dominican Republic | 606 | 0.0% |
| Eastern Africa | 6,441 | 0.5% |
| Eastern Asia | 43,797 | 3.2% |
| Eastern Europe | 12,340 | 0.9% |
| Ecuador | 397 | 0.0% |
| Egypt | 660 | 0.1% |
| El Salvador | 1,380 | 0.1% |
| England | 1,898 | 0.1% |
| Eritrea | 518 | 0.0% |
| Ethiopia | 2,446 | 0.2% |
| Europe | 30,121 | 2.2% |
| Fiji | 148 | 0.0% |
| France | 2,132 | 0.2% |
| Germany | 3,151 | 0.2% |
| Ghana | 155 | 0.0% |
| Greece | 426 | 0.0% |
| Grenada | 37 | 0.0% |
| Guatemala | 2,819 | 0.2% |
| Guyana | 91 | 0.0% |
| Haiti | 753 | 0.1% |
| Honduras | 544 | 0.0% |
| Hong Kong | 1,913 | 0.1% |
| Hungary | 383 | 0.0% |
| India | 19,690 | 1.4% |
| Indonesia | 696 | 0.1% |
| Iran | 6,750 | 0.5% |
| Iraq | 1,523 | 0.1% |
| Ireland | 569 | 0.0% |
| Israel | 1,610 | 0.1% |
| Italy | 1,632 | 0.1% |
| Jamaica | 615 | 0.0% |
| Japan | 6,333 | 0.5% |
| Jordan | 349 | 0.0% |
| Kazakhstan | 315 | 0.0% |
| Kenya | 711 | 0.1% |
| Korea | 9,638 | 0.7% |
| Kuwait | 724 | 0.1% |
| Laos | 3,699 | 0.3% |
| Latin America | 131,609 | 9.5% |
| Latvia | 106 | 0.0% |
| Lebanon | 1,149 | 0.1% |
| Liberia | 130 | 0.0% |
| Lithuania | 285 | 0.0% |
| Malaysia | 398 | 0.0% |
| Mexico | 110,404 | 8.0% |
| Micronesia | 67 | 0.0% |
| Middle Africa | 644 | 0.1% |
| Moldova | 233 | 0.0% |
| Morocco | 234 | 0.0% |
| Nepal | 290 | 0.0% |
| Netherlands | 459 | 0.0% |
| Nicaragua | 365 | 0.0% |
| Nigeria | 691 | 0.1% |
| North Macedonia | 41 | 0.0% |
| Northern Africa | 2,321 | 0.2% |
| Northern Europe | 6,654 | 0.5% |
| Norway | 196 | 0.0% |
| Oceania | 2,010 | 0.2% |
| Pakistan | 1,162 | 0.1% |
| Panama | 352 | 0.0% |
| Peru | 1,485 | 0.1% |
| Philippines | 43,910 | 3.2% |
| Poland | 700 | 0.1% |
| Portugal | 908 | 0.1% |
| Romania | 805 | 0.1% |
| Russia | 4,051 | 0.3% |
| Saudi Arabia | 403 | 0.0% |
| Scotland | 412 | 0.0% |
| Senegal | 87 | 0.0% |
| Serbia | 384 | 0.0% |
| Sierra Leone | 110 | 0.0% |
| Singapore | 229 | 0.0% |
| Somalia | 1,716 | 0.1% |
| South Africa | 1,810 | 0.1% |
| South America | 12,213 | 0.9% |
| South Central Asia | 30,792 | 2.2% |
| South Eastern Asia | 79,393 | 5.7% |
| Southern Europe | 4,049 | 0.3% |
| Spain | 1,083 | 0.1% |
| Sri Lanka | 137 | 0.0% |
| St. Vincent and the Grenadines | 52 | 0.0% |
| Sudan | 1,003 | 0.1% |
| Sweden | 586 | 0.0% |
| Switzerland | 633 | 0.1% |
| Syria | 480 | 0.0% |
| Taiwan | 4,656 | 0.3% |
| Thailand | 3,308 | 0.2% |
| Trinidad and Tobago | 112 | 0.0% |
| Turkey | 880 | 0.1% |
| Uganda | 355 | 0.0% |
| Ukraine | 1,721 | 0.1% |
| Uruguay | 202 | 0.0% |
| Uzbekistan | 310 | 0.0% |
| Venezuela | 643 | 0.1% |
| Vietnam | 24,509 | 1.8% |
| West Indies | 16 | 0.0% |
| Western Africa | 1,401 | 0.1% |
| Western Asia | 8,319 | 0.6% |
| Western Europe | 7,020 | 0.5% |
| Yemen | 147 | 0.0% |
| Zaire | 180 | 0.0% |
| Zimbabwe | 160 | 0.0% | View All 135 Rows |
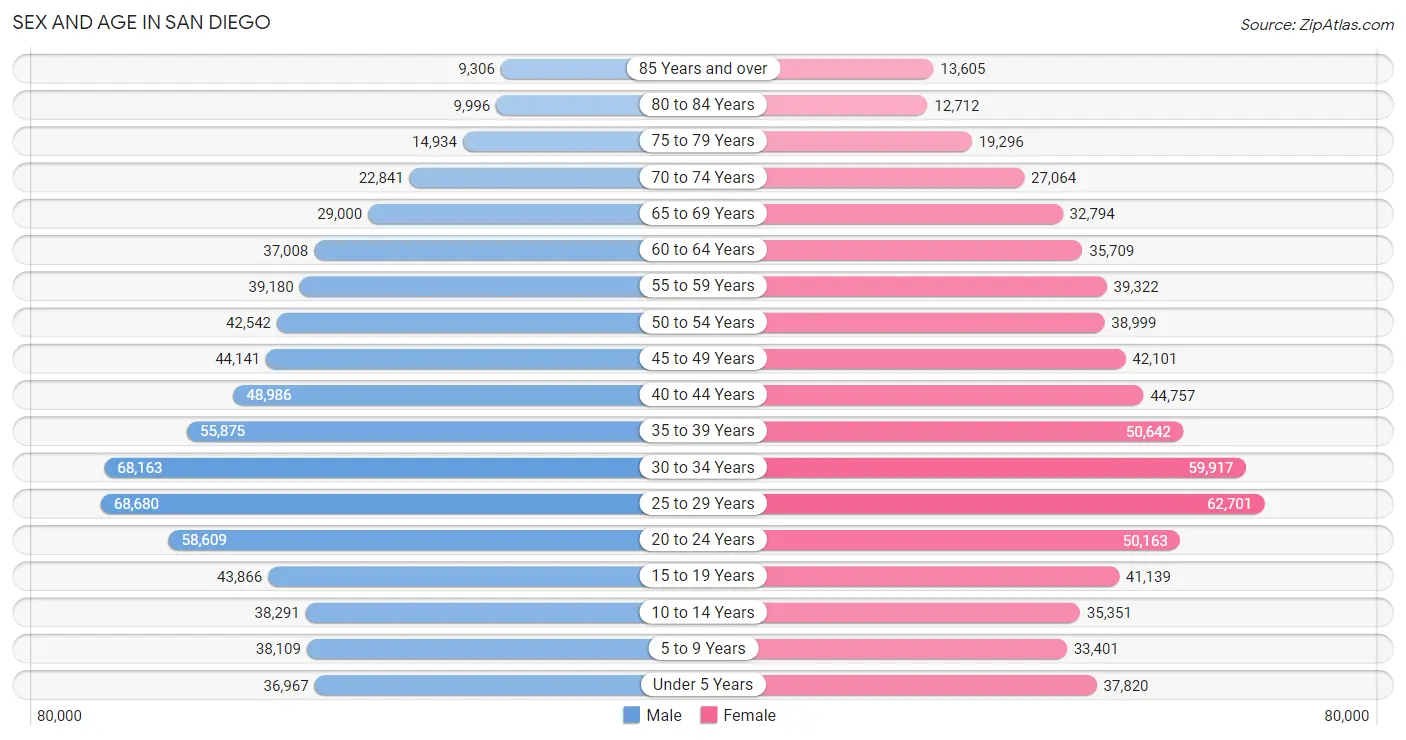
Sex and Age in San Diego
Sex and Age in San Diego
The most populous age groups in San Diego are 25 to 29 Years (68,680 | 9.7%) for men and 25 to 29 Years (62,701 | 9.2%) for women.
| Age Bracket | Male | Female |
| Under 5 Years | 36,967 (5.2%) | 37,820 (5.6%) |
| 5 to 9 Years | 38,109 (5.4%) | 33,401 (4.9%) |
| 10 to 14 Years | 38,291 (5.4%) | 35,351 (5.2%) |
| 15 to 19 Years | 43,866 (6.2%) | 41,139 (6.1%) |
| 20 to 24 Years | 58,609 (8.3%) | 50,163 (7.4%) |
| 25 to 29 Years | 68,680 (9.7%) | 62,701 (9.2%) |
| 30 to 34 Years | 68,163 (9.7%) | 59,917 (8.8%) |
| 35 to 39 Years | 55,875 (7.9%) | 50,642 (7.5%) |
| 40 to 44 Years | 48,986 (6.9%) | 44,757 (6.6%) |
| 45 to 49 Years | 44,141 (6.2%) | 42,101 (6.2%) |
| 50 to 54 Years | 42,542 (6.0%) | 38,999 (5.8%) |
| 55 to 59 Years | 39,180 (5.6%) | 39,322 (5.8%) |
| 60 to 64 Years | 37,008 (5.2%) | 35,709 (5.3%) |
| 65 to 69 Years | 29,000 (4.1%) | 32,794 (4.8%) |
| 70 to 74 Years | 22,841 (3.2%) | 27,064 (4.0%) |
| 75 to 79 Years | 14,934 (2.1%) | 19,296 (2.9%) |
| 80 to 84 Years | 9,996 (1.4%) | 12,712 (1.9%) |
| 85 Years and over | 9,306 (1.3%) | 13,605 (2.0%) |
| Total | 706,494 (100.0%) | 677,493 (100.0%) |
Families and Households in San Diego
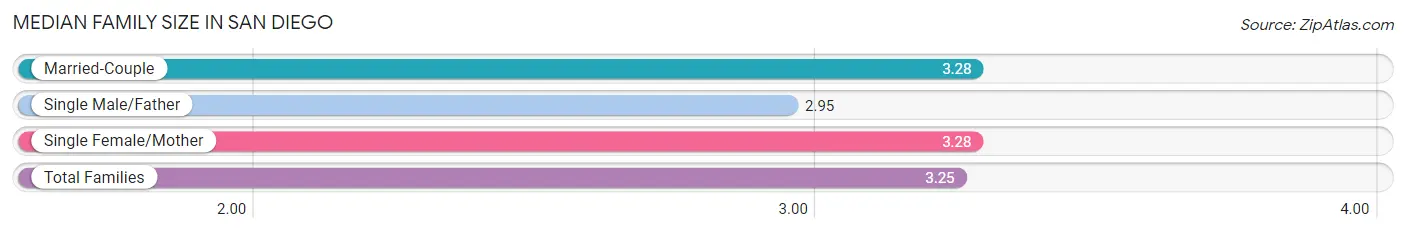
Median Family Size in San Diego
The median family size in San Diego is 3.25 persons per family, with married-couple families (231,023 | 75.0%) accounting for the largest median family size of 3.28 persons per family. On the other hand, single male/father families (23,110 | 7.5%) represent the smallest median family size with 2.95 persons per family.
| Family Type | # Families | Family Size |
| Married-Couple | 231,023 (75.0%) | 3.28 |
| Single Male/Father | 23,110 (7.5%) | 2.95 |
| Single Female/Mother | 54,042 (17.5%) | 3.28 |
| Total Families | 308,175 (100.0%) | 3.25 |
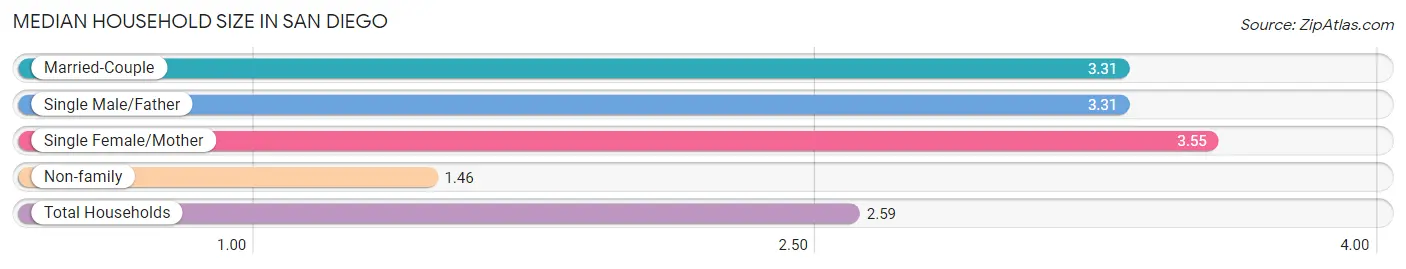
Median Household Size in San Diego
The median household size in San Diego is 2.59 persons per household, with single female/mother households (54,042 | 10.5%) accounting for the largest median household size of 3.55 persons per household. non-family households (207,300 | 40.2%) represent the smallest median household size with 1.46 persons per household.
| Household Type | # Households | Household Size |
| Married-Couple | 231,023 (44.8%) | 3.31 |
| Single Male/Father | 23,110 (4.5%) | 3.31 |
| Single Female/Mother | 54,042 (10.5%) | 3.55 |
| Non-family | 207,300 (40.2%) | 1.46 |
| Total Households | 515,475 (100.0%) | 2.59 |
Household Size by Marriage Status in San Diego
Out of a total of 515,475 households in San Diego, 308,175 (59.8%) are family households, while 207,300 (40.2%) are nonfamily households. The most numerous type of family households are 2-person households, comprising 127,219, and the most common type of nonfamily households are 1-person households, comprising 143,651.
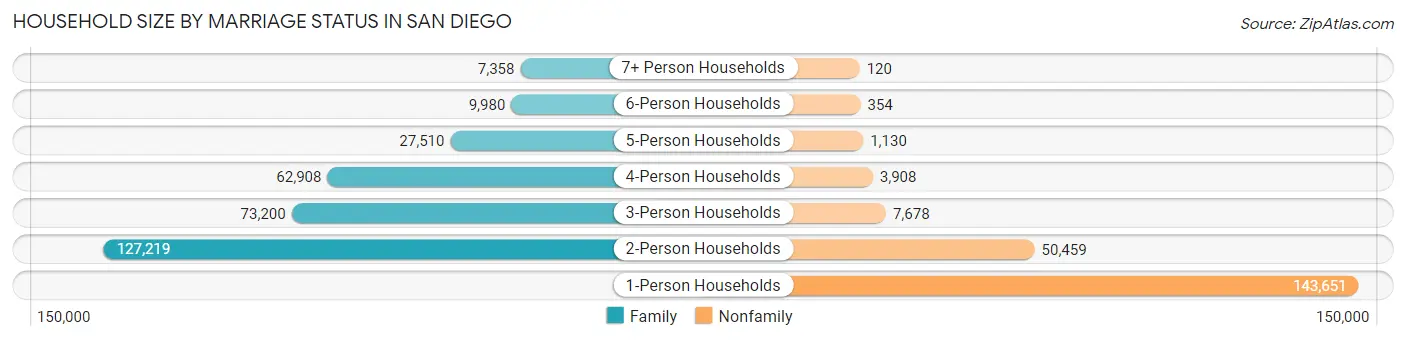
| Household Size | Family Households | Nonfamily Households |
| 1-Person Households | - | 143,651 (27.9%) |
| 2-Person Households | 127,219 (24.7%) | 50,459 (9.8%) |
| 3-Person Households | 73,200 (14.2%) | 7,678 (1.5%) |
| 4-Person Households | 62,908 (12.2%) | 3,908 (0.8%) |
| 5-Person Households | 27,510 (5.3%) | 1,130 (0.2%) |
| 6-Person Households | 9,980 (1.9%) | 354 (0.1%) |
| 7+ Person Households | 7,358 (1.4%) | 120 (0.0%) |
| Total | 308,175 (59.8%) | 207,300 (40.2%) |
Female Fertility in San Diego
Fertility by Age in San Diego
Average fertility rate in San Diego is 43.0 births per 1,000 women. Women in the age bracket of 20 to 34 years have the highest fertility rate with 58.0 births per 1,000 women. Women in the age bracket of 20 to 34 years acount for 64.8% of all women with births.
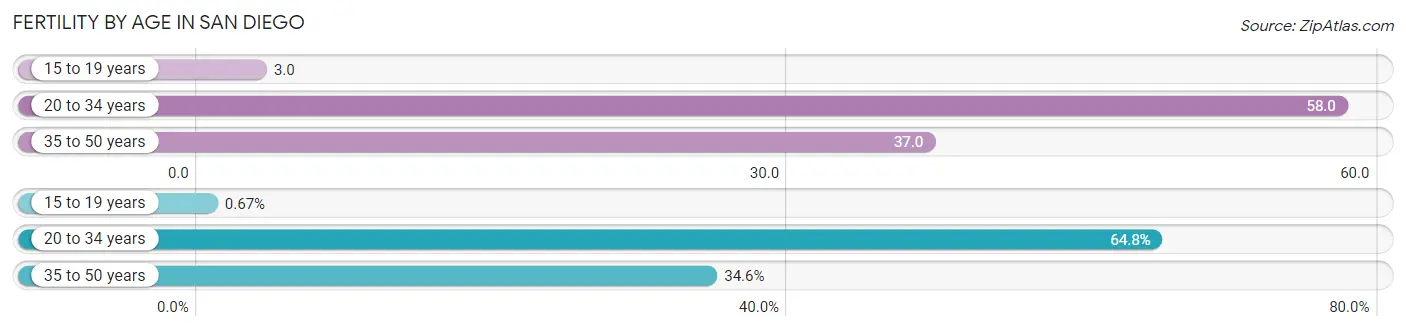
| Age Bracket | Women with Births | Births / 1,000 Women |
| 15 to 19 years | 104 (0.7%) | 3.0 |
| 20 to 34 years | 10,107 (64.8%) | 58.0 |
| 35 to 50 years | 5,393 (34.6%) | 37.0 |
| Total | 15,604 (100.0%) | 43.0 |
Fertility by Age by Marriage Status in San Diego
78.8% of women with births (15,604) in San Diego are married. The highest percentage of unmarried women with births falls into 15 to 19 years age bracket with 89.4% of them unmarried at the time of birth, while the lowest percentage of unmarried women with births belong to 35 to 50 years age bracket with 16.3% of them unmarried.
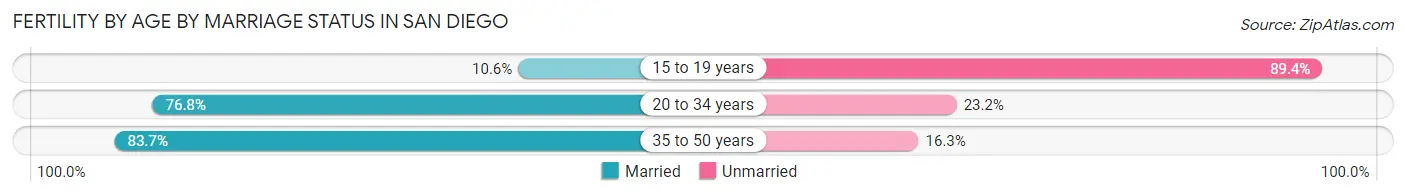
| Age Bracket | Married | Unmarried |
| 15 to 19 years | 11 (10.6%) | 93 (89.4%) |
| 20 to 34 years | 7,762 (76.8%) | 2,345 (23.2%) |
| 35 to 50 years | 4,514 (83.7%) | 879 (16.3%) |
| Total | 12,296 (78.8%) | 3,308 (21.2%) |
Fertility by Education in San Diego
Average fertility rate in San Diego is 43.0 births per 1,000 women. Women with the education attainment of graduate degree have the highest fertility rate of 59.0 births per 1,000 women, while women with the education attainment of less than high school have the lowest fertility at 20.0 births per 1,000 women. Women with the education attainment of bachelor's degree represent 28.3% of all women with births.
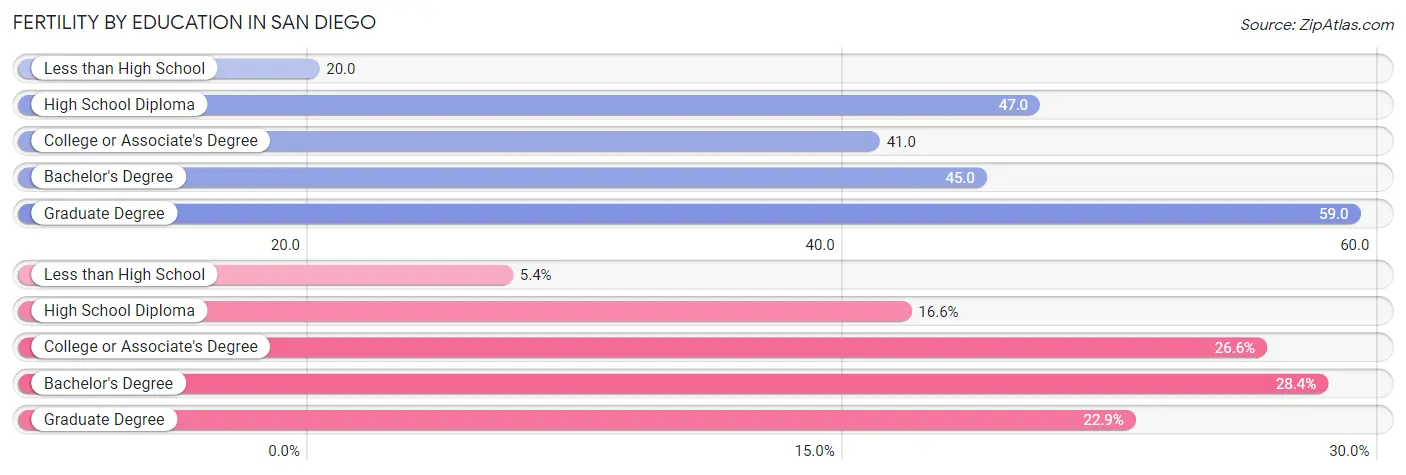
| Educational Attainment | Women with Births | Births / 1,000 Women |
| Less than High School | 849 (5.4%) | 20.0 |
| High School Diploma | 2,597 (16.6%) | 47.0 |
| College or Associate's Degree | 4,155 (26.6%) | 41.0 |
| Bachelor's Degree | 4,423 (28.3%) | 45.0 |
| Graduate Degree | 3,580 (22.9%) | 59.0 |
| Total | 15,604 (100.0%) | 43.0 |
Fertility by Education by Marriage Status in San Diego
21.2% of women with births in San Diego are unmarried. Women with the educational attainment of graduate degree are most likely to be married with 89.6% of them married at childbirth, while women with the educational attainment of high school diploma are least likely to be married with 38.5% of them unmarried at childbirth.
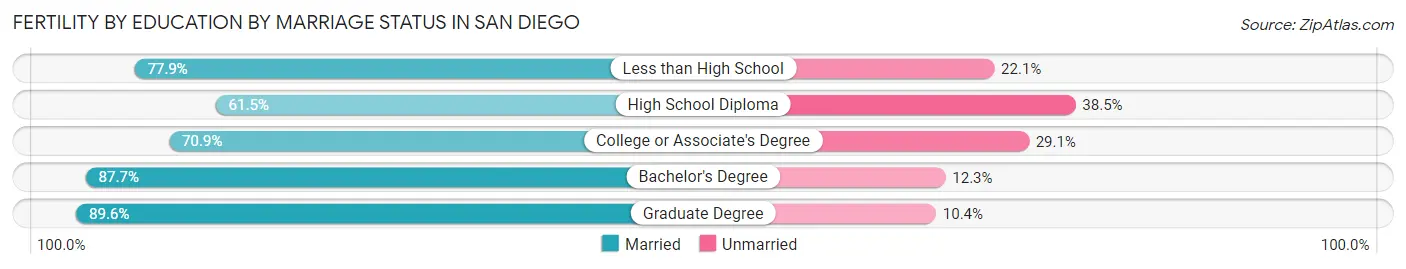
| Educational Attainment | Married | Unmarried |
| Less than High School | 661 (77.9%) | 188 (22.1%) |
| High School Diploma | 1,597 (61.5%) | 1,000 (38.5%) |
| College or Associate's Degree | 2,946 (70.9%) | 1,209 (29.1%) |
| Bachelor's Degree | 3,879 (87.7%) | 544 (12.3%) |
| Graduate Degree | 3,208 (89.6%) | 372 (10.4%) |
| Total | 12,296 (78.8%) | 3,308 (21.2%) |
Employment Characteristics in San Diego
Employment by Class of Employer in San Diego
Among the 721,050 employed individuals in San Diego, private company employees (450,363 | 62.5%), federal government employees (65,685 | 9.1%), and not-for-profit organizations (59,864 | 8.3%) make up the most common classes of employment.
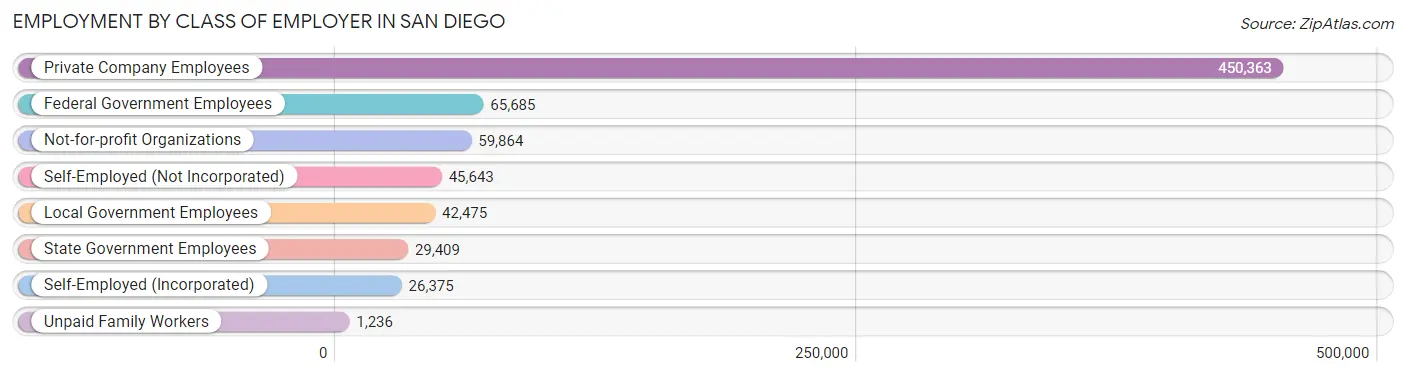
| Employer Class | # Employees | % Employees |
| Private Company Employees | 450,363 | 62.5% |
| Self-Employed (Incorporated) | 26,375 | 3.7% |
| Self-Employed (Not Incorporated) | 45,643 | 6.3% |
| Not-for-profit Organizations | 59,864 | 8.3% |
| Local Government Employees | 42,475 | 5.9% |
| State Government Employees | 29,409 | 4.1% |
| Federal Government Employees | 65,685 | 9.1% |
| Unpaid Family Workers | 1,236 | 0.2% |
| Total | 721,050 | 100.0% |
Employment Status by Age in San Diego
According to the labor force statistics for San Diego, out of the total population over 16 years of age (1,149,990), 68.1% or 783,143 individuals are in the labor force, with 6.1% or 47,772 of them unemployed. The age group with the highest labor force participation rate is 30 to 34 years, with 87.5% or 112,070 individuals in the labor force. Within the labor force, the 16 to 19 years age range has the highest percentage of unemployed individuals, with 19.4% or 4,583 of them being unemployed.
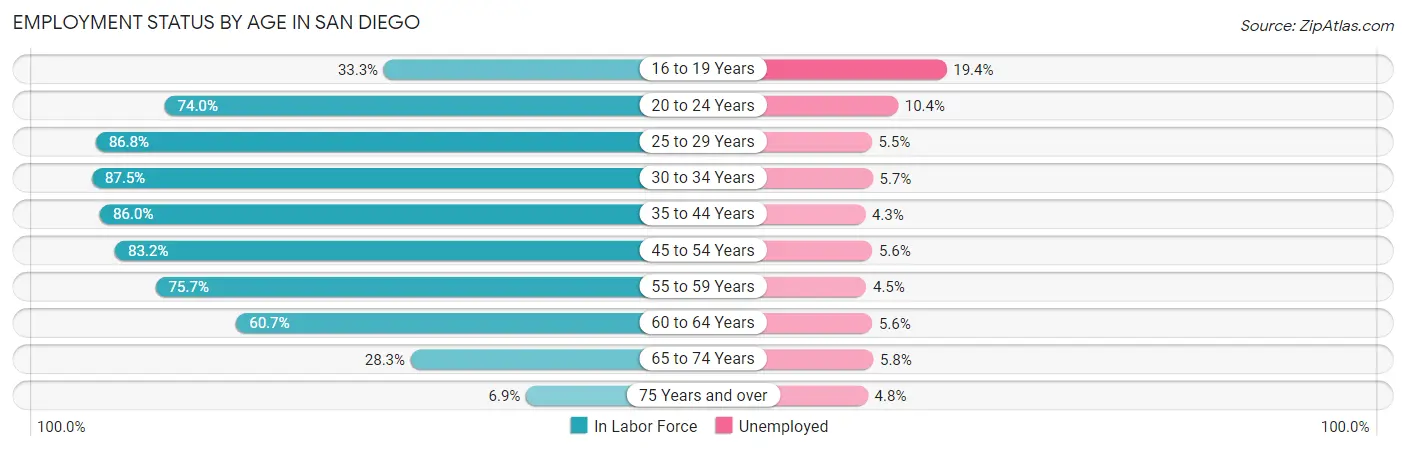
| Age Bracket | In Labor Force | Unemployed |
| 16 to 19 Years | 23,625 (33.3%) | 4,583 (19.4%) |
| 20 to 24 Years | 80,491 (74.0%) | 8,371 (10.4%) |
| 25 to 29 Years | 114,039 (86.8%) | 6,272 (5.5%) |
| 30 to 34 Years | 112,070 (87.5%) | 6,388 (5.7%) |
| 35 to 44 Years | 172,224 (86.0%) | 7,406 (4.3%) |
| 45 to 54 Years | 139,595 (83.2%) | 7,817 (5.6%) |
| 55 to 59 Years | 59,426 (75.7%) | 2,674 (4.5%) |
| 60 to 64 Years | 44,139 (60.7%) | 2,472 (5.6%) |
| 65 to 74 Years | 31,611 (28.3%) | 1,833 (5.8%) |
| 75 Years and over | 5,510 (6.9%) | 264 (4.8%) |
| Total | 783,143 (68.1%) | 47,772 (6.1%) |
Employment Status by Educational Attainment in San Diego
According to labor force statistics for San Diego, 82.4% of individuals (641,668) out of the total population between 25 and 64 years of age (778,723) are in the labor force, with 5.2% or 33,367 of them being unemployed. The group with the highest labor force participation rate are those with the educational attainment of bachelor's degree or higher, with 88.2% or 345,297 individuals in the labor force. Within the labor force, individuals with less than high school education have the highest percentage of unemployment, with 9.1% or 4,404 of them being unemployed.
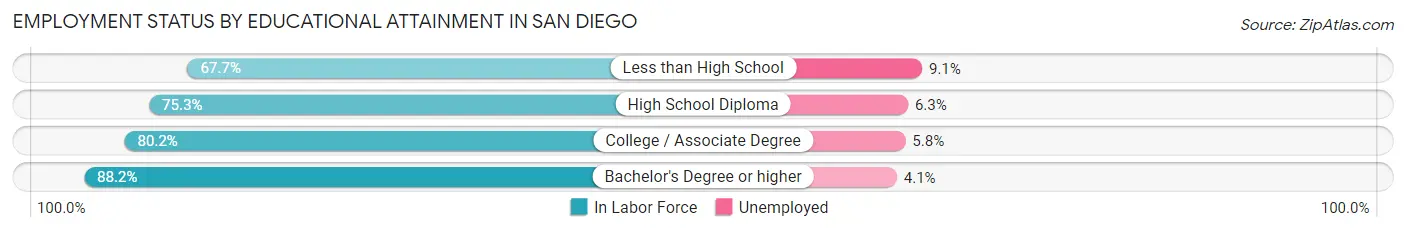
| Educational Attainment | In Labor Force | Unemployed |
| Less than High School | 48,393 (67.7%) | 6,505 (9.1%) |
| High School Diploma | 87,217 (75.3%) | 7,297 (6.3%) |
| College / Associate Degree | 160,338 (80.2%) | 11,596 (5.8%) |
| Bachelor's Degree or higher | 345,297 (88.2%) | 16,051 (4.1%) |
| Total | 641,668 (82.4%) | 40,494 (5.2%) |
Employment Occupations by Sex in San Diego
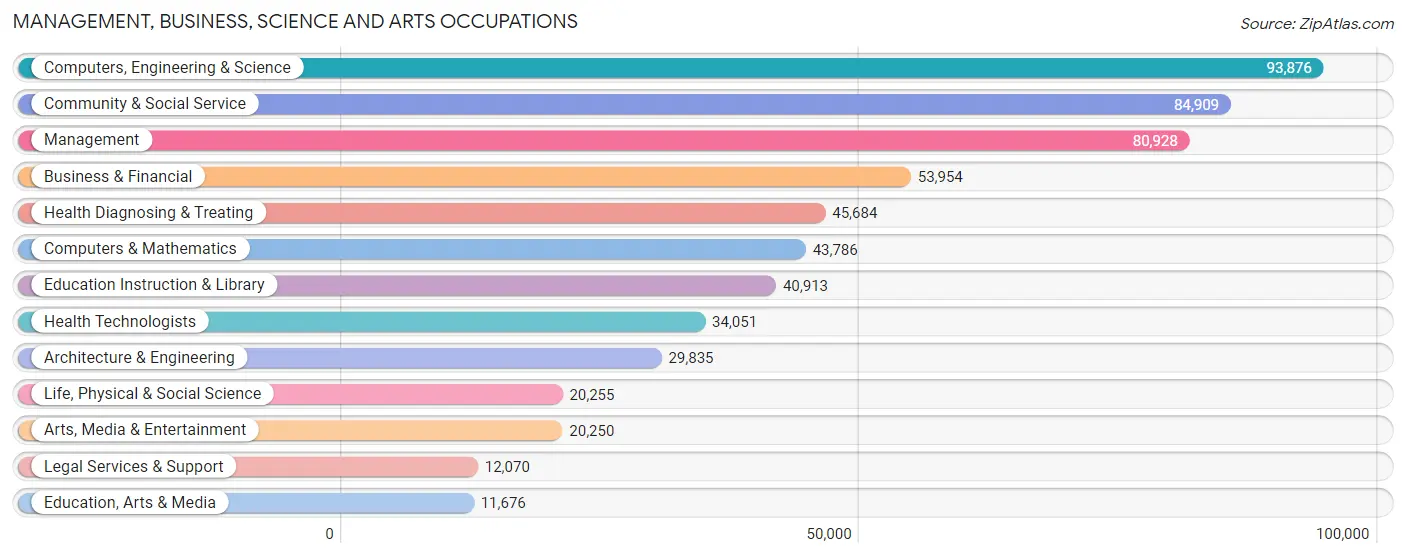
Management, Business, Science and Arts Occupations
The most common Management, Business, Science and Arts occupations in San Diego are Computers, Engineering & Science (93,876 | 13.4%), Community & Social Service (84,909 | 12.1%), Management (80,928 | 11.6%), Business & Financial (53,954 | 7.7%), and Health Diagnosing & Treating (45,684 | 6.5%).
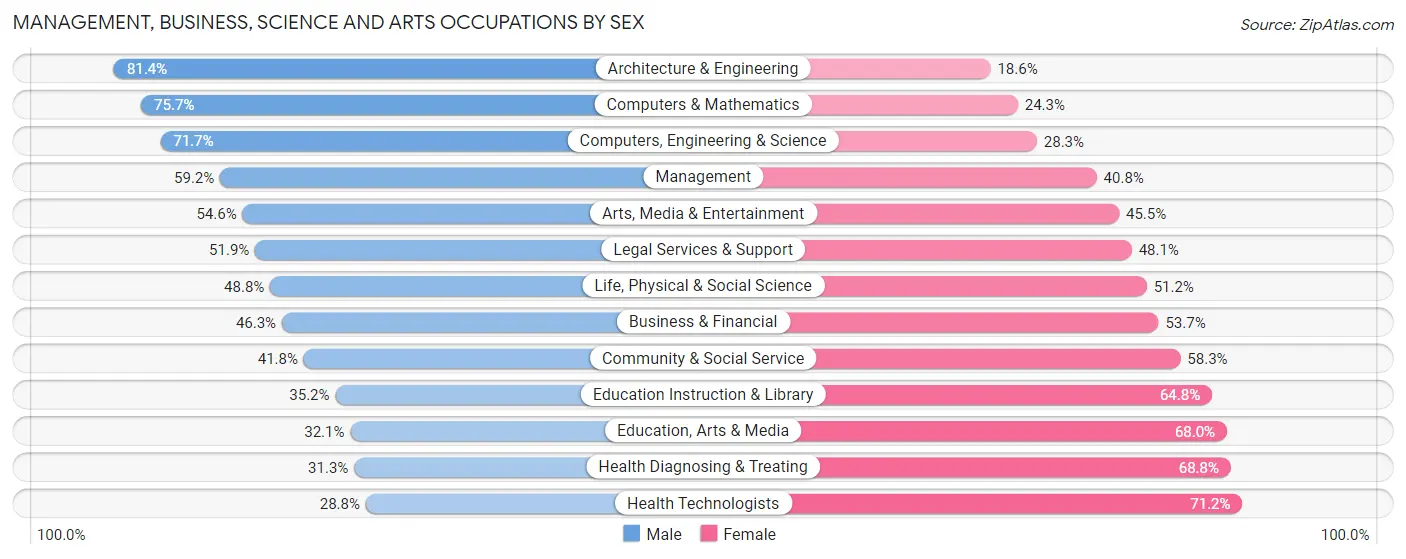
Management, Business, Science and Arts Occupations by Sex
Within the Management, Business, Science and Arts occupations in San Diego, the most male-oriented occupations are Architecture & Engineering (81.4%), Computers & Mathematics (75.7%), and Computers, Engineering & Science (71.7%), while the most female-oriented occupations are Health Technologists (71.2%), Health Diagnosing & Treating (68.8%), and Education, Arts & Media (67.9%).
| Occupation | Male | Female |
| Management | 47,926 (59.2%) | 33,002 (40.8%) |
| Business & Financial | 24,990 (46.3%) | 28,964 (53.7%) |
| Computers, Engineering & Science | 67,297 (71.7%) | 26,579 (28.3%) |
| Computers & Mathematics | 33,139 (75.7%) | 10,647 (24.3%) |
| Architecture & Engineering | 24,277 (81.4%) | 5,558 (18.6%) |
| Life, Physical & Social Science | 9,881 (48.8%) | 10,374 (51.2%) |
| Community & Social Service | 35,446 (41.7%) | 49,463 (58.3%) |
| Education, Arts & Media | 3,742 (32.1%) | 7,934 (67.9%) |
| Legal Services & Support | 6,266 (51.9%) | 5,804 (48.1%) |
| Education Instruction & Library | 14,391 (35.2%) | 26,522 (64.8%) |
| Arts, Media & Entertainment | 11,047 (54.5%) | 9,203 (45.5%) |
| Health Diagnosing & Treating | 14,275 (31.2%) | 31,409 (68.8%) |
| Health Technologists | 9,816 (28.8%) | 24,235 (71.2%) |
| Total (Category) | 189,934 (52.8%) | 169,417 (47.1%) |
| Total (Overall) | 376,107 (53.8%) | 322,788 (46.2%) |
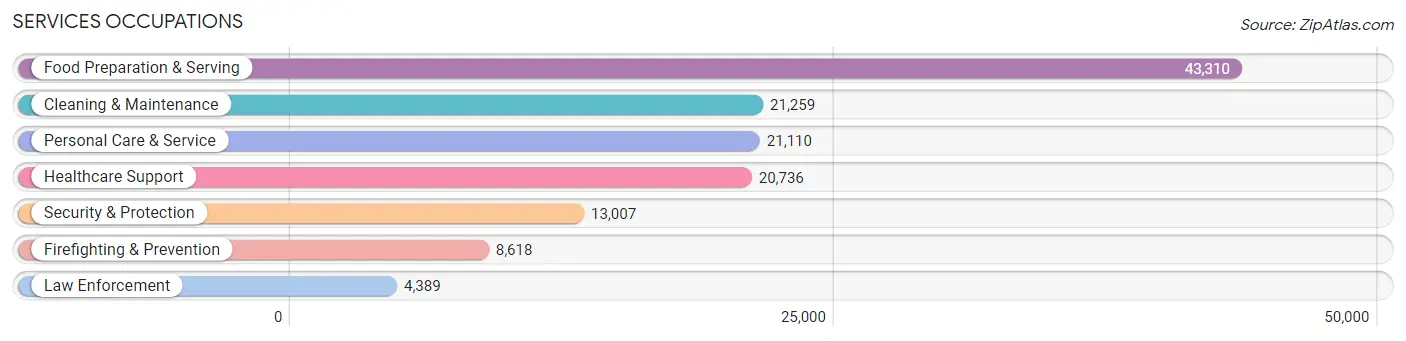
Services Occupations
The most common Services occupations in San Diego are Food Preparation & Serving (43,310 | 6.2%), Cleaning & Maintenance (21,259 | 3.0%), Personal Care & Service (21,110 | 3.0%), Healthcare Support (20,736 | 3.0%), and Security & Protection (13,007 | 1.9%).
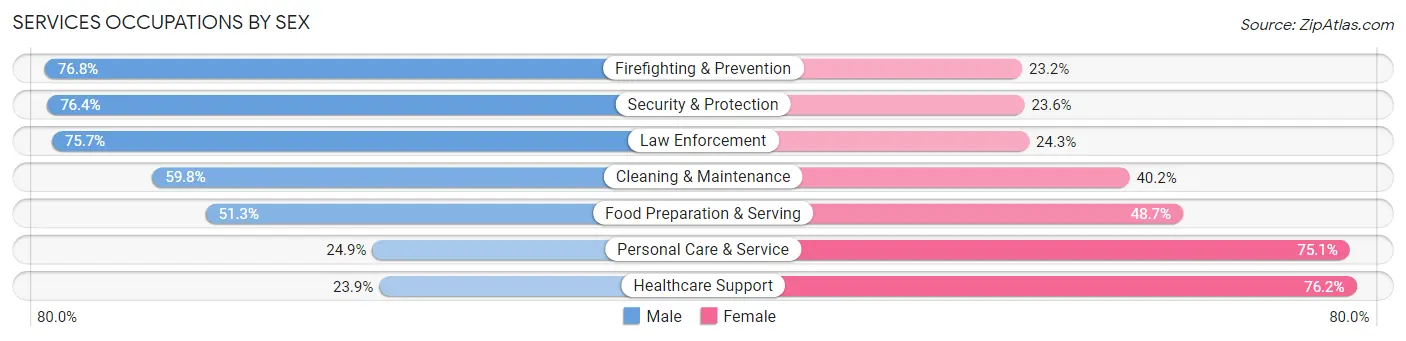
Services Occupations by Sex
Within the Services occupations in San Diego, the most male-oriented occupations are Firefighting & Prevention (76.8%), Security & Protection (76.4%), and Law Enforcement (75.7%), while the most female-oriented occupations are Healthcare Support (76.1%), Personal Care & Service (75.1%), and Food Preparation & Serving (48.7%).
| Occupation | Male | Female |
| Healthcare Support | 4,945 (23.8%) | 15,791 (76.1%) |
| Security & Protection | 9,938 (76.4%) | 3,069 (23.6%) |
| Firefighting & Prevention | 6,617 (76.8%) | 2,001 (23.2%) |
| Law Enforcement | 3,321 (75.7%) | 1,068 (24.3%) |
| Food Preparation & Serving | 22,227 (51.3%) | 21,083 (48.7%) |
| Cleaning & Maintenance | 12,707 (59.8%) | 8,552 (40.2%) |
| Personal Care & Service | 5,261 (24.9%) | 15,849 (75.1%) |
| Total (Category) | 55,078 (46.1%) | 64,344 (53.9%) |
| Total (Overall) | 376,107 (53.8%) | 322,788 (46.2%) |
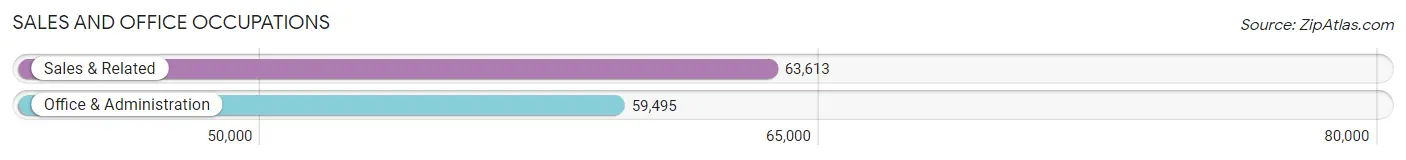
Sales and Office Occupations
The most common Sales and Office occupations in San Diego are Sales & Related (63,613 | 9.1%), and Office & Administration (59,495 | 8.5%).
Sales and Office Occupations by Sex
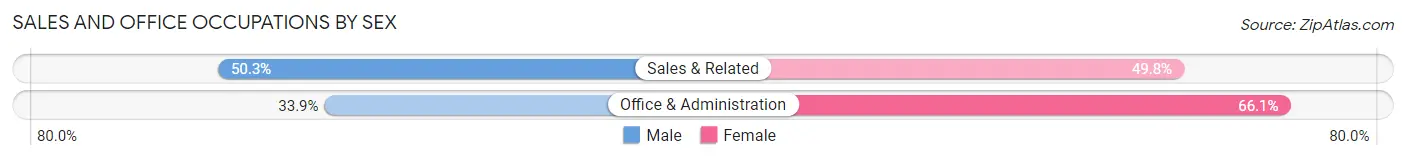
| Occupation | Male | Female |
| Sales & Related | 31,965 (50.2%) | 31,648 (49.7%) |
| Office & Administration | 20,155 (33.9%) | 39,340 (66.1%) |
| Total (Category) | 52,120 (42.3%) | 70,988 (57.7%) |
| Total (Overall) | 376,107 (53.8%) | 322,788 (46.2%) |
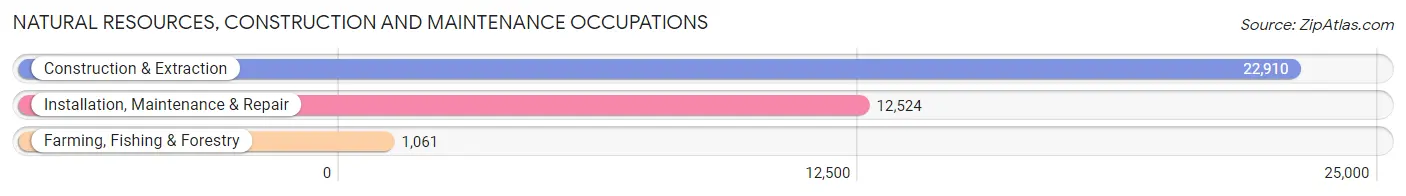
Natural Resources, Construction and Maintenance Occupations
The most common Natural Resources, Construction and Maintenance occupations in San Diego are Construction & Extraction (22,910 | 3.3%), Installation, Maintenance & Repair (12,524 | 1.8%), and Farming, Fishing & Forestry (1,061 | 0.2%).
Natural Resources, Construction and Maintenance Occupations by Sex
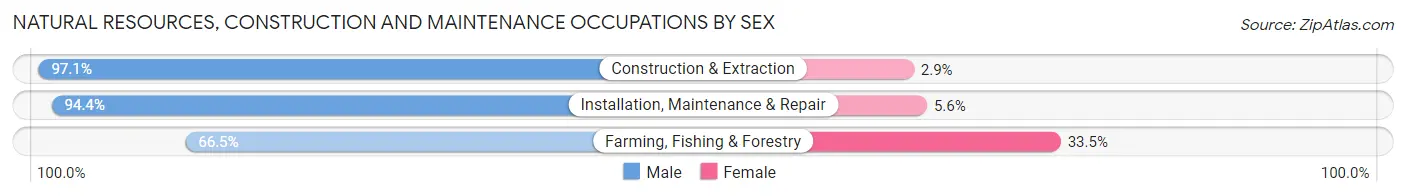
| Occupation | Male | Female |
| Farming, Fishing & Forestry | 706 (66.5%) | 355 (33.5%) |
| Construction & Extraction | 22,246 (97.1%) | 664 (2.9%) |
| Installation, Maintenance & Repair | 11,819 (94.4%) | 705 (5.6%) |
| Total (Category) | 34,771 (95.3%) | 1,724 (4.7%) |
| Total (Overall) | 376,107 (53.8%) | 322,788 (46.2%) |
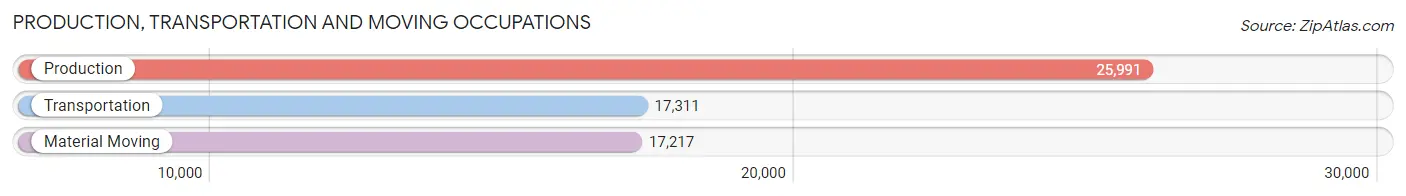
Production, Transportation and Moving Occupations
The most common Production, Transportation and Moving occupations in San Diego are Production (25,991 | 3.7%), Transportation (17,311 | 2.5%), and Material Moving (17,217 | 2.5%).
Production, Transportation and Moving Occupations by Sex
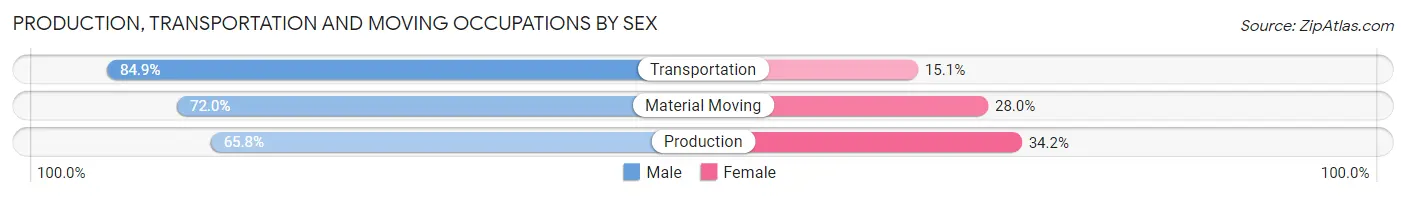
| Occupation | Male | Female |
| Production | 17,113 (65.8%) | 8,878 (34.2%) |
| Transportation | 14,692 (84.9%) | 2,619 (15.1%) |
| Material Moving | 12,399 (72.0%) | 4,818 (28.0%) |
| Total (Category) | 44,204 (73.0%) | 16,315 (27.0%) |
| Total (Overall) | 376,107 (53.8%) | 322,788 (46.2%) |
Employment Industries by Sex in San Diego
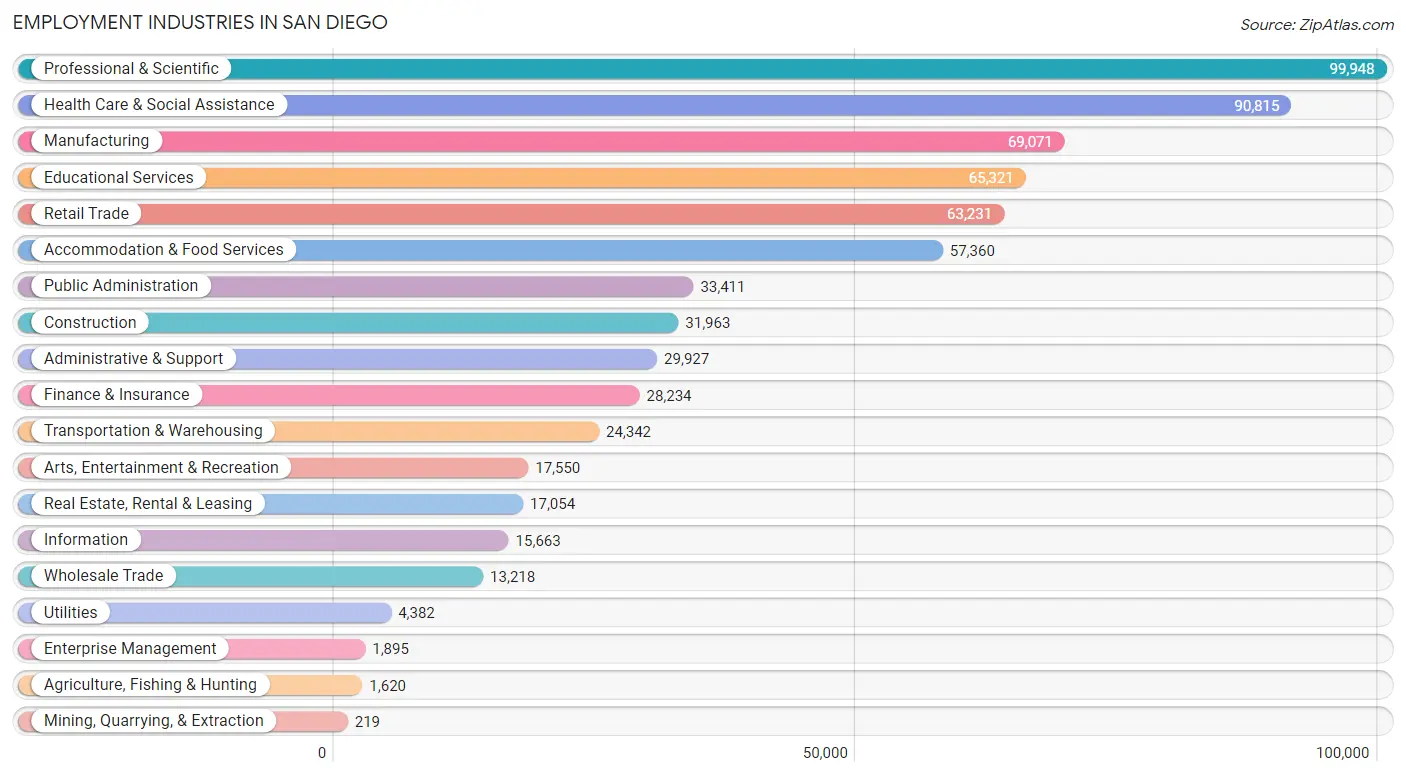
Employment Industries in San Diego
The major employment industries in San Diego include Professional & Scientific (99,948 | 14.3%), Health Care & Social Assistance (90,815 | 13.0%), Manufacturing (69,071 | 9.9%), Educational Services (65,321 | 9.3%), and Retail Trade (63,231 | 9.0%).
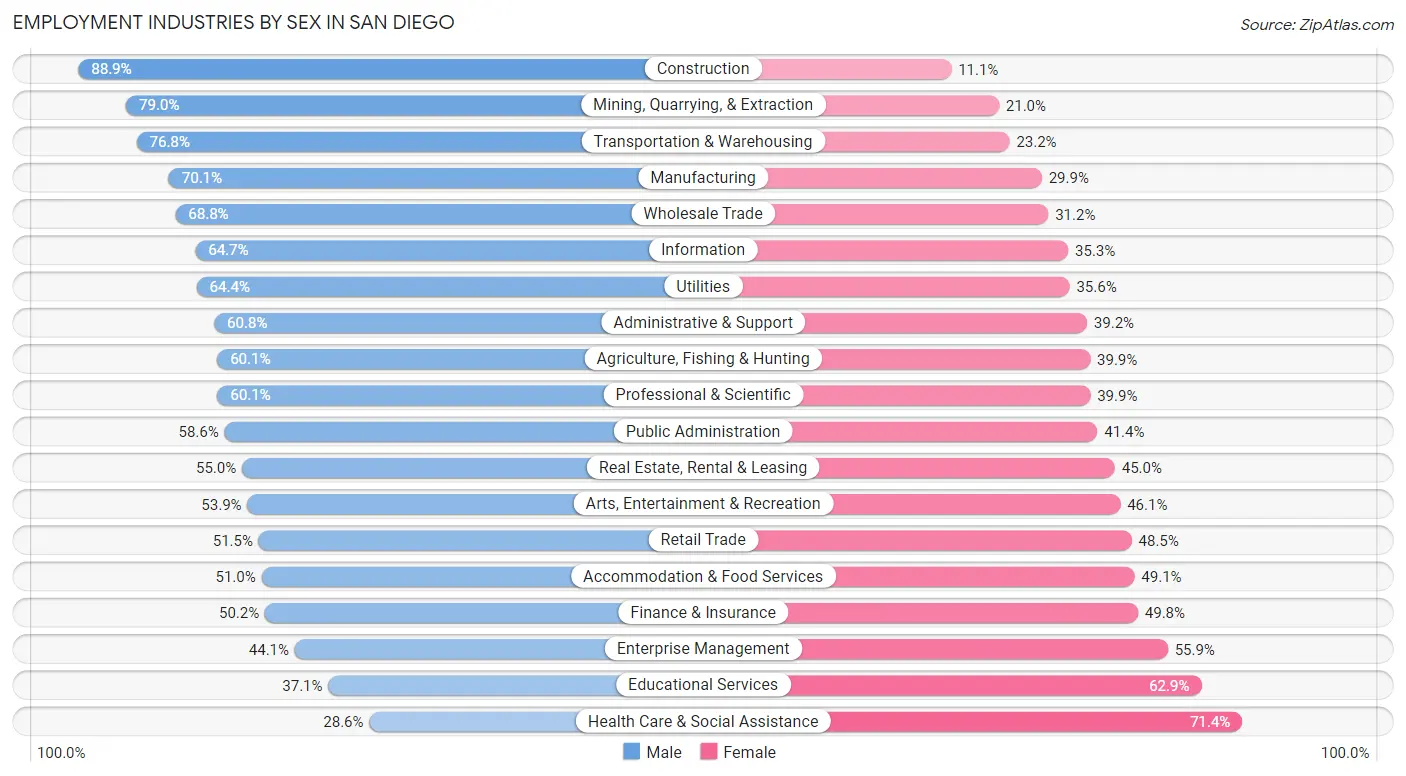
Employment Industries by Sex in San Diego
The San Diego industries that see more men than women are Construction (88.9%), Mining, Quarrying, & Extraction (79.0%), and Transportation & Warehousing (76.8%), whereas the industries that tend to have a higher number of women are Health Care & Social Assistance (71.4%), Educational Services (62.9%), and Enterprise Management (55.9%).
| Industry | Male | Female |
| Agriculture, Fishing & Hunting | 974 (60.1%) | 646 (39.9%) |
| Mining, Quarrying, & Extraction | 173 (79.0%) | 46 (21.0%) |
| Construction | 28,404 (88.9%) | 3,559 (11.1%) |
| Manufacturing | 48,440 (70.1%) | 20,631 (29.9%) |
| Wholesale Trade | 9,091 (68.8%) | 4,127 (31.2%) |
| Retail Trade | 32,584 (51.5%) | 30,647 (48.5%) |
| Transportation & Warehousing | 18,698 (76.8%) | 5,644 (23.2%) |
| Utilities | 2,821 (64.4%) | 1,561 (35.6%) |
| Information | 10,130 (64.7%) | 5,533 (35.3%) |
| Finance & Insurance | 14,182 (50.2%) | 14,052 (49.8%) |
| Real Estate, Rental & Leasing | 9,379 (55.0%) | 7,675 (45.0%) |
| Professional & Scientific | 60,060 (60.1%) | 39,888 (39.9%) |
| Enterprise Management | 835 (44.1%) | 1,060 (55.9%) |
| Administrative & Support | 18,191 (60.8%) | 11,736 (39.2%) |
| Educational Services | 24,248 (37.1%) | 41,073 (62.9%) |
| Health Care & Social Assistance | 26,006 (28.6%) | 64,809 (71.4%) |
| Arts, Entertainment & Recreation | 9,456 (53.9%) | 8,094 (46.1%) |
| Accommodation & Food Services | 29,224 (50.9%) | 28,136 (49.0%) |
| Public Administration | 19,584 (58.6%) | 13,827 (41.4%) |
| Total | 376,107 (53.8%) | 322,788 (46.2%) |
Education in San Diego
School Enrollment in San Diego
The most common levels of schooling among the 346,859 students in San Diego are college / undergraduate (111,315 | 32.1%), high school (60,270 | 17.4%), and elementary school (56,461 | 16.3%).
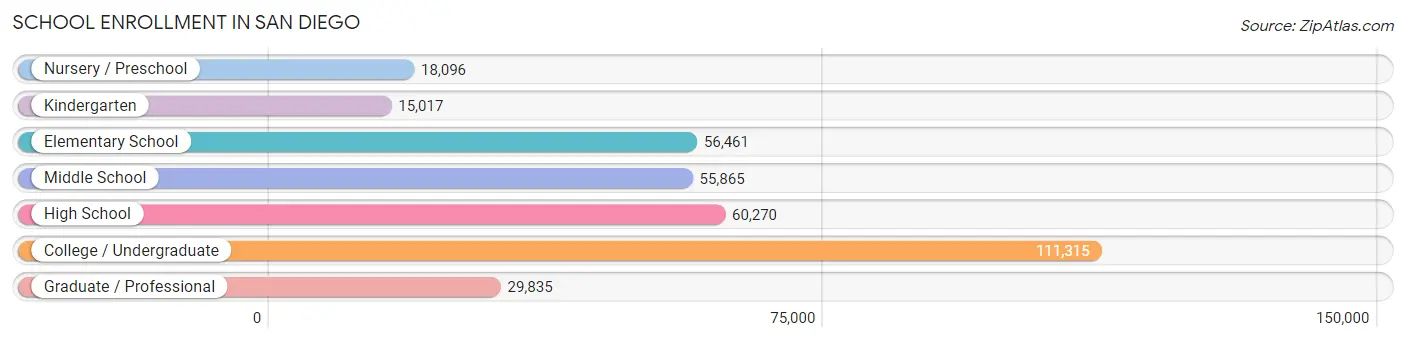
| School Level | # Students | % Students |
| Nursery / Preschool | 18,096 | 5.2% |
| Kindergarten | 15,017 | 4.3% |
| Elementary School | 56,461 | 16.3% |
| Middle School | 55,865 | 16.1% |
| High School | 60,270 | 17.4% |
| College / Undergraduate | 111,315 | 32.1% |
| Graduate / Professional | 29,835 | 8.6% |
| Total | 346,859 | 100.0% |
School Enrollment by Age by Funding Source in San Diego
Out of a total of 346,859 students who are enrolled in schools in San Diego, 61,394 (17.7%) attend a private institution, while the remaining 285,465 (82.3%) are enrolled in public schools. The age group of 3 to 4 year olds has the highest likelihood of being enrolled in private schools, with 8,150 (54.6% in the age bracket) enrolled. Conversely, the age group of 10 to 14 year olds has the lowest likelihood of being enrolled in a private school, with 66,015 (91.1% in the age bracket) attending a public institution.
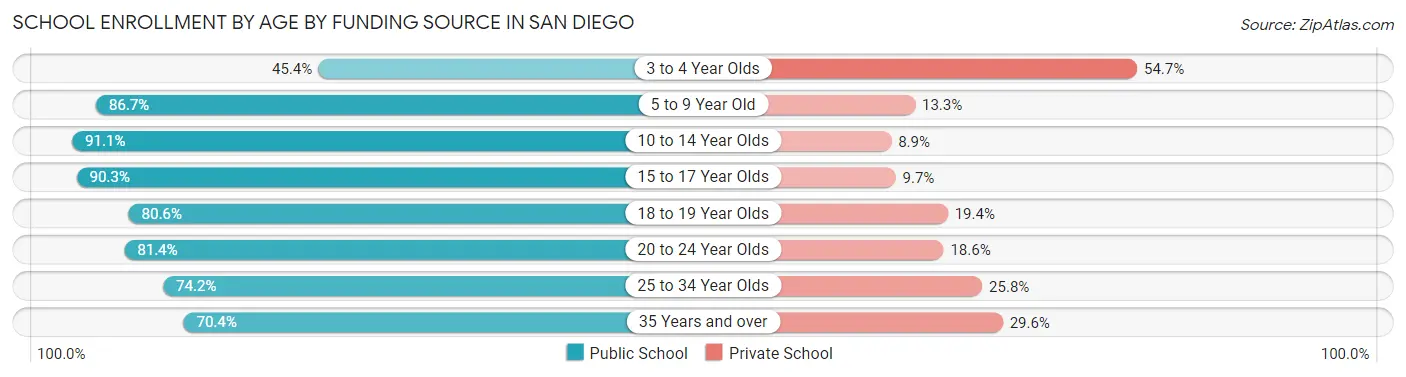
| Age Bracket | Public School | Private School |
| 3 to 4 Year Olds | 6,764 (45.4%) | 8,150 (54.6%) |
| 5 to 9 Year Old | 58,572 (86.7%) | 8,981 (13.3%) |
| 10 to 14 Year Olds | 66,015 (91.1%) | 6,416 (8.9%) |
| 15 to 17 Year Olds | 37,739 (90.3%) | 4,044 (9.7%) |
| 18 to 19 Year Olds | 27,169 (80.6%) | 6,529 (19.4%) |
| 20 to 24 Year Olds | 42,447 (81.4%) | 9,695 (18.6%) |
| 25 to 34 Year Olds | 30,433 (74.2%) | 10,575 (25.8%) |
| 35 Years and over | 16,419 (70.4%) | 6,911 (29.6%) |
| Total | 285,465 (82.3%) | 61,394 (17.7%) |
Educational Attainment by Field of Study in San Diego
Business (85,984 | 16.9%), engineering (58,929 | 11.6%), social sciences (52,277 | 10.3%), bio, nature & agricultural (43,744 | 8.6%), and science & technology (42,876 | 8.4%) are the most common fields of study among 509,510 individuals in San Diego who have obtained a bachelor's degree or higher.
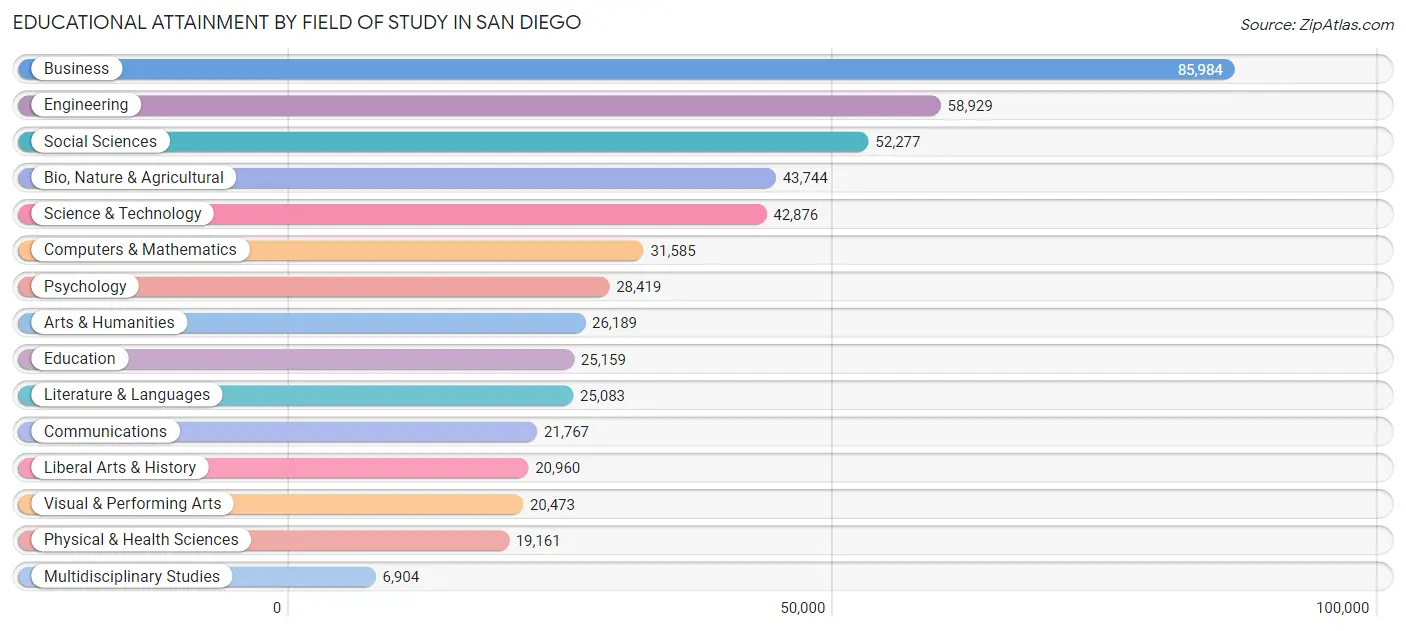
| Field of Study | # Graduates | % Graduates |
| Computers & Mathematics | 31,585 | 6.2% |
| Bio, Nature & Agricultural | 43,744 | 8.6% |
| Physical & Health Sciences | 19,161 | 3.8% |
| Psychology | 28,419 | 5.6% |
| Social Sciences | 52,277 | 10.3% |
| Engineering | 58,929 | 11.6% |
| Multidisciplinary Studies | 6,904 | 1.4% |
| Science & Technology | 42,876 | 8.4% |
| Business | 85,984 | 16.9% |
| Education | 25,159 | 4.9% |
| Literature & Languages | 25,083 | 4.9% |
| Liberal Arts & History | 20,960 | 4.1% |
| Visual & Performing Arts | 20,473 | 4.0% |
| Communications | 21,767 | 4.3% |
| Arts & Humanities | 26,189 | 5.1% |
| Total | 509,510 | 100.0% |
Transportation & Commute in San Diego
Vehicle Availability by Sex in San Diego
The most prevalent vehicle ownership categories in San Diego are males with 2 vehicles (168,307, accounting for 43.7%) and females with 2 vehicles (134,657, making up 53.6%).
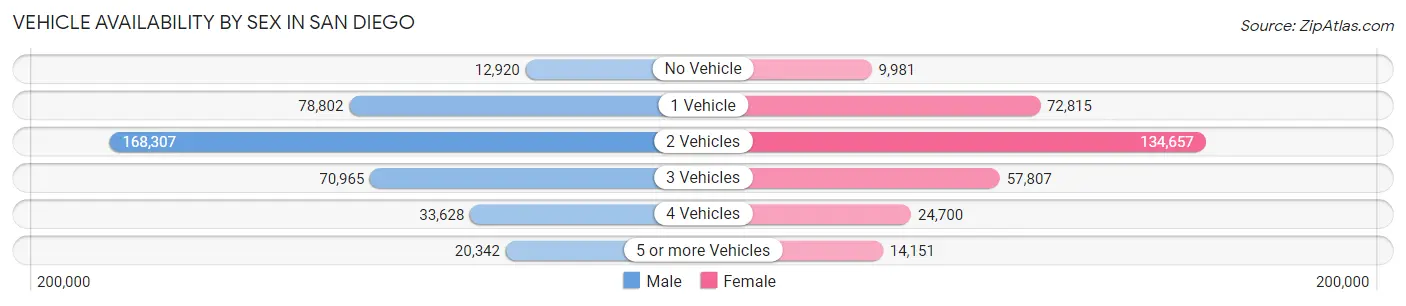
| Vehicles Available | Male | Female |
| No Vehicle | 12,920 (3.4%) | 9,981 (3.2%) |
| 1 Vehicle | 78,802 (20.5%) | 72,815 (23.2%) |
| 2 Vehicles | 168,307 (43.7%) | 134,657 (42.9%) |
| 3 Vehicles | 70,965 (18.4%) | 57,807 (18.4%) |
| 4 Vehicles | 33,628 (8.7%) | 24,700 (7.9%) |
| 5 or more Vehicles | 20,342 (5.3%) | 14,151 (4.5%) |
| Total | 384,964 (100.0%) | 314,111 (100.0%) |
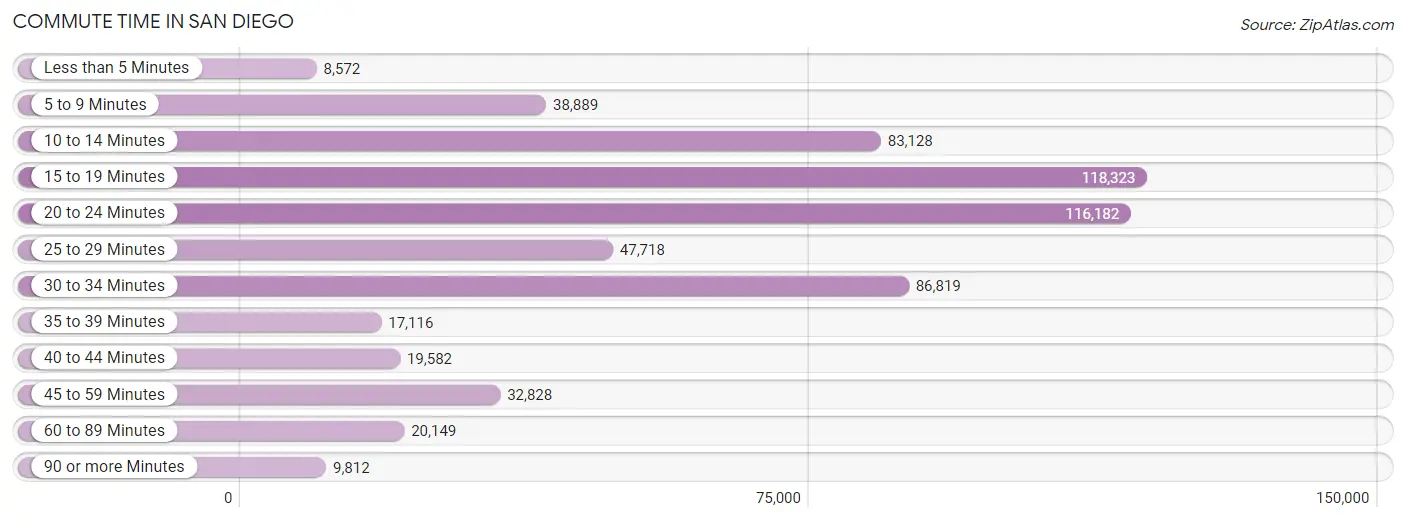
Commute Time in San Diego
The most frequently occuring commute durations in San Diego are 15 to 19 minutes (118,323 commuters, 19.8%), 20 to 24 minutes (116,182 commuters, 19.4%), and 30 to 34 minutes (86,819 commuters, 14.5%).
| Commute Time | # Commuters | % Commuters |
| Less than 5 Minutes | 8,572 | 1.4% |
| 5 to 9 Minutes | 38,889 | 6.5% |
| 10 to 14 Minutes | 83,128 | 13.9% |
| 15 to 19 Minutes | 118,323 | 19.8% |
| 20 to 24 Minutes | 116,182 | 19.4% |
| 25 to 29 Minutes | 47,718 | 8.0% |
| 30 to 34 Minutes | 86,819 | 14.5% |
| 35 to 39 Minutes | 17,116 | 2.9% |
| 40 to 44 Minutes | 19,582 | 3.3% |
| 45 to 59 Minutes | 32,828 | 5.5% |
| 60 to 89 Minutes | 20,149 | 3.4% |
| 90 or more Minutes | 9,812 | 1.6% |
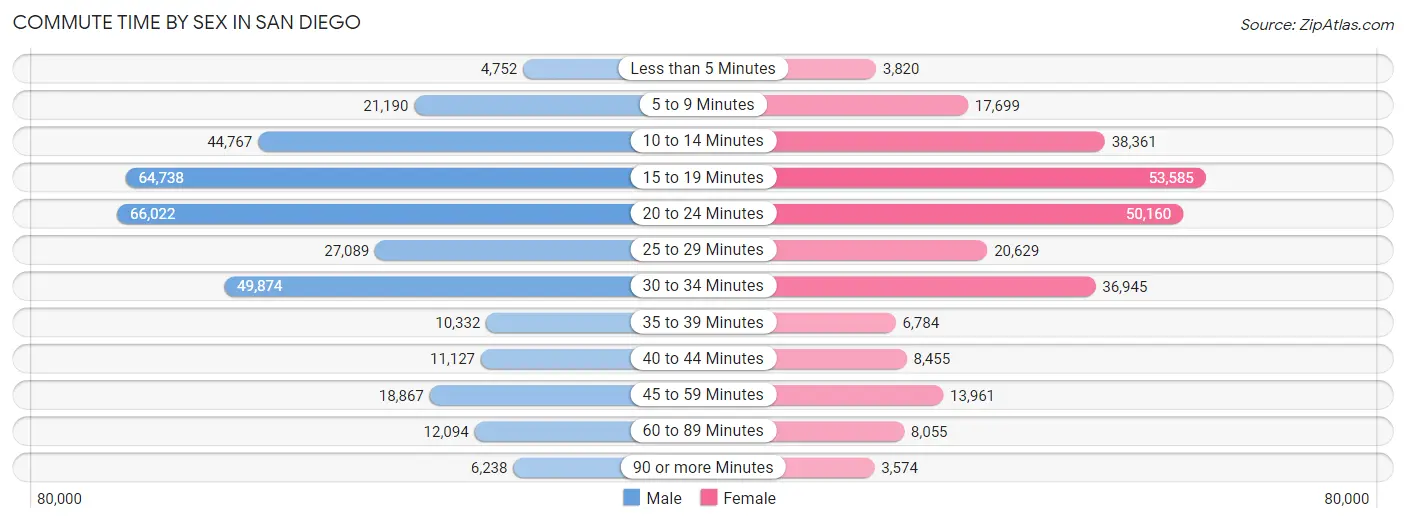
Commute Time by Sex in San Diego
The most common commute times in San Diego are 20 to 24 minutes (66,022 commuters, 19.6%) for males and 15 to 19 minutes (53,585 commuters, 20.4%) for females.
| Commute Time | Male | Female |
| Less than 5 Minutes | 4,752 (1.4%) | 3,820 (1.5%) |
| 5 to 9 Minutes | 21,190 (6.3%) | 17,699 (6.8%) |
| 10 to 14 Minutes | 44,767 (13.3%) | 38,361 (14.6%) |
| 15 to 19 Minutes | 64,738 (19.2%) | 53,585 (20.4%) |
| 20 to 24 Minutes | 66,022 (19.6%) | 50,160 (19.1%) |
| 25 to 29 Minutes | 27,089 (8.0%) | 20,629 (7.9%) |
| 30 to 34 Minutes | 49,874 (14.8%) | 36,945 (14.1%) |
| 35 to 39 Minutes | 10,332 (3.1%) | 6,784 (2.6%) |
| 40 to 44 Minutes | 11,127 (3.3%) | 8,455 (3.2%) |
| 45 to 59 Minutes | 18,867 (5.6%) | 13,961 (5.3%) |
| 60 to 89 Minutes | 12,094 (3.6%) | 8,055 (3.1%) |
| 90 or more Minutes | 6,238 (1.8%) | 3,574 (1.4%) |
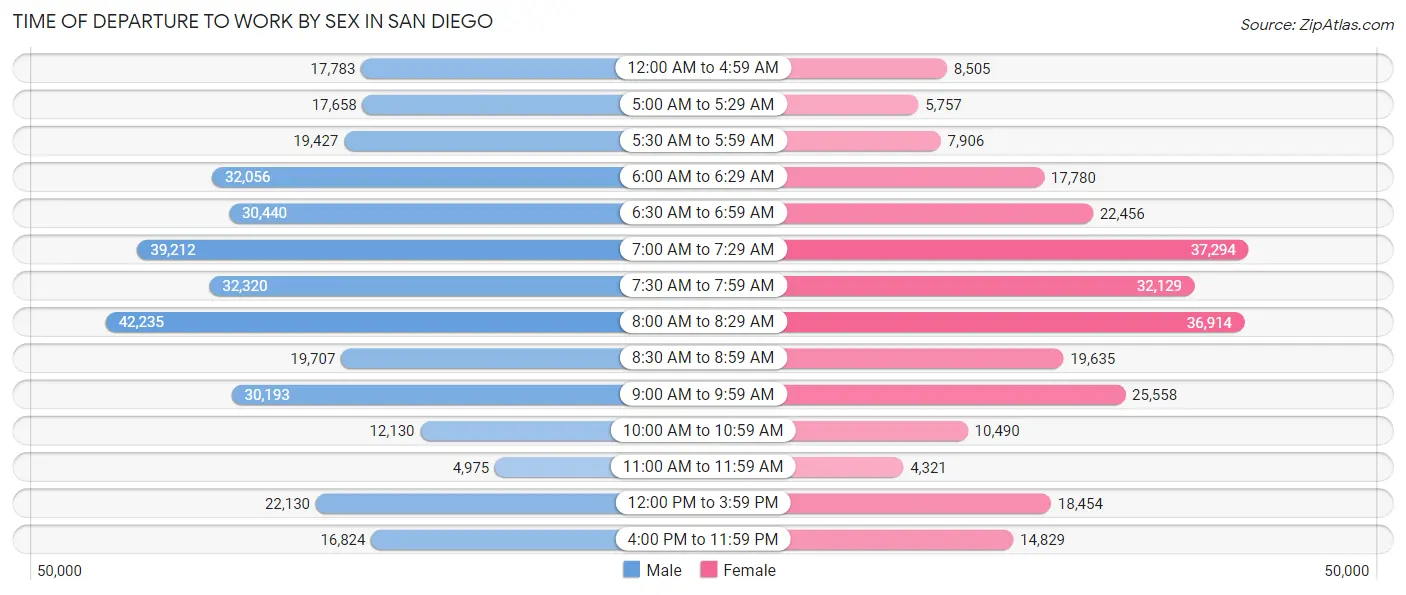
Time of Departure to Work by Sex in San Diego
The most frequent times of departure to work in San Diego are 8:00 AM to 8:29 AM (42,235, 12.5%) for males and 7:00 AM to 7:29 AM (37,294, 14.2%) for females.
| Time of Departure | Male | Female |
| 12:00 AM to 4:59 AM | 17,783 (5.3%) | 8,505 (3.3%) |
| 5:00 AM to 5:29 AM | 17,658 (5.2%) | 5,757 (2.2%) |
| 5:30 AM to 5:59 AM | 19,427 (5.8%) | 7,906 (3.0%) |
| 6:00 AM to 6:29 AM | 32,056 (9.5%) | 17,780 (6.8%) |
| 6:30 AM to 6:59 AM | 30,440 (9.0%) | 22,456 (8.6%) |
| 7:00 AM to 7:29 AM | 39,212 (11.6%) | 37,294 (14.2%) |
| 7:30 AM to 7:59 AM | 32,320 (9.6%) | 32,129 (12.3%) |
| 8:00 AM to 8:29 AM | 42,235 (12.5%) | 36,914 (14.1%) |
| 8:30 AM to 8:59 AM | 19,707 (5.9%) | 19,635 (7.5%) |
| 9:00 AM to 9:59 AM | 30,193 (9.0%) | 25,558 (9.8%) |
| 10:00 AM to 10:59 AM | 12,130 (3.6%) | 10,490 (4.0%) |
| 11:00 AM to 11:59 AM | 4,975 (1.5%) | 4,321 (1.7%) |
| 12:00 PM to 3:59 PM | 22,130 (6.6%) | 18,454 (7.0%) |
| 4:00 PM to 11:59 PM | 16,824 (5.0%) | 14,829 (5.7%) |
| Total | 337,090 (100.0%) | 262,028 (100.0%) |
Housing Occupancy in San Diego
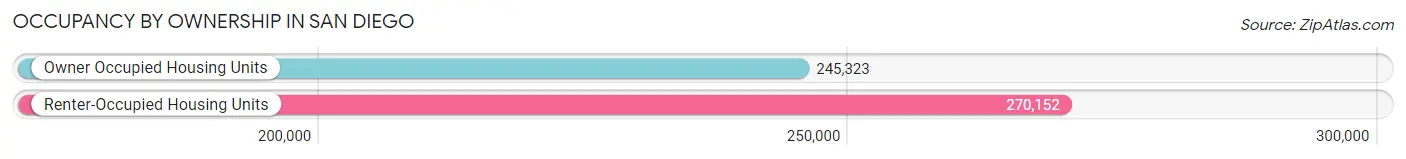
Occupancy by Ownership in San Diego
Of the total 515,475 dwellings in San Diego, owner-occupied units account for 245,323 (47.6%), while renter-occupied units make up 270,152 (52.4%).
| Occupancy | # Housing Units | % Housing Units |
| Owner Occupied Housing Units | 245,323 | 47.6% |
| Renter-Occupied Housing Units | 270,152 | 52.4% |
| Total Occupied Housing Units | 515,475 | 100.0% |
Occupancy by Household Size in San Diego
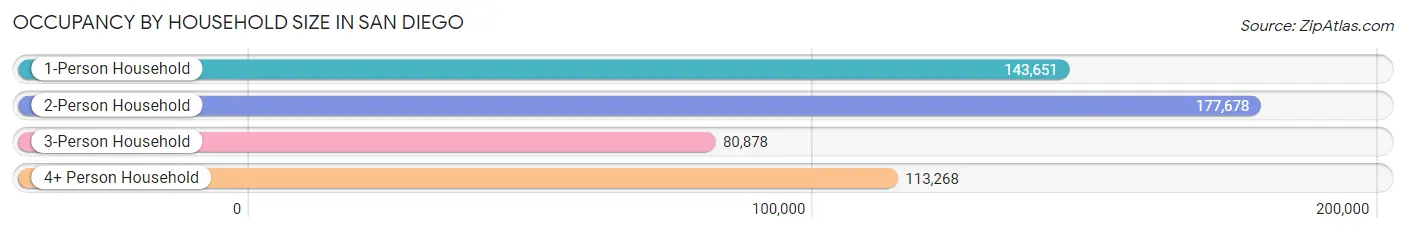
| Household Size | # Housing Units | % Housing Units |
| 1-Person Household | 143,651 | 27.9% |
| 2-Person Household | 177,678 | 34.5% |
| 3-Person Household | 80,878 | 15.7% |
| 4+ Person Household | 113,268 | 22.0% |
| Total Housing Units | 515,475 | 100.0% |
Occupancy by Ownership by Household Size in San Diego
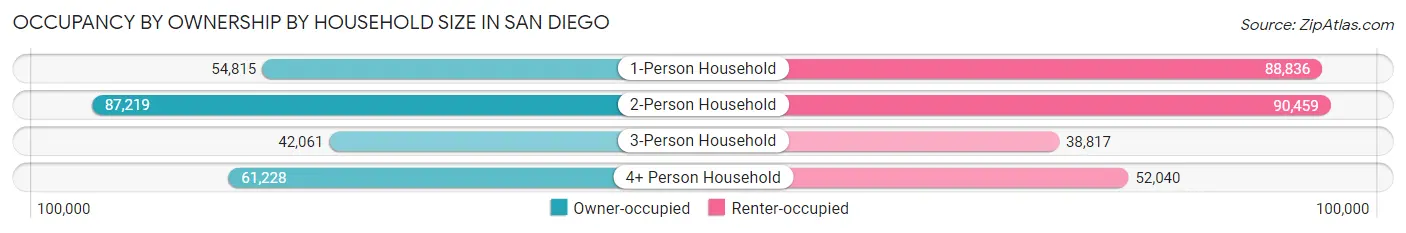
| Household Size | Owner-occupied | Renter-occupied |
| 1-Person Household | 54,815 (38.2%) | 88,836 (61.8%) |
| 2-Person Household | 87,219 (49.1%) | 90,459 (50.9%) |
| 3-Person Household | 42,061 (52.0%) | 38,817 (48.0%) |
| 4+ Person Household | 61,228 (54.1%) | 52,040 (45.9%) |
| Total Housing Units | 245,323 (47.6%) | 270,152 (52.4%) |
Occupancy by Educational Attainment in San Diego
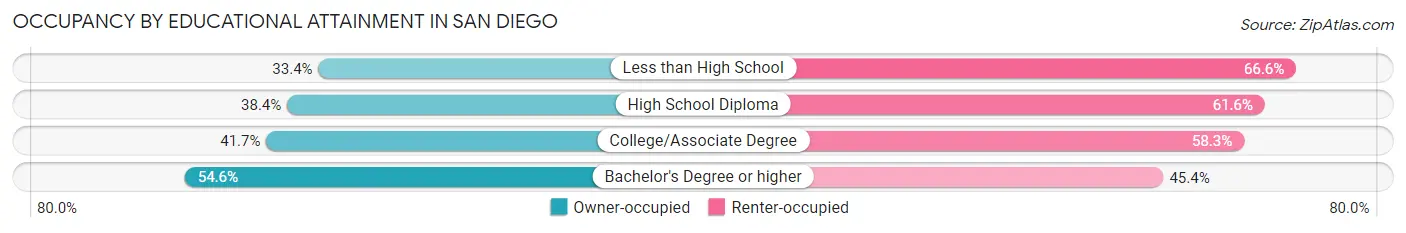
| Household Size | Owner-occupied | Renter-occupied |
| Less than High School | 12,868 (33.4%) | 25,656 (66.6%) |
| High School Diploma | 24,408 (38.4%) | 39,215 (61.6%) |
| College/Associate Degree | 56,694 (41.7%) | 79,389 (58.3%) |
| Bachelor's Degree or higher | 151,353 (54.6%) | 125,892 (45.4%) |
Occupancy by Age of Householder in San Diego
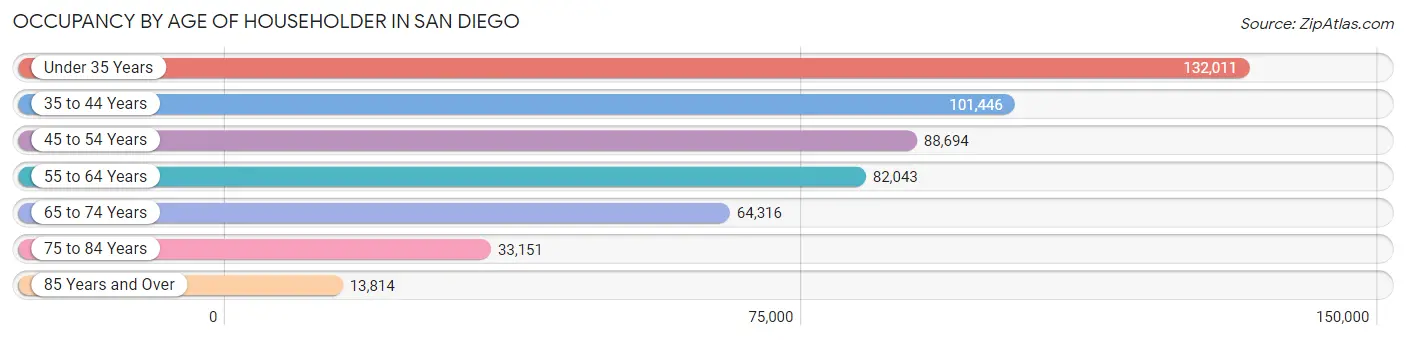
| Age Bracket | # Households | % Households |
| Under 35 Years | 132,011 | 25.6% |
| 35 to 44 Years | 101,446 | 19.7% |
| 45 to 54 Years | 88,694 | 17.2% |
| 55 to 64 Years | 82,043 | 15.9% |
| 65 to 74 Years | 64,316 | 12.5% |
| 75 to 84 Years | 33,151 | 6.4% |
| 85 Years and Over | 13,814 | 2.7% |
| Total | 515,475 | 100.0% |
Housing Finances in San Diego
Median Income by Occupancy in San Diego
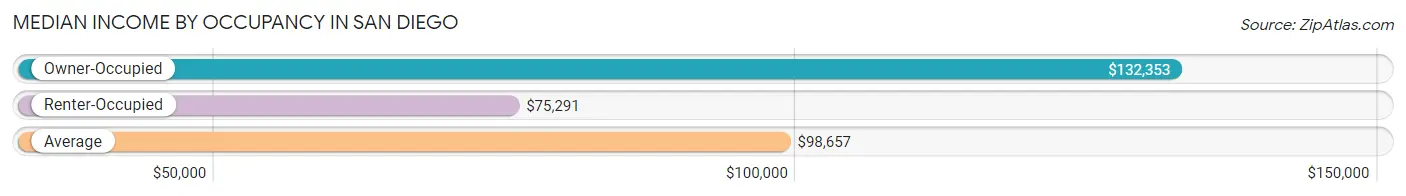
| Occupancy Type | # Households | Median Income |
| Owner-Occupied | 245,323 (47.6%) | $132,353 |
| Renter-Occupied | 270,152 (52.4%) | $75,291 |
| Average | 515,475 (100.0%) | $98,657 |
Occupancy by Householder Income Bracket in San Diego
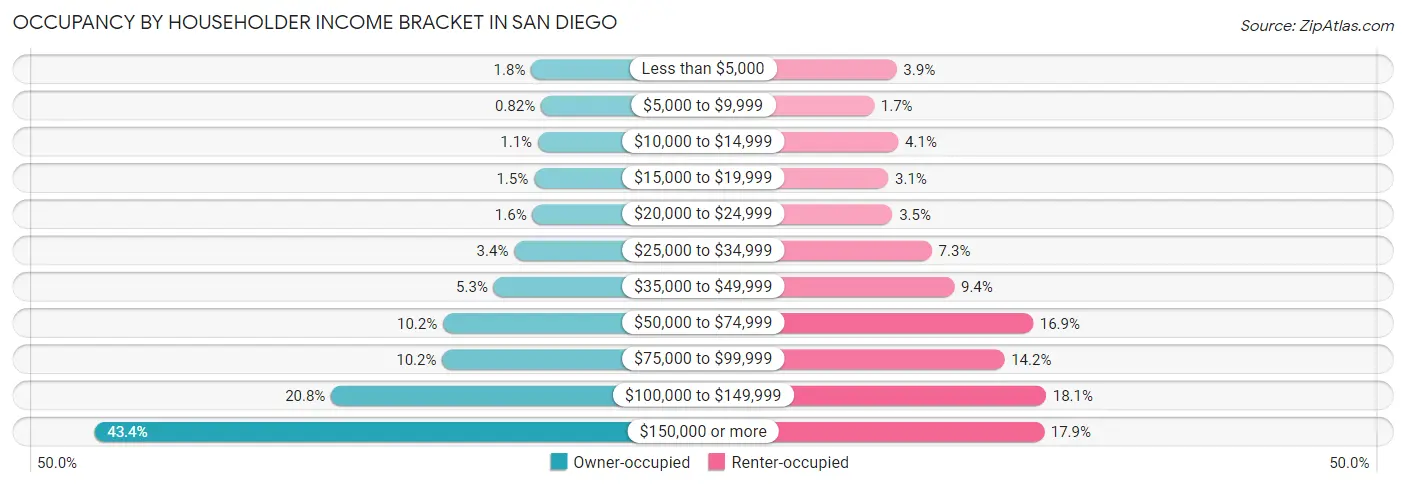
| Income Bracket | Owner-occupied | Renter-occupied |
| Less than $5,000 | 4,283 (1.8%) | 10,507 (3.9%) |
| $5,000 to $9,999 | 2,001 (0.8%) | 4,703 (1.7%) |
| $10,000 to $14,999 | 2,726 (1.1%) | 10,969 (4.1%) |
| $15,000 to $19,999 | 3,624 (1.5%) | 8,371 (3.1%) |
| $20,000 to $24,999 | 3,997 (1.6%) | 9,436 (3.5%) |
| $25,000 to $34,999 | 8,273 (3.4%) | 19,597 (7.2%) |
| $35,000 to $49,999 | 13,051 (5.3%) | 25,331 (9.4%) |
| $50,000 to $74,999 | 24,903 (10.2%) | 45,589 (16.9%) |
| $75,000 to $99,999 | 25,079 (10.2%) | 38,266 (14.2%) |
| $100,000 to $149,999 | 51,025 (20.8%) | 48,950 (18.1%) |
| $150,000 or more | 106,361 (43.4%) | 48,433 (17.9%) |
| Total | 245,323 (100.0%) | 270,152 (100.0%) |
Monthly Housing Cost Tiers in San Diego
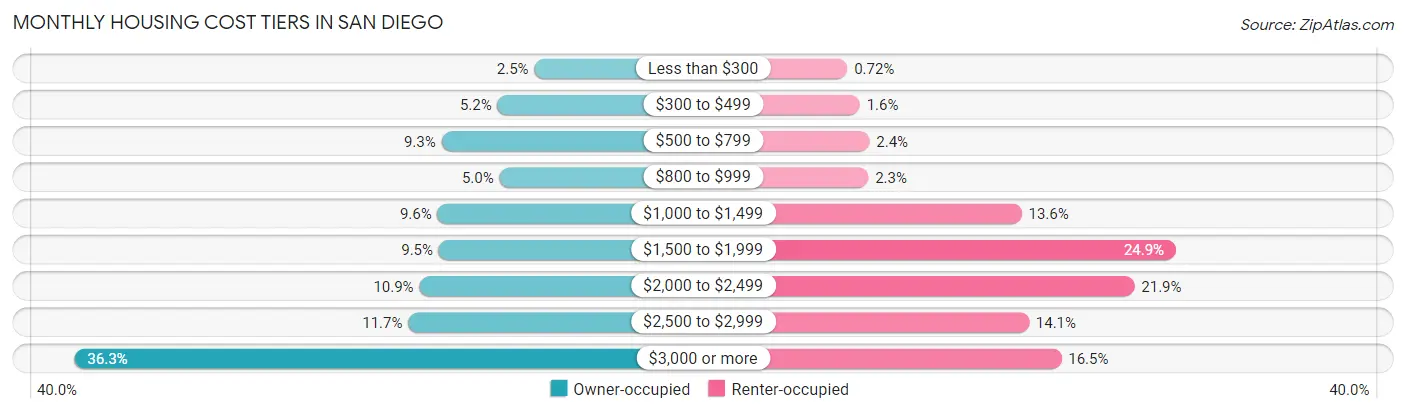
| Monthly Cost | Owner-occupied | Renter-occupied |
| Less than $300 | 6,021 (2.5%) | 1,951 (0.7%) |
| $300 to $499 | 12,678 (5.2%) | 4,432 (1.6%) |
| $500 to $799 | 22,787 (9.3%) | 6,339 (2.4%) |
| $800 to $999 | 12,303 (5.0%) | 6,120 (2.3%) |
| $1,000 to $1,499 | 23,518 (9.6%) | 36,636 (13.6%) |
| $1,500 to $1,999 | 23,285 (9.5%) | 67,357 (24.9%) |
| $2,000 to $2,499 | 26,796 (10.9%) | 59,092 (21.9%) |
| $2,500 to $2,999 | 28,811 (11.7%) | 38,082 (14.1%) |
| $3,000 or more | 89,124 (36.3%) | 44,557 (16.5%) |
| Total | 245,323 (100.0%) | 270,152 (100.0%) |
Physical Housing Characteristics in San Diego
Housing Structures in San Diego
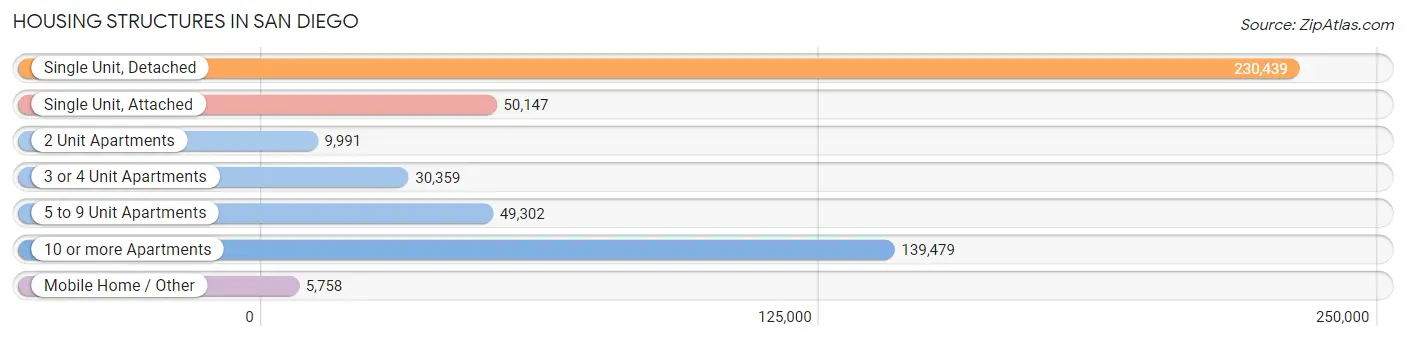
| Structure Type | # Housing Units | % Housing Units |
| Single Unit, Detached | 230,439 | 44.7% |
| Single Unit, Attached | 50,147 | 9.7% |
| 2 Unit Apartments | 9,991 | 1.9% |
| 3 or 4 Unit Apartments | 30,359 | 5.9% |
| 5 to 9 Unit Apartments | 49,302 | 9.6% |
| 10 or more Apartments | 139,479 | 27.1% |
| Mobile Home / Other | 5,758 | 1.1% |
| Total | 515,475 | 100.0% |
Housing Structures by Occupancy in San Diego
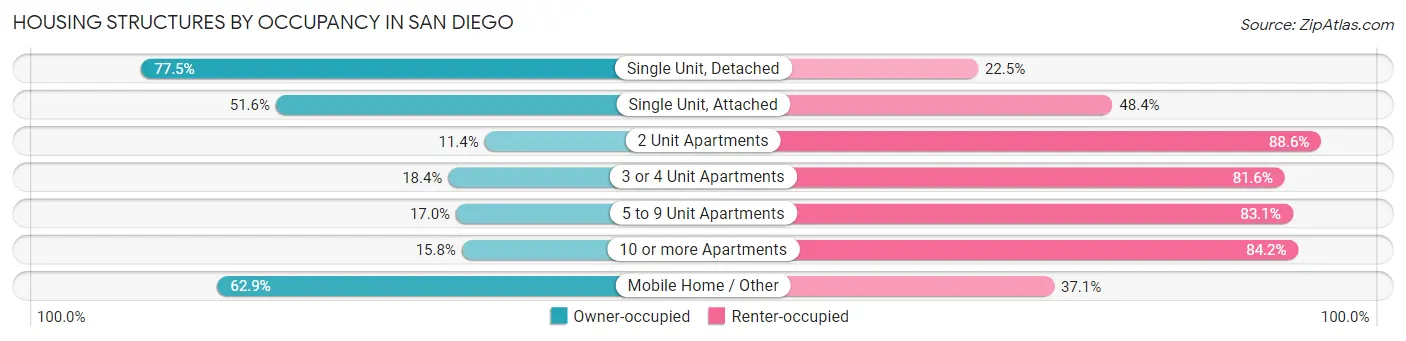
| Structure Type | Owner-occupied | Renter-occupied |
| Single Unit, Detached | 178,619 (77.5%) | 51,820 (22.5%) |
| Single Unit, Attached | 25,892 (51.6%) | 24,255 (48.4%) |
| 2 Unit Apartments | 1,143 (11.4%) | 8,848 (88.6%) |
| 3 or 4 Unit Apartments | 5,597 (18.4%) | 24,762 (81.6%) |
| 5 to 9 Unit Apartments | 8,357 (17.0%) | 40,945 (83.1%) |
| 10 or more Apartments | 22,095 (15.8%) | 117,384 (84.2%) |
| Mobile Home / Other | 3,620 (62.9%) | 2,138 (37.1%) |
| Total | 245,323 (47.6%) | 270,152 (52.4%) |
Housing Structures by Number of Rooms in San Diego
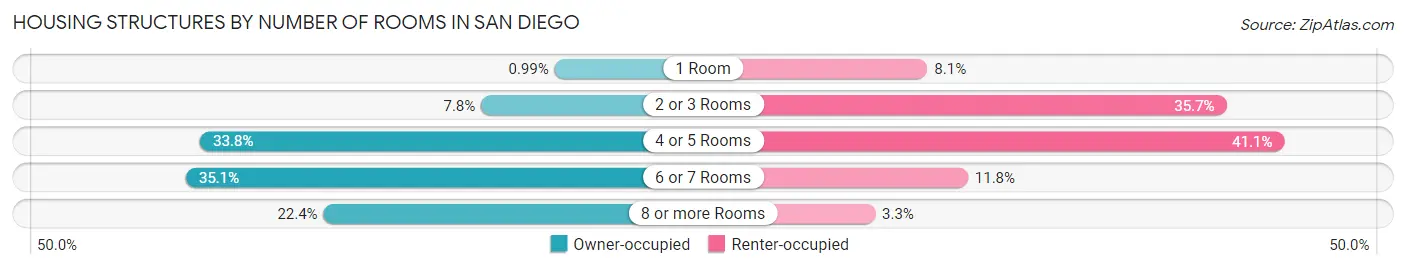
| Number of Rooms | Owner-occupied | Renter-occupied |
| 1 Room | 2,440 (1.0%) | 21,857 (8.1%) |
| 2 or 3 Rooms | 19,082 (7.8%) | 96,542 (35.7%) |
| 4 or 5 Rooms | 82,857 (33.8%) | 111,022 (41.1%) |
| 6 or 7 Rooms | 86,081 (35.1%) | 31,953 (11.8%) |
| 8 or more Rooms | 54,863 (22.4%) | 8,778 (3.3%) |
| Total | 245,323 (100.0%) | 270,152 (100.0%) |
Housing Structure by Heating Type in San Diego
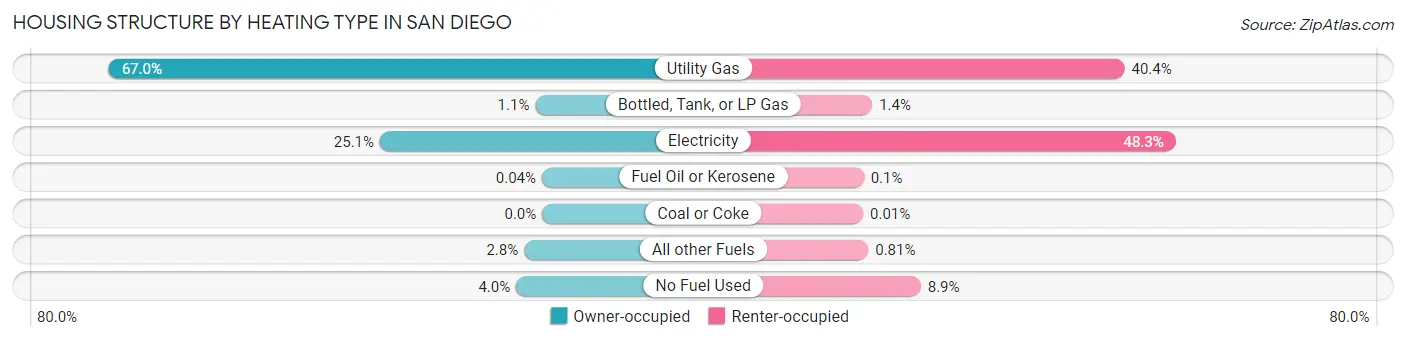
| Heating Type | Owner-occupied | Renter-occupied |
| Utility Gas | 164,351 (67.0%) | 109,202 (40.4%) |
| Bottled, Tank, or LP Gas | 2,589 (1.1%) | 3,834 (1.4%) |
| Electricity | 61,520 (25.1%) | 130,500 (48.3%) |
| Fuel Oil or Kerosene | 108 (0.0%) | 270 (0.1%) |
| Coal or Coke | 6 (0.0%) | 33 (0.0%) |
| All other Fuels | 6,851 (2.8%) | 2,179 (0.8%) |
| No Fuel Used | 9,898 (4.0%) | 24,134 (8.9%) |
| Total | 245,323 (100.0%) | 270,152 (100.0%) |
Household Vehicle Usage in San Diego
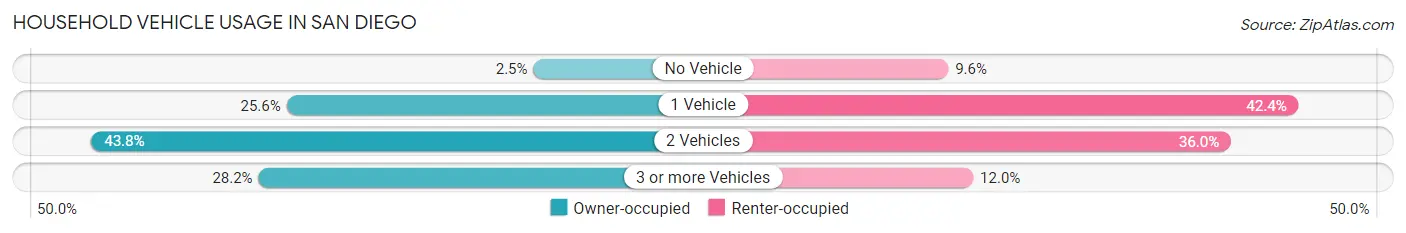
| Vehicles per Household | Owner-occupied | Renter-occupied |
| No Vehicle | 6,147 (2.5%) | 26,033 (9.6%) |
| 1 Vehicle | 62,683 (25.6%) | 114,415 (42.3%) |
| 2 Vehicles | 107,374 (43.8%) | 97,360 (36.0%) |
| 3 or more Vehicles | 69,119 (28.2%) | 32,344 (12.0%) |
| Total | 245,323 (100.0%) | 270,152 (100.0%) |
Real Estate & Mortgages in San Diego
Real Estate and Mortgage Overview in San Diego
| Characteristic | Without Mortgage | With Mortgage |
| Housing Units | 73,000 | 172,323 |
| Median Property Value | $755,300 | $793,800 |
| Median Household Income | $92,716 | $85,428 |
| Monthly Housing Costs | $747 | $87,496 |
| Real Estate Taxes | $3,618 | $2,921 |
Property Value by Mortgage Status in San Diego
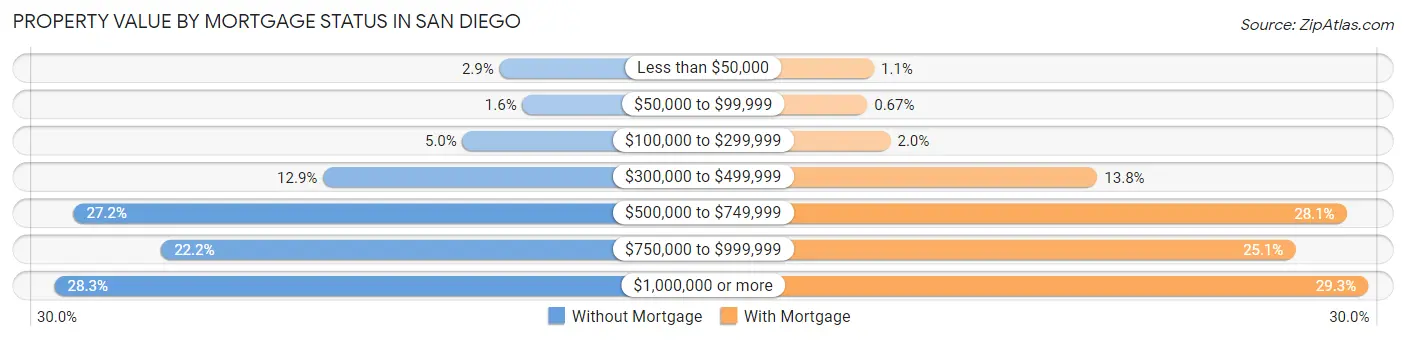
| Property Value | Without Mortgage | With Mortgage |
| Less than $50,000 | 2,091 (2.9%) | 1,829 (1.1%) |
| $50,000 to $99,999 | 1,130 (1.5%) | 1,146 (0.7%) |
| $100,000 to $299,999 | 3,626 (5.0%) | 3,448 (2.0%) |
| $300,000 to $499,999 | 9,449 (12.9%) | 23,822 (13.8%) |
| $500,000 to $749,999 | 19,858 (27.2%) | 48,336 (28.1%) |
| $750,000 to $999,999 | 16,200 (22.2%) | 43,291 (25.1%) |
| $1,000,000 or more | 20,646 (28.3%) | 50,451 (29.3%) |
| Total | 73,000 (100.0%) | 172,323 (100.0%) |
Household Income by Mortgage Status in San Diego
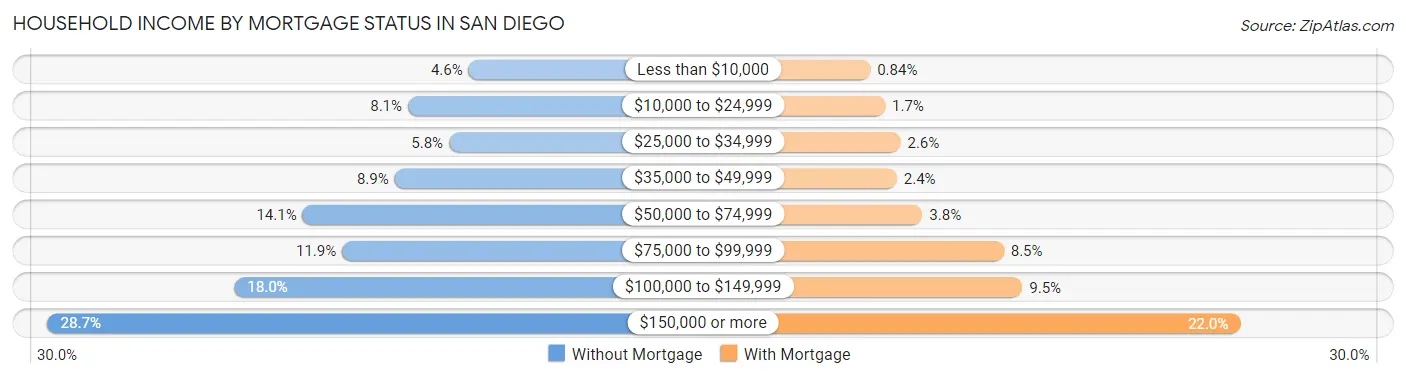
| Household Income | Without Mortgage | With Mortgage |
| Less than $10,000 | 3,380 (4.6%) | 1,450 (0.8%) |
| $10,000 to $24,999 | 5,913 (8.1%) | 2,904 (1.7%) |
| $25,000 to $34,999 | 4,198 (5.8%) | 4,434 (2.6%) |
| $35,000 to $49,999 | 6,468 (8.9%) | 4,075 (2.4%) |
| $50,000 to $74,999 | 10,307 (14.1%) | 6,583 (3.8%) |
| $75,000 to $99,999 | 8,656 (11.9%) | 14,596 (8.5%) |
| $100,000 to $149,999 | 13,145 (18.0%) | 16,423 (9.5%) |
| $150,000 or more | 20,933 (28.7%) | 37,880 (22.0%) |
| Total | 73,000 (100.0%) | 172,323 (100.0%) |
Property Value to Household Income Ratio in San Diego
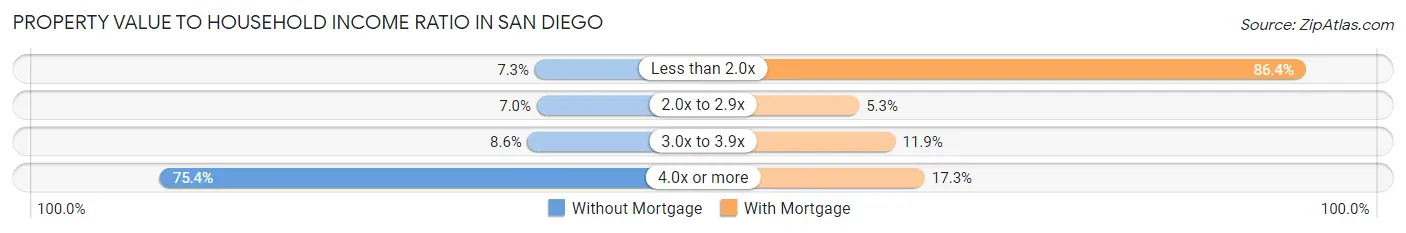
| Value-to-Income Ratio | Without Mortgage | With Mortgage |
| Less than 2.0x | 5,353 (7.3%) | 148,945 (86.4%) |
| 2.0x to 2.9x | 5,088 (7.0%) | 9,164 (5.3%) |
| 3.0x to 3.9x | 6,308 (8.6%) | 20,563 (11.9%) |
| 4.0x or more | 55,069 (75.4%) | 29,727 (17.2%) |
| Total | 73,000 (100.0%) | 172,323 (100.0%) |
Real Estate Taxes by Mortgage Status in San Diego
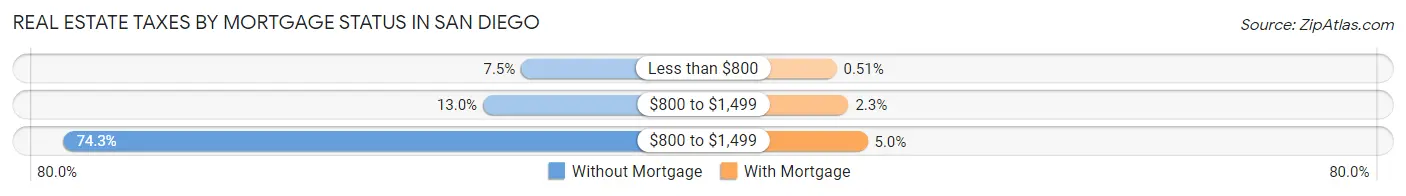
| Property Taxes | Without Mortgage | With Mortgage |
| Less than $800 | 5,435 (7.4%) | 874 (0.5%) |
| $800 to $1,499 | 9,514 (13.0%) | 3,873 (2.2%) |
| $800 to $1,499 | 54,250 (74.3%) | 8,693 (5.0%) |
| Total | 73,000 (100.0%) | 172,323 (100.0%) |
Health & Disability in San Diego
Health Insurance Coverage by Age in San Diego
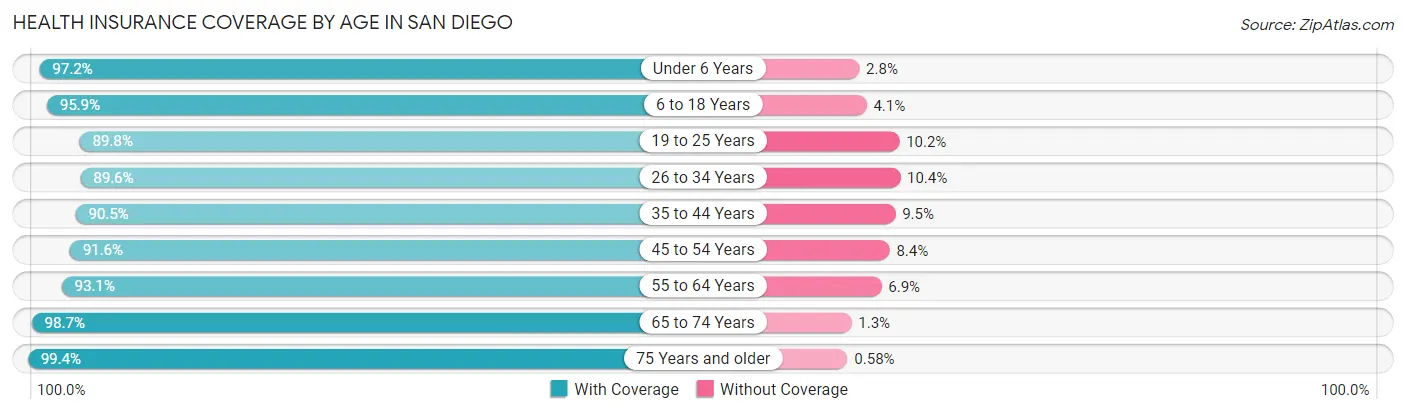
| Age Bracket | With Coverage | Without Coverage |
| Under 6 Years | 86,358 (97.2%) | 2,461 (2.8%) |
| 6 to 18 Years | 185,918 (95.9%) | 8,035 (4.1%) |
| 19 to 25 Years | 124,238 (89.8%) | 14,169 (10.2%) |
| 26 to 34 Years | 195,653 (89.6%) | 22,717 (10.4%) |
| 35 to 44 Years | 175,129 (90.5%) | 18,367 (9.5%) |
| 45 to 54 Years | 151,806 (91.6%) | 13,956 (8.4%) |
| 55 to 64 Years | 139,971 (93.1%) | 10,390 (6.9%) |
| 65 to 74 Years | 109,383 (98.7%) | 1,461 (1.3%) |
| 75 Years and older | 77,916 (99.4%) | 451 (0.6%) |
| Total | 1,246,372 (93.1%) | 92,007 (6.9%) |
Health Insurance Coverage by Citizenship Status in San Diego

| Citizenship Status | With Coverage | Without Coverage |
| Native Born | 86,358 (97.2%) | 2,461 (2.8%) |
| Foreign Born, Citizen | 185,918 (95.9%) | 8,035 (4.1%) |
| Foreign Born, not a Citizen | 124,238 (89.8%) | 14,169 (10.2%) |
Health Insurance Coverage by Household Income in San Diego
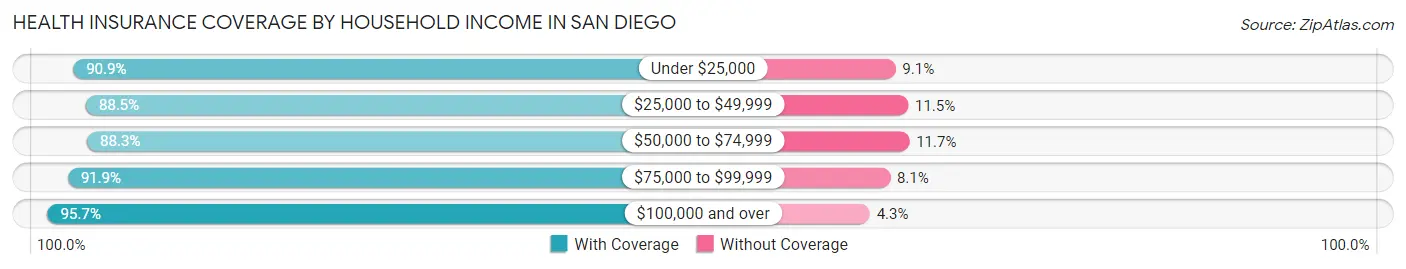
| Household Income | With Coverage | Without Coverage |
| Under $25,000 | 101,504 (90.9%) | 10,175 (9.1%) |
| $25,000 to $49,999 | 131,321 (88.5%) | 17,036 (11.5%) |
| $50,000 to $74,999 | 145,748 (88.3%) | 19,316 (11.7%) |
| $75,000 to $99,999 | 140,366 (91.9%) | 12,331 (8.1%) |
| $100,000 and over | 704,006 (95.7%) | 31,586 (4.3%) |
Public vs Private Health Insurance Coverage by Age in San Diego
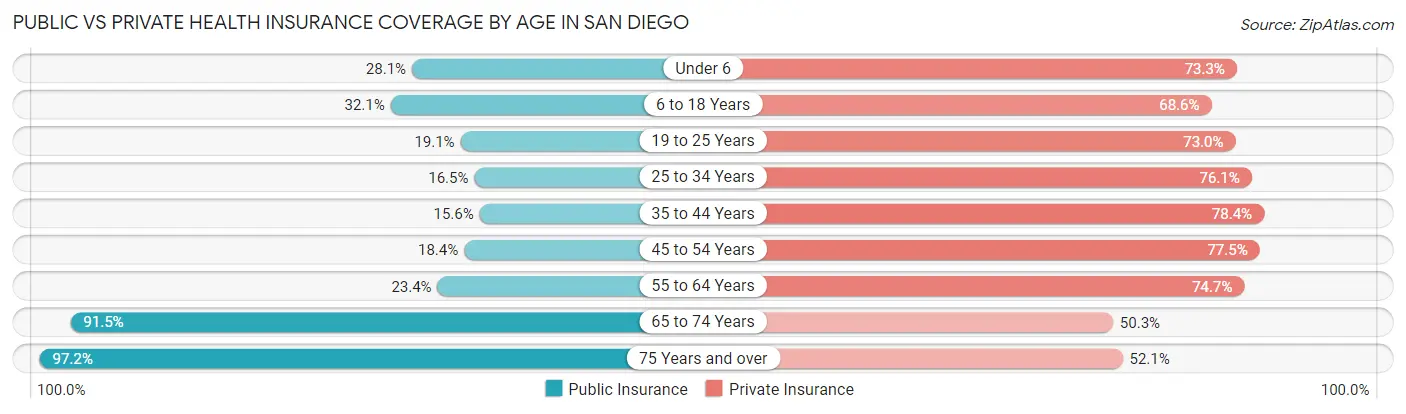
| Age Bracket | Public Insurance | Private Insurance |
| Under 6 | 24,968 (28.1%) | 65,098 (73.3%) |
| 6 to 18 Years | 62,222 (32.1%) | 133,037 (68.6%) |
| 19 to 25 Years | 26,441 (19.1%) | 101,086 (73.0%) |
| 25 to 34 Years | 36,103 (16.5%) | 166,092 (76.1%) |
| 35 to 44 Years | 30,096 (15.5%) | 151,602 (78.3%) |
| 45 to 54 Years | 30,550 (18.4%) | 128,491 (77.5%) |
| 55 to 64 Years | 35,140 (23.4%) | 112,303 (74.7%) |
| 65 to 74 Years | 101,408 (91.5%) | 55,781 (50.3%) |
| 75 Years and over | 76,187 (97.2%) | 40,840 (52.1%) |
| Total | 423,115 (31.6%) | 954,330 (71.3%) |
Disability Status by Sex by Age in San Diego
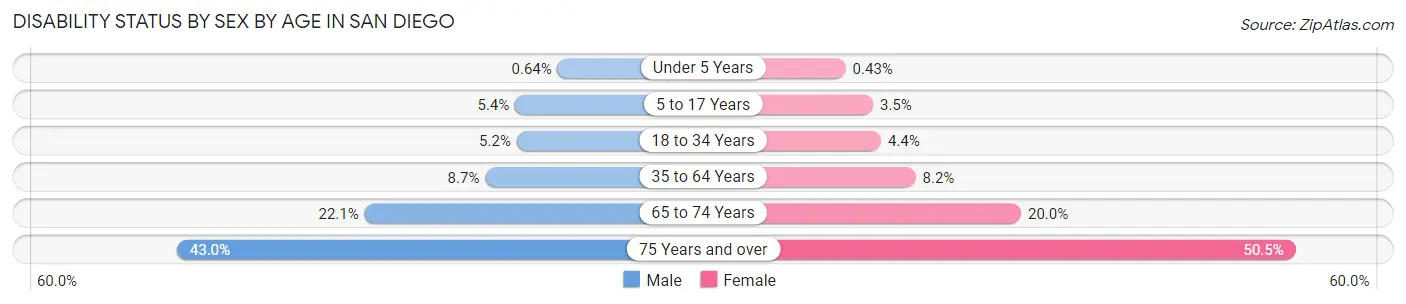
| Age Bracket | Male | Female |
| Under 5 Years | 236 (0.6%) | 163 (0.4%) |
| 5 to 17 Years | 5,272 (5.4%) | 3,107 (3.5%) |
| 18 to 34 Years | 9,882 (5.2%) | 8,179 (4.4%) |
| 35 to 64 Years | 22,575 (8.7%) | 20,576 (8.2%) |
| 65 to 74 Years | 11,388 (22.1%) | 11,854 (20.0%) |
| 75 Years and over | 14,513 (43.0%) | 22,563 (50.5%) |
Disability Class by Sex by Age in San Diego
Disability Class: Hearing Difficulty
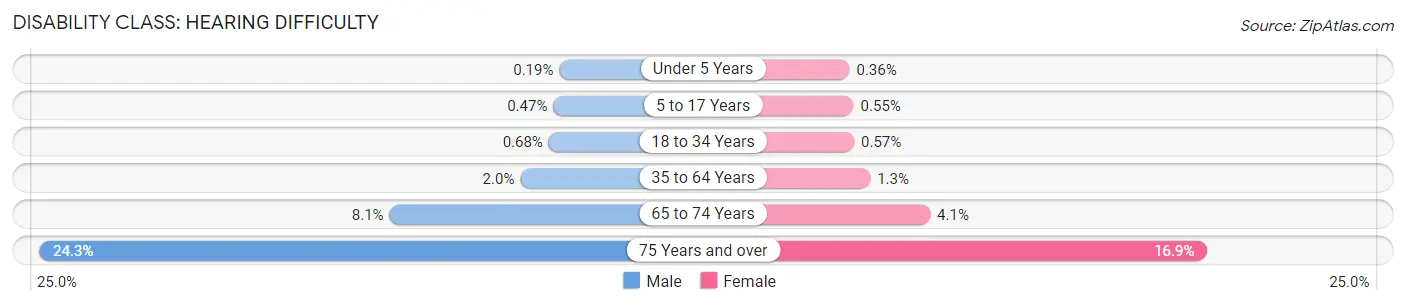
| Age Bracket | Male | Female |
| Under 5 Years | 69 (0.2%) | 136 (0.4%) |
| 5 to 17 Years | 460 (0.5%) | 493 (0.5%) |
| 18 to 34 Years | 1,302 (0.7%) | 1,062 (0.6%) |
| 35 to 64 Years | 5,175 (2.0%) | 3,316 (1.3%) |
| 65 to 74 Years | 4,152 (8.1%) | 2,435 (4.1%) |
| 75 Years and over | 8,187 (24.3%) | 7,551 (16.9%) |
Disability Class: Vision Difficulty
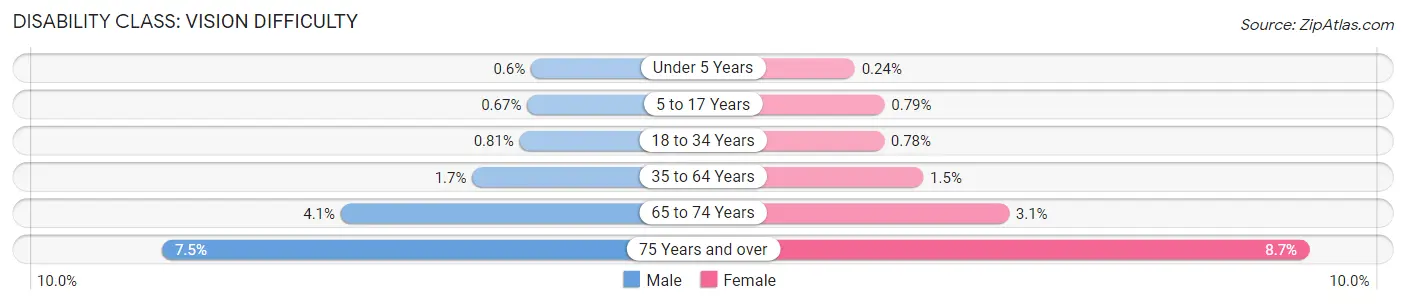
| Age Bracket | Male | Female |
| Under 5 Years | 220 (0.6%) | 90 (0.2%) |
| 5 to 17 Years | 660 (0.7%) | 705 (0.8%) |
| 18 to 34 Years | 1,544 (0.8%) | 1,460 (0.8%) |
| 35 to 64 Years | 4,393 (1.7%) | 3,782 (1.5%) |
| 65 to 74 Years | 2,126 (4.1%) | 1,839 (3.1%) |
| 75 Years and over | 2,512 (7.4%) | 3,873 (8.7%) |
Disability Class: Cognitive Difficulty
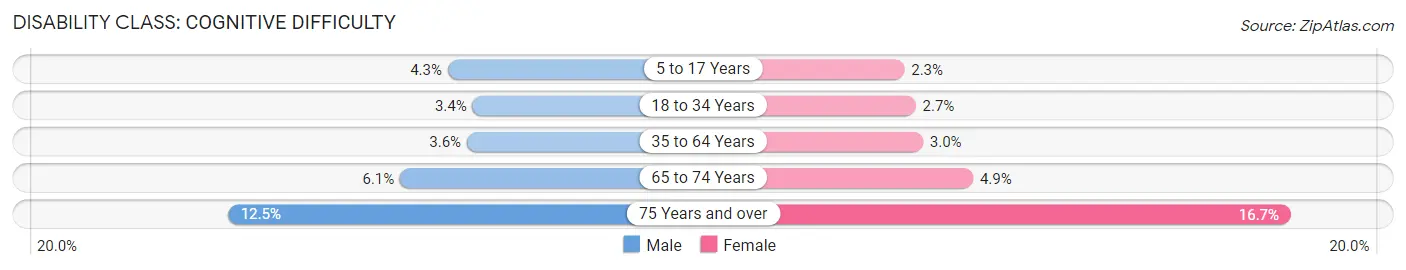
| Age Bracket | Male | Female |
| 5 to 17 Years | 4,212 (4.3%) | 2,077 (2.3%) |
| 18 to 34 Years | 6,408 (3.4%) | 5,116 (2.7%) |
| 35 to 64 Years | 9,276 (3.6%) | 7,536 (3.0%) |
| 65 to 74 Years | 3,118 (6.1%) | 2,893 (4.9%) |
| 75 Years and over | 4,202 (12.5%) | 7,445 (16.7%) |
Disability Class: Ambulatory Difficulty
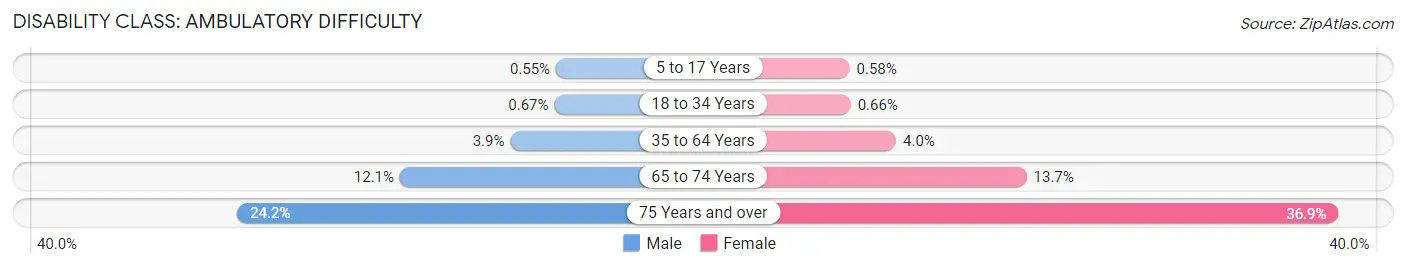
| Age Bracket | Male | Female |
| 5 to 17 Years | 540 (0.5%) | 515 (0.6%) |
| 18 to 34 Years | 1,269 (0.7%) | 1,241 (0.7%) |
| 35 to 64 Years | 10,220 (3.9%) | 10,090 (4.0%) |
| 65 to 74 Years | 6,244 (12.1%) | 8,151 (13.7%) |
| 75 Years and over | 8,165 (24.2%) | 16,460 (36.9%) |
Disability Class: Self-Care Difficulty
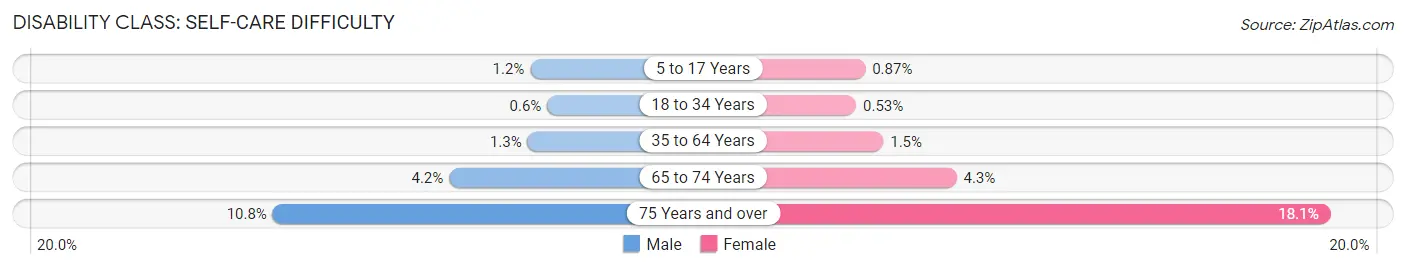
| Age Bracket | Male | Female |
| 5 to 17 Years | 1,202 (1.2%) | 775 (0.9%) |
| 18 to 34 Years | 1,138 (0.6%) | 999 (0.5%) |
| 35 to 64 Years | 3,460 (1.3%) | 3,859 (1.5%) |
| 65 to 74 Years | 2,179 (4.2%) | 2,528 (4.3%) |
| 75 Years and over | 3,638 (10.8%) | 8,099 (18.1%) |
Technology Access in San Diego
Computing Device Access in San Diego
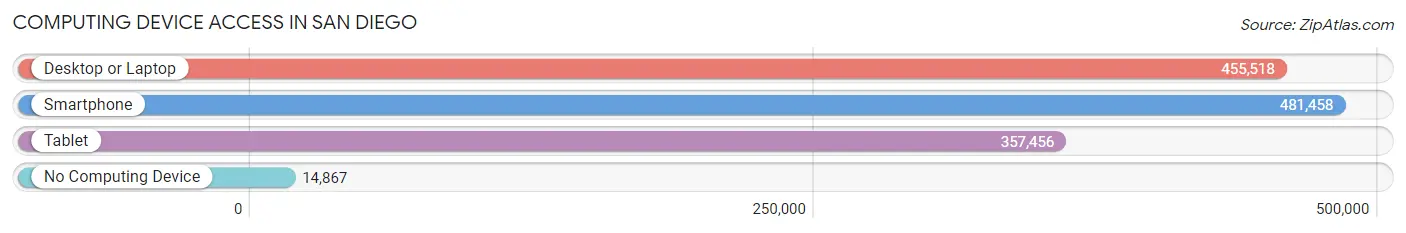
| Device Type | # Households | % Households |
| Desktop or Laptop | 455,518 | 88.4% |
| Smartphone | 481,458 | 93.4% |
| Tablet | 357,456 | 69.3% |
| No Computing Device | 14,867 | 2.9% |
| Total | 515,475 | 100.0% |
Internet Access in San Diego
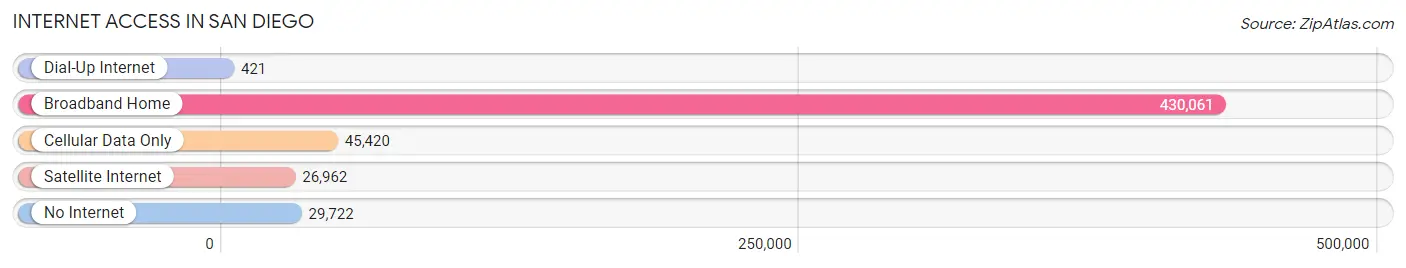
| Internet Type | # Households | % Households |
| Dial-Up Internet | 421 | 0.1% |
| Broadband Home | 430,061 | 83.4% |
| Cellular Data Only | 45,420 | 8.8% |
| Satellite Internet | 26,962 | 5.2% |
| No Internet | 29,722 | 5.8% |
| Total | 515,475 | 100.0% |
San Diego Summary
San Diego, California is a major city located in the southwestern corner of the United States. It is the second-largest city in California and the eighth-largest in the United States. San Diego is known for its mild climate, natural deep-water harbor, extensive beaches, long association with the U.S. Navy, and recent emergence as a healthcare and biotechnology development center.
Geography
San Diego is located in the southwestern corner of California, just north of the Mexican border. It is bordered by the Pacific Ocean to the west, the Anza-Borrego Desert to the east, and the Laguna Mountains to the north. The city is situated on a coastal plain, with an average elevation of about 500 feet (150 m). The city's terrain is mostly flat, with some hills and canyons. The highest point in the city is Cowles Mountain, which rises to an elevation of 1,591 feet (485 m).
San Diego has a Mediterranean climate, with mild, wet winters and hot, dry summers. The average annual temperature is 64°F (18°C). The average annual precipitation is 10.3 inches (261 mm).
Economy
San Diego's economy is largely based on tourism, defense, and manufacturing. The city is home to several major military installations, including the Marine Corps Air Station Miramar, the Naval Base San Diego, and the Naval Air Station North Island. The city is also home to several major defense contractors, including General Atomics, Northrop Grumman, and Lockheed Martin.
San Diego is also a major manufacturing center, with a large number of companies producing electronics, medical devices, and other products. The city is home to several major companies, including Qualcomm, Sempra Energy, and Petco.
San Diego is also a major tourist destination, with more than 30 million visitors each year. The city is home to several major attractions, including the San Diego Zoo, SeaWorld San Diego, and the USS Midway Museum.
Demographics
As of the 2010 census, San Diego had a population of 1,301,617. The racial makeup of the city was 48.5% White, 8.3% African American, 0.7% Native American, 28.2% Asian, 0.4% Pacific Islander, 11.3% from other races, and 2.6% from two or more races. Hispanic or Latino of any race were 28.0% of the population.
The median income for a household in the city was $50,867, and the median income for a family was $60,717. The per capita income for the city was $27,837. About 11.3% of families and 14.9% of the population were below the poverty line, including 19.2% of those under age 18 and 8.3% of those age 65 or over.
San Diego is a diverse city, with a large population of immigrants from Mexico, Central America, and Asia. The city is also home to a large number of military personnel and their families.
Common Questions
What is Per Capita Income in San Diego?
Per Capita income in San Diego is $51,368.
What is the Median Family Income in San Diego?
Median Family Income in San Diego is $115,908.
What is the Median Household income in San Diego?
Median Household Income in San Diego is $98,657.
What is Income or Wage Gap in San Diego?
Income or Wage Gap in San Diego is 25.2%.
Women in San Diego earn 74.8 cents for every dollar earned by a man.
What is Family Income Deficit in San Diego?
Family Income Deficit in San Diego is $10,783.
Families that are below poverty line in San Diego earn $10,783 less on average than the poverty threshold level.
What is Inequality or Gini Index in San Diego?
Inequality or Gini Index in San Diego is 0.46.
What is the Total Population of San Diego?
Total Population of San Diego is 1,383,987.
What is the Total Male Population of San Diego?
Total Male Population of San Diego is 706,494.
What is the Total Female Population of San Diego?
Total Female Population of San Diego is 677,493.
What is the Ratio of Males per 100 Females in San Diego?
There are 104.28 Males per 100 Females in San Diego.
What is the Ratio of Females per 100 Males in San Diego?
There are 95.90 Females per 100 Males in San Diego.
What is the Median Population Age in San Diego?
Median Population Age in San Diego is 35.8 Years.
What is the Average Family Size in San Diego
Average Family Size in San Diego is 3.2 People.
What is the Average Household Size in San Diego
Average Household Size in San Diego is 2.6 People.
How Large is the Labor Force in San Diego?
There are 783,143 People in the Labor Forcein in San Diego.
What is the Percentage of People in the Labor Force in San Diego?
68.1% of People are in the Labor Force in San Diego.
What is the Unemployment Rate in San Diego?
Unemployment Rate in San Diego is 6.1%.