Cities with the Largest Black / African American Community in Virginia
RELATED REPORTS & OPTIONS
Black / African American
Virginia
Compare Cities
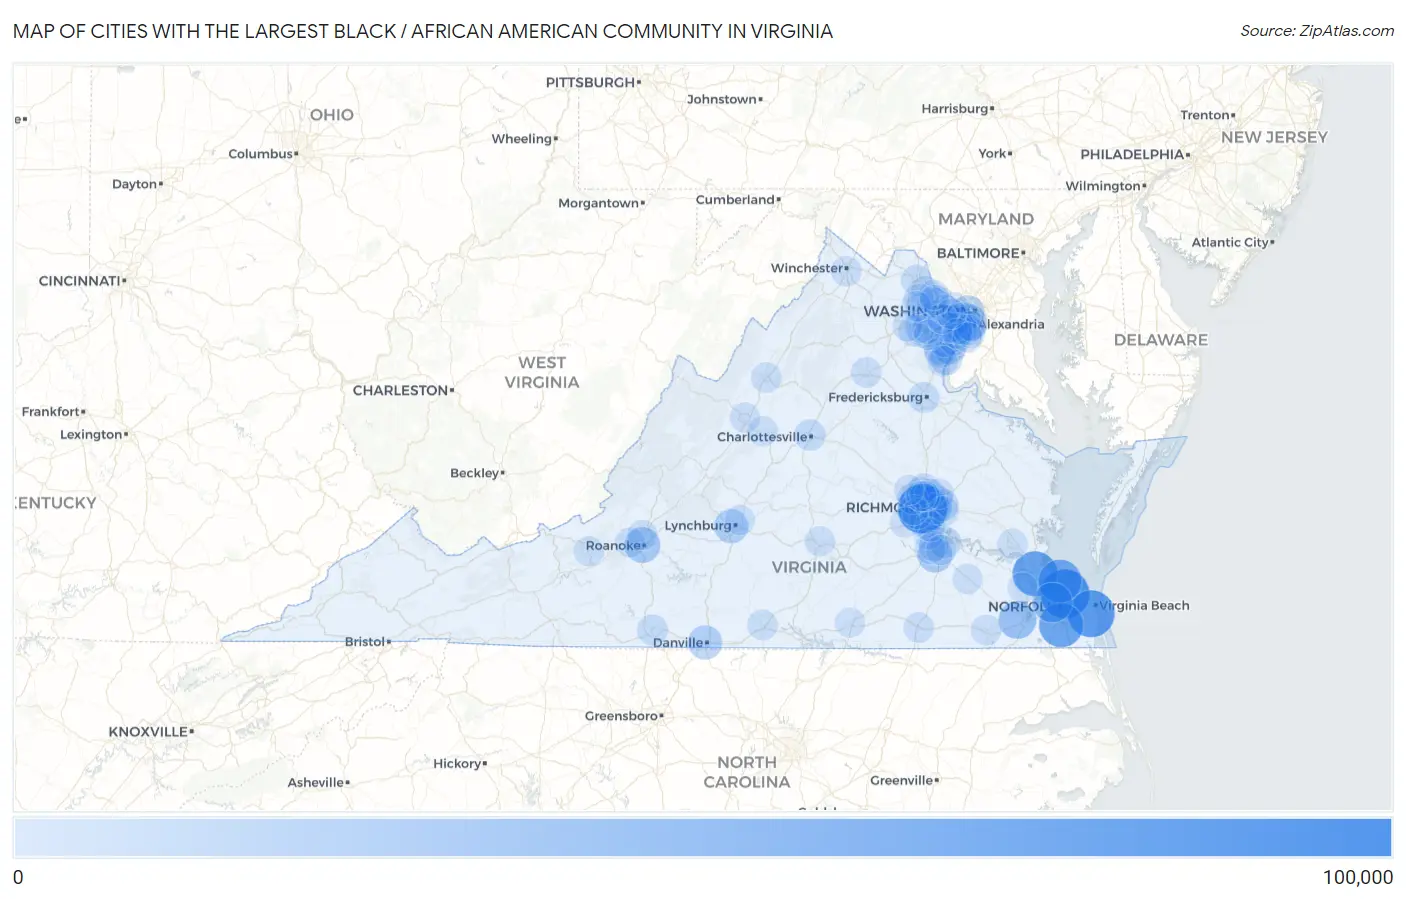
Map of Cities with the Largest Black / African American Community in Virginia
0
100,000
Cities with the Largest Black / African American Community in Virginia
| City | Black / African American | vs State | vs National | |
| 1. | Richmond | 99,855 | 1,630,355(6.12%)#1 | 41,288,572(0.24%)#37 |
| 2. | Norfolk | 96,487 | 1,630,355(5.92%)#2 | 41,288,572(0.23%)#40 |
| 3. | Virginia Beach | 86,497 | 1,630,355(5.31%)#3 | 41,288,572(0.21%)#48 |
| 4. | Newport News | 76,203 | 1,630,355(4.67%)#4 | 41,288,572(0.18%)#57 |
| 5. | Chesapeake | 73,034 | 1,630,355(4.48%)#5 | 41,288,572(0.18%)#61 |
| 6. | Hampton | 67,213 | 1,630,355(4.12%)#6 | 41,288,572(0.16%)#66 |
| 7. | Portsmouth | 50,091 | 1,630,355(3.07%)#7 | 41,288,572(0.12%)#94 |
| 8. | Suffolk | 39,413 | 1,630,355(2.42%)#8 | 41,288,572(0.10%)#112 |
| 9. | Alexandria | 33,645 | 1,630,355(2.06%)#9 | 41,288,572(0.08%)#137 |
| 10. | Roanoke | 29,140 | 1,630,355(1.79%)#10 | 41,288,572(0.07%)#163 |
| 11. | Petersburg | 25,698 | 1,630,355(1.58%)#11 | 41,288,572(0.06%)#191 |
| 12. | Arlington | 21,994 | 1,630,355(1.35%)#12 | 41,288,572(0.05%)#239 |
| 13. | Lynchburg | 21,824 | 1,630,355(1.34%)#13 | 41,288,572(0.05%)#240 |
| 14. | Danville | 21,338 | 1,630,355(1.31%)#14 | 41,288,572(0.05%)#244 |
| 15. | Dale City | 17,634 | 1,630,355(1.08%)#15 | 41,288,572(0.04%)#295 |
| 16. | East Highland Park | 14,176 | 1,630,355(0.87%)#16 | 41,288,572(0.03%)#371 |
| 17. | Cherry Hill | 11,544 | 1,630,355(0.71%)#17 | 41,288,572(0.03%)#478 |
| 18. | Highland Springs | 10,990 | 1,630,355(0.67%)#18 | 41,288,572(0.03%)#502 |
| 19. | Woodbridge | 10,886 | 1,630,355(0.67%)#19 | 41,288,572(0.03%)#506 |
| 20. | Hopewell | 9,978 | 1,630,355(0.61%)#20 | 41,288,572(0.02%)#557 |
| 21. | Leesylvania | 9,812 | 1,630,355(0.60%)#21 | 41,288,572(0.02%)#566 |
| 22. | Lake Ridge | 9,452 | 1,630,355(0.58%)#22 | 41,288,572(0.02%)#587 |
| 23. | Meadowbrook | 8,425 | 1,630,355(0.52%)#23 | 41,288,572(0.02%)#670 |
| 24. | Charlottesville | 7,945 | 1,630,355(0.49%)#24 | 41,288,572(0.02%)#711 |
| 25. | Woodlawn Cdp Fairfax County | 7,861 | 1,630,355(0.48%)#25 | 41,288,572(0.02%)#719 |
| 26. | Lorton | 6,342 | 1,630,355(0.39%)#26 | 41,288,572(0.02%)#860 |
| 27. | Montrose | 6,176 | 1,630,355(0.38%)#27 | 41,288,572(0.01%)#882 |
| 28. | Martinsville | 6,148 | 1,630,355(0.38%)#28 | 41,288,572(0.01%)#887 |
| 29. | Fredericksburg | 6,084 | 1,630,355(0.37%)#29 | 41,288,572(0.01%)#893 |
| 30. | Reston | 6,077 | 1,630,355(0.37%)#30 | 41,288,572(0.01%)#895 |
| 31. | Chester | 5,866 | 1,630,355(0.36%)#31 | 41,288,572(0.01%)#923 |
| 32. | Laurel | 5,747 | 1,630,355(0.35%)#32 | 41,288,572(0.01%)#939 |
| 33. | Manassas | 5,708 | 1,630,355(0.35%)#33 | 41,288,572(0.01%)#946 |
| 34. | Lincolnia | 5,310 | 1,630,355(0.33%)#34 | 41,288,572(0.01%)#1,007 |
| 35. | Hybla Valley | 5,247 | 1,630,355(0.32%)#35 | 41,288,572(0.01%)#1,016 |
| 36. | Bailey S Crossroads | 5,128 | 1,630,355(0.31%)#36 | 41,288,572(0.01%)#1,032 |
| 37. | Centreville | 5,112 | 1,630,355(0.31%)#37 | 41,288,572(0.01%)#1,036 |
| 38. | Leesburg | 5,047 | 1,630,355(0.31%)#38 | 41,288,572(0.01%)#1,051 |
| 39. | Linton Hall | 4,844 | 1,630,355(0.30%)#39 | 41,288,572(0.01%)#1,083 |
| 40. | Tuckahoe | 4,577 | 1,630,355(0.28%)#40 | 41,288,572(0.01%)#1,138 |
| 41. | Montclair | 4,573 | 1,630,355(0.28%)#41 | 41,288,572(0.01%)#1,141 |
| 42. | Kingstowne | 4,557 | 1,630,355(0.28%)#42 | 41,288,572(0.01%)#1,143 |
| 43. | Glen Allen | 4,308 | 1,630,355(0.26%)#43 | 41,288,572(0.01%)#1,197 |
| 44. | South Boston | 4,214 | 1,630,355(0.26%)#44 | 41,288,572(0.01%)#1,227 |
| 45. | Franklin | 4,212 | 1,630,355(0.26%)#45 | 41,288,572(0.01%)#1,229 |
| 46. | Franconia | 4,170 | 1,630,355(0.26%)#46 | 41,288,572(0.01%)#1,238 |
| 47. | Manchester | 4,063 | 1,630,355(0.25%)#47 | 41,288,572(0.01%)#1,262 |
| 48. | Triangle | 4,030 | 1,630,355(0.25%)#48 | 41,288,572(0.01%)#1,278 |
| 49. | Ettrick | 3,987 | 1,630,355(0.24%)#49 | 41,288,572(0.01%)#1,292 |
| 50. | Bull Run | 3,940 | 1,630,355(0.24%)#50 | 41,288,572(0.01%)#1,304 |
| 51. | Annandale | 3,929 | 1,630,355(0.24%)#51 | 41,288,572(0.01%)#1,311 |
| 52. | Harrisonburg | 3,881 | 1,630,355(0.24%)#52 | 41,288,572(0.01%)#1,318 |
| 53. | Springfield | 3,751 | 1,630,355(0.23%)#53 | 41,288,572(0.01%)#1,357 |
| 54. | Culpeper | 3,746 | 1,630,355(0.23%)#54 | 41,288,572(0.01%)#1,359 |
| 55. | Fair Oaks | 3,639 | 1,630,355(0.22%)#55 | 41,288,572(0.01%)#1,385 |
| 56. | Ashburn | 3,529 | 1,630,355(0.22%)#56 | 41,288,572(0.01%)#1,416 |
| 57. | Emporia | 3,440 | 1,630,355(0.21%)#57 | 41,288,572(0.01%)#1,445 |
| 58. | South Riding | 3,268 | 1,630,355(0.20%)#58 | 41,288,572(0.01%)#1,510 |
| 59. | West Springfield | 3,184 | 1,630,355(0.20%)#59 | 41,288,572(0.01%)#1,547 |
| 60. | Colonial Heights | 3,127 | 1,630,355(0.19%)#60 | 41,288,572(0.01%)#1,565 |
| 61. | Mechanicsville | 3,098 | 1,630,355(0.19%)#61 | 41,288,572(0.01%)#1,576 |
| 62. | Mcnair | 3,078 | 1,630,355(0.19%)#62 | 41,288,572(0.01%)#1,586 |
| 63. | Burke | 3,068 | 1,630,355(0.19%)#63 | 41,288,572(0.01%)#1,588 |
| 64. | Chamberlayne | 2,921 | 1,630,355(0.18%)#64 | 41,288,572(0.01%)#1,656 |
| 65. | Groveton | 2,878 | 1,630,355(0.18%)#65 | 41,288,572(0.01%)#1,673 |
| 66. | Bellwood | 2,850 | 1,630,355(0.17%)#66 | 41,288,572(0.01%)#1,681 |
| 67. | Sandston | 2,799 | 1,630,355(0.17%)#67 | 41,288,572(0.01%)#1,699 |
| 68. | Winchester | 2,793 | 1,630,355(0.17%)#68 | 41,288,572(0.01%)#1,701 |
| 69. | Staunton | 2,739 | 1,630,355(0.17%)#69 | 41,288,572(0.01%)#1,723 |
| 70. | Manassas Park | 2,514 | 1,630,355(0.15%)#70 | 41,288,572(0.01%)#1,849 |
| 71. | Fort Lee | 2,501 | 1,630,355(0.15%)#71 | 41,288,572(0.01%)#1,858 |
| 72. | Bon Air | 2,498 | 1,630,355(0.15%)#72 | 41,288,572(0.01%)#1,860 |
| 73. | Madison Heights | 2,453 | 1,630,355(0.15%)#73 | 41,288,572(0.01%)#1,888 |
| 74. | Waynesboro | 2,363 | 1,630,355(0.14%)#74 | 41,288,572(0.01%)#1,946 |
| 75. | Williamsburg | 2,360 | 1,630,355(0.14%)#75 | 41,288,572(0.01%)#1,949 |
| 76. | Lakeside | 2,352 | 1,630,355(0.14%)#76 | 41,288,572(0.01%)#1,953 |
| 77. | Oakton | 2,303 | 1,630,355(0.14%)#77 | 41,288,572(0.01%)#1,987 |
| 78. | Brambleton | 2,299 | 1,630,355(0.14%)#78 | 41,288,572(0.01%)#1,991 |
| 79. | South Hill | 2,228 | 1,630,355(0.14%)#79 | 41,288,572(0.01%)#2,025 |
| 80. | Buckhall | 2,222 | 1,630,355(0.14%)#80 | 41,288,572(0.01%)#2,032 |
| 81. | Huntington | 2,218 | 1,630,355(0.14%)#81 | 41,288,572(0.01%)#2,035 |
| 82. | Gainesville | 2,216 | 1,630,355(0.14%)#82 | 41,288,572(0.01%)#2,036 |
| 83. | Blacksburg | 2,185 | 1,630,355(0.13%)#83 | 41,288,572(0.01%)#2,059 |
| 84. | Tysons | 2,172 | 1,630,355(0.13%)#84 | 41,288,572(0.01%)#2,071 |
| 85. | Brandermill | 2,153 | 1,630,355(0.13%)#85 | 41,288,572(0.01%)#2,088 |
| 86. | George Mason | 2,118 | 1,630,355(0.13%)#86 | 41,288,572(0.01%)#2,120 |
| 87. | Newington | 2,108 | 1,630,355(0.13%)#87 | 41,288,572(0.01%)#2,133 |
| 88. | Midlothian | 2,093 | 1,630,355(0.13%)#88 | 41,288,572(0.01%)#2,140 |
| 89. | Sterling | 2,055 | 1,630,355(0.13%)#89 | 41,288,572(0.00%)#2,176 |
| 90. | Stone Ridge | 2,025 | 1,630,355(0.12%)#90 | 41,288,572(0.00%)#2,200 |
| 91. | Waverly | 2,010 | 1,630,355(0.12%)#91 | 41,288,572(0.00%)#2,210 |
| 92. | Salem | 2,003 | 1,630,355(0.12%)#92 | 41,288,572(0.00%)#2,213 |
| 93. | Smithfield | 1,996 | 1,630,355(0.12%)#93 | 41,288,572(0.00%)#2,221 |
| 94. | Mount Vernon | 1,993 | 1,630,355(0.12%)#94 | 41,288,572(0.00%)#2,223 |
| 95. | Farmville | 1,954 | 1,630,355(0.12%)#95 | 41,288,572(0.00%)#2,261 |
| 96. | Dumbarton | 1,923 | 1,630,355(0.12%)#96 | 41,288,572(0.00%)#2,284 |
| 97. | Short Pump | 1,888 | 1,630,355(0.12%)#97 | 41,288,572(0.00%)#2,317 |
| 98. | Merrifield | 1,853 | 1,630,355(0.11%)#98 | 41,288,572(0.00%)#2,342 |
| 99. | Herndon | 1,818 | 1,630,355(0.11%)#99 | 41,288,572(0.00%)#2,365 |
| 100. | Hollins | 1,797 | 1,630,355(0.11%)#100 | 41,288,572(0.00%)#2,384 |
Common Questions
What are the Top 10 Cities with the Largest Black / African American Community in Virginia?
Top 10 Cities with the Largest Black / African American Community in Virginia are:
#1
99,855
#2
96,487
#3
86,497
#4
76,203
#5
73,034
#6
67,213
#7
50,091
#8
39,413
#9
33,645
#10
29,140
What city has the Largest Black / African American Community in Virginia?
Richmond has the Largest Black / African American Community in Virginia with 99,855.
What is the Total Black / African American Population in the State of Virginia?
Total Black / African American Population in Virginia is 1,630,355.
What is the Total Black / African American Population in the United States?
Total Black / African American Population in the United States is 41,288,572.