Cities with the Largest Black / African American Community in Indiana
RELATED REPORTS & OPTIONS
Black / African American
Indiana
Compare Cities
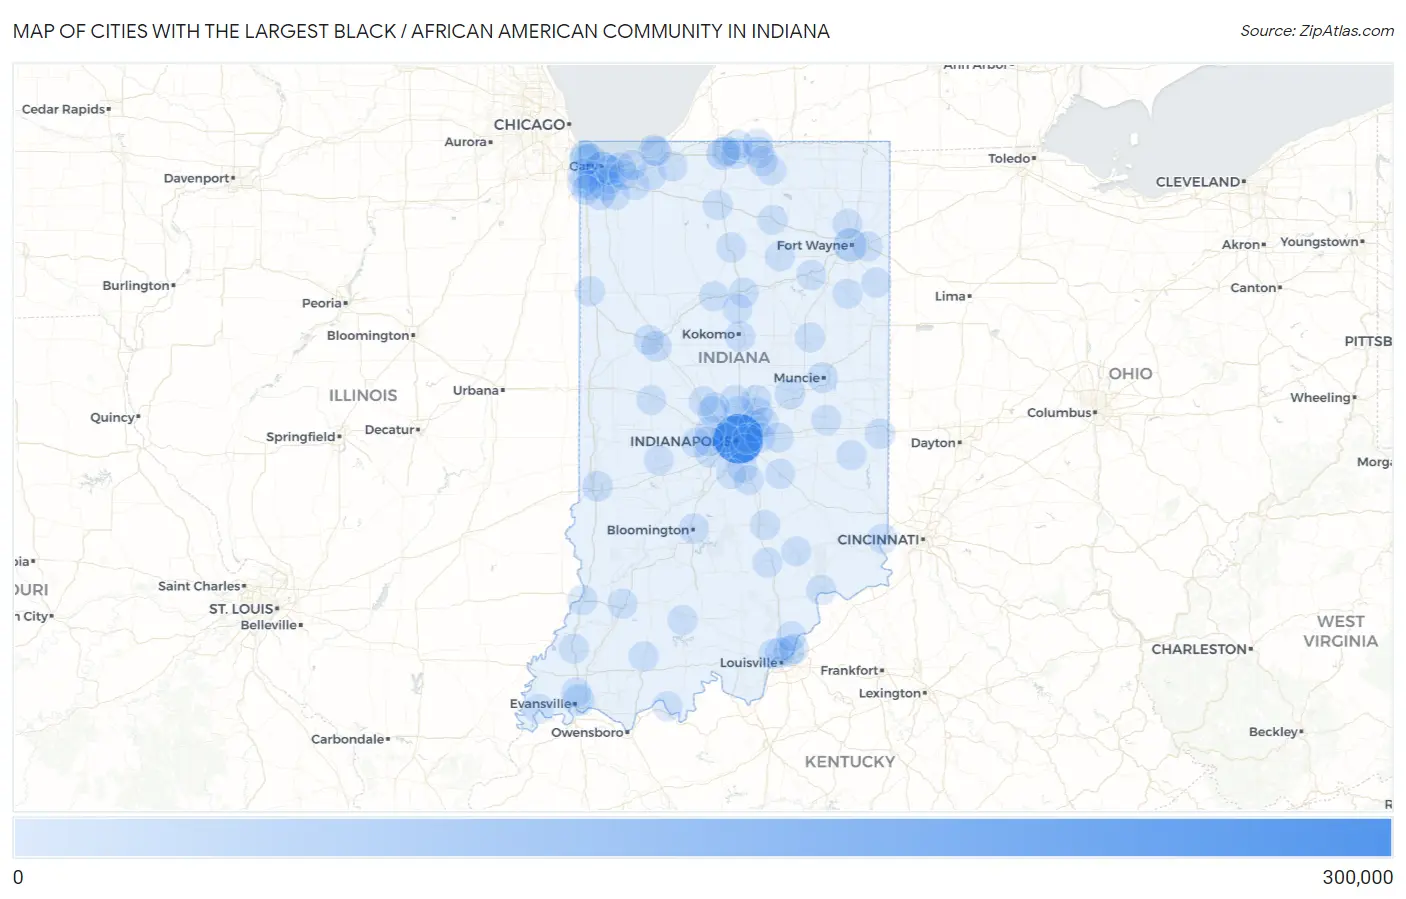
Map of Cities with the Largest Black / African American Community in Indiana
0
300,000
Cities with the Largest Black / African American Community in Indiana
| City | Black / African American | vs State | vs National | |
| 1. | Indianapolis | 254,390 | 640,752(39.70%)#1 | 41,288,572(0.62%)#14 |
| 2. | Gary | 53,623 | 640,752(8.37%)#2 | 41,288,572(0.13%)#85 |
| 3. | Fort Wayne | 40,285 | 640,752(6.29%)#3 | 41,288,572(0.10%)#110 |
| 4. | South Bend | 26,141 | 640,752(4.08%)#4 | 41,288,572(0.06%)#185 |
| 5. | Hammond | 17,325 | 640,752(2.70%)#5 | 41,288,572(0.04%)#301 |
| 6. | Merrillville | 16,751 | 640,752(2.61%)#6 | 41,288,572(0.04%)#315 |
| 7. | Evansville | 15,947 | 640,752(2.49%)#7 | 41,288,572(0.04%)#330 |
| 8. | Lawrence | 13,409 | 640,752(2.09%)#8 | 41,288,572(0.03%)#391 |
| 9. | East Chicago | 10,136 | 640,752(1.58%)#9 | 41,288,572(0.02%)#551 |
| 10. | Michigan City | 8,797 | 640,752(1.37%)#10 | 41,288,572(0.02%)#639 |
| 11. | Anderson | 8,540 | 640,752(1.33%)#11 | 41,288,572(0.02%)#654 |
| 12. | Lafayette | 6,634 | 640,752(1.04%)#12 | 41,288,572(0.02%)#823 |
| 13. | Muncie | 6,617 | 640,752(1.03%)#13 | 41,288,572(0.02%)#826 |
| 14. | Elkhart | 6,600 | 640,752(1.03%)#14 | 41,288,572(0.02%)#830 |
| 15. | Terre Haute | 6,426 | 640,752(1.00%)#15 | 41,288,572(0.02%)#848 |
| 16. | Kokomo | 6,239 | 640,752(0.97%)#16 | 41,288,572(0.02%)#873 |
| 17. | Jeffersonville | 6,183 | 640,752(0.96%)#17 | 41,288,572(0.01%)#880 |
| 18. | Fishers | 5,057 | 640,752(0.79%)#18 | 41,288,572(0.01%)#1,047 |
| 19. | Mishawaka | 4,373 | 640,752(0.68%)#19 | 41,288,572(0.01%)#1,177 |
| 20. | Speedway | 4,037 | 640,752(0.63%)#20 | 41,288,572(0.01%)#1,274 |
| 21. | Bloomington | 3,755 | 640,752(0.59%)#21 | 41,288,572(0.01%)#1,355 |
| 22. | Noblesville | 3,751 | 640,752(0.59%)#22 | 41,288,572(0.01%)#1,356 |
| 23. | Portage | 3,598 | 640,752(0.56%)#23 | 41,288,572(0.01%)#1,398 |
| 24. | Carmel | 3,510 | 640,752(0.55%)#24 | 41,288,572(0.01%)#1,420 |
| 25. | Hobart | 3,334 | 640,752(0.52%)#25 | 41,288,572(0.01%)#1,485 |
| 26. | Plainfield | 3,307 | 640,752(0.52%)#26 | 41,288,572(0.01%)#1,502 |
| 27. | New Albany | 3,222 | 640,752(0.50%)#27 | 41,288,572(0.01%)#1,534 |
| 28. | Avon | 2,873 | 640,752(0.45%)#28 | 41,288,572(0.01%)#1,674 |
| 29. | Crown Point | 2,687 | 640,752(0.42%)#29 | 41,288,572(0.01%)#1,749 |
| 30. | Griffith | 2,672 | 640,752(0.42%)#30 | 41,288,572(0.01%)#1,757 |
| 31. | Greenwood | 2,569 | 640,752(0.40%)#31 | 41,288,572(0.01%)#1,818 |
| 32. | Brownsburg | 2,557 | 640,752(0.40%)#32 | 41,288,572(0.01%)#1,822 |
| 33. | Richmond | 2,527 | 640,752(0.39%)#33 | 41,288,572(0.01%)#1,845 |
| 34. | Schererville | 2,316 | 640,752(0.36%)#34 | 41,288,572(0.01%)#1,980 |
| 35. | West Lafayette | 1,716 | 640,752(0.27%)#35 | 41,288,572(0.00%)#2,451 |
| 36. | Valparaiso | 1,655 | 640,752(0.26%)#36 | 41,288,572(0.00%)#2,490 |
| 37. | Westfield | 1,539 | 640,752(0.24%)#37 | 41,288,572(0.00%)#2,624 |
| 38. | Clarksville | 1,496 | 640,752(0.23%)#38 | 41,288,572(0.00%)#2,684 |
| 39. | Munster | 1,437 | 640,752(0.22%)#39 | 41,288,572(0.00%)#2,756 |
| 40. | Westville | 1,347 | 640,752(0.21%)#40 | 41,288,572(0.00%)#2,860 |
| 41. | Goshen | 1,128 | 640,752(0.18%)#41 | 41,288,572(0.00%)#3,183 |
| 42. | Columbus | 1,079 | 640,752(0.17%)#42 | 41,288,572(0.00%)#3,265 |
| 43. | Beech Grove | 1,054 | 640,752(0.16%)#43 | 41,288,572(0.00%)#3,326 |
| 44. | Granger | 1,032 | 640,752(0.16%)#44 | 41,288,572(0.00%)#3,367 |
| 45. | Franklin | 1,006 | 640,752(0.16%)#45 | 41,288,572(0.00%)#3,415 |
| 46. | Mccordsville | 869 | 640,752(0.14%)#46 | 41,288,572(0.00%)#3,711 |
| 47. | Zionsville | 796 | 640,752(0.12%)#47 | 41,288,572(0.00%)#3,895 |
| 48. | New Castle | 795 | 640,752(0.12%)#48 | 41,288,572(0.00%)#3,898 |
| 49. | Vincennes | 790 | 640,752(0.12%)#49 | 41,288,572(0.00%)#3,914 |
| 50. | Lakes Of The Four Seasons | 785 | 640,752(0.12%)#50 | 41,288,572(0.00%)#3,929 |
| 51. | Dyer | 778 | 640,752(0.12%)#51 | 41,288,572(0.00%)#3,949 |
| 52. | Cumberland | 718 | 640,752(0.11%)#52 | 41,288,572(0.00%)#4,098 |
| 53. | Putnamville | 712 | 640,752(0.11%)#53 | 41,288,572(0.00%)#4,112 |
| 54. | La Porte | 700 | 640,752(0.11%)#54 | 41,288,572(0.00%)#4,151 |
| 55. | New Haven | 650 | 640,752(0.10%)#55 | 41,288,572(0.00%)#4,308 |
| 56. | St John | 580 | 640,752(0.09%)#56 | 41,288,572(0.00%)#4,580 |
| 57. | Madison | 542 | 640,752(0.08%)#57 | 41,288,572(0.00%)#4,729 |
| 58. | Shelbyville | 537 | 640,752(0.08%)#58 | 41,288,572(0.00%)#4,756 |
| 59. | Whitestown | 497 | 640,752(0.08%)#59 | 41,288,572(0.00%)#4,925 |
| 60. | Peru | 491 | 640,752(0.08%)#60 | 41,288,572(0.00%)#4,956 |
| 61. | Lake Station | 477 | 640,752(0.07%)#61 | 41,288,572(0.00%)#5,019 |
| 62. | Washington | 466 | 640,752(0.07%)#62 | 41,288,572(0.00%)#5,085 |
| 63. | Seymour | 450 | 640,752(0.07%)#63 | 41,288,572(0.00%)#5,149 |
| 64. | Princeton | 431 | 640,752(0.07%)#64 | 41,288,572(0.00%)#5,255 |
| 65. | Simonton Lake | 422 | 640,752(0.07%)#65 | 41,288,572(0.00%)#5,314 |
| 66. | Warsaw | 405 | 640,752(0.06%)#66 | 41,288,572(0.00%)#5,392 |
| 67. | Huntingburg | 399 | 640,752(0.06%)#67 | 41,288,572(0.00%)#5,435 |
| 68. | Warren Park | 354 | 640,752(0.06%)#68 | 41,288,572(0.00%)#5,734 |
| 69. | Logansport | 353 | 640,752(0.06%)#69 | 41,288,572(0.00%)#5,736 |
| 70. | Greenfield | 350 | 640,752(0.05%)#70 | 41,288,572(0.00%)#5,752 |
| 71. | Danville | 346 | 640,752(0.05%)#71 | 41,288,572(0.00%)#5,778 |
| 72. | Charlestown | 325 | 640,752(0.05%)#72 | 41,288,572(0.00%)#5,949 |
| 73. | South Haven | 307 | 640,752(0.05%)#73 | 41,288,572(0.00%)#6,084 |
| 74. | Bluffton | 278 | 640,752(0.04%)#74 | 41,288,572(0.00%)#6,327 |
| 75. | Greencastle | 256 | 640,752(0.04%)#75 | 41,288,572(0.00%)#6,516 |
| 76. | Huntertown | 255 | 640,752(0.04%)#76 | 41,288,572(0.00%)#6,525 |
| 77. | Tell City | 250 | 640,752(0.04%)#77 | 41,288,572(0.00%)#6,577 |
| 78. | Notre Dame | 247 | 640,752(0.04%)#78 | 41,288,572(0.00%)#6,608 |
| 79. | Crawfordsville | 244 | 640,752(0.04%)#79 | 41,288,572(0.00%)#6,640 |
| 80. | Chesterton | 232 | 640,752(0.04%)#80 | 41,288,572(0.00%)#6,749 |
| 81. | Bargersville | 230 | 640,752(0.04%)#81 | 41,288,572(0.00%)#6,769 |
| 82. | Dunlap | 219 | 640,752(0.03%)#82 | 41,288,572(0.00%)#6,889 |
| 83. | Lebanon | 217 | 640,752(0.03%)#83 | 41,288,572(0.00%)#6,913 |
| 84. | Plymouth | 215 | 640,752(0.03%)#84 | 41,288,572(0.00%)#6,939 |
| 85. | Whiting | 214 | 640,752(0.03%)#85 | 41,288,572(0.00%)#6,950 |
| 86. | Huntington | 212 | 640,752(0.03%)#86 | 41,288,572(0.00%)#6,978 |
| 87. | French Lick | 206 | 640,752(0.03%)#87 | 41,288,572(0.00%)#7,070 |
| 88. | North Manchester | 204 | 640,752(0.03%)#88 | 41,288,572(0.00%)#7,091 |
| 89. | Connersville | 203 | 640,752(0.03%)#89 | 41,288,572(0.00%)#7,101 |
| 90. | North Vernon | 190 | 640,752(0.03%)#90 | 41,288,572(0.00%)#7,266 |
| 91. | Trail Creek | 183 | 640,752(0.03%)#91 | 41,288,572(0.00%)#7,384 |
| 92. | Mount Vernon | 175 | 640,752(0.03%)#92 | 41,288,572(0.00%)#7,490 |
| 93. | Utica | 171 | 640,752(0.03%)#93 | 41,288,572(0.00%)#7,572 |
| 94. | Lawrenceburg | 164 | 640,752(0.03%)#94 | 41,288,572(0.00%)#7,696 |
| 95. | Kentland | 157 | 640,752(0.02%)#95 | 41,288,572(0.00%)#7,822 |
| 96. | Upland | 156 | 640,752(0.02%)#96 | 41,288,572(0.00%)#7,838 |
| 97. | Grissom Afb | 143 | 640,752(0.02%)#97 | 41,288,572(0.00%)#8,068 |
| 98. | Decatur | 132 | 640,752(0.02%)#98 | 41,288,572(0.00%)#8,279 |
| 99. | Rochester | 131 | 640,752(0.02%)#99 | 41,288,572(0.00%)#8,313 |
| 100. | Highland | 128 | 640,752(0.02%)#100 | 41,288,572(0.00%)#8,388 |
Common Questions
What are the Top 10 Cities with the Largest Black / African American Community in Indiana?
Top 10 Cities with the Largest Black / African American Community in Indiana are:
#1
254,390
#2
53,623
#3
40,285
#4
26,141
#5
17,325
#6
16,751
#7
15,947
#8
13,409
#9
10,136
#10
8,797
What city has the Largest Black / African American Community in Indiana?
Indianapolis has the Largest Black / African American Community in Indiana with 254,390.
What is the Total Black / African American Population in the State of Indiana?
Total Black / African American Population in Indiana is 640,752.
What is the Total Black / African American Population in the United States?
Total Black / African American Population in the United States is 41,288,572.