Chula Vista, CA Map & Demographics
Chula Vista Map
Chula Vista Overview
$37,618
PER CAPITA INCOME
$112,818
AVG FAMILY INCOME
$101,984
AVG HOUSEHOLD INCOME
29.1%
WAGE / INCOME GAP [ % ]
70.9¢/ $1
WAGE / INCOME GAP [ $ ]
$11,329
FAMILY INCOME DEFICIT
0.41
INEQUALITY / GINI INDEX
276,103
TOTAL POPULATION
137,744
MALE POPULATION
138,359
FEMALE POPULATION
99.56
MALES / 100 FEMALES
100.45
FEMALES / 100 MALES
36.1
MEDIAN AGE
3.7
AVG FAMILY SIZE
3.3
AVG HOUSEHOLD SIZE
144,663
LABOR FORCE [ PEOPLE ]
66.9%
PERCENT IN LABOR FORCE
8.8%
UNEMPLOYMENT RATE
Chula Vista Area Codes
Income in Chula Vista
Income Overview in Chula Vista
Per Capita Income in Chula Vista is $37,618, while median incomes of families and households are $112,818 and $101,984 respectively.
| Characteristic | Number | Measure |
| Per Capita Income | 276,103 | $37,618 |
| Median Family Income | 66,048 | $112,818 |
| Mean Family Income | 66,048 | $128,828 |
| Median Household Income | 83,074 | $101,984 |
| Mean Household Income | 83,074 | $120,845 |
| Income Deficit | 66,048 | $11,329 |
| Wage / Income Gap (%) | 276,103 | 29.08% |
| Wage / Income Gap ($) | 276,103 | 70.92¢ per $1 |
| Gini / Inequality Index | 276,103 | 0.41 |
Earnings by Sex in Chula Vista
Average Earnings in Chula Vista are $45,542, $52,112 for men and $36,957 for women, a difference of 29.1%.
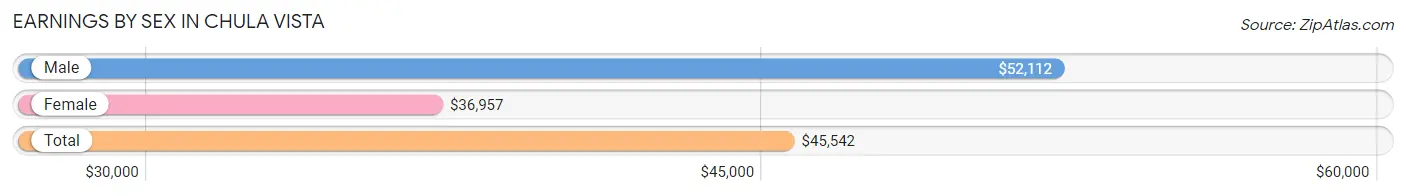
| Sex | Number | Average Earnings |
| Male | 77,465 (54.8%) | $52,112 |
| Female | 63,987 (45.2%) | $36,957 |
| Total | 141,452 (100.0%) | $45,542 |
Earnings by Sex by Income Bracket in Chula Vista
The most common earnings brackets in Chula Vista are $100,000+ for men (15,285 | 19.7%) and $100,000+ for women (8,648 | 13.5%).
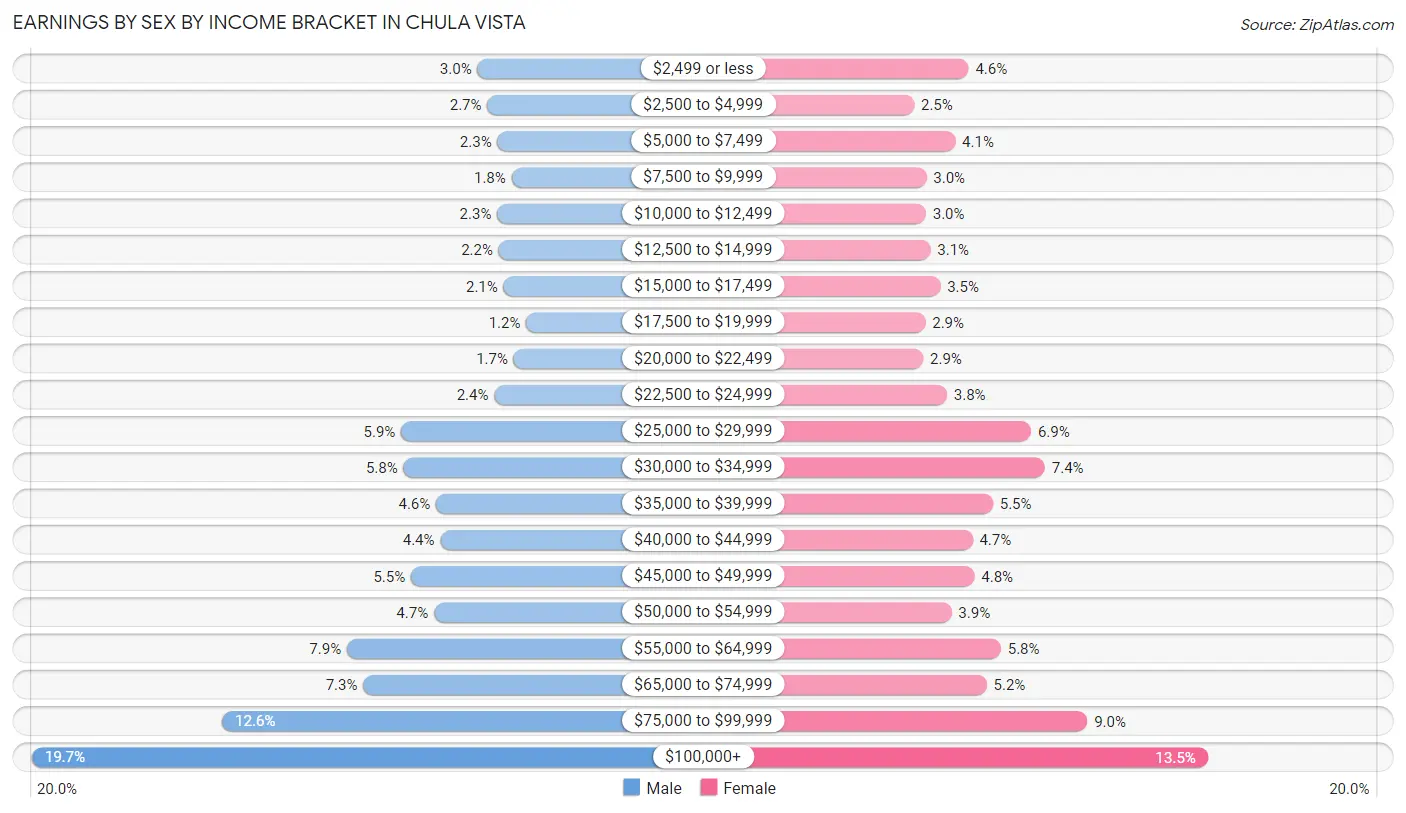
| Income | Male | Female |
| $2,499 or less | 2,345 (3.0%) | 2,920 (4.6%) |
| $2,500 to $4,999 | 2,061 (2.7%) | 1,615 (2.5%) |
| $5,000 to $7,499 | 1,770 (2.3%) | 2,596 (4.1%) |
| $7,500 to $9,999 | 1,354 (1.8%) | 1,904 (3.0%) |
| $10,000 to $12,499 | 1,774 (2.3%) | 1,896 (3.0%) |
| $12,500 to $14,999 | 1,729 (2.2%) | 2,003 (3.1%) |
| $15,000 to $17,499 | 1,590 (2.1%) | 2,241 (3.5%) |
| $17,500 to $19,999 | 928 (1.2%) | 1,880 (2.9%) |
| $20,000 to $22,499 | 1,291 (1.7%) | 1,828 (2.9%) |
| $22,500 to $24,999 | 1,862 (2.4%) | 2,398 (3.7%) |
| $25,000 to $29,999 | 4,566 (5.9%) | 4,414 (6.9%) |
| $30,000 to $34,999 | 4,492 (5.8%) | 4,747 (7.4%) |
| $35,000 to $39,999 | 3,548 (4.6%) | 3,503 (5.5%) |
| $40,000 to $44,999 | 3,424 (4.4%) | 3,015 (4.7%) |
| $45,000 to $49,999 | 4,274 (5.5%) | 3,057 (4.8%) |
| $50,000 to $54,999 | 3,613 (4.7%) | 2,509 (3.9%) |
| $55,000 to $64,999 | 6,139 (7.9%) | 3,693 (5.8%) |
| $65,000 to $74,999 | 5,661 (7.3%) | 3,354 (5.2%) |
| $75,000 to $99,999 | 9,759 (12.6%) | 5,766 (9.0%) |
| $100,000+ | 15,285 (19.7%) | 8,648 (13.5%) |
| Total | 77,465 (100.0%) | 63,987 (100.0%) |
Earnings by Sex by Educational Attainment in Chula Vista
Average earnings in Chula Vista are $57,449 for men and $41,768 for women, a difference of 27.3%. Men with an educational attainment of graduate degree enjoy the highest average annual earnings of $99,156, while those with less than high school education earn the least with $40,146. Women with an educational attainment of graduate degree earn the most with the average annual earnings of $83,734, while those with less than high school education have the smallest earnings of $24,722.
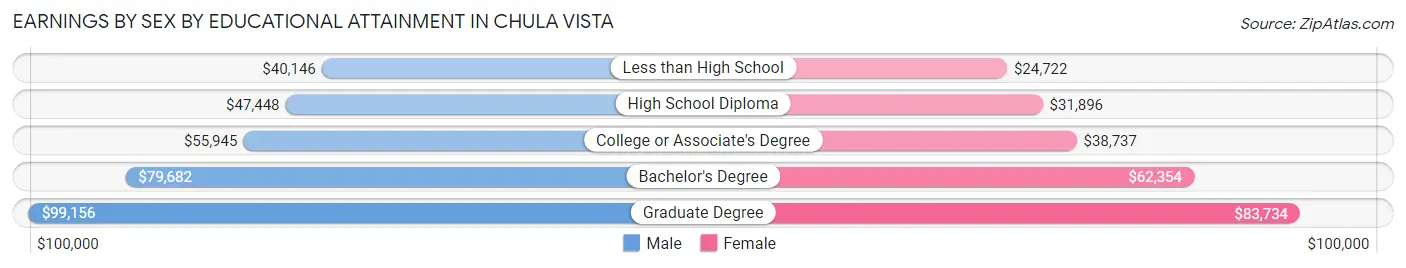
| Educational Attainment | Male Income | Female Income |
| Less than High School | $40,146 | $24,722 |
| High School Diploma | $47,448 | $31,896 |
| College or Associate's Degree | $55,945 | $38,737 |
| Bachelor's Degree | $79,682 | $62,354 |
| Graduate Degree | $99,156 | $83,734 |
| Total | $57,449 | $41,768 |
Family Income in Chula Vista
Family Income Brackets in Chula Vista
According to the Chula Vista family income data, there are 15,653 families falling into the $100,000 to $149,999 income range, which is the most common income bracket and makes up 23.7% of all families. Conversely, the $10,000 to $14,999 income bracket is the least frequent group with only 925 families (1.4%) belonging to this category.
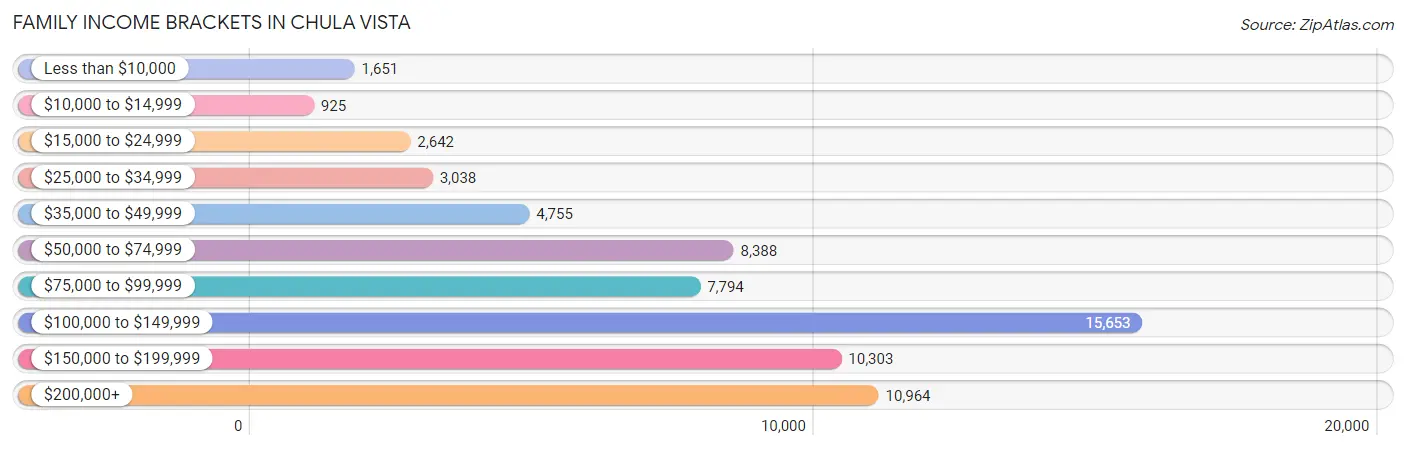
| Income Bracket | # Families | % Families |
| Less than $10,000 | 1,651 | 2.5% |
| $10,000 to $14,999 | 925 | 1.4% |
| $15,000 to $24,999 | 2,642 | 4.0% |
| $25,000 to $34,999 | 3,038 | 4.6% |
| $35,000 to $49,999 | 4,755 | 7.2% |
| $50,000 to $74,999 | 8,388 | 12.7% |
| $75,000 to $99,999 | 7,794 | 11.8% |
| $100,000 to $149,999 | 15,653 | 23.7% |
| $150,000 to $199,999 | 10,303 | 15.6% |
| $200,000+ | 10,964 | 16.6% |
Family Income by Famaliy Size in Chula Vista
7+ person families (2,436 | 3.7%) account for the highest median family income in Chula Vista with $158,114 per family, while 2-person families (20,151 | 30.5%) have the highest median income of $42,157 per family member.
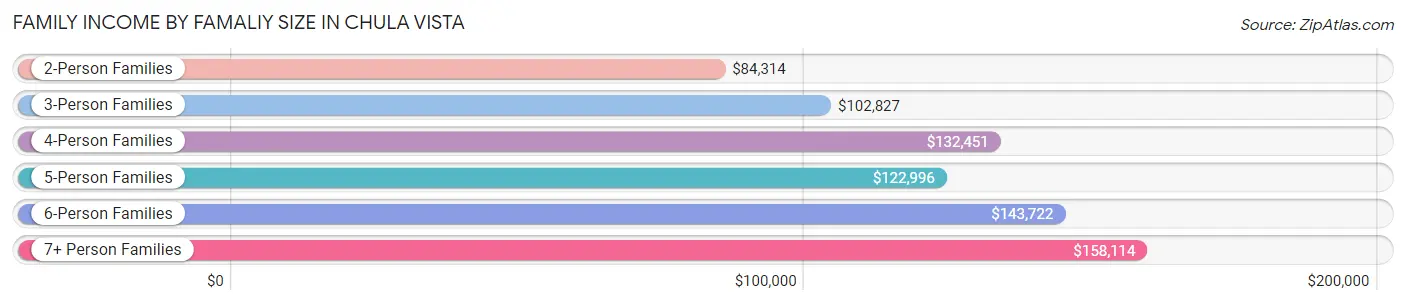
| Income Bracket | # Families | Median Income |
| 2-Person Families | 20,151 (30.5%) | $84,314 |
| 3-Person Families | 15,958 (24.2%) | $102,827 |
| 4-Person Families | 15,577 (23.6%) | $132,451 |
| 5-Person Families | 9,123 (13.8%) | $122,996 |
| 6-Person Families | 2,803 (4.2%) | $143,722 |
| 7+ Person Families | 2,436 (3.7%) | $158,114 |
| Total | 66,048 (100.0%) | $112,818 |
Family Income by Number of Earners in Chula Vista
The median family income in Chula Vista is $112,818, with families comprising 3+ earners (12,091) having the highest median family income of $162,685, while families with no earners (6,508) have the lowest median family income of $37,725, accounting for 18.3% and 9.9% of families, respectively.
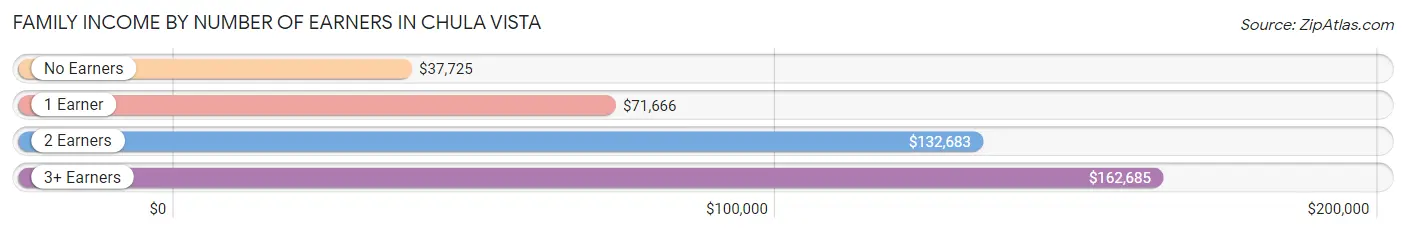
| Number of Earners | # Families | Median Income |
| No Earners | 6,508 (9.9%) | $37,725 |
| 1 Earner | 19,935 (30.2%) | $71,666 |
| 2 Earners | 27,514 (41.7%) | $132,683 |
| 3+ Earners | 12,091 (18.3%) | $162,685 |
| Total | 66,048 (100.0%) | $112,818 |
Household Income in Chula Vista
Household Income Brackets in Chula Vista
With 18,775 households falling in the category, the $100,000 to $149,999 income range is the most frequent in Chula Vista, accounting for 22.6% of all households. In contrast, only 2,409 households (2.9%) fall into the $10,000 to $14,999 income bracket, making it the least populous group.
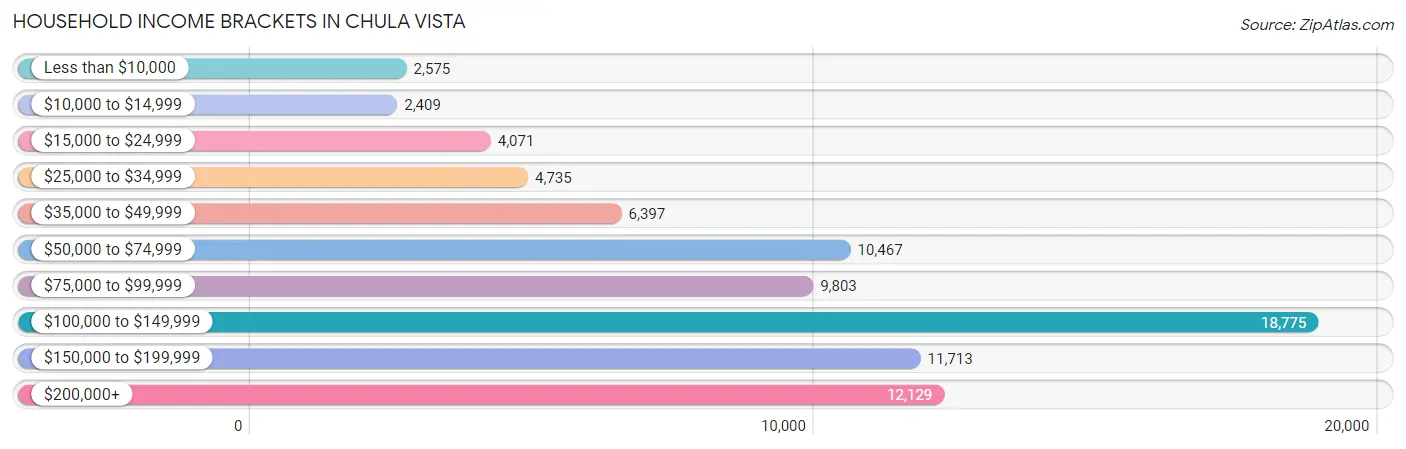
| Income Bracket | # Households | % Households |
| Less than $10,000 | 2,575 | 3.1% |
| $10,000 to $14,999 | 2,409 | 2.9% |
| $15,000 to $24,999 | 4,071 | 4.9% |
| $25,000 to $34,999 | 4,735 | 5.7% |
| $35,000 to $49,999 | 6,397 | 7.7% |
| $50,000 to $74,999 | 10,467 | 12.6% |
| $75,000 to $99,999 | 9,803 | 11.8% |
| $100,000 to $149,999 | 18,775 | 22.6% |
| $150,000 to $199,999 | 11,713 | 14.1% |
| $200,000+ | 12,129 | 14.6% |
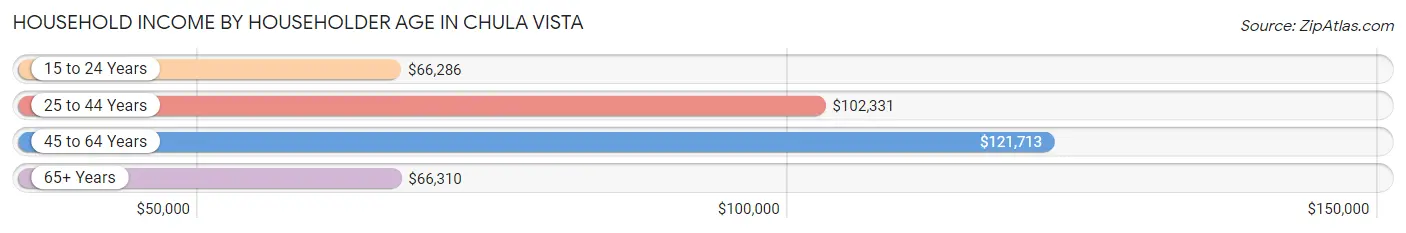
Household Income by Householder Age in Chula Vista
The median household income in Chula Vista is $101,984, with the highest median household income of $121,713 found in the 45 to 64 years age bracket for the primary householder. A total of 35,275 households (42.5%) fall into this category. Meanwhile, the 15 to 24 years age bracket for the primary householder has the lowest median household income of $66,286, with 1,676 households (2.0%) in this group.
| Income Bracket | # Households | Median Income |
| 15 to 24 Years | 1,676 (2.0%) | $66,286 |
| 25 to 44 Years | 29,348 (35.3%) | $102,331 |
| 45 to 64 Years | 35,275 (42.5%) | $121,713 |
| 65+ Years | 16,775 (20.2%) | $66,310 |
| Total | 83,074 (100.0%) | $101,984 |
Poverty in Chula Vista
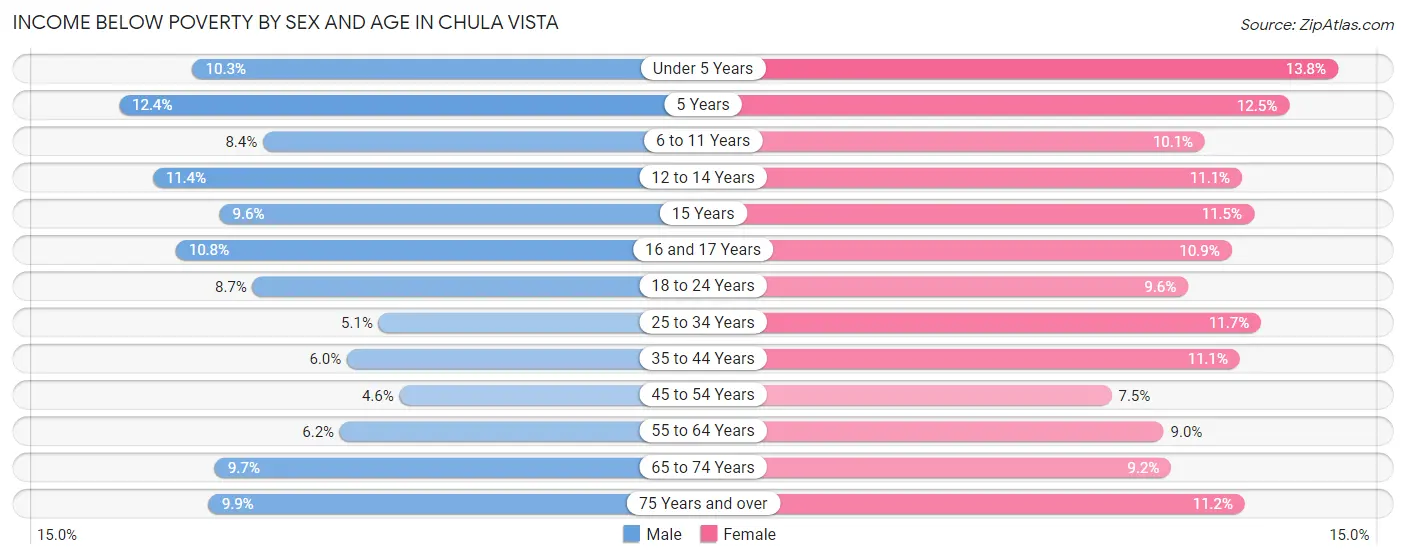
Income Below Poverty by Sex and Age in Chula Vista
With 7.3% poverty level for males and 10.2% for females among the residents of Chula Vista, 5 year old males and under 5 year old females are the most vulnerable to poverty, with 234 males (12.4%) and 991 females (13.8%) in their respective age groups living below the poverty level.
| Age Bracket | Male | Female |
| Under 5 Years | 844 (10.3%) | 991 (13.8%) |
| 5 Years | 234 (12.4%) | 195 (12.4%) |
| 6 to 11 Years | 929 (8.4%) | 1,248 (10.1%) |
| 12 to 14 Years | 691 (11.4%) | 679 (11.1%) |
| 15 Years | 208 (9.6%) | 240 (11.5%) |
| 16 and 17 Years | 467 (10.8%) | 439 (10.8%) |
| 18 to 24 Years | 1,134 (8.6%) | 1,170 (9.6%) |
| 25 to 34 Years | 1,083 (5.1%) | 2,159 (11.7%) |
| 35 to 44 Years | 1,230 (6.0%) | 2,159 (11.1%) |
| 45 to 54 Years | 843 (4.6%) | 1,423 (7.5%) |
| 55 to 64 Years | 973 (6.2%) | 1,410 (9.0%) |
| 65 to 74 Years | 874 (9.7%) | 970 (9.2%) |
| 75 Years and over | 529 (9.9%) | 946 (11.2%) |
| Total | 10,039 (7.3%) | 14,029 (10.2%) |
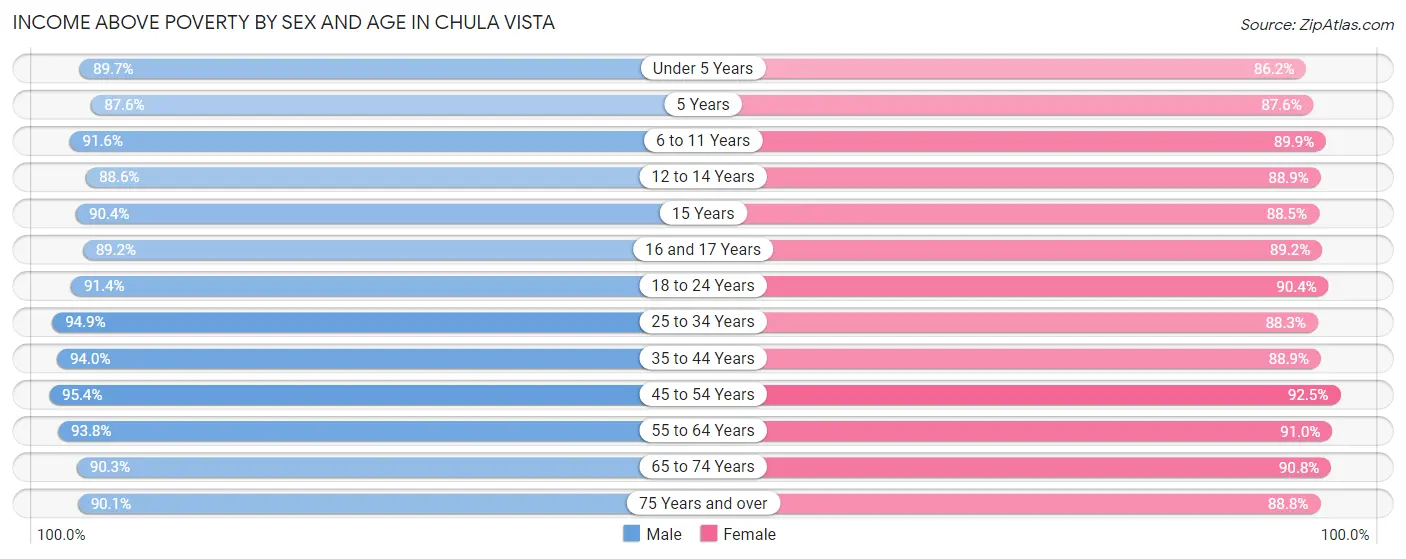
Income Above Poverty by Sex and Age in Chula Vista
According to the poverty statistics in Chula Vista, males aged 45 to 54 years and females aged 45 to 54 years are the age groups that are most secure financially, with 95.4% of males and 92.5% of females in these age groups living above the poverty line.
| Age Bracket | Male | Female |
| Under 5 Years | 7,335 (89.7%) | 6,187 (86.2%) |
| 5 Years | 1,658 (87.6%) | 1,371 (87.5%) |
| 6 to 11 Years | 10,188 (91.6%) | 11,102 (89.9%) |
| 12 to 14 Years | 5,352 (88.6%) | 5,418 (88.9%) |
| 15 Years | 1,966 (90.4%) | 1,853 (88.5%) |
| 16 and 17 Years | 3,863 (89.2%) | 3,607 (89.1%) |
| 18 to 24 Years | 11,977 (91.3%) | 10,968 (90.4%) |
| 25 to 34 Years | 20,002 (94.9%) | 16,341 (88.3%) |
| 35 to 44 Years | 19,188 (94.0%) | 17,333 (88.9%) |
| 45 to 54 Years | 17,637 (95.4%) | 17,529 (92.5%) |
| 55 to 64 Years | 14,667 (93.8%) | 14,331 (91.0%) |
| 65 to 74 Years | 8,133 (90.3%) | 9,607 (90.8%) |
| 75 Years and over | 4,832 (90.1%) | 7,487 (88.8%) |
| Total | 126,798 (92.7%) | 123,134 (89.8%) |
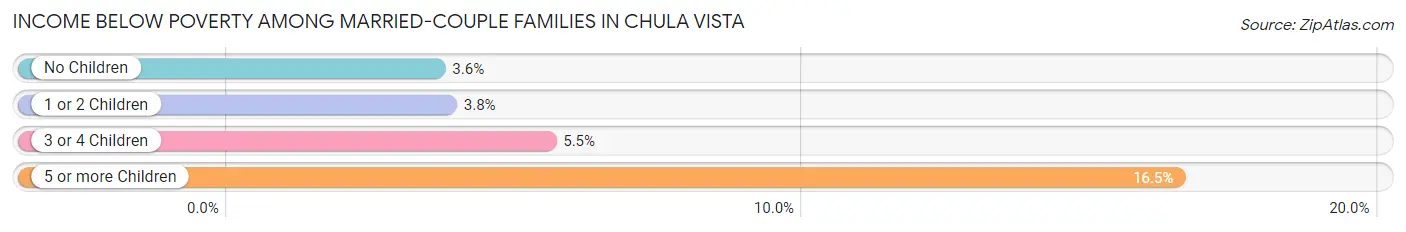
Income Below Poverty Among Married-Couple Families in Chula Vista
The poverty statistics for married-couple families in Chula Vista show that 3.9% or 1,895 of the total 48,048 families live below the poverty line. Families with 5 or more children have the highest poverty rate of 16.5%, comprising of 46 families. On the other hand, families with no children have the lowest poverty rate of 3.6%, which includes 822 families.
| Children | Above Poverty | Below Poverty |
| No Children | 21,924 (96.4%) | 822 (3.6%) |
| 1 or 2 Children | 20,025 (96.2%) | 794 (3.8%) |
| 3 or 4 Children | 3,971 (94.5%) | 233 (5.5%) |
| 5 or more Children | 233 (83.5%) | 46 (16.5%) |
| Total | 46,153 (96.1%) | 1,895 (3.9%) |
Income Below Poverty Among Single-Parent Households in Chula Vista
According to the poverty data in Chula Vista, 7.4% or 391 single-father households and 18.7% or 2,383 single-mother households are living below the poverty line. Among single-father households, those with 3 or 4 children have the highest poverty rate, with 51 households (27.7%) experiencing poverty. Likewise, among single-mother households, those with 5 or more children have the highest poverty rate, with 71 households (93.4%) falling below the poverty line.
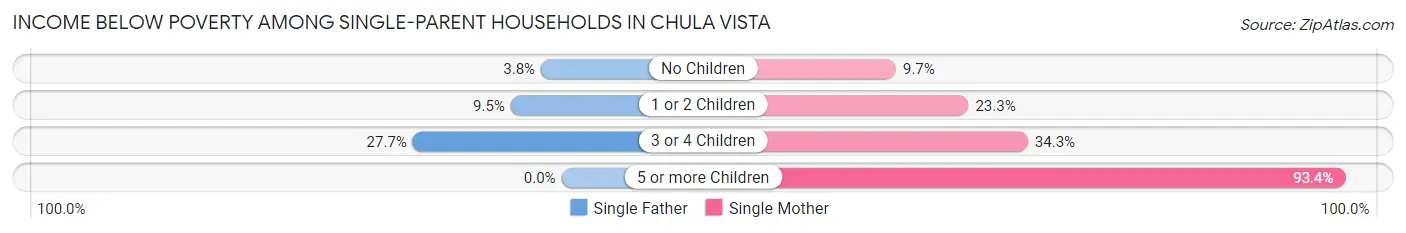
| Children | Single Father | Single Mother |
| No Children | 93 (3.8%) | 561 (9.7%) |
| 1 or 2 Children | 247 (9.5%) | 1,300 (23.3%) |
| 3 or 4 Children | 51 (27.7%) | 451 (34.3%) |
| 5 or more Children | 0 (0.0%) | 71 (93.4%) |
| Total | 391 (7.4%) | 2,383 (18.7%) |
Income Below Poverty Among Married-Couple vs Single-Parent Households in Chula Vista
The poverty data for Chula Vista shows that 1,895 of the married-couple family households (3.9%) and 2,774 of the single-parent households (15.4%) are living below the poverty level. Within the married-couple family households, those with 5 or more children have the highest poverty rate, with 46 households (16.5%) falling below the poverty line. Among the single-parent households, those with 5 or more children have the highest poverty rate, with 71 household (69.6%) living below poverty.
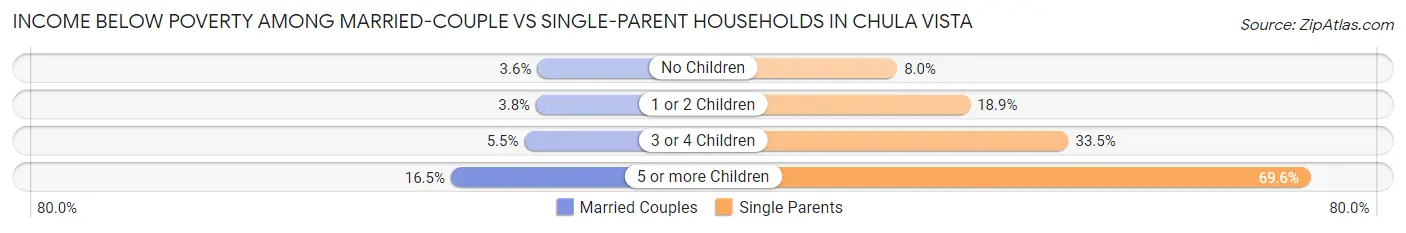
| Children | Married-Couple Families | Single-Parent Households |
| No Children | 822 (3.6%) | 654 (8.0%) |
| 1 or 2 Children | 794 (3.8%) | 1,547 (18.9%) |
| 3 or 4 Children | 233 (5.5%) | 502 (33.5%) |
| 5 or more Children | 46 (16.5%) | 71 (69.6%) |
| Total | 1,895 (3.9%) | 2,774 (15.4%) |
Race in Chula Vista
The most populous races in Chula Vista are Hispanic or Latino (166,129 | 60.2%), White / Caucasian (112,825 | 40.9%), and Two or more Races (64,044 | 23.2%).
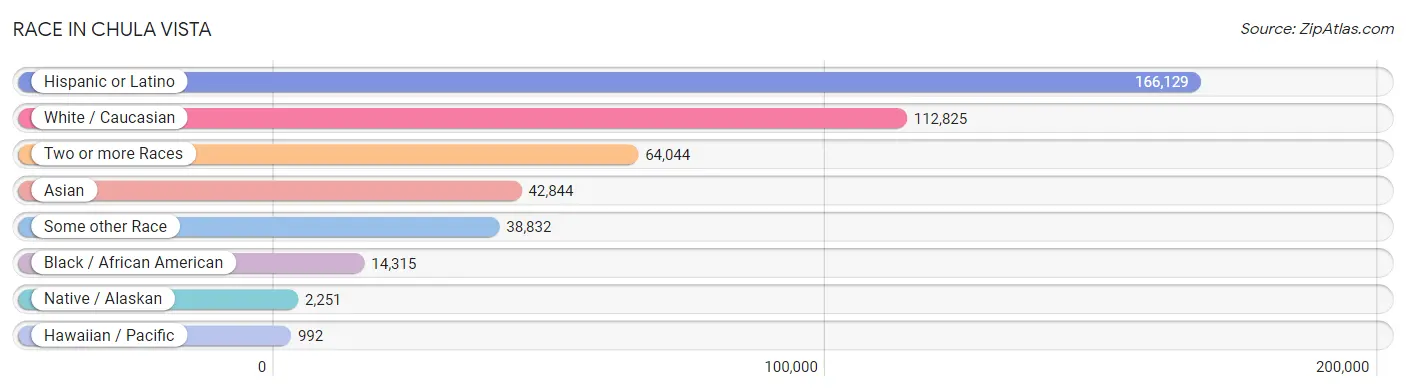
| Race | # Population | % Population |
| Asian | 42,844 | 15.5% |
| Black / African American | 14,315 | 5.2% |
| Hawaiian / Pacific | 992 | 0.4% |
| Hispanic or Latino | 166,129 | 60.2% |
| Native / Alaskan | 2,251 | 0.8% |
| White / Caucasian | 112,825 | 40.9% |
| Two or more Races | 64,044 | 23.2% |
| Some other Race | 38,832 | 14.1% |
| Total | 276,103 | 100.0% |
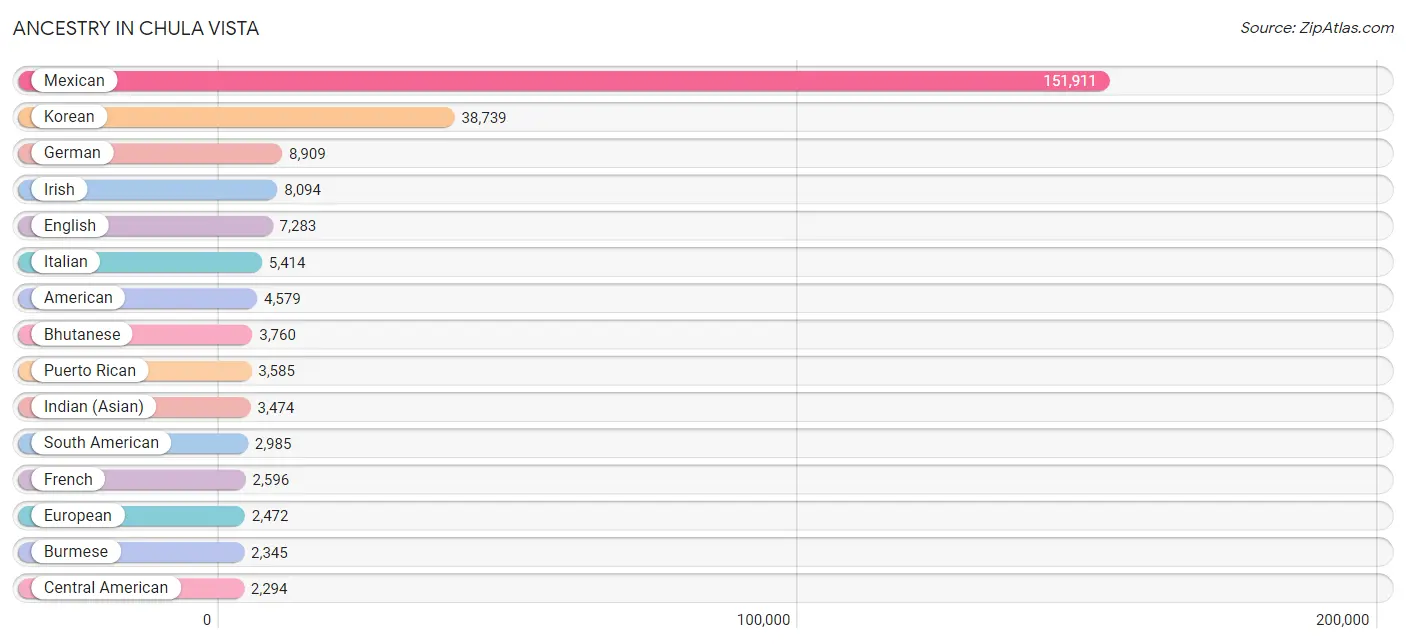
Ancestry in Chula Vista
The most populous ancestries reported in Chula Vista are Mexican (151,911 | 55.0%), Korean (38,739 | 14.0%), German (8,909 | 3.2%), Irish (8,094 | 2.9%), and English (7,283 | 2.6%), together accounting for 77.8% of all Chula Vista residents.
| Ancestry | # Population | % Population |
| Afghan | 34 | 0.0% |
| African | 1,237 | 0.4% |
| American | 4,579 | 1.7% |
| Apache | 411 | 0.2% |
| Arab | 1,051 | 0.4% |
| Arapaho | 38 | 0.0% |
| Argentinean | 458 | 0.2% |
| Armenian | 58 | 0.0% |
| Assyrian / Chaldean / Syriac | 13 | 0.0% |
| Australian | 100 | 0.0% |
| Austrian | 88 | 0.0% |
| Bangladeshi | 65 | 0.0% |
| Basque | 137 | 0.1% |
| Belgian | 33 | 0.0% |
| Belizean | 30 | 0.0% |
| Bhutanese | 3,760 | 1.4% |
| Blackfeet | 18 | 0.0% |
| Bolivian | 42 | 0.0% |
| Brazilian | 180 | 0.1% |
| British | 641 | 0.2% |
| Bulgarian | 56 | 0.0% |
| Burmese | 2,345 | 0.9% |
| Cajun | 31 | 0.0% |
| Canadian | 372 | 0.1% |
| Carpatho Rusyn | 12 | 0.0% |
| Celtic | 9 | 0.0% |
| Central American | 2,294 | 0.8% |
| Central American Indian | 416 | 0.2% |
| Cherokee | 190 | 0.1% |
| Chilean | 267 | 0.1% |
| Choctaw | 128 | 0.1% |
| Colombian | 788 | 0.3% |
| Comanche | 59 | 0.0% |
| Costa Rican | 153 | 0.1% |
| Creek | 10 | 0.0% |
| Croatian | 95 | 0.0% |
| Cuban | 528 | 0.2% |
| Czech | 68 | 0.0% |
| Czechoslovakian | 65 | 0.0% |
| Danish | 459 | 0.2% |
| Delaware | 228 | 0.1% |
| Dominican | 466 | 0.2% |
| Dutch | 903 | 0.3% |
| Eastern European | 487 | 0.2% |
| Ecuadorian | 379 | 0.1% |
| Egyptian | 196 | 0.1% |
| English | 7,283 | 2.6% |
| Ethiopian | 75 | 0.0% |
| European | 2,472 | 0.9% |
| Filipino | 171 | 0.1% |
| Finnish | 134 | 0.1% |
| French | 2,596 | 0.9% |
| French Canadian | 583 | 0.2% |
| German | 8,909 | 3.2% |
| German Russian | 11 | 0.0% |
| Ghanaian | 170 | 0.1% |
| Greek | 388 | 0.1% |
| Guamanian / Chamorro | 1,059 | 0.4% |
| Guatemalan | 753 | 0.3% |
| Haitian | 135 | 0.1% |
| Honduran | 84 | 0.0% |
| Hopi | 19 | 0.0% |
| Hungarian | 281 | 0.1% |
| Icelander | 28 | 0.0% |
| Indian (Asian) | 3,474 | 1.3% |
| Indonesian | 143 | 0.1% |
| Inupiat | 106 | 0.0% |
| Iranian | 291 | 0.1% |
| Irish | 8,094 | 2.9% |
| Israeli | 36 | 0.0% |
| Italian | 5,414 | 2.0% |
| Jamaican | 647 | 0.2% |
| Japanese | 377 | 0.1% |
| Jordanian | 63 | 0.0% |
| Kenyan | 39 | 0.0% |
| Korean | 38,739 | 14.0% |
| Laotian | 246 | 0.1% |
| Lebanese | 357 | 0.1% |
| Lithuanian | 17 | 0.0% |
| Luxembourger | 8 | 0.0% |
| Malaysian | 380 | 0.1% |
| Mexican | 151,911 | 55.0% |
| Mexican American Indian | 1,972 | 0.7% |
| Mongolian | 25 | 0.0% |
| Moroccan | 8 | 0.0% |
| Native Hawaiian | 319 | 0.1% |
| Navajo | 119 | 0.0% |
| Nicaraguan | 710 | 0.3% |
| Nigerian | 169 | 0.1% |
| Northern European | 198 | 0.1% |
| Norwegian | 986 | 0.4% |
| Okinawan | 89 | 0.0% |
| Paiute | 33 | 0.0% |
| Pakistani | 228 | 0.1% |
| Palestinian | 214 | 0.1% |
| Panamanian | 75 | 0.0% |
| Pennsylvania German | 8 | 0.0% |
| Peruvian | 691 | 0.3% |
| Pima | 1 | 0.0% |
| Polish | 2,019 | 0.7% |
| Portuguese | 811 | 0.3% |
| Potawatomi | 7 | 0.0% |
| Pueblo | 42 | 0.0% |
| Puerto Rican | 3,585 | 1.3% |
| Puget Sound Salish | 7 | 0.0% |
| Romanian | 192 | 0.1% |
| Russian | 909 | 0.3% |
| Salvadoran | 519 | 0.2% |
| Samoan | 147 | 0.1% |
| Scandinavian | 555 | 0.2% |
| Scotch-Irish | 794 | 0.3% |
| Scottish | 1,150 | 0.4% |
| Serbian | 67 | 0.0% |
| Sioux | 80 | 0.0% |
| Slavic | 44 | 0.0% |
| Slovak | 13 | 0.0% |
| Slovene | 9 | 0.0% |
| South American | 2,985 | 1.1% |
| South American Indian | 14 | 0.0% |
| Spaniard | 1,354 | 0.5% |
| Spanish | 636 | 0.2% |
| Sri Lankan | 1,779 | 0.6% |
| Subsaharan African | 1,708 | 0.6% |
| Swedish | 1,258 | 0.5% |
| Swiss | 228 | 0.1% |
| Syrian | 24 | 0.0% |
| Thai | 944 | 0.3% |
| Tohono O'Odham | 1 | 0.0% |
| Tongan | 140 | 0.1% |
| Trinidadian and Tobagonian | 7 | 0.0% |
| Turkish | 60 | 0.0% |
| U.S. Virgin Islander | 6 | 0.0% |
| Ukrainian | 290 | 0.1% |
| Uruguayan | 56 | 0.0% |
| Ute | 5 | 0.0% |
| Venezuelan | 304 | 0.1% |
| Welsh | 325 | 0.1% |
| West Indian | 11 | 0.0% |
| Yaqui | 75 | 0.0% |
| Zimbabwean | 18 | 0.0% | View All 140 Rows |
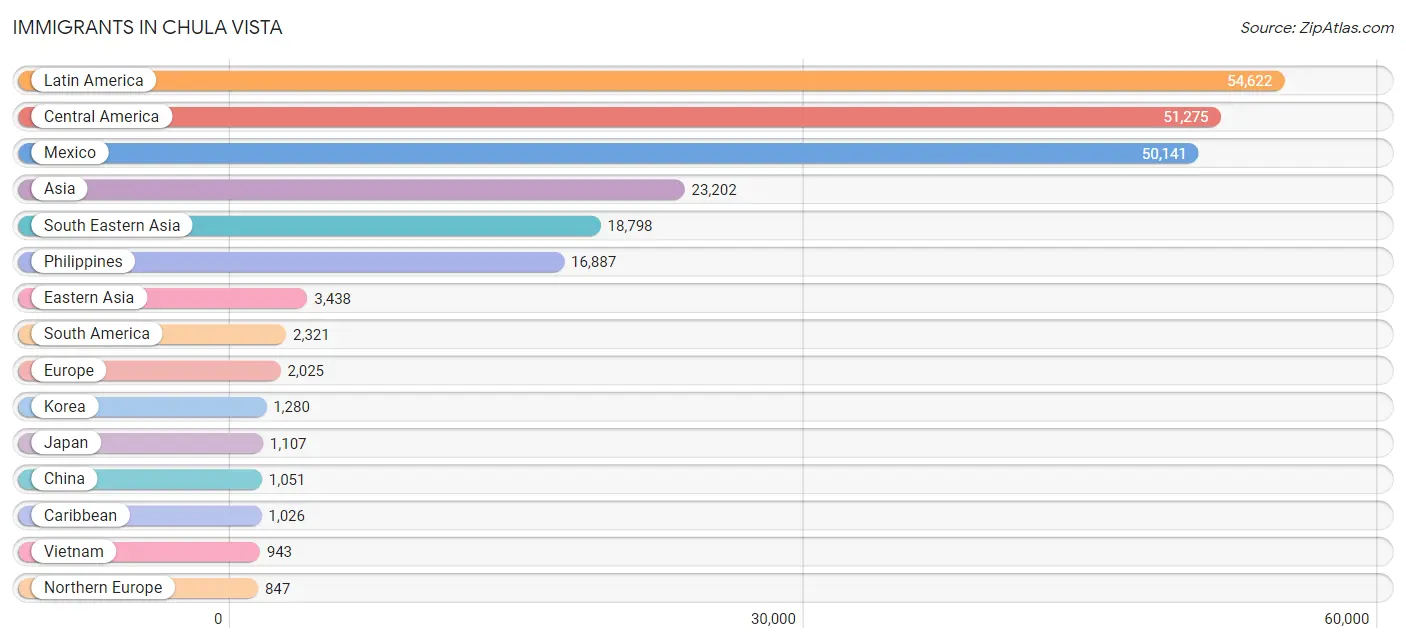
Immigrants in Chula Vista
The most numerous immigrant groups reported in Chula Vista came from Latin America (54,622 | 19.8%), Central America (51,275 | 18.6%), Mexico (50,141 | 18.2%), Asia (23,202 | 8.4%), and South Eastern Asia (18,798 | 6.8%), together accounting for 71.7% of all Chula Vista residents.
| Immigration Origin | # Population | % Population |
| Afghanistan | 58 | 0.0% |
| Africa | 469 | 0.2% |
| Argentina | 370 | 0.1% |
| Asia | 23,202 | 8.4% |
| Australia | 46 | 0.0% |
| Austria | 22 | 0.0% |
| Azores | 1 | 0.0% |
| Barbados | 6 | 0.0% |
| Belgium | 25 | 0.0% |
| Belize | 14 | 0.0% |
| Bolivia | 23 | 0.0% |
| Brazil | 215 | 0.1% |
| Cambodia | 65 | 0.0% |
| Canada | 546 | 0.2% |
| Caribbean | 1,026 | 0.4% |
| Central America | 51,275 | 18.6% |
| Chile | 244 | 0.1% |
| China | 1,051 | 0.4% |
| Colombia | 559 | 0.2% |
| Costa Rica | 90 | 0.0% |
| Cuba | 163 | 0.1% |
| Dominican Republic | 273 | 0.1% |
| Eastern Africa | 135 | 0.1% |
| Eastern Asia | 3,438 | 1.3% |
| Eastern Europe | 442 | 0.2% |
| Ecuador | 94 | 0.0% |
| Egypt | 78 | 0.0% |
| El Salvador | 365 | 0.1% |
| England | 215 | 0.1% |
| Ethiopia | 24 | 0.0% |
| Europe | 2,025 | 0.7% |
| France | 108 | 0.0% |
| Germany | 204 | 0.1% |
| Ghana | 170 | 0.1% |
| Greece | 22 | 0.0% |
| Guatemala | 392 | 0.1% |
| Guyana | 172 | 0.1% |
| Haiti | 27 | 0.0% |
| Honduras | 19 | 0.0% |
| Hong Kong | 122 | 0.0% |
| India | 265 | 0.1% |
| Indonesia | 334 | 0.1% |
| Iran | 207 | 0.1% |
| Iraq | 18 | 0.0% |
| Ireland | 8 | 0.0% |
| Italy | 103 | 0.0% |
| Jamaica | 492 | 0.2% |
| Japan | 1,107 | 0.4% |
| Jordan | 62 | 0.0% |
| Kazakhstan | 24 | 0.0% |
| Kenya | 72 | 0.0% |
| Korea | 1,280 | 0.5% |
| Laos | 62 | 0.0% |
| Latin America | 54,622 | 19.8% |
| Latvia | 37 | 0.0% |
| Lebanon | 76 | 0.0% |
| Liberia | 1 | 0.0% |
| Malaysia | 62 | 0.0% |
| Mexico | 50,141 | 18.2% |
| Morocco | 8 | 0.0% |
| Netherlands | 35 | 0.0% |
| Nicaragua | 205 | 0.1% |
| Nigeria | 77 | 0.0% |
| Northern Africa | 86 | 0.0% |
| Northern Europe | 847 | 0.3% |
| Oceania | 150 | 0.1% |
| Pakistan | 9 | 0.0% |
| Panama | 49 | 0.0% |
| Peru | 207 | 0.1% |
| Philippines | 16,887 | 6.1% |
| Poland | 72 | 0.0% |
| Portugal | 37 | 0.0% |
| Russia | 264 | 0.1% |
| Saudi Arabia | 56 | 0.0% |
| Scotland | 64 | 0.0% |
| Singapore | 81 | 0.0% |
| South America | 2,321 | 0.8% |
| South Central Asia | 654 | 0.2% |
| South Eastern Asia | 18,798 | 6.8% |
| Southern Europe | 342 | 0.1% |
| Spain | 180 | 0.1% |
| Sri Lanka | 91 | 0.0% |
| St. Vincent and the Grenadines | 24 | 0.0% |
| Sweden | 216 | 0.1% |
| Syria | 19 | 0.0% |
| Taiwan | 252 | 0.1% |
| Thailand | 216 | 0.1% |
| Trinidad and Tobago | 20 | 0.0% |
| Turkey | 23 | 0.0% |
| Uganda | 21 | 0.0% |
| Ukraine | 33 | 0.0% |
| Uruguay | 56 | 0.0% |
| Venezuela | 255 | 0.1% |
| Vietnam | 943 | 0.3% |
| Western Africa | 248 | 0.1% |
| Western Asia | 270 | 0.1% |
| Western Europe | 394 | 0.1% |
| Zimbabwe | 18 | 0.0% | View All 98 Rows |
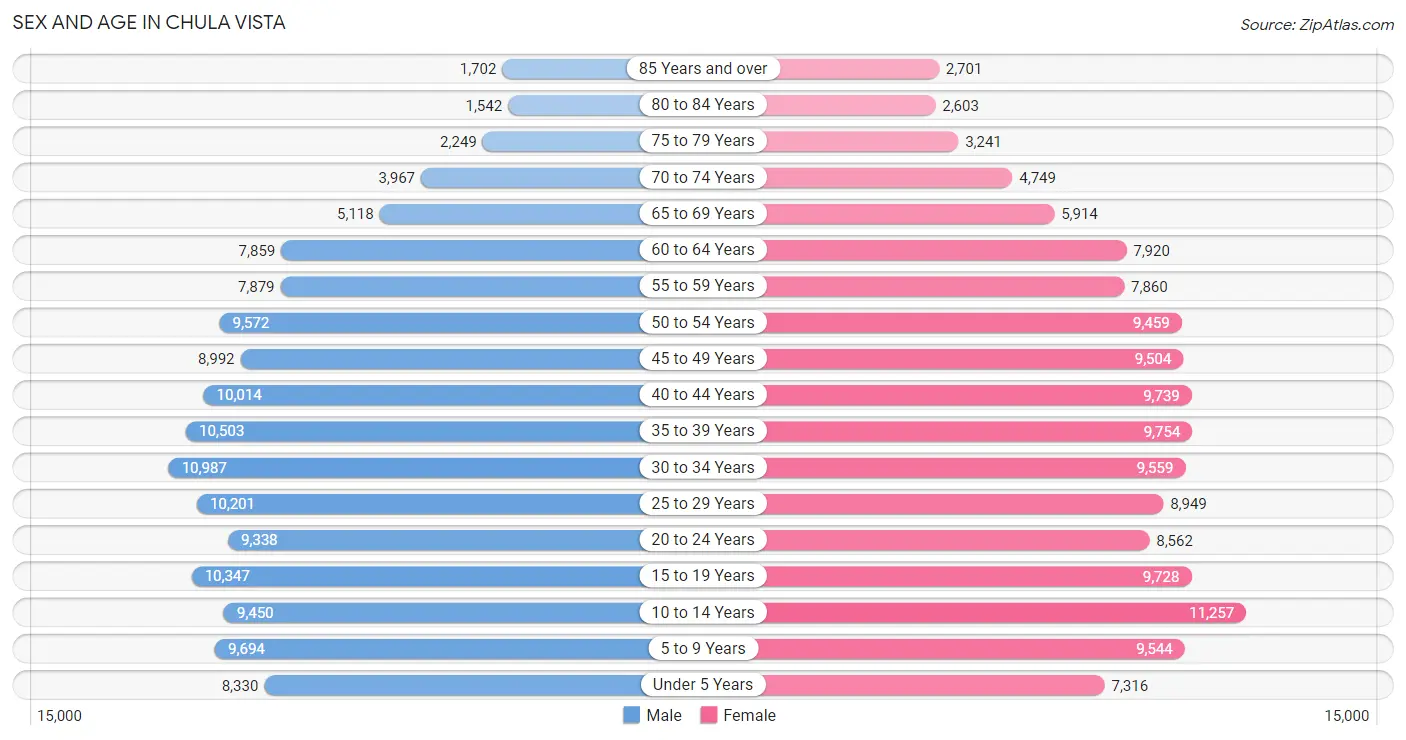
Sex and Age in Chula Vista
Sex and Age in Chula Vista
The most populous age groups in Chula Vista are 30 to 34 Years (10,987 | 8.0%) for men and 10 to 14 Years (11,257 | 8.1%) for women.
| Age Bracket | Male | Female |
| Under 5 Years | 8,330 (6.0%) | 7,316 (5.3%) |
| 5 to 9 Years | 9,694 (7.0%) | 9,544 (6.9%) |
| 10 to 14 Years | 9,450 (6.9%) | 11,257 (8.1%) |
| 15 to 19 Years | 10,347 (7.5%) | 9,728 (7.0%) |
| 20 to 24 Years | 9,338 (6.8%) | 8,562 (6.2%) |
| 25 to 29 Years | 10,201 (7.4%) | 8,949 (6.5%) |
| 30 to 34 Years | 10,987 (8.0%) | 9,559 (6.9%) |
| 35 to 39 Years | 10,503 (7.6%) | 9,754 (7.0%) |
| 40 to 44 Years | 10,014 (7.3%) | 9,739 (7.0%) |
| 45 to 49 Years | 8,992 (6.5%) | 9,504 (6.9%) |
| 50 to 54 Years | 9,572 (7.0%) | 9,459 (6.8%) |
| 55 to 59 Years | 7,879 (5.7%) | 7,860 (5.7%) |
| 60 to 64 Years | 7,859 (5.7%) | 7,920 (5.7%) |
| 65 to 69 Years | 5,118 (3.7%) | 5,914 (4.3%) |
| 70 to 74 Years | 3,967 (2.9%) | 4,749 (3.4%) |
| 75 to 79 Years | 2,249 (1.6%) | 3,241 (2.3%) |
| 80 to 84 Years | 1,542 (1.1%) | 2,603 (1.9%) |
| 85 Years and over | 1,702 (1.2%) | 2,701 (1.9%) |
| Total | 137,744 (100.0%) | 138,359 (100.0%) |
Families and Households in Chula Vista
Median Family Size in Chula Vista
The median family size in Chula Vista is 3.69 persons per family, with married-couple families (48,048 | 72.8%) accounting for the largest median family size of 3.82 persons per family. On the other hand, single male/father families (5,250 | 8.0%) represent the smallest median family size with 3.07 persons per family.

| Family Type | # Families | Family Size |
| Married-Couple | 48,048 (72.8%) | 3.82 |
| Single Male/Father | 5,250 (8.0%) | 3.07 |
| Single Female/Mother | 12,750 (19.3%) | 3.44 |
| Total Families | 66,048 (100.0%) | 3.69 |
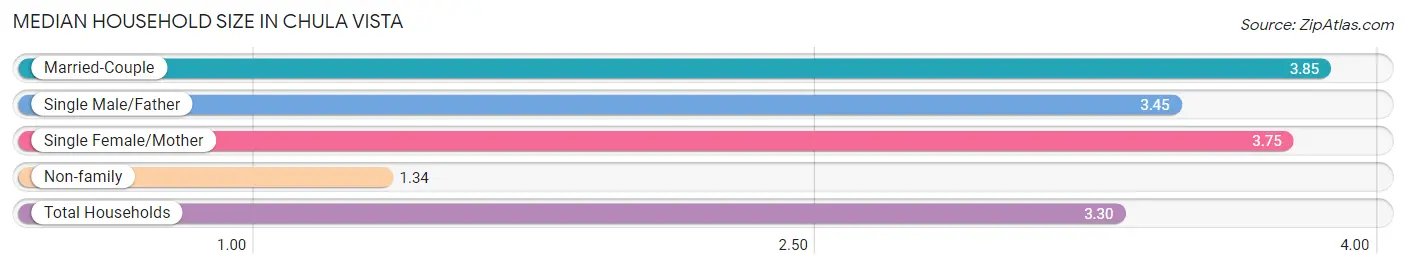
Median Household Size in Chula Vista
The median household size in Chula Vista is 3.30 persons per household, with married-couple households (48,048 | 57.8%) accounting for the largest median household size of 3.85 persons per household. non-family households (17,026 | 20.5%) represent the smallest median household size with 1.34 persons per household.
| Household Type | # Households | Household Size |
| Married-Couple | 48,048 (57.8%) | 3.85 |
| Single Male/Father | 5,250 (6.3%) | 3.45 |
| Single Female/Mother | 12,750 (15.3%) | 3.75 |
| Non-family | 17,026 (20.5%) | 1.34 |
| Total Households | 83,074 (100.0%) | 3.30 |
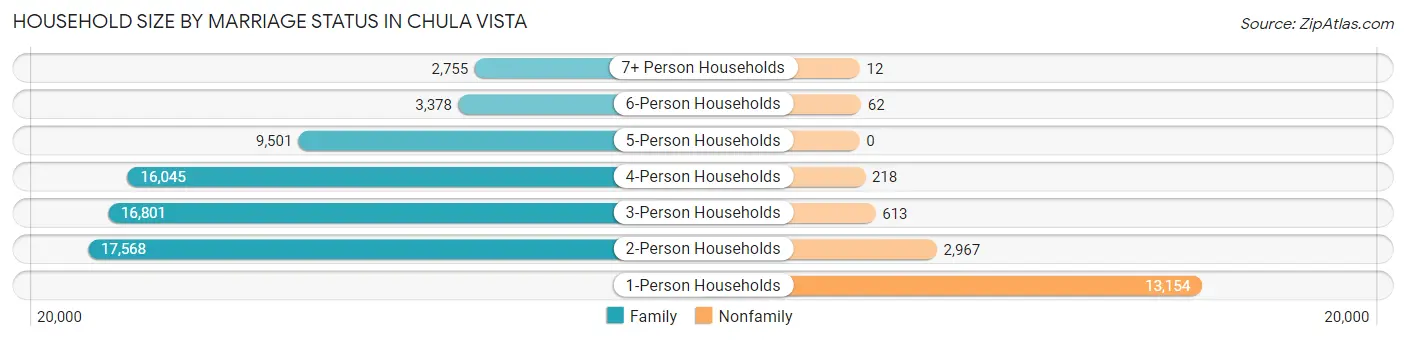
Household Size by Marriage Status in Chula Vista
Out of a total of 83,074 households in Chula Vista, 66,048 (79.5%) are family households, while 17,026 (20.5%) are nonfamily households. The most numerous type of family households are 2-person households, comprising 17,568, and the most common type of nonfamily households are 1-person households, comprising 13,154.
| Household Size | Family Households | Nonfamily Households |
| 1-Person Households | - | 13,154 (15.8%) |
| 2-Person Households | 17,568 (21.1%) | 2,967 (3.6%) |
| 3-Person Households | 16,801 (20.2%) | 613 (0.7%) |
| 4-Person Households | 16,045 (19.3%) | 218 (0.3%) |
| 5-Person Households | 9,501 (11.4%) | 0 (0.0%) |
| 6-Person Households | 3,378 (4.1%) | 62 (0.1%) |
| 7+ Person Households | 2,755 (3.3%) | 12 (0.0%) |
| Total | 66,048 (79.5%) | 17,026 (20.5%) |
Female Fertility in Chula Vista
Fertility by Age in Chula Vista
Average fertility rate in Chula Vista is 62.0 births per 1,000 women. Women in the age bracket of 20 to 34 years have the highest fertility rate with 78.0 births per 1,000 women. Women in the age bracket of 20 to 34 years acount for 50.5% of all women with births.
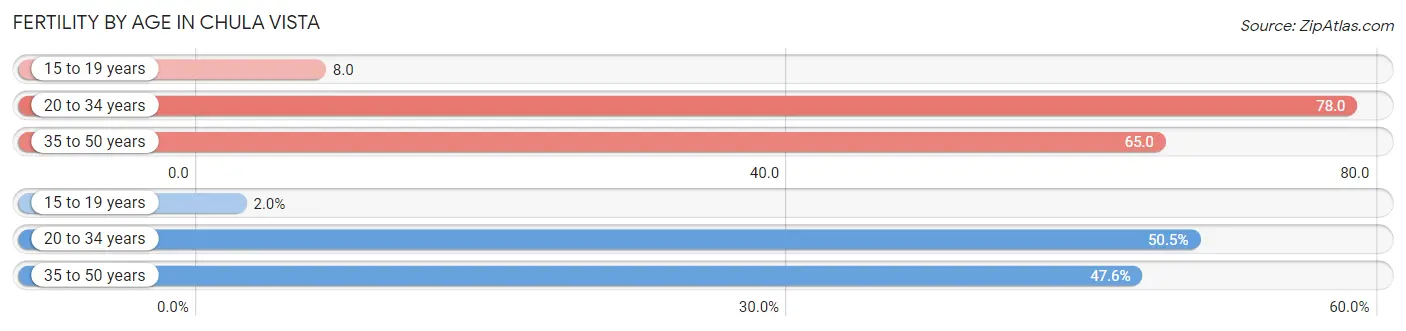
| Age Bracket | Women with Births | Births / 1,000 Women |
| 15 to 19 years | 82 (2.0%) | 8.0 |
| 20 to 34 years | 2,112 (50.5%) | 78.0 |
| 35 to 50 years | 1,989 (47.5%) | 65.0 |
| Total | 4,183 (100.0%) | 62.0 |
Fertility by Age by Marriage Status in Chula Vista
75.4% of women with births (4,183) in Chula Vista are married. The highest percentage of unmarried women with births falls into 15 to 19 years age bracket with 100.0% of them unmarried at the time of birth, while the lowest percentage of unmarried women with births belong to 35 to 50 years age bracket with 16.3% of them unmarried.
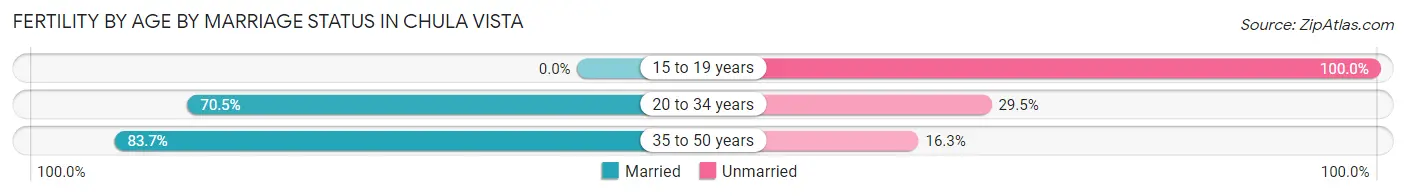
| Age Bracket | Married | Unmarried |
| 15 to 19 years | 0 (0.0%) | 82 (100.0%) |
| 20 to 34 years | 1,489 (70.5%) | 623 (29.5%) |
| 35 to 50 years | 1,665 (83.7%) | 324 (16.3%) |
| Total | 3,154 (75.4%) | 1,029 (24.6%) |
Fertility by Education in Chula Vista
Average fertility rate in Chula Vista is 62.0 births per 1,000 women. Women with the education attainment of college or associate's degree have the highest fertility rate of 86.0 births per 1,000 women, while women with the education attainment of less than high school have the lowest fertility at 24.0 births per 1,000 women. Women with the education attainment of college or associate's degree represent 46.7% of all women with births.
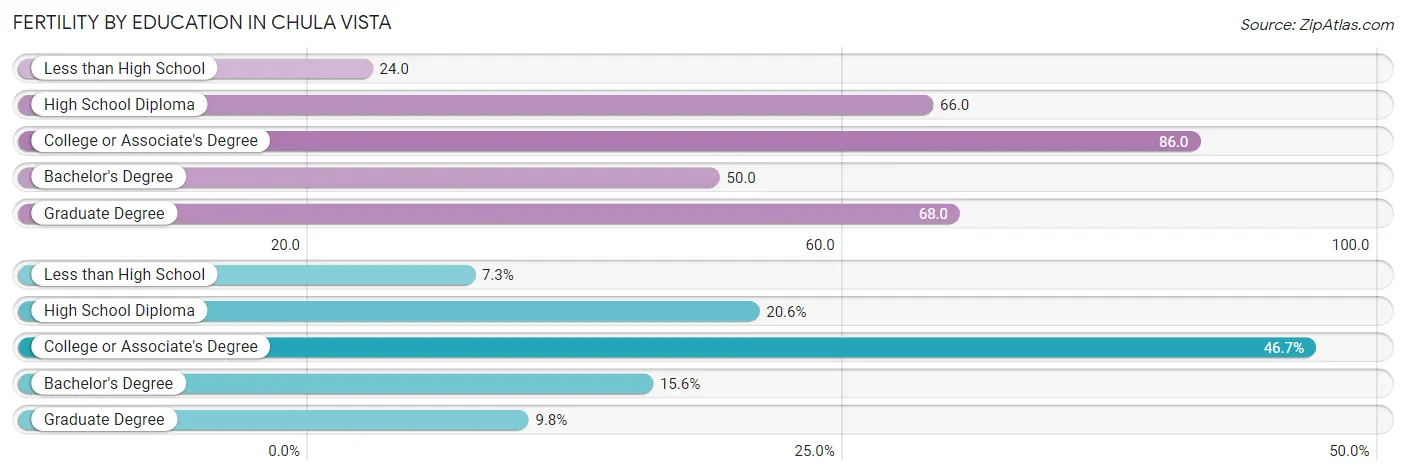
| Educational Attainment | Women with Births | Births / 1,000 Women |
| Less than High School | 305 (7.3%) | 24.0 |
| High School Diploma | 862 (20.6%) | 66.0 |
| College or Associate's Degree | 1,952 (46.7%) | 86.0 |
| Bachelor's Degree | 654 (15.6%) | 50.0 |
| Graduate Degree | 410 (9.8%) | 68.0 |
| Total | 4,183 (100.0%) | 62.0 |
Fertility by Education by Marriage Status in Chula Vista
24.6% of women with births in Chula Vista are unmarried. Women with the educational attainment of graduate degree are most likely to be married with 97.3% of them married at childbirth, while women with the educational attainment of high school diploma are least likely to be married with 38.2% of them unmarried at childbirth.
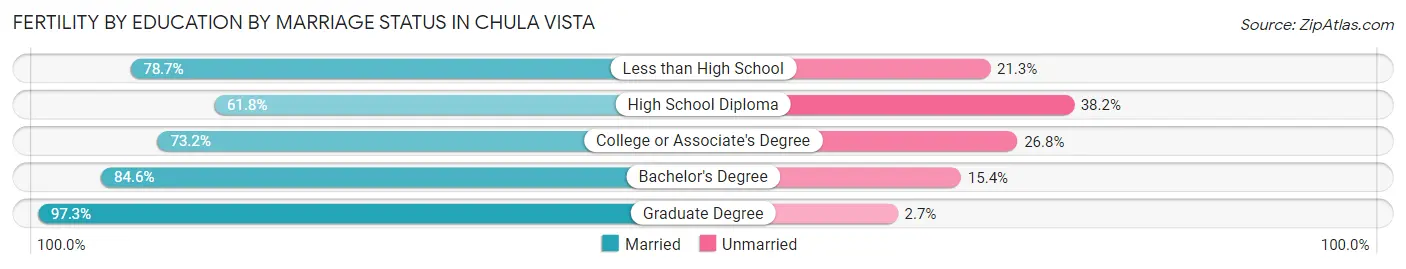
| Educational Attainment | Married | Unmarried |
| Less than High School | 240 (78.7%) | 65 (21.3%) |
| High School Diploma | 533 (61.8%) | 329 (38.2%) |
| College or Associate's Degree | 1,429 (73.2%) | 523 (26.8%) |
| Bachelor's Degree | 553 (84.6%) | 101 (15.4%) |
| Graduate Degree | 399 (97.3%) | 11 (2.7%) |
| Total | 3,154 (75.4%) | 1,029 (24.6%) |
Employment Characteristics in Chula Vista
Employment by Class of Employer in Chula Vista
Among the 129,066 employed individuals in Chula Vista, private company employees (79,952 | 62.0%), federal government employees (13,354 | 10.3%), and local government employees (10,146 | 7.9%) make up the most common classes of employment.
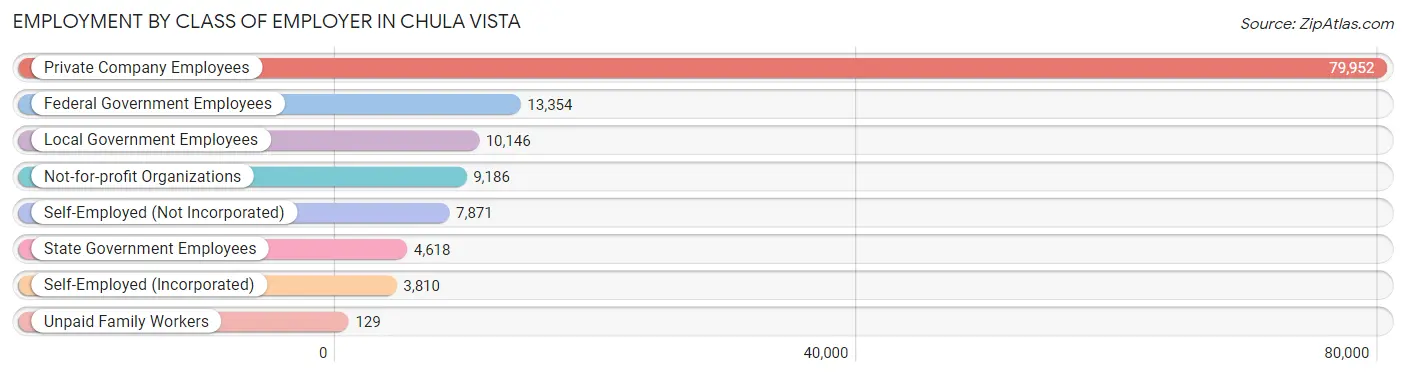
| Employer Class | # Employees | % Employees |
| Private Company Employees | 79,952 | 62.0% |
| Self-Employed (Incorporated) | 3,810 | 2.9% |
| Self-Employed (Not Incorporated) | 7,871 | 6.1% |
| Not-for-profit Organizations | 9,186 | 7.1% |
| Local Government Employees | 10,146 | 7.9% |
| State Government Employees | 4,618 | 3.6% |
| Federal Government Employees | 13,354 | 10.3% |
| Unpaid Family Workers | 129 | 0.1% |
| Total | 129,066 | 100.0% |
Employment Status by Age in Chula Vista
According to the labor force statistics for Chula Vista, out of the total population over 16 years of age (216,237), 66.9% or 144,663 individuals are in the labor force, with 8.8% or 12,730 of them unemployed. The age group with the highest labor force participation rate is 25 to 29 years, with 86.1% or 16,488 individuals in the labor force. Within the labor force, the 16 to 19 years age range has the highest percentage of unemployed individuals, with 30.0% or 1,545 of them being unemployed.
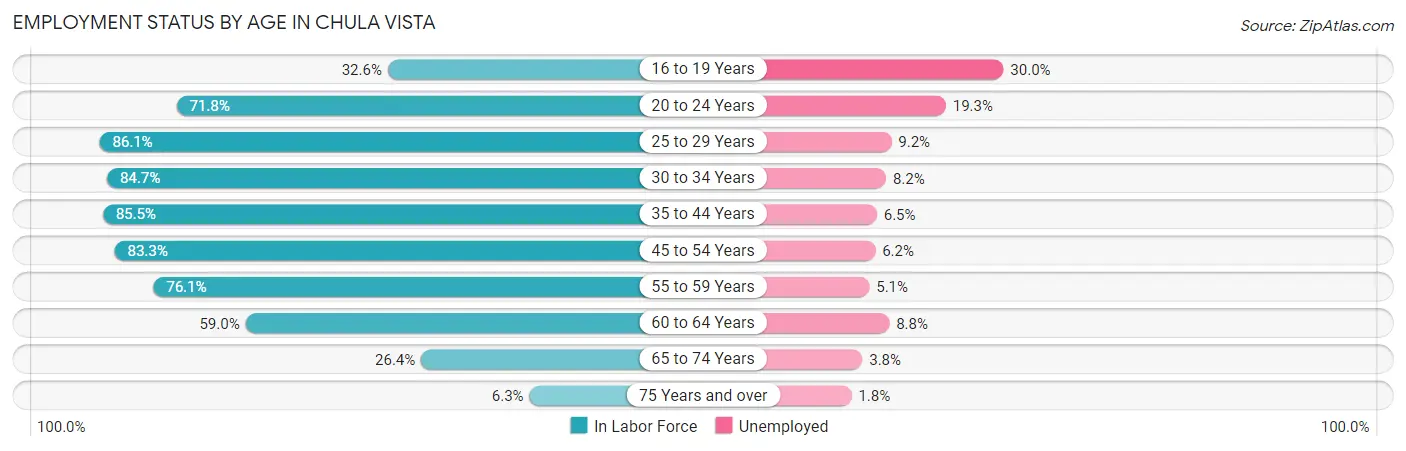
| Age Bracket | In Labor Force | Unemployed |
| 16 to 19 Years | 5,151 (32.6%) | 1,545 (30.0%) |
| 20 to 24 Years | 12,852 (71.8%) | 2,480 (19.3%) |
| 25 to 29 Years | 16,488 (86.1%) | 1,517 (9.2%) |
| 30 to 34 Years | 17,402 (84.7%) | 1,427 (8.2%) |
| 35 to 44 Years | 34,209 (85.5%) | 2,224 (6.5%) |
| 45 to 54 Years | 31,260 (83.3%) | 1,938 (6.2%) |
| 55 to 59 Years | 11,977 (76.1%) | 611 (5.1%) |
| 60 to 64 Years | 9,310 (59.0%) | 819 (8.8%) |
| 65 to 74 Years | 5,213 (26.4%) | 198 (3.8%) |
| 75 Years and over | 884 (6.3%) | 16 (1.8%) |
| Total | 144,663 (66.9%) | 12,730 (8.8%) |
Employment Status by Educational Attainment in Chula Vista
According to labor force statistics for Chula Vista, 81.1% of individuals (120,637) out of the total population between 25 and 64 years of age (148,751) are in the labor force, with 7.1% or 8,565 of them being unemployed. The group with the highest labor force participation rate are those with the educational attainment of bachelor's degree or higher, with 86.6% or 41,546 individuals in the labor force. Within the labor force, individuals with less than high school education have the highest percentage of unemployment, with 15.1% or 1,917 of them being unemployed.
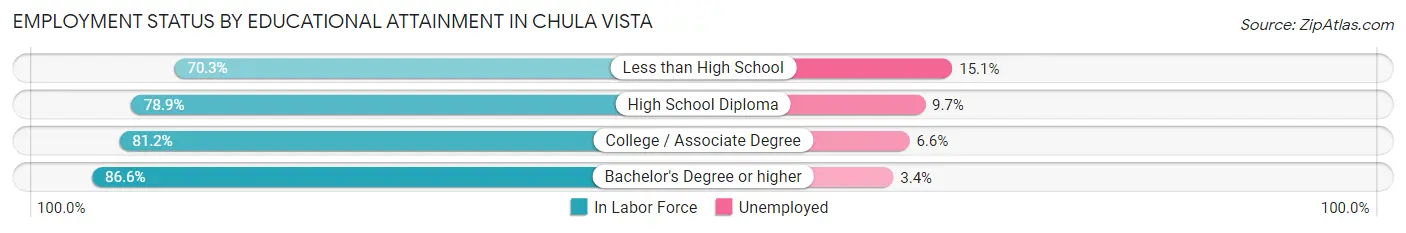
| Educational Attainment | In Labor Force | Unemployed |
| Less than High School | 12,693 (70.3%) | 2,726 (15.1%) |
| High School Diploma | 25,390 (78.9%) | 3,121 (9.7%) |
| College / Associate Degree | 41,038 (81.2%) | 3,336 (6.6%) |
| Bachelor's Degree or higher | 41,546 (86.6%) | 1,631 (3.4%) |
| Total | 120,637 (81.1%) | 10,561 (7.1%) |
Employment Occupations by Sex in Chula Vista
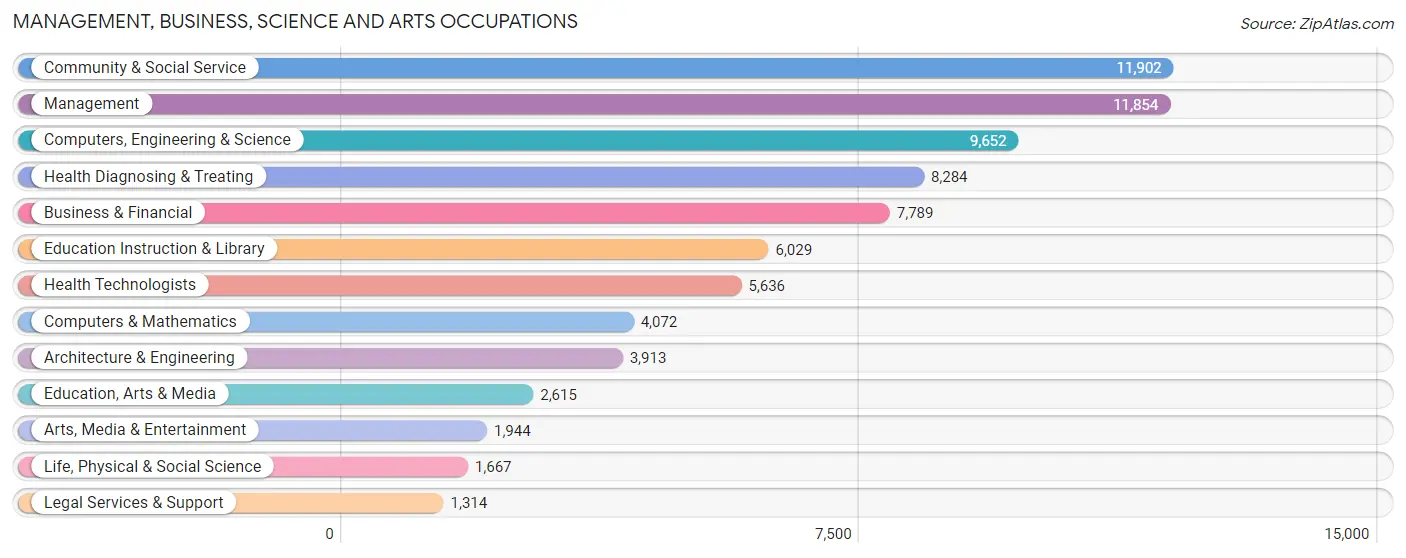
Management, Business, Science and Arts Occupations
The most common Management, Business, Science and Arts occupations in Chula Vista are Community & Social Service (11,902 | 9.3%), Management (11,854 | 9.3%), Computers, Engineering & Science (9,652 | 7.6%), Health Diagnosing & Treating (8,284 | 6.5%), and Business & Financial (7,789 | 6.1%).
Management, Business, Science and Arts Occupations by Sex
Within the Management, Business, Science and Arts occupations in Chula Vista, the most male-oriented occupations are Architecture & Engineering (84.8%), Computers & Mathematics (82.3%), and Computers, Engineering & Science (77.8%), while the most female-oriented occupations are Health Diagnosing & Treating (74.8%), Health Technologists (74.1%), and Education Instruction & Library (73.6%).
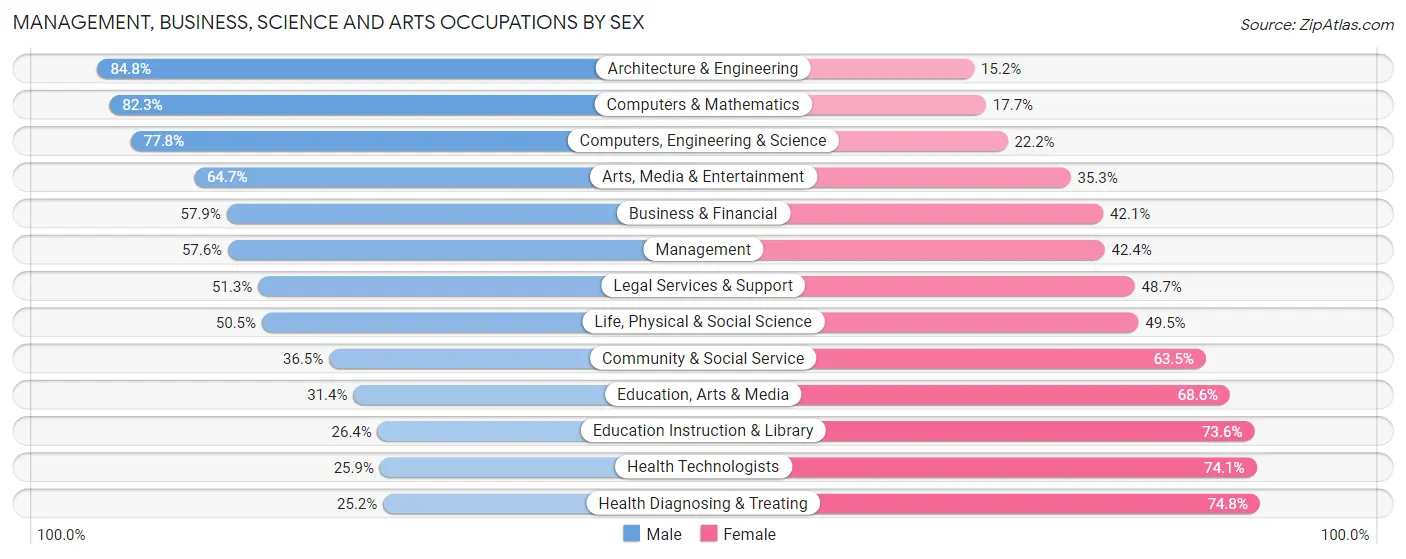
| Occupation | Male | Female |
| Management | 6,825 (57.6%) | 5,029 (42.4%) |
| Business & Financial | 4,507 (57.9%) | 3,282 (42.1%) |
| Computers, Engineering & Science | 7,512 (77.8%) | 2,140 (22.2%) |
| Computers & Mathematics | 3,352 (82.3%) | 720 (17.7%) |
| Architecture & Engineering | 3,318 (84.8%) | 595 (15.2%) |
| Life, Physical & Social Science | 842 (50.5%) | 825 (49.5%) |
| Community & Social Service | 4,342 (36.5%) | 7,560 (63.5%) |
| Education, Arts & Media | 822 (31.4%) | 1,793 (68.6%) |
| Legal Services & Support | 674 (51.3%) | 640 (48.7%) |
| Education Instruction & Library | 1,589 (26.4%) | 4,440 (73.6%) |
| Arts, Media & Entertainment | 1,257 (64.7%) | 687 (35.3%) |
| Health Diagnosing & Treating | 2,088 (25.2%) | 6,196 (74.8%) |
| Health Technologists | 1,461 (25.9%) | 4,175 (74.1%) |
| Total (Category) | 25,274 (51.1%) | 24,207 (48.9%) |
| Total (Overall) | 68,958 (54.1%) | 58,477 (45.9%) |
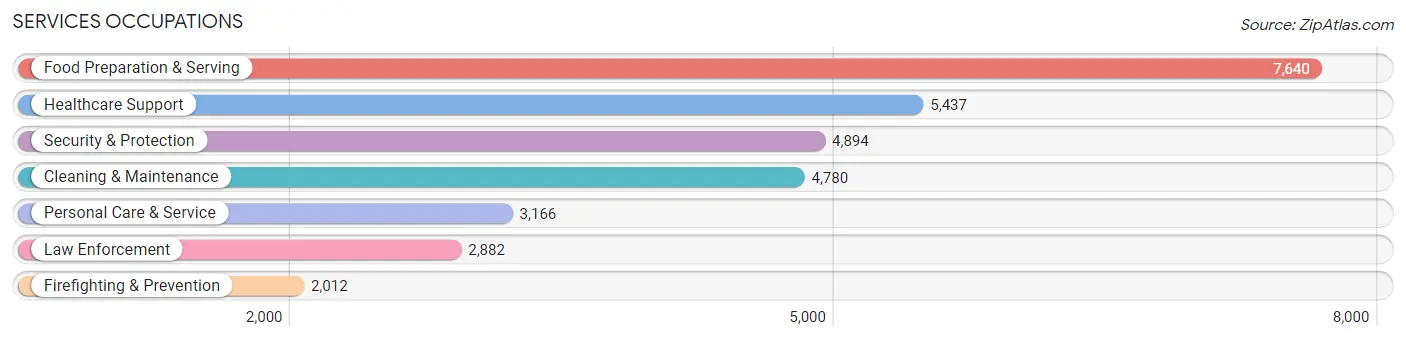
Services Occupations
The most common Services occupations in Chula Vista are Food Preparation & Serving (7,640 | 6.0%), Healthcare Support (5,437 | 4.3%), Security & Protection (4,894 | 3.8%), Cleaning & Maintenance (4,780 | 3.7%), and Personal Care & Service (3,166 | 2.5%).
Services Occupations by Sex
Within the Services occupations in Chula Vista, the most male-oriented occupations are Law Enforcement (83.6%), Security & Protection (79.0%), and Firefighting & Prevention (72.4%), while the most female-oriented occupations are Healthcare Support (77.8%), Personal Care & Service (64.0%), and Food Preparation & Serving (48.9%).
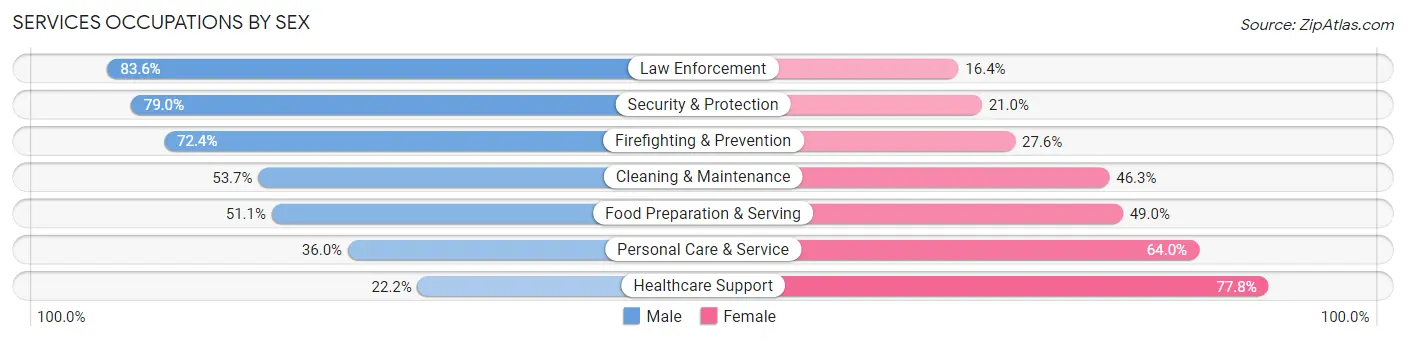
| Occupation | Male | Female |
| Healthcare Support | 1,206 (22.2%) | 4,231 (77.8%) |
| Security & Protection | 3,865 (79.0%) | 1,029 (21.0%) |
| Firefighting & Prevention | 1,456 (72.4%) | 556 (27.6%) |
| Law Enforcement | 2,409 (83.6%) | 473 (16.4%) |
| Food Preparation & Serving | 3,900 (51.0%) | 3,740 (48.9%) |
| Cleaning & Maintenance | 2,568 (53.7%) | 2,212 (46.3%) |
| Personal Care & Service | 1,139 (36.0%) | 2,027 (64.0%) |
| Total (Category) | 12,678 (48.9%) | 13,239 (51.1%) |
| Total (Overall) | 68,958 (54.1%) | 58,477 (45.9%) |
Sales and Office Occupations
The most common Sales and Office occupations in Chula Vista are Office & Administration (15,378 | 12.1%), and Sales & Related (12,876 | 10.1%).

Sales and Office Occupations by Sex
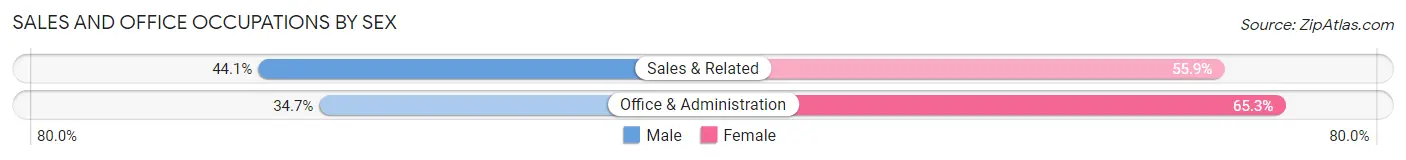
| Occupation | Male | Female |
| Sales & Related | 5,673 (44.1%) | 7,203 (55.9%) |
| Office & Administration | 5,333 (34.7%) | 10,045 (65.3%) |
| Total (Category) | 11,006 (39.0%) | 17,248 (61.1%) |
| Total (Overall) | 68,958 (54.1%) | 58,477 (45.9%) |
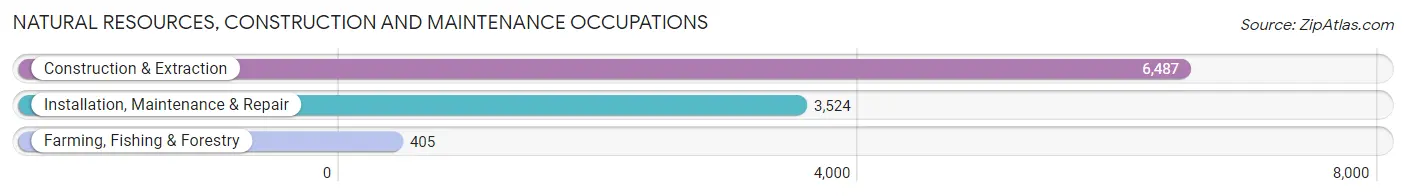
Natural Resources, Construction and Maintenance Occupations
The most common Natural Resources, Construction and Maintenance occupations in Chula Vista are Construction & Extraction (6,487 | 5.1%), Installation, Maintenance & Repair (3,524 | 2.8%), and Farming, Fishing & Forestry (405 | 0.3%).
Natural Resources, Construction and Maintenance Occupations by Sex
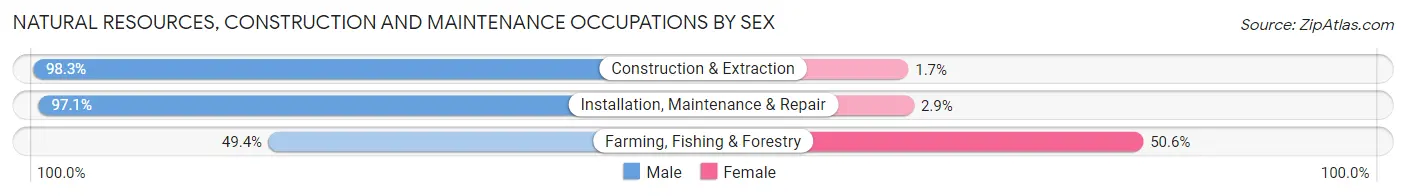
| Occupation | Male | Female |
| Farming, Fishing & Forestry | 200 (49.4%) | 205 (50.6%) |
| Construction & Extraction | 6,374 (98.3%) | 113 (1.7%) |
| Installation, Maintenance & Repair | 3,421 (97.1%) | 103 (2.9%) |
| Total (Category) | 9,995 (96.0%) | 421 (4.0%) |
| Total (Overall) | 68,958 (54.1%) | 58,477 (45.9%) |
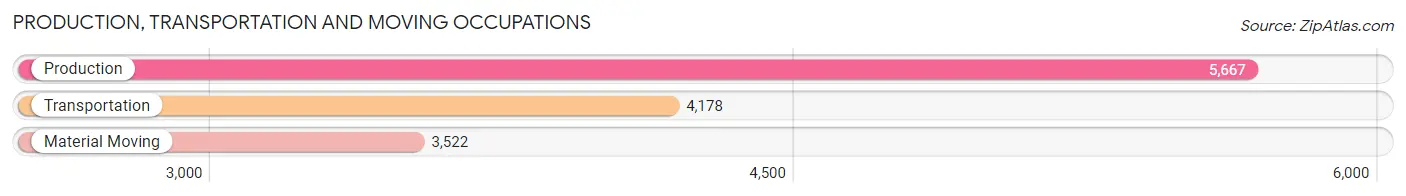
Production, Transportation and Moving Occupations
The most common Production, Transportation and Moving occupations in Chula Vista are Production (5,667 | 4.4%), Transportation (4,178 | 3.3%), and Material Moving (3,522 | 2.8%).
Production, Transportation and Moving Occupations by Sex
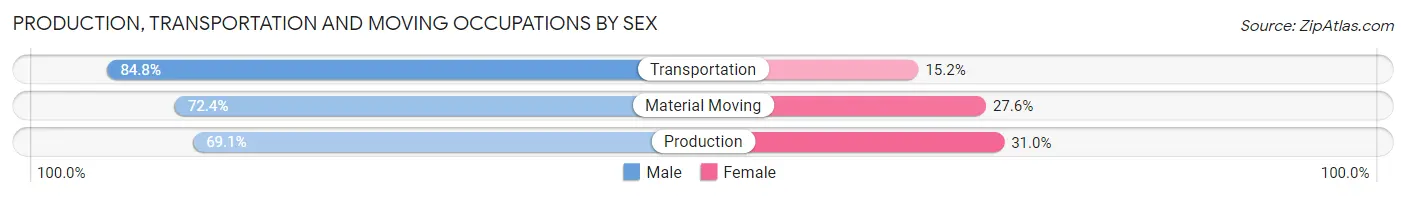
| Occupation | Male | Female |
| Production | 3,913 (69.1%) | 1,754 (30.9%) |
| Transportation | 3,542 (84.8%) | 636 (15.2%) |
| Material Moving | 2,550 (72.4%) | 972 (27.6%) |
| Total (Category) | 10,005 (74.9%) | 3,362 (25.2%) |
| Total (Overall) | 68,958 (54.1%) | 58,477 (45.9%) |
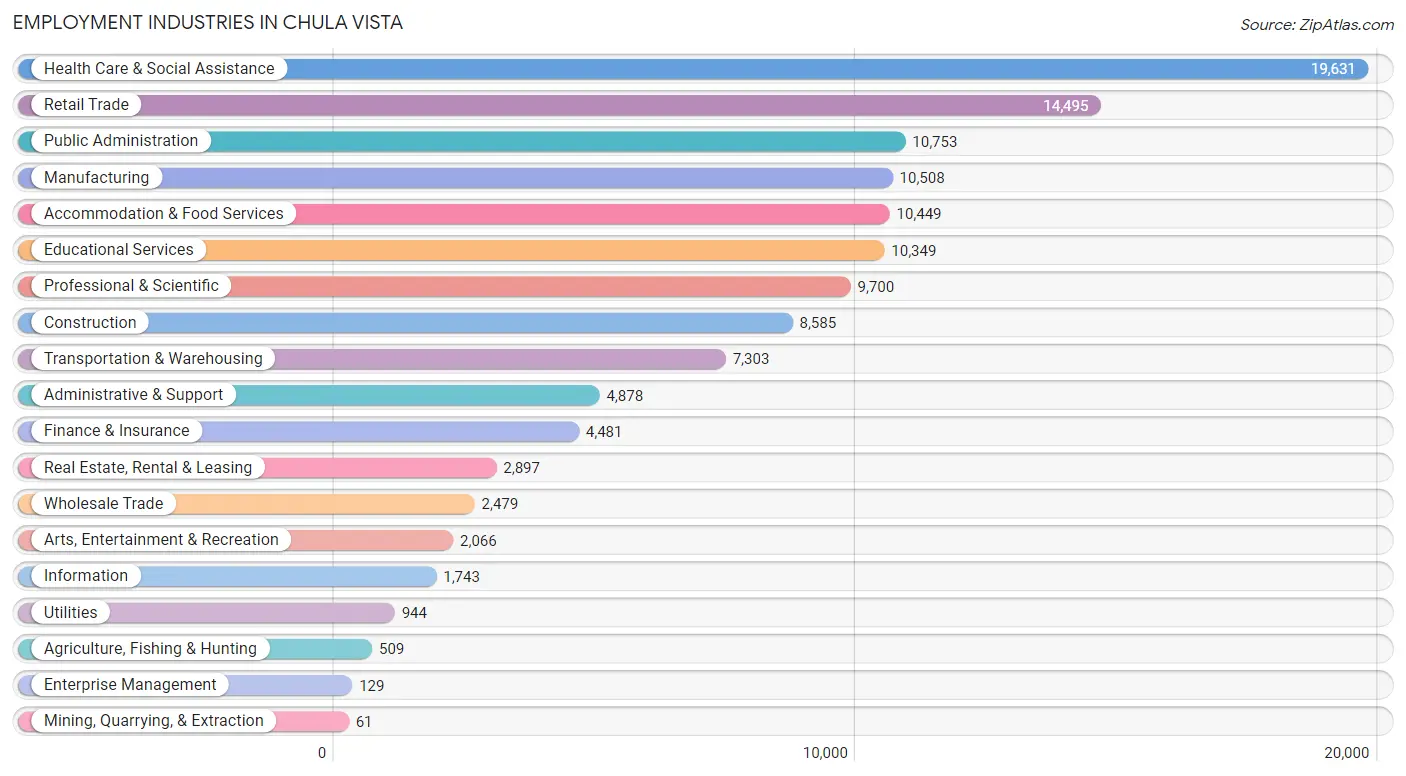
Employment Industries by Sex in Chula Vista
Employment Industries in Chula Vista
The major employment industries in Chula Vista include Health Care & Social Assistance (19,631 | 15.4%), Retail Trade (14,495 | 11.4%), Public Administration (10,753 | 8.4%), Manufacturing (10,508 | 8.3%), and Accommodation & Food Services (10,449 | 8.2%).
Employment Industries by Sex in Chula Vista
The Chula Vista industries that see more men than women are Mining, Quarrying, & Extraction (100.0%), Construction (92.2%), and Utilities (80.7%), whereas the industries that tend to have a higher number of women are Health Care & Social Assistance (74.7%), Educational Services (69.9%), and Finance & Insurance (57.4%).
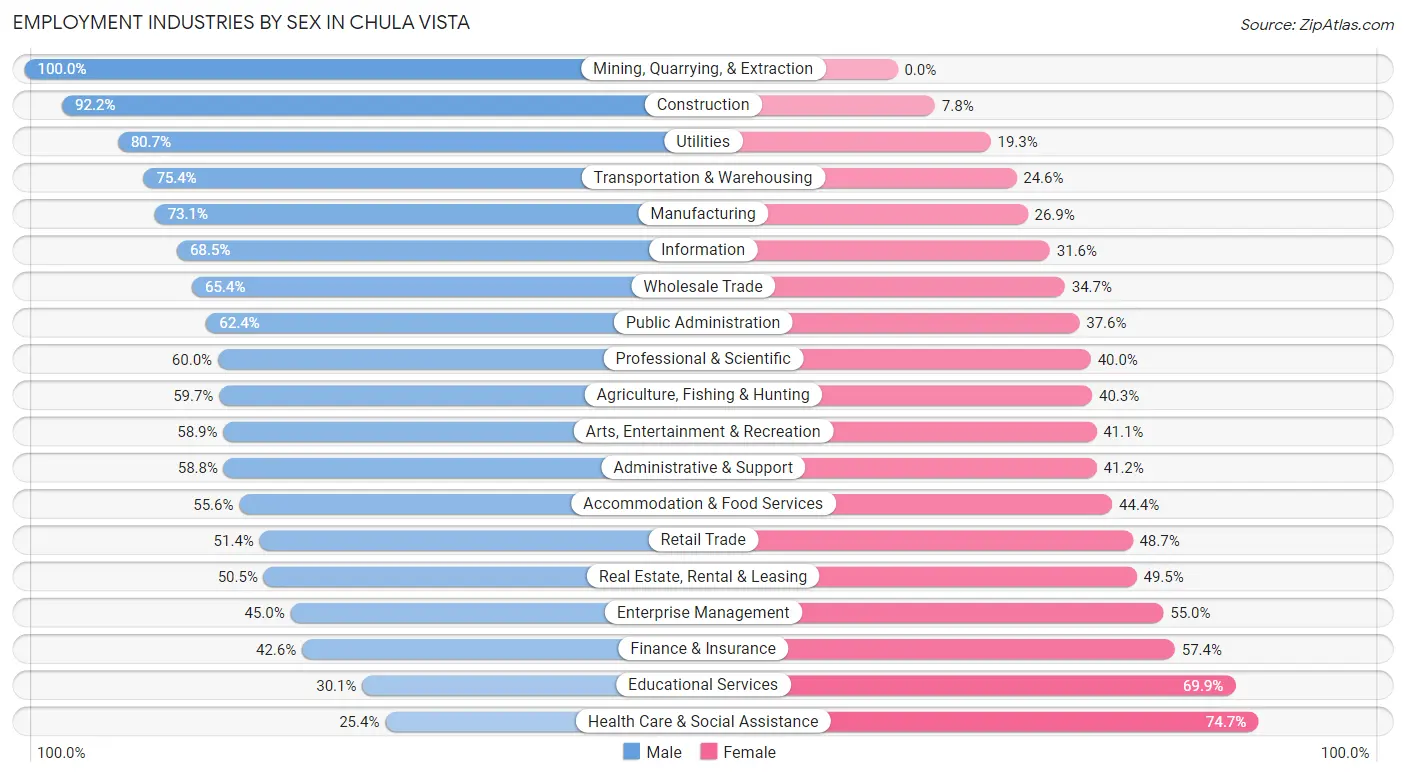
| Industry | Male | Female |
| Agriculture, Fishing & Hunting | 304 (59.7%) | 205 (40.3%) |
| Mining, Quarrying, & Extraction | 61 (100.0%) | 0 (0.0%) |
| Construction | 7,919 (92.2%) | 666 (7.8%) |
| Manufacturing | 7,677 (73.1%) | 2,831 (26.9%) |
| Wholesale Trade | 1,620 (65.3%) | 859 (34.6%) |
| Retail Trade | 7,443 (51.3%) | 7,052 (48.6%) |
| Transportation & Warehousing | 5,506 (75.4%) | 1,797 (24.6%) |
| Utilities | 762 (80.7%) | 182 (19.3%) |
| Information | 1,193 (68.4%) | 550 (31.6%) |
| Finance & Insurance | 1,908 (42.6%) | 2,573 (57.4%) |
| Real Estate, Rental & Leasing | 1,463 (50.5%) | 1,434 (49.5%) |
| Professional & Scientific | 5,819 (60.0%) | 3,881 (40.0%) |
| Enterprise Management | 58 (45.0%) | 71 (55.0%) |
| Administrative & Support | 2,867 (58.8%) | 2,011 (41.2%) |
| Educational Services | 3,115 (30.1%) | 7,234 (69.9%) |
| Health Care & Social Assistance | 4,976 (25.4%) | 14,655 (74.7%) |
| Arts, Entertainment & Recreation | 1,216 (58.9%) | 850 (41.1%) |
| Accommodation & Food Services | 5,805 (55.6%) | 4,644 (44.4%) |
| Public Administration | 6,706 (62.4%) | 4,047 (37.6%) |
| Total | 68,958 (54.1%) | 58,477 (45.9%) |
Education in Chula Vista
School Enrollment in Chula Vista
The most common levels of schooling among the 81,299 students in Chula Vista are college / undergraduate (21,767 | 26.8%), high school (18,186 | 22.4%), and elementary school (15,551 | 19.1%).
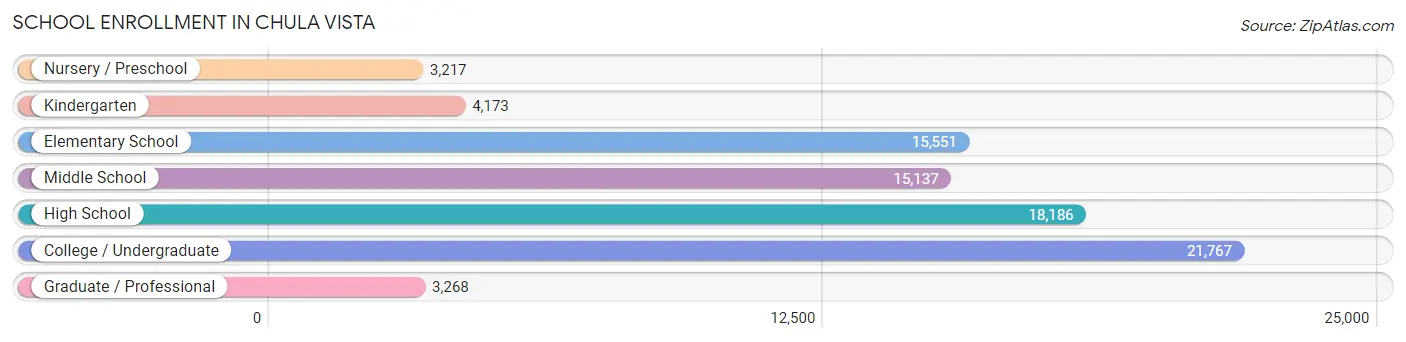
| School Level | # Students | % Students |
| Nursery / Preschool | 3,217 | 4.0% |
| Kindergarten | 4,173 | 5.1% |
| Elementary School | 15,551 | 19.1% |
| Middle School | 15,137 | 18.6% |
| High School | 18,186 | 22.4% |
| College / Undergraduate | 21,767 | 26.8% |
| Graduate / Professional | 3,268 | 4.0% |
| Total | 81,299 | 100.0% |
School Enrollment by Age by Funding Source in Chula Vista
Out of a total of 81,299 students who are enrolled in schools in Chula Vista, 9,675 (11.9%) attend a private institution, while the remaining 71,624 (88.1%) are enrolled in public schools. The age group of 3 to 4 year olds has the highest likelihood of being enrolled in private schools, with 1,297 (44.8% in the age bracket) enrolled. Conversely, the age group of 10 to 14 year olds has the lowest likelihood of being enrolled in a private school, with 19,233 (94.4% in the age bracket) attending a public institution.
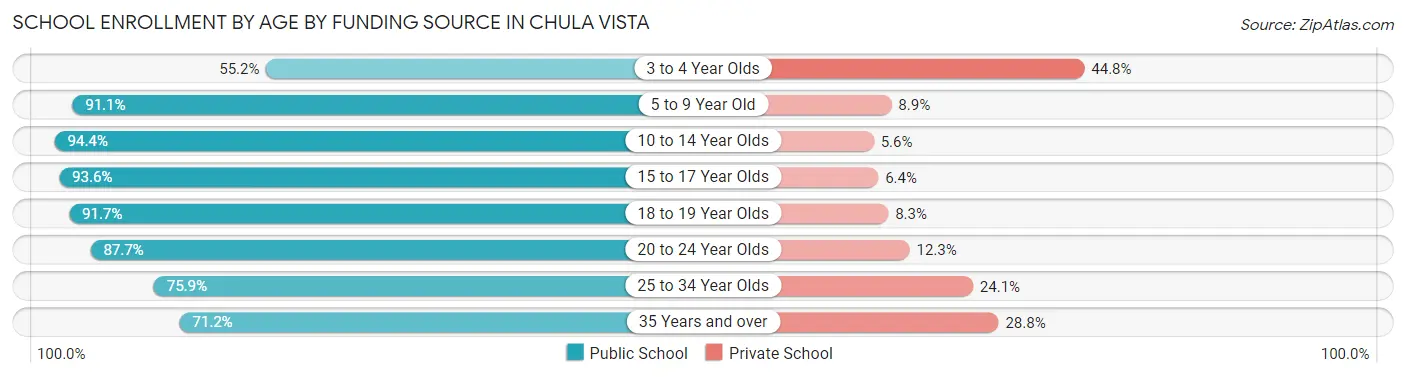
| Age Bracket | Public School | Private School |
| 3 to 4 Year Olds | 1,596 (55.2%) | 1,297 (44.8%) |
| 5 to 9 Year Old | 16,842 (91.1%) | 1,644 (8.9%) |
| 10 to 14 Year Olds | 19,233 (94.4%) | 1,140 (5.6%) |
| 15 to 17 Year Olds | 11,708 (93.6%) | 806 (6.4%) |
| 18 to 19 Year Olds | 5,256 (91.7%) | 476 (8.3%) |
| 20 to 24 Year Olds | 8,263 (87.7%) | 1,156 (12.3%) |
| 25 to 34 Year Olds | 4,699 (75.9%) | 1,490 (24.1%) |
| 35 Years and over | 4,051 (71.2%) | 1,642 (28.8%) |
| Total | 71,624 (88.1%) | 9,675 (11.9%) |
Educational Attainment by Field of Study in Chula Vista
Business (12,105 | 20.1%), science & technology (7,993 | 13.3%), engineering (5,946 | 9.9%), social sciences (5,869 | 9.8%), and arts & humanities (4,884 | 8.1%) are the most common fields of study among 60,141 individuals in Chula Vista who have obtained a bachelor's degree or higher.
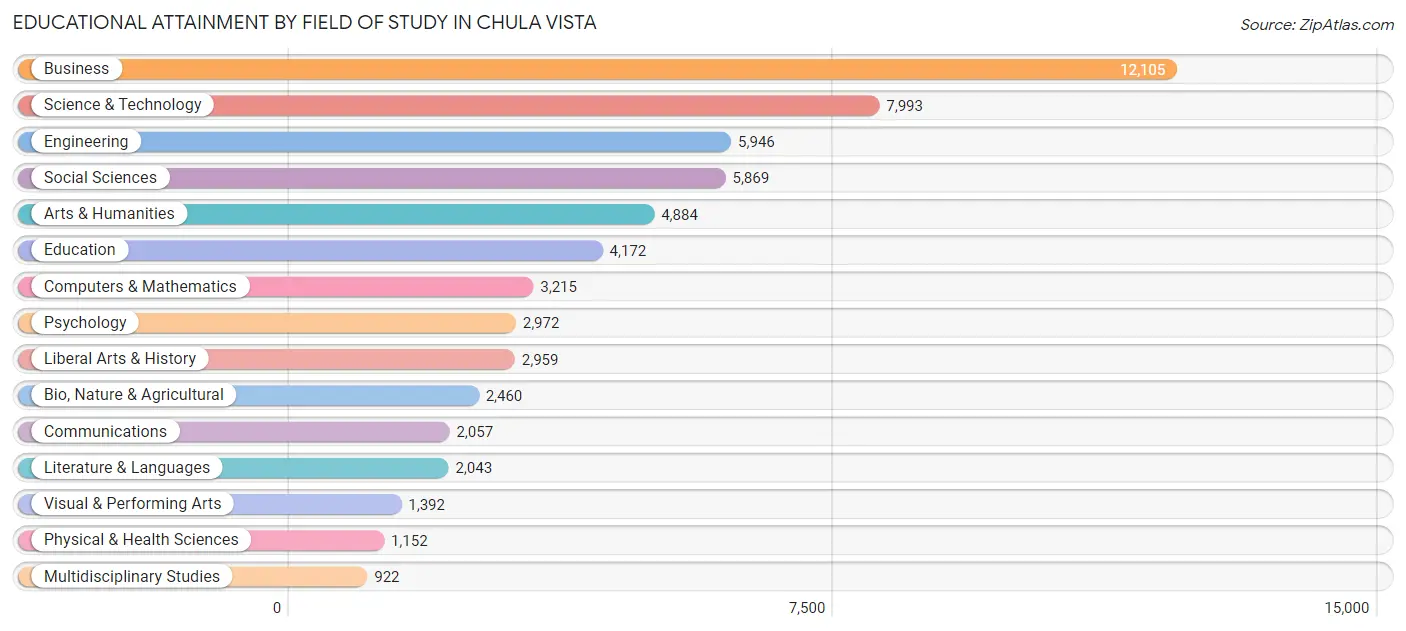
| Field of Study | # Graduates | % Graduates |
| Computers & Mathematics | 3,215 | 5.3% |
| Bio, Nature & Agricultural | 2,460 | 4.1% |
| Physical & Health Sciences | 1,152 | 1.9% |
| Psychology | 2,972 | 4.9% |
| Social Sciences | 5,869 | 9.8% |
| Engineering | 5,946 | 9.9% |
| Multidisciplinary Studies | 922 | 1.5% |
| Science & Technology | 7,993 | 13.3% |
| Business | 12,105 | 20.1% |
| Education | 4,172 | 6.9% |
| Literature & Languages | 2,043 | 3.4% |
| Liberal Arts & History | 2,959 | 4.9% |
| Visual & Performing Arts | 1,392 | 2.3% |
| Communications | 2,057 | 3.4% |
| Arts & Humanities | 4,884 | 8.1% |
| Total | 60,141 | 100.0% |
Transportation & Commute in Chula Vista
Vehicle Availability by Sex in Chula Vista
The most prevalent vehicle ownership categories in Chula Vista are males with 2 vehicles (27,922, accounting for 39.1%) and females with 2 vehicles (21,884, making up 48.6%).
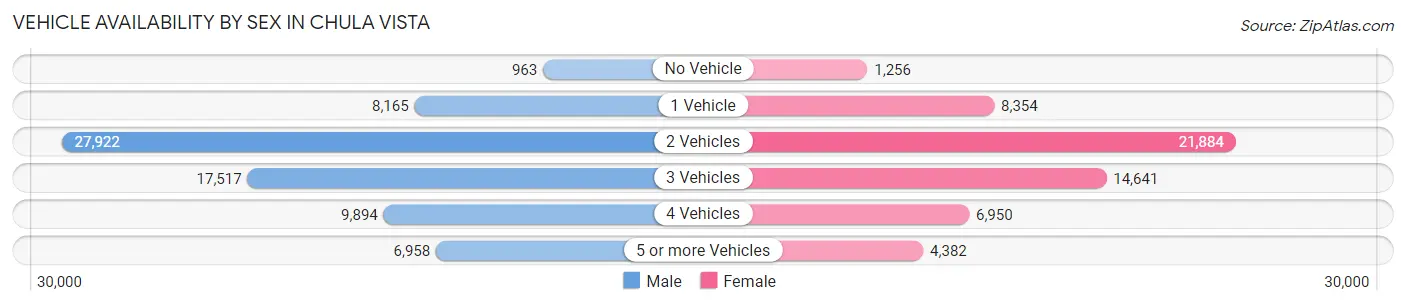
| Vehicles Available | Male | Female |
| No Vehicle | 963 (1.3%) | 1,256 (2.2%) |
| 1 Vehicle | 8,165 (11.4%) | 8,354 (14.5%) |
| 2 Vehicles | 27,922 (39.1%) | 21,884 (38.1%) |
| 3 Vehicles | 17,517 (24.5%) | 14,641 (25.5%) |
| 4 Vehicles | 9,894 (13.9%) | 6,950 (12.1%) |
| 5 or more Vehicles | 6,958 (9.7%) | 4,382 (7.6%) |
| Total | 71,419 (100.0%) | 57,467 (100.0%) |
Commute Time in Chula Vista
The most frequently occuring commute durations in Chula Vista are 30 to 34 minutes (18,916 commuters, 16.3%), 20 to 24 minutes (18,183 commuters, 15.7%), and 15 to 19 minutes (16,654 commuters, 14.4%).
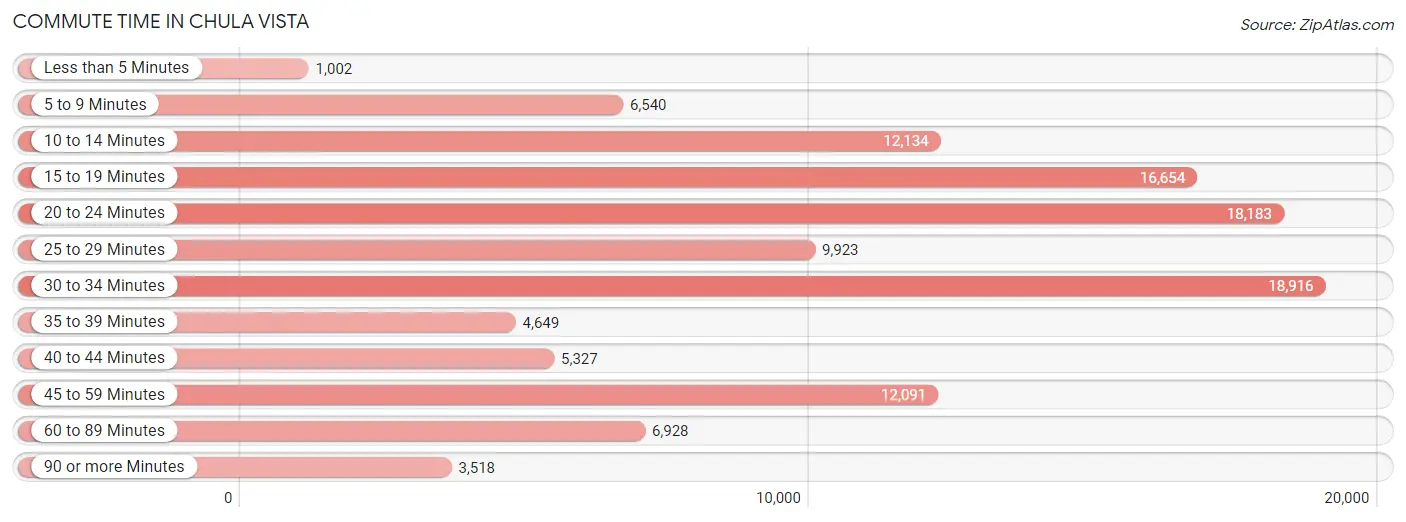
| Commute Time | # Commuters | % Commuters |
| Less than 5 Minutes | 1,002 | 0.9% |
| 5 to 9 Minutes | 6,540 | 5.6% |
| 10 to 14 Minutes | 12,134 | 10.5% |
| 15 to 19 Minutes | 16,654 | 14.4% |
| 20 to 24 Minutes | 18,183 | 15.7% |
| 25 to 29 Minutes | 9,923 | 8.6% |
| 30 to 34 Minutes | 18,916 | 16.3% |
| 35 to 39 Minutes | 4,649 | 4.0% |
| 40 to 44 Minutes | 5,327 | 4.6% |
| 45 to 59 Minutes | 12,091 | 10.4% |
| 60 to 89 Minutes | 6,928 | 6.0% |
| 90 or more Minutes | 3,518 | 3.0% |
Commute Time by Sex in Chula Vista
The most common commute times in Chula Vista are 30 to 34 minutes (11,531 commuters, 17.8%) for males and 15 to 19 minutes (7,855 commuters, 15.4%) for females.
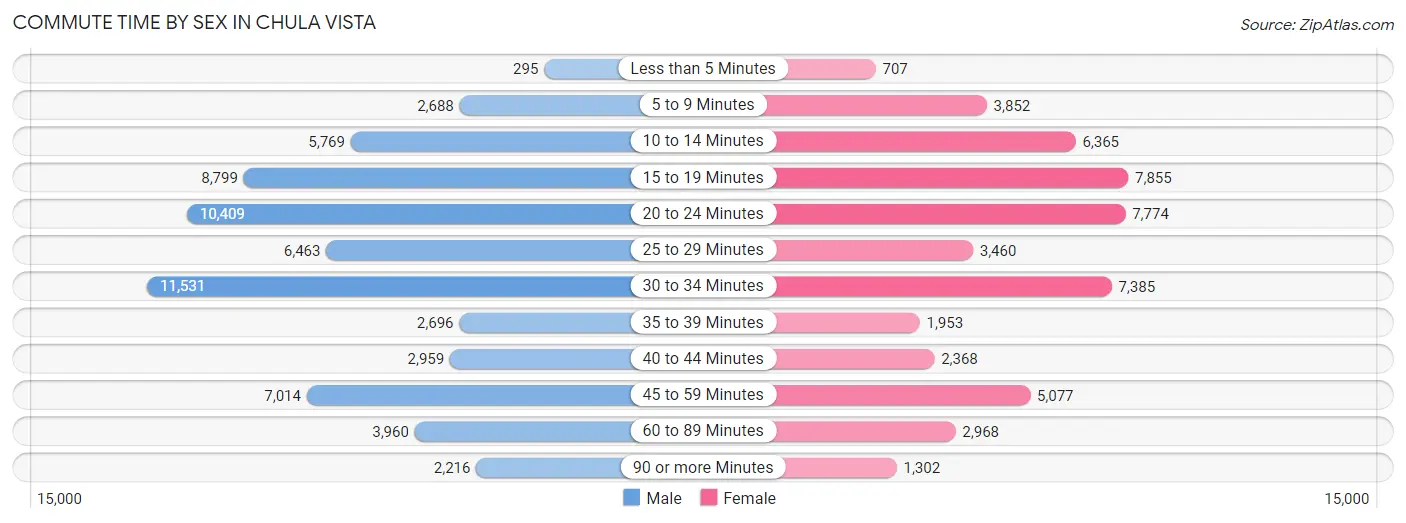
| Commute Time | Male | Female |
| Less than 5 Minutes | 295 (0.5%) | 707 (1.4%) |
| 5 to 9 Minutes | 2,688 (4.2%) | 3,852 (7.5%) |
| 10 to 14 Minutes | 5,769 (8.9%) | 6,365 (12.5%) |
| 15 to 19 Minutes | 8,799 (13.6%) | 7,855 (15.4%) |
| 20 to 24 Minutes | 10,409 (16.1%) | 7,774 (15.2%) |
| 25 to 29 Minutes | 6,463 (10.0%) | 3,460 (6.8%) |
| 30 to 34 Minutes | 11,531 (17.8%) | 7,385 (14.5%) |
| 35 to 39 Minutes | 2,696 (4.2%) | 1,953 (3.8%) |
| 40 to 44 Minutes | 2,959 (4.6%) | 2,368 (4.6%) |
| 45 to 59 Minutes | 7,014 (10.8%) | 5,077 (9.9%) |
| 60 to 89 Minutes | 3,960 (6.1%) | 2,968 (5.8%) |
| 90 or more Minutes | 2,216 (3.4%) | 1,302 (2.5%) |
Time of Departure to Work by Sex in Chula Vista
The most frequent times of departure to work in Chula Vista are 6:00 AM to 6:29 AM (8,077, 12.5%) for males and 7:00 AM to 7:29 AM (7,498, 14.7%) for females.
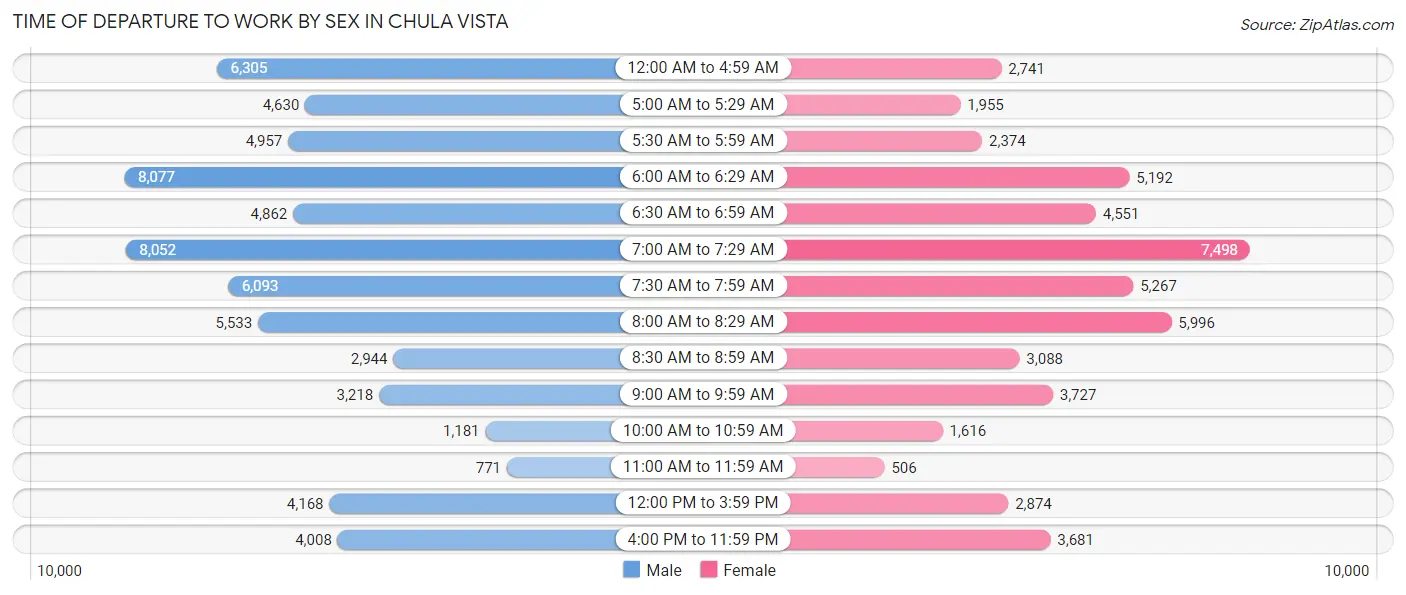
| Time of Departure | Male | Female |
| 12:00 AM to 4:59 AM | 6,305 (9.7%) | 2,741 (5.4%) |
| 5:00 AM to 5:29 AM | 4,630 (7.1%) | 1,955 (3.8%) |
| 5:30 AM to 5:59 AM | 4,957 (7.6%) | 2,374 (4.6%) |
| 6:00 AM to 6:29 AM | 8,077 (12.5%) | 5,192 (10.2%) |
| 6:30 AM to 6:59 AM | 4,862 (7.5%) | 4,551 (8.9%) |
| 7:00 AM to 7:29 AM | 8,052 (12.4%) | 7,498 (14.7%) |
| 7:30 AM to 7:59 AM | 6,093 (9.4%) | 5,267 (10.3%) |
| 8:00 AM to 8:29 AM | 5,533 (8.5%) | 5,996 (11.7%) |
| 8:30 AM to 8:59 AM | 2,944 (4.5%) | 3,088 (6.0%) |
| 9:00 AM to 9:59 AM | 3,218 (5.0%) | 3,727 (7.3%) |
| 10:00 AM to 10:59 AM | 1,181 (1.8%) | 1,616 (3.2%) |
| 11:00 AM to 11:59 AM | 771 (1.2%) | 506 (1.0%) |
| 12:00 PM to 3:59 PM | 4,168 (6.4%) | 2,874 (5.6%) |
| 4:00 PM to 11:59 PM | 4,008 (6.2%) | 3,681 (7.2%) |
| Total | 64,799 (100.0%) | 51,066 (100.0%) |
Housing Occupancy in Chula Vista
Occupancy by Ownership in Chula Vista
Of the total 83,074 dwellings in Chula Vista, owner-occupied units account for 49,795 (59.9%), while renter-occupied units make up 33,279 (40.1%).
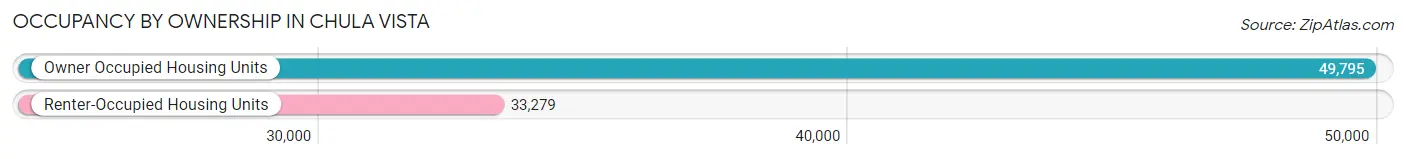
| Occupancy | # Housing Units | % Housing Units |
| Owner Occupied Housing Units | 49,795 | 59.9% |
| Renter-Occupied Housing Units | 33,279 | 40.1% |
| Total Occupied Housing Units | 83,074 | 100.0% |
Occupancy by Household Size in Chula Vista
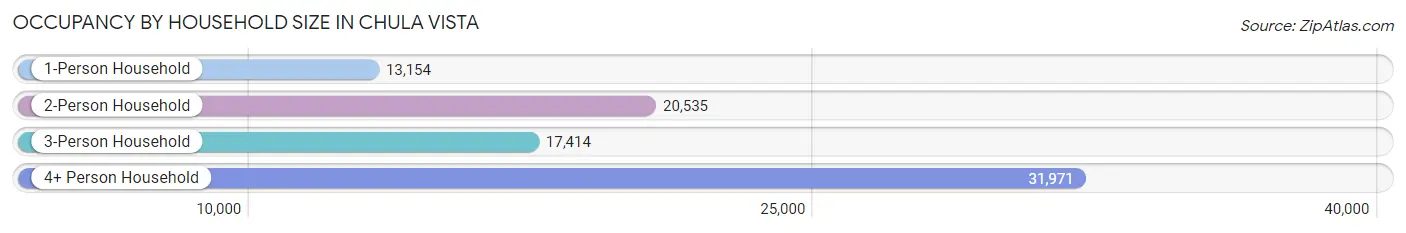
| Household Size | # Housing Units | % Housing Units |
| 1-Person Household | 13,154 | 15.8% |
| 2-Person Household | 20,535 | 24.7% |
| 3-Person Household | 17,414 | 21.0% |
| 4+ Person Household | 31,971 | 38.5% |
| Total Housing Units | 83,074 | 100.0% |
Occupancy by Ownership by Household Size in Chula Vista
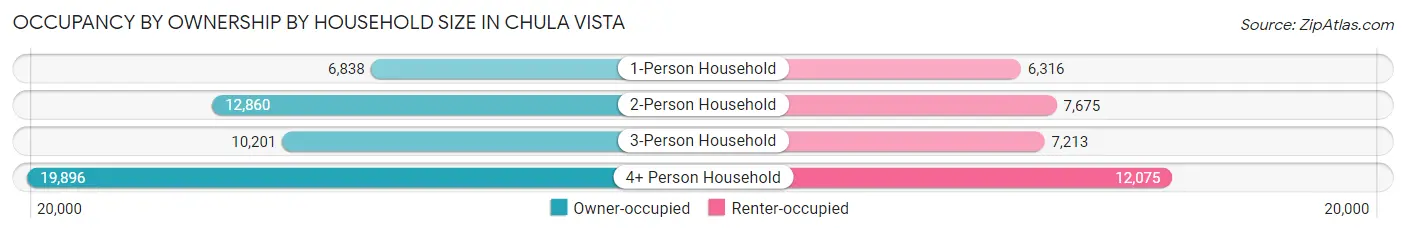
| Household Size | Owner-occupied | Renter-occupied |
| 1-Person Household | 6,838 (52.0%) | 6,316 (48.0%) |
| 2-Person Household | 12,860 (62.6%) | 7,675 (37.4%) |
| 3-Person Household | 10,201 (58.6%) | 7,213 (41.4%) |
| 4+ Person Household | 19,896 (62.2%) | 12,075 (37.8%) |
| Total Housing Units | 49,795 (59.9%) | 33,279 (40.1%) |
Occupancy by Educational Attainment in Chula Vista
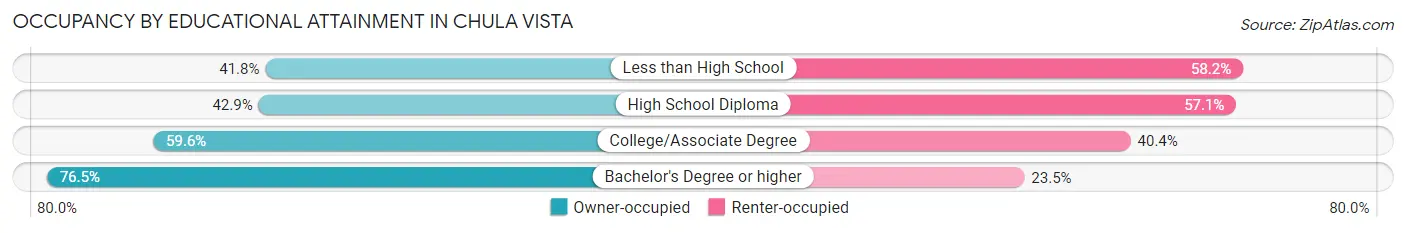
| Household Size | Owner-occupied | Renter-occupied |
| Less than High School | 4,627 (41.8%) | 6,438 (58.2%) |
| High School Diploma | 6,425 (42.9%) | 8,553 (57.1%) |
| College/Associate Degree | 17,269 (59.6%) | 11,687 (40.4%) |
| Bachelor's Degree or higher | 21,474 (76.5%) | 6,601 (23.5%) |
Occupancy by Age of Householder in Chula Vista
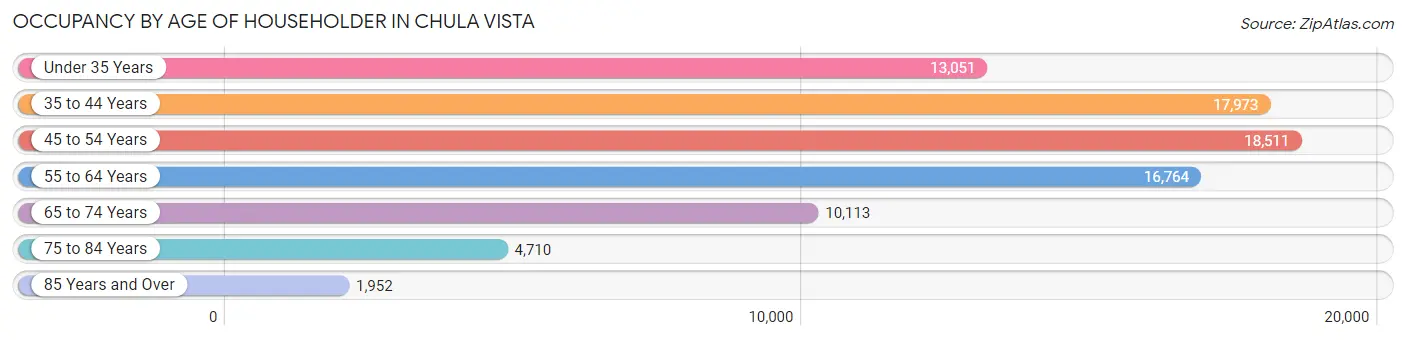
| Age Bracket | # Households | % Households |
| Under 35 Years | 13,051 | 15.7% |
| 35 to 44 Years | 17,973 | 21.6% |
| 45 to 54 Years | 18,511 | 22.3% |
| 55 to 64 Years | 16,764 | 20.2% |
| 65 to 74 Years | 10,113 | 12.2% |
| 75 to 84 Years | 4,710 | 5.7% |
| 85 Years and Over | 1,952 | 2.4% |
| Total | 83,074 | 100.0% |
Housing Finances in Chula Vista
Median Income by Occupancy in Chula Vista
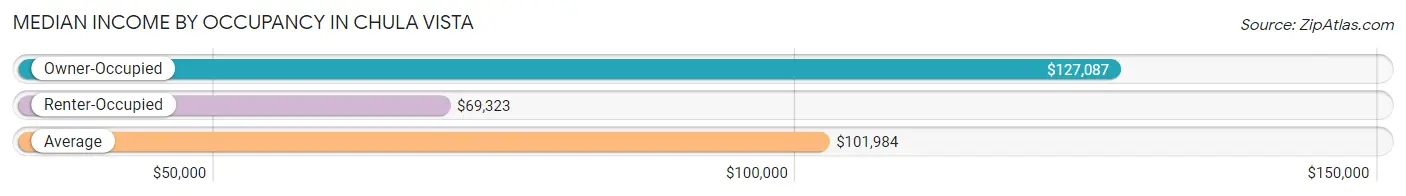
| Occupancy Type | # Households | Median Income |
| Owner-Occupied | 49,795 (59.9%) | $127,087 |
| Renter-Occupied | 33,279 (40.1%) | $69,323 |
| Average | 83,074 (100.0%) | $101,984 |
Occupancy by Householder Income Bracket in Chula Vista
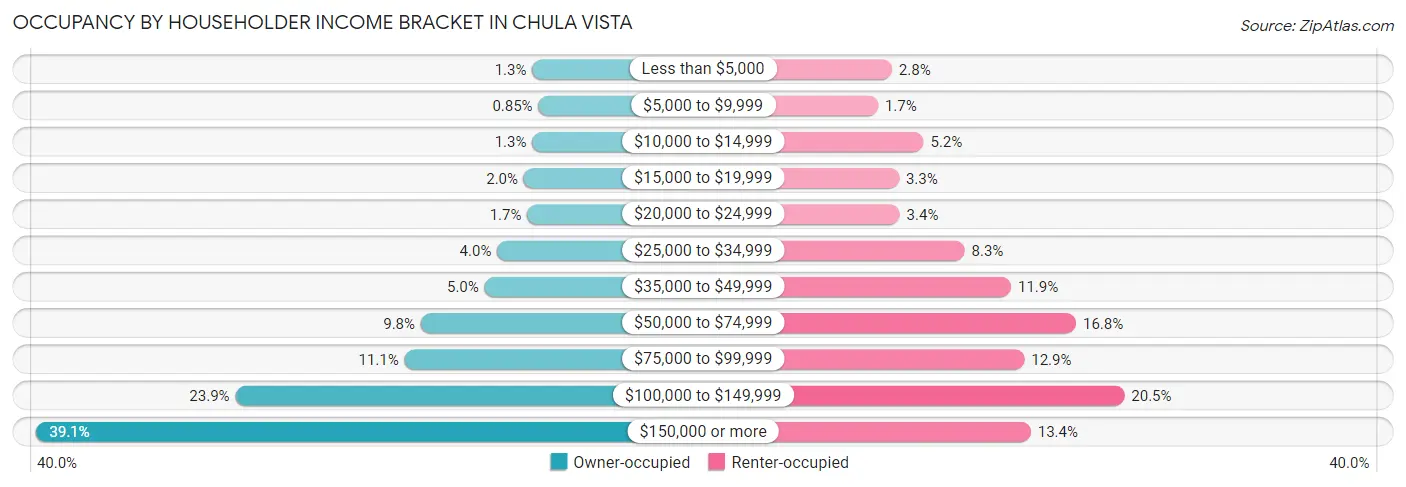
| Income Bracket | Owner-occupied | Renter-occupied |
| Less than $5,000 | 658 (1.3%) | 923 (2.8%) |
| $5,000 to $9,999 | 425 (0.9%) | 568 (1.7%) |
| $10,000 to $14,999 | 656 (1.3%) | 1,725 (5.2%) |
| $15,000 to $19,999 | 975 (2.0%) | 1,103 (3.3%) |
| $20,000 to $24,999 | 849 (1.7%) | 1,118 (3.4%) |
| $25,000 to $34,999 | 1,987 (4.0%) | 2,767 (8.3%) |
| $35,000 to $49,999 | 2,463 (5.0%) | 3,945 (11.8%) |
| $50,000 to $74,999 | 4,887 (9.8%) | 5,590 (16.8%) |
| $75,000 to $99,999 | 5,504 (11.1%) | 4,280 (12.9%) |
| $100,000 to $149,999 | 11,923 (23.9%) | 6,817 (20.5%) |
| $150,000 or more | 19,468 (39.1%) | 4,443 (13.4%) |
| Total | 49,795 (100.0%) | 33,279 (100.0%) |
Monthly Housing Cost Tiers in Chula Vista
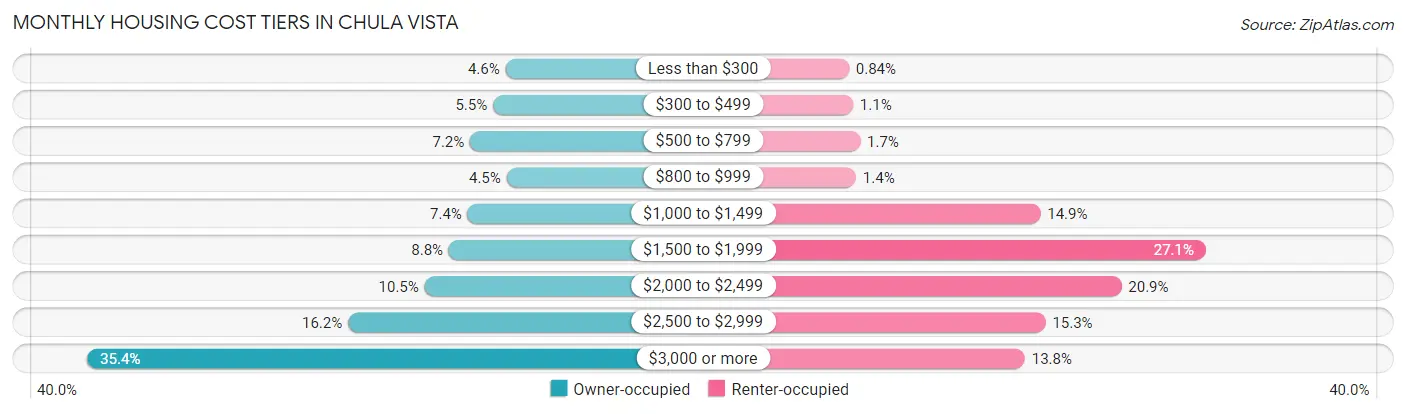
| Monthly Cost | Owner-occupied | Renter-occupied |
| Less than $300 | 2,282 (4.6%) | 280 (0.8%) |
| $300 to $499 | 2,738 (5.5%) | 378 (1.1%) |
| $500 to $799 | 3,579 (7.2%) | 555 (1.7%) |
| $800 to $999 | 2,240 (4.5%) | 454 (1.4%) |
| $1,000 to $1,499 | 3,669 (7.4%) | 4,972 (14.9%) |
| $1,500 to $1,999 | 4,359 (8.7%) | 9,029 (27.1%) |
| $2,000 to $2,499 | 5,247 (10.5%) | 6,960 (20.9%) |
| $2,500 to $2,999 | 8,058 (16.2%) | 5,100 (15.3%) |
| $3,000 or more | 17,623 (35.4%) | 4,594 (13.8%) |
| Total | 49,795 (100.0%) | 33,279 (100.0%) |
Physical Housing Characteristics in Chula Vista
Housing Structures in Chula Vista
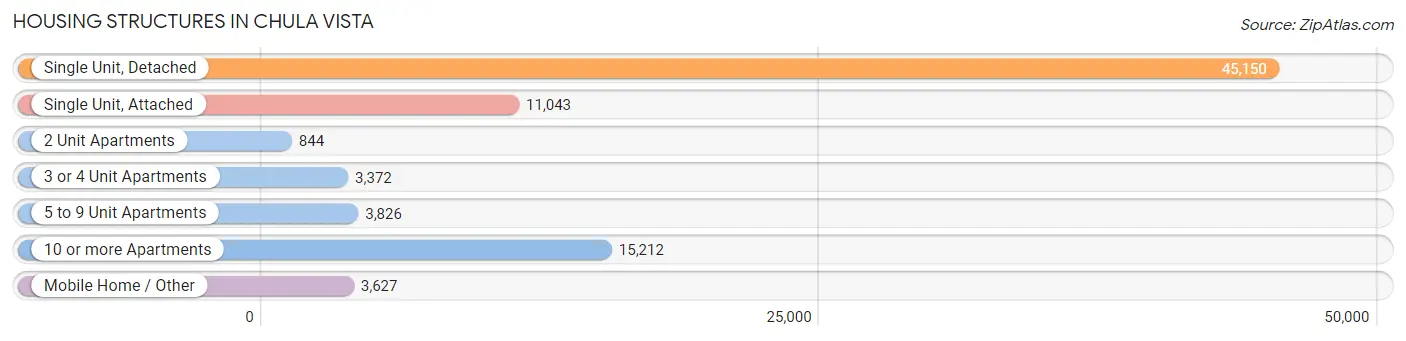
| Structure Type | # Housing Units | % Housing Units |
| Single Unit, Detached | 45,150 | 54.3% |
| Single Unit, Attached | 11,043 | 13.3% |
| 2 Unit Apartments | 844 | 1.0% |
| 3 or 4 Unit Apartments | 3,372 | 4.1% |
| 5 to 9 Unit Apartments | 3,826 | 4.6% |
| 10 or more Apartments | 15,212 | 18.3% |
| Mobile Home / Other | 3,627 | 4.4% |
| Total | 83,074 | 100.0% |
Housing Structures by Occupancy in Chula Vista
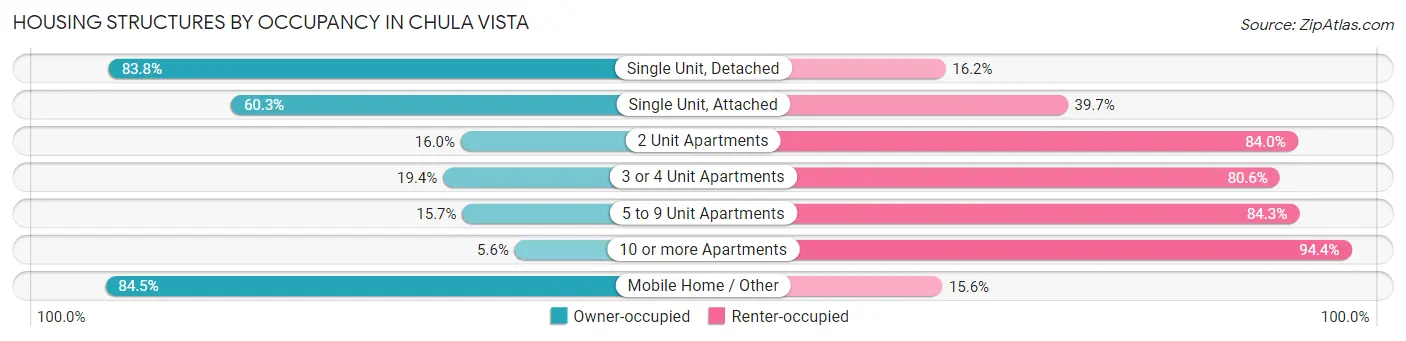
| Structure Type | Owner-occupied | Renter-occupied |
| Single Unit, Detached | 37,831 (83.8%) | 7,319 (16.2%) |
| Single Unit, Attached | 6,654 (60.3%) | 4,389 (39.7%) |
| 2 Unit Apartments | 135 (16.0%) | 709 (84.0%) |
| 3 or 4 Unit Apartments | 655 (19.4%) | 2,717 (80.6%) |
| 5 to 9 Unit Apartments | 601 (15.7%) | 3,225 (84.3%) |
| 10 or more Apartments | 856 (5.6%) | 14,356 (94.4%) |
| Mobile Home / Other | 3,063 (84.5%) | 564 (15.5%) |
| Total | 49,795 (59.9%) | 33,279 (40.1%) |
Housing Structures by Number of Rooms in Chula Vista
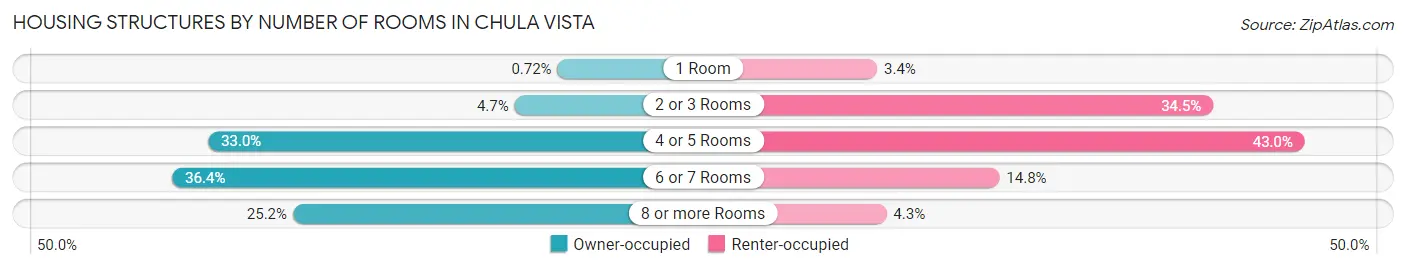
| Number of Rooms | Owner-occupied | Renter-occupied |
| 1 Room | 357 (0.7%) | 1,146 (3.4%) |
| 2 or 3 Rooms | 2,336 (4.7%) | 11,488 (34.5%) |
| 4 or 5 Rooms | 16,454 (33.0%) | 14,306 (43.0%) |
| 6 or 7 Rooms | 18,103 (36.4%) | 4,909 (14.7%) |
| 8 or more Rooms | 12,545 (25.2%) | 1,430 (4.3%) |
| Total | 49,795 (100.0%) | 33,279 (100.0%) |
Housing Structure by Heating Type in Chula Vista
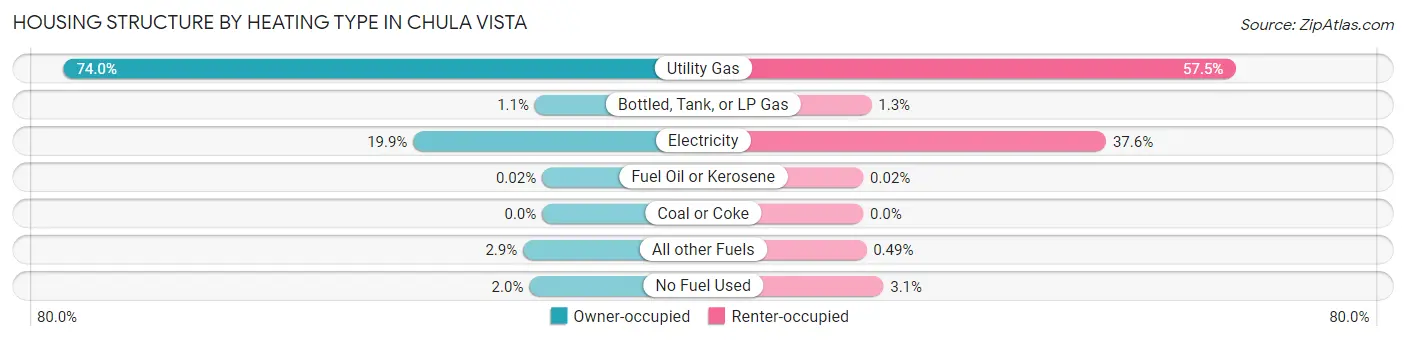
| Heating Type | Owner-occupied | Renter-occupied |
| Utility Gas | 36,840 (74.0%) | 19,141 (57.5%) |
| Bottled, Tank, or LP Gas | 563 (1.1%) | 426 (1.3%) |
| Electricity | 9,926 (19.9%) | 12,499 (37.6%) |
| Fuel Oil or Kerosene | 8 (0.0%) | 7 (0.0%) |
| Coal or Coke | 0 (0.0%) | 0 (0.0%) |
| All other Fuels | 1,465 (2.9%) | 163 (0.5%) |
| No Fuel Used | 993 (2.0%) | 1,043 (3.1%) |
| Total | 49,795 (100.0%) | 33,279 (100.0%) |
Household Vehicle Usage in Chula Vista
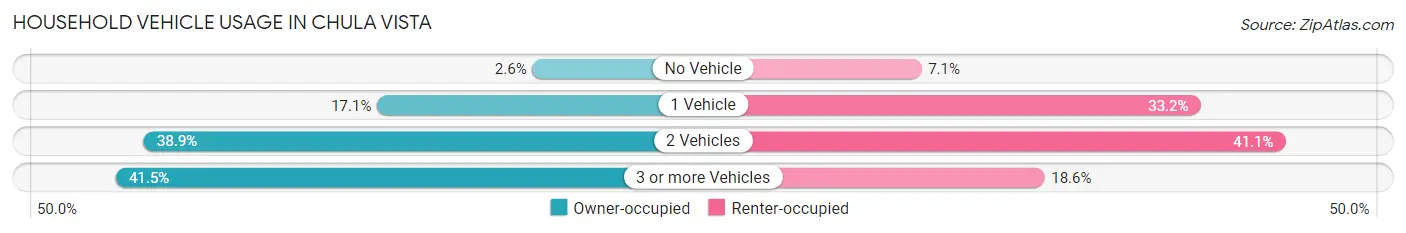
| Vehicles per Household | Owner-occupied | Renter-occupied |
| No Vehicle | 1,290 (2.6%) | 2,368 (7.1%) |
| 1 Vehicle | 8,506 (17.1%) | 11,038 (33.2%) |
| 2 Vehicles | 19,349 (38.9%) | 13,680 (41.1%) |
| 3 or more Vehicles | 20,650 (41.5%) | 6,193 (18.6%) |
| Total | 49,795 (100.0%) | 33,279 (100.0%) |
Real Estate & Mortgages in Chula Vista
Real Estate and Mortgage Overview in Chula Vista
| Characteristic | Without Mortgage | With Mortgage |
| Housing Units | 13,399 | 36,396 |
| Median Property Value | $582,700 | $668,900 |
| Median Household Income | $80,531 | $16,459 |
| Monthly Housing Costs | $677 | $17,561 |
| Real Estate Taxes | $3,414 | $903 |
Property Value by Mortgage Status in Chula Vista
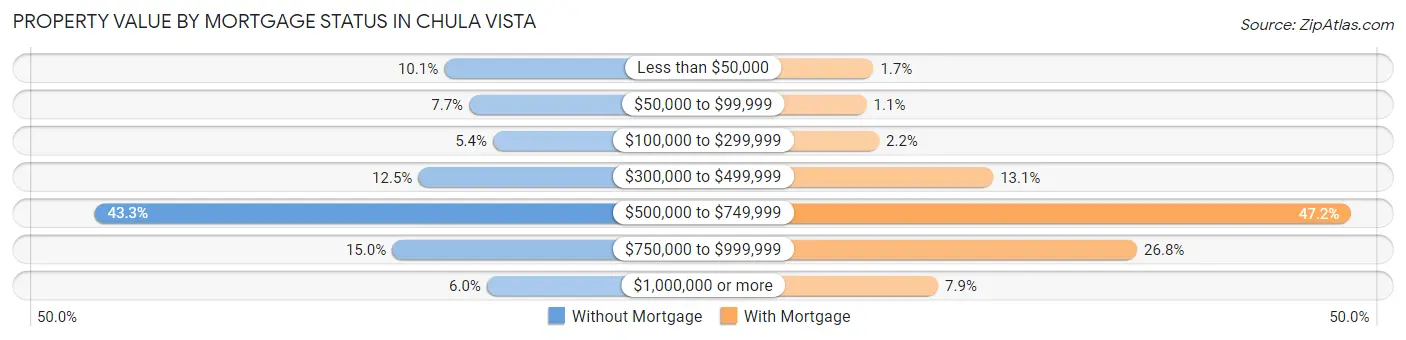
| Property Value | Without Mortgage | With Mortgage |
| Less than $50,000 | 1,348 (10.1%) | 623 (1.7%) |
| $50,000 to $99,999 | 1,029 (7.7%) | 384 (1.1%) |
| $100,000 to $299,999 | 725 (5.4%) | 814 (2.2%) |
| $300,000 to $499,999 | 1,677 (12.5%) | 4,771 (13.1%) |
| $500,000 to $749,999 | 5,806 (43.3%) | 17,178 (47.2%) |
| $750,000 to $999,999 | 2,011 (15.0%) | 9,761 (26.8%) |
| $1,000,000 or more | 803 (6.0%) | 2,865 (7.9%) |
| Total | 13,399 (100.0%) | 36,396 (100.0%) |
Household Income by Mortgage Status in Chula Vista
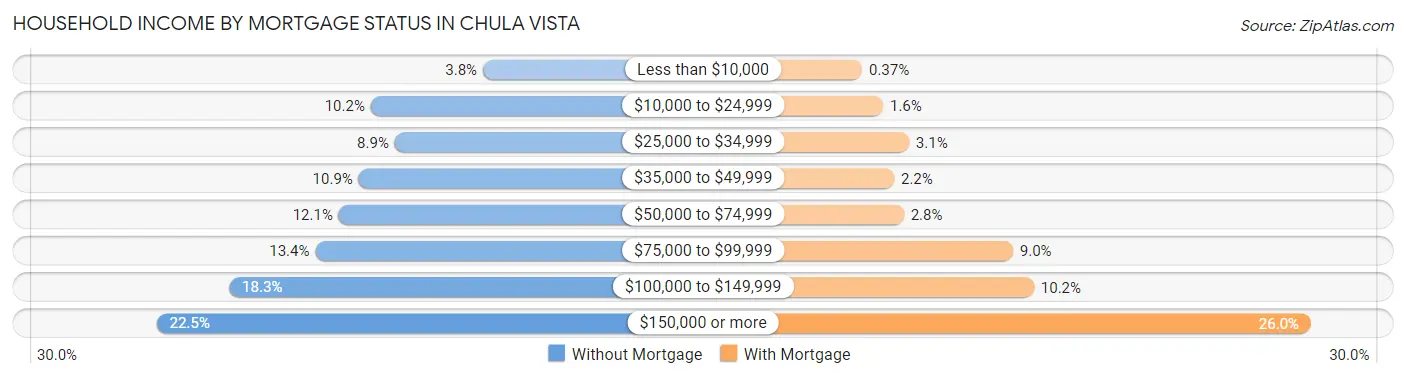
| Household Income | Without Mortgage | With Mortgage |
| Less than $10,000 | 510 (3.8%) | 136 (0.4%) |
| $10,000 to $24,999 | 1,370 (10.2%) | 573 (1.6%) |
| $25,000 to $34,999 | 1,186 (8.8%) | 1,110 (3.0%) |
| $35,000 to $49,999 | 1,462 (10.9%) | 801 (2.2%) |
| $50,000 to $74,999 | 1,615 (12.0%) | 1,001 (2.8%) |
| $75,000 to $99,999 | 1,794 (13.4%) | 3,272 (9.0%) |
| $100,000 to $149,999 | 2,453 (18.3%) | 3,710 (10.2%) |
| $150,000 or more | 3,009 (22.5%) | 9,470 (26.0%) |
| Total | 13,399 (100.0%) | 36,396 (100.0%) |
Property Value to Household Income Ratio in Chula Vista
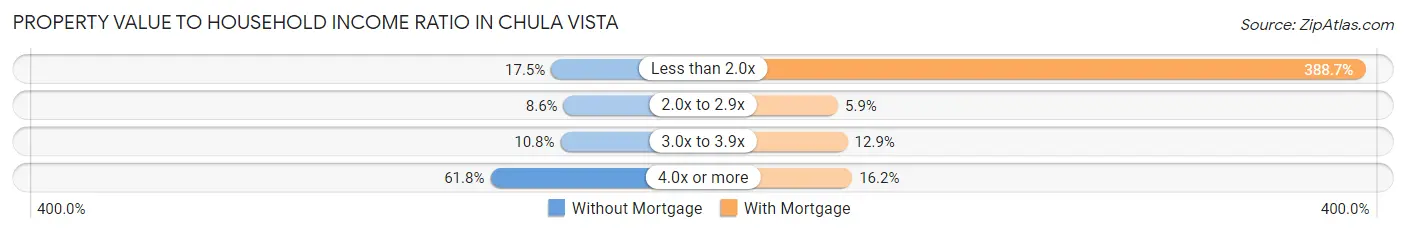
| Value-to-Income Ratio | Without Mortgage | With Mortgage |
| Less than 2.0x | 2,346 (17.5%) | 141,485 (388.7%) |
| 2.0x to 2.9x | 1,150 (8.6%) | 2,160 (5.9%) |
| 3.0x to 3.9x | 1,450 (10.8%) | 4,691 (12.9%) |
| 4.0x or more | 8,274 (61.8%) | 5,894 (16.2%) |
| Total | 13,399 (100.0%) | 36,396 (100.0%) |
Real Estate Taxes by Mortgage Status in Chula Vista
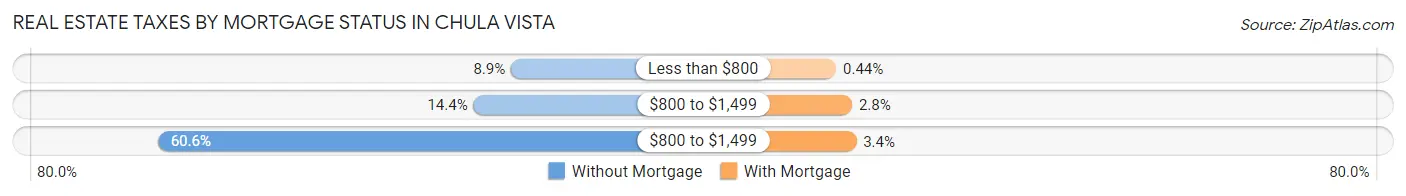
| Property Taxes | Without Mortgage | With Mortgage |
| Less than $800 | 1,195 (8.9%) | 160 (0.4%) |
| $800 to $1,499 | 1,931 (14.4%) | 1,006 (2.8%) |
| $800 to $1,499 | 8,113 (60.6%) | 1,232 (3.4%) |
| Total | 13,399 (100.0%) | 36,396 (100.0%) |
Health & Disability in Chula Vista
Health Insurance Coverage by Age in Chula Vista
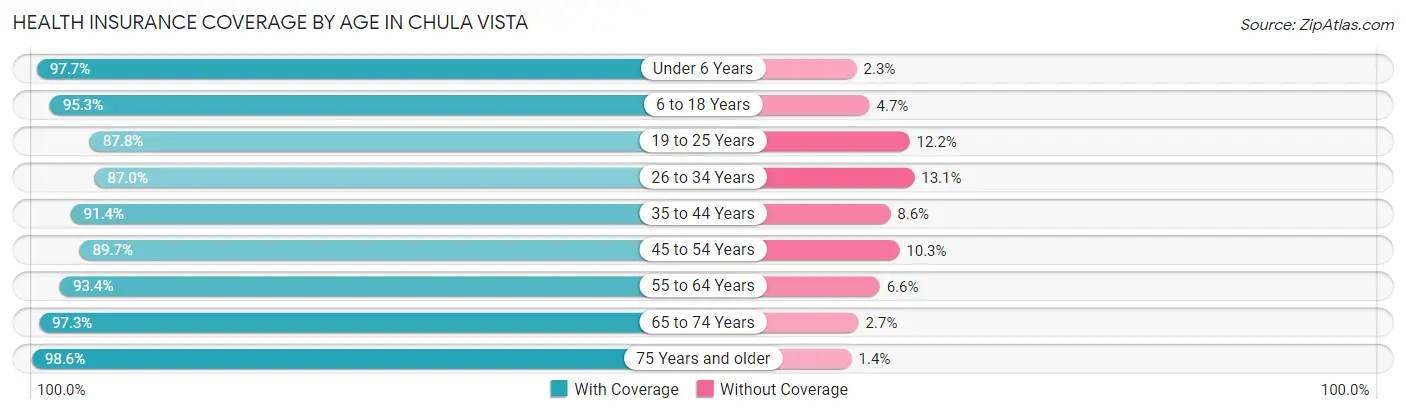
| Age Bracket | With Coverage | Without Coverage |
| Under 6 Years | 18,796 (97.7%) | 441 (2.3%) |
| 6 to 18 Years | 50,404 (95.3%) | 2,497 (4.7%) |
| 19 to 25 Years | 21,744 (87.8%) | 3,019 (12.2%) |
| 26 to 34 Years | 29,249 (87.0%) | 4,391 (13.1%) |
| 35 to 44 Years | 34,632 (91.4%) | 3,253 (8.6%) |
| 45 to 54 Years | 33,184 (89.7%) | 3,796 (10.3%) |
| 55 to 64 Years | 29,310 (93.4%) | 2,071 (6.6%) |
| 65 to 74 Years | 19,059 (97.3%) | 525 (2.7%) |
| 75 Years and older | 13,606 (98.6%) | 188 (1.4%) |
| Total | 249,984 (92.5%) | 20,181 (7.5%) |
Health Insurance Coverage by Citizenship Status in Chula Vista
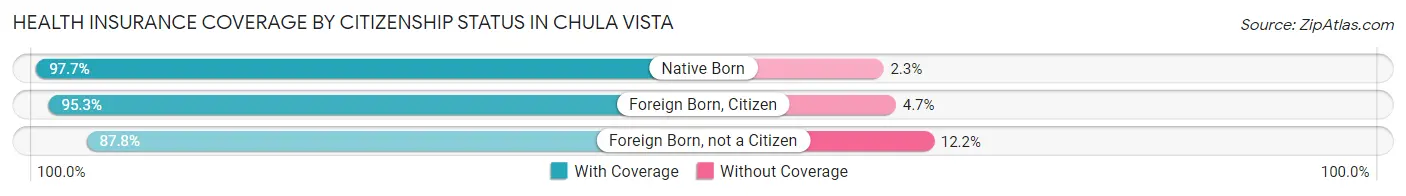
| Citizenship Status | With Coverage | Without Coverage |
| Native Born | 18,796 (97.7%) | 441 (2.3%) |
| Foreign Born, Citizen | 50,404 (95.3%) | 2,497 (4.7%) |
| Foreign Born, not a Citizen | 21,744 (87.8%) | 3,019 (12.2%) |
Health Insurance Coverage by Household Income in Chula Vista
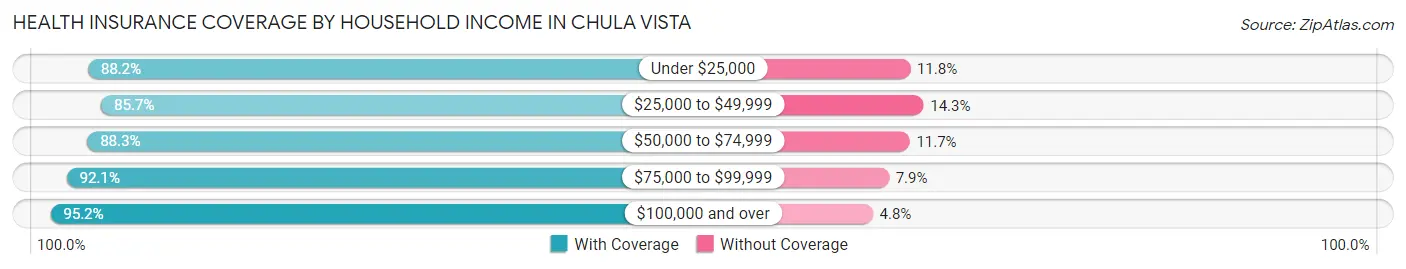
| Household Income | With Coverage | Without Coverage |
| Under $25,000 | 16,145 (88.2%) | 2,169 (11.8%) |
| $25,000 to $49,999 | 23,886 (85.7%) | 3,997 (14.3%) |
| $50,000 to $74,999 | 28,294 (88.3%) | 3,762 (11.7%) |
| $75,000 to $99,999 | 27,695 (92.1%) | 2,361 (7.9%) |
| $100,000 and over | 152,895 (95.2%) | 7,766 (4.8%) |
Public vs Private Health Insurance Coverage by Age in Chula Vista
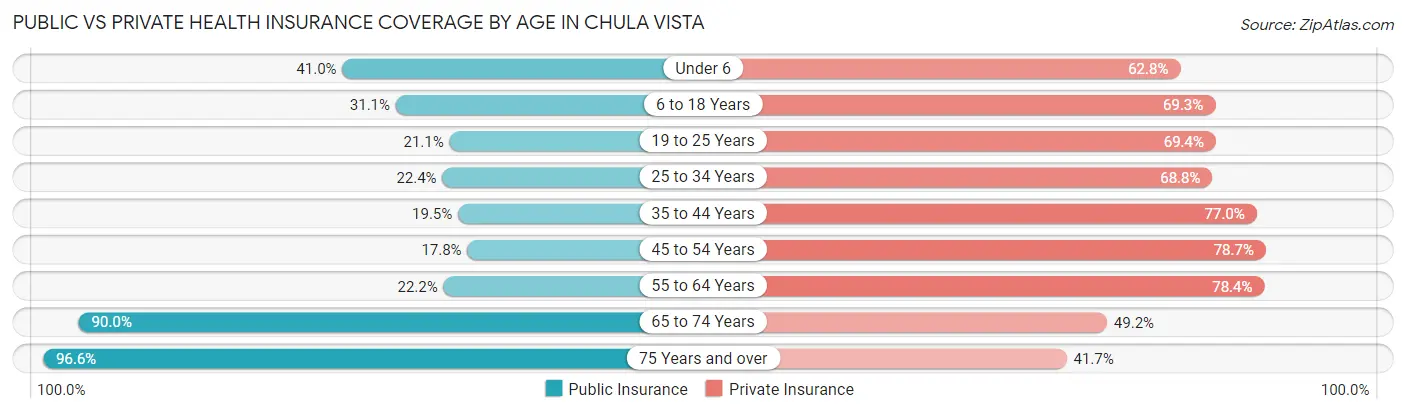
| Age Bracket | Public Insurance | Private Insurance |
| Under 6 | 7,890 (41.0%) | 12,083 (62.8%) |
| 6 to 18 Years | 16,447 (31.1%) | 36,654 (69.3%) |
| 19 to 25 Years | 5,229 (21.1%) | 17,190 (69.4%) |
| 25 to 34 Years | 7,549 (22.4%) | 23,135 (68.8%) |
| 35 to 44 Years | 7,399 (19.5%) | 29,171 (77.0%) |
| 45 to 54 Years | 6,581 (17.8%) | 29,095 (78.7%) |
| 55 to 64 Years | 6,979 (22.2%) | 24,607 (78.4%) |
| 65 to 74 Years | 17,623 (90.0%) | 9,638 (49.2%) |
| 75 Years and over | 13,324 (96.6%) | 5,755 (41.7%) |
| Total | 89,021 (33.0%) | 187,328 (69.3%) |
Disability Status by Sex by Age in Chula Vista
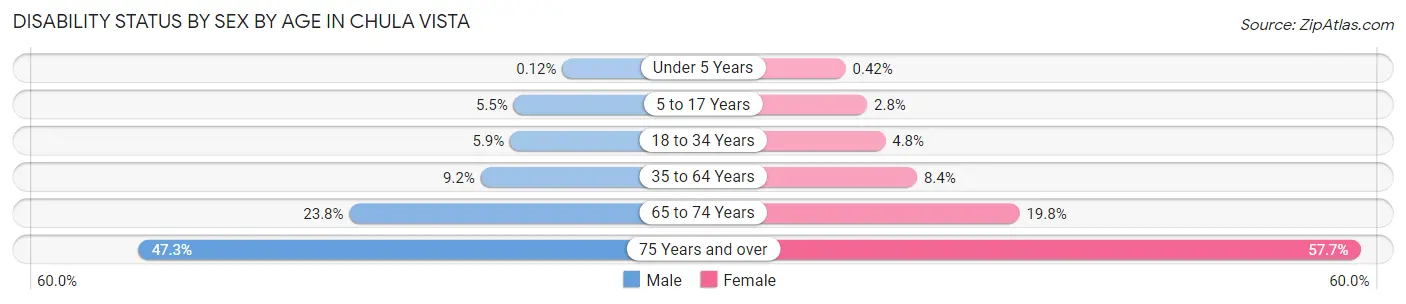
| Age Bracket | Male | Female |
| Under 5 Years | 10 (0.1%) | 31 (0.4%) |
| 5 to 17 Years | 1,421 (5.5%) | 760 (2.8%) |
| 18 to 34 Years | 1,922 (5.9%) | 1,447 (4.8%) |
| 35 to 64 Years | 4,836 (9.2%) | 4,498 (8.4%) |
| 65 to 74 Years | 2,146 (23.8%) | 2,093 (19.8%) |
| 75 Years and over | 2,535 (47.3%) | 4,869 (57.7%) |
Disability Class by Sex by Age in Chula Vista
Disability Class: Hearing Difficulty
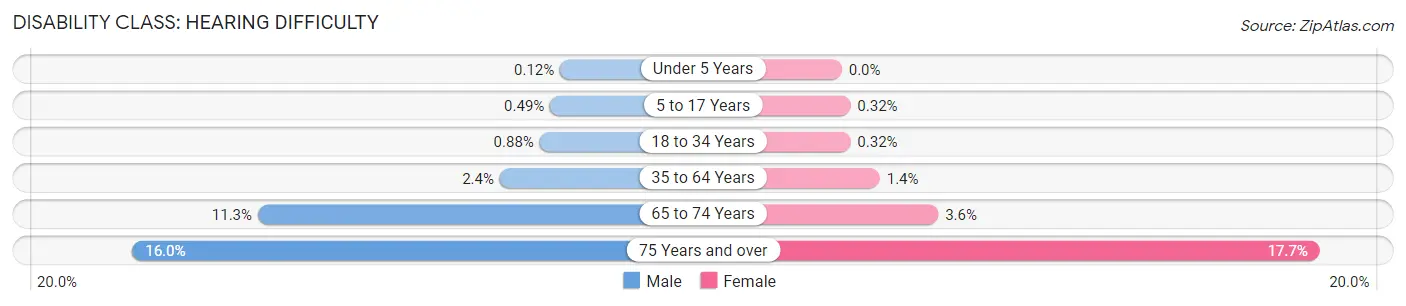
| Age Bracket | Male | Female |
| Under 5 Years | 10 (0.1%) | 0 (0.0%) |
| 5 to 17 Years | 125 (0.5%) | 87 (0.3%) |
| 18 to 34 Years | 285 (0.9%) | 96 (0.3%) |
| 35 to 64 Years | 1,239 (2.4%) | 758 (1.4%) |
| 65 to 74 Years | 1,021 (11.3%) | 379 (3.6%) |
| 75 Years and over | 858 (16.0%) | 1,496 (17.7%) |
Disability Class: Vision Difficulty
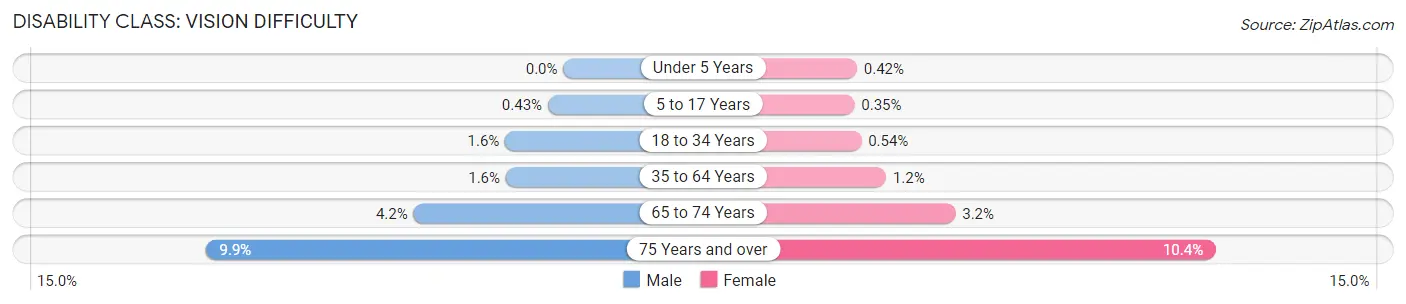
| Age Bracket | Male | Female |
| Under 5 Years | 0 (0.0%) | 31 (0.4%) |
| 5 to 17 Years | 109 (0.4%) | 93 (0.4%) |
| 18 to 34 Years | 525 (1.6%) | 160 (0.5%) |
| 35 to 64 Years | 841 (1.6%) | 661 (1.2%) |
| 65 to 74 Years | 376 (4.2%) | 334 (3.2%) |
| 75 Years and over | 533 (9.9%) | 876 (10.4%) |
Disability Class: Cognitive Difficulty
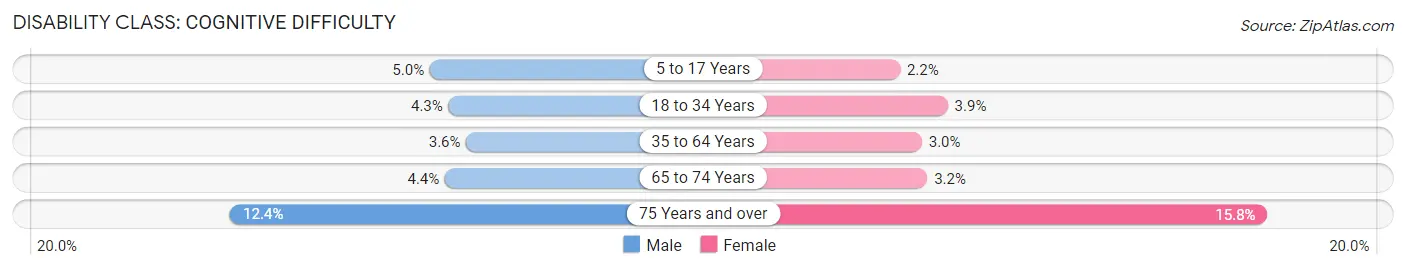
| Age Bracket | Male | Female |
| 5 to 17 Years | 1,269 (5.0%) | 581 (2.2%) |
| 18 to 34 Years | 1,380 (4.3%) | 1,175 (3.9%) |
| 35 to 64 Years | 1,891 (3.6%) | 1,596 (3.0%) |
| 65 to 74 Years | 395 (4.4%) | 335 (3.2%) |
| 75 Years and over | 663 (12.4%) | 1,332 (15.8%) |
Disability Class: Ambulatory Difficulty
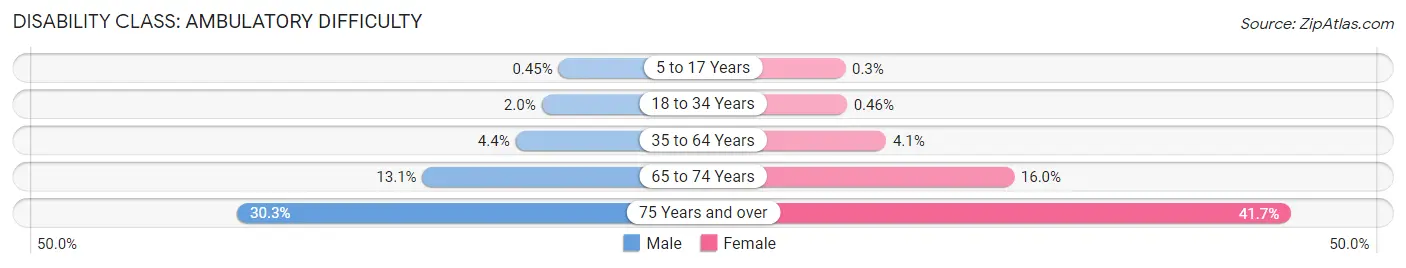
| Age Bracket | Male | Female |
| 5 to 17 Years | 116 (0.4%) | 82 (0.3%) |
| 18 to 34 Years | 658 (2.0%) | 139 (0.5%) |
| 35 to 64 Years | 2,331 (4.4%) | 2,201 (4.1%) |
| 65 to 74 Years | 1,178 (13.1%) | 1,689 (16.0%) |
| 75 Years and over | 1,623 (30.3%) | 3,516 (41.7%) |
Disability Class: Self-Care Difficulty
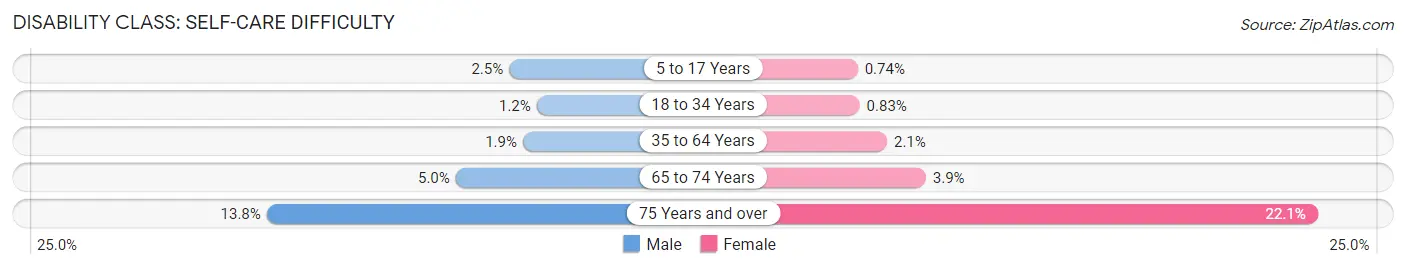
| Age Bracket | Male | Female |
| 5 to 17 Years | 647 (2.5%) | 198 (0.7%) |
| 18 to 34 Years | 401 (1.2%) | 248 (0.8%) |
| 35 to 64 Years | 987 (1.9%) | 1,126 (2.1%) |
| 65 to 74 Years | 450 (5.0%) | 413 (3.9%) |
| 75 Years and over | 738 (13.8%) | 1,862 (22.1%) |
Technology Access in Chula Vista
Computing Device Access in Chula Vista
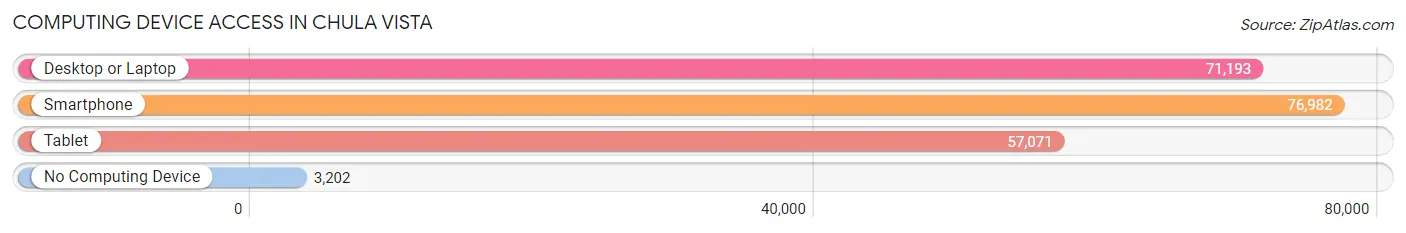
| Device Type | # Households | % Households |
| Desktop or Laptop | 71,193 | 85.7% |
| Smartphone | 76,982 | 92.7% |
| Tablet | 57,071 | 68.7% |
| No Computing Device | 3,202 | 3.8% |
| Total | 83,074 | 100.0% |
Internet Access in Chula Vista
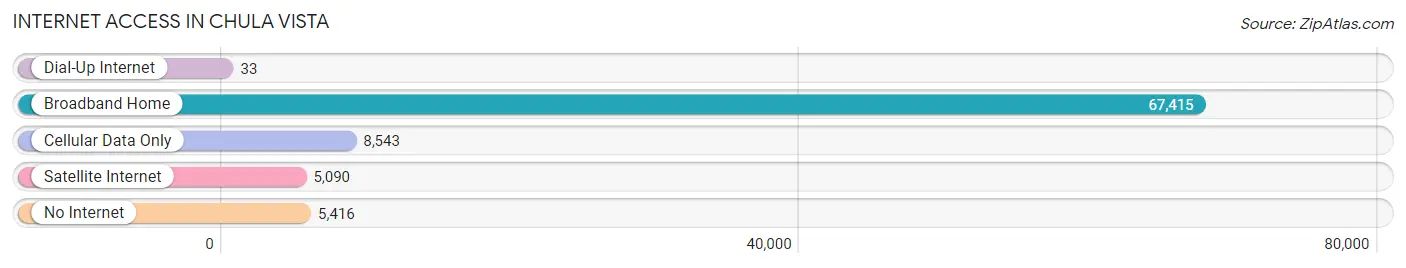
| Internet Type | # Households | % Households |
| Dial-Up Internet | 33 | 0.0% |
| Broadband Home | 67,415 | 81.1% |
| Cellular Data Only | 8,543 | 10.3% |
| Satellite Internet | 5,090 | 6.1% |
| No Internet | 5,416 | 6.5% |
| Total | 83,074 | 100.0% |
Chula Vista Summary
Chula Vista is a city located in the southwestern corner of San Diego County, California. It is the second-largest city in the county and the seventh-largest in the state. The city is bordered by the cities of San Diego, National City, and Bonita, and the Pacific Ocean. Chula Vista is known for its beautiful beaches, parks, and recreational activities.
History
Chula Vista was first settled in the late 1800s by the Spanish, who named it “Chula Vista”, which means “beautiful view”. The area was originally used for cattle ranching and farming. In the early 1900s, the city began to grow as a resort town, with the development of the Chula Vista Inn and the Chula Vista Yacht Club.
In the 1950s, the city experienced a population boom, as many people moved to the area for its affordable housing and proximity to San Diego. The city continued to grow throughout the 1960s and 1970s, and in the 1980s, the city began to focus on economic development.
Geography
Chula Vista is located in the southwestern corner of San Diego County, California. It is bordered by the cities of San Diego, National City, and Bonita, and the Pacific Ocean. The city covers an area of approximately 50 square miles and has a population of over 250,000 people.
The city is divided into several distinct neighborhoods, including Eastlake, Otay Ranch, Rancho del Rey, and Rolling Hills Ranch. The city is also home to several parks, including the Chula Vista Nature Center, the Otay Valley Regional Park, and the San Diego Bay National Wildlife Refuge.
Economy
Chula Vista is home to a diverse economy, with a variety of industries represented. The city is home to several major employers, including the Chula Vista Medical Center, the Southwestern College, and the Chula Vista Elementary School District. The city is also home to several retail and commercial businesses, including the Chula Vista Shopping Center, the Otay Ranch Town Center, and the Chula Vista Marina.
The city is also home to several technology companies, including Qualcomm, Sony, and Hewlett-Packard. The city is also home to several military bases, including the Naval Base San Diego and the Marine Corps Air Station Miramar.
Demographics
As of the 2010 census, the population of Chula Vista was 243,916. The racial makeup of the city was 57.2% White, 5.3% African American, 0.7% Native American, 18.2% Asian, 0.5% Pacific Islander, 11.3% from other races, and 7.1% from two or more races. Hispanic or Latino of any race were 33.7% of the population.
The median income for a household in the city was $60,837, and the median income for a family was $68,945. The per capita income for the city was $25,845. About 11.2% of families and 14.2% of the population were below the poverty line, including 19.2% of those under age 18 and 8.2% of those age 65 or over.
Chula Vista is a diverse and vibrant city, with a rich history and a bright future. The city is home to a variety of industries, businesses, and recreational activities, making it an ideal place to live, work, and play.
Common Questions
What is Per Capita Income in Chula Vista?
Per Capita income in Chula Vista is $37,618.
What is the Median Family Income in Chula Vista?
Median Family Income in Chula Vista is $112,818.
What is the Median Household income in Chula Vista?
Median Household Income in Chula Vista is $101,984.
What is Income or Wage Gap in Chula Vista?
Income or Wage Gap in Chula Vista is 29.1%.
Women in Chula Vista earn 70.9 cents for every dollar earned by a man.
What is Family Income Deficit in Chula Vista?
Family Income Deficit in Chula Vista is $11,329.
Families that are below poverty line in Chula Vista earn $11,329 less on average than the poverty threshold level.
What is Inequality or Gini Index in Chula Vista?
Inequality or Gini Index in Chula Vista is 0.41.
What is the Total Population of Chula Vista?
Total Population of Chula Vista is 276,103.
What is the Total Male Population of Chula Vista?
Total Male Population of Chula Vista is 137,744.
What is the Total Female Population of Chula Vista?
Total Female Population of Chula Vista is 138,359.
What is the Ratio of Males per 100 Females in Chula Vista?
There are 99.56 Males per 100 Females in Chula Vista.
What is the Ratio of Females per 100 Males in Chula Vista?
There are 100.45 Females per 100 Males in Chula Vista.
What is the Median Population Age in Chula Vista?
Median Population Age in Chula Vista is 36.1 Years.
What is the Average Family Size in Chula Vista
Average Family Size in Chula Vista is 3.7 People.
What is the Average Household Size in Chula Vista
Average Household Size in Chula Vista is 3.3 People.
How Large is the Labor Force in Chula Vista?
There are 144,663 People in the Labor Forcein in Chula Vista.
What is the Percentage of People in the Labor Force in Chula Vista?
66.9% of People are in the Labor Force in Chula Vista.
What is the Unemployment Rate in Chula Vista?
Unemployment Rate in Chula Vista is 8.8%.