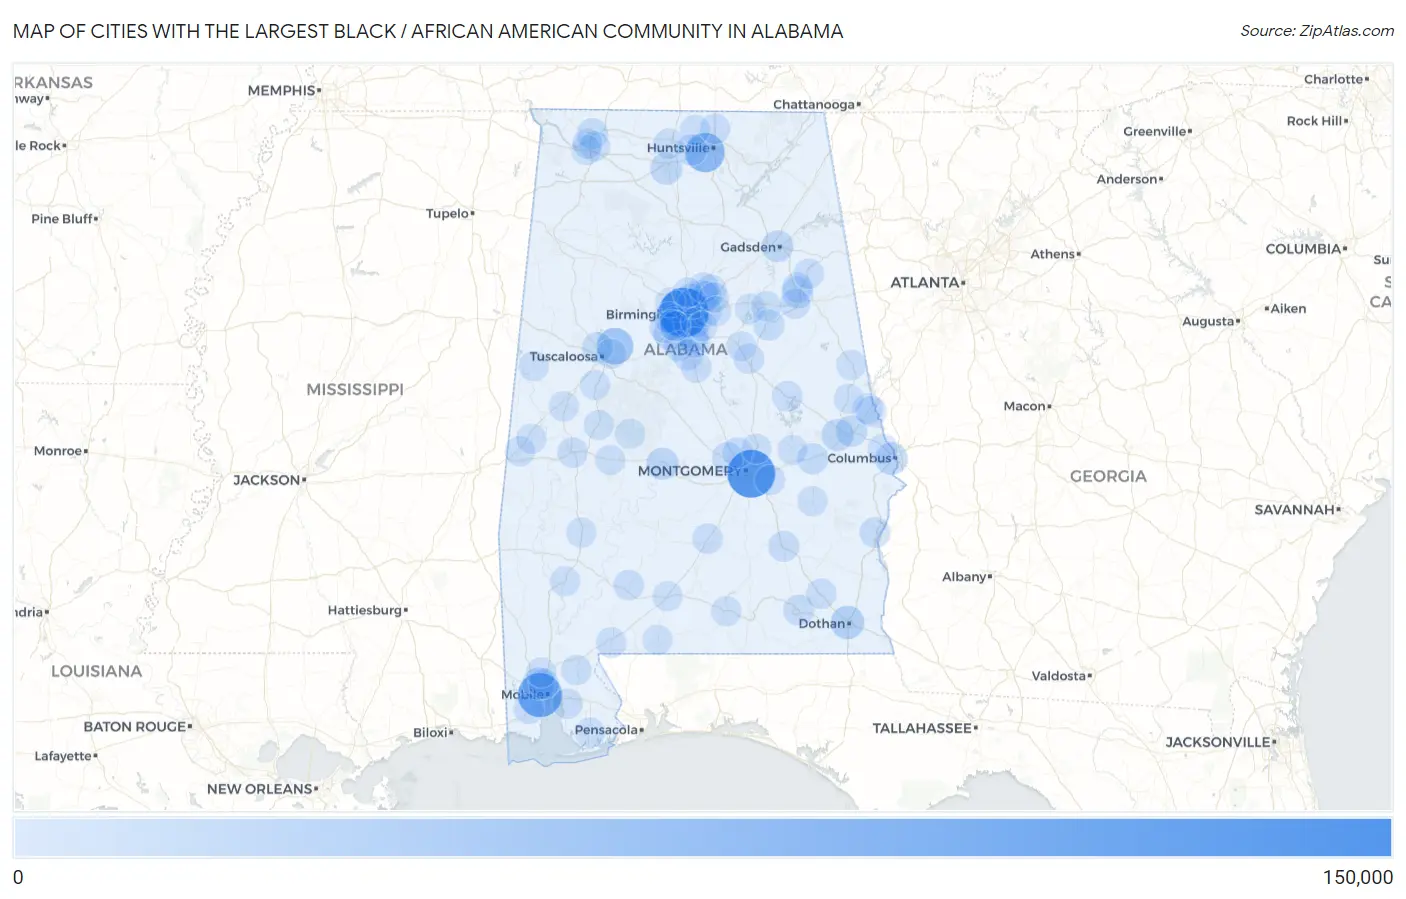
Cities with the Largest Black / African American Community in Alabama
RELATED REPORTS & OPTIONS
Black / African American
Alabama
Compare Cities
Map of Cities with the Largest Black / African American Community in Alabama
0
150,000
Cities with the Largest Black / African American Community in Alabama
| City | Black / African American | vs State | vs National | |
| 1. | Birmingham | 137,487 | 1,326,341(10.37%)#1 | 41,288,572(0.33%)#24 |
| 2. | Montgomery | 125,354 | 1,326,341(9.45%)#2 | 41,288,572(0.30%)#30 |
| 3. | Mobile | 98,951 | 1,326,341(7.46%)#3 | 41,288,572(0.24%)#38 |
| 4. | Huntsville | 65,393 | 1,326,341(4.93%)#4 | 41,288,572(0.16%)#68 |
| 5. | Tuscaloosa | 45,340 | 1,326,341(3.42%)#5 | 41,288,572(0.11%)#102 |
| 6. | Dothan | 24,680 | 1,326,341(1.86%)#6 | 41,288,572(0.06%)#204 |
| 7. | Bessemer | 18,628 | 1,326,341(1.40%)#7 | 41,288,572(0.05%)#279 |
| 8. | Phenix City | 18,517 | 1,326,341(1.40%)#8 | 41,288,572(0.04%)#281 |
| 9. | Hoover | 18,210 | 1,326,341(1.37%)#9 | 41,288,572(0.04%)#287 |
| 10. | Prichard | 17,432 | 1,326,341(1.31%)#10 | 41,288,572(0.04%)#299 |
| 11. | Selma | 14,186 | 1,326,341(1.07%)#11 | 41,288,572(0.03%)#370 |
| 12. | Decatur | 13,810 | 1,326,341(1.04%)#12 | 41,288,572(0.03%)#381 |
| 13. | Auburn | 13,729 | 1,326,341(1.04%)#13 | 41,288,572(0.03%)#384 |
| 14. | Gadsden | 12,741 | 1,326,341(0.96%)#14 | 41,288,572(0.03%)#425 |
| 15. | Center Point | 11,819 | 1,326,341(0.89%)#15 | 41,288,572(0.03%)#465 |
| 16. | Opelika | 11,456 | 1,326,341(0.86%)#16 | 41,288,572(0.03%)#481 |
| 17. | Anniston | 10,844 | 1,326,341(0.82%)#17 | 41,288,572(0.03%)#509 |
| 18. | Fairfield | 9,233 | 1,326,341(0.70%)#18 | 41,288,572(0.02%)#608 |
| 19. | Madison | 8,409 | 1,326,341(0.63%)#19 | 41,288,572(0.02%)#672 |
| 20. | Northport | 8,318 | 1,326,341(0.63%)#20 | 41,288,572(0.02%)#682 |
| 21. | Tuskegee | 8,149 | 1,326,341(0.61%)#21 | 41,288,572(0.02%)#690 |
| 22. | Talladega | 8,132 | 1,326,341(0.61%)#22 | 41,288,572(0.02%)#692 |
| 23. | Florence | 7,609 | 1,326,341(0.57%)#23 | 41,288,572(0.02%)#744 |
| 24. | Prattville | 7,479 | 1,326,341(0.56%)#24 | 41,288,572(0.02%)#757 |
| 25. | Troy | 7,189 | 1,326,341(0.54%)#25 | 41,288,572(0.02%)#782 |
| 26. | Forestdale | 6,975 | 1,326,341(0.53%)#26 | 41,288,572(0.02%)#797 |
| 27. | Hueytown | 6,795 | 1,326,341(0.51%)#27 | 41,288,572(0.02%)#811 |
| 28. | Enterprise | 6,498 | 1,326,341(0.49%)#28 | 41,288,572(0.02%)#839 |
| 29. | Mccalla | 6,293 | 1,326,341(0.47%)#29 | 41,288,572(0.02%)#865 |
| 30. | Pleasant Grove | 6,255 | 1,326,341(0.47%)#30 | 41,288,572(0.02%)#871 |
| 31. | Alabaster | 5,884 | 1,326,341(0.44%)#31 | 41,288,572(0.01%)#918 |
| 32. | Eufaula | 5,673 | 1,326,341(0.43%)#32 | 41,288,572(0.01%)#951 |
| 33. | Lanett | 4,918 | 1,326,341(0.37%)#33 | 41,288,572(0.01%)#1,071 |
| 34. | Alexander City | 4,893 | 1,326,341(0.37%)#34 | 41,288,572(0.01%)#1,075 |
| 35. | Calera | 4,789 | 1,326,341(0.36%)#35 | 41,288,572(0.01%)#1,091 |
| 36. | Athens | 4,692 | 1,326,341(0.35%)#36 | 41,288,572(0.01%)#1,111 |
| 37. | Atmore | 4,660 | 1,326,341(0.35%)#37 | 41,288,572(0.01%)#1,122 |
| 38. | Clay | 4,540 | 1,326,341(0.34%)#38 | 41,288,572(0.01%)#1,148 |
| 39. | Greenville | 4,516 | 1,326,341(0.34%)#39 | 41,288,572(0.01%)#1,153 |
| 40. | Irondale | 4,328 | 1,326,341(0.33%)#40 | 41,288,572(0.01%)#1,190 |
| 41. | Midfield | 4,328 | 1,326,341(0.33%)#41 | 41,288,572(0.01%)#1,191 |
| 42. | Ozark | 4,293 | 1,326,341(0.32%)#42 | 41,288,572(0.01%)#1,200 |
| 43. | Millbrook | 4,025 | 1,326,341(0.30%)#43 | 41,288,572(0.01%)#1,279 |
| 44. | Valley | 4,011 | 1,326,341(0.30%)#44 | 41,288,572(0.01%)#1,286 |
| 45. | Daphne | 4,007 | 1,326,341(0.30%)#45 | 41,288,572(0.01%)#1,288 |
| 46. | Helena | 3,931 | 1,326,341(0.30%)#46 | 41,288,572(0.01%)#1,308 |
| 47. | Sylacauga | 3,882 | 1,326,341(0.29%)#47 | 41,288,572(0.01%)#1,317 |
| 48. | Monroeville | 3,857 | 1,326,341(0.29%)#48 | 41,288,572(0.01%)#1,326 |
| 49. | Homewood | 3,806 | 1,326,341(0.29%)#49 | 41,288,572(0.01%)#1,341 |
| 50. | Saks | 3,670 | 1,326,341(0.28%)#50 | 41,288,572(0.01%)#1,375 |
| 51. | Oxford | 3,598 | 1,326,341(0.27%)#51 | 41,288,572(0.01%)#1,399 |
| 52. | Jacksonville | 3,460 | 1,326,341(0.26%)#52 | 41,288,572(0.01%)#1,438 |
| 53. | Demopolis | 3,351 | 1,326,341(0.25%)#53 | 41,288,572(0.01%)#1,473 |
| 54. | Fultondale | 3,350 | 1,326,341(0.25%)#54 | 41,288,572(0.01%)#1,476 |
| 55. | Tillmans Corner | 3,332 | 1,326,341(0.25%)#55 | 41,288,572(0.01%)#1,489 |
| 56. | Bay Minette | 3,263 | 1,326,341(0.25%)#56 | 41,288,572(0.01%)#1,512 |
| 57. | Grayson Valley | 3,152 | 1,326,341(0.24%)#57 | 41,288,572(0.01%)#1,557 |
| 58. | Chickasaw | 3,147 | 1,326,341(0.24%)#58 | 41,288,572(0.01%)#1,558 |
| 59. | Tarrant | 3,049 | 1,326,341(0.23%)#59 | 41,288,572(0.01%)#1,599 |
| 60. | Meridianville | 3,000 | 1,326,341(0.23%)#60 | 41,288,572(0.01%)#1,620 |
| 61. | Pinson | 2,978 | 1,326,341(0.22%)#61 | 41,288,572(0.01%)#1,629 |
| 62. | Pike Road | 2,832 | 1,326,341(0.21%)#62 | 41,288,572(0.01%)#1,690 |
| 63. | Pelham | 2,818 | 1,326,341(0.21%)#63 | 41,288,572(0.01%)#1,692 |
| 64. | Evergreen | 2,610 | 1,326,341(0.20%)#64 | 41,288,572(0.01%)#1,787 |
| 65. | Adamsville | 2,453 | 1,326,341(0.18%)#65 | 41,288,572(0.01%)#1,889 |
| 66. | Saraland | 2,424 | 1,326,341(0.18%)#66 | 41,288,572(0.01%)#1,911 |
| 67. | Muscle Shoals | 2,410 | 1,326,341(0.18%)#67 | 41,288,572(0.01%)#1,919 |
| 68. | Roanoke | 2,368 | 1,326,341(0.18%)#68 | 41,288,572(0.01%)#1,945 |
| 69. | Trussville | 2,321 | 1,326,341(0.17%)#69 | 41,288,572(0.01%)#1,976 |
| 70. | Brighton | 2,264 | 1,326,341(0.17%)#70 | 41,288,572(0.01%)#2,008 |
| 71. | Pell City | 2,259 | 1,326,341(0.17%)#71 | 41,288,572(0.01%)#2,012 |
| 72. | Union Springs | 2,231 | 1,326,341(0.17%)#72 | 41,288,572(0.01%)#2,023 |
| 73. | Tuscumbia | 2,213 | 1,326,341(0.17%)#73 | 41,288,572(0.01%)#2,039 |
| 74. | Wetumpka | 2,175 | 1,326,341(0.16%)#74 | 41,288,572(0.01%)#2,069 |
| 75. | Sheffield | 2,156 | 1,326,341(0.16%)#75 | 41,288,572(0.01%)#2,085 |
| 76. | Eutaw | 2,154 | 1,326,341(0.16%)#76 | 41,288,572(0.01%)#2,086 |
| 77. | Thomasville | 2,129 | 1,326,341(0.16%)#77 | 41,288,572(0.01%)#2,110 |
| 78. | Gardendale | 2,109 | 1,326,341(0.16%)#78 | 41,288,572(0.01%)#2,132 |
| 79. | Marion | 2,093 | 1,326,341(0.16%)#79 | 41,288,572(0.01%)#2,141 |
| 80. | Andalusia | 2,084 | 1,326,341(0.16%)#80 | 41,288,572(0.01%)#2,152 |
| 81. | Vestavia Hills | 2,080 | 1,326,341(0.16%)#81 | 41,288,572(0.01%)#2,156 |
| 82. | York | 2,053 | 1,326,341(0.15%)#82 | 41,288,572(0.00%)#2,179 |
| 83. | Jackson | 1,992 | 1,326,341(0.15%)#83 | 41,288,572(0.00%)#2,224 |
| 84. | Aliceville | 1,911 | 1,326,341(0.14%)#84 | 41,288,572(0.00%)#2,297 |
| 85. | Childersburg | 1,889 | 1,326,341(0.14%)#85 | 41,288,572(0.00%)#2,316 |
| 86. | Livingston | 1,851 | 1,326,341(0.14%)#86 | 41,288,572(0.00%)#2,345 |
| 87. | Leeds | 1,834 | 1,326,341(0.14%)#87 | 41,288,572(0.00%)#2,358 |
| 88. | Lincoln | 1,823 | 1,326,341(0.14%)#88 | 41,288,572(0.00%)#2,364 |
| 89. | Brook Highland | 1,785 | 1,326,341(0.13%)#89 | 41,288,572(0.00%)#2,394 |
| 90. | Harvest | 1,784 | 1,326,341(0.13%)#90 | 41,288,572(0.00%)#2,396 |
| 91. | La Fayette | 1,783 | 1,326,341(0.13%)#91 | 41,288,572(0.00%)#2,400 |
| 92. | Smiths Station | 1,726 | 1,326,341(0.13%)#92 | 41,288,572(0.00%)#2,443 |
| 93. | Greensboro | 1,702 | 1,326,341(0.13%)#93 | 41,288,572(0.00%)#2,459 |
| 94. | Uniontown | 1,670 | 1,326,341(0.13%)#94 | 41,288,572(0.00%)#2,478 |
| 95. | Brewton | 1,668 | 1,326,341(0.13%)#95 | 41,288,572(0.00%)#2,480 |
| 96. | Holt | 1,651 | 1,326,341(0.12%)#96 | 41,288,572(0.00%)#2,501 |
| 97. | Lipscomb | 1,651 | 1,326,341(0.12%)#97 | 41,288,572(0.00%)#2,502 |
| 98. | Foley | 1,631 | 1,326,341(0.12%)#98 | 41,288,572(0.00%)#2,527 |
| 99. | Moundville | 1,629 | 1,326,341(0.12%)#99 | 41,288,572(0.00%)#2,528 |
| 100. | Tallassee | 1,575 | 1,326,341(0.12%)#100 | 41,288,572(0.00%)#2,586 |
Common Questions
What are the Top 10 Cities with the Largest Black / African American Community in Alabama?
Top 10 Cities with the Largest Black / African American Community in Alabama are:
#1
137,487
#2
125,354
#3
98,951
#4
65,393
#5
45,340
#6
24,680
#7
18,628
#8
18,517
#9
18,210
#10
17,432
What city has the Largest Black / African American Community in Alabama?
Birmingham has the Largest Black / African American Community in Alabama with 137,487.
What is the Total Black / African American Population in the State of Alabama?
Total Black / African American Population in Alabama is 1,326,341.
What is the Total Black / African American Population in the United States?
Total Black / African American Population in the United States is 41,288,572.