Upland, CA Map & Demographics
Upland Map
Upland Overview
$42,026
PER CAPITA INCOME
$104,246
AVG FAMILY INCOME
$93,994
AVG HOUSEHOLD INCOME
29.5%
WAGE / INCOME GAP [ % ]
70.5¢/ $1
WAGE / INCOME GAP [ $ ]
$11,238
FAMILY INCOME DEFICIT
0.44
INEQUALITY / GINI INDEX
78,847
TOTAL POPULATION
37,933
MALE POPULATION
40,914
FEMALE POPULATION
92.71
MALES / 100 FEMALES
107.86
FEMALES / 100 MALES
37.1
MEDIAN AGE
3.3
AVG FAMILY SIZE
2.9
AVG HOUSEHOLD SIZE
42,360
LABOR FORCE [ PEOPLE ]
66.2%
PERCENT IN LABOR FORCE
4.9%
UNEMPLOYMENT RATE
Upland Area Codes
Income in Upland
Income Overview in Upland
Per Capita Income in Upland is $42,026, while median incomes of families and households are $104,246 and $93,994 respectively.
| Characteristic | Number | Measure |
| Per Capita Income | 78,847 | $42,026 |
| Median Family Income | 19,573 | $104,246 |
| Mean Family Income | 19,573 | $132,716 |
| Median Household Income | 27,237 | $93,994 |
| Mean Household Income | 27,237 | $118,667 |
| Income Deficit | 19,573 | $11,238 |
| Wage / Income Gap (%) | 78,847 | 29.48% |
| Wage / Income Gap ($) | 78,847 | 70.52¢ per $1 |
| Gini / Inequality Index | 78,847 | 0.44 |
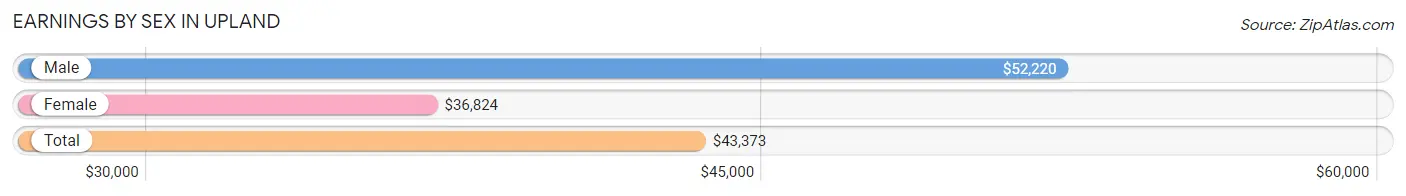
Earnings by Sex in Upland
Average Earnings in Upland are $43,373, $52,220 for men and $36,824 for women, a difference of 29.5%.
| Sex | Number | Average Earnings |
| Male | 22,580 (52.1%) | $52,220 |
| Female | 20,749 (47.9%) | $36,824 |
| Total | 43,329 (100.0%) | $43,373 |
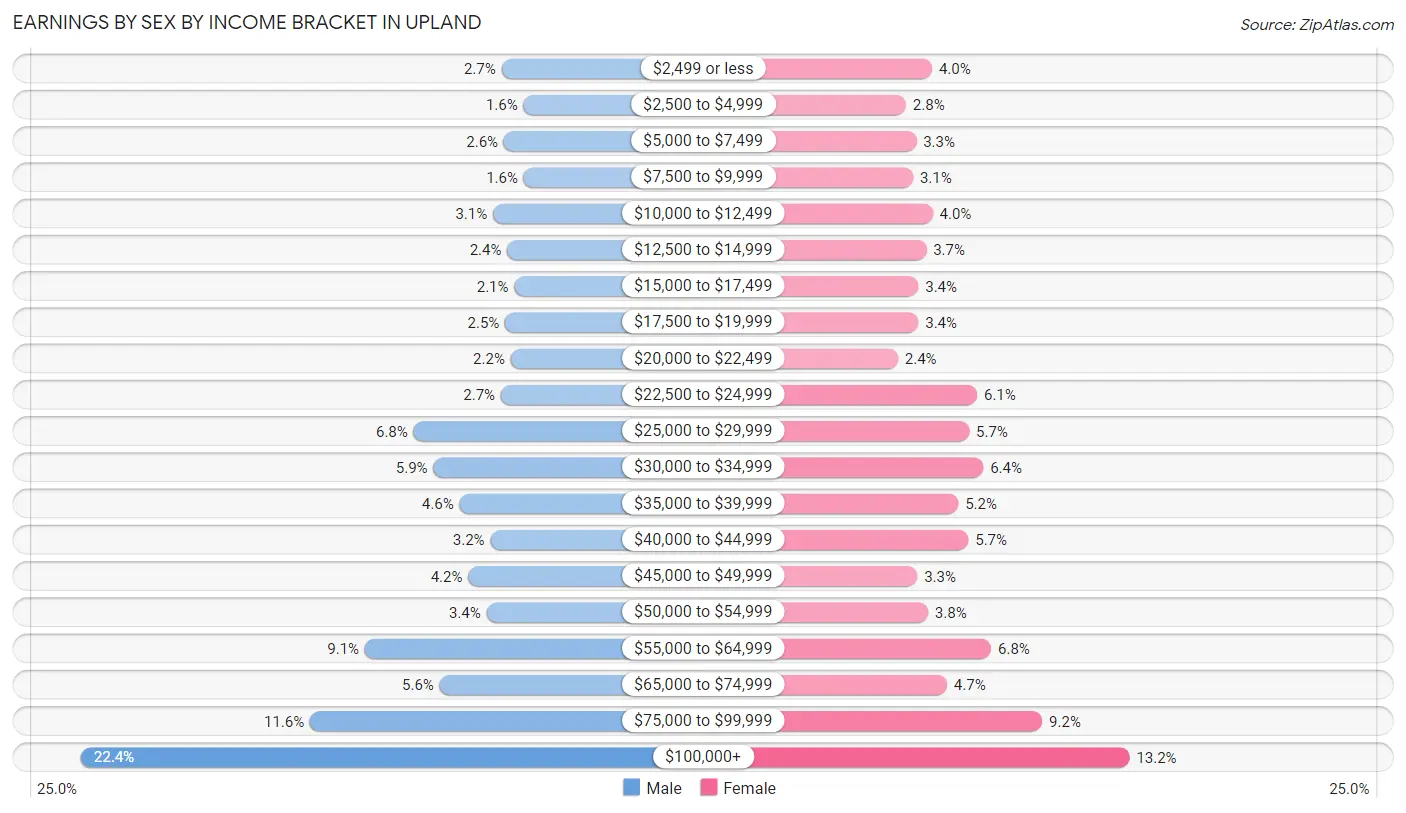
Earnings by Sex by Income Bracket in Upland
The most common earnings brackets in Upland are $100,000+ for men (5,048 | 22.4%) and $100,000+ for women (2,747 | 13.2%).
| Income | Male | Female |
| $2,499 or less | 600 (2.7%) | 828 (4.0%) |
| $2,500 to $4,999 | 367 (1.6%) | 575 (2.8%) |
| $5,000 to $7,499 | 575 (2.5%) | 675 (3.3%) |
| $7,500 to $9,999 | 365 (1.6%) | 644 (3.1%) |
| $10,000 to $12,499 | 692 (3.1%) | 835 (4.0%) |
| $12,500 to $14,999 | 539 (2.4%) | 772 (3.7%) |
| $15,000 to $17,499 | 466 (2.1%) | 695 (3.4%) |
| $17,500 to $19,999 | 562 (2.5%) | 695 (3.4%) |
| $20,000 to $22,499 | 503 (2.2%) | 496 (2.4%) |
| $22,500 to $24,999 | 607 (2.7%) | 1,265 (6.1%) |
| $25,000 to $29,999 | 1,532 (6.8%) | 1,188 (5.7%) |
| $30,000 to $34,999 | 1,321 (5.9%) | 1,325 (6.4%) |
| $35,000 to $39,999 | 1,046 (4.6%) | 1,083 (5.2%) |
| $40,000 to $44,999 | 719 (3.2%) | 1,180 (5.7%) |
| $45,000 to $49,999 | 952 (4.2%) | 684 (3.3%) |
| $50,000 to $54,999 | 759 (3.4%) | 789 (3.8%) |
| $55,000 to $64,999 | 2,045 (9.1%) | 1,402 (6.8%) |
| $65,000 to $74,999 | 1,255 (5.6%) | 973 (4.7%) |
| $75,000 to $99,999 | 2,627 (11.6%) | 1,898 (9.1%) |
| $100,000+ | 5,048 (22.4%) | 2,747 (13.2%) |
| Total | 22,580 (100.0%) | 20,749 (100.0%) |
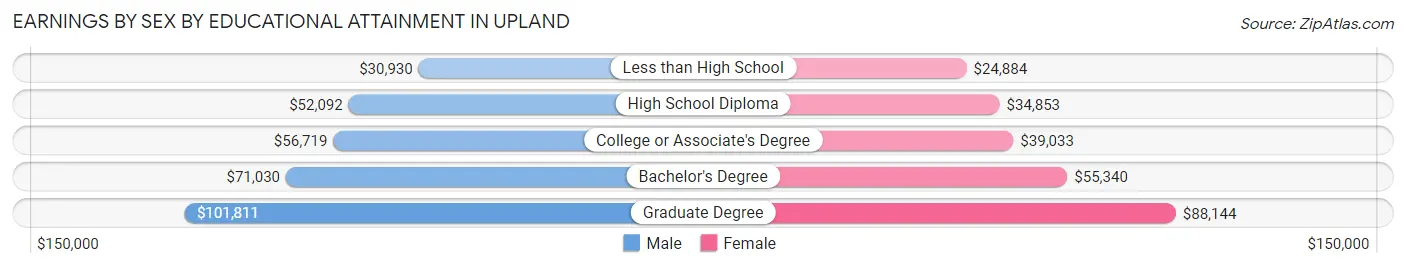
Earnings by Sex by Educational Attainment in Upland
Average earnings in Upland are $59,852 for men and $42,703 for women, a difference of 28.6%. Men with an educational attainment of graduate degree enjoy the highest average annual earnings of $101,811, while those with less than high school education earn the least with $30,930. Women with an educational attainment of graduate degree earn the most with the average annual earnings of $88,144, while those with less than high school education have the smallest earnings of $24,884.
| Educational Attainment | Male Income | Female Income |
| Less than High School | $30,930 | $24,884 |
| High School Diploma | $52,092 | $34,853 |
| College or Associate's Degree | $56,719 | $39,033 |
| Bachelor's Degree | $71,030 | $55,340 |
| Graduate Degree | $101,811 | $88,144 |
| Total | $59,852 | $42,703 |
Family Income in Upland
Family Income Brackets in Upland
According to the Upland family income data, there are 3,895 families falling into the $100,000 to $149,999 income range, which is the most common income bracket and makes up 19.9% of all families. Conversely, the $10,000 to $14,999 income bracket is the least frequent group with only 372 families (1.9%) belonging to this category.
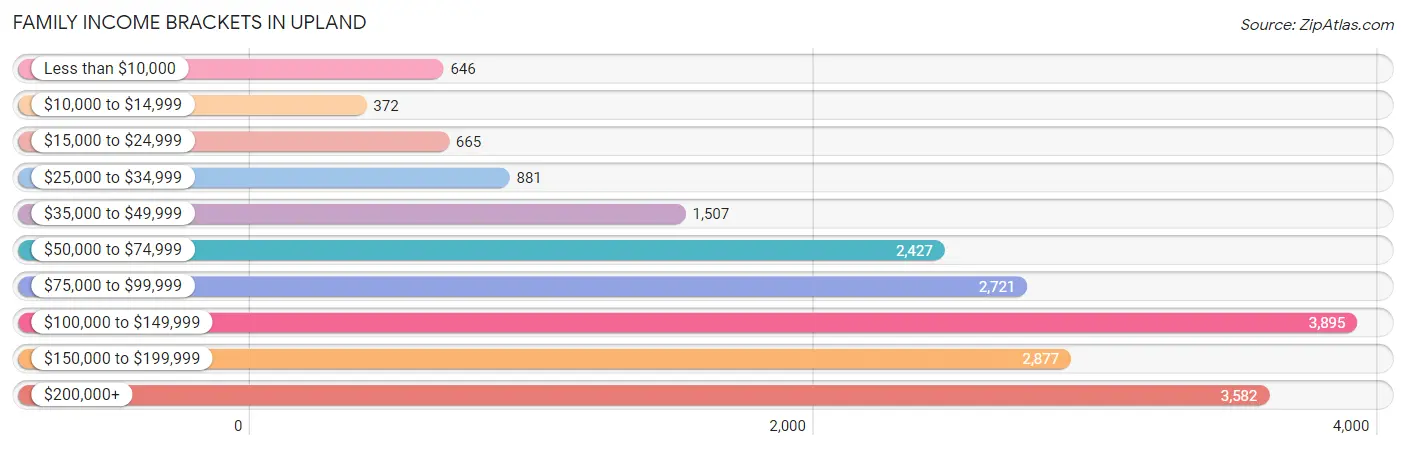
| Income Bracket | # Families | % Families |
| Less than $10,000 | 646 | 3.3% |
| $10,000 to $14,999 | 372 | 1.9% |
| $15,000 to $24,999 | 665 | 3.4% |
| $25,000 to $34,999 | 881 | 4.5% |
| $35,000 to $49,999 | 1,507 | 7.7% |
| $50,000 to $74,999 | 2,427 | 12.4% |
| $75,000 to $99,999 | 2,721 | 13.9% |
| $100,000 to $149,999 | 3,895 | 19.9% |
| $150,000 to $199,999 | 2,877 | 14.7% |
| $200,000+ | 3,582 | 18.3% |
Family Income by Famaliy Size in Upland
7+ person families (263 | 1.3%) account for the highest median family income in Upland with $142,880 per family, while 2-person families (8,329 | 42.5%) have the highest median income of $43,649 per family member.
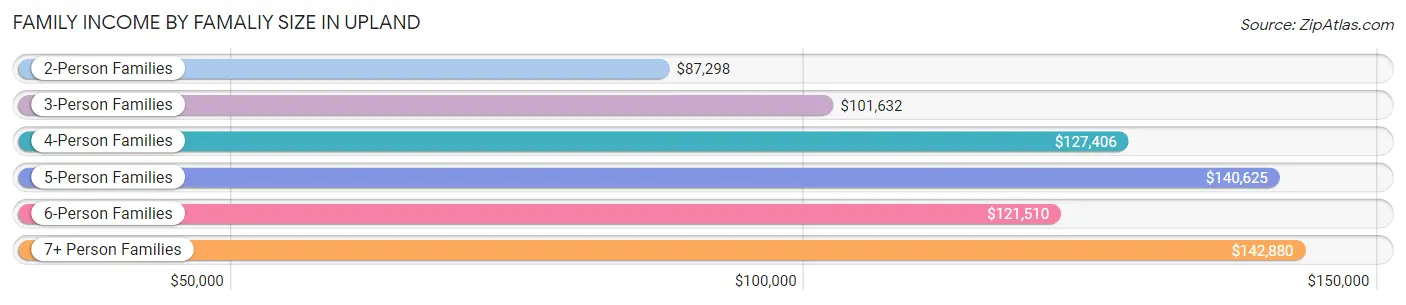
| Income Bracket | # Families | Median Income |
| 2-Person Families | 8,329 (42.5%) | $87,298 |
| 3-Person Families | 4,001 (20.4%) | $101,632 |
| 4-Person Families | 4,525 (23.1%) | $127,406 |
| 5-Person Families | 1,702 (8.7%) | $140,625 |
| 6-Person Families | 753 (3.8%) | $121,510 |
| 7+ Person Families | 263 (1.3%) | $142,880 |
| Total | 19,573 (100.0%) | $104,246 |
Family Income by Number of Earners in Upland
The median family income in Upland is $104,246, with families comprising 3+ earners (3,091) having the highest median family income of $163,750, while families with no earners (2,291) have the lowest median family income of $54,349, accounting for 15.8% and 11.7% of families, respectively.
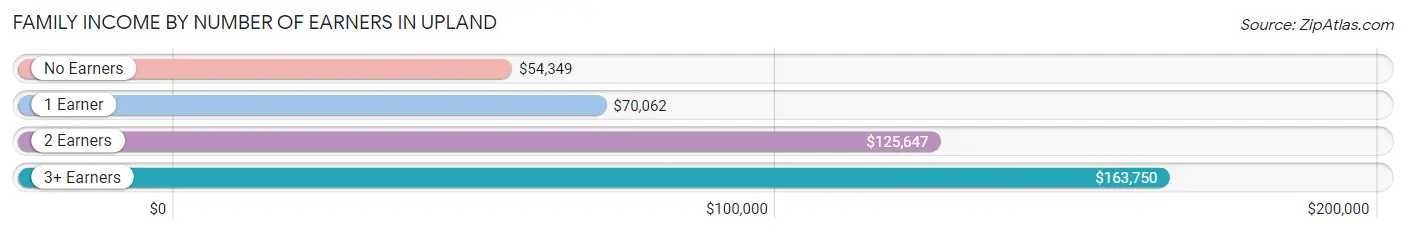
| Number of Earners | # Families | Median Income |
| No Earners | 2,291 (11.7%) | $54,349 |
| 1 Earner | 5,859 (29.9%) | $70,062 |
| 2 Earners | 8,332 (42.6%) | $125,647 |
| 3+ Earners | 3,091 (15.8%) | $163,750 |
| Total | 19,573 (100.0%) | $104,246 |
Household Income in Upland
Household Income Brackets in Upland
With 4,957 households falling in the category, the $100,000 to $149,999 income range is the most frequent in Upland, accounting for 18.2% of all households. In contrast, only 763 households (2.8%) fall into the $10,000 to $14,999 income bracket, making it the least populous group.
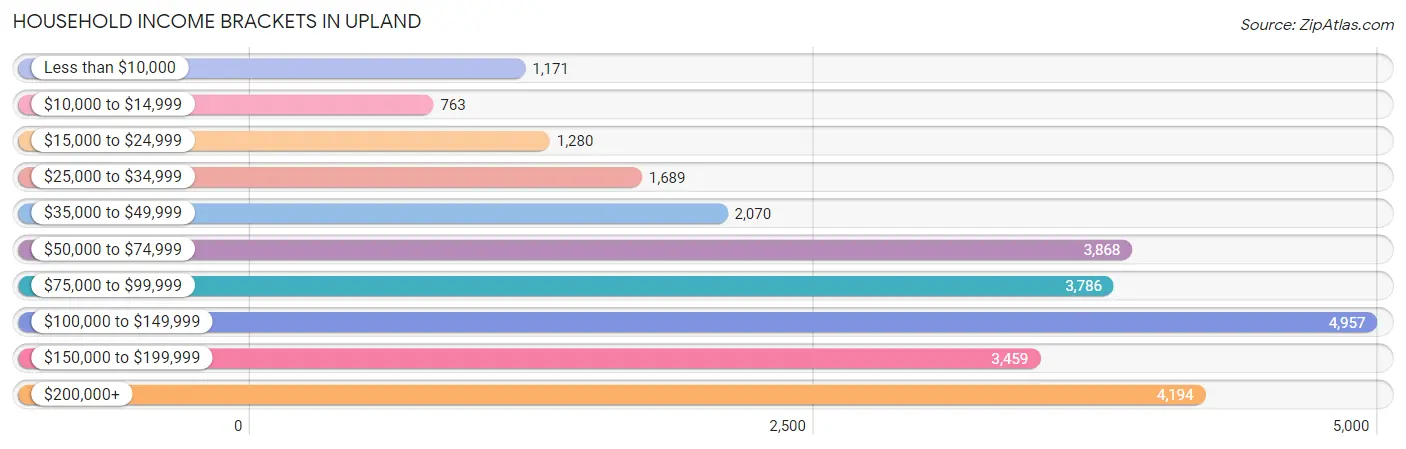
| Income Bracket | # Households | % Households |
| Less than $10,000 | 1,171 | 4.3% |
| $10,000 to $14,999 | 763 | 2.8% |
| $15,000 to $24,999 | 1,280 | 4.7% |
| $25,000 to $34,999 | 1,689 | 6.2% |
| $35,000 to $49,999 | 2,070 | 7.6% |
| $50,000 to $74,999 | 3,868 | 14.2% |
| $75,000 to $99,999 | 3,786 | 13.9% |
| $100,000 to $149,999 | 4,957 | 18.2% |
| $150,000 to $199,999 | 3,459 | 12.7% |
| $200,000+ | 4,194 | 15.4% |
Household Income by Householder Age in Upland
The median household income in Upland is $93,994, with the highest median household income of $109,902 found in the 45 to 64 years age bracket for the primary householder. A total of 10,269 households (37.7%) fall into this category. Meanwhile, the 15 to 24 years age bracket for the primary householder has the lowest median household income of $39,090, with 605 households (2.2%) in this group.
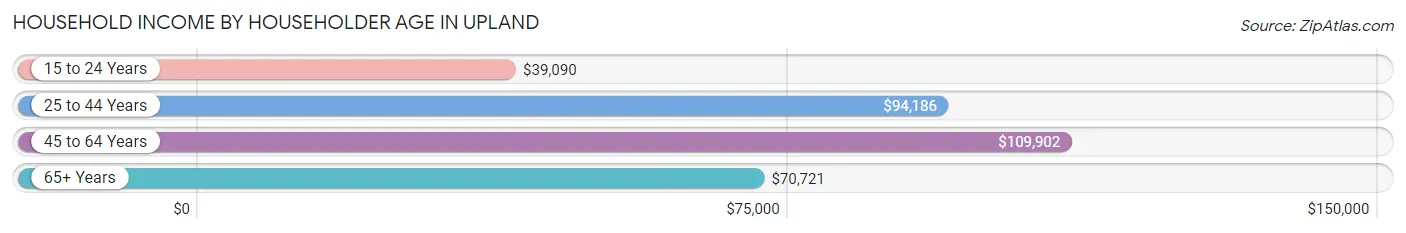
| Income Bracket | # Households | Median Income |
| 15 to 24 Years | 605 (2.2%) | $39,090 |
| 25 to 44 Years | 9,584 (35.2%) | $94,186 |
| 45 to 64 Years | 10,269 (37.7%) | $109,902 |
| 65+ Years | 6,779 (24.9%) | $70,721 |
| Total | 27,237 (100.0%) | $93,994 |
Poverty in Upland
Income Below Poverty by Sex and Age in Upland
With 9.1% poverty level for males and 11.8% for females among the residents of Upland, 5 year old males and 18 to 24 year old females are the most vulnerable to poverty, with 48 males (23.8%) and 680 females (16.6%) in their respective age groups living below the poverty level.
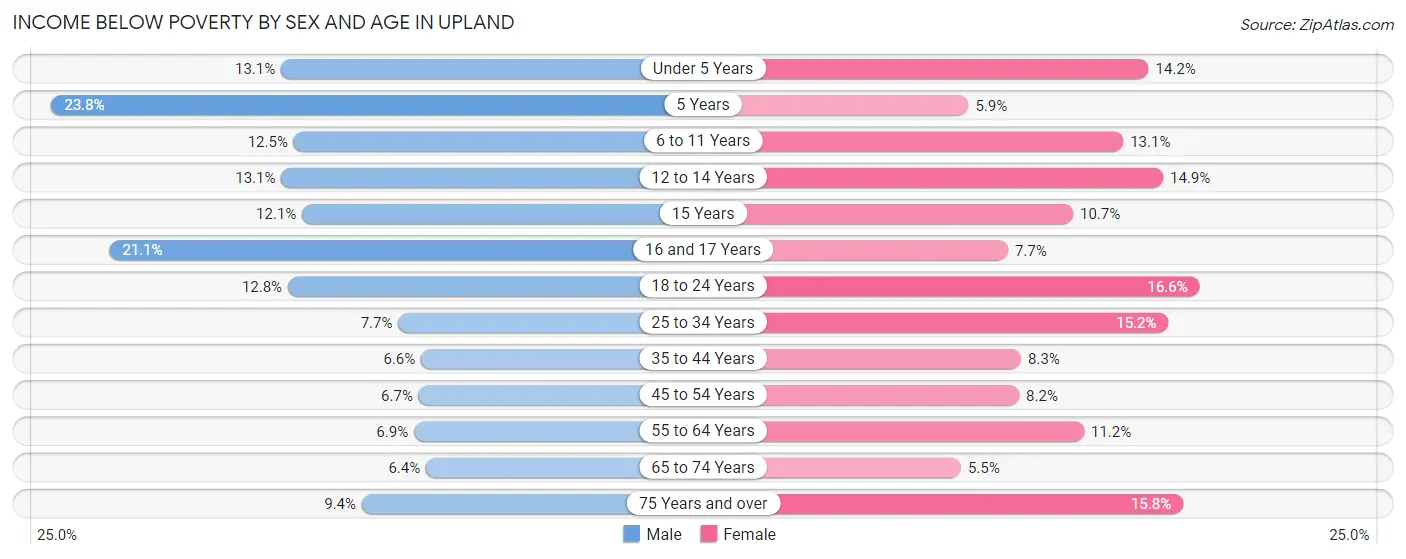
| Age Bracket | Male | Female |
| Under 5 Years | 291 (13.1%) | 333 (14.2%) |
| 5 Years | 48 (23.8%) | 27 (5.9%) |
| 6 to 11 Years | 327 (12.5%) | 332 (13.1%) |
| 12 to 14 Years | 215 (13.1%) | 232 (14.9%) |
| 15 Years | 64 (12.1%) | 47 (10.7%) |
| 16 and 17 Years | 169 (21.1%) | 97 (7.7%) |
| 18 to 24 Years | 458 (12.8%) | 680 (16.6%) |
| 25 to 34 Years | 476 (7.7%) | 990 (15.1%) |
| 35 to 44 Years | 343 (6.6%) | 405 (8.3%) |
| 45 to 54 Years | 321 (6.7%) | 440 (8.2%) |
| 55 to 64 Years | 313 (6.9%) | 533 (11.2%) |
| 65 to 74 Years | 197 (6.4%) | 188 (5.5%) |
| 75 Years and over | 209 (9.3%) | 459 (15.8%) |
| Total | 3,431 (9.1%) | 4,763 (11.8%) |
Income Above Poverty by Sex and Age in Upland
According to the poverty statistics in Upland, males aged 65 to 74 years and females aged 65 to 74 years are the age groups that are most secure financially, with 93.6% of males and 94.5% of females in these age groups living above the poverty line.
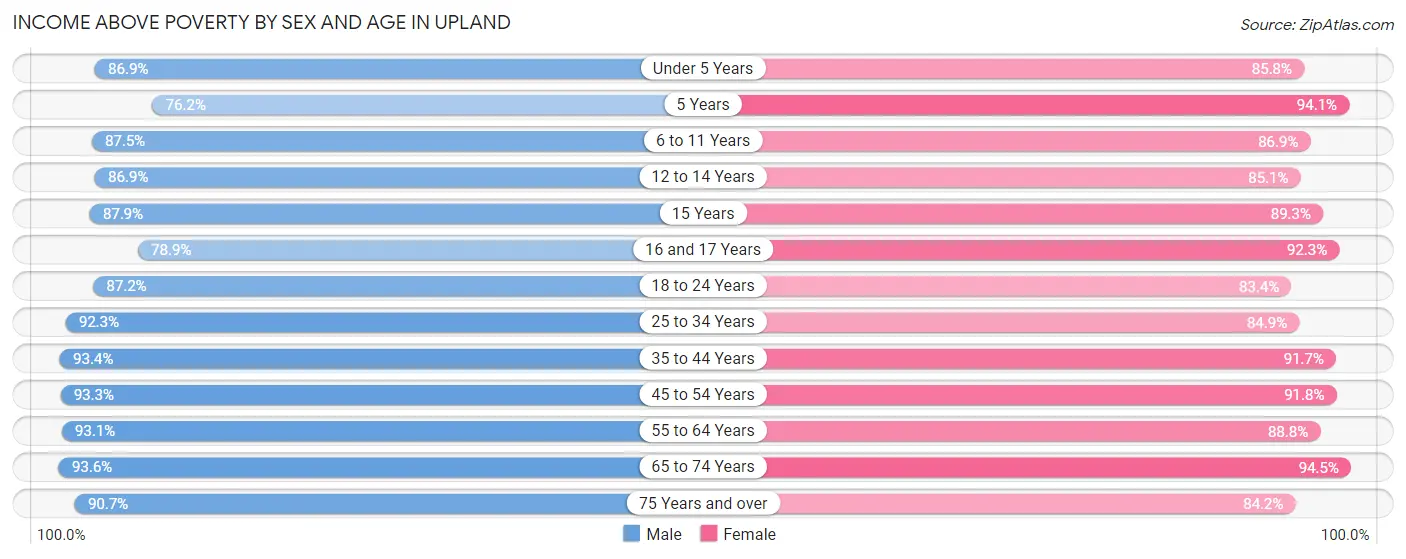
| Age Bracket | Male | Female |
| Under 5 Years | 1,931 (86.9%) | 2,005 (85.8%) |
| 5 Years | 154 (76.2%) | 432 (94.1%) |
| 6 to 11 Years | 2,287 (87.5%) | 2,211 (86.9%) |
| 12 to 14 Years | 1,428 (86.9%) | 1,324 (85.1%) |
| 15 Years | 464 (87.9%) | 391 (89.3%) |
| 16 and 17 Years | 633 (78.9%) | 1,161 (92.3%) |
| 18 to 24 Years | 3,125 (87.2%) | 3,416 (83.4%) |
| 25 to 34 Years | 5,739 (92.3%) | 5,546 (84.9%) |
| 35 to 44 Years | 4,851 (93.4%) | 4,461 (91.7%) |
| 45 to 54 Years | 4,460 (93.3%) | 4,908 (91.8%) |
| 55 to 64 Years | 4,205 (93.1%) | 4,209 (88.8%) |
| 65 to 74 Years | 2,898 (93.6%) | 3,213 (94.5%) |
| 75 Years and over | 2,027 (90.6%) | 2,441 (84.2%) |
| Total | 34,202 (90.9%) | 35,718 (88.2%) |
Income Below Poverty Among Married-Couple Families in Upland
The poverty statistics for married-couple families in Upland show that 4.8% or 669 of the total 13,887 families live below the poverty line. Families with 1 or 2 children have the highest poverty rate of 5.5%, comprising of 258 families. On the other hand, families with 5 or more children have the lowest poverty rate of 0.0%, which includes 0 families.
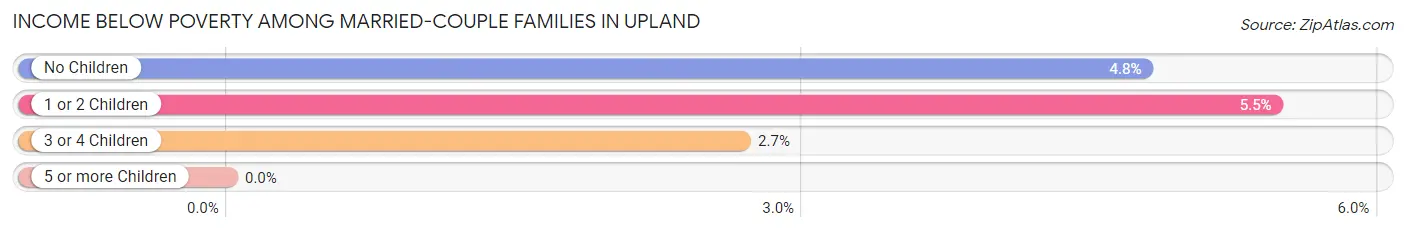
| Children | Above Poverty | Below Poverty |
| No Children | 7,628 (95.2%) | 383 (4.8%) |
| 1 or 2 Children | 4,466 (94.5%) | 258 (5.5%) |
| 3 or 4 Children | 1,015 (97.3%) | 28 (2.7%) |
| 5 or more Children | 109 (100.0%) | 0 (0.0%) |
| Total | 13,218 (95.2%) | 669 (4.8%) |
Income Below Poverty Among Single-Parent Households in Upland
According to the poverty data in Upland, 5.2% or 100 single-father households and 19.9% or 753 single-mother households are living below the poverty line. Among single-father households, those with 3 or 4 children have the highest poverty rate, with 32 households (46.4%) experiencing poverty. Likewise, among single-mother households, those with 3 or 4 children have the highest poverty rate, with 194 households (58.8%) falling below the poverty line.
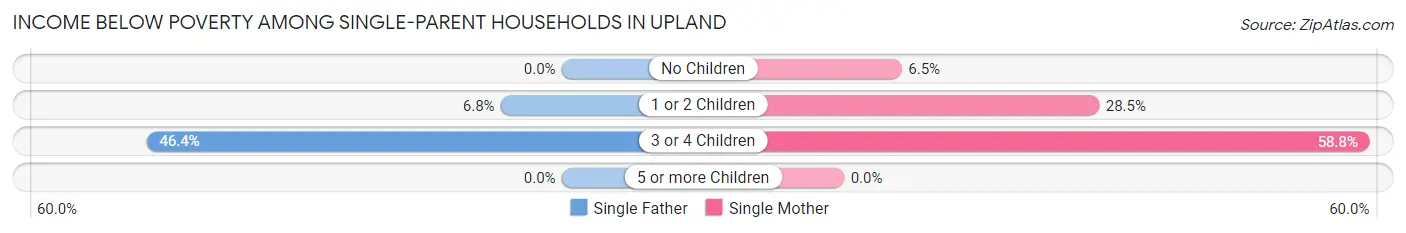
| Children | Single Father | Single Mother |
| No Children | 0 (0.0%) | 124 (6.5%) |
| 1 or 2 Children | 68 (6.8%) | 435 (28.5%) |
| 3 or 4 Children | 32 (46.4%) | 194 (58.8%) |
| 5 or more Children | 0 (0.0%) | 0 (0.0%) |
| Total | 100 (5.2%) | 753 (19.9%) |
Income Below Poverty Among Married-Couple vs Single-Parent Households in Upland
The poverty data for Upland shows that 669 of the married-couple family households (4.8%) and 853 of the single-parent households (15.0%) are living below the poverty level. Within the married-couple family households, those with 1 or 2 children have the highest poverty rate, with 258 households (5.5%) falling below the poverty line. Among the single-parent households, those with 3 or 4 children have the highest poverty rate, with 226 household (56.6%) living below poverty.
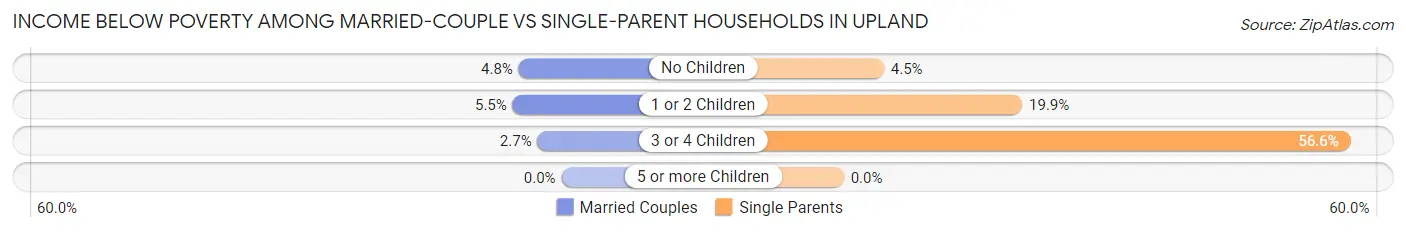
| Children | Married-Couple Families | Single-Parent Households |
| No Children | 383 (4.8%) | 124 (4.5%) |
| 1 or 2 Children | 258 (5.5%) | 503 (19.9%) |
| 3 or 4 Children | 28 (2.7%) | 226 (56.6%) |
| 5 or more Children | 0 (0.0%) | 0 (0.0%) |
| Total | 669 (4.8%) | 853 (15.0%) |
Race in Upland
The most populous races in Upland are White / Caucasian (37,887 | 48.0%), Hispanic or Latino (34,475 | 43.7%), and Some other Race (13,708 | 17.4%).
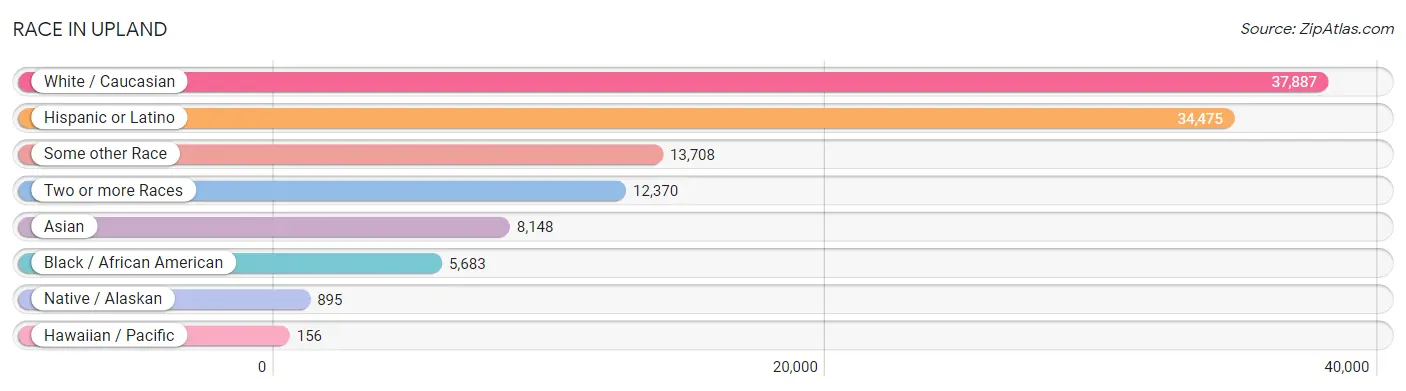
| Race | # Population | % Population |
| Asian | 8,148 | 10.3% |
| Black / African American | 5,683 | 7.2% |
| Hawaiian / Pacific | 156 | 0.2% |
| Hispanic or Latino | 34,475 | 43.7% |
| Native / Alaskan | 895 | 1.1% |
| White / Caucasian | 37,887 | 48.0% |
| Two or more Races | 12,370 | 15.7% |
| Some other Race | 13,708 | 17.4% |
| Total | 78,847 | 100.0% |
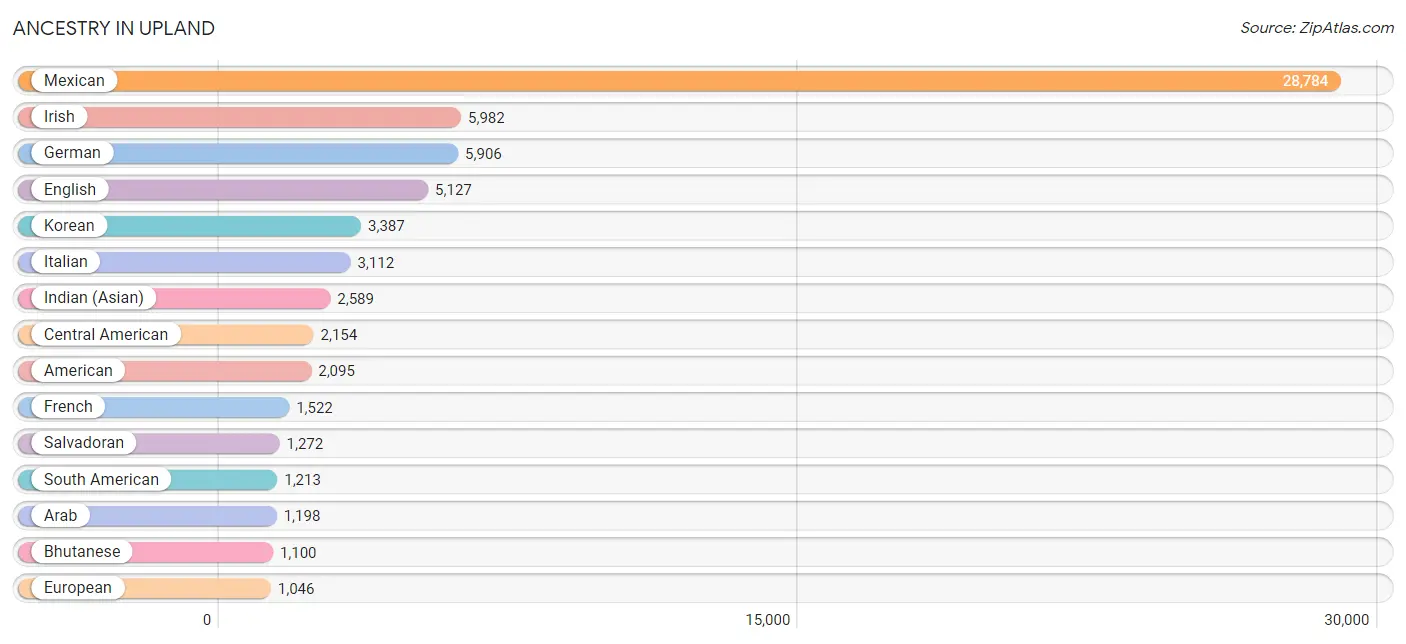
Ancestry in Upland
The most populous ancestries reported in Upland are Mexican (28,784 | 36.5%), Irish (5,982 | 7.6%), German (5,906 | 7.5%), English (5,127 | 6.5%), and Korean (3,387 | 4.3%), together accounting for 62.4% of all Upland residents.
| Ancestry | # Population | % Population |
| Afghan | 42 | 0.1% |
| African | 394 | 0.5% |
| American | 2,095 | 2.7% |
| Apache | 227 | 0.3% |
| Arab | 1,198 | 1.5% |
| Argentinean | 247 | 0.3% |
| Armenian | 191 | 0.2% |
| Assyrian / Chaldean / Syriac | 11 | 0.0% |
| Australian | 14 | 0.0% |
| Austrian | 191 | 0.2% |
| Basque | 18 | 0.0% |
| Belgian | 8 | 0.0% |
| Bhutanese | 1,100 | 1.4% |
| Blackfeet | 11 | 0.0% |
| Bolivian | 46 | 0.1% |
| Brazilian | 273 | 0.4% |
| British | 426 | 0.5% |
| British West Indian | 10 | 0.0% |
| Burmese | 540 | 0.7% |
| Canadian | 182 | 0.2% |
| Central American | 2,154 | 2.7% |
| Central American Indian | 199 | 0.3% |
| Cherokee | 543 | 0.7% |
| Chickasaw | 86 | 0.1% |
| Chilean | 115 | 0.2% |
| Chippewa | 7 | 0.0% |
| Choctaw | 253 | 0.3% |
| Colombian | 312 | 0.4% |
| Comanche | 11 | 0.0% |
| Costa Rican | 61 | 0.1% |
| Cree | 13 | 0.0% |
| Croatian | 67 | 0.1% |
| Cuban | 366 | 0.5% |
| Czech | 85 | 0.1% |
| Czechoslovakian | 132 | 0.2% |
| Danish | 155 | 0.2% |
| Dominican | 8 | 0.0% |
| Dutch | 561 | 0.7% |
| Eastern European | 122 | 0.2% |
| Ecuadorian | 239 | 0.3% |
| Egyptian | 234 | 0.3% |
| English | 5,127 | 6.5% |
| Ethiopian | 206 | 0.3% |
| European | 1,046 | 1.3% |
| Filipino | 165 | 0.2% |
| Finnish | 37 | 0.1% |
| French | 1,522 | 1.9% |
| French Canadian | 181 | 0.2% |
| German | 5,906 | 7.5% |
| Ghanaian | 68 | 0.1% |
| Greek | 194 | 0.3% |
| Guamanian / Chamorro | 30 | 0.0% |
| Guatemalan | 394 | 0.5% |
| Haitian | 249 | 0.3% |
| Honduran | 71 | 0.1% |
| Hungarian | 232 | 0.3% |
| Icelander | 9 | 0.0% |
| Indian (Asian) | 2,589 | 3.3% |
| Indonesian | 163 | 0.2% |
| Iranian | 317 | 0.4% |
| Iraqi | 74 | 0.1% |
| Irish | 5,982 | 7.6% |
| Iroquois | 4 | 0.0% |
| Israeli | 34 | 0.0% |
| Italian | 3,112 | 4.0% |
| Jamaican | 442 | 0.6% |
| Japanese | 101 | 0.1% |
| Jordanian | 196 | 0.3% |
| Korean | 3,387 | 4.3% |
| Laotian | 375 | 0.5% |
| Latvian | 10 | 0.0% |
| Lebanese | 143 | 0.2% |
| Liberian | 25 | 0.0% |
| Lithuanian | 62 | 0.1% |
| Malaysian | 74 | 0.1% |
| Maltese | 23 | 0.0% |
| Mexican | 28,784 | 36.5% |
| Mexican American Indian | 272 | 0.3% |
| Mongolian | 28 | 0.0% |
| Moroccan | 12 | 0.0% |
| Native Hawaiian | 45 | 0.1% |
| Navajo | 89 | 0.1% |
| Nicaraguan | 308 | 0.4% |
| Nigerian | 28 | 0.0% |
| Northern European | 95 | 0.1% |
| Norwegian | 880 | 1.1% |
| Osage | 27 | 0.0% |
| Pakistani | 173 | 0.2% |
| Palestinian | 221 | 0.3% |
| Peruvian | 158 | 0.2% |
| Pima | 6 | 0.0% |
| Polish | 935 | 1.2% |
| Portuguese | 261 | 0.3% |
| Pueblo | 24 | 0.0% |
| Puerto Rican | 358 | 0.4% |
| Romanian | 52 | 0.1% |
| Russian | 426 | 0.5% |
| Salvadoran | 1,272 | 1.6% |
| Samoan | 410 | 0.5% |
| Scandinavian | 146 | 0.2% |
| Scotch-Irish | 462 | 0.6% |
| Scottish | 961 | 1.2% |
| Serbian | 24 | 0.0% |
| Shoshone | 31 | 0.0% |
| Sioux | 63 | 0.1% |
| Slavic | 16 | 0.0% |
| Slovak | 63 | 0.1% |
| South African | 59 | 0.1% |
| South American | 1,213 | 1.5% |
| Spaniard | 313 | 0.4% |
| Spanish | 337 | 0.4% |
| Sri Lankan | 743 | 0.9% |
| Subsaharan African | 911 | 1.2% |
| Sudanese | 88 | 0.1% |
| Swedish | 520 | 0.7% |
| Swiss | 92 | 0.1% |
| Syrian | 41 | 0.1% |
| Thai | 823 | 1.0% |
| Tohono O'Odham | 19 | 0.0% |
| Tongan | 83 | 0.1% |
| Trinidadian and Tobagonian | 10 | 0.0% |
| Tsimshian | 14 | 0.0% |
| Turkish | 47 | 0.1% |
| Ukrainian | 98 | 0.1% |
| Ute | 107 | 0.1% |
| Venezuelan | 85 | 0.1% |
| Welsh | 294 | 0.4% |
| West Indian | 40 | 0.1% |
| Yaqui | 50 | 0.1% |
| Yugoslavian | 106 | 0.1% | View All 130 Rows |
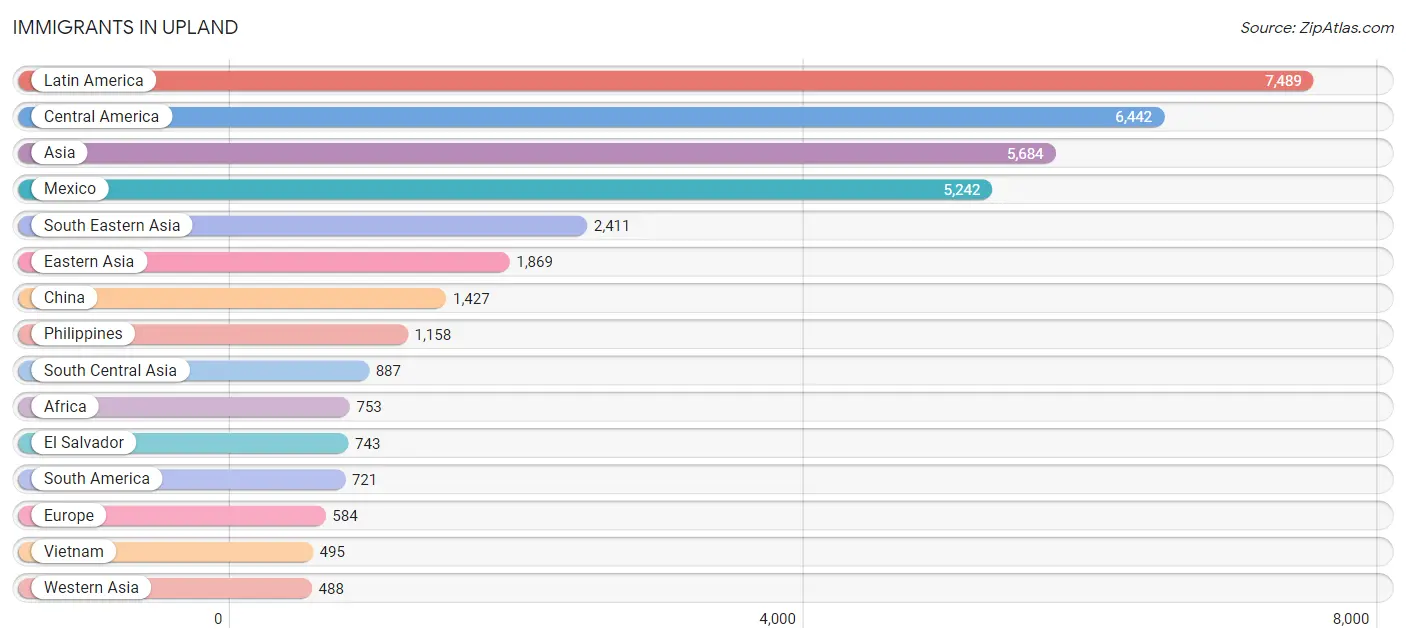
Immigrants in Upland
The most numerous immigrant groups reported in Upland came from Latin America (7,489 | 9.5%), Central America (6,442 | 8.2%), Asia (5,684 | 7.2%), Mexico (5,242 | 6.7%), and South Eastern Asia (2,411 | 3.1%), together accounting for 34.6% of all Upland residents.
| Immigration Origin | # Population | % Population |
| Afghanistan | 31 | 0.0% |
| Africa | 753 | 1.0% |
| Argentina | 26 | 0.0% |
| Armenia | 21 | 0.0% |
| Asia | 5,684 | 7.2% |
| Austria | 14 | 0.0% |
| Bangladesh | 35 | 0.0% |
| Bolivia | 21 | 0.0% |
| Brazil | 160 | 0.2% |
| Cambodia | 68 | 0.1% |
| Canada | 208 | 0.3% |
| Caribbean | 326 | 0.4% |
| Central America | 6,442 | 8.2% |
| Chile | 107 | 0.1% |
| China | 1,427 | 1.8% |
| Colombia | 140 | 0.2% |
| Costa Rica | 149 | 0.2% |
| Cuba | 168 | 0.2% |
| Denmark | 7 | 0.0% |
| Dominican Republic | 8 | 0.0% |
| Eastern Africa | 394 | 0.5% |
| Eastern Asia | 1,869 | 2.4% |
| Eastern Europe | 135 | 0.2% |
| Ecuador | 87 | 0.1% |
| Egypt | 80 | 0.1% |
| El Salvador | 743 | 0.9% |
| England | 102 | 0.1% |
| Ethiopia | 181 | 0.2% |
| Europe | 584 | 0.7% |
| Fiji | 10 | 0.0% |
| France | 42 | 0.1% |
| Germany | 26 | 0.0% |
| Ghana | 42 | 0.1% |
| Guatemala | 165 | 0.2% |
| Honduras | 10 | 0.0% |
| Hong Kong | 106 | 0.1% |
| Hungary | 19 | 0.0% |
| India | 400 | 0.5% |
| Indonesia | 202 | 0.3% |
| Iran | 228 | 0.3% |
| Iraq | 47 | 0.1% |
| Ireland | 10 | 0.0% |
| Israel | 39 | 0.1% |
| Italy | 51 | 0.1% |
| Jamaica | 102 | 0.1% |
| Japan | 99 | 0.1% |
| Jordan | 190 | 0.2% |
| Kenya | 13 | 0.0% |
| Korea | 343 | 0.4% |
| Kuwait | 12 | 0.0% |
| Laos | 137 | 0.2% |
| Latin America | 7,489 | 9.5% |
| Latvia | 10 | 0.0% |
| Lebanon | 108 | 0.1% |
| Malaysia | 14 | 0.0% |
| Mexico | 5,242 | 6.7% |
| Netherlands | 103 | 0.1% |
| Nicaragua | 105 | 0.1% |
| Nigeria | 28 | 0.0% |
| Northern Africa | 144 | 0.2% |
| Northern Europe | 174 | 0.2% |
| Norway | 9 | 0.0% |
| Oceania | 39 | 0.1% |
| Pakistan | 140 | 0.2% |
| Peru | 109 | 0.1% |
| Philippines | 1,158 | 1.5% |
| Romania | 61 | 0.1% |
| Russia | 45 | 0.1% |
| Singapore | 27 | 0.0% |
| South Africa | 58 | 0.1% |
| South America | 721 | 0.9% |
| South Central Asia | 887 | 1.1% |
| South Eastern Asia | 2,411 | 3.1% |
| Southern Europe | 51 | 0.1% |
| Sri Lanka | 31 | 0.0% |
| Sudan | 64 | 0.1% |
| Switzerland | 39 | 0.1% |
| Syria | 59 | 0.1% |
| Taiwan | 486 | 0.6% |
| Thailand | 126 | 0.2% |
| Trinidad and Tobago | 38 | 0.1% |
| Turkey | 12 | 0.0% |
| Uganda | 172 | 0.2% |
| Venezuela | 71 | 0.1% |
| Vietnam | 495 | 0.6% |
| West Indies | 10 | 0.0% |
| Western Africa | 128 | 0.2% |
| Western Asia | 488 | 0.6% |
| Western Europe | 224 | 0.3% |
| Zimbabwe | 28 | 0.0% | View All 90 Rows |
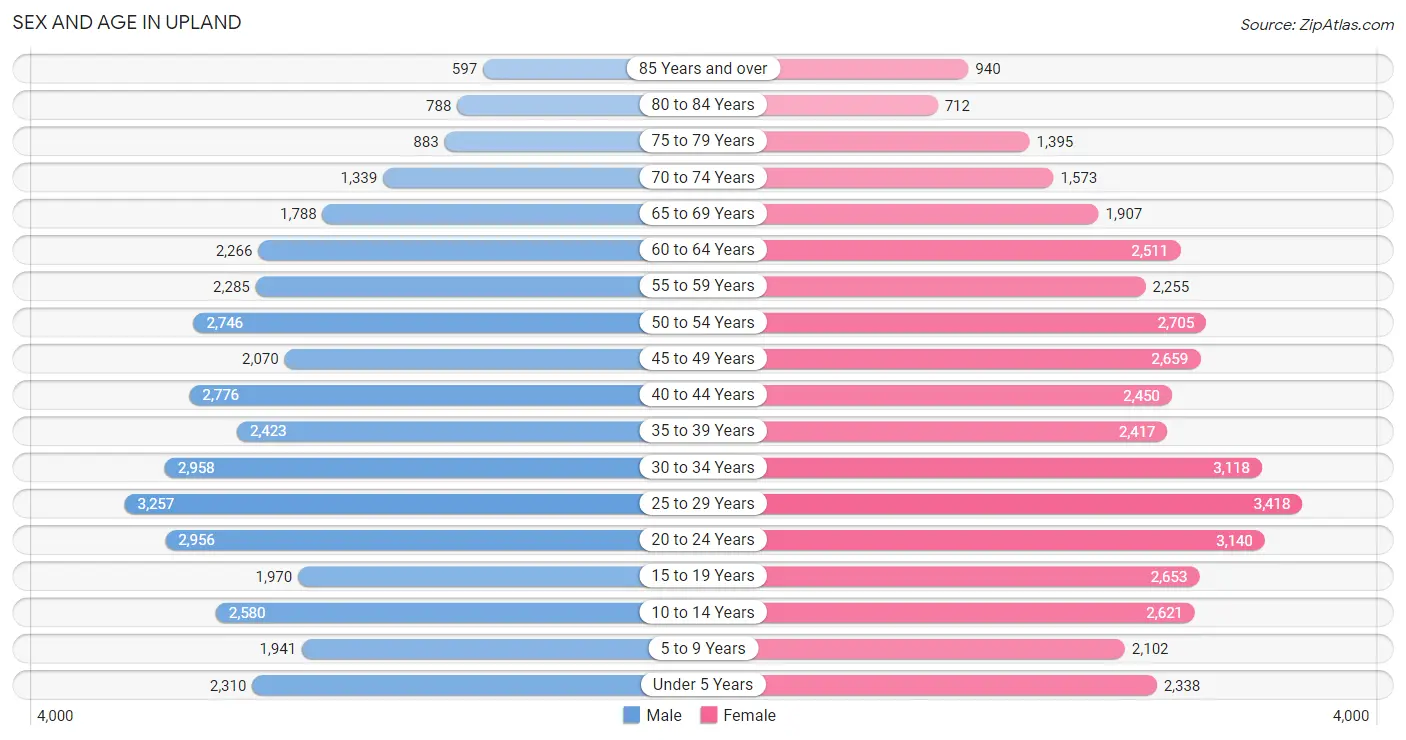
Sex and Age in Upland
Sex and Age in Upland
The most populous age groups in Upland are 25 to 29 Years (3,257 | 8.6%) for men and 25 to 29 Years (3,418 | 8.4%) for women.
| Age Bracket | Male | Female |
| Under 5 Years | 2,310 (6.1%) | 2,338 (5.7%) |
| 5 to 9 Years | 1,941 (5.1%) | 2,102 (5.1%) |
| 10 to 14 Years | 2,580 (6.8%) | 2,621 (6.4%) |
| 15 to 19 Years | 1,970 (5.2%) | 2,653 (6.5%) |
| 20 to 24 Years | 2,956 (7.8%) | 3,140 (7.7%) |
| 25 to 29 Years | 3,257 (8.6%) | 3,418 (8.4%) |
| 30 to 34 Years | 2,958 (7.8%) | 3,118 (7.6%) |
| 35 to 39 Years | 2,423 (6.4%) | 2,417 (5.9%) |
| 40 to 44 Years | 2,776 (7.3%) | 2,450 (6.0%) |
| 45 to 49 Years | 2,070 (5.5%) | 2,659 (6.5%) |
| 50 to 54 Years | 2,746 (7.2%) | 2,705 (6.6%) |
| 55 to 59 Years | 2,285 (6.0%) | 2,255 (5.5%) |
| 60 to 64 Years | 2,266 (6.0%) | 2,511 (6.1%) |
| 65 to 69 Years | 1,788 (4.7%) | 1,907 (4.7%) |
| 70 to 74 Years | 1,339 (3.5%) | 1,573 (3.8%) |
| 75 to 79 Years | 883 (2.3%) | 1,395 (3.4%) |
| 80 to 84 Years | 788 (2.1%) | 712 (1.7%) |
| 85 Years and over | 597 (1.6%) | 940 (2.3%) |
| Total | 37,933 (100.0%) | 40,914 (100.0%) |
Families and Households in Upland
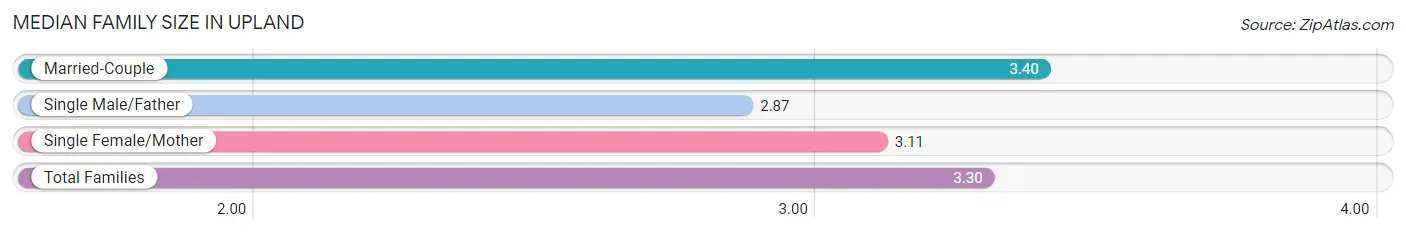
Median Family Size in Upland
The median family size in Upland is 3.30 persons per family, with married-couple families (13,887 | 71.0%) accounting for the largest median family size of 3.4 persons per family. On the other hand, single male/father families (1,909 | 9.8%) represent the smallest median family size with 2.87 persons per family.
| Family Type | # Families | Family Size |
| Married-Couple | 13,887 (71.0%) | 3.40 |
| Single Male/Father | 1,909 (9.8%) | 2.87 |
| Single Female/Mother | 3,777 (19.3%) | 3.11 |
| Total Families | 19,573 (100.0%) | 3.30 |
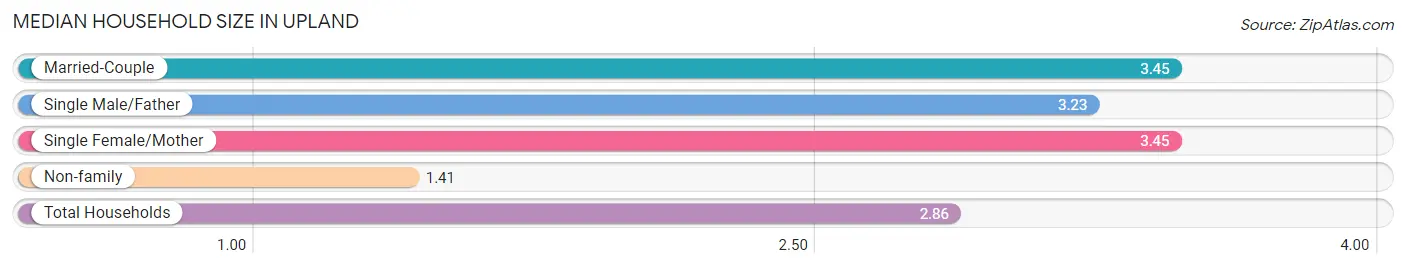
Median Household Size in Upland
The median household size in Upland is 2.86 persons per household, with married-couple households (13,887 | 51.0%) accounting for the largest median household size of 3.45 persons per household. non-family households (7,664 | 28.1%) represent the smallest median household size with 1.41 persons per household.
| Household Type | # Households | Household Size |
| Married-Couple | 13,887 (51.0%) | 3.45 |
| Single Male/Father | 1,909 (7.0%) | 3.23 |
| Single Female/Mother | 3,777 (13.9%) | 3.45 |
| Non-family | 7,664 (28.1%) | 1.41 |
| Total Households | 27,237 (100.0%) | 2.86 |
Household Size by Marriage Status in Upland
Out of a total of 27,237 households in Upland, 19,573 (71.9%) are family households, while 7,664 (28.1%) are nonfamily households. The most numerous type of family households are 2-person households, comprising 7,190, and the most common type of nonfamily households are 1-person households, comprising 5,404.
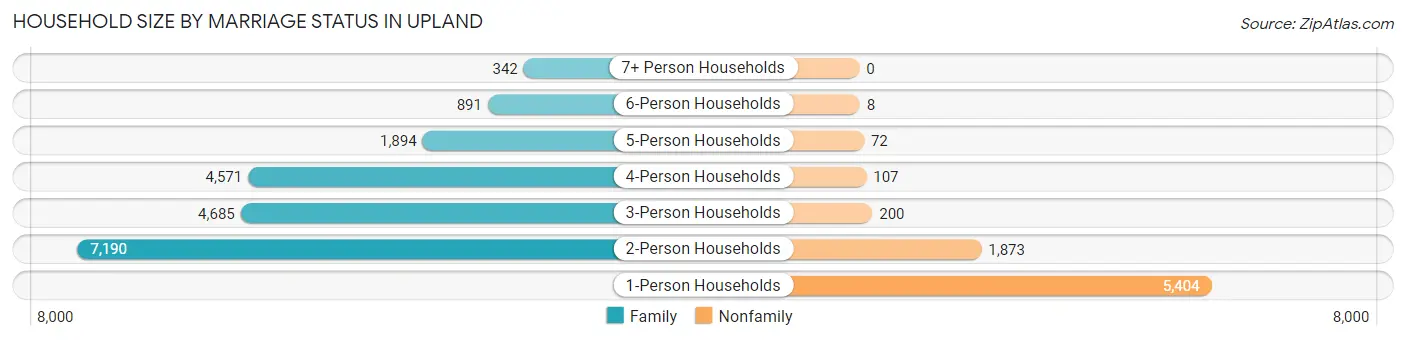
| Household Size | Family Households | Nonfamily Households |
| 1-Person Households | - | 5,404 (19.8%) |
| 2-Person Households | 7,190 (26.4%) | 1,873 (6.9%) |
| 3-Person Households | 4,685 (17.2%) | 200 (0.7%) |
| 4-Person Households | 4,571 (16.8%) | 107 (0.4%) |
| 5-Person Households | 1,894 (7.0%) | 72 (0.3%) |
| 6-Person Households | 891 (3.3%) | 8 (0.0%) |
| 7+ Person Households | 342 (1.3%) | 0 (0.0%) |
| Total | 19,573 (71.9%) | 7,664 (28.1%) |
Female Fertility in Upland
Fertility by Age in Upland
Average fertility rate in Upland is 50.0 births per 1,000 women. Women in the age bracket of 20 to 34 years have the highest fertility rate with 61.0 births per 1,000 women. Women in the age bracket of 20 to 34 years acount for 57.3% of all women with births.
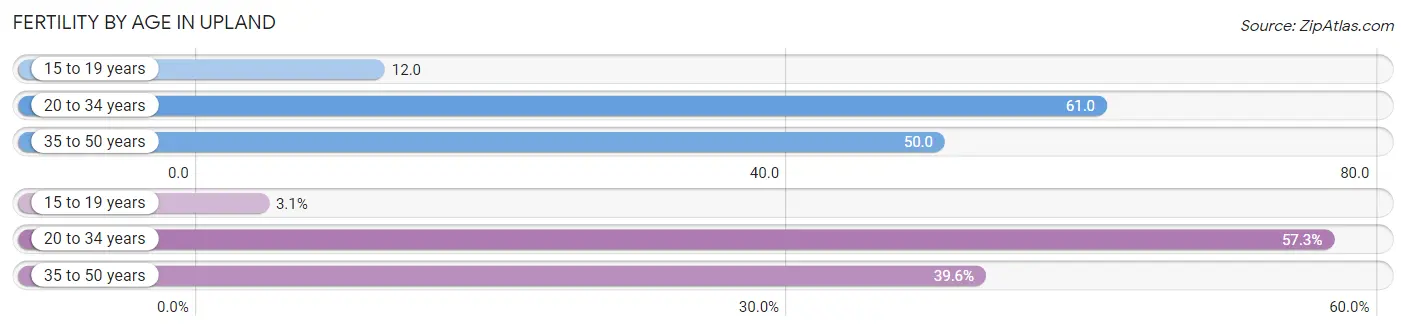
| Age Bracket | Women with Births | Births / 1,000 Women |
| 15 to 19 years | 32 (3.1%) | 12.0 |
| 20 to 34 years | 592 (57.3%) | 61.0 |
| 35 to 50 years | 409 (39.6%) | 50.0 |
| Total | 1,033 (100.0%) | 50.0 |
Fertility by Age by Marriage Status in Upland
63.8% of women with births (1,033) in Upland are married. The highest percentage of unmarried women with births falls into 15 to 19 years age bracket with 100.0% of them unmarried at the time of birth, while the lowest percentage of unmarried women with births belong to 35 to 50 years age bracket with 24.7% of them unmarried.
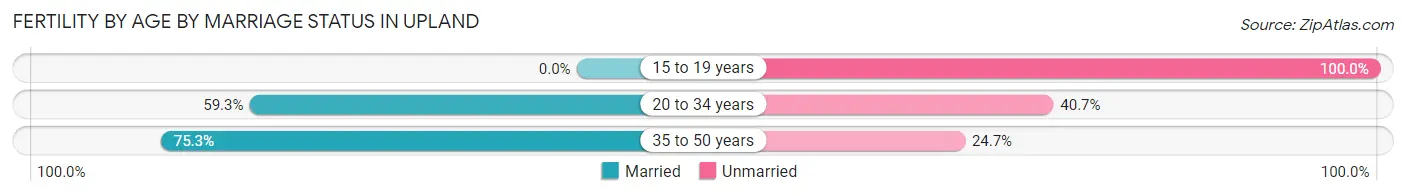
| Age Bracket | Married | Unmarried |
| 15 to 19 years | 0 (0.0%) | 32 (100.0%) |
| 20 to 34 years | 351 (59.3%) | 241 (40.7%) |
| 35 to 50 years | 308 (75.3%) | 101 (24.7%) |
| Total | 659 (63.8%) | 374 (36.2%) |
Fertility by Education in Upland
Average fertility rate in Upland is 50.0 births per 1,000 women. Women with the education attainment of graduate degree have the highest fertility rate of 138.0 births per 1,000 women, while women with the education attainment of college or associate's degree have the lowest fertility at 35.0 births per 1,000 women. Women with the education attainment of graduate degree represent 27.6% of all women with births.
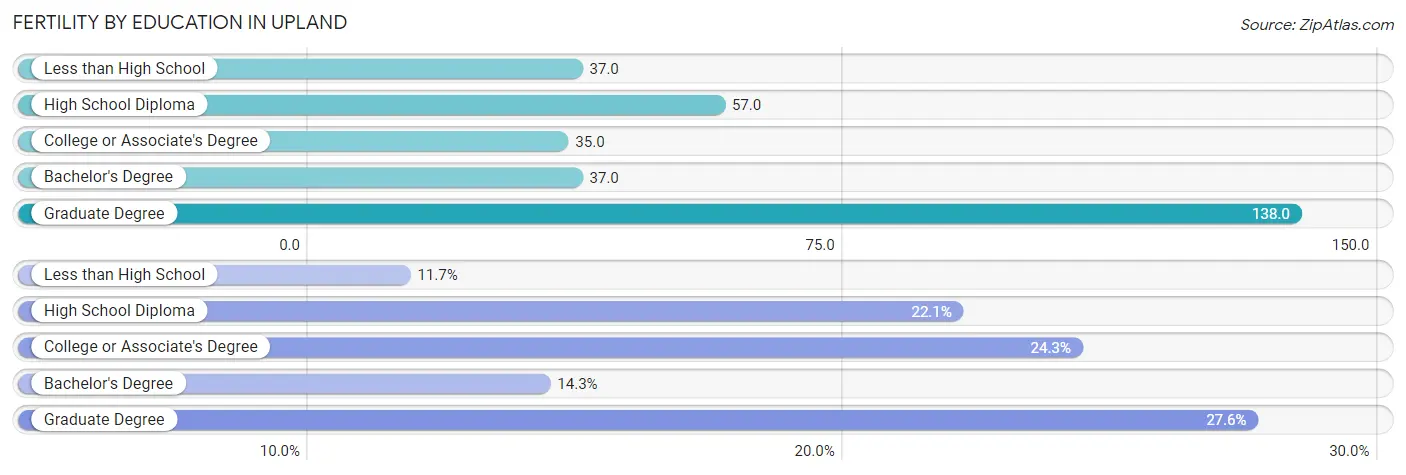
| Educational Attainment | Women with Births | Births / 1,000 Women |
| Less than High School | 121 (11.7%) | 37.0 |
| High School Diploma | 228 (22.1%) | 57.0 |
| College or Associate's Degree | 251 (24.3%) | 35.0 |
| Bachelor's Degree | 148 (14.3%) | 37.0 |
| Graduate Degree | 285 (27.6%) | 138.0 |
| Total | 1,033 (100.0%) | 50.0 |
Fertility by Education by Marriage Status in Upland
36.2% of women with births in Upland are unmarried. Women with the educational attainment of graduate degree are most likely to be married with 100.0% of them married at childbirth, while women with the educational attainment of less than high school are least likely to be married with 81.0% of them unmarried at childbirth.
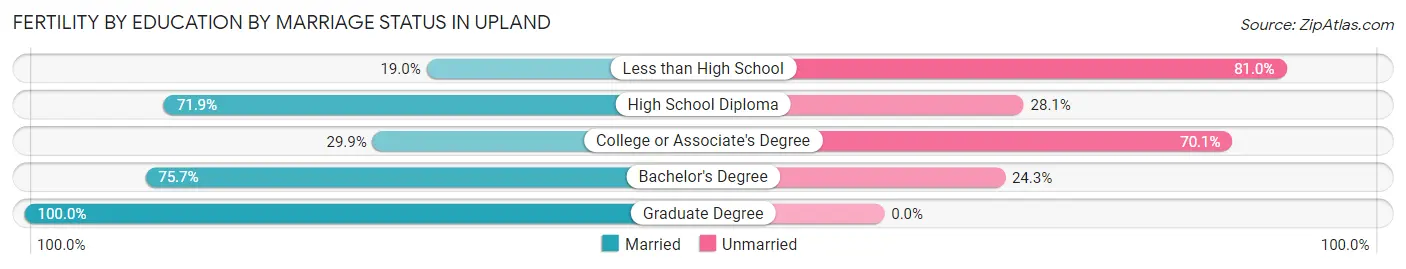
| Educational Attainment | Married | Unmarried |
| Less than High School | 23 (19.0%) | 98 (81.0%) |
| High School Diploma | 164 (71.9%) | 64 (28.1%) |
| College or Associate's Degree | 75 (29.9%) | 176 (70.1%) |
| Bachelor's Degree | 112 (75.7%) | 36 (24.3%) |
| Graduate Degree | 285 (100.0%) | 0 (0.0%) |
| Total | 659 (63.8%) | 374 (36.2%) |
Employment Characteristics in Upland
Employment by Class of Employer in Upland
Among the 39,186 employed individuals in Upland, private company employees (26,065 | 66.5%), local government employees (4,465 | 11.4%), and not-for-profit organizations (3,623 | 9.2%) make up the most common classes of employment.
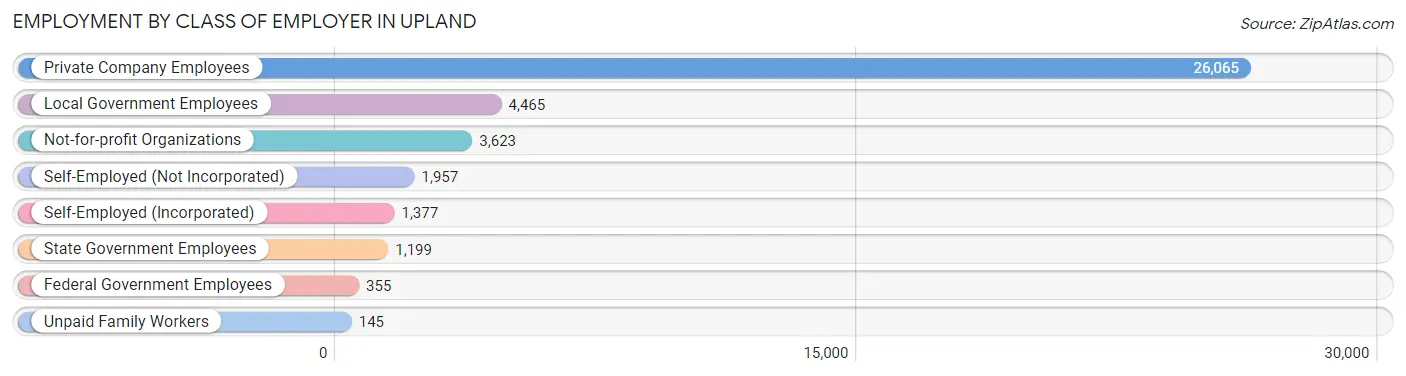
| Employer Class | # Employees | % Employees |
| Private Company Employees | 26,065 | 66.5% |
| Self-Employed (Incorporated) | 1,377 | 3.5% |
| Self-Employed (Not Incorporated) | 1,957 | 5.0% |
| Not-for-profit Organizations | 3,623 | 9.2% |
| Local Government Employees | 4,465 | 11.4% |
| State Government Employees | 1,199 | 3.1% |
| Federal Government Employees | 355 | 0.9% |
| Unpaid Family Workers | 145 | 0.4% |
| Total | 39,186 | 100.0% |
Employment Status by Age in Upland
According to the labor force statistics for Upland, out of the total population over 16 years of age (63,988), 66.2% or 42,360 individuals are in the labor force, with 4.9% or 2,076 of them unemployed. The age group with the highest labor force participation rate is 35 to 44 years, with 85.6% or 8,616 individuals in the labor force. Within the labor force, the 16 to 19 years age range has the highest percentage of unemployed individuals, with 10.4% or 100 of them being unemployed.
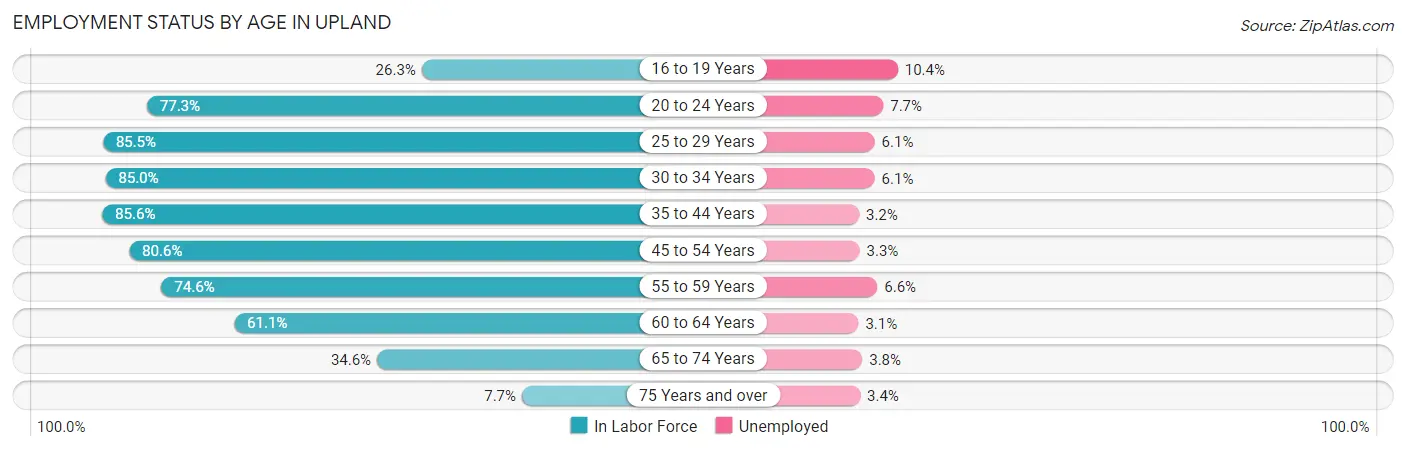
| Age Bracket | In Labor Force | Unemployed |
| 16 to 19 Years | 962 (26.3%) | 100 (10.4%) |
| 20 to 24 Years | 4,712 (77.3%) | 363 (7.7%) |
| 25 to 29 Years | 5,707 (85.5%) | 348 (6.1%) |
| 30 to 34 Years | 5,165 (85.0%) | 315 (6.1%) |
| 35 to 44 Years | 8,616 (85.6%) | 276 (3.2%) |
| 45 to 54 Years | 8,205 (80.6%) | 271 (3.3%) |
| 55 to 59 Years | 3,387 (74.6%) | 224 (6.6%) |
| 60 to 64 Years | 2,919 (61.1%) | 90 (3.1%) |
| 65 to 74 Years | 2,286 (34.6%) | 87 (3.8%) |
| 75 Years and over | 409 (7.7%) | 14 (3.4%) |
| Total | 42,360 (66.2%) | 2,076 (4.9%) |
Employment Status by Educational Attainment in Upland
According to labor force statistics for Upland, 80.4% of individuals (34,020) out of the total population between 25 and 64 years of age (42,314) are in the labor force, with 4.5% or 1,531 of them being unemployed. The group with the highest labor force participation rate are those with the educational attainment of bachelor's degree or higher, with 87.9% or 12,685 individuals in the labor force. Within the labor force, individuals with college / associate degree education have the highest percentage of unemployment, with 5.2% or 607 of them being unemployed.
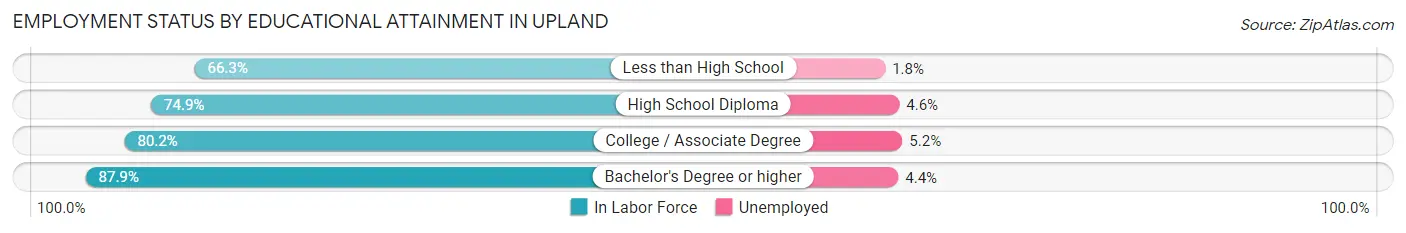
| Educational Attainment | In Labor Force | Unemployed |
| Less than High School | 2,515 (66.3%) | 68 (1.8%) |
| High School Diploma | 7,136 (74.9%) | 438 (4.6%) |
| College / Associate Degree | 11,679 (80.2%) | 757 (5.2%) |
| Bachelor's Degree or higher | 12,685 (87.9%) | 635 (4.4%) |
| Total | 34,020 (80.4%) | 1,904 (4.5%) |
Employment Occupations by Sex in Upland
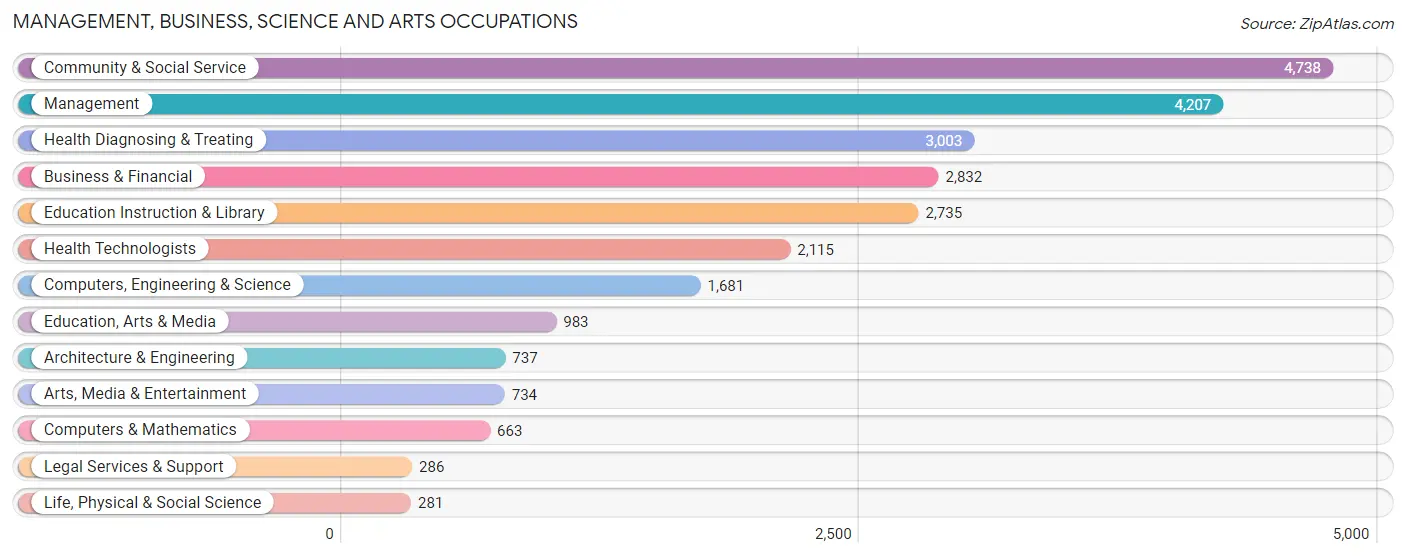
Management, Business, Science and Arts Occupations
The most common Management, Business, Science and Arts occupations in Upland are Community & Social Service (4,738 | 11.8%), Management (4,207 | 10.4%), Health Diagnosing & Treating (3,003 | 7.5%), Business & Financial (2,832 | 7.0%), and Education Instruction & Library (2,735 | 6.8%).
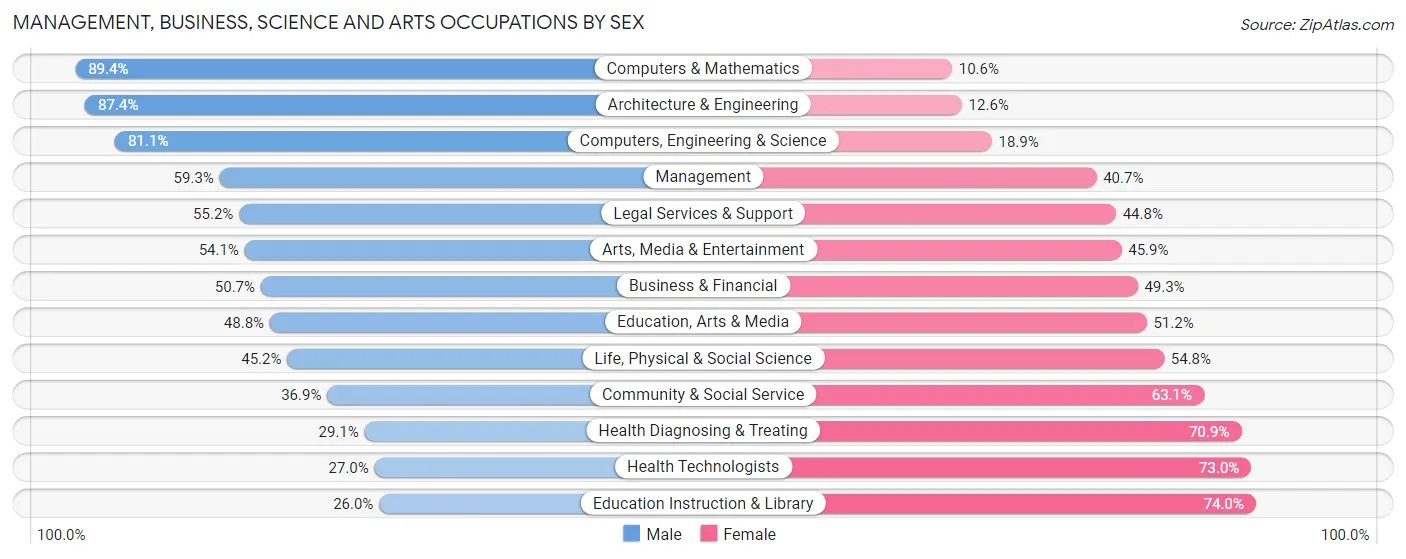
Management, Business, Science and Arts Occupations by Sex
Within the Management, Business, Science and Arts occupations in Upland, the most male-oriented occupations are Computers & Mathematics (89.4%), Architecture & Engineering (87.4%), and Computers, Engineering & Science (81.1%), while the most female-oriented occupations are Education Instruction & Library (74.0%), Health Technologists (73.0%), and Health Diagnosing & Treating (70.9%).
| Occupation | Male | Female |
| Management | 2,495 (59.3%) | 1,712 (40.7%) |
| Business & Financial | 1,436 (50.7%) | 1,396 (49.3%) |
| Computers, Engineering & Science | 1,364 (81.1%) | 317 (18.9%) |
| Computers & Mathematics | 593 (89.4%) | 70 (10.6%) |
| Architecture & Engineering | 644 (87.4%) | 93 (12.6%) |
| Life, Physical & Social Science | 127 (45.2%) | 154 (54.8%) |
| Community & Social Service | 1,747 (36.9%) | 2,991 (63.1%) |
| Education, Arts & Media | 480 (48.8%) | 503 (51.2%) |
| Legal Services & Support | 158 (55.2%) | 128 (44.8%) |
| Education Instruction & Library | 712 (26.0%) | 2,023 (74.0%) |
| Arts, Media & Entertainment | 397 (54.1%) | 337 (45.9%) |
| Health Diagnosing & Treating | 873 (29.1%) | 2,130 (70.9%) |
| Health Technologists | 571 (27.0%) | 1,544 (73.0%) |
| Total (Category) | 7,915 (48.1%) | 8,546 (51.9%) |
| Total (Overall) | 21,024 (52.2%) | 19,216 (47.7%) |
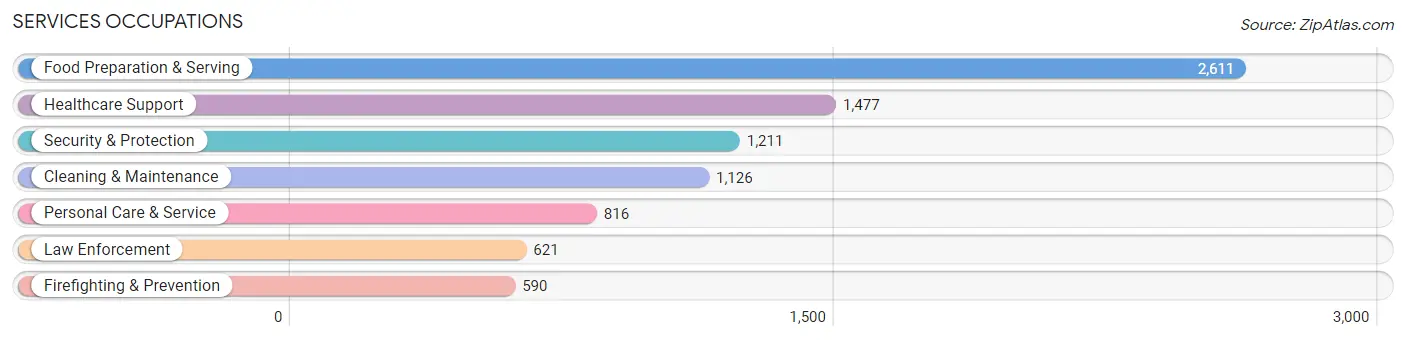
Services Occupations
The most common Services occupations in Upland are Food Preparation & Serving (2,611 | 6.5%), Healthcare Support (1,477 | 3.7%), Security & Protection (1,211 | 3.0%), Cleaning & Maintenance (1,126 | 2.8%), and Personal Care & Service (816 | 2.0%).
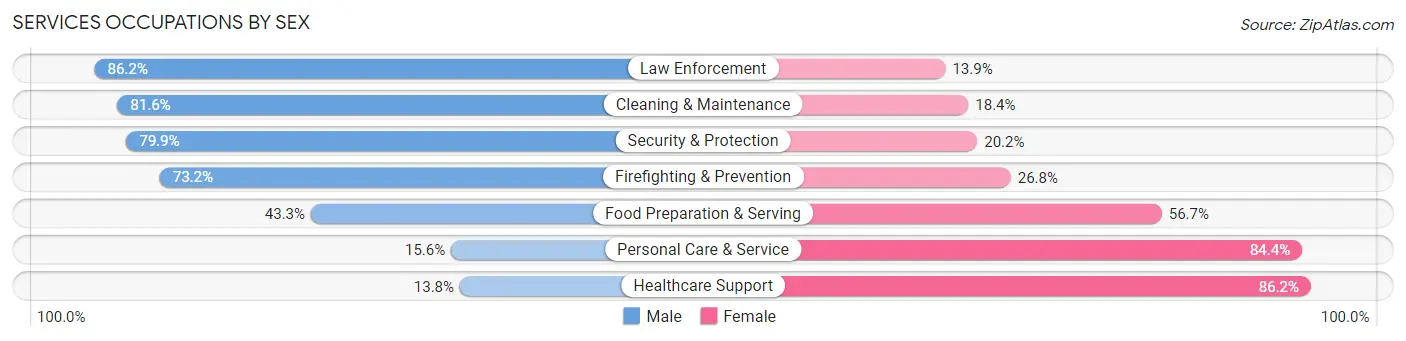
Services Occupations by Sex
Within the Services occupations in Upland, the most male-oriented occupations are Law Enforcement (86.2%), Cleaning & Maintenance (81.6%), and Security & Protection (79.8%), while the most female-oriented occupations are Healthcare Support (86.2%), Personal Care & Service (84.4%), and Food Preparation & Serving (56.7%).
| Occupation | Male | Female |
| Healthcare Support | 204 (13.8%) | 1,273 (86.2%) |
| Security & Protection | 967 (79.8%) | 244 (20.2%) |
| Firefighting & Prevention | 432 (73.2%) | 158 (26.8%) |
| Law Enforcement | 535 (86.2%) | 86 (13.9%) |
| Food Preparation & Serving | 1,131 (43.3%) | 1,480 (56.7%) |
| Cleaning & Maintenance | 919 (81.6%) | 207 (18.4%) |
| Personal Care & Service | 127 (15.6%) | 689 (84.4%) |
| Total (Category) | 3,348 (46.2%) | 3,893 (53.8%) |
| Total (Overall) | 21,024 (52.2%) | 19,216 (47.7%) |
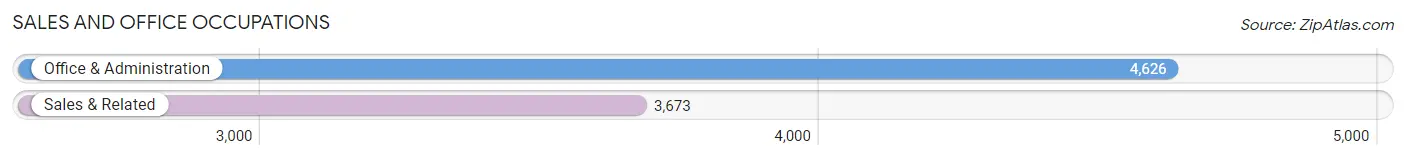
Sales and Office Occupations
The most common Sales and Office occupations in Upland are Office & Administration (4,626 | 11.5%), and Sales & Related (3,673 | 9.1%).
Sales and Office Occupations by Sex
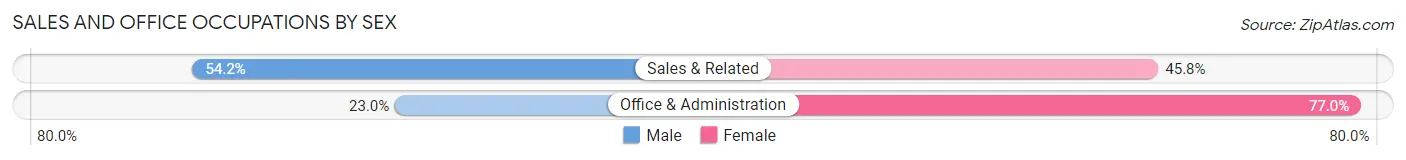
| Occupation | Male | Female |
| Sales & Related | 1,990 (54.2%) | 1,683 (45.8%) |
| Office & Administration | 1,064 (23.0%) | 3,562 (77.0%) |
| Total (Category) | 3,054 (36.8%) | 5,245 (63.2%) |
| Total (Overall) | 21,024 (52.2%) | 19,216 (47.7%) |
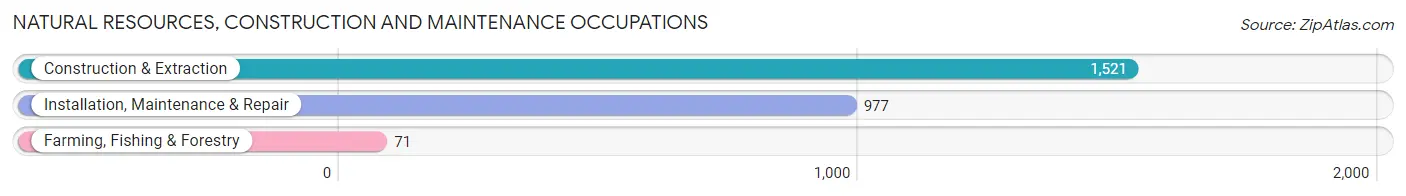
Natural Resources, Construction and Maintenance Occupations
The most common Natural Resources, Construction and Maintenance occupations in Upland are Construction & Extraction (1,521 | 3.8%), Installation, Maintenance & Repair (977 | 2.4%), and Farming, Fishing & Forestry (71 | 0.2%).
Natural Resources, Construction and Maintenance Occupations by Sex
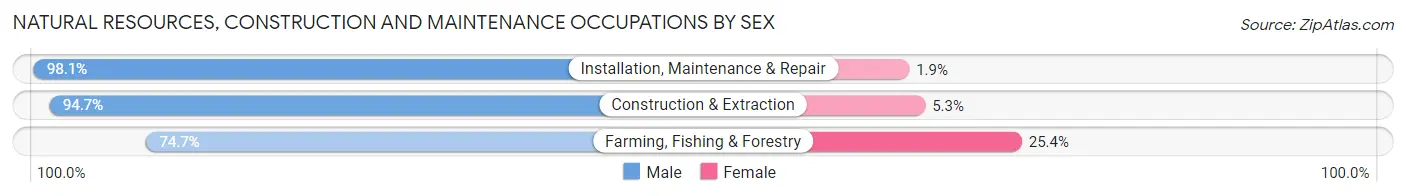
| Occupation | Male | Female |
| Farming, Fishing & Forestry | 53 (74.7%) | 18 (25.4%) |
| Construction & Extraction | 1,441 (94.7%) | 80 (5.3%) |
| Installation, Maintenance & Repair | 958 (98.1%) | 19 (1.9%) |
| Total (Category) | 2,452 (95.5%) | 117 (4.5%) |
| Total (Overall) | 21,024 (52.2%) | 19,216 (47.7%) |
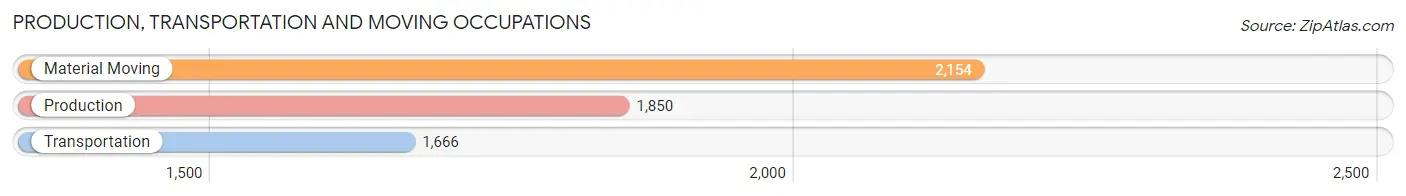
Production, Transportation and Moving Occupations
The most common Production, Transportation and Moving occupations in Upland are Material Moving (2,154 | 5.3%), Production (1,850 | 4.6%), and Transportation (1,666 | 4.1%).
Production, Transportation and Moving Occupations by Sex
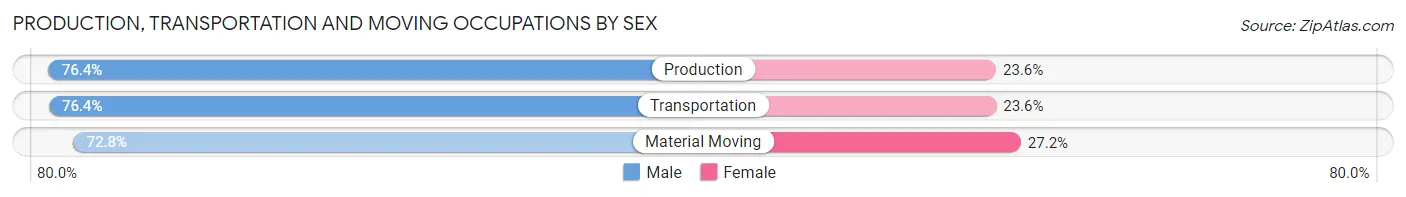
| Occupation | Male | Female |
| Production | 1,414 (76.4%) | 436 (23.6%) |
| Transportation | 1,273 (76.4%) | 393 (23.6%) |
| Material Moving | 1,568 (72.8%) | 586 (27.2%) |
| Total (Category) | 4,255 (75.0%) | 1,415 (25.0%) |
| Total (Overall) | 21,024 (52.2%) | 19,216 (47.7%) |
Employment Industries by Sex in Upland
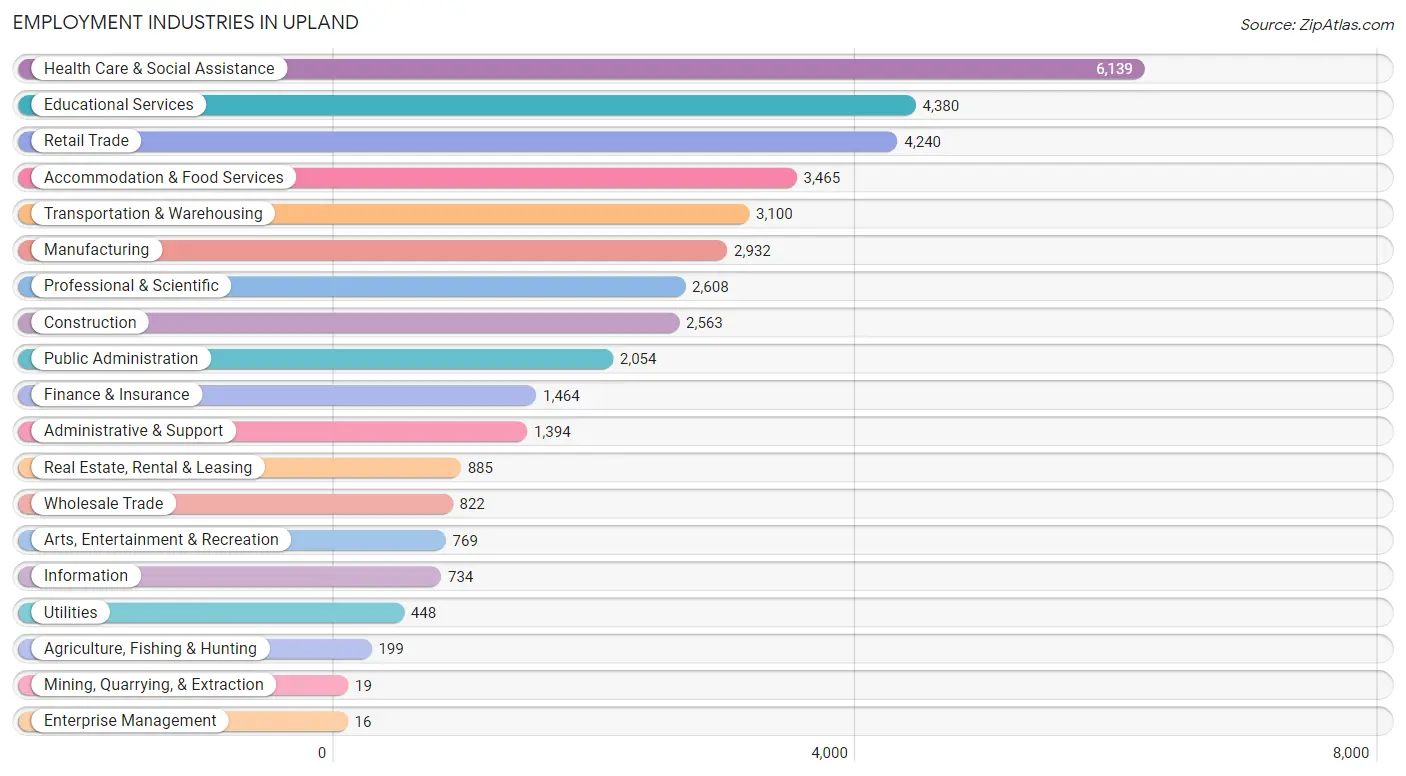
Employment Industries in Upland
The major employment industries in Upland include Health Care & Social Assistance (6,139 | 15.3%), Educational Services (4,380 | 10.9%), Retail Trade (4,240 | 10.5%), Accommodation & Food Services (3,465 | 8.6%), and Transportation & Warehousing (3,100 | 7.7%).
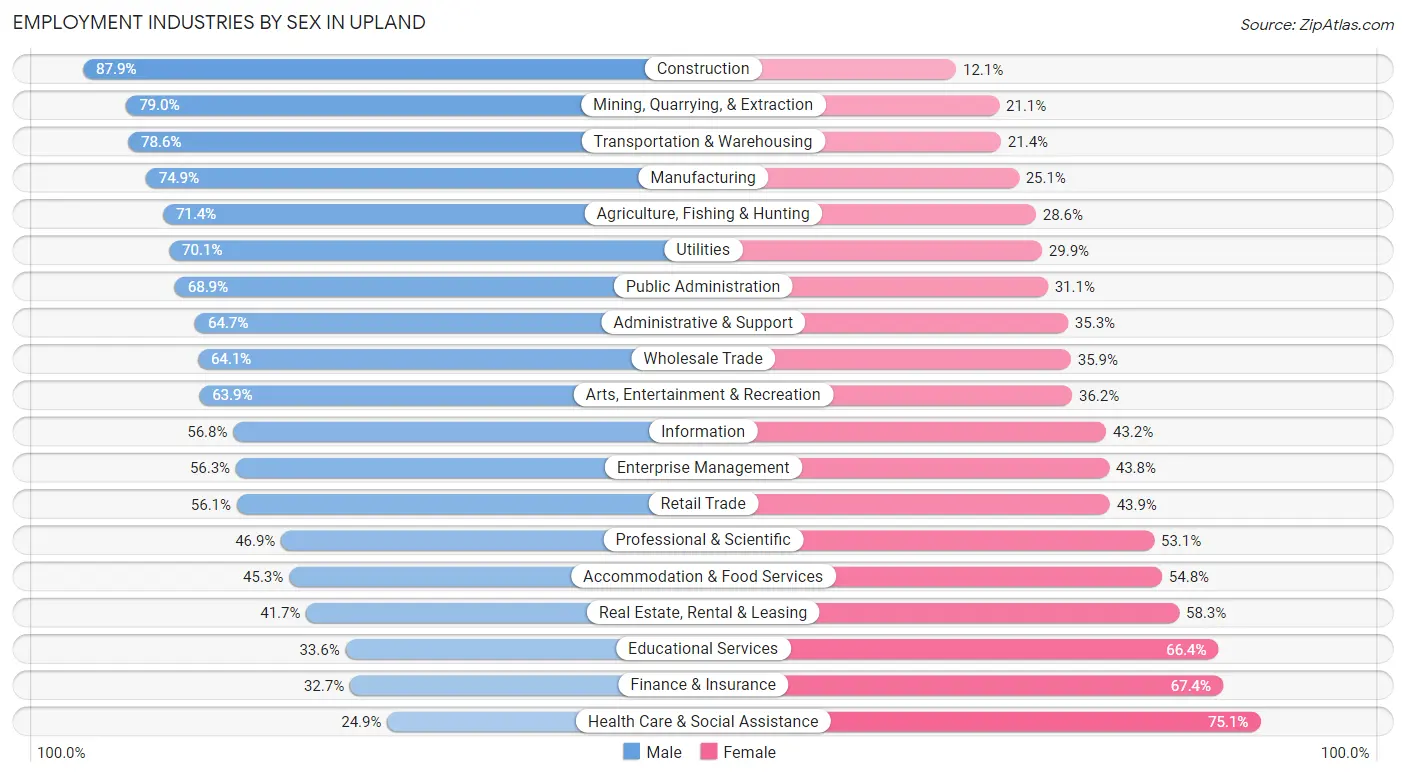
Employment Industries by Sex in Upland
The Upland industries that see more men than women are Construction (87.9%), Mining, Quarrying, & Extraction (78.9%), and Transportation & Warehousing (78.6%), whereas the industries that tend to have a higher number of women are Health Care & Social Assistance (75.1%), Finance & Insurance (67.3%), and Educational Services (66.4%).
| Industry | Male | Female |
| Agriculture, Fishing & Hunting | 142 (71.4%) | 57 (28.6%) |
| Mining, Quarrying, & Extraction | 15 (78.9%) | 4 (21.0%) |
| Construction | 2,252 (87.9%) | 311 (12.1%) |
| Manufacturing | 2,196 (74.9%) | 736 (25.1%) |
| Wholesale Trade | 527 (64.1%) | 295 (35.9%) |
| Retail Trade | 2,377 (56.1%) | 1,863 (43.9%) |
| Transportation & Warehousing | 2,436 (78.6%) | 664 (21.4%) |
| Utilities | 314 (70.1%) | 134 (29.9%) |
| Information | 417 (56.8%) | 317 (43.2%) |
| Finance & Insurance | 478 (32.7%) | 986 (67.3%) |
| Real Estate, Rental & Leasing | 369 (41.7%) | 516 (58.3%) |
| Professional & Scientific | 1,223 (46.9%) | 1,385 (53.1%) |
| Enterprise Management | 9 (56.2%) | 7 (43.8%) |
| Administrative & Support | 902 (64.7%) | 492 (35.3%) |
| Educational Services | 1,471 (33.6%) | 2,909 (66.4%) |
| Health Care & Social Assistance | 1,530 (24.9%) | 4,609 (75.1%) |
| Arts, Entertainment & Recreation | 491 (63.8%) | 278 (36.1%) |
| Accommodation & Food Services | 1,568 (45.3%) | 1,897 (54.7%) |
| Public Administration | 1,415 (68.9%) | 639 (31.1%) |
| Total | 21,024 (52.2%) | 19,216 (47.7%) |
Education in Upland
School Enrollment in Upland
The most common levels of schooling among the 20,643 students in Upland are college / undergraduate (5,655 | 27.4%), high school (4,342 | 21.0%), and middle school (4,012 | 19.4%).
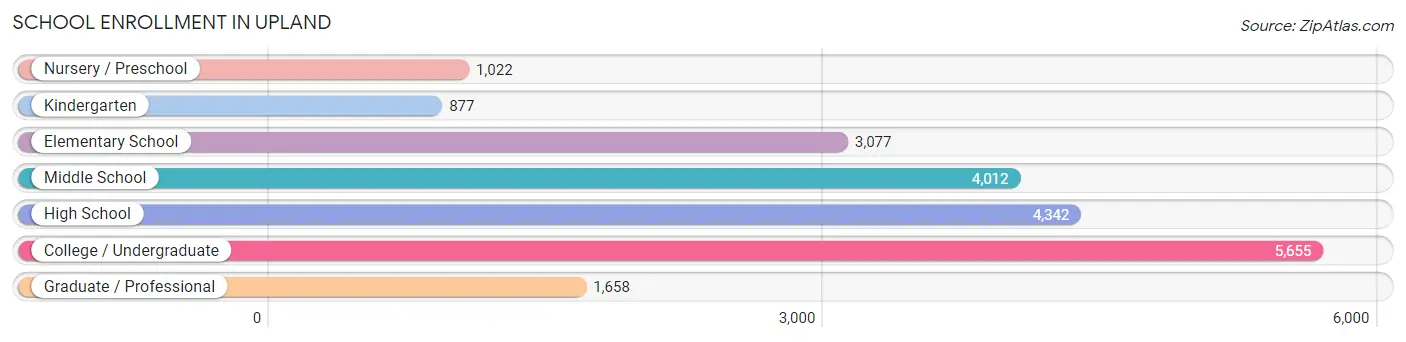
| School Level | # Students | % Students |
| Nursery / Preschool | 1,022 | 5.0% |
| Kindergarten | 877 | 4.3% |
| Elementary School | 3,077 | 14.9% |
| Middle School | 4,012 | 19.4% |
| High School | 4,342 | 21.0% |
| College / Undergraduate | 5,655 | 27.4% |
| Graduate / Professional | 1,658 | 8.0% |
| Total | 20,643 | 100.0% |
School Enrollment by Age by Funding Source in Upland
Out of a total of 20,643 students who are enrolled in schools in Upland, 3,716 (18.0%) attend a private institution, while the remaining 16,927 (82.0%) are enrolled in public schools. The age group of 25 to 34 year olds has the highest likelihood of being enrolled in private schools, with 796 (39.7% in the age bracket) enrolled. Conversely, the age group of 15 to 17 year olds has the lowest likelihood of being enrolled in a private school, with 2,728 (92.8% in the age bracket) attending a public institution.
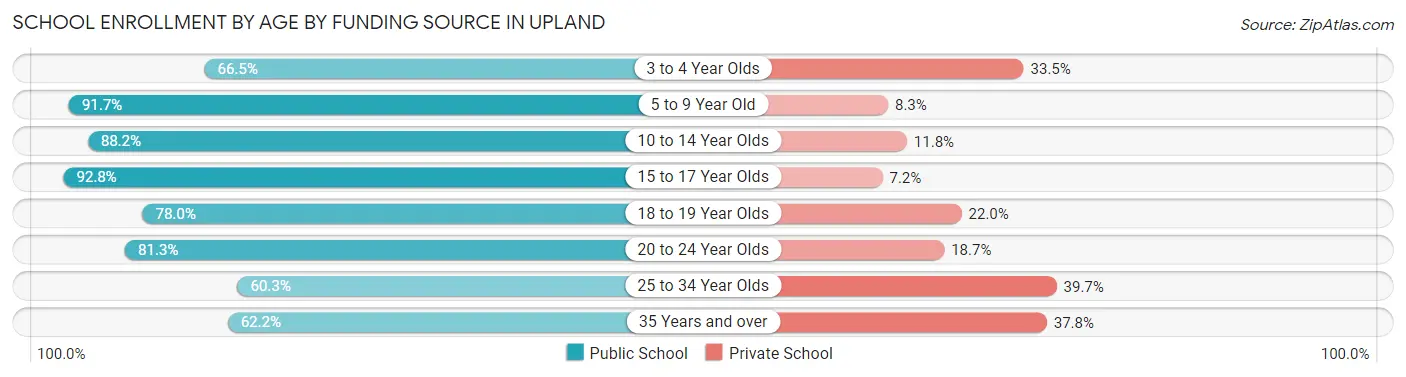
| Age Bracket | Public School | Private School |
| 3 to 4 Year Olds | 597 (66.5%) | 301 (33.5%) |
| 5 to 9 Year Old | 3,597 (91.7%) | 324 (8.3%) |
| 10 to 14 Year Olds | 4,458 (88.2%) | 595 (11.8%) |
| 15 to 17 Year Olds | 2,728 (92.8%) | 213 (7.2%) |
| 18 to 19 Year Olds | 888 (78.0%) | 250 (22.0%) |
| 20 to 24 Year Olds | 2,287 (81.3%) | 527 (18.7%) |
| 25 to 34 Year Olds | 1,211 (60.3%) | 796 (39.7%) |
| 35 Years and over | 1,163 (62.2%) | 708 (37.8%) |
| Total | 16,927 (82.0%) | 3,716 (18.0%) |
Educational Attainment by Field of Study in Upland
Business (4,573 | 23.4%), social sciences (1,886 | 9.7%), education (1,615 | 8.3%), liberal arts & history (1,441 | 7.4%), and science & technology (1,427 | 7.3%) are the most common fields of study among 19,506 individuals in Upland who have obtained a bachelor's degree or higher.
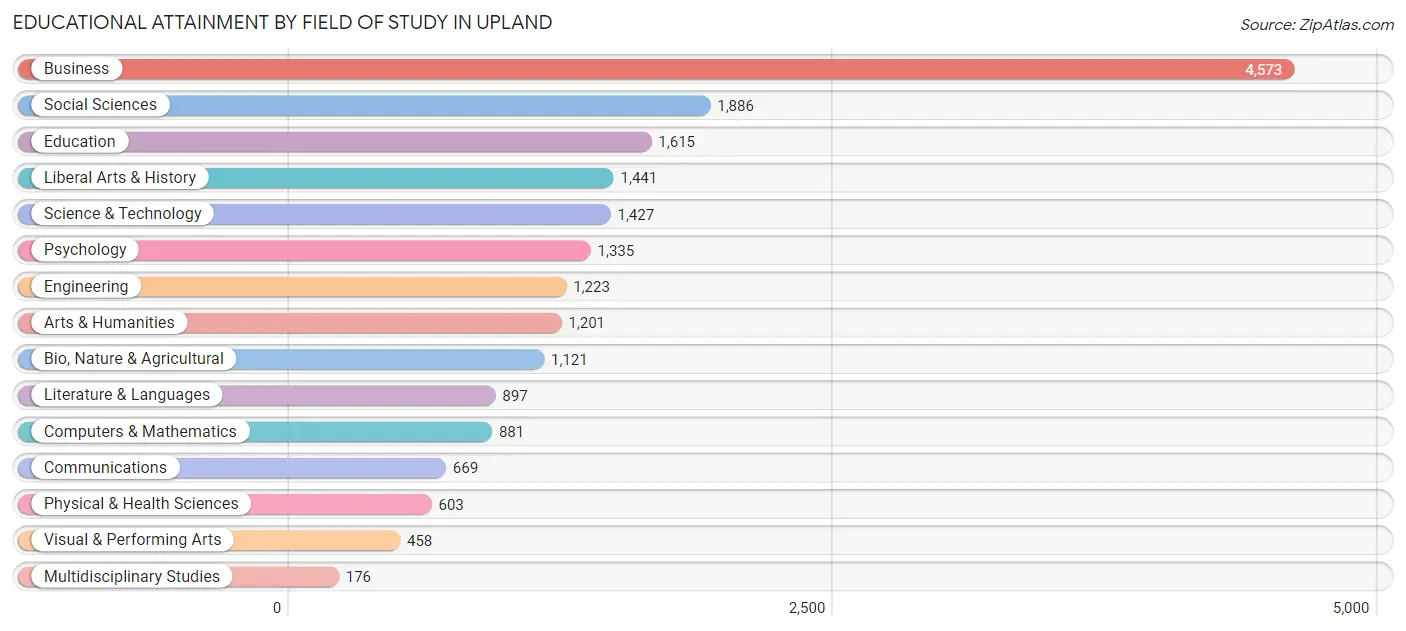
| Field of Study | # Graduates | % Graduates |
| Computers & Mathematics | 881 | 4.5% |
| Bio, Nature & Agricultural | 1,121 | 5.8% |
| Physical & Health Sciences | 603 | 3.1% |
| Psychology | 1,335 | 6.8% |
| Social Sciences | 1,886 | 9.7% |
| Engineering | 1,223 | 6.3% |
| Multidisciplinary Studies | 176 | 0.9% |
| Science & Technology | 1,427 | 7.3% |
| Business | 4,573 | 23.4% |
| Education | 1,615 | 8.3% |
| Literature & Languages | 897 | 4.6% |
| Liberal Arts & History | 1,441 | 7.4% |
| Visual & Performing Arts | 458 | 2.4% |
| Communications | 669 | 3.4% |
| Arts & Humanities | 1,201 | 6.2% |
| Total | 19,506 | 100.0% |
Transportation & Commute in Upland
Vehicle Availability by Sex in Upland
The most prevalent vehicle ownership categories in Upland are males with 2 vehicles (8,900, accounting for 43.5%) and females with 2 vehicles (7,526, making up 47.8%).
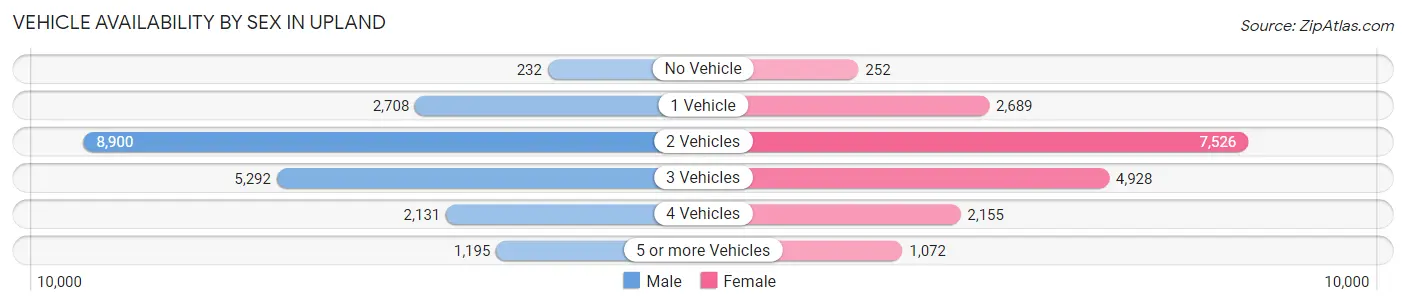
| Vehicles Available | Male | Female |
| No Vehicle | 232 (1.1%) | 252 (1.3%) |
| 1 Vehicle | 2,708 (13.2%) | 2,689 (14.4%) |
| 2 Vehicles | 8,900 (43.5%) | 7,526 (40.4%) |
| 3 Vehicles | 5,292 (25.9%) | 4,928 (26.5%) |
| 4 Vehicles | 2,131 (10.4%) | 2,155 (11.6%) |
| 5 or more Vehicles | 1,195 (5.8%) | 1,072 (5.8%) |
| Total | 20,458 (100.0%) | 18,622 (100.0%) |
Commute Time in Upland
The most frequently occuring commute durations in Upland are 30 to 34 minutes (5,047 commuters, 14.5%), 15 to 19 minutes (4,978 commuters, 14.3%), and 20 to 24 minutes (4,915 commuters, 14.2%).
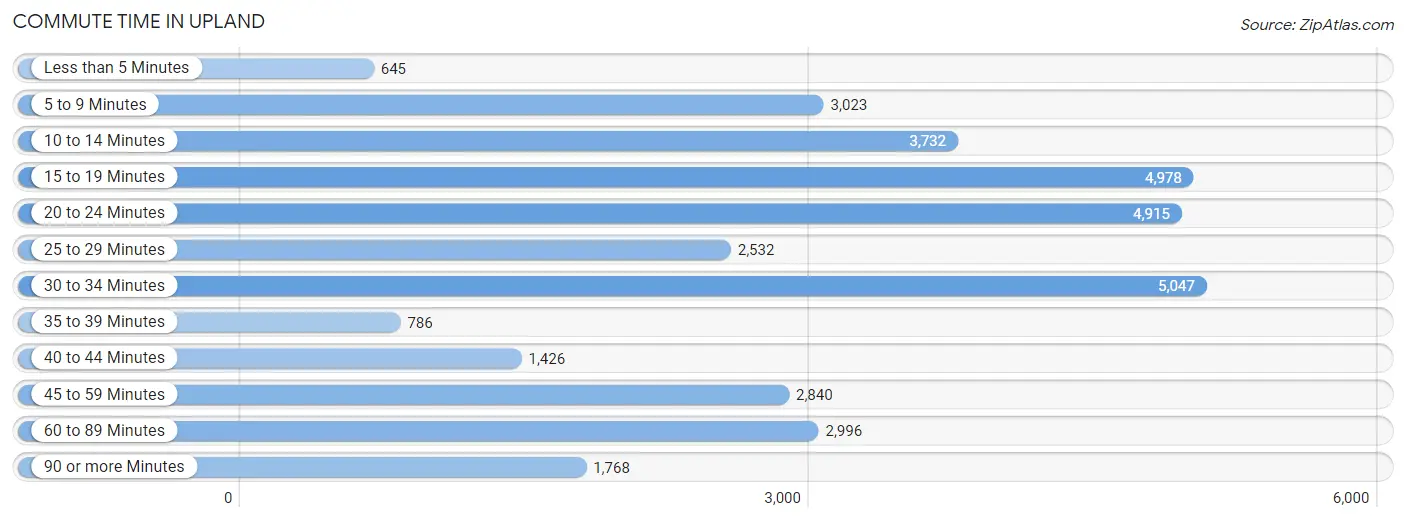
| Commute Time | # Commuters | % Commuters |
| Less than 5 Minutes | 645 | 1.9% |
| 5 to 9 Minutes | 3,023 | 8.7% |
| 10 to 14 Minutes | 3,732 | 10.8% |
| 15 to 19 Minutes | 4,978 | 14.3% |
| 20 to 24 Minutes | 4,915 | 14.2% |
| 25 to 29 Minutes | 2,532 | 7.3% |
| 30 to 34 Minutes | 5,047 | 14.5% |
| 35 to 39 Minutes | 786 | 2.3% |
| 40 to 44 Minutes | 1,426 | 4.1% |
| 45 to 59 Minutes | 2,840 | 8.2% |
| 60 to 89 Minutes | 2,996 | 8.6% |
| 90 or more Minutes | 1,768 | 5.1% |
Commute Time by Sex in Upland
The most common commute times in Upland are 30 to 34 minutes (2,866 commuters, 15.8%) for males and 15 to 19 minutes (2,622 commuters, 15.9%) for females.
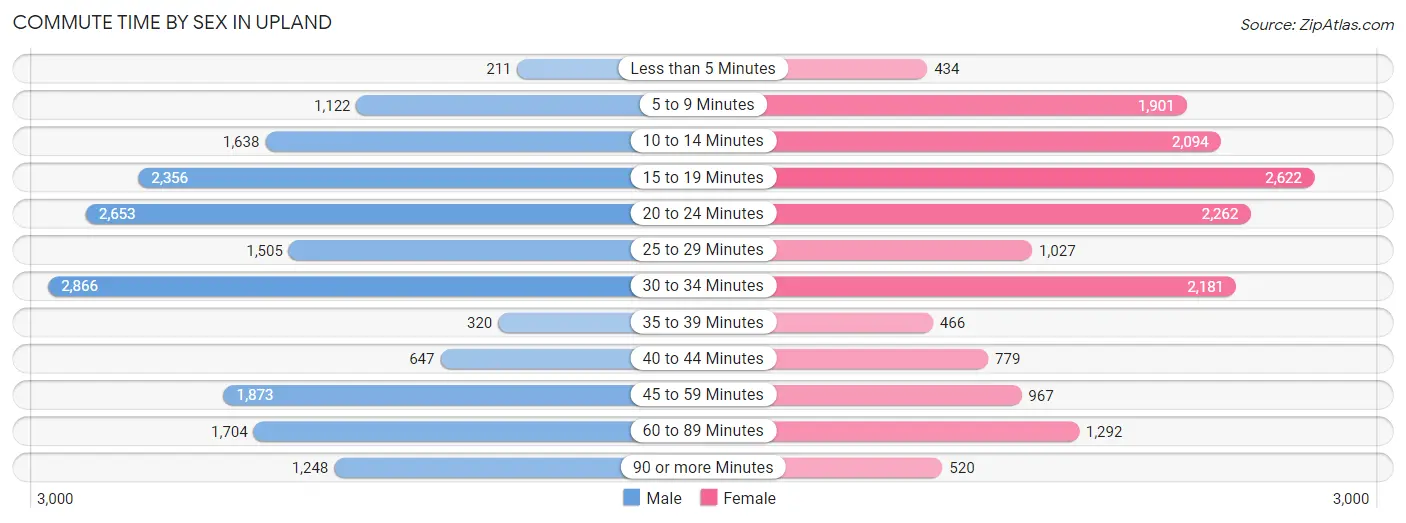
| Commute Time | Male | Female |
| Less than 5 Minutes | 211 (1.2%) | 434 (2.6%) |
| 5 to 9 Minutes | 1,122 (6.2%) | 1,901 (11.5%) |
| 10 to 14 Minutes | 1,638 (9.0%) | 2,094 (12.7%) |
| 15 to 19 Minutes | 2,356 (13.0%) | 2,622 (15.9%) |
| 20 to 24 Minutes | 2,653 (14.6%) | 2,262 (13.7%) |
| 25 to 29 Minutes | 1,505 (8.3%) | 1,027 (6.2%) |
| 30 to 34 Minutes | 2,866 (15.8%) | 2,181 (13.2%) |
| 35 to 39 Minutes | 320 (1.8%) | 466 (2.8%) |
| 40 to 44 Minutes | 647 (3.6%) | 779 (4.7%) |
| 45 to 59 Minutes | 1,873 (10.3%) | 967 (5.8%) |
| 60 to 89 Minutes | 1,704 (9.4%) | 1,292 (7.8%) |
| 90 or more Minutes | 1,248 (6.9%) | 520 (3.1%) |
Time of Departure to Work by Sex in Upland
The most frequent times of departure to work in Upland are 12:00 AM to 4:59 AM (2,471, 13.6%) for males and 7:00 AM to 7:29 AM (2,822, 17.1%) for females.
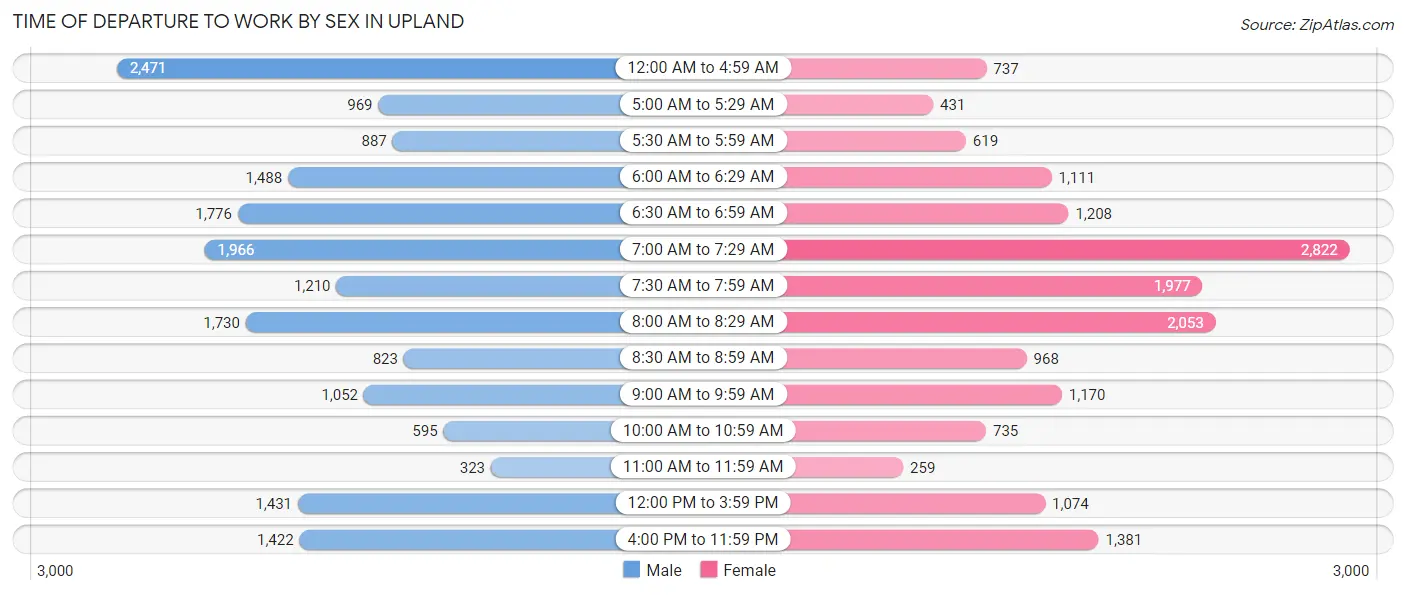
| Time of Departure | Male | Female |
| 12:00 AM to 4:59 AM | 2,471 (13.6%) | 737 (4.4%) |
| 5:00 AM to 5:29 AM | 969 (5.3%) | 431 (2.6%) |
| 5:30 AM to 5:59 AM | 887 (4.9%) | 619 (3.7%) |
| 6:00 AM to 6:29 AM | 1,488 (8.2%) | 1,111 (6.7%) |
| 6:30 AM to 6:59 AM | 1,776 (9.8%) | 1,208 (7.3%) |
| 7:00 AM to 7:29 AM | 1,966 (10.8%) | 2,822 (17.1%) |
| 7:30 AM to 7:59 AM | 1,210 (6.7%) | 1,977 (11.9%) |
| 8:00 AM to 8:29 AM | 1,730 (9.5%) | 2,053 (12.4%) |
| 8:30 AM to 8:59 AM | 823 (4.5%) | 968 (5.9%) |
| 9:00 AM to 9:59 AM | 1,052 (5.8%) | 1,170 (7.1%) |
| 10:00 AM to 10:59 AM | 595 (3.3%) | 735 (4.4%) |
| 11:00 AM to 11:59 AM | 323 (1.8%) | 259 (1.6%) |
| 12:00 PM to 3:59 PM | 1,431 (7.9%) | 1,074 (6.5%) |
| 4:00 PM to 11:59 PM | 1,422 (7.8%) | 1,381 (8.4%) |
| Total | 18,143 (100.0%) | 16,545 (100.0%) |
Housing Occupancy in Upland
Occupancy by Ownership in Upland
Of the total 27,237 dwellings in Upland, owner-occupied units account for 15,092 (55.4%), while renter-occupied units make up 12,145 (44.6%).
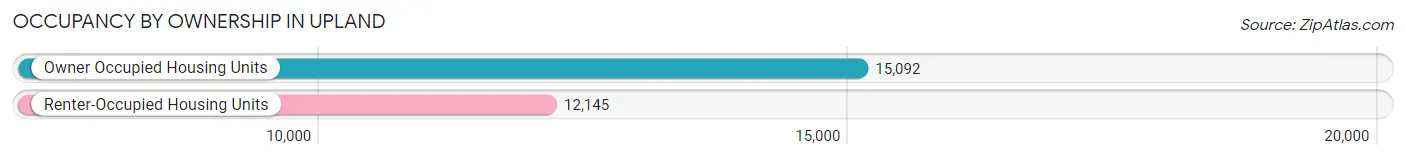
| Occupancy | # Housing Units | % Housing Units |
| Owner Occupied Housing Units | 15,092 | 55.4% |
| Renter-Occupied Housing Units | 12,145 | 44.6% |
| Total Occupied Housing Units | 27,237 | 100.0% |
Occupancy by Household Size in Upland
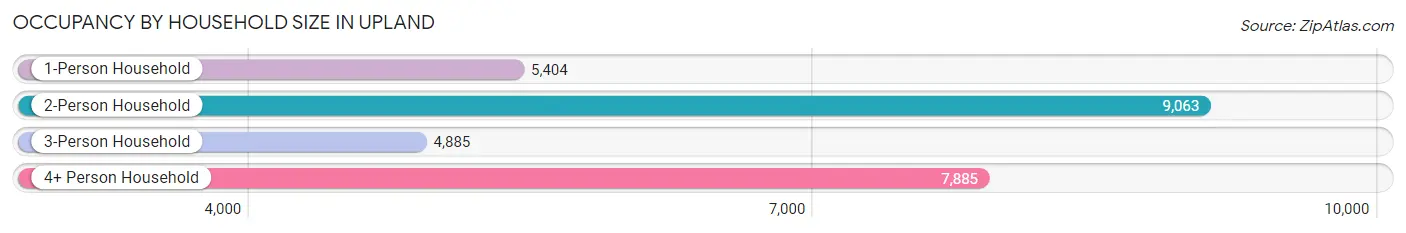
| Household Size | # Housing Units | % Housing Units |
| 1-Person Household | 5,404 | 19.8% |
| 2-Person Household | 9,063 | 33.3% |
| 3-Person Household | 4,885 | 17.9% |
| 4+ Person Household | 7,885 | 28.9% |
| Total Housing Units | 27,237 | 100.0% |
Occupancy by Ownership by Household Size in Upland
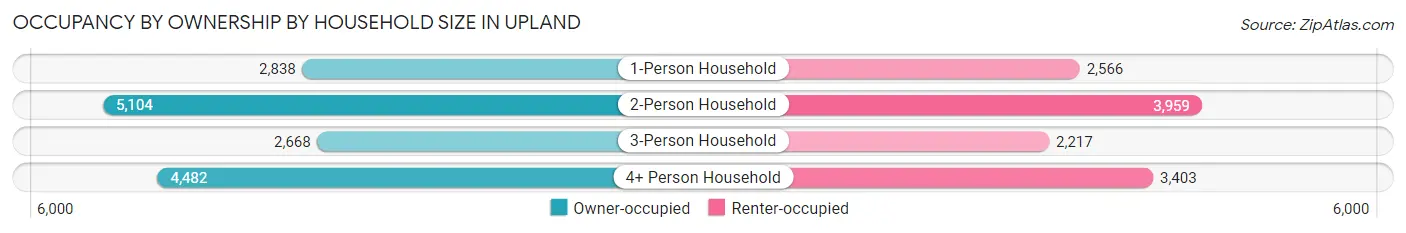
| Household Size | Owner-occupied | Renter-occupied |
| 1-Person Household | 2,838 (52.5%) | 2,566 (47.5%) |
| 2-Person Household | 5,104 (56.3%) | 3,959 (43.7%) |
| 3-Person Household | 2,668 (54.6%) | 2,217 (45.4%) |
| 4+ Person Household | 4,482 (56.8%) | 3,403 (43.2%) |
| Total Housing Units | 15,092 (55.4%) | 12,145 (44.6%) |
Occupancy by Educational Attainment in Upland
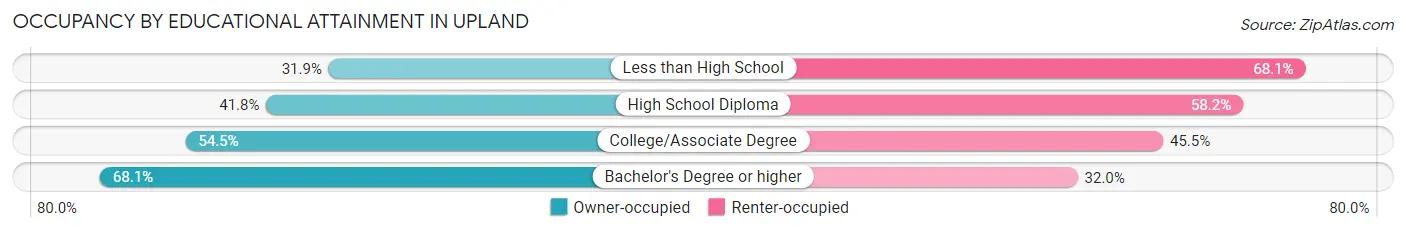
| Household Size | Owner-occupied | Renter-occupied |
| Less than High School | 647 (31.9%) | 1,380 (68.1%) |
| High School Diploma | 2,149 (41.8%) | 2,990 (58.2%) |
| College/Associate Degree | 5,480 (54.5%) | 4,575 (45.5%) |
| Bachelor's Degree or higher | 6,816 (68.0%) | 3,200 (32.0%) |
Occupancy by Age of Householder in Upland
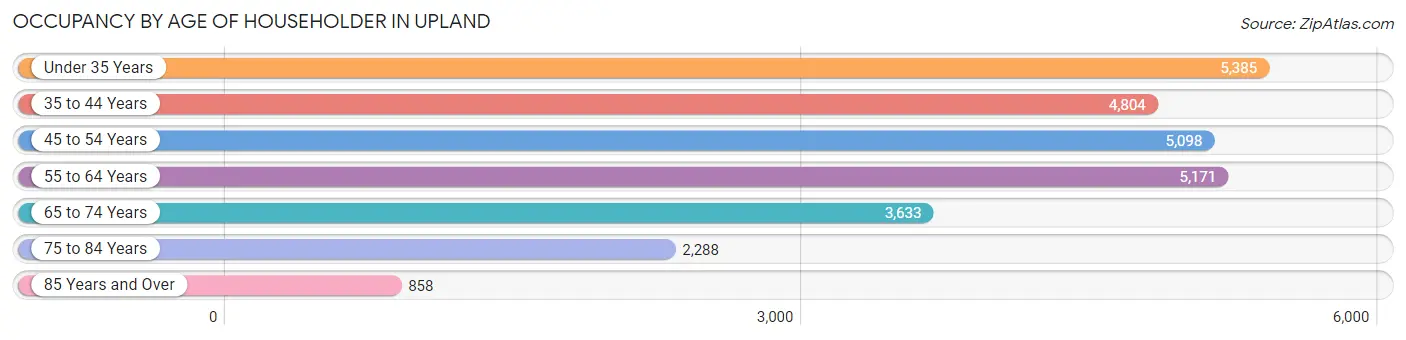
| Age Bracket | # Households | % Households |
| Under 35 Years | 5,385 | 19.8% |
| 35 to 44 Years | 4,804 | 17.6% |
| 45 to 54 Years | 5,098 | 18.7% |
| 55 to 64 Years | 5,171 | 19.0% |
| 65 to 74 Years | 3,633 | 13.3% |
| 75 to 84 Years | 2,288 | 8.4% |
| 85 Years and Over | 858 | 3.2% |
| Total | 27,237 | 100.0% |
Housing Finances in Upland
Median Income by Occupancy in Upland
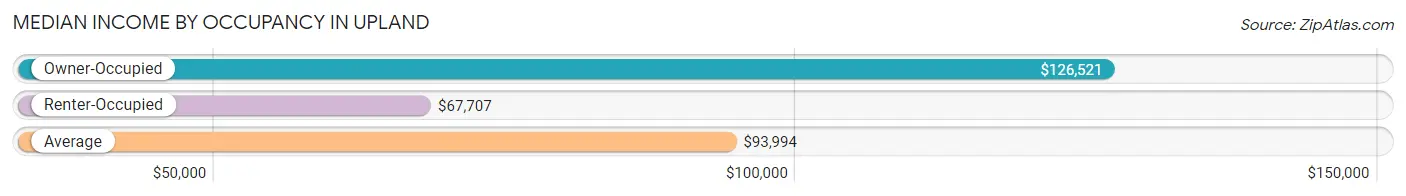
| Occupancy Type | # Households | Median Income |
| Owner-Occupied | 15,092 (55.4%) | $126,521 |
| Renter-Occupied | 12,145 (44.6%) | $67,707 |
| Average | 27,237 (100.0%) | $93,994 |
Occupancy by Householder Income Bracket in Upland
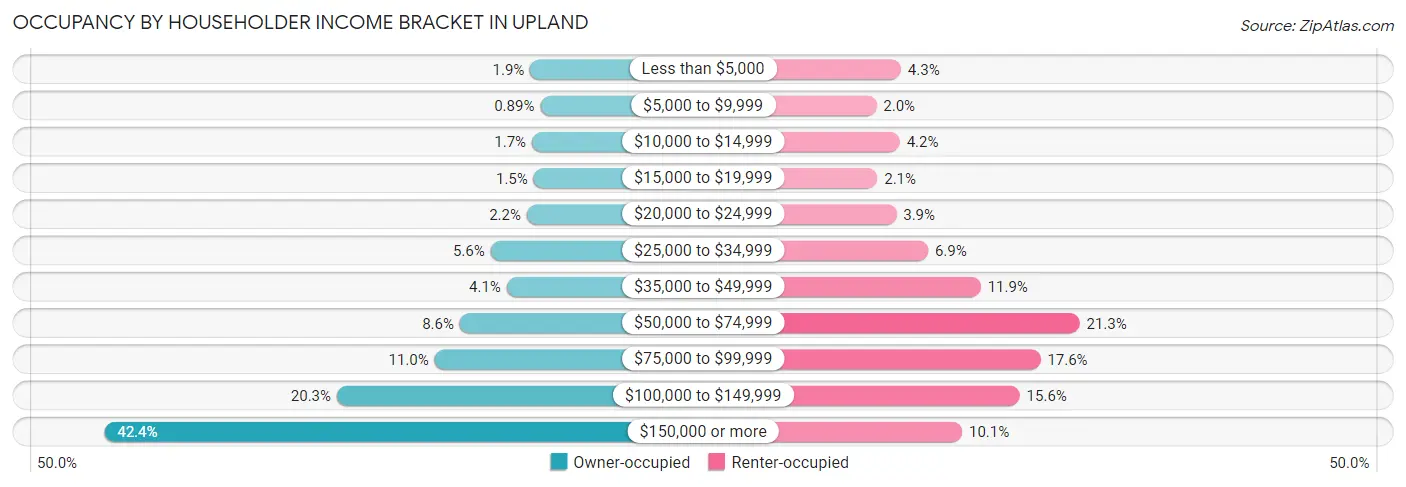
| Income Bracket | Owner-occupied | Renter-occupied |
| Less than $5,000 | 279 (1.8%) | 525 (4.3%) |
| $5,000 to $9,999 | 134 (0.9%) | 241 (2.0%) |
| $10,000 to $14,999 | 254 (1.7%) | 511 (4.2%) |
| $15,000 to $19,999 | 230 (1.5%) | 252 (2.1%) |
| $20,000 to $24,999 | 328 (2.2%) | 471 (3.9%) |
| $25,000 to $34,999 | 848 (5.6%) | 838 (6.9%) |
| $35,000 to $49,999 | 618 (4.1%) | 1,448 (11.9%) |
| $50,000 to $74,999 | 1,290 (8.6%) | 2,590 (21.3%) |
| $75,000 to $99,999 | 1,654 (11.0%) | 2,139 (17.6%) |
| $100,000 to $149,999 | 3,057 (20.3%) | 1,898 (15.6%) |
| $150,000 or more | 6,400 (42.4%) | 1,232 (10.1%) |
| Total | 15,092 (100.0%) | 12,145 (100.0%) |
Monthly Housing Cost Tiers in Upland
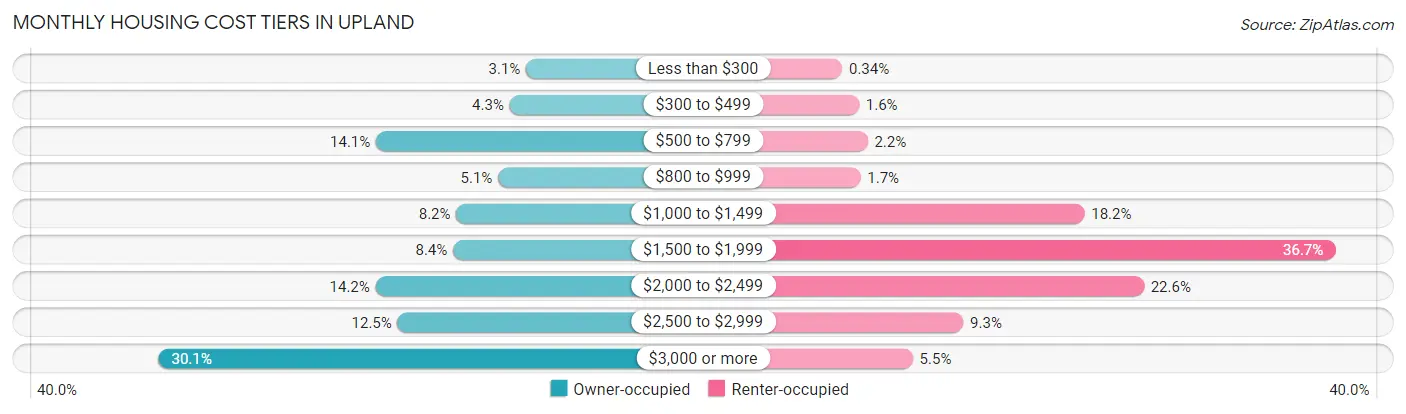
| Monthly Cost | Owner-occupied | Renter-occupied |
| Less than $300 | 462 (3.1%) | 41 (0.3%) |
| $300 to $499 | 644 (4.3%) | 192 (1.6%) |
| $500 to $799 | 2,130 (14.1%) | 268 (2.2%) |
| $800 to $999 | 772 (5.1%) | 205 (1.7%) |
| $1,000 to $1,499 | 1,237 (8.2%) | 2,208 (18.2%) |
| $1,500 to $1,999 | 1,274 (8.4%) | 4,451 (36.6%) |
| $2,000 to $2,499 | 2,135 (14.1%) | 2,740 (22.6%) |
| $2,500 to $2,999 | 1,891 (12.5%) | 1,125 (9.3%) |
| $3,000 or more | 4,547 (30.1%) | 673 (5.5%) |
| Total | 15,092 (100.0%) | 12,145 (100.0%) |
Physical Housing Characteristics in Upland
Housing Structures in Upland
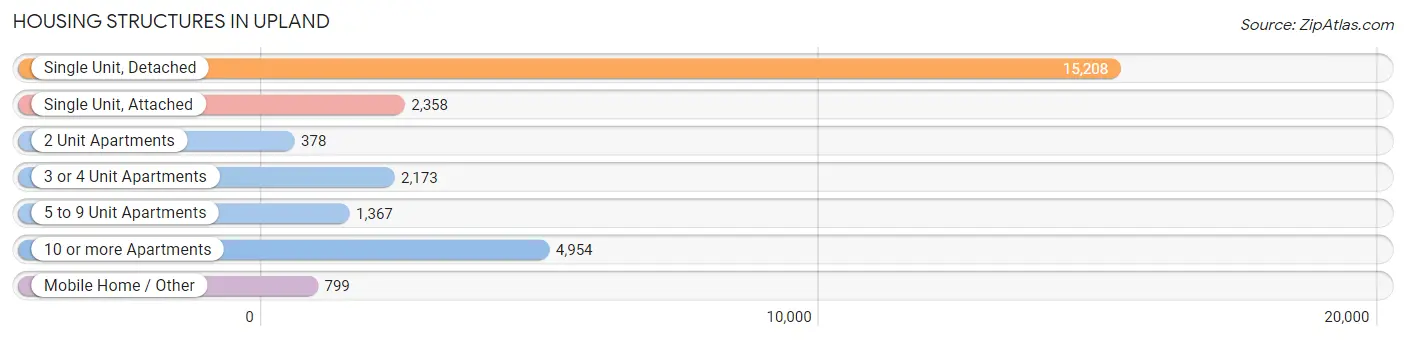
| Structure Type | # Housing Units | % Housing Units |
| Single Unit, Detached | 15,208 | 55.8% |
| Single Unit, Attached | 2,358 | 8.7% |
| 2 Unit Apartments | 378 | 1.4% |
| 3 or 4 Unit Apartments | 2,173 | 8.0% |
| 5 to 9 Unit Apartments | 1,367 | 5.0% |
| 10 or more Apartments | 4,954 | 18.2% |
| Mobile Home / Other | 799 | 2.9% |
| Total | 27,237 | 100.0% |
Housing Structures by Occupancy in Upland
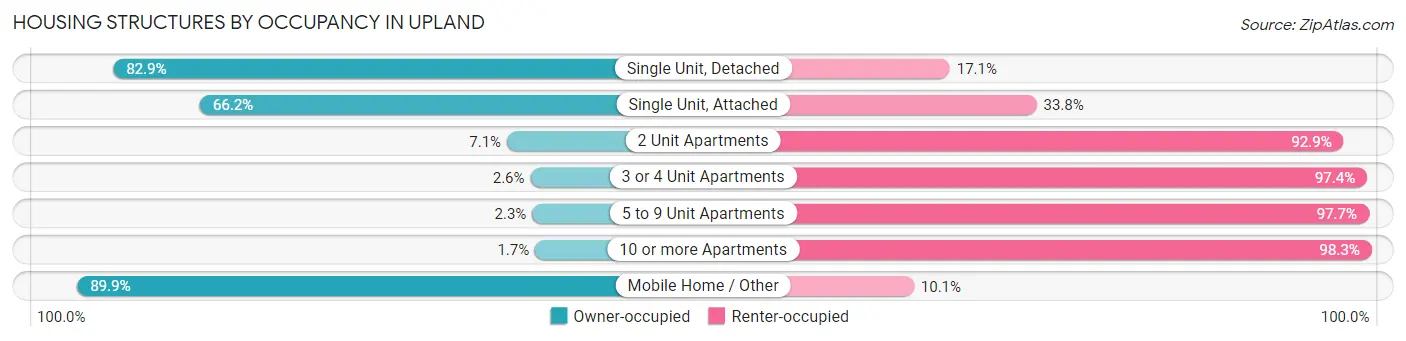
| Structure Type | Owner-occupied | Renter-occupied |
| Single Unit, Detached | 12,612 (82.9%) | 2,596 (17.1%) |
| Single Unit, Attached | 1,562 (66.2%) | 796 (33.8%) |
| 2 Unit Apartments | 27 (7.1%) | 351 (92.9%) |
| 3 or 4 Unit Apartments | 57 (2.6%) | 2,116 (97.4%) |
| 5 to 9 Unit Apartments | 31 (2.3%) | 1,336 (97.7%) |
| 10 or more Apartments | 85 (1.7%) | 4,869 (98.3%) |
| Mobile Home / Other | 718 (89.9%) | 81 (10.1%) |
| Total | 15,092 (55.4%) | 12,145 (44.6%) |
Housing Structures by Number of Rooms in Upland
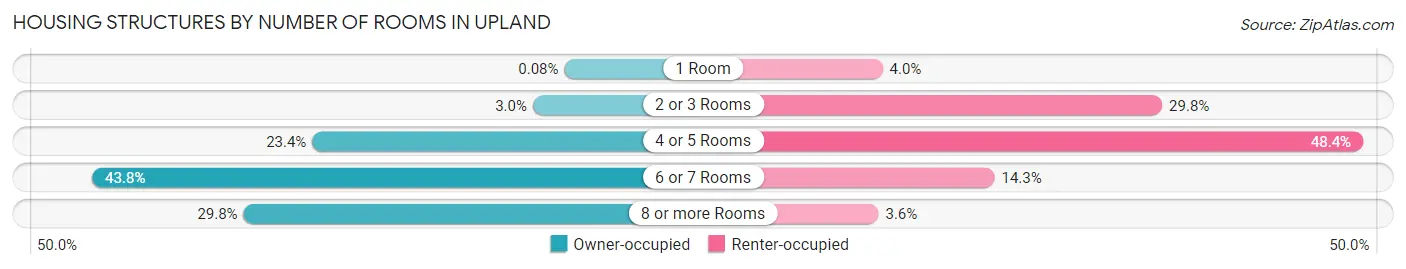
| Number of Rooms | Owner-occupied | Renter-occupied |
| 1 Room | 12 (0.1%) | 480 (4.0%) |
| 2 or 3 Rooms | 453 (3.0%) | 3,619 (29.8%) |
| 4 or 5 Rooms | 3,531 (23.4%) | 5,875 (48.4%) |
| 6 or 7 Rooms | 6,605 (43.8%) | 1,737 (14.3%) |
| 8 or more Rooms | 4,491 (29.8%) | 434 (3.6%) |
| Total | 15,092 (100.0%) | 12,145 (100.0%) |
Housing Structure by Heating Type in Upland
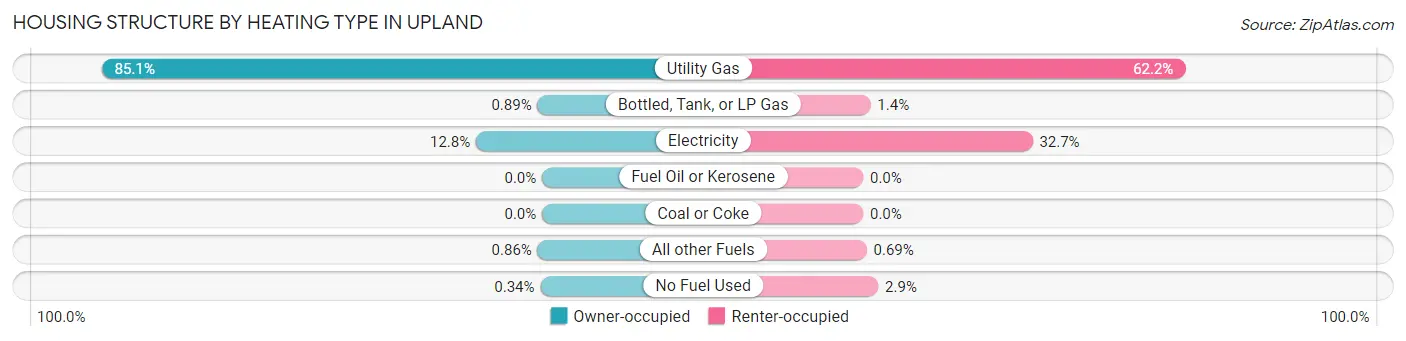
| Heating Type | Owner-occupied | Renter-occupied |
| Utility Gas | 12,850 (85.1%) | 7,559 (62.2%) |
| Bottled, Tank, or LP Gas | 134 (0.9%) | 172 (1.4%) |
| Electricity | 1,926 (12.8%) | 3,975 (32.7%) |
| Fuel Oil or Kerosene | 0 (0.0%) | 0 (0.0%) |
| Coal or Coke | 0 (0.0%) | 0 (0.0%) |
| All other Fuels | 130 (0.9%) | 84 (0.7%) |
| No Fuel Used | 52 (0.3%) | 355 (2.9%) |
| Total | 15,092 (100.0%) | 12,145 (100.0%) |
Household Vehicle Usage in Upland
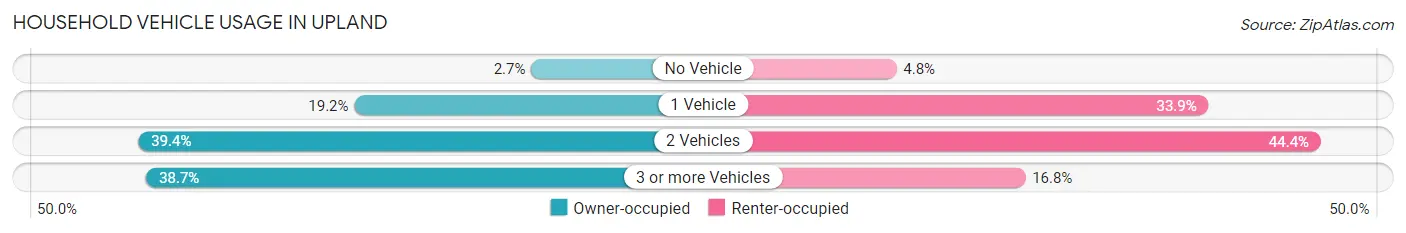
| Vehicles per Household | Owner-occupied | Renter-occupied |
| No Vehicle | 408 (2.7%) | 583 (4.8%) |
| 1 Vehicle | 2,900 (19.2%) | 4,122 (33.9%) |
| 2 Vehicles | 5,948 (39.4%) | 5,396 (44.4%) |
| 3 or more Vehicles | 5,836 (38.7%) | 2,044 (16.8%) |
| Total | 15,092 (100.0%) | 12,145 (100.0%) |
Real Estate & Mortgages in Upland
Real Estate and Mortgage Overview in Upland
| Characteristic | Without Mortgage | With Mortgage |
| Housing Units | 4,565 | 10,527 |
| Median Property Value | $598,700 | $664,100 |
| Median Household Income | $78,239 | $5,472 |
| Monthly Housing Costs | $677 | $4,518 |
| Real Estate Taxes | $3,027 | $186 |
Property Value by Mortgage Status in Upland
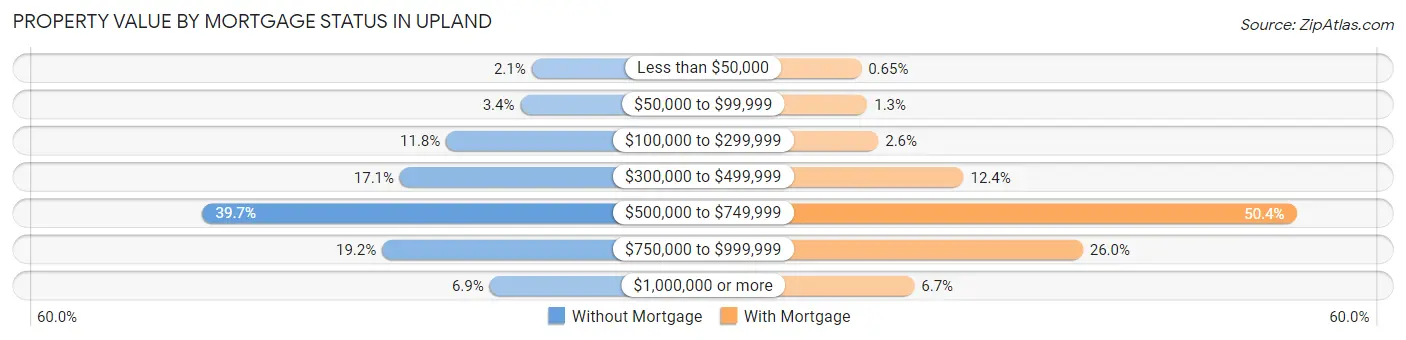
| Property Value | Without Mortgage | With Mortgage |
| Less than $50,000 | 94 (2.1%) | 68 (0.6%) |
| $50,000 to $99,999 | 153 (3.4%) | 141 (1.3%) |
| $100,000 to $299,999 | 540 (11.8%) | 274 (2.6%) |
| $300,000 to $499,999 | 781 (17.1%) | 1,300 (12.3%) |
| $500,000 to $749,999 | 1,810 (39.7%) | 5,303 (50.4%) |
| $750,000 to $999,999 | 874 (19.2%) | 2,734 (26.0%) |
| $1,000,000 or more | 313 (6.9%) | 707 (6.7%) |
| Total | 4,565 (100.0%) | 10,527 (100.0%) |
Household Income by Mortgage Status in Upland
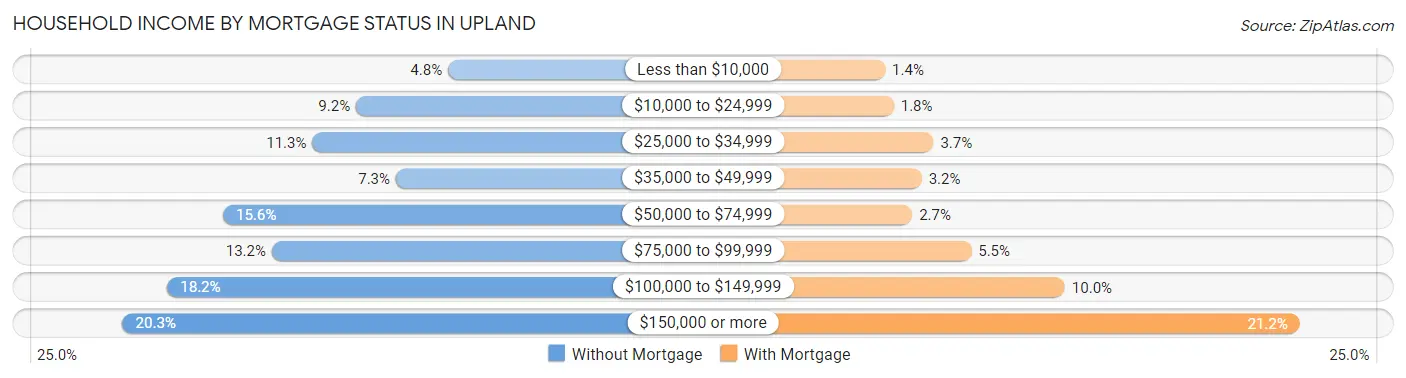
| Household Income | Without Mortgage | With Mortgage |
| Less than $10,000 | 221 (4.8%) | 148 (1.4%) |
| $10,000 to $24,999 | 421 (9.2%) | 192 (1.8%) |
| $25,000 to $34,999 | 516 (11.3%) | 391 (3.7%) |
| $35,000 to $49,999 | 334 (7.3%) | 332 (3.2%) |
| $50,000 to $74,999 | 710 (15.5%) | 284 (2.7%) |
| $75,000 to $99,999 | 604 (13.2%) | 580 (5.5%) |
| $100,000 to $149,999 | 831 (18.2%) | 1,050 (10.0%) |
| $150,000 or more | 928 (20.3%) | 2,226 (21.1%) |
| Total | 4,565 (100.0%) | 10,527 (100.0%) |
Property Value to Household Income Ratio in Upland
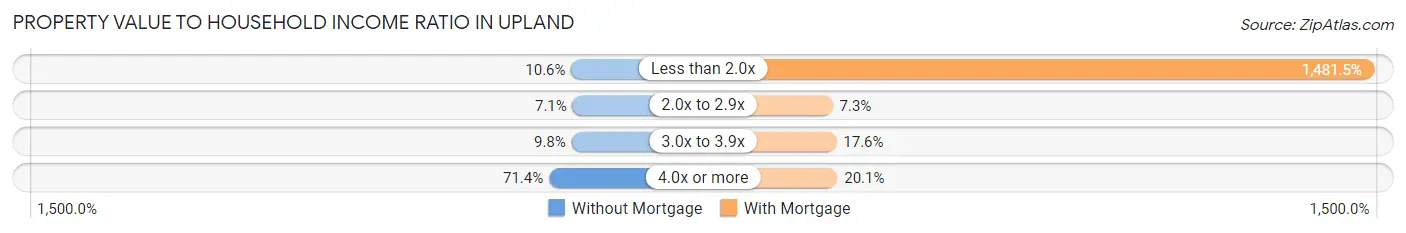
| Value-to-Income Ratio | Without Mortgage | With Mortgage |
| Less than 2.0x | 483 (10.6%) | 155,958 (1,481.5%) |
| 2.0x to 2.9x | 325 (7.1%) | 764 (7.3%) |
| 3.0x to 3.9x | 449 (9.8%) | 1,853 (17.6%) |
| 4.0x or more | 3,257 (71.4%) | 2,117 (20.1%) |
| Total | 4,565 (100.0%) | 10,527 (100.0%) |
Real Estate Taxes by Mortgage Status in Upland
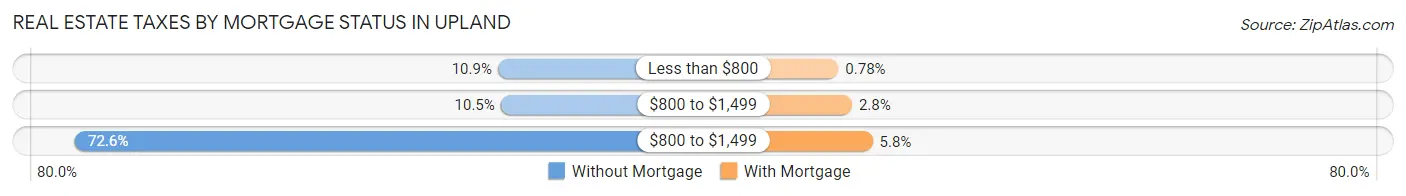
| Property Taxes | Without Mortgage | With Mortgage |
| Less than $800 | 496 (10.9%) | 82 (0.8%) |
| $800 to $1,499 | 477 (10.4%) | 291 (2.8%) |
| $800 to $1,499 | 3,315 (72.6%) | 608 (5.8%) |
| Total | 4,565 (100.0%) | 10,527 (100.0%) |
Health & Disability in Upland
Health Insurance Coverage by Age in Upland
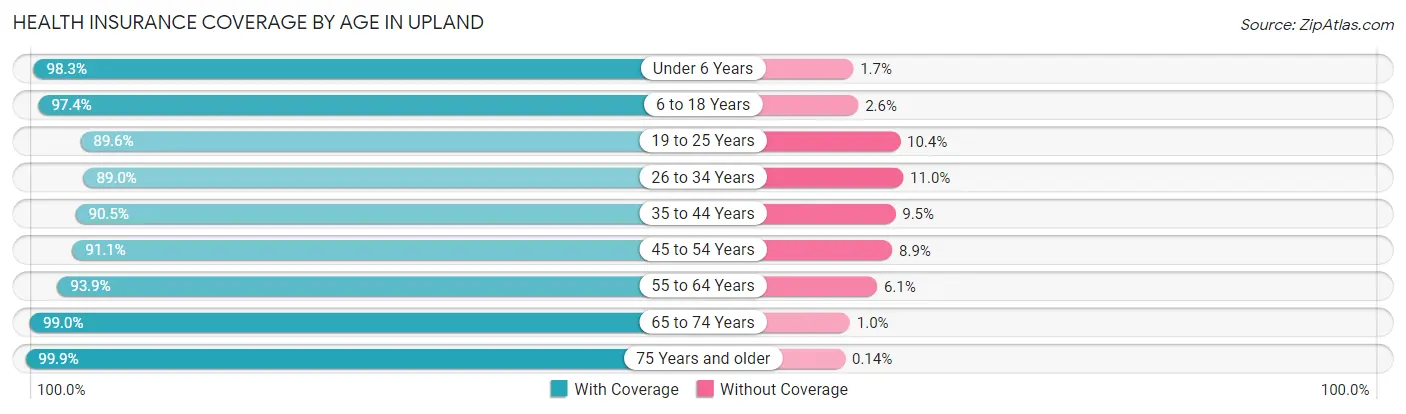
| Age Bracket | With Coverage | Without Coverage |
| Under 6 Years | 5,233 (98.3%) | 89 (1.7%) |
| 6 to 18 Years | 11,999 (97.4%) | 319 (2.6%) |
| 19 to 25 Years | 7,466 (89.6%) | 866 (10.4%) |
| 26 to 34 Years | 10,070 (89.0%) | 1,242 (11.0%) |
| 35 to 44 Years | 9,103 (90.5%) | 957 (9.5%) |
| 45 to 54 Years | 9,226 (91.1%) | 903 (8.9%) |
| 55 to 64 Years | 8,695 (93.9%) | 565 (6.1%) |
| 65 to 74 Years | 6,429 (99.0%) | 67 (1.0%) |
| 75 Years and older | 5,129 (99.9%) | 7 (0.1%) |
| Total | 73,350 (93.6%) | 5,015 (6.4%) |
Health Insurance Coverage by Citizenship Status in Upland
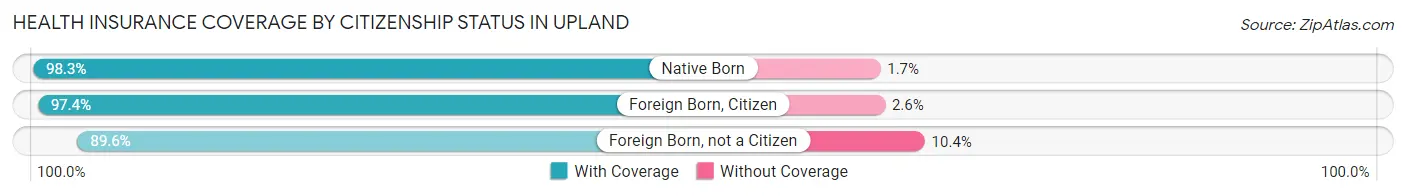
| Citizenship Status | With Coverage | Without Coverage |
| Native Born | 5,233 (98.3%) | 89 (1.7%) |
| Foreign Born, Citizen | 11,999 (97.4%) | 319 (2.6%) |
| Foreign Born, not a Citizen | 7,466 (89.6%) | 866 (10.4%) |
Health Insurance Coverage by Household Income in Upland
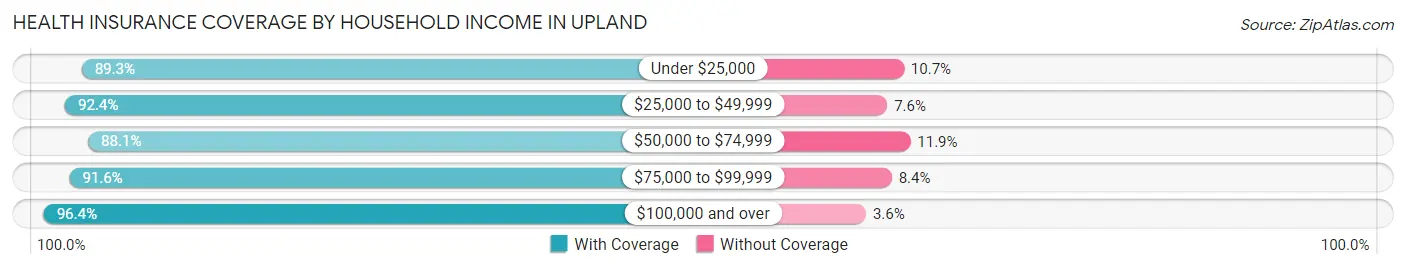
| Household Income | With Coverage | Without Coverage |
| Under $25,000 | 5,639 (89.3%) | 676 (10.7%) |
| $25,000 to $49,999 | 7,535 (92.4%) | 618 (7.6%) |
| $50,000 to $74,999 | 8,974 (88.1%) | 1,213 (11.9%) |
| $75,000 to $99,999 | 10,425 (91.6%) | 957 (8.4%) |
| $100,000 and over | 40,273 (96.4%) | 1,499 (3.6%) |
Public vs Private Health Insurance Coverage by Age in Upland
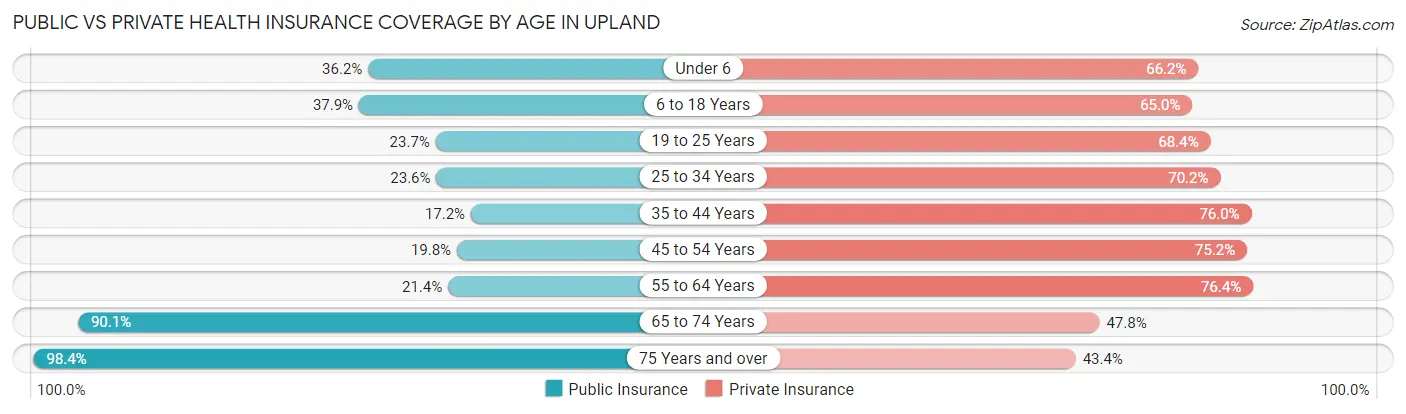
| Age Bracket | Public Insurance | Private Insurance |
| Under 6 | 1,928 (36.2%) | 3,521 (66.2%) |
| 6 to 18 Years | 4,674 (37.9%) | 8,012 (65.0%) |
| 19 to 25 Years | 1,975 (23.7%) | 5,702 (68.4%) |
| 25 to 34 Years | 2,666 (23.6%) | 7,946 (70.2%) |
| 35 to 44 Years | 1,725 (17.2%) | 7,649 (76.0%) |
| 45 to 54 Years | 2,000 (19.8%) | 7,620 (75.2%) |
| 55 to 64 Years | 1,982 (21.4%) | 7,070 (76.3%) |
| 65 to 74 Years | 5,852 (90.1%) | 3,107 (47.8%) |
| 75 Years and over | 5,051 (98.4%) | 2,230 (43.4%) |
| Total | 27,853 (35.5%) | 52,857 (67.4%) |
Disability Status by Sex by Age in Upland
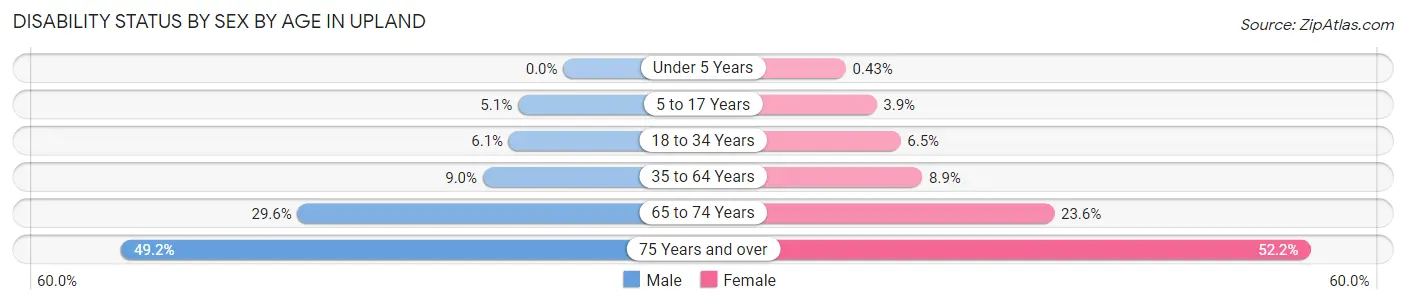
| Age Bracket | Male | Female |
| Under 5 Years | 0 (0.0%) | 10 (0.4%) |
| 5 to 17 Years | 295 (5.1%) | 247 (3.8%) |
| 18 to 34 Years | 591 (6.1%) | 692 (6.5%) |
| 35 to 64 Years | 1,299 (9.0%) | 1,337 (8.9%) |
| 65 to 74 Years | 916 (29.6%) | 804 (23.6%) |
| 75 Years and over | 1,101 (49.2%) | 1,513 (52.2%) |
Disability Class by Sex by Age in Upland
Disability Class: Hearing Difficulty
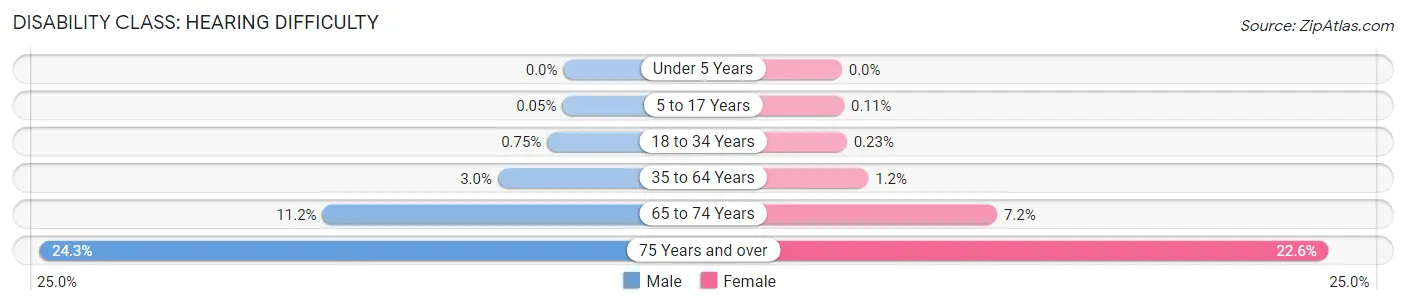
| Age Bracket | Male | Female |
| Under 5 Years | 0 (0.0%) | 0 (0.0%) |
| 5 to 17 Years | 3 (0.1%) | 7 (0.1%) |
| 18 to 34 Years | 73 (0.7%) | 24 (0.2%) |
| 35 to 64 Years | 440 (3.0%) | 184 (1.2%) |
| 65 to 74 Years | 346 (11.2%) | 245 (7.2%) |
| 75 Years and over | 544 (24.3%) | 655 (22.6%) |
Disability Class: Vision Difficulty
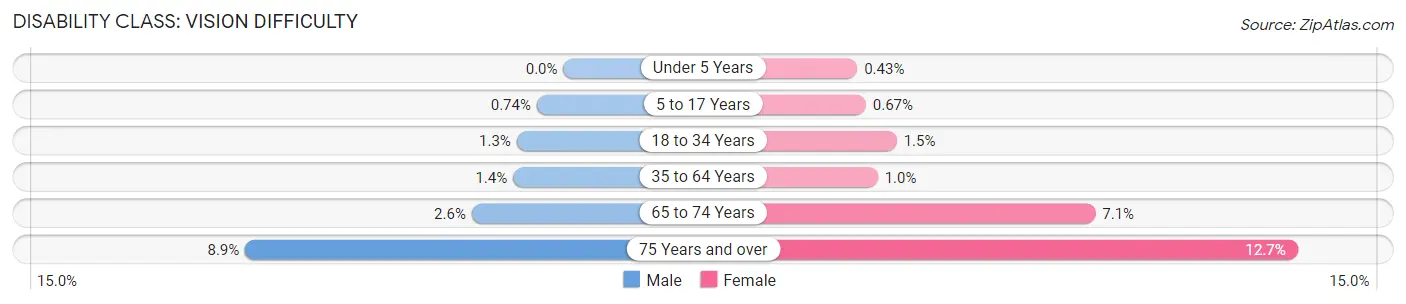
| Age Bracket | Male | Female |
| Under 5 Years | 0 (0.0%) | 10 (0.4%) |
| 5 to 17 Years | 43 (0.7%) | 43 (0.7%) |
| 18 to 34 Years | 127 (1.3%) | 162 (1.5%) |
| 35 to 64 Years | 203 (1.4%) | 150 (1.0%) |
| 65 to 74 Years | 79 (2.5%) | 240 (7.1%) |
| 75 Years and over | 198 (8.9%) | 368 (12.7%) |
Disability Class: Cognitive Difficulty
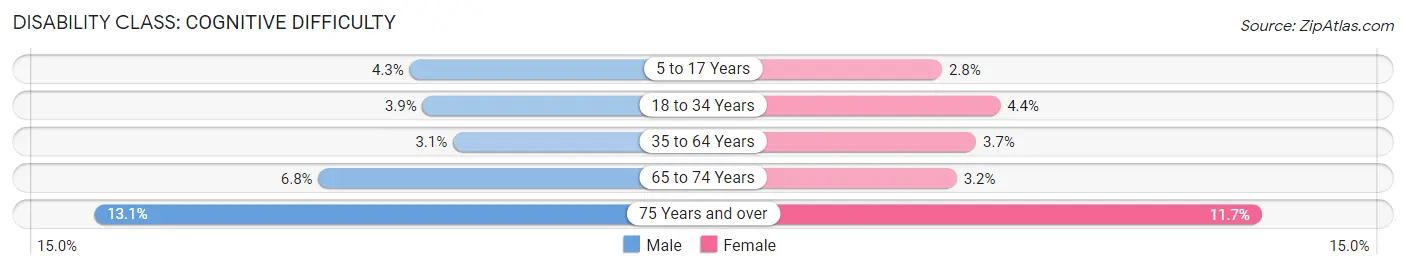
| Age Bracket | Male | Female |
| 5 to 17 Years | 250 (4.3%) | 179 (2.8%) |
| 18 to 34 Years | 383 (3.9%) | 468 (4.4%) |
| 35 to 64 Years | 445 (3.1%) | 560 (3.7%) |
| 65 to 74 Years | 211 (6.8%) | 109 (3.2%) |
| 75 Years and over | 292 (13.1%) | 339 (11.7%) |
Disability Class: Ambulatory Difficulty
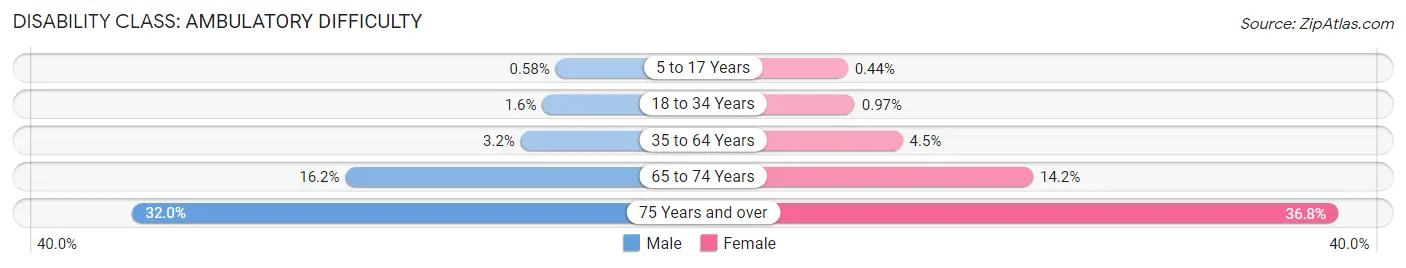
| Age Bracket | Male | Female |
| 5 to 17 Years | 34 (0.6%) | 28 (0.4%) |
| 18 to 34 Years | 152 (1.6%) | 103 (1.0%) |
| 35 to 64 Years | 459 (3.2%) | 676 (4.5%) |
| 65 to 74 Years | 501 (16.2%) | 483 (14.2%) |
| 75 Years and over | 715 (32.0%) | 1,068 (36.8%) |
Disability Class: Self-Care Difficulty
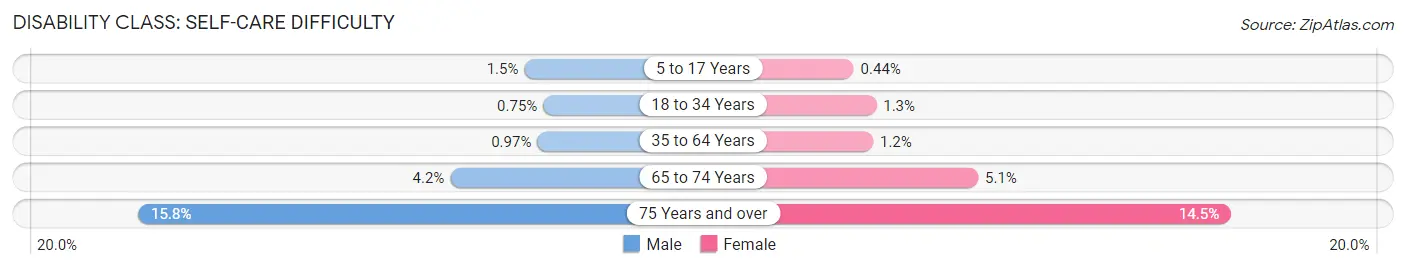
| Age Bracket | Male | Female |
| 5 to 17 Years | 85 (1.5%) | 28 (0.4%) |
| 18 to 34 Years | 73 (0.7%) | 136 (1.3%) |
| 35 to 64 Years | 141 (1.0%) | 174 (1.2%) |
| 65 to 74 Years | 130 (4.2%) | 172 (5.1%) |
| 75 Years and over | 353 (15.8%) | 419 (14.4%) |
Technology Access in Upland
Computing Device Access in Upland
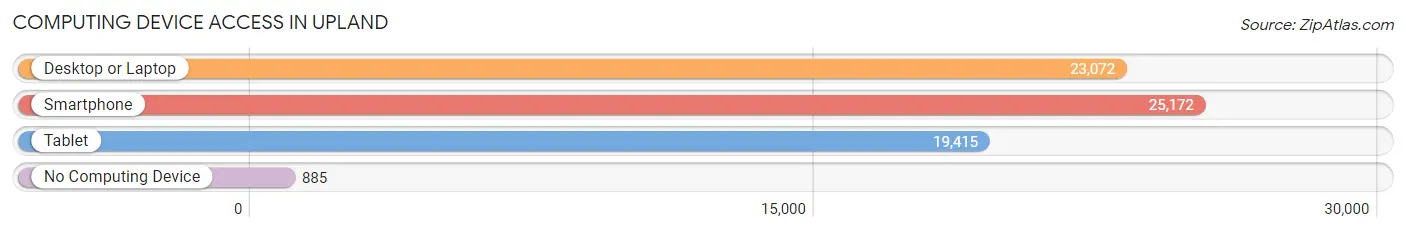
| Device Type | # Households | % Households |
| Desktop or Laptop | 23,072 | 84.7% |
| Smartphone | 25,172 | 92.4% |
| Tablet | 19,415 | 71.3% |
| No Computing Device | 885 | 3.3% |
| Total | 27,237 | 100.0% |
Internet Access in Upland
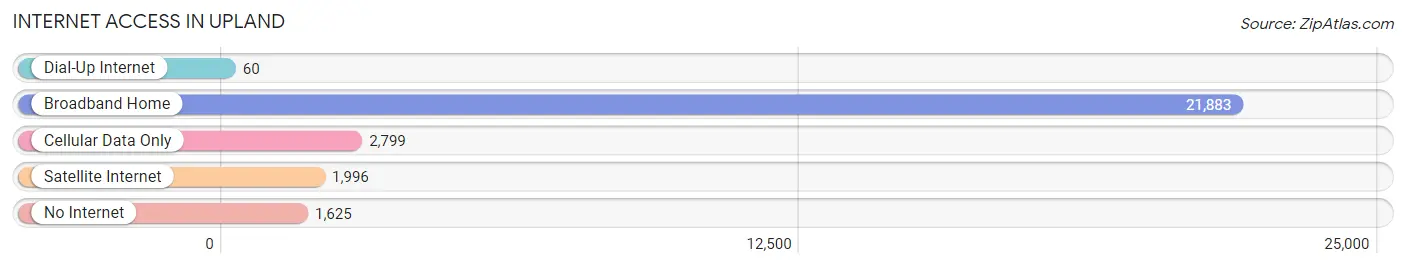
| Internet Type | # Households | % Households |
| Dial-Up Internet | 60 | 0.2% |
| Broadband Home | 21,883 | 80.3% |
| Cellular Data Only | 2,799 | 10.3% |
| Satellite Internet | 1,996 | 7.3% |
| No Internet | 1,625 | 6.0% |
| Total | 27,237 | 100.0% |
Upland Summary
Upland, California is a city located in San Bernardino County, California, United States. The city is situated at the foothills of the San Gabriel Mountains, and is located approximately 40 miles east of downtown Los Angeles. Upland is home to a population of approximately 73,732 people, as of the 2010 census.
History
Upland was founded in 1906 by George and William Chaffey, two brothers who had previously founded the city of Ontario. The brothers purchased the land that would become Upland from the San Antonio Land Company, and began to develop the area. The city was originally named North Ontario, but was later changed to Upland in 1910.
The city experienced rapid growth in the early 20th century, due to the development of the citrus industry in the area. The citrus industry was a major source of employment for the city, and helped to fuel its growth. The city was incorporated in 1906, and by the 1920s, it had become a major center for citrus production.
Geography
Upland is located in the foothills of the San Gabriel Mountains, and is situated at an elevation of 1,242 feet. The city covers an area of approximately 19.6 square miles, and is located approximately 40 miles east of downtown Los Angeles. The city is bordered by the cities of Rancho Cucamonga to the north, Montclair to the east, Claremont to the south, and Ontario to the west.
The city is located in the Inland Empire region of California, and is part of the Greater Los Angeles Area. The city is located in the San Bernardino Valley, and is surrounded by several mountain ranges, including the San Gabriel Mountains to the north, the San Bernardino Mountains to the east, and the San Jacinto Mountains to the south.
Economy
Upland’s economy is largely based on the service industry, with many residents employed in retail, healthcare, and education. The city is also home to several major employers, including the University of La Verne, the Upland Unified School District, and the San Antonio Community Hospital.
The city is also home to several major shopping centers, including the Upland Town Center, the Upland Plaza, and the Upland Village Shopping Center. The city is also home to several major employers, including the University of La Verne, the Upland Unified School District, and the San Antonio Community Hospital.
Demographics
As of the 2010 census, Upland had a population of 73,732 people. The racial makeup of the city was 57.2% White, 4.2% African American, 1.2% Native American, 8.2% Asian, 0.3% Pacific Islander, 25.2% from other races, and 3.7% from two or more races. Hispanic or Latino of any race were 44.2% of the population.
The median household income in Upland was $60,945, and the median family income was $68,945. The per capita income for the city was $27,845. About 11.2% of families and 14.2% of the population were below the poverty line, including 19.2% of those under age 18 and 8.2% of those age 65 or over.
Upland is a diverse city, with a variety of cultures and backgrounds represented. The city is home to a large Hispanic population, as well as a significant Asian population. The city is also home to a large number of immigrants, with many coming from Mexico, the Philippines, India, and China.
Common Questions
What is Per Capita Income in Upland?
Per Capita income in Upland is $42,026.
What is the Median Family Income in Upland?
Median Family Income in Upland is $104,246.
What is the Median Household income in Upland?
Median Household Income in Upland is $93,994.
What is Income or Wage Gap in Upland?
Income or Wage Gap in Upland is 29.5%.
Women in Upland earn 70.5 cents for every dollar earned by a man.
What is Family Income Deficit in Upland?
Family Income Deficit in Upland is $11,238.
Families that are below poverty line in Upland earn $11,238 less on average than the poverty threshold level.
What is Inequality or Gini Index in Upland?
Inequality or Gini Index in Upland is 0.44.
What is the Total Population of Upland?
Total Population of Upland is 78,847.
What is the Total Male Population of Upland?
Total Male Population of Upland is 37,933.
What is the Total Female Population of Upland?
Total Female Population of Upland is 40,914.
What is the Ratio of Males per 100 Females in Upland?
There are 92.71 Males per 100 Females in Upland.
What is the Ratio of Females per 100 Males in Upland?
There are 107.86 Females per 100 Males in Upland.
What is the Median Population Age in Upland?
Median Population Age in Upland is 37.1 Years.
What is the Average Family Size in Upland
Average Family Size in Upland is 3.3 People.
What is the Average Household Size in Upland
Average Household Size in Upland is 2.9 People.
How Large is the Labor Force in Upland?
There are 42,360 People in the Labor Forcein in Upland.
What is the Percentage of People in the Labor Force in Upland?
66.2% of People are in the Labor Force in Upland.
What is the Unemployment Rate in Upland?
Unemployment Rate in Upland is 4.9%.