Lake Elsinore, CA Map & Demographics
Lake Elsinore Map
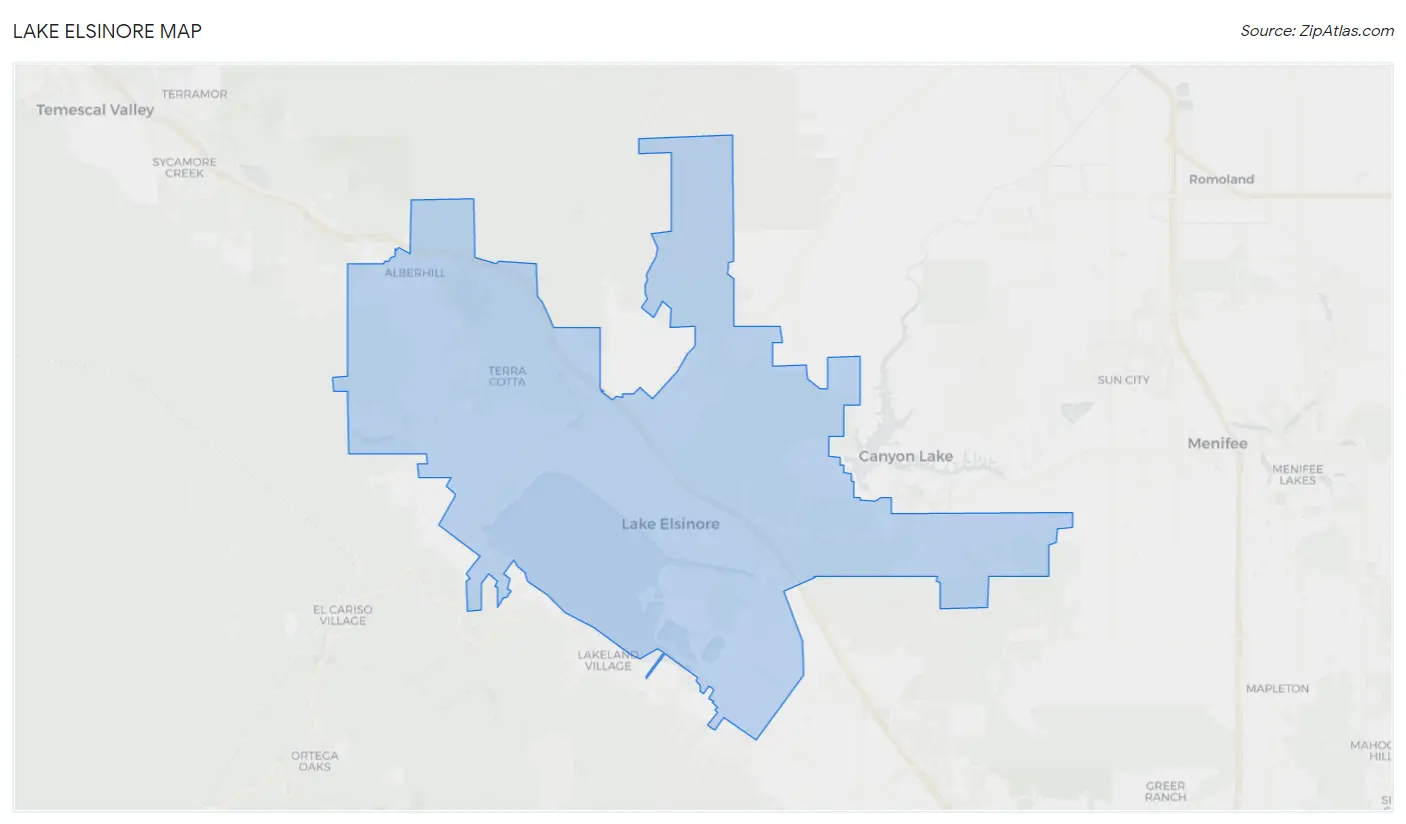
Lake Elsinore Overview
$32,792
PER CAPITA INCOME
$95,168
AVG FAMILY INCOME
$89,788
AVG HOUSEHOLD INCOME
38.4%
WAGE / INCOME GAP [ % ]
61.6¢/ $1
WAGE / INCOME GAP [ $ ]
0.41
INEQUALITY / GINI INDEX
69,993
TOTAL POPULATION
35,102
MALE POPULATION
34,891
FEMALE POPULATION
100.60
MALES / 100 FEMALES
99.40
FEMALES / 100 MALES
32.5
MEDIAN AGE
3.9
AVG FAMILY SIZE
3.5
AVG HOUSEHOLD SIZE
34,627
LABOR FORCE [ PEOPLE ]
65.9%
PERCENT IN LABOR FORCE
6.9%
UNEMPLOYMENT RATE
Lake Elsinore Area Codes
Income in Lake Elsinore
Income Overview in Lake Elsinore
Per Capita Income in Lake Elsinore is $32,792, while median incomes of families and households are $95,168 and $89,788 respectively.
| Characteristic | Number | Measure |
| Per Capita Income | 69,993 | $32,792 |
| Median Family Income | 16,027 | $95,168 |
| Mean Family Income | 16,027 | $111,758 |
| Median Household Income | 20,004 | $89,788 |
| Mean Household Income | 20,004 | $111,044 |
| Income Deficit | 16,027 | $0 |
| Wage / Income Gap (%) | 69,993 | 38.39% |
| Wage / Income Gap ($) | 69,993 | 61.61¢ per $1 |
| Gini / Inequality Index | 69,993 | 0.41 |
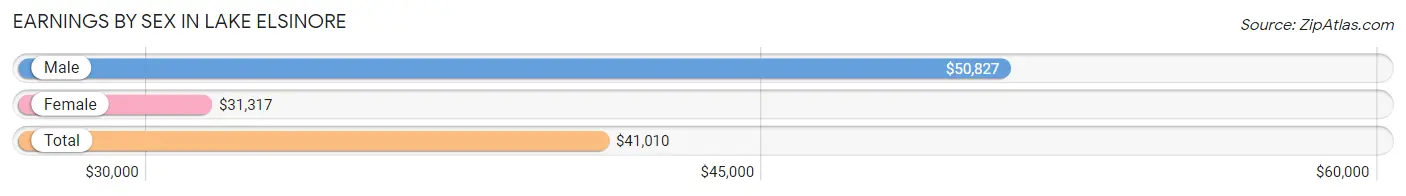
Earnings by Sex in Lake Elsinore
Average Earnings in Lake Elsinore are $41,010, $50,827 for men and $31,317 for women, a difference of 38.4%.
| Sex | Number | Average Earnings |
| Male | 19,358 (55.0%) | $50,827 |
| Female | 15,827 (45.0%) | $31,317 |
| Total | 35,185 (100.0%) | $41,010 |
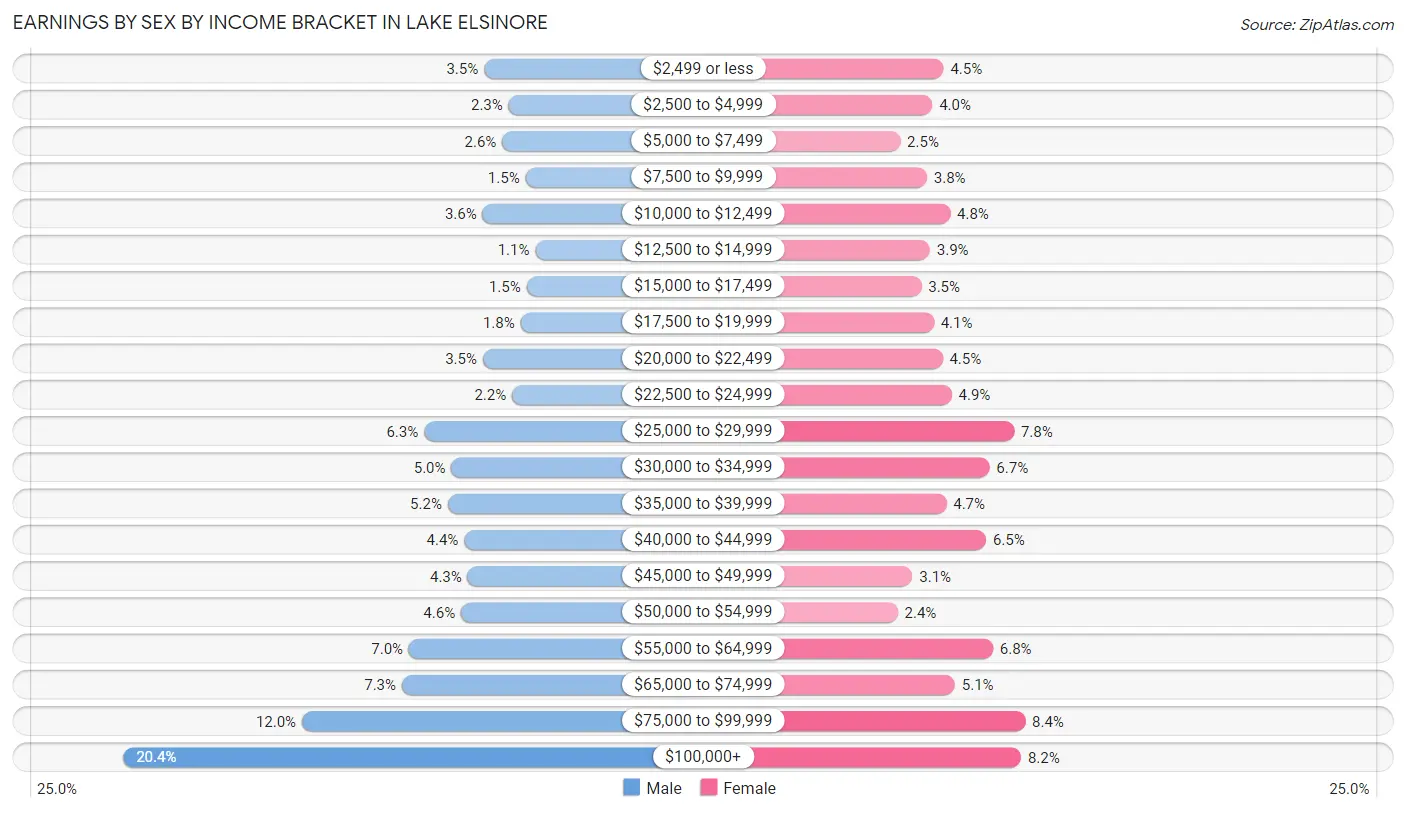
Earnings by Sex by Income Bracket in Lake Elsinore
The most common earnings brackets in Lake Elsinore are $100,000+ for men (3,945 | 20.4%) and $75,000 to $99,999 for women (1,322 | 8.4%).
| Income | Male | Female |
| $2,499 or less | 674 (3.5%) | 717 (4.5%) |
| $2,500 to $4,999 | 451 (2.3%) | 633 (4.0%) |
| $5,000 to $7,499 | 510 (2.6%) | 395 (2.5%) |
| $7,500 to $9,999 | 299 (1.5%) | 593 (3.7%) |
| $10,000 to $12,499 | 687 (3.5%) | 766 (4.8%) |
| $12,500 to $14,999 | 209 (1.1%) | 615 (3.9%) |
| $15,000 to $17,499 | 289 (1.5%) | 552 (3.5%) |
| $17,500 to $19,999 | 343 (1.8%) | 644 (4.1%) |
| $20,000 to $22,499 | 686 (3.5%) | 709 (4.5%) |
| $22,500 to $24,999 | 420 (2.2%) | 777 (4.9%) |
| $25,000 to $29,999 | 1,217 (6.3%) | 1,239 (7.8%) |
| $30,000 to $34,999 | 970 (5.0%) | 1,057 (6.7%) |
| $35,000 to $39,999 | 1,002 (5.2%) | 738 (4.7%) |
| $40,000 to $44,999 | 854 (4.4%) | 1,032 (6.5%) |
| $45,000 to $49,999 | 822 (4.3%) | 486 (3.1%) |
| $50,000 to $54,999 | 883 (4.6%) | 377 (2.4%) |
| $55,000 to $64,999 | 1,355 (7.0%) | 1,082 (6.8%) |
| $65,000 to $74,999 | 1,418 (7.3%) | 801 (5.1%) |
| $75,000 to $99,999 | 2,324 (12.0%) | 1,322 (8.4%) |
| $100,000+ | 3,945 (20.4%) | 1,292 (8.2%) |
| Total | 19,358 (100.0%) | 15,827 (100.0%) |
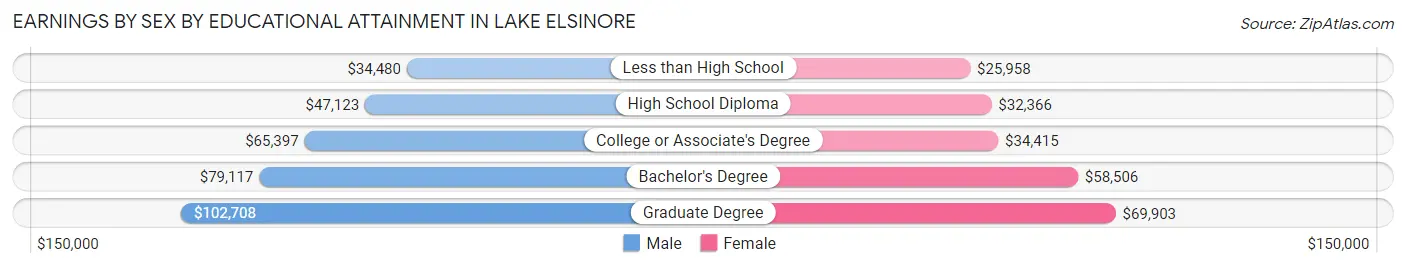
Earnings by Sex by Educational Attainment in Lake Elsinore
Average earnings in Lake Elsinore are $59,271 for men and $37,340 for women, a difference of 37.0%. Men with an educational attainment of graduate degree enjoy the highest average annual earnings of $102,708, while those with less than high school education earn the least with $34,480. Women with an educational attainment of graduate degree earn the most with the average annual earnings of $69,903, while those with less than high school education have the smallest earnings of $25,958.
| Educational Attainment | Male Income | Female Income |
| Less than High School | $34,480 | $25,958 |
| High School Diploma | $47,123 | $32,366 |
| College or Associate's Degree | $65,397 | $34,415 |
| Bachelor's Degree | $79,117 | $58,506 |
| Graduate Degree | $102,708 | $69,903 |
| Total | $59,271 | $37,340 |
Family Income in Lake Elsinore
Family Income Brackets in Lake Elsinore
According to the Lake Elsinore family income data, there are 3,590 families falling into the $100,000 to $149,999 income range, which is the most common income bracket and makes up 22.4% of all families. Conversely, the $10,000 to $14,999 income bracket is the least frequent group with only 80 families (0.5%) belonging to this category.
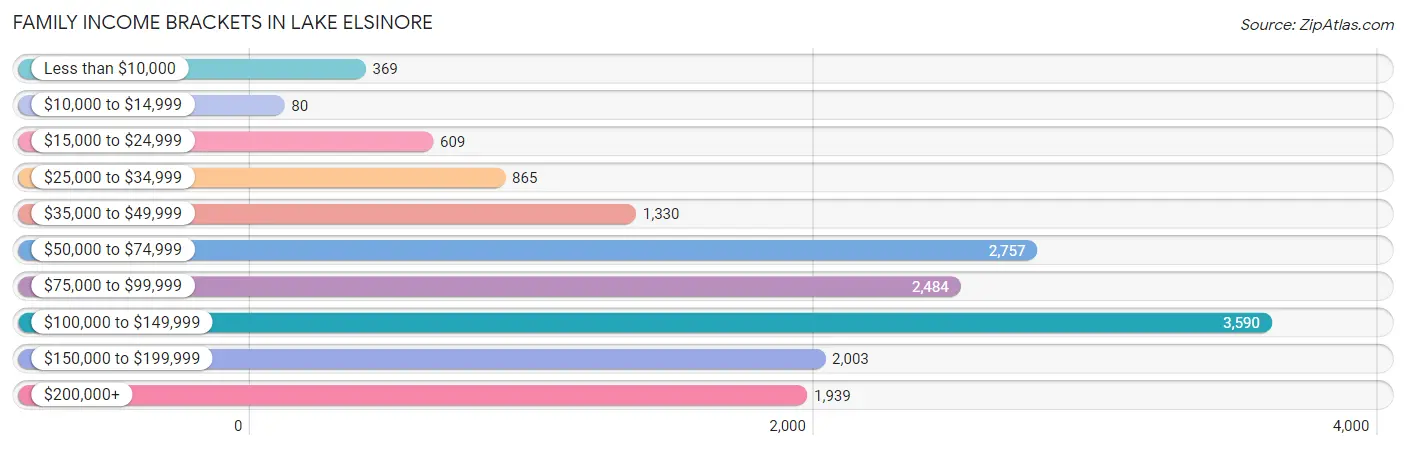
| Income Bracket | # Families | % Families |
| Less than $10,000 | 369 | 2.3% |
| $10,000 to $14,999 | 80 | 0.5% |
| $15,000 to $24,999 | 609 | 3.8% |
| $25,000 to $34,999 | 865 | 5.4% |
| $35,000 to $49,999 | 1,330 | 8.3% |
| $50,000 to $74,999 | 2,757 | 17.2% |
| $75,000 to $99,999 | 2,484 | 15.5% |
| $100,000 to $149,999 | 3,590 | 22.4% |
| $150,000 to $199,999 | 2,003 | 12.5% |
| $200,000+ | 1,939 | 12.1% |
Family Income by Famaliy Size in Lake Elsinore
7+ person families (654 | 4.1%) account for the highest median family income in Lake Elsinore with $135,291 per family, while 2-person families (4,623 | 28.8%) have the highest median income of $45,782 per family member.
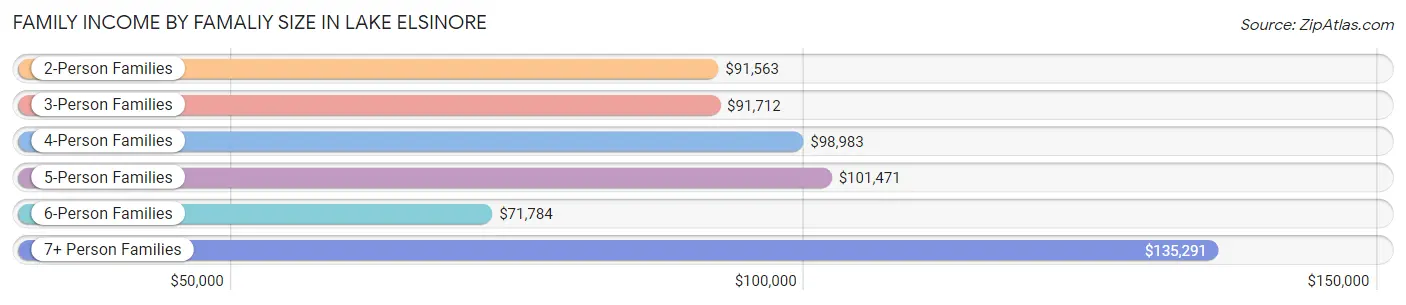
| Income Bracket | # Families | Median Income |
| 2-Person Families | 4,623 (28.8%) | $91,563 |
| 3-Person Families | 3,443 (21.5%) | $91,712 |
| 4-Person Families | 3,758 (23.4%) | $98,983 |
| 5-Person Families | 2,674 (16.7%) | $101,471 |
| 6-Person Families | 875 (5.5%) | $71,784 |
| 7+ Person Families | 654 (4.1%) | $135,291 |
| Total | 16,027 (100.0%) | $95,168 |
Family Income by Number of Earners in Lake Elsinore
The median family income in Lake Elsinore is $95,168, with families comprising 3+ earners (2,723) having the highest median family income of $137,297, while families with no earners (1,311) have the lowest median family income of $28,011, accounting for 17.0% and 8.2% of families, respectively.
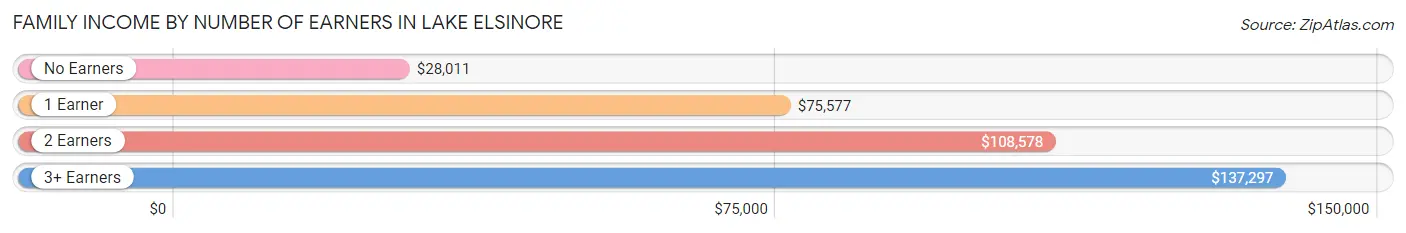
| Number of Earners | # Families | Median Income |
| No Earners | 1,311 (8.2%) | $28,011 |
| 1 Earner | 5,000 (31.2%) | $75,577 |
| 2 Earners | 6,993 (43.6%) | $108,578 |
| 3+ Earners | 2,723 (17.0%) | $137,297 |
| Total | 16,027 (100.0%) | $95,168 |
Household Income in Lake Elsinore
Household Income Brackets in Lake Elsinore
With 4,201 households falling in the category, the $100,000 to $149,999 income range is the most frequent in Lake Elsinore, accounting for 21.0% of all households. In contrast, only 200 households (1.0%) fall into the $10,000 to $14,999 income bracket, making it the least populous group.
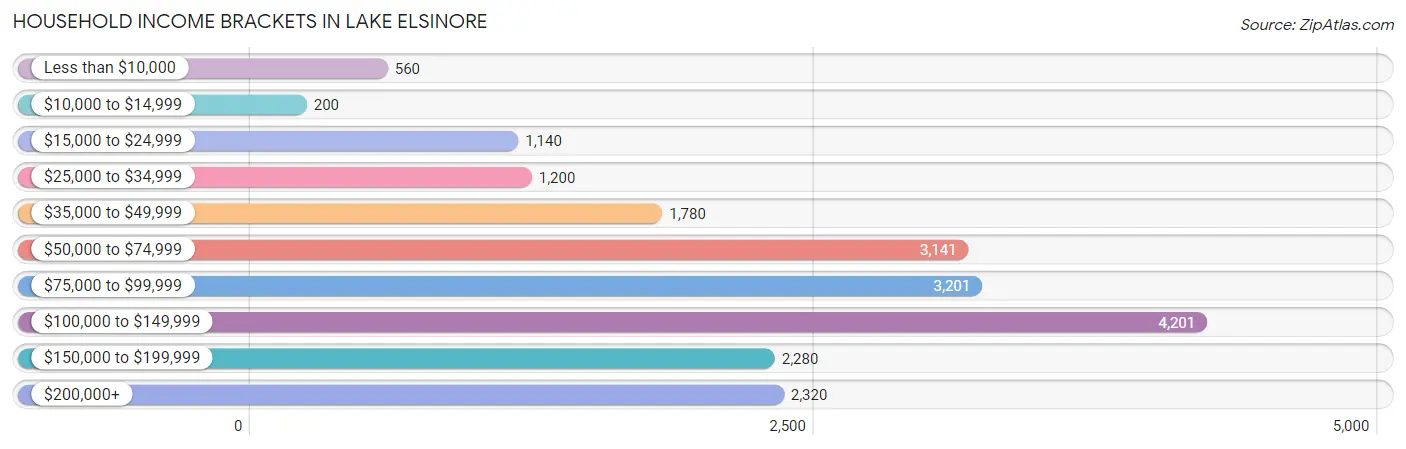
| Income Bracket | # Households | % Households |
| Less than $10,000 | 560 | 2.8% |
| $10,000 to $14,999 | 200 | 1.0% |
| $15,000 to $24,999 | 1,140 | 5.7% |
| $25,000 to $34,999 | 1,200 | 6.0% |
| $35,000 to $49,999 | 1,780 | 8.9% |
| $50,000 to $74,999 | 3,141 | 15.7% |
| $75,000 to $99,999 | 3,201 | 16.0% |
| $100,000 to $149,999 | 4,201 | 21.0% |
| $150,000 to $199,999 | 2,280 | 11.4% |
| $200,000+ | 2,320 | 11.6% |
Household Income by Householder Age in Lake Elsinore
The median household income in Lake Elsinore is $89,788, with the highest median household income of $94,252 found in the 25 to 44 years age bracket for the primary householder. A total of 8,718 households (43.6%) fall into this category. Meanwhile, the 65+ years age bracket for the primary householder has the lowest median household income of $66,192, with 2,589 households (12.9%) in this group.
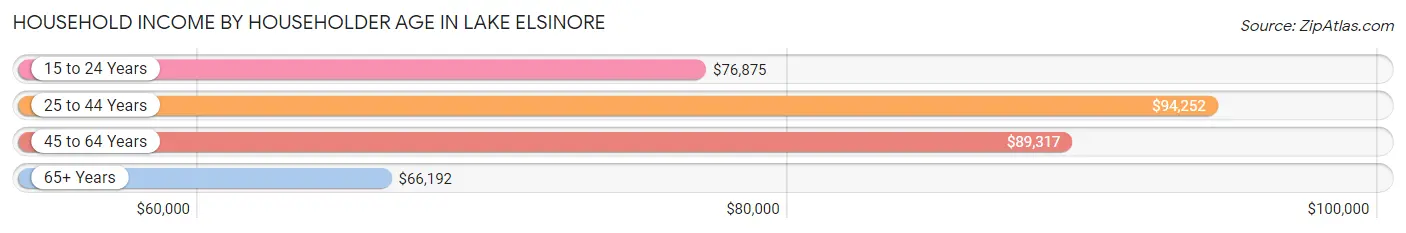
| Income Bracket | # Households | Median Income |
| 15 to 24 Years | 757 (3.8%) | $76,875 |
| 25 to 44 Years | 8,718 (43.6%) | $94,252 |
| 45 to 64 Years | 7,940 (39.7%) | $89,317 |
| 65+ Years | 2,589 (12.9%) | $66,192 |
| Total | 20,004 (100.0%) | $89,788 |
Poverty in Lake Elsinore
Income Below Poverty by Sex and Age in Lake Elsinore
With 8.6% poverty level for males and 12.1% for females among the residents of Lake Elsinore, 6 to 11 year old males and 5 year old females are the most vulnerable to poverty, with 732 males (20.6%) and 117 females (34.0%) in their respective age groups living below the poverty level.
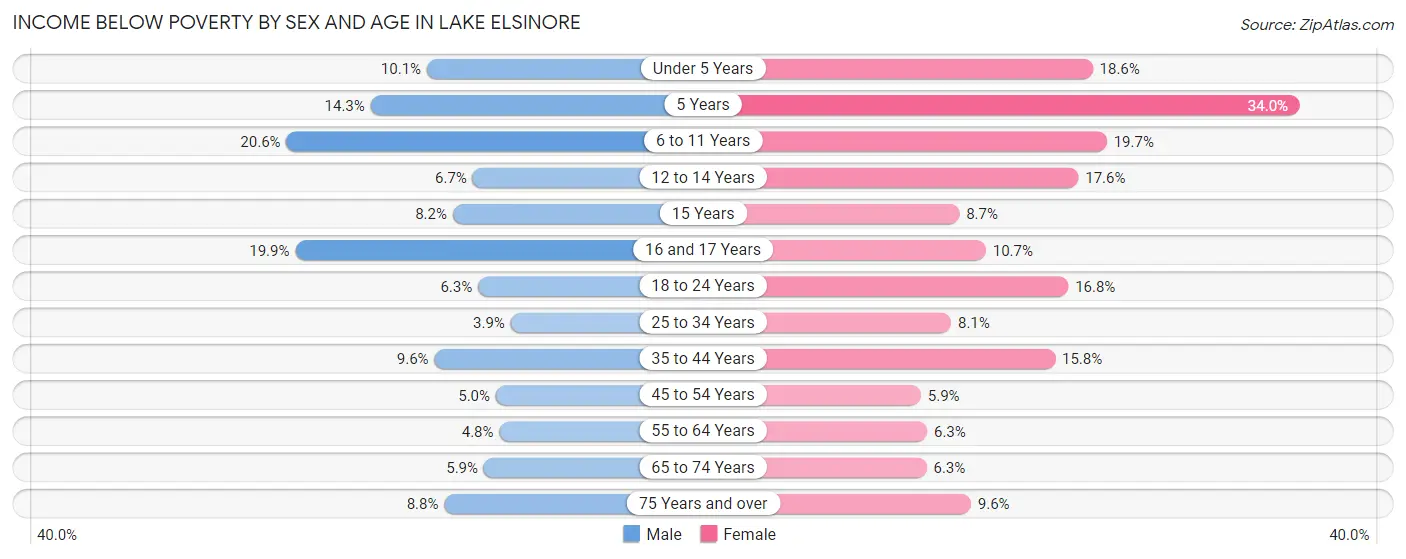
| Age Bracket | Male | Female |
| Under 5 Years | 288 (10.1%) | 484 (18.6%) |
| 5 Years | 89 (14.3%) | 117 (34.0%) |
| 6 to 11 Years | 732 (20.6%) | 560 (19.7%) |
| 12 to 14 Years | 112 (6.7%) | 293 (17.6%) |
| 15 Years | 68 (8.2%) | 32 (8.7%) |
| 16 and 17 Years | 245 (19.9%) | 120 (10.7%) |
| 18 to 24 Years | 206 (6.3%) | 605 (16.8%) |
| 25 to 34 Years | 221 (3.9%) | 462 (8.1%) |
| 35 to 44 Years | 480 (9.6%) | 801 (15.8%) |
| 45 to 54 Years | 215 (5.0%) | 293 (5.9%) |
| 55 to 64 Years | 166 (4.8%) | 185 (6.3%) |
| 65 to 74 Years | 109 (5.9%) | 138 (6.3%) |
| 75 Years and over | 70 (8.8%) | 133 (9.6%) |
| Total | 3,001 (8.6%) | 4,223 (12.1%) |
Income Above Poverty by Sex and Age in Lake Elsinore
According to the poverty statistics in Lake Elsinore, males aged 25 to 34 years and females aged 45 to 54 years are the age groups that are most secure financially, with 96.1% of males and 94.1% of females in these age groups living above the poverty line.
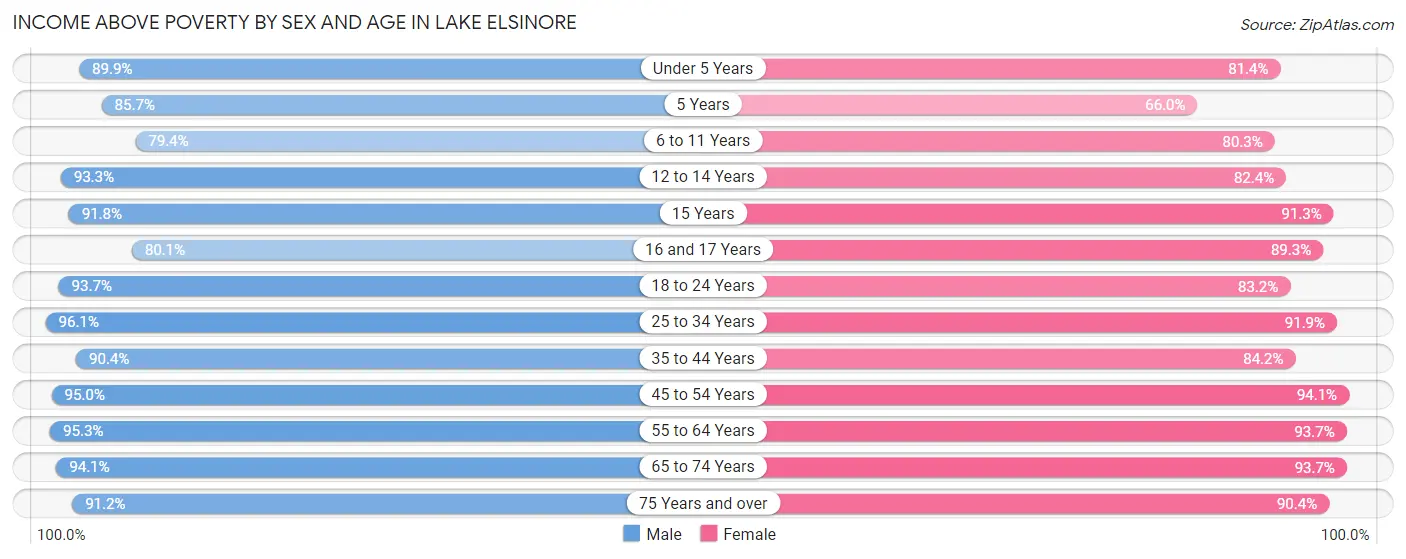
| Age Bracket | Male | Female |
| Under 5 Years | 2,555 (89.9%) | 2,116 (81.4%) |
| 5 Years | 533 (85.7%) | 227 (66.0%) |
| 6 to 11 Years | 2,828 (79.4%) | 2,287 (80.3%) |
| 12 to 14 Years | 1,553 (93.3%) | 1,376 (82.4%) |
| 15 Years | 760 (91.8%) | 335 (91.3%) |
| 16 and 17 Years | 986 (80.1%) | 1,003 (89.3%) |
| 18 to 24 Years | 3,049 (93.7%) | 2,993 (83.2%) |
| 25 to 34 Years | 5,426 (96.1%) | 5,236 (91.9%) |
| 35 to 44 Years | 4,536 (90.4%) | 4,259 (84.2%) |
| 45 to 54 Years | 4,075 (95.0%) | 4,695 (94.1%) |
| 55 to 64 Years | 3,332 (95.3%) | 2,736 (93.7%) |
| 65 to 74 Years | 1,737 (94.1%) | 2,055 (93.7%) |
| 75 Years and over | 722 (91.2%) | 1,256 (90.4%) |
| Total | 32,092 (91.4%) | 30,574 (87.9%) |
Income Below Poverty Among Married-Couple Families in Lake Elsinore
The poverty statistics for married-couple families in Lake Elsinore show that 5.7% or 660 of the total 11,684 families live below the poverty line. Families with 5 or more children have the highest poverty rate of 29.6%, comprising of 51 families. On the other hand, families with no children have the lowest poverty rate of 1.8%, which includes 90 families.
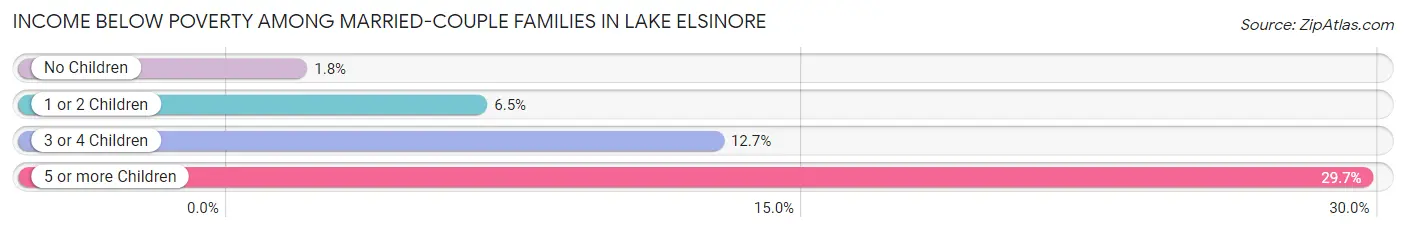
| Children | Above Poverty | Below Poverty |
| No Children | 4,871 (98.2%) | 90 (1.8%) |
| 1 or 2 Children | 4,725 (93.5%) | 329 (6.5%) |
| 3 or 4 Children | 1,307 (87.3%) | 190 (12.7%) |
| 5 or more Children | 121 (70.4%) | 51 (29.6%) |
| Total | 11,024 (94.4%) | 660 (5.7%) |
Income Below Poverty Among Single-Parent Households in Lake Elsinore
According to the poverty data in Lake Elsinore, 1.9% or 24 single-father households and 17.9% or 556 single-mother households are living below the poverty line. Among single-father households, those with 1 or 2 children have the highest poverty rate, with 16 households (2.9%) experiencing poverty. Likewise, among single-mother households, those with 5 or more children have the highest poverty rate, with 22 households (57.9%) falling below the poverty line.
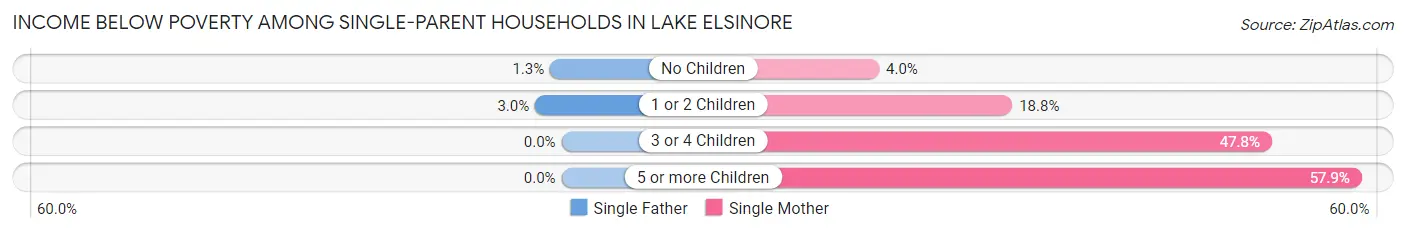
| Children | Single Father | Single Mother |
| No Children | 8 (1.3%) | 49 (4.0%) |
| 1 or 2 Children | 16 (2.9%) | 253 (18.8%) |
| 3 or 4 Children | 0 (0.0%) | 232 (47.8%) |
| 5 or more Children | 0 (0.0%) | 22 (57.9%) |
| Total | 24 (1.9%) | 556 (17.9%) |
Income Below Poverty Among Married-Couple vs Single-Parent Households in Lake Elsinore
The poverty data for Lake Elsinore shows that 660 of the married-couple family households (5.7%) and 580 of the single-parent households (13.4%) are living below the poverty level. Within the married-couple family households, those with 5 or more children have the highest poverty rate, with 51 households (29.6%) falling below the poverty line. Among the single-parent households, those with 5 or more children have the highest poverty rate, with 22 household (57.9%) living below poverty.
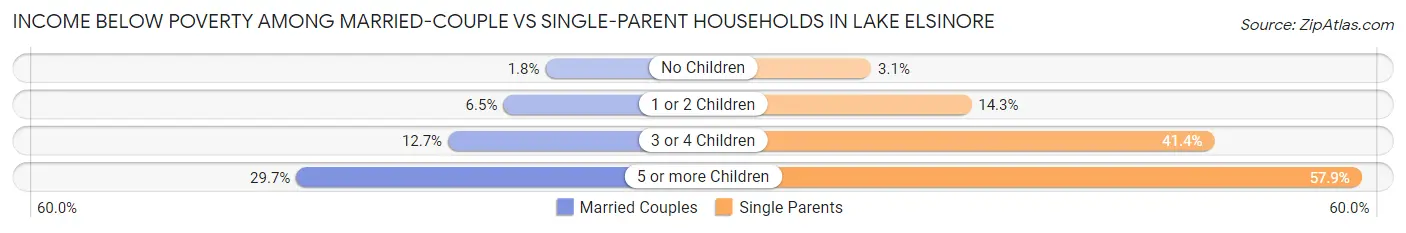
| Children | Married-Couple Families | Single-Parent Households |
| No Children | 90 (1.8%) | 57 (3.1%) |
| 1 or 2 Children | 329 (6.5%) | 269 (14.3%) |
| 3 or 4 Children | 190 (12.7%) | 232 (41.4%) |
| 5 or more Children | 51 (29.6%) | 22 (57.9%) |
| Total | 660 (5.7%) | 580 (13.4%) |
Race in Lake Elsinore
The most populous races in Lake Elsinore are Hispanic or Latino (36,590 | 52.3%), White / Caucasian (32,931 | 47.0%), and Some other Race (16,233 | 23.2%).
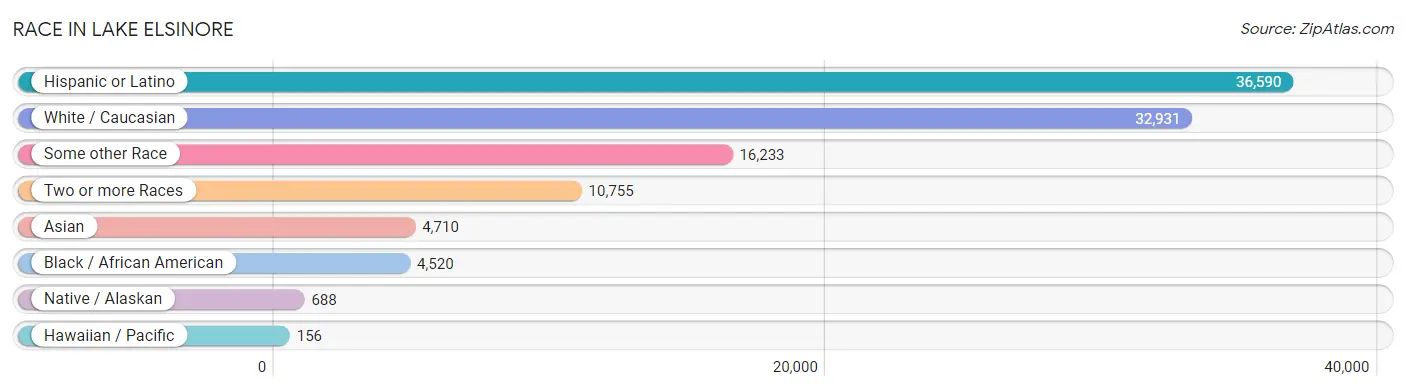
| Race | # Population | % Population |
| Asian | 4,710 | 6.7% |
| Black / African American | 4,520 | 6.5% |
| Hawaiian / Pacific | 156 | 0.2% |
| Hispanic or Latino | 36,590 | 52.3% |
| Native / Alaskan | 688 | 1.0% |
| White / Caucasian | 32,931 | 47.0% |
| Two or more Races | 10,755 | 15.4% |
| Some other Race | 16,233 | 23.2% |
| Total | 69,993 | 100.0% |
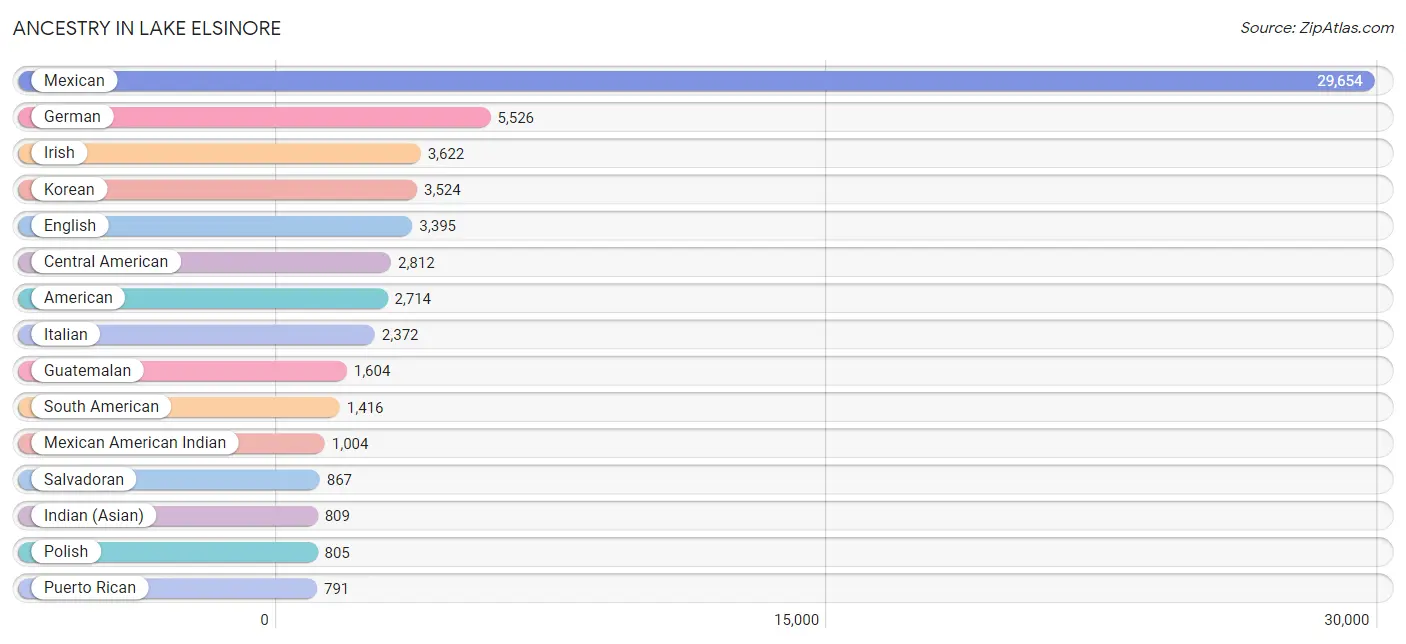
Ancestry in Lake Elsinore
The most populous ancestries reported in Lake Elsinore are Mexican (29,654 | 42.4%), German (5,526 | 7.9%), Irish (3,622 | 5.2%), Korean (3,524 | 5.0%), and English (3,395 | 4.9%), together accounting for 65.3% of all Lake Elsinore residents.
| Ancestry | # Population | % Population |
| Afghan | 26 | 0.0% |
| African | 131 | 0.2% |
| American | 2,714 | 3.9% |
| Apache | 78 | 0.1% |
| Arab | 429 | 0.6% |
| Argentinean | 118 | 0.2% |
| Austrian | 14 | 0.0% |
| Belizean | 62 | 0.1% |
| Bhutanese | 157 | 0.2% |
| Blackfeet | 33 | 0.1% |
| Bolivian | 367 | 0.5% |
| Brazilian | 19 | 0.0% |
| British | 165 | 0.2% |
| Bulgarian | 5 | 0.0% |
| Burmese | 481 | 0.7% |
| Canadian | 27 | 0.0% |
| Central American | 2,812 | 4.0% |
| Central American Indian | 66 | 0.1% |
| Cherokee | 110 | 0.2% |
| Chickasaw | 25 | 0.0% |
| Chippewa | 98 | 0.1% |
| Choctaw | 20 | 0.0% |
| Colombian | 415 | 0.6% |
| Costa Rican | 84 | 0.1% |
| Croatian | 206 | 0.3% |
| Cuban | 379 | 0.5% |
| Czech | 24 | 0.0% |
| Danish | 191 | 0.3% |
| Dominican | 93 | 0.1% |
| Dutch | 690 | 1.0% |
| Eastern European | 140 | 0.2% |
| Ecuadorian | 213 | 0.3% |
| Egyptian | 192 | 0.3% |
| English | 3,395 | 4.9% |
| Ethiopian | 37 | 0.1% |
| European | 532 | 0.8% |
| Filipino | 237 | 0.3% |
| Finnish | 196 | 0.3% |
| French | 566 | 0.8% |
| French Canadian | 274 | 0.4% |
| German | 5,526 | 7.9% |
| German Russian | 24 | 0.0% |
| Ghanaian | 117 | 0.2% |
| Greek | 85 | 0.1% |
| Guatemalan | 1,604 | 2.3% |
| Haitian | 8 | 0.0% |
| Honduran | 68 | 0.1% |
| Hungarian | 102 | 0.2% |
| Indian (Asian) | 809 | 1.2% |
| Indonesian | 47 | 0.1% |
| Iranian | 165 | 0.2% |
| Irish | 3,622 | 5.2% |
| Iroquois | 30 | 0.0% |
| Italian | 2,372 | 3.4% |
| Jamaican | 143 | 0.2% |
| Japanese | 115 | 0.2% |
| Jordanian | 98 | 0.1% |
| Kenyan | 79 | 0.1% |
| Korean | 3,524 | 5.0% |
| Lebanese | 9 | 0.0% |
| Lithuanian | 65 | 0.1% |
| Malaysian | 64 | 0.1% |
| Maltese | 8 | 0.0% |
| Mexican | 29,654 | 42.4% |
| Mexican American Indian | 1,004 | 1.4% |
| Native Hawaiian | 79 | 0.1% |
| Navajo | 77 | 0.1% |
| Nicaraguan | 46 | 0.1% |
| Nigerian | 9 | 0.0% |
| Northern European | 29 | 0.0% |
| Norwegian | 492 | 0.7% |
| Okinawan | 7 | 0.0% |
| Pakistani | 30 | 0.0% |
| Panamanian | 143 | 0.2% |
| Peruvian | 217 | 0.3% |
| Polish | 805 | 1.1% |
| Portuguese | 269 | 0.4% |
| Puerto Rican | 791 | 1.1% |
| Romanian | 81 | 0.1% |
| Russian | 215 | 0.3% |
| Salvadoran | 867 | 1.2% |
| Samoan | 147 | 0.2% |
| Scandinavian | 156 | 0.2% |
| Scotch-Irish | 136 | 0.2% |
| Scottish | 789 | 1.1% |
| Serbian | 36 | 0.1% |
| Sioux | 8 | 0.0% |
| Slavic | 7 | 0.0% |
| Slovak | 29 | 0.0% |
| South American | 1,416 | 2.0% |
| Spaniard | 176 | 0.3% |
| Spanish | 205 | 0.3% |
| Spanish American | 327 | 0.5% |
| Spanish American Indian | 15 | 0.0% |
| Sri Lankan | 420 | 0.6% |
| Subsaharan African | 373 | 0.5% |
| Swedish | 405 | 0.6% |
| Swiss | 14 | 0.0% |
| Thai | 638 | 0.9% |
| Turkish | 22 | 0.0% |
| Ukrainian | 32 | 0.1% |
| Venezuelan | 86 | 0.1% |
| Welsh | 51 | 0.1% |
| Yaqui | 25 | 0.0% | View All 104 Rows |
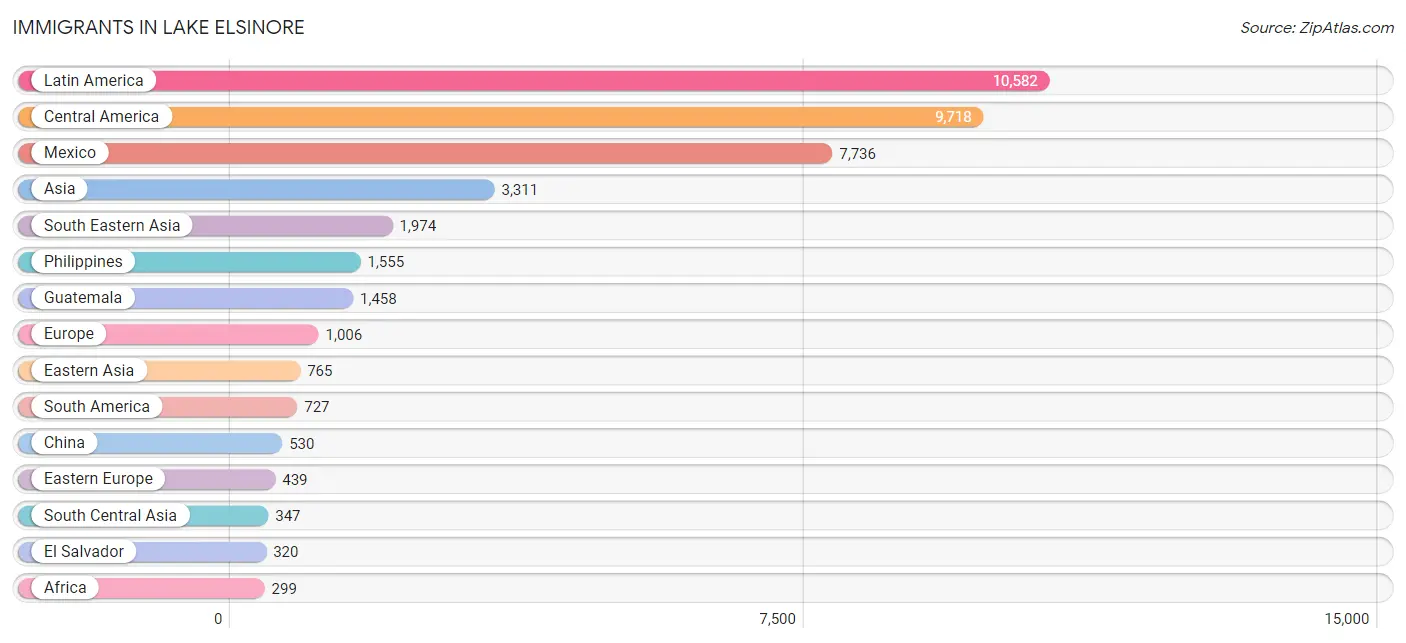
Immigrants in Lake Elsinore
The most numerous immigrant groups reported in Lake Elsinore came from Latin America (10,582 | 15.1%), Central America (9,718 | 13.9%), Mexico (7,736 | 11.1%), Asia (3,311 | 4.7%), and South Eastern Asia (1,974 | 2.8%), together accounting for 47.6% of all Lake Elsinore residents.
| Immigration Origin | # Population | % Population |
| Afghanistan | 43 | 0.1% |
| Africa | 299 | 0.4% |
| Argentina | 63 | 0.1% |
| Asia | 3,311 | 4.7% |
| Australia | 39 | 0.1% |
| Belgium | 37 | 0.1% |
| Bolivia | 113 | 0.2% |
| Brazil | 9 | 0.0% |
| Cambodia | 36 | 0.1% |
| Canada | 76 | 0.1% |
| Caribbean | 137 | 0.2% |
| Central America | 9,718 | 13.9% |
| China | 530 | 0.8% |
| Colombia | 140 | 0.2% |
| Costa Rica | 73 | 0.1% |
| Croatia | 61 | 0.1% |
| Cuba | 14 | 0.0% |
| Denmark | 5 | 0.0% |
| Eastern Africa | 39 | 0.1% |
| Eastern Asia | 765 | 1.1% |
| Eastern Europe | 439 | 0.6% |
| Ecuador | 158 | 0.2% |
| Egypt | 164 | 0.2% |
| El Salvador | 320 | 0.5% |
| England | 41 | 0.1% |
| Europe | 1,006 | 1.4% |
| Germany | 182 | 0.3% |
| Ghana | 95 | 0.1% |
| Guatemala | 1,458 | 2.1% |
| Guyana | 14 | 0.0% |
| Honduras | 62 | 0.1% |
| Hong Kong | 19 | 0.0% |
| India | 141 | 0.2% |
| Indonesia | 5 | 0.0% |
| Iran | 74 | 0.1% |
| Iraq | 46 | 0.1% |
| Jamaica | 123 | 0.2% |
| Japan | 101 | 0.1% |
| Jordan | 152 | 0.2% |
| Kenya | 39 | 0.1% |
| Korea | 134 | 0.2% |
| Kuwait | 27 | 0.0% |
| Laos | 51 | 0.1% |
| Latin America | 10,582 | 15.1% |
| Lithuania | 32 | 0.1% |
| Malaysia | 64 | 0.1% |
| Mexico | 7,736 | 11.1% |
| Morocco | 1 | 0.0% |
| Nicaragua | 39 | 0.1% |
| Northern Africa | 165 | 0.2% |
| Northern Europe | 231 | 0.3% |
| Oceania | 63 | 0.1% |
| Pakistan | 57 | 0.1% |
| Panama | 30 | 0.0% |
| Peru | 157 | 0.2% |
| Philippines | 1,555 | 2.2% |
| Poland | 81 | 0.1% |
| Portugal | 89 | 0.1% |
| Romania | 51 | 0.1% |
| Russia | 20 | 0.0% |
| Scotland | 20 | 0.0% |
| Serbia | 9 | 0.0% |
| Singapore | 7 | 0.0% |
| South America | 727 | 1.0% |
| South Central Asia | 347 | 0.5% |
| South Eastern Asia | 1,974 | 2.8% |
| Southern Europe | 117 | 0.2% |
| Spain | 28 | 0.0% |
| Sri Lanka | 32 | 0.1% |
| Sweden | 3 | 0.0% |
| Taiwan | 234 | 0.3% |
| Thailand | 102 | 0.2% |
| Ukraine | 185 | 0.3% |
| Venezuela | 66 | 0.1% |
| Vietnam | 154 | 0.2% |
| Western Africa | 95 | 0.1% |
| Western Asia | 225 | 0.3% |
| Western Europe | 219 | 0.3% | View All 78 Rows |
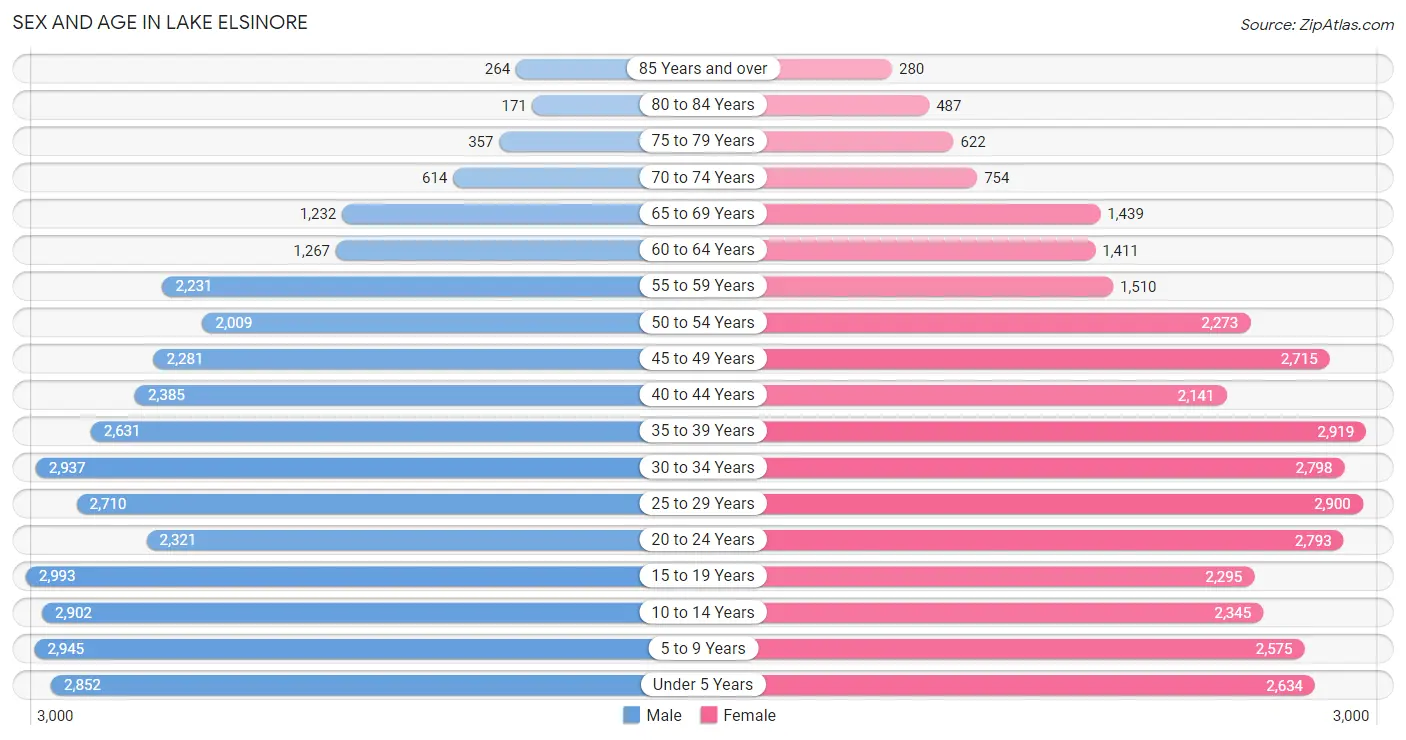
Sex and Age in Lake Elsinore
Sex and Age in Lake Elsinore
The most populous age groups in Lake Elsinore are 15 to 19 Years (2,993 | 8.5%) for men and 35 to 39 Years (2,919 | 8.4%) for women.
| Age Bracket | Male | Female |
| Under 5 Years | 2,852 (8.1%) | 2,634 (7.5%) |
| 5 to 9 Years | 2,945 (8.4%) | 2,575 (7.4%) |
| 10 to 14 Years | 2,902 (8.3%) | 2,345 (6.7%) |
| 15 to 19 Years | 2,993 (8.5%) | 2,295 (6.6%) |
| 20 to 24 Years | 2,321 (6.6%) | 2,793 (8.0%) |
| 25 to 29 Years | 2,710 (7.7%) | 2,900 (8.3%) |
| 30 to 34 Years | 2,937 (8.4%) | 2,798 (8.0%) |
| 35 to 39 Years | 2,631 (7.5%) | 2,919 (8.4%) |
| 40 to 44 Years | 2,385 (6.8%) | 2,141 (6.1%) |
| 45 to 49 Years | 2,281 (6.5%) | 2,715 (7.8%) |
| 50 to 54 Years | 2,009 (5.7%) | 2,273 (6.5%) |
| 55 to 59 Years | 2,231 (6.4%) | 1,510 (4.3%) |
| 60 to 64 Years | 1,267 (3.6%) | 1,411 (4.0%) |
| 65 to 69 Years | 1,232 (3.5%) | 1,439 (4.1%) |
| 70 to 74 Years | 614 (1.8%) | 754 (2.2%) |
| 75 to 79 Years | 357 (1.0%) | 622 (1.8%) |
| 80 to 84 Years | 171 (0.5%) | 487 (1.4%) |
| 85 Years and over | 264 (0.7%) | 280 (0.8%) |
| Total | 35,102 (100.0%) | 34,891 (100.0%) |
Families and Households in Lake Elsinore
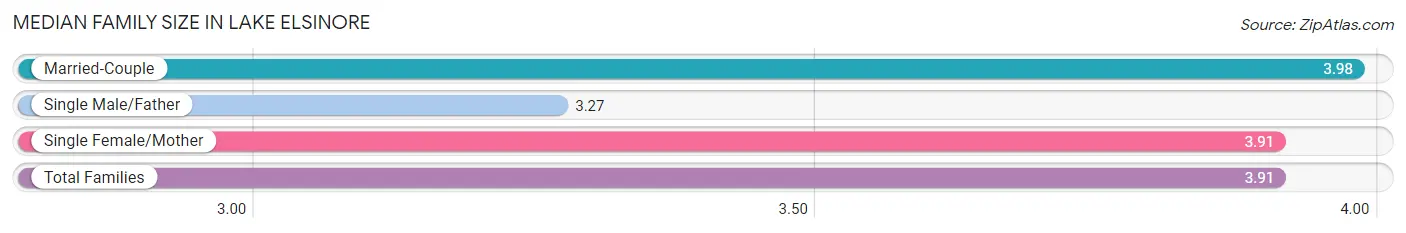
Median Family Size in Lake Elsinore
The median family size in Lake Elsinore is 3.91 persons per family, with married-couple families (11,684 | 72.9%) accounting for the largest median family size of 3.98 persons per family. On the other hand, single male/father families (1,241 | 7.7%) represent the smallest median family size with 3.27 persons per family.
| Family Type | # Families | Family Size |
| Married-Couple | 11,684 (72.9%) | 3.98 |
| Single Male/Father | 1,241 (7.7%) | 3.27 |
| Single Female/Mother | 3,102 (19.4%) | 3.91 |
| Total Families | 16,027 (100.0%) | 3.91 |
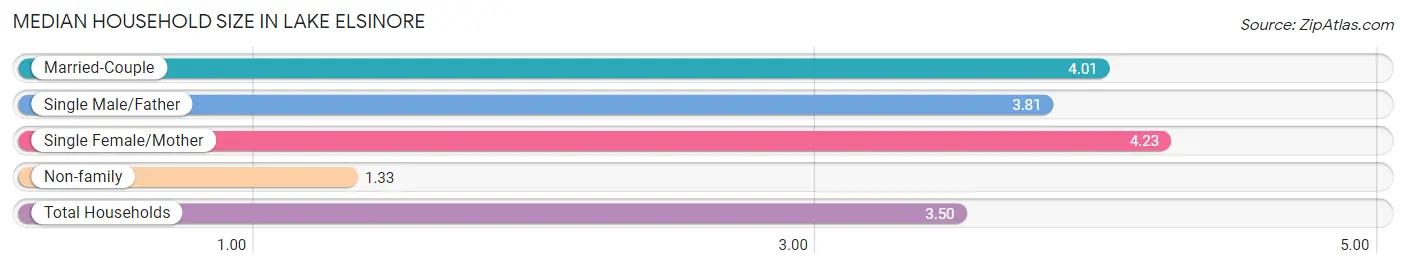
Median Household Size in Lake Elsinore
The median household size in Lake Elsinore is 3.50 persons per household, with single female/mother households (3,102 | 15.5%) accounting for the largest median household size of 4.23 persons per household. non-family households (3,977 | 19.9%) represent the smallest median household size with 1.33 persons per household.
| Household Type | # Households | Household Size |
| Married-Couple | 11,684 (58.4%) | 4.01 |
| Single Male/Father | 1,241 (6.2%) | 3.81 |
| Single Female/Mother | 3,102 (15.5%) | 4.23 |
| Non-family | 3,977 (19.9%) | 1.33 |
| Total Households | 20,004 (100.0%) | 3.50 |
Household Size by Marriage Status in Lake Elsinore
Out of a total of 20,004 households in Lake Elsinore, 16,027 (80.1%) are family households, while 3,977 (19.9%) are nonfamily households. The most numerous type of family households are 2-person households, comprising 4,071, and the most common type of nonfamily households are 1-person households, comprising 3,003.
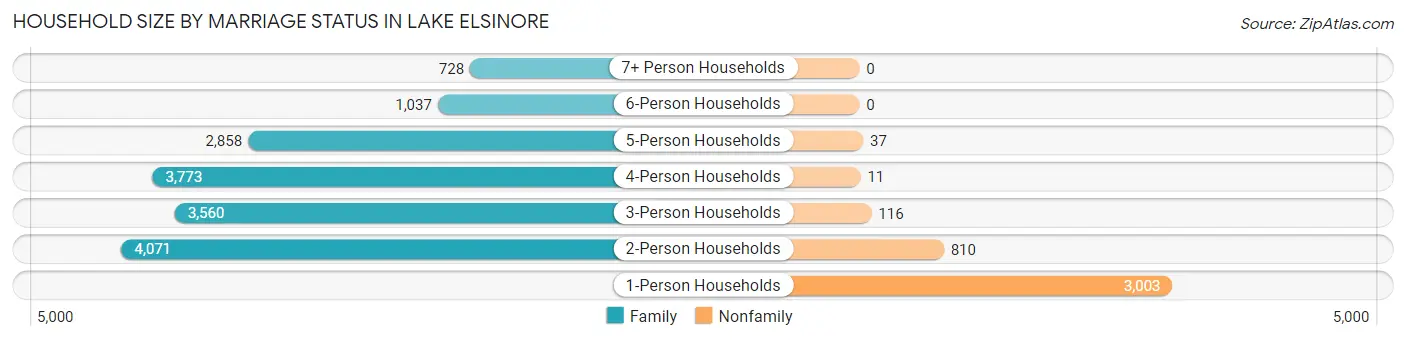
| Household Size | Family Households | Nonfamily Households |
| 1-Person Households | - | 3,003 (15.0%) |
| 2-Person Households | 4,071 (20.3%) | 810 (4.1%) |
| 3-Person Households | 3,560 (17.8%) | 116 (0.6%) |
| 4-Person Households | 3,773 (18.9%) | 11 (0.1%) |
| 5-Person Households | 2,858 (14.3%) | 37 (0.2%) |
| 6-Person Households | 1,037 (5.2%) | 0 (0.0%) |
| 7+ Person Households | 728 (3.6%) | 0 (0.0%) |
| Total | 16,027 (80.1%) | 3,977 (19.9%) |
Female Fertility in Lake Elsinore
Fertility by Age in Lake Elsinore
Average fertility rate in Lake Elsinore is 78.0 births per 1,000 women. Women in the age bracket of 20 to 34 years have the highest fertility rate with 121.0 births per 1,000 women. Women in the age bracket of 20 to 34 years acount for 69.7% of all women with births.
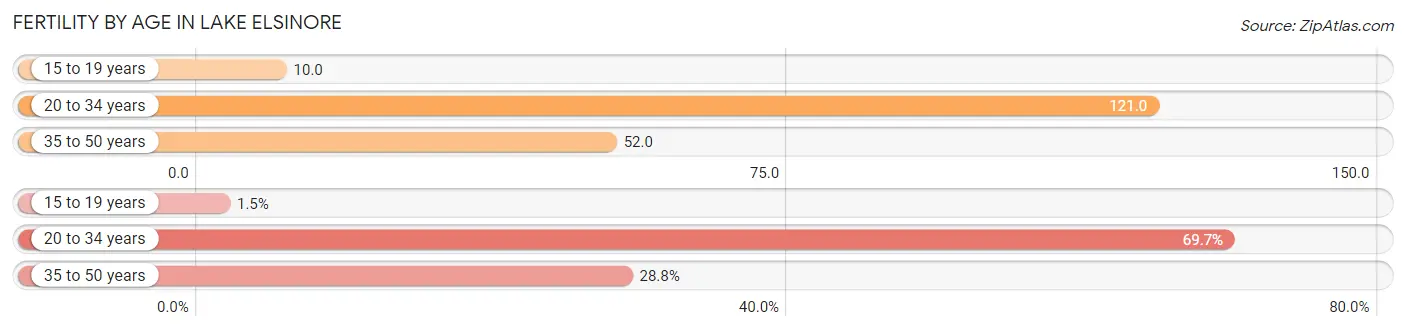
| Age Bracket | Women with Births | Births / 1,000 Women |
| 15 to 19 years | 22 (1.5%) | 10.0 |
| 20 to 34 years | 1,028 (69.7%) | 121.0 |
| 35 to 50 years | 425 (28.8%) | 52.0 |
| Total | 1,475 (100.0%) | 78.0 |
Fertility by Age by Marriage Status in Lake Elsinore
59.5% of women with births (1,475) in Lake Elsinore are married. The highest percentage of unmarried women with births falls into 15 to 19 years age bracket with 100.0% of them unmarried at the time of birth, while the lowest percentage of unmarried women with births belong to 35 to 50 years age bracket with 32.7% of them unmarried.
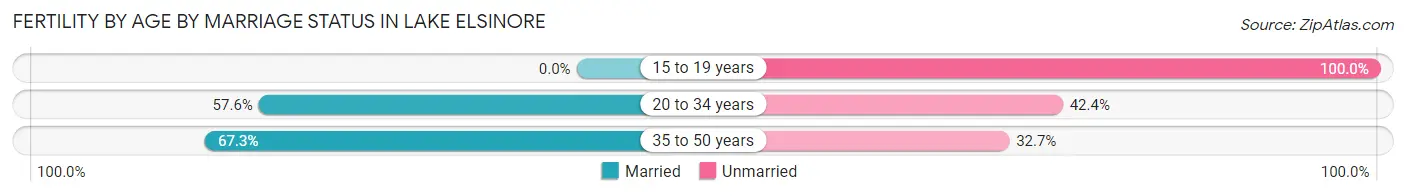
| Age Bracket | Married | Unmarried |
| 15 to 19 years | 0 (0.0%) | 22 (100.0%) |
| 20 to 34 years | 592 (57.6%) | 436 (42.4%) |
| 35 to 50 years | 286 (67.3%) | 139 (32.7%) |
| Total | 878 (59.5%) | 597 (40.5%) |
Fertility by Education in Lake Elsinore
Average fertility rate in Lake Elsinore is 78.0 births per 1,000 women. Women with the education attainment of bachelor's degree have the highest fertility rate of 127.0 births per 1,000 women, while women with the education attainment of graduate degree have the lowest fertility at 6.0 births per 1,000 women. Women with the education attainment of college or associate's degree represent 39.6% of all women with births.
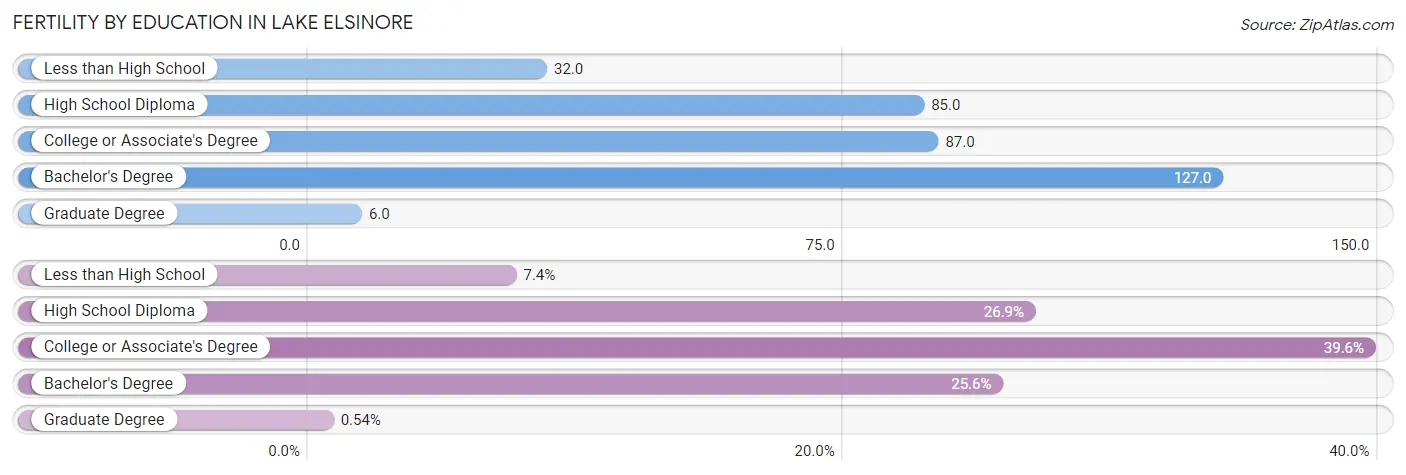
| Educational Attainment | Women with Births | Births / 1,000 Women |
| Less than High School | 109 (7.4%) | 32.0 |
| High School Diploma | 396 (26.9%) | 85.0 |
| College or Associate's Degree | 584 (39.6%) | 87.0 |
| Bachelor's Degree | 378 (25.6%) | 127.0 |
| Graduate Degree | 8 (0.5%) | 6.0 |
| Total | 1,475 (100.0%) | 78.0 |
Fertility by Education by Marriage Status in Lake Elsinore
40.5% of women with births in Lake Elsinore are unmarried. Women with the educational attainment of graduate degree are most likely to be married with 100.0% of them married at childbirth, while women with the educational attainment of high school diploma are least likely to be married with 74.0% of them unmarried at childbirth.
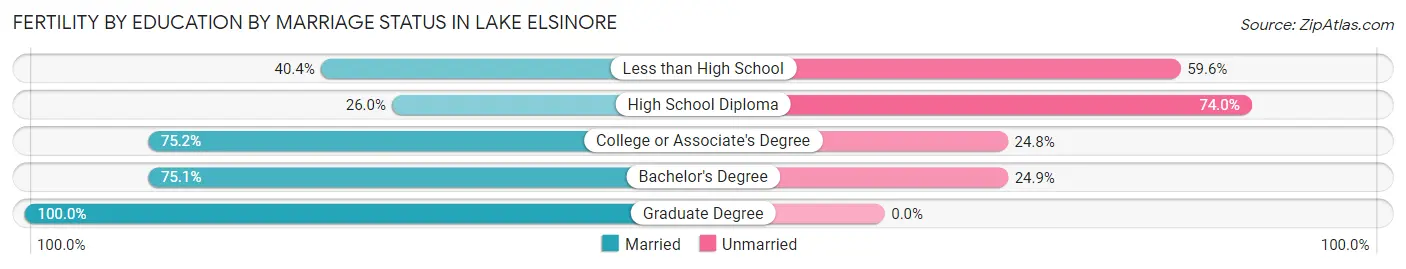
| Educational Attainment | Married | Unmarried |
| Less than High School | 44 (40.4%) | 65 (59.6%) |
| High School Diploma | 103 (26.0%) | 293 (74.0%) |
| College or Associate's Degree | 439 (75.2%) | 145 (24.8%) |
| Bachelor's Degree | 284 (75.1%) | 94 (24.9%) |
| Graduate Degree | 8 (100.0%) | 0 (0.0%) |
| Total | 878 (59.5%) | 597 (40.5%) |
Employment Characteristics in Lake Elsinore
Employment by Class of Employer in Lake Elsinore
Among the 31,391 employed individuals in Lake Elsinore, private company employees (22,040 | 70.2%), local government employees (3,202 | 10.2%), and self-employed (not incorporated) (1,925 | 6.1%) make up the most common classes of employment.
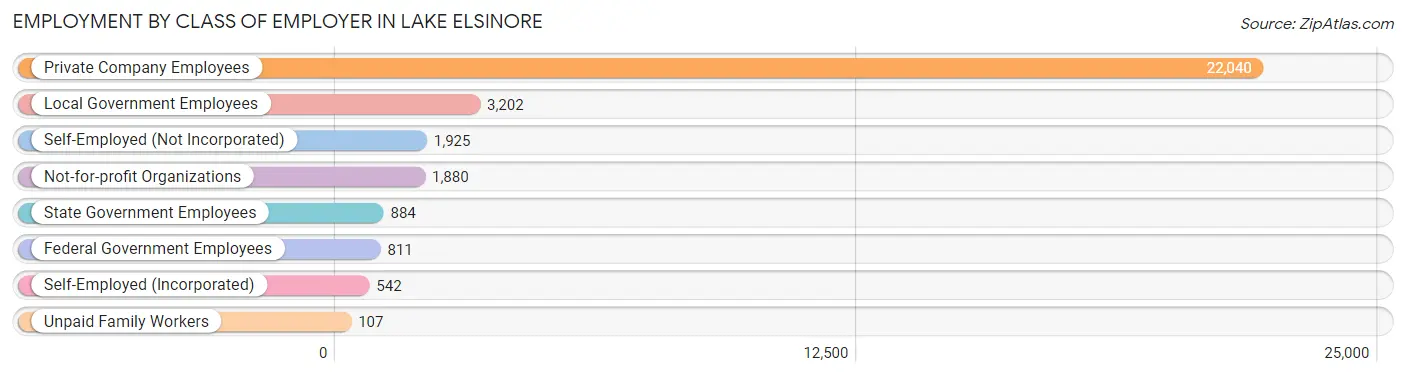
| Employer Class | # Employees | % Employees |
| Private Company Employees | 22,040 | 70.2% |
| Self-Employed (Incorporated) | 542 | 1.7% |
| Self-Employed (Not Incorporated) | 1,925 | 6.1% |
| Not-for-profit Organizations | 1,880 | 6.0% |
| Local Government Employees | 3,202 | 10.2% |
| State Government Employees | 884 | 2.8% |
| Federal Government Employees | 811 | 2.6% |
| Unpaid Family Workers | 107 | 0.3% |
| Total | 31,391 | 100.0% |
Employment Status by Age in Lake Elsinore
According to the labor force statistics for Lake Elsinore, out of the total population over 16 years of age (52,545), 65.9% or 34,627 individuals are in the labor force, with 6.9% or 2,389 of them unemployed. The age group with the highest labor force participation rate is 30 to 34 years, with 85.2% or 4,886 individuals in the labor force. Within the labor force, the 16 to 19 years age range has the highest percentage of unemployed individuals, with 18.0% or 214 of them being unemployed.
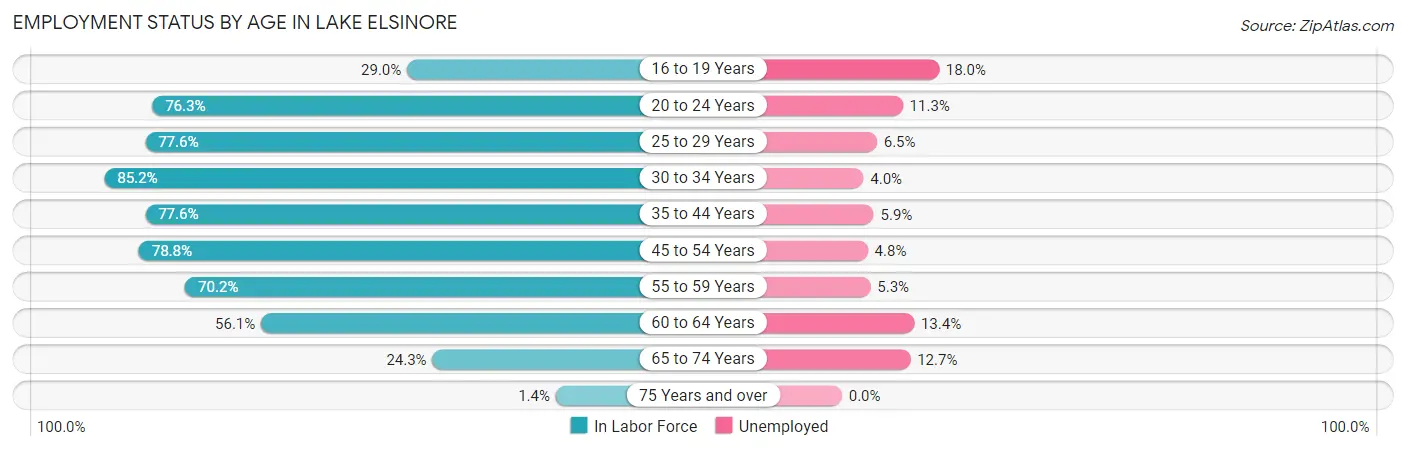
| Age Bracket | In Labor Force | Unemployed |
| 16 to 19 Years | 1,187 (29.0%) | 214 (18.0%) |
| 20 to 24 Years | 3,902 (76.3%) | 441 (11.3%) |
| 25 to 29 Years | 4,353 (77.6%) | 283 (6.5%) |
| 30 to 34 Years | 4,886 (85.2%) | 195 (4.0%) |
| 35 to 44 Years | 7,819 (77.6%) | 461 (5.9%) |
| 45 to 54 Years | 7,311 (78.8%) | 351 (4.8%) |
| 55 to 59 Years | 2,626 (70.2%) | 139 (5.3%) |
| 60 to 64 Years | 1,502 (56.1%) | 201 (13.4%) |
| 65 to 74 Years | 981 (24.3%) | 125 (12.7%) |
| 75 Years and over | 31 (1.4%) | 0 (0.0%) |
| Total | 34,627 (65.9%) | 2,389 (6.9%) |
Employment Status by Educational Attainment in Lake Elsinore
According to labor force statistics for Lake Elsinore, 76.8% of individuals (28,507) out of the total population between 25 and 64 years of age (37,118) are in the labor force, with 5.7% or 1,625 of them being unemployed. The group with the highest labor force participation rate are those with the educational attainment of bachelor's degree or higher, with 82.0% or 7,104 individuals in the labor force. Within the labor force, individuals with less than high school education have the highest percentage of unemployment, with 8.4% or 316 of them being unemployed.
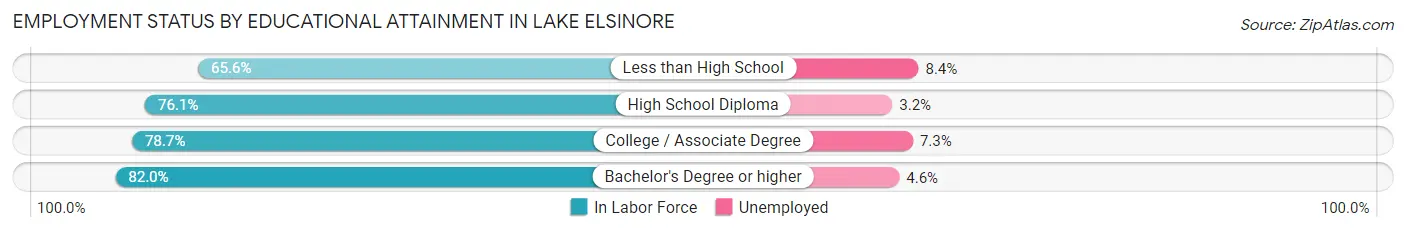
| Educational Attainment | In Labor Force | Unemployed |
| Less than High School | 3,762 (65.6%) | 482 (8.4%) |
| High School Diploma | 7,326 (76.1%) | 308 (3.2%) |
| College / Associate Degree | 10,304 (78.7%) | 956 (7.3%) |
| Bachelor's Degree or higher | 7,104 (82.0%) | 398 (4.6%) |
| Total | 28,507 (76.8%) | 2,116 (5.7%) |
Employment Occupations by Sex in Lake Elsinore
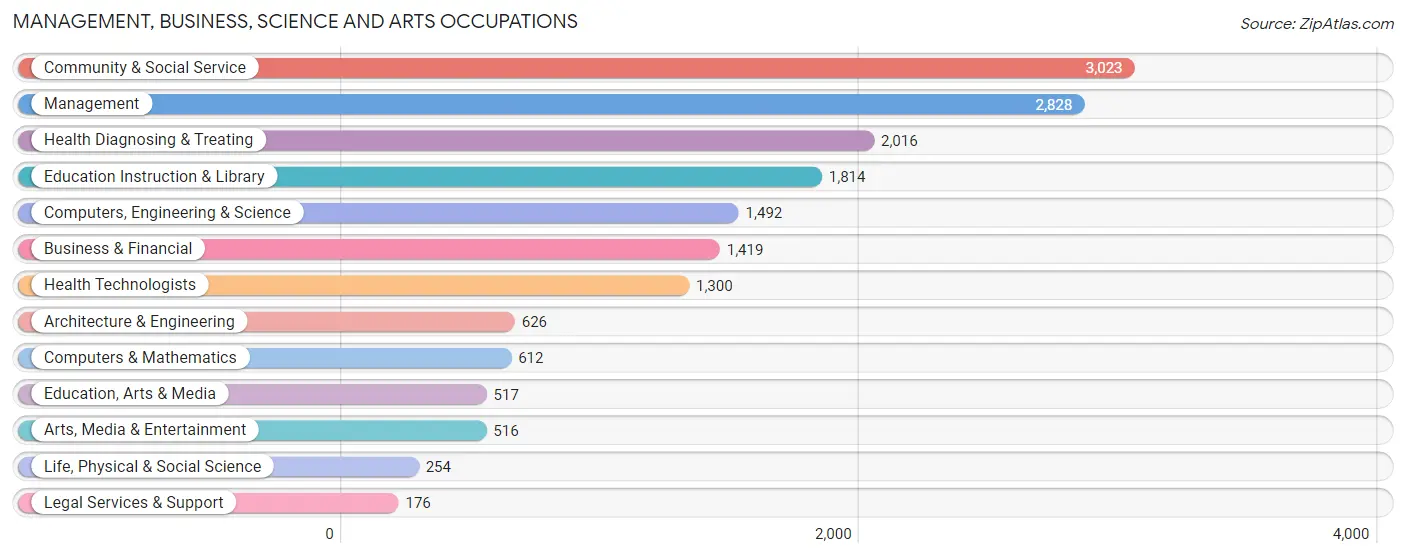
Management, Business, Science and Arts Occupations
The most common Management, Business, Science and Arts occupations in Lake Elsinore are Community & Social Service (3,023 | 9.5%), Management (2,828 | 8.8%), Health Diagnosing & Treating (2,016 | 6.3%), Education Instruction & Library (1,814 | 5.7%), and Computers, Engineering & Science (1,492 | 4.7%).
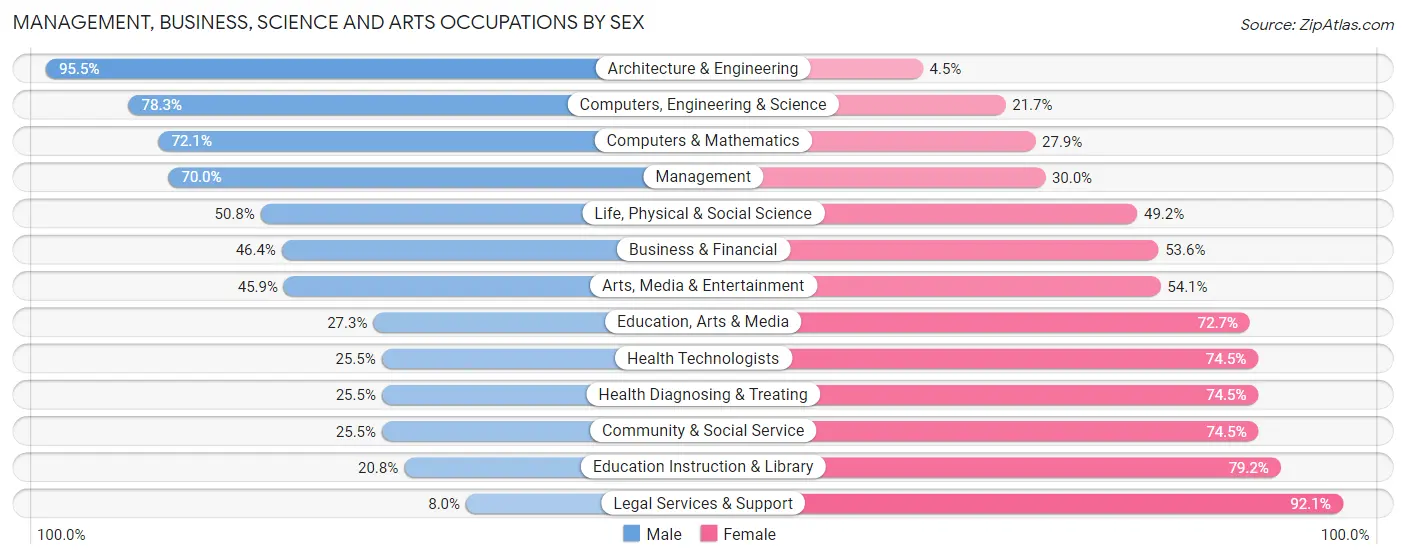
Management, Business, Science and Arts Occupations by Sex
Within the Management, Business, Science and Arts occupations in Lake Elsinore, the most male-oriented occupations are Architecture & Engineering (95.5%), Computers, Engineering & Science (78.3%), and Computers & Mathematics (72.1%), while the most female-oriented occupations are Legal Services & Support (92.0%), Education Instruction & Library (79.2%), and Community & Social Service (74.5%).
| Occupation | Male | Female |
| Management | 1,980 (70.0%) | 848 (30.0%) |
| Business & Financial | 658 (46.4%) | 761 (53.6%) |
| Computers, Engineering & Science | 1,168 (78.3%) | 324 (21.7%) |
| Computers & Mathematics | 441 (72.1%) | 171 (27.9%) |
| Architecture & Engineering | 598 (95.5%) | 28 (4.5%) |
| Life, Physical & Social Science | 129 (50.8%) | 125 (49.2%) |
| Community & Social Service | 770 (25.5%) | 2,253 (74.5%) |
| Education, Arts & Media | 141 (27.3%) | 376 (72.7%) |
| Legal Services & Support | 14 (8.0%) | 162 (92.0%) |
| Education Instruction & Library | 378 (20.8%) | 1,436 (79.2%) |
| Arts, Media & Entertainment | 237 (45.9%) | 279 (54.1%) |
| Health Diagnosing & Treating | 514 (25.5%) | 1,502 (74.5%) |
| Health Technologists | 332 (25.5%) | 968 (74.5%) |
| Total (Category) | 5,090 (47.2%) | 5,688 (52.8%) |
| Total (Overall) | 17,581 (54.9%) | 14,416 (45.1%) |
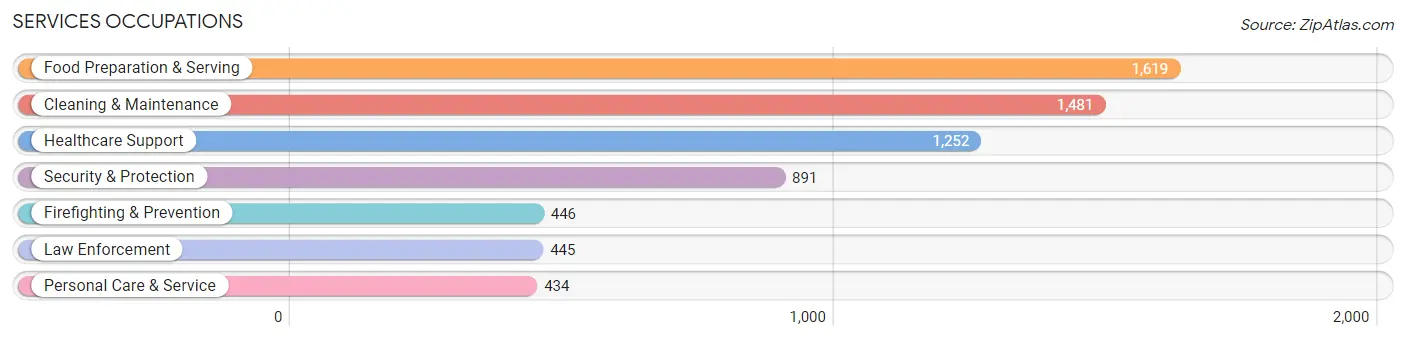
Services Occupations
The most common Services occupations in Lake Elsinore are Food Preparation & Serving (1,619 | 5.1%), Cleaning & Maintenance (1,481 | 4.6%), Healthcare Support (1,252 | 3.9%), Security & Protection (891 | 2.8%), and Firefighting & Prevention (446 | 1.4%).
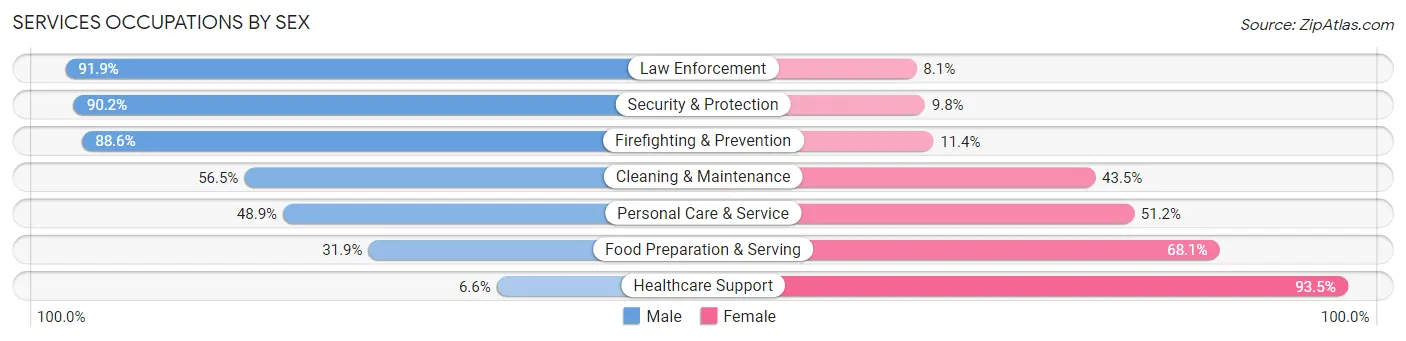
Services Occupations by Sex
Within the Services occupations in Lake Elsinore, the most male-oriented occupations are Law Enforcement (91.9%), Security & Protection (90.2%), and Firefighting & Prevention (88.6%), while the most female-oriented occupations are Healthcare Support (93.4%), Food Preparation & Serving (68.1%), and Personal Care & Service (51.1%).
| Occupation | Male | Female |
| Healthcare Support | 82 (6.6%) | 1,170 (93.4%) |
| Security & Protection | 804 (90.2%) | 87 (9.8%) |
| Firefighting & Prevention | 395 (88.6%) | 51 (11.4%) |
| Law Enforcement | 409 (91.9%) | 36 (8.1%) |
| Food Preparation & Serving | 517 (31.9%) | 1,102 (68.1%) |
| Cleaning & Maintenance | 837 (56.5%) | 644 (43.5%) |
| Personal Care & Service | 212 (48.8%) | 222 (51.1%) |
| Total (Category) | 2,452 (43.2%) | 3,225 (56.8%) |
| Total (Overall) | 17,581 (54.9%) | 14,416 (45.1%) |
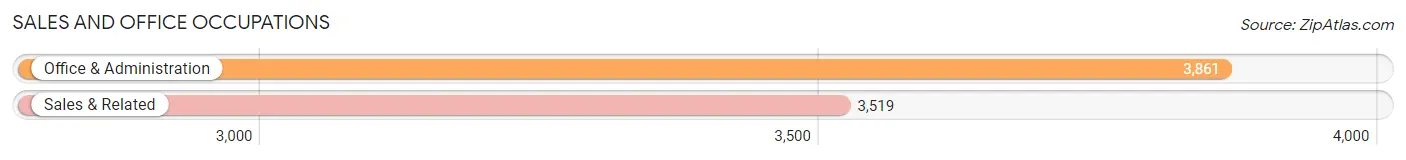
Sales and Office Occupations
The most common Sales and Office occupations in Lake Elsinore are Office & Administration (3,861 | 12.1%), and Sales & Related (3,519 | 11.0%).
Sales and Office Occupations by Sex
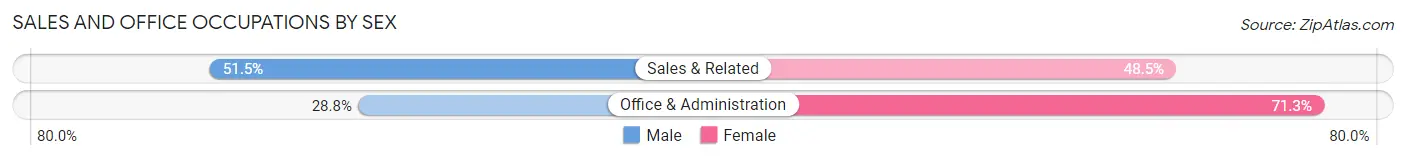
| Occupation | Male | Female |
| Sales & Related | 1,812 (51.5%) | 1,707 (48.5%) |
| Office & Administration | 1,110 (28.7%) | 2,751 (71.3%) |
| Total (Category) | 2,922 (39.6%) | 4,458 (60.4%) |
| Total (Overall) | 17,581 (54.9%) | 14,416 (45.1%) |
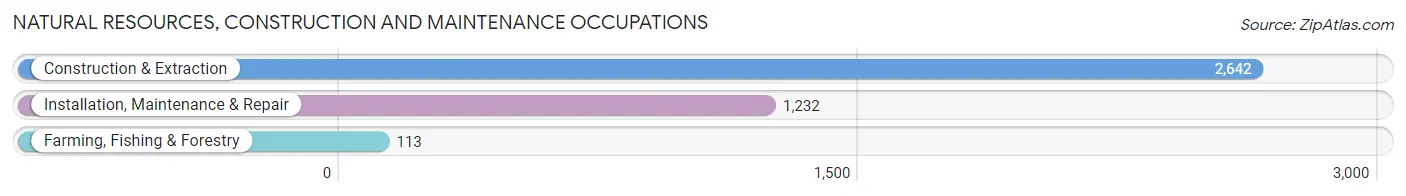
Natural Resources, Construction and Maintenance Occupations
The most common Natural Resources, Construction and Maintenance occupations in Lake Elsinore are Construction & Extraction (2,642 | 8.3%), Installation, Maintenance & Repair (1,232 | 3.8%), and Farming, Fishing & Forestry (113 | 0.4%).
Natural Resources, Construction and Maintenance Occupations by Sex
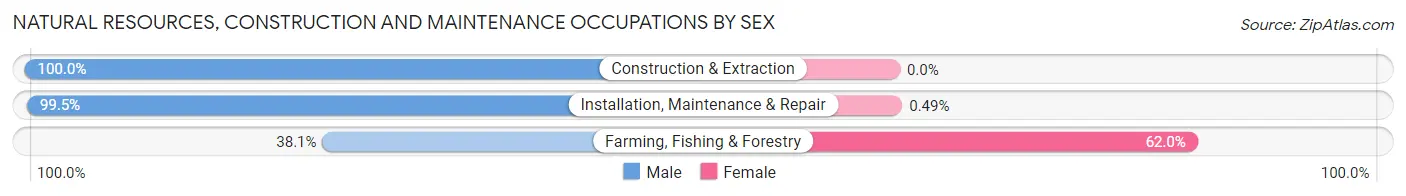
| Occupation | Male | Female |
| Farming, Fishing & Forestry | 43 (38.1%) | 70 (62.0%) |
| Construction & Extraction | 2,642 (100.0%) | 0 (0.0%) |
| Installation, Maintenance & Repair | 1,226 (99.5%) | 6 (0.5%) |
| Total (Category) | 3,911 (98.1%) | 76 (1.9%) |
| Total (Overall) | 17,581 (54.9%) | 14,416 (45.1%) |
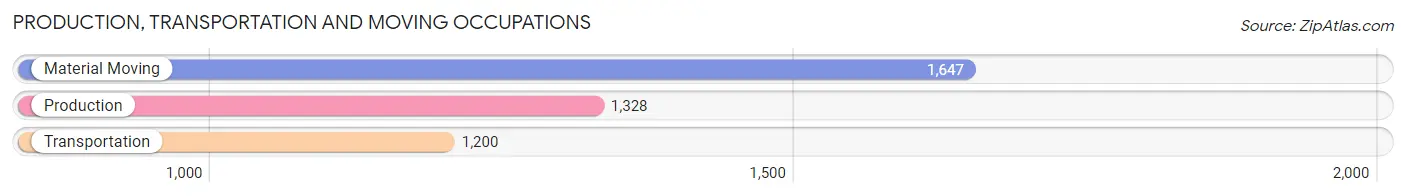
Production, Transportation and Moving Occupations
The most common Production, Transportation and Moving occupations in Lake Elsinore are Material Moving (1,647 | 5.1%), Production (1,328 | 4.2%), and Transportation (1,200 | 3.7%).
Production, Transportation and Moving Occupations by Sex
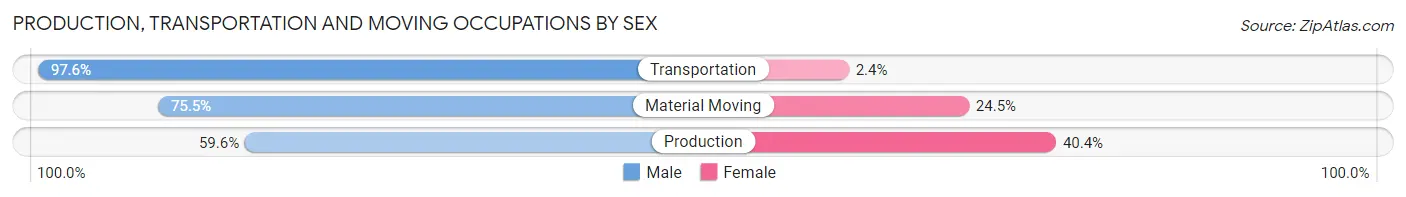
| Occupation | Male | Female |
| Production | 791 (59.6%) | 537 (40.4%) |
| Transportation | 1,171 (97.6%) | 29 (2.4%) |
| Material Moving | 1,244 (75.5%) | 403 (24.5%) |
| Total (Category) | 3,206 (76.8%) | 969 (23.2%) |
| Total (Overall) | 17,581 (54.9%) | 14,416 (45.1%) |
Employment Industries by Sex in Lake Elsinore
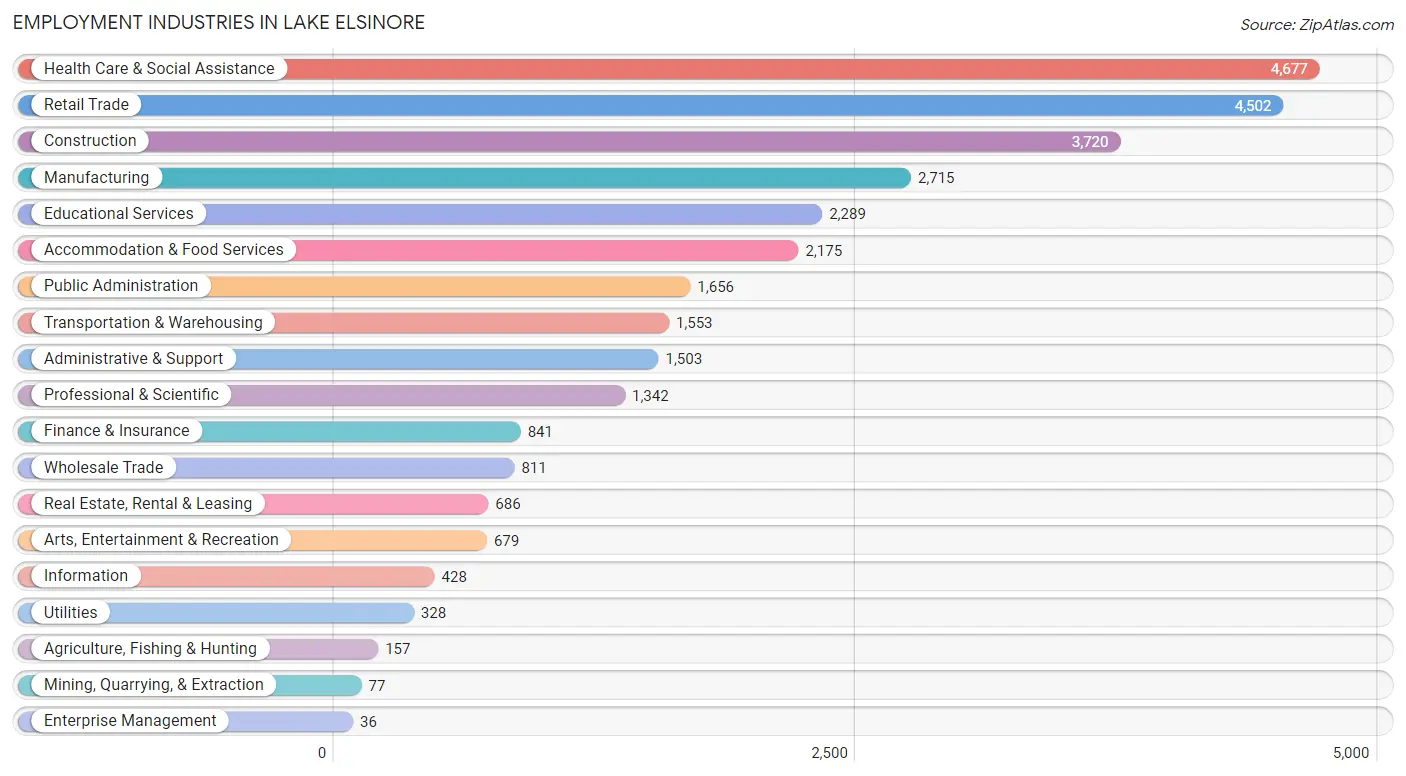
Employment Industries in Lake Elsinore
The major employment industries in Lake Elsinore include Health Care & Social Assistance (4,677 | 14.6%), Retail Trade (4,502 | 14.1%), Construction (3,720 | 11.6%), Manufacturing (2,715 | 8.5%), and Educational Services (2,289 | 7.1%).
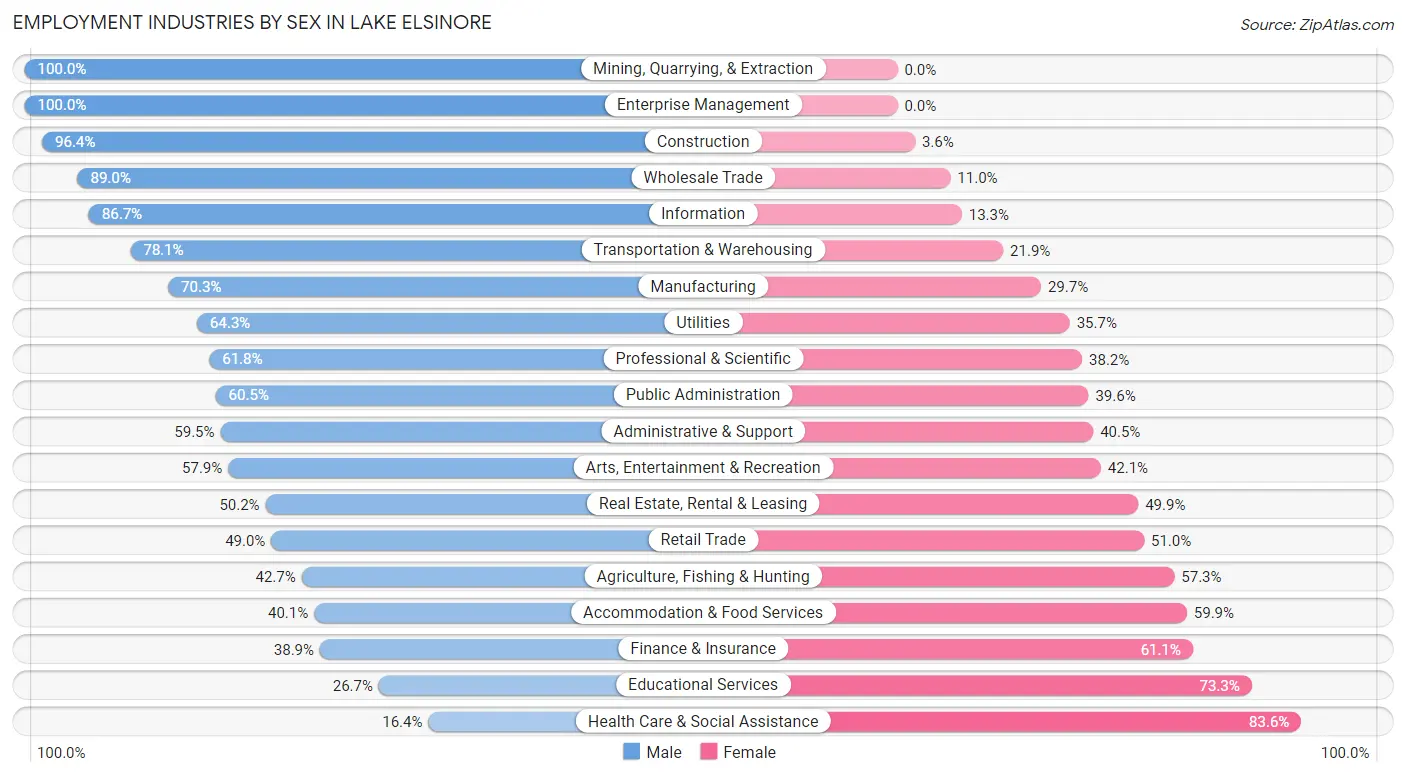
Employment Industries by Sex in Lake Elsinore
The Lake Elsinore industries that see more men than women are Mining, Quarrying, & Extraction (100.0%), Enterprise Management (100.0%), and Construction (96.4%), whereas the industries that tend to have a higher number of women are Health Care & Social Assistance (83.6%), Educational Services (73.3%), and Finance & Insurance (61.1%).
| Industry | Male | Female |
| Agriculture, Fishing & Hunting | 67 (42.7%) | 90 (57.3%) |
| Mining, Quarrying, & Extraction | 77 (100.0%) | 0 (0.0%) |
| Construction | 3,585 (96.4%) | 135 (3.6%) |
| Manufacturing | 1,908 (70.3%) | 807 (29.7%) |
| Wholesale Trade | 722 (89.0%) | 89 (11.0%) |
| Retail Trade | 2,204 (49.0%) | 2,298 (51.0%) |
| Transportation & Warehousing | 1,213 (78.1%) | 340 (21.9%) |
| Utilities | 211 (64.3%) | 117 (35.7%) |
| Information | 371 (86.7%) | 57 (13.3%) |
| Finance & Insurance | 327 (38.9%) | 514 (61.1%) |
| Real Estate, Rental & Leasing | 344 (50.1%) | 342 (49.8%) |
| Professional & Scientific | 829 (61.8%) | 513 (38.2%) |
| Enterprise Management | 36 (100.0%) | 0 (0.0%) |
| Administrative & Support | 894 (59.5%) | 609 (40.5%) |
| Educational Services | 611 (26.7%) | 1,678 (73.3%) |
| Health Care & Social Assistance | 769 (16.4%) | 3,908 (83.6%) |
| Arts, Entertainment & Recreation | 393 (57.9%) | 286 (42.1%) |
| Accommodation & Food Services | 872 (40.1%) | 1,303 (59.9%) |
| Public Administration | 1,001 (60.5%) | 655 (39.6%) |
| Total | 17,581 (54.9%) | 14,416 (45.1%) |
Education in Lake Elsinore
School Enrollment in Lake Elsinore
The most common levels of schooling among the 19,754 students in Lake Elsinore are high school (4,866 | 24.6%), elementary school (4,494 | 22.8%), and college / undergraduate (4,025 | 20.4%).
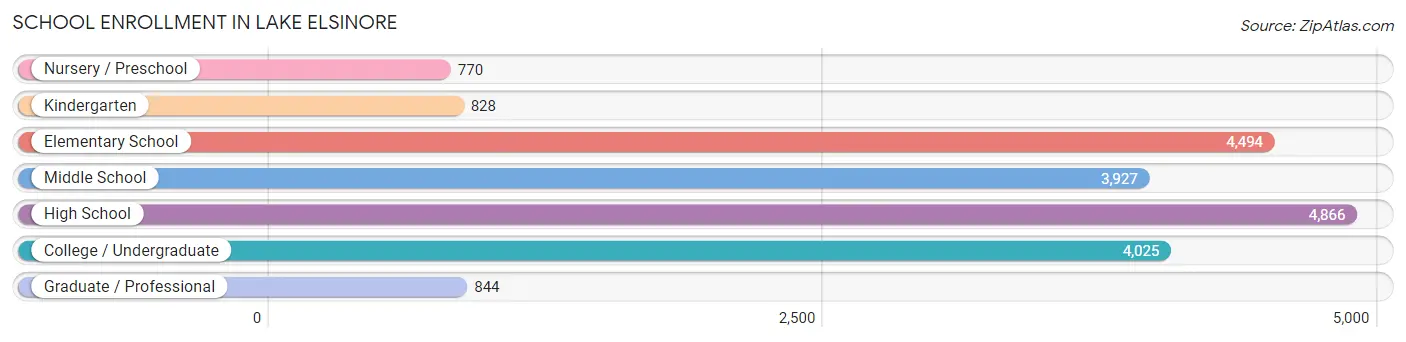
| School Level | # Students | % Students |
| Nursery / Preschool | 770 | 3.9% |
| Kindergarten | 828 | 4.2% |
| Elementary School | 4,494 | 22.8% |
| Middle School | 3,927 | 19.9% |
| High School | 4,866 | 24.6% |
| College / Undergraduate | 4,025 | 20.4% |
| Graduate / Professional | 844 | 4.3% |
| Total | 19,754 | 100.0% |
School Enrollment by Age by Funding Source in Lake Elsinore
Out of a total of 19,754 students who are enrolled in schools in Lake Elsinore, 1,501 (7.6%) attend a private institution, while the remaining 18,253 (92.4%) are enrolled in public schools. The age group of 35 years and over has the highest likelihood of being enrolled in private schools, with 219 (31.9% in the age bracket) enrolled. Conversely, the age group of 15 to 17 year olds has the lowest likelihood of being enrolled in a private school, with 3,427 (98.6% in the age bracket) attending a public institution.
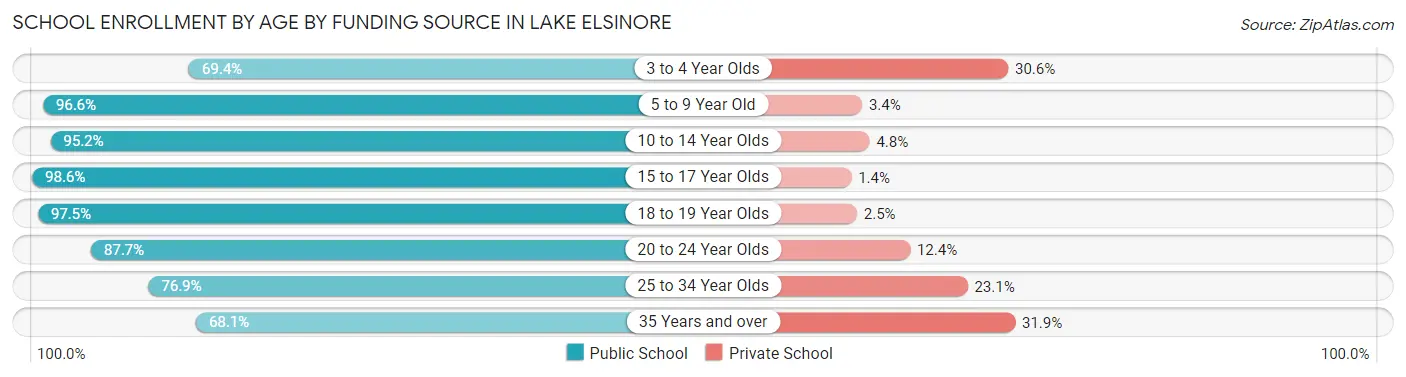
| Age Bracket | Public School | Private School |
| 3 to 4 Year Olds | 340 (69.4%) | 150 (30.6%) |
| 5 to 9 Year Old | 5,039 (96.6%) | 178 (3.4%) |
| 10 to 14 Year Olds | 4,859 (95.2%) | 245 (4.8%) |
| 15 to 17 Year Olds | 3,427 (98.6%) | 49 (1.4%) |
| 18 to 19 Year Olds | 1,033 (97.5%) | 26 (2.5%) |
| 20 to 24 Year Olds | 1,909 (87.6%) | 269 (12.3%) |
| 25 to 34 Year Olds | 1,188 (76.9%) | 356 (23.1%) |
| 35 Years and over | 467 (68.1%) | 219 (31.9%) |
| Total | 18,253 (92.4%) | 1,501 (7.6%) |
Educational Attainment by Field of Study in Lake Elsinore
Business (1,708 | 16.7%), science & technology (1,508 | 14.7%), social sciences (1,033 | 10.1%), arts & humanities (931 | 9.1%), and engineering (791 | 7.7%) are the most common fields of study among 10,232 individuals in Lake Elsinore who have obtained a bachelor's degree or higher.
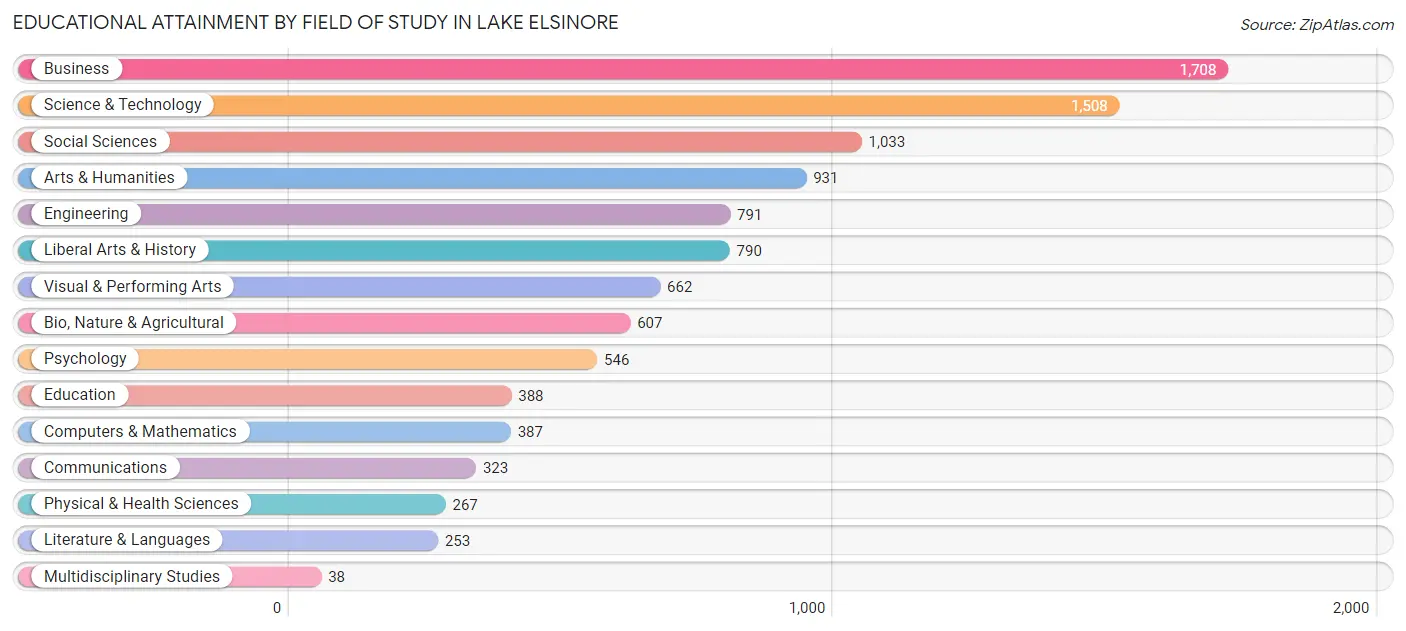
| Field of Study | # Graduates | % Graduates |
| Computers & Mathematics | 387 | 3.8% |
| Bio, Nature & Agricultural | 607 | 5.9% |
| Physical & Health Sciences | 267 | 2.6% |
| Psychology | 546 | 5.3% |
| Social Sciences | 1,033 | 10.1% |
| Engineering | 791 | 7.7% |
| Multidisciplinary Studies | 38 | 0.4% |
| Science & Technology | 1,508 | 14.7% |
| Business | 1,708 | 16.7% |
| Education | 388 | 3.8% |
| Literature & Languages | 253 | 2.5% |
| Liberal Arts & History | 790 | 7.7% |
| Visual & Performing Arts | 662 | 6.5% |
| Communications | 323 | 3.2% |
| Arts & Humanities | 931 | 9.1% |
| Total | 10,232 | 100.0% |
Transportation & Commute in Lake Elsinore
Vehicle Availability by Sex in Lake Elsinore
The most prevalent vehicle ownership categories in Lake Elsinore are males with 2 vehicles (6,454, accounting for 36.8%) and females with 2 vehicles (4,608, making up 46.6%).
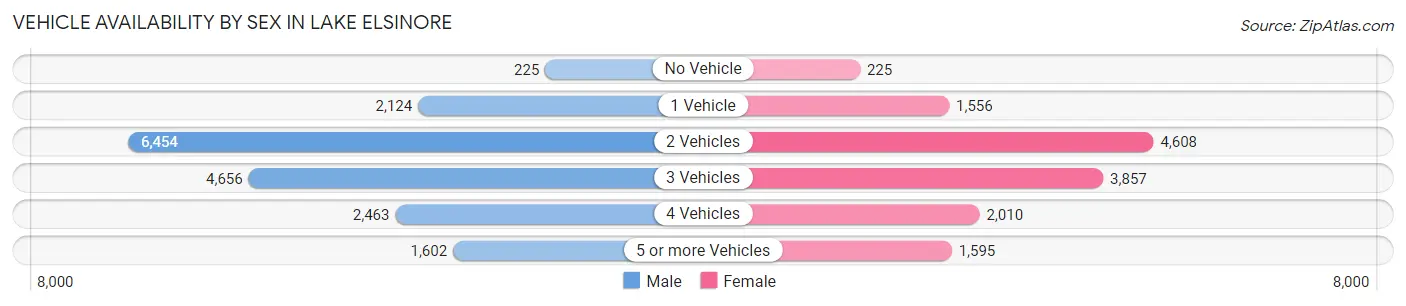
| Vehicles Available | Male | Female |
| No Vehicle | 225 (1.3%) | 225 (1.6%) |
| 1 Vehicle | 2,124 (12.1%) | 1,556 (11.2%) |
| 2 Vehicles | 6,454 (36.8%) | 4,608 (33.3%) |
| 3 Vehicles | 4,656 (26.6%) | 3,857 (27.9%) |
| 4 Vehicles | 2,463 (14.1%) | 2,010 (14.5%) |
| 5 or more Vehicles | 1,602 (9.1%) | 1,595 (11.5%) |
| Total | 17,524 (100.0%) | 13,851 (100.0%) |
Commute Time in Lake Elsinore
The most frequently occuring commute durations in Lake Elsinore are 60 to 89 minutes (5,189 commuters, 18.0%), 30 to 34 minutes (3,968 commuters, 13.8%), and 15 to 19 minutes (3,522 commuters, 12.2%).
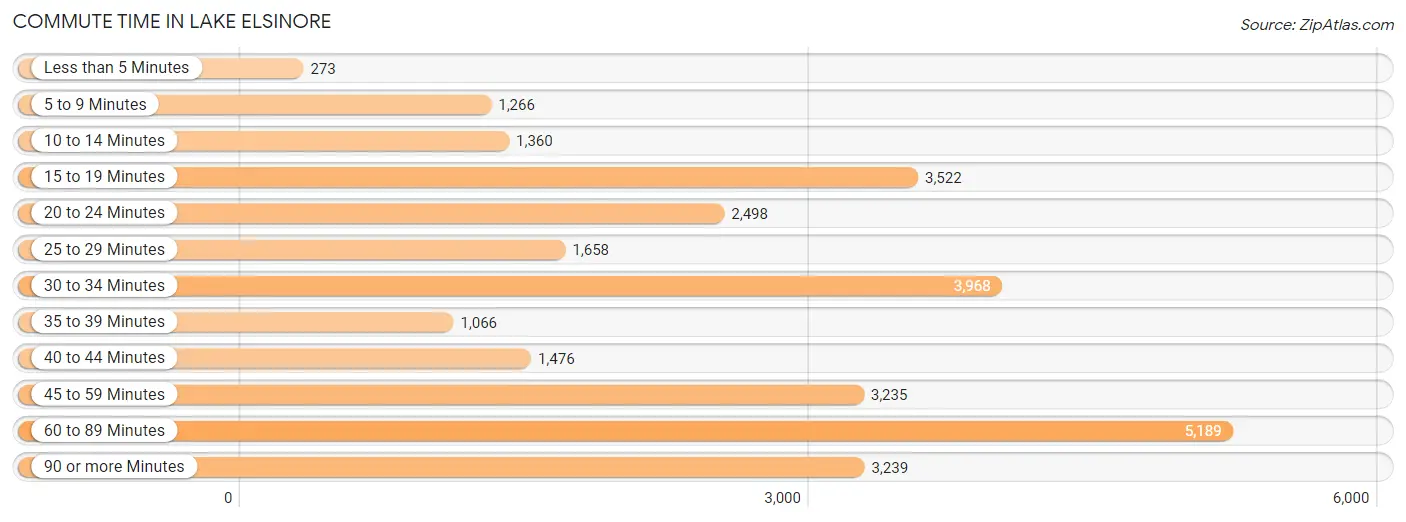
| Commute Time | # Commuters | % Commuters |
| Less than 5 Minutes | 273 | 0.9% |
| 5 to 9 Minutes | 1,266 | 4.4% |
| 10 to 14 Minutes | 1,360 | 4.7% |
| 15 to 19 Minutes | 3,522 | 12.2% |
| 20 to 24 Minutes | 2,498 | 8.7% |
| 25 to 29 Minutes | 1,658 | 5.8% |
| 30 to 34 Minutes | 3,968 | 13.8% |
| 35 to 39 Minutes | 1,066 | 3.7% |
| 40 to 44 Minutes | 1,476 | 5.1% |
| 45 to 59 Minutes | 3,235 | 11.3% |
| 60 to 89 Minutes | 5,189 | 18.0% |
| 90 or more Minutes | 3,239 | 11.3% |
Commute Time by Sex in Lake Elsinore
The most common commute times in Lake Elsinore are 60 to 89 minutes (3,531 commuters, 21.6%) for males and 15 to 19 minutes (2,065 commuters, 16.6%) for females.
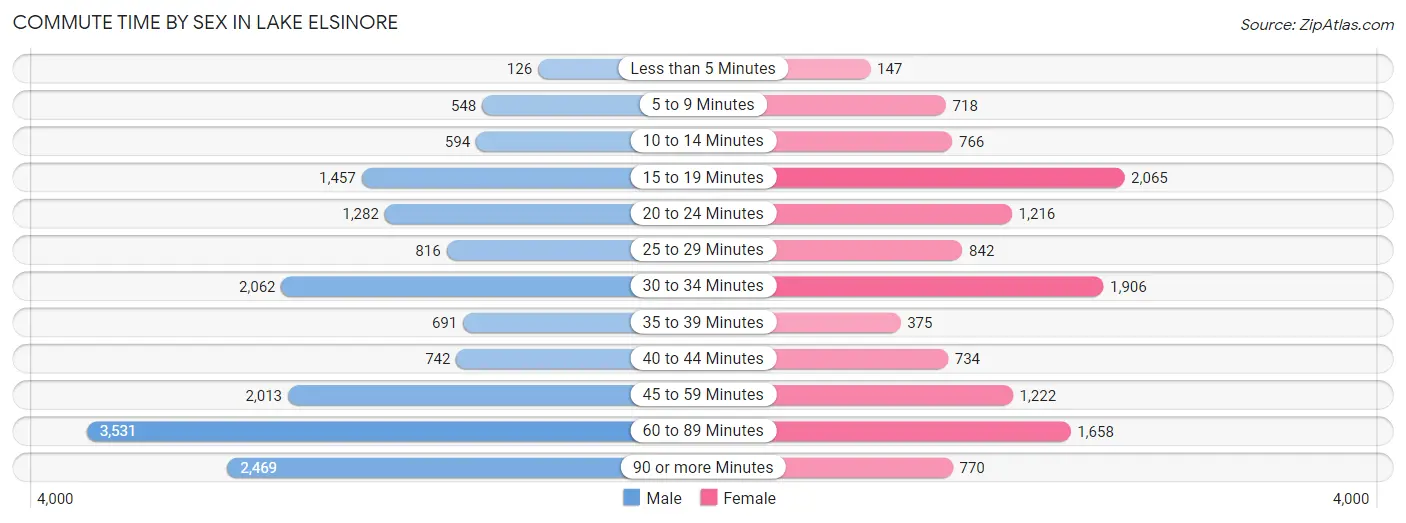
| Commute Time | Male | Female |
| Less than 5 Minutes | 126 (0.8%) | 147 (1.2%) |
| 5 to 9 Minutes | 548 (3.4%) | 718 (5.8%) |
| 10 to 14 Minutes | 594 (3.6%) | 766 (6.2%) |
| 15 to 19 Minutes | 1,457 (8.9%) | 2,065 (16.6%) |
| 20 to 24 Minutes | 1,282 (7.9%) | 1,216 (9.8%) |
| 25 to 29 Minutes | 816 (5.0%) | 842 (6.8%) |
| 30 to 34 Minutes | 2,062 (12.6%) | 1,906 (15.3%) |
| 35 to 39 Minutes | 691 (4.2%) | 375 (3.0%) |
| 40 to 44 Minutes | 742 (4.5%) | 734 (5.9%) |
| 45 to 59 Minutes | 2,013 (12.3%) | 1,222 (9.8%) |
| 60 to 89 Minutes | 3,531 (21.6%) | 1,658 (13.4%) |
| 90 or more Minutes | 2,469 (15.1%) | 770 (6.2%) |
Time of Departure to Work by Sex in Lake Elsinore
The most frequent times of departure to work in Lake Elsinore are 12:00 AM to 4:59 AM (3,547, 21.7%) for males and 7:00 AM to 7:29 AM (2,164, 17.4%) for females.
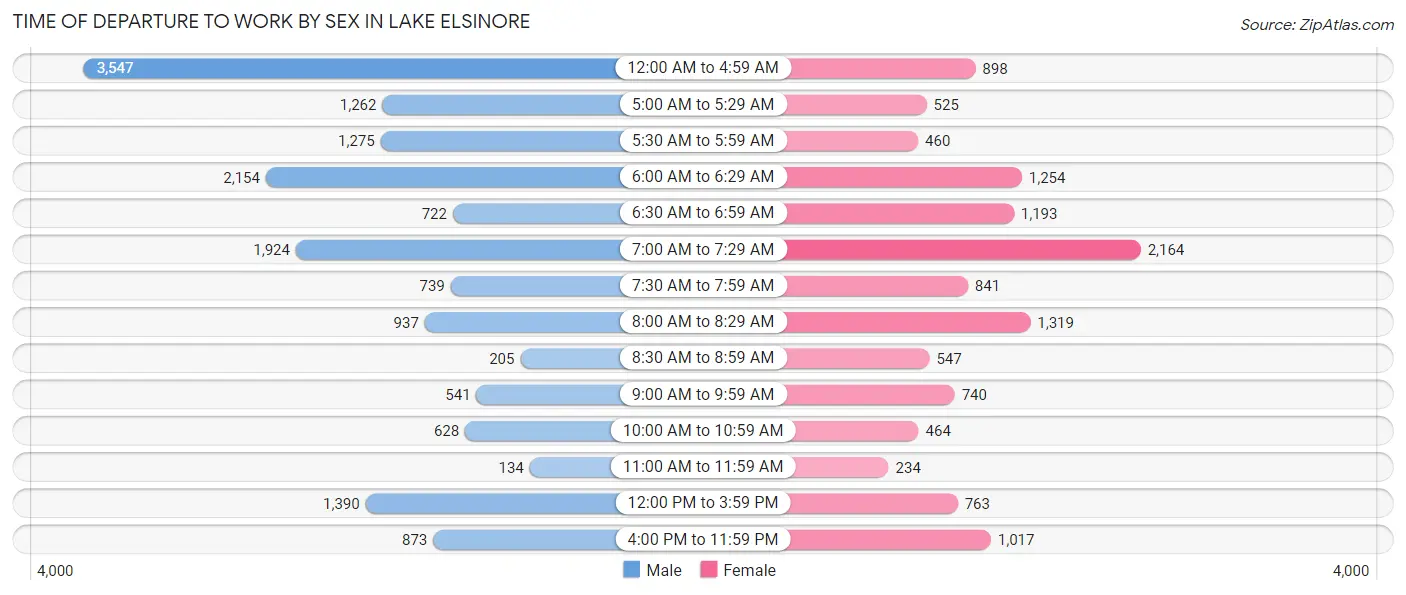
| Time of Departure | Male | Female |
| 12:00 AM to 4:59 AM | 3,547 (21.7%) | 898 (7.2%) |
| 5:00 AM to 5:29 AM | 1,262 (7.7%) | 525 (4.2%) |
| 5:30 AM to 5:59 AM | 1,275 (7.8%) | 460 (3.7%) |
| 6:00 AM to 6:29 AM | 2,154 (13.2%) | 1,254 (10.1%) |
| 6:30 AM to 6:59 AM | 722 (4.4%) | 1,193 (9.6%) |
| 7:00 AM to 7:29 AM | 1,924 (11.8%) | 2,164 (17.4%) |
| 7:30 AM to 7:59 AM | 739 (4.5%) | 841 (6.8%) |
| 8:00 AM to 8:29 AM | 937 (5.7%) | 1,319 (10.6%) |
| 8:30 AM to 8:59 AM | 205 (1.3%) | 547 (4.4%) |
| 9:00 AM to 9:59 AM | 541 (3.3%) | 740 (6.0%) |
| 10:00 AM to 10:59 AM | 628 (3.8%) | 464 (3.7%) |
| 11:00 AM to 11:59 AM | 134 (0.8%) | 234 (1.9%) |
| 12:00 PM to 3:59 PM | 1,390 (8.5%) | 763 (6.1%) |
| 4:00 PM to 11:59 PM | 873 (5.3%) | 1,017 (8.2%) |
| Total | 16,331 (100.0%) | 12,419 (100.0%) |
Housing Occupancy in Lake Elsinore
Occupancy by Ownership in Lake Elsinore
Of the total 20,004 dwellings in Lake Elsinore, owner-occupied units account for 14,041 (70.2%), while renter-occupied units make up 5,963 (29.8%).
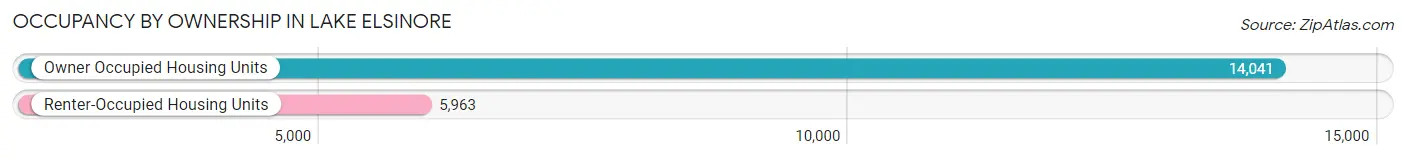
| Occupancy | # Housing Units | % Housing Units |
| Owner Occupied Housing Units | 14,041 | 70.2% |
| Renter-Occupied Housing Units | 5,963 | 29.8% |
| Total Occupied Housing Units | 20,004 | 100.0% |
Occupancy by Household Size in Lake Elsinore
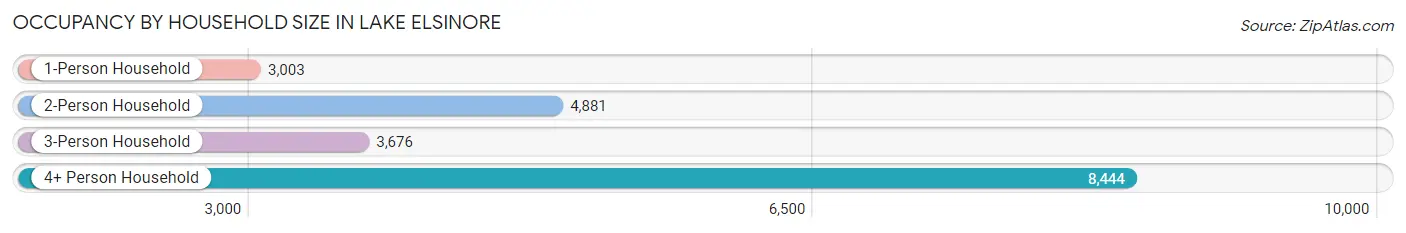
| Household Size | # Housing Units | % Housing Units |
| 1-Person Household | 3,003 | 15.0% |
| 2-Person Household | 4,881 | 24.4% |
| 3-Person Household | 3,676 | 18.4% |
| 4+ Person Household | 8,444 | 42.2% |
| Total Housing Units | 20,004 | 100.0% |
Occupancy by Ownership by Household Size in Lake Elsinore
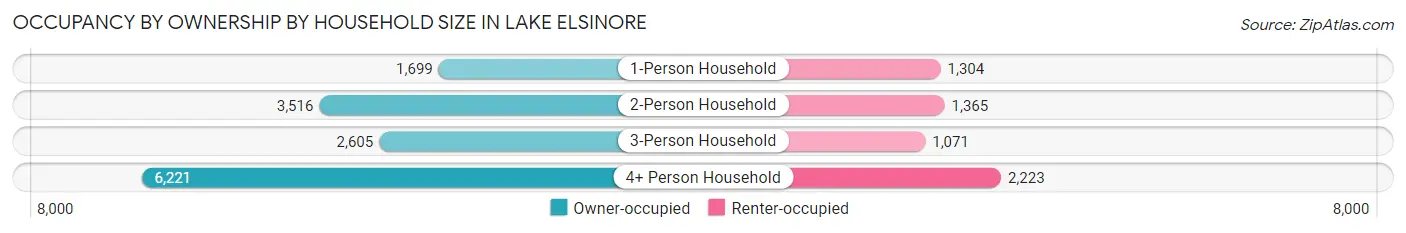
| Household Size | Owner-occupied | Renter-occupied |
| 1-Person Household | 1,699 (56.6%) | 1,304 (43.4%) |
| 2-Person Household | 3,516 (72.0%) | 1,365 (28.0%) |
| 3-Person Household | 2,605 (70.9%) | 1,071 (29.1%) |
| 4+ Person Household | 6,221 (73.7%) | 2,223 (26.3%) |
| Total Housing Units | 14,041 (70.2%) | 5,963 (29.8%) |
Occupancy by Educational Attainment in Lake Elsinore
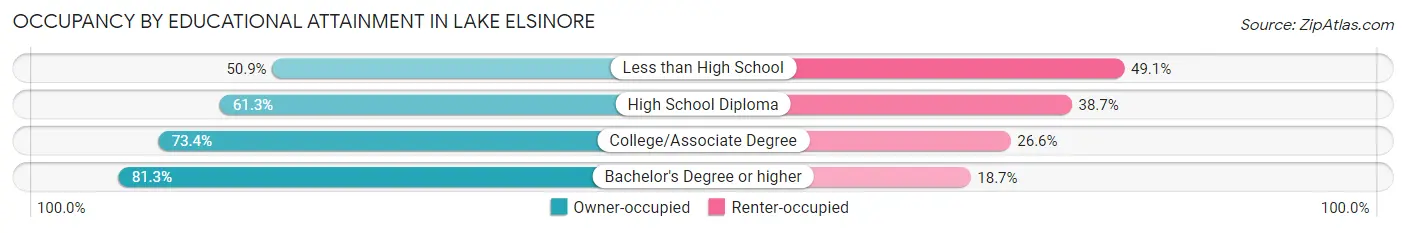
| Household Size | Owner-occupied | Renter-occupied |
| Less than High School | 1,061 (50.9%) | 1,025 (49.1%) |
| High School Diploma | 2,789 (61.3%) | 1,763 (38.7%) |
| College/Associate Degree | 6,290 (73.4%) | 2,279 (26.6%) |
| Bachelor's Degree or higher | 3,901 (81.3%) | 896 (18.7%) |
Occupancy by Age of Householder in Lake Elsinore
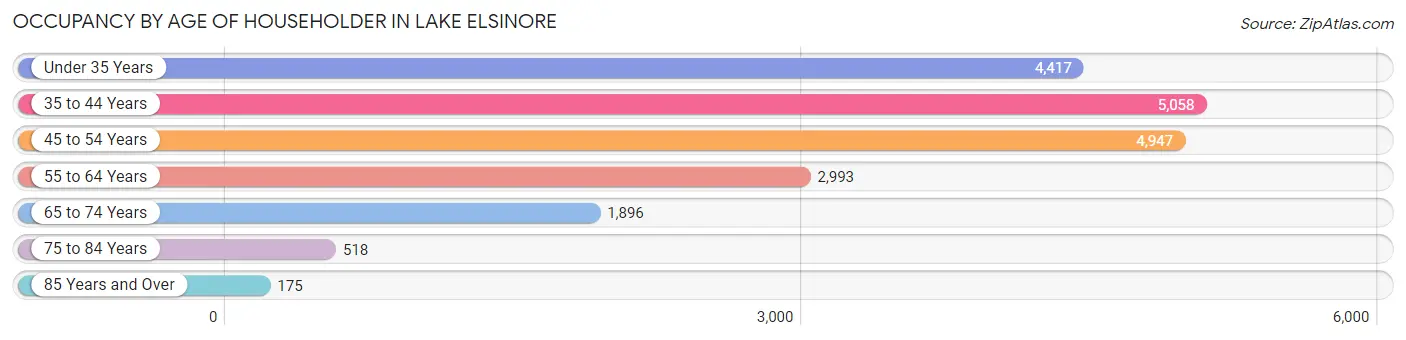
| Age Bracket | # Households | % Households |
| Under 35 Years | 4,417 | 22.1% |
| 35 to 44 Years | 5,058 | 25.3% |
| 45 to 54 Years | 4,947 | 24.7% |
| 55 to 64 Years | 2,993 | 15.0% |
| 65 to 74 Years | 1,896 | 9.5% |
| 75 to 84 Years | 518 | 2.6% |
| 85 Years and Over | 175 | 0.9% |
| Total | 20,004 | 100.0% |
Housing Finances in Lake Elsinore
Median Income by Occupancy in Lake Elsinore
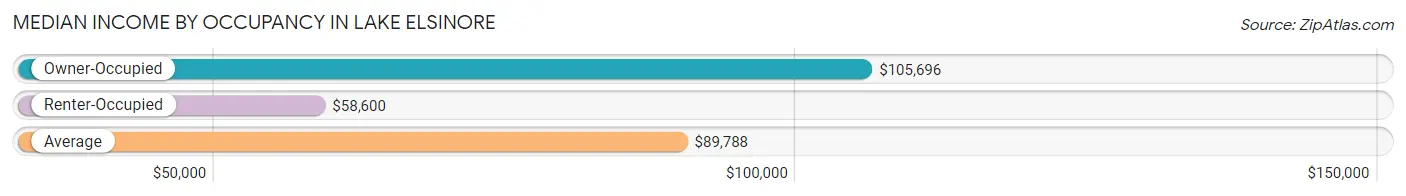
| Occupancy Type | # Households | Median Income |
| Owner-Occupied | 14,041 (70.2%) | $105,696 |
| Renter-Occupied | 5,963 (29.8%) | $58,600 |
| Average | 20,004 (100.0%) | $89,788 |
Occupancy by Householder Income Bracket in Lake Elsinore
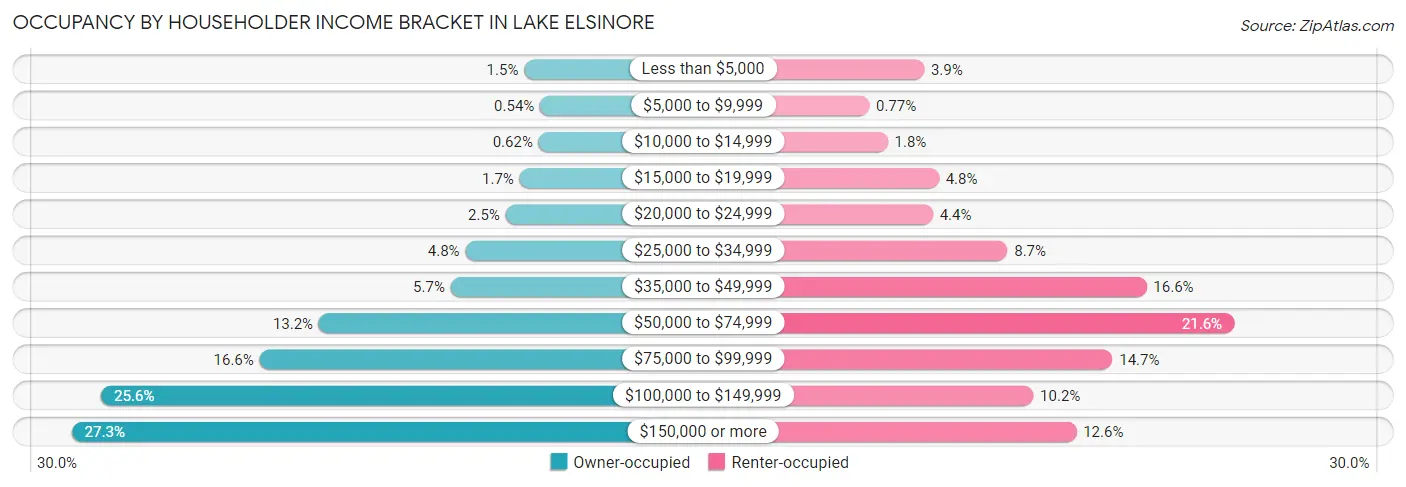
| Income Bracket | Owner-occupied | Renter-occupied |
| Less than $5,000 | 204 (1.5%) | 233 (3.9%) |
| $5,000 to $9,999 | 76 (0.5%) | 46 (0.8%) |
| $10,000 to $14,999 | 87 (0.6%) | 109 (1.8%) |
| $15,000 to $19,999 | 240 (1.7%) | 283 (4.8%) |
| $20,000 to $24,999 | 353 (2.5%) | 263 (4.4%) |
| $25,000 to $34,999 | 676 (4.8%) | 517 (8.7%) |
| $35,000 to $49,999 | 794 (5.7%) | 991 (16.6%) |
| $50,000 to $74,999 | 1,850 (13.2%) | 1,289 (21.6%) |
| $75,000 to $99,999 | 2,327 (16.6%) | 875 (14.7%) |
| $100,000 to $149,999 | 3,599 (25.6%) | 605 (10.2%) |
| $150,000 or more | 3,835 (27.3%) | 752 (12.6%) |
| Total | 14,041 (100.0%) | 5,963 (100.0%) |
Monthly Housing Cost Tiers in Lake Elsinore
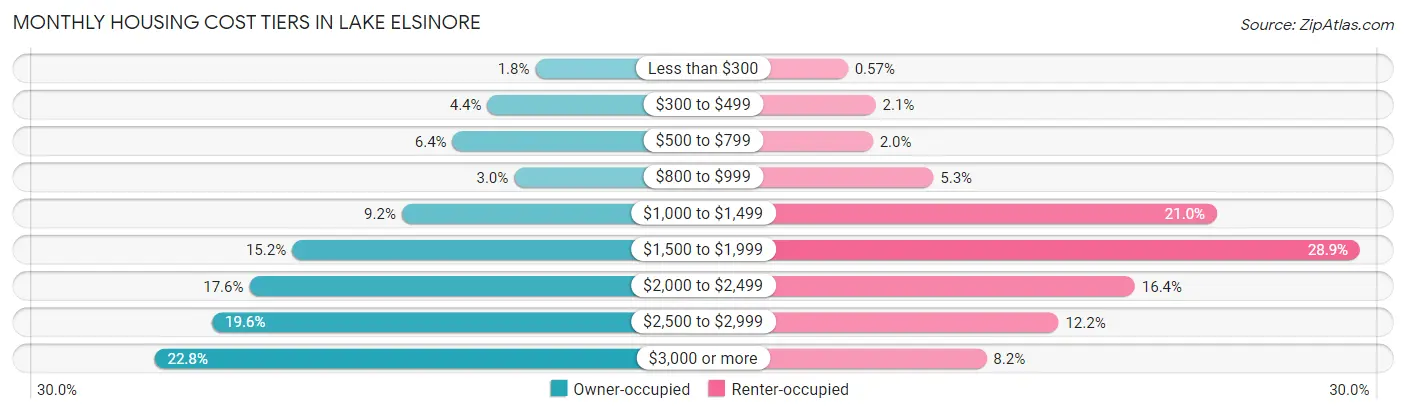
| Monthly Cost | Owner-occupied | Renter-occupied |
| Less than $300 | 251 (1.8%) | 34 (0.6%) |
| $300 to $499 | 624 (4.4%) | 126 (2.1%) |
| $500 to $799 | 894 (6.4%) | 116 (1.9%) |
| $800 to $999 | 415 (3.0%) | 316 (5.3%) |
| $1,000 to $1,499 | 1,287 (9.2%) | 1,250 (21.0%) |
| $1,500 to $1,999 | 2,138 (15.2%) | 1,721 (28.9%) |
| $2,000 to $2,499 | 2,470 (17.6%) | 980 (16.4%) |
| $2,500 to $2,999 | 2,758 (19.6%) | 728 (12.2%) |
| $3,000 or more | 3,204 (22.8%) | 491 (8.2%) |
| Total | 14,041 (100.0%) | 5,963 (100.0%) |
Physical Housing Characteristics in Lake Elsinore
Housing Structures in Lake Elsinore
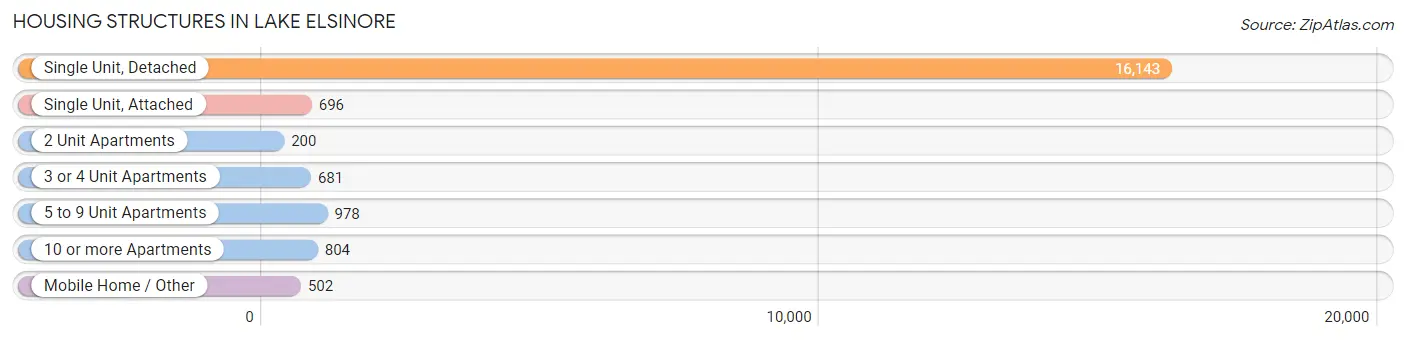
| Structure Type | # Housing Units | % Housing Units |
| Single Unit, Detached | 16,143 | 80.7% |
| Single Unit, Attached | 696 | 3.5% |
| 2 Unit Apartments | 200 | 1.0% |
| 3 or 4 Unit Apartments | 681 | 3.4% |
| 5 to 9 Unit Apartments | 978 | 4.9% |
| 10 or more Apartments | 804 | 4.0% |
| Mobile Home / Other | 502 | 2.5% |
| Total | 20,004 | 100.0% |
Housing Structures by Occupancy in Lake Elsinore
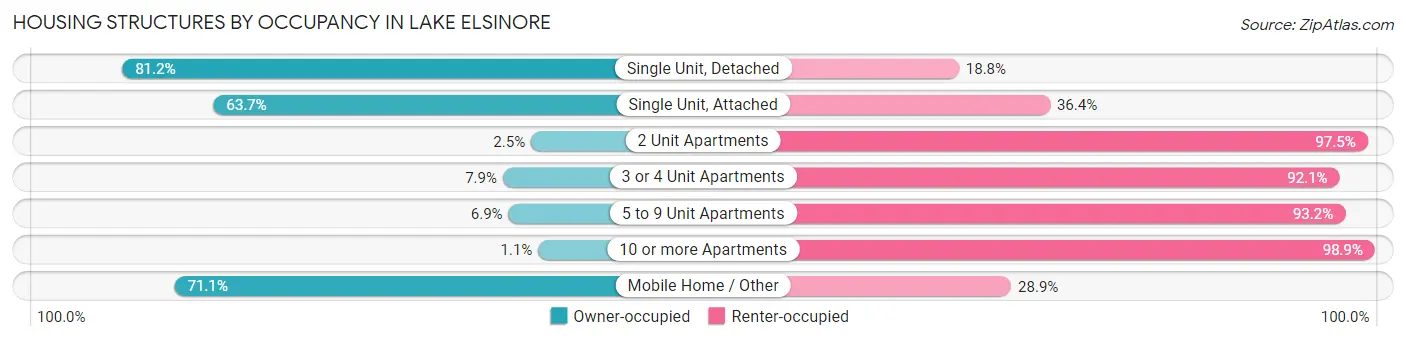
| Structure Type | Owner-occupied | Renter-occupied |
| Single Unit, Detached | 13,106 (81.2%) | 3,037 (18.8%) |
| Single Unit, Attached | 443 (63.6%) | 253 (36.3%) |
| 2 Unit Apartments | 5 (2.5%) | 195 (97.5%) |
| 3 or 4 Unit Apartments | 54 (7.9%) | 627 (92.1%) |
| 5 to 9 Unit Apartments | 67 (6.9%) | 911 (93.1%) |
| 10 or more Apartments | 9 (1.1%) | 795 (98.9%) |
| Mobile Home / Other | 357 (71.1%) | 145 (28.9%) |
| Total | 14,041 (70.2%) | 5,963 (29.8%) |
Housing Structures by Number of Rooms in Lake Elsinore
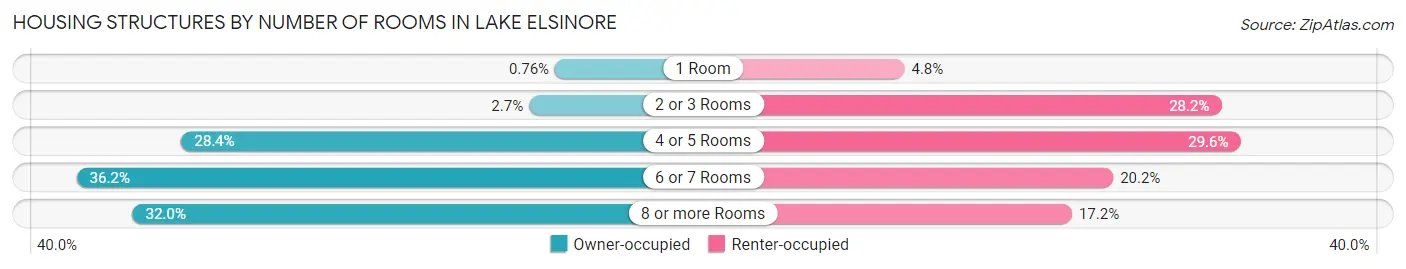
| Number of Rooms | Owner-occupied | Renter-occupied |
| 1 Room | 107 (0.8%) | 285 (4.8%) |
| 2 or 3 Rooms | 377 (2.7%) | 1,682 (28.2%) |
| 4 or 5 Rooms | 3,987 (28.4%) | 1,766 (29.6%) |
| 6 or 7 Rooms | 5,076 (36.1%) | 1,206 (20.2%) |
| 8 or more Rooms | 4,494 (32.0%) | 1,024 (17.2%) |
| Total | 14,041 (100.0%) | 5,963 (100.0%) |
Housing Structure by Heating Type in Lake Elsinore
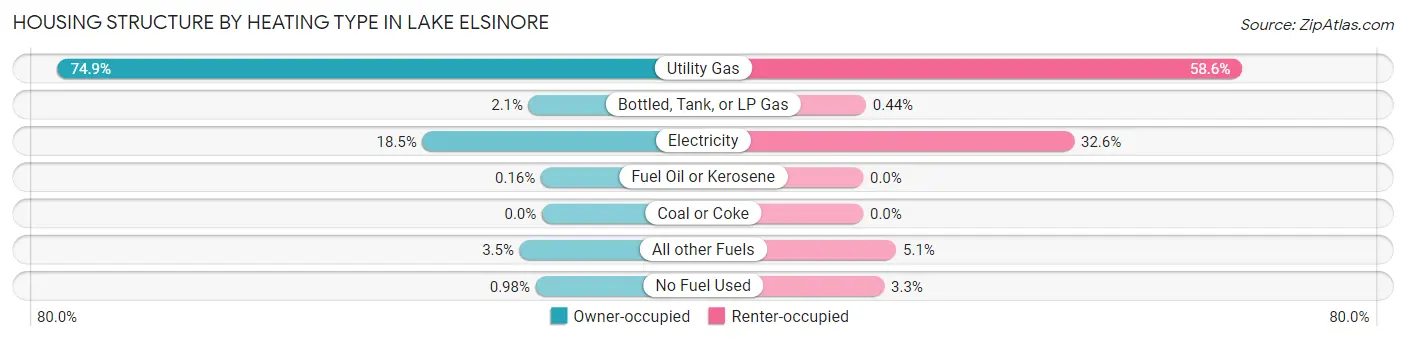
| Heating Type | Owner-occupied | Renter-occupied |
| Utility Gas | 10,516 (74.9%) | 3,493 (58.6%) |
| Bottled, Tank, or LP Gas | 288 (2.1%) | 26 (0.4%) |
| Electricity | 2,593 (18.5%) | 1,945 (32.6%) |
| Fuel Oil or Kerosene | 22 (0.2%) | 0 (0.0%) |
| Coal or Coke | 0 (0.0%) | 0 (0.0%) |
| All other Fuels | 484 (3.5%) | 305 (5.1%) |
| No Fuel Used | 138 (1.0%) | 194 (3.3%) |
| Total | 14,041 (100.0%) | 5,963 (100.0%) |
Household Vehicle Usage in Lake Elsinore
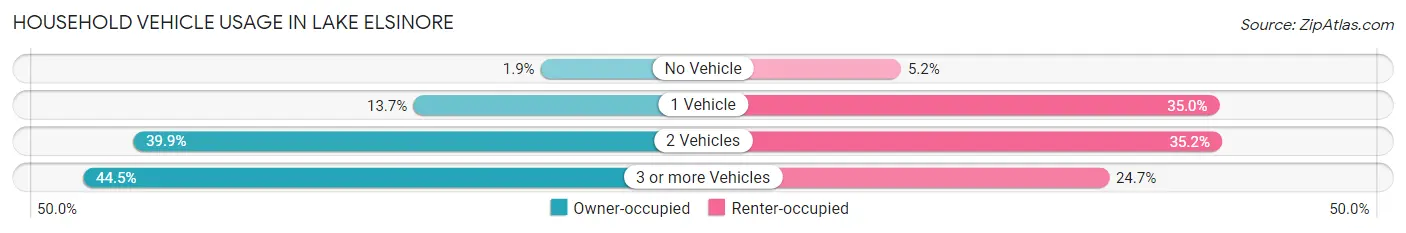
| Vehicles per Household | Owner-occupied | Renter-occupied |
| No Vehicle | 260 (1.8%) | 312 (5.2%) |
| 1 Vehicle | 1,929 (13.7%) | 2,084 (34.9%) |
| 2 Vehicles | 5,599 (39.9%) | 2,097 (35.2%) |
| 3 or more Vehicles | 6,253 (44.5%) | 1,470 (24.6%) |
| Total | 14,041 (100.0%) | 5,963 (100.0%) |
Real Estate & Mortgages in Lake Elsinore
Real Estate and Mortgage Overview in Lake Elsinore
| Characteristic | Without Mortgage | With Mortgage |
| Housing Units | 2,484 | 11,557 |
| Median Property Value | $416,300 | $472,000 |
| Median Household Income | $78,553 | $3,254 |
| Monthly Housing Costs | $679 | $3,195 |
| Real Estate Taxes | $2,968 | $180 |
Property Value by Mortgage Status in Lake Elsinore
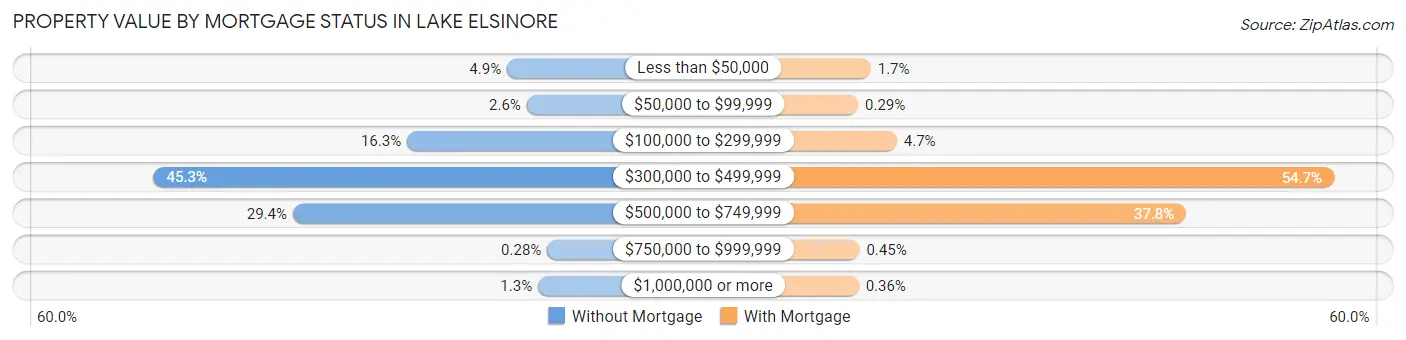
| Property Value | Without Mortgage | With Mortgage |
| Less than $50,000 | 121 (4.9%) | 201 (1.7%) |
| $50,000 to $99,999 | 65 (2.6%) | 34 (0.3%) |
| $100,000 to $299,999 | 405 (16.3%) | 545 (4.7%) |
| $300,000 to $499,999 | 1,124 (45.3%) | 6,318 (54.7%) |
| $500,000 to $749,999 | 729 (29.3%) | 4,365 (37.8%) |
| $750,000 to $999,999 | 7 (0.3%) | 52 (0.4%) |
| $1,000,000 or more | 33 (1.3%) | 42 (0.4%) |
| Total | 2,484 (100.0%) | 11,557 (100.0%) |
Household Income by Mortgage Status in Lake Elsinore
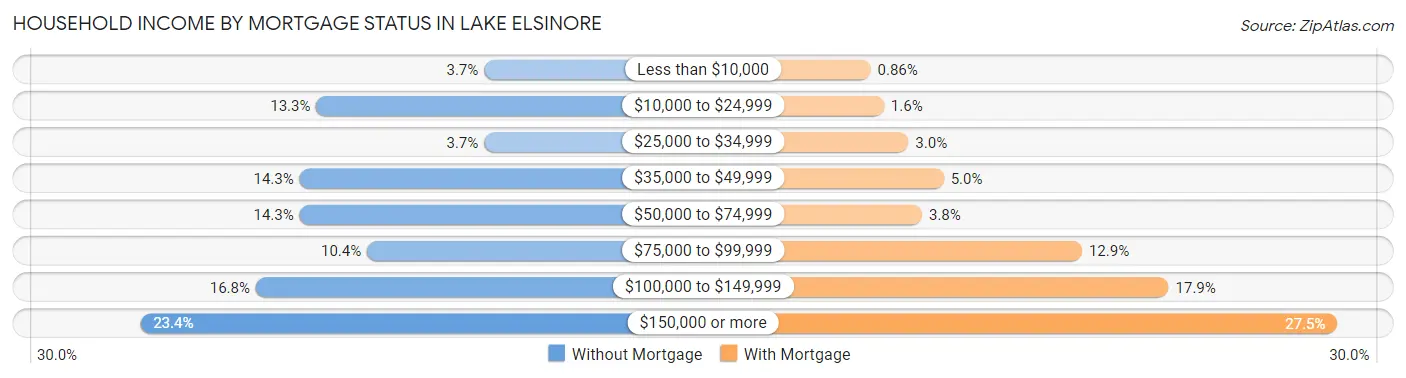
| Household Income | Without Mortgage | With Mortgage |
| Less than $10,000 | 93 (3.7%) | 99 (0.9%) |
| $10,000 to $24,999 | 331 (13.3%) | 187 (1.6%) |
| $25,000 to $34,999 | 93 (3.7%) | 349 (3.0%) |
| $35,000 to $49,999 | 355 (14.3%) | 583 (5.0%) |
| $50,000 to $74,999 | 355 (14.3%) | 439 (3.8%) |
| $75,000 to $99,999 | 259 (10.4%) | 1,495 (12.9%) |
| $100,000 to $149,999 | 417 (16.8%) | 2,068 (17.9%) |
| $150,000 or more | 581 (23.4%) | 3,182 (27.5%) |
| Total | 2,484 (100.0%) | 11,557 (100.0%) |
Property Value to Household Income Ratio in Lake Elsinore
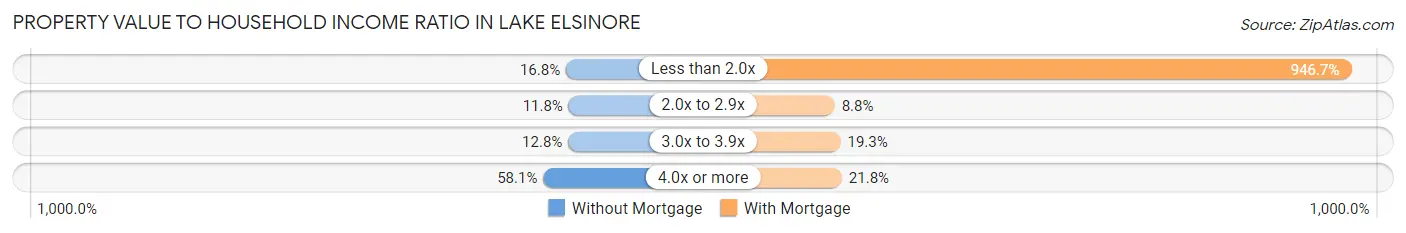
| Value-to-Income Ratio | Without Mortgage | With Mortgage |
| Less than 2.0x | 417 (16.8%) | 109,406 (946.7%) |
| 2.0x to 2.9x | 294 (11.8%) | 1,014 (8.8%) |
| 3.0x to 3.9x | 319 (12.8%) | 2,230 (19.3%) |
| 4.0x or more | 1,444 (58.1%) | 2,514 (21.7%) |
| Total | 2,484 (100.0%) | 11,557 (100.0%) |
Real Estate Taxes by Mortgage Status in Lake Elsinore
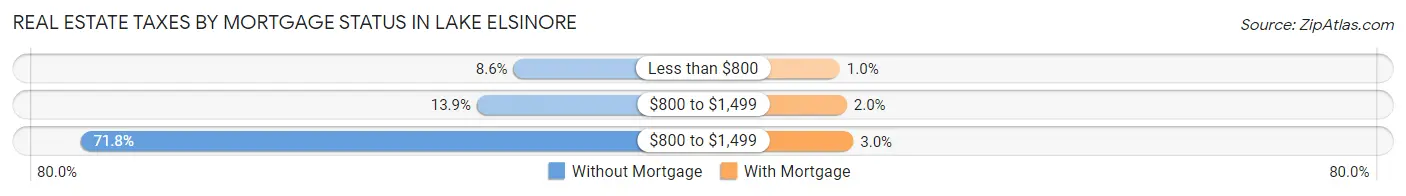
| Property Taxes | Without Mortgage | With Mortgage |
| Less than $800 | 213 (8.6%) | 115 (1.0%) |
| $800 to $1,499 | 346 (13.9%) | 233 (2.0%) |
| $800 to $1,499 | 1,784 (71.8%) | 343 (3.0%) |
| Total | 2,484 (100.0%) | 11,557 (100.0%) |
Health & Disability in Lake Elsinore
Health Insurance Coverage by Age in Lake Elsinore
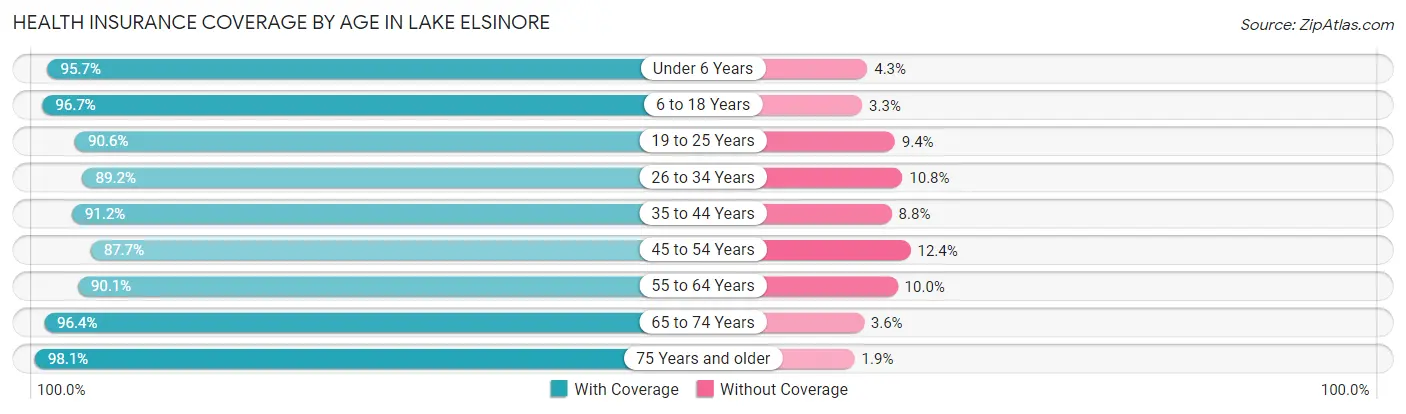
| Age Bracket | With Coverage | Without Coverage |
| Under 6 Years | 6,187 (95.7%) | 277 (4.3%) |
| 6 to 18 Years | 13,873 (96.7%) | 478 (3.3%) |
| 19 to 25 Years | 6,066 (90.6%) | 631 (9.4%) |
| 26 to 34 Years | 9,185 (89.2%) | 1,116 (10.8%) |
| 35 to 44 Years | 9,158 (91.2%) | 887 (8.8%) |
| 45 to 54 Years | 8,132 (87.6%) | 1,146 (12.3%) |
| 55 to 64 Years | 5,780 (90.0%) | 639 (10.0%) |
| 65 to 74 Years | 3,892 (96.4%) | 147 (3.6%) |
| 75 Years and older | 2,139 (98.1%) | 42 (1.9%) |
| Total | 64,412 (92.3%) | 5,363 (7.7%) |
Health Insurance Coverage by Citizenship Status in Lake Elsinore
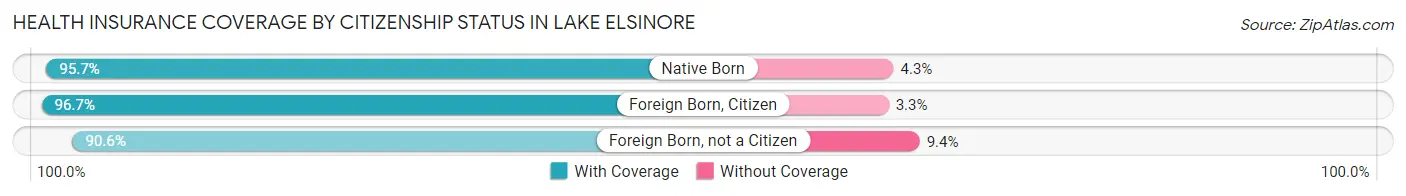
| Citizenship Status | With Coverage | Without Coverage |
| Native Born | 6,187 (95.7%) | 277 (4.3%) |
| Foreign Born, Citizen | 13,873 (96.7%) | 478 (3.3%) |
| Foreign Born, not a Citizen | 6,066 (90.6%) | 631 (9.4%) |
Health Insurance Coverage by Household Income in Lake Elsinore
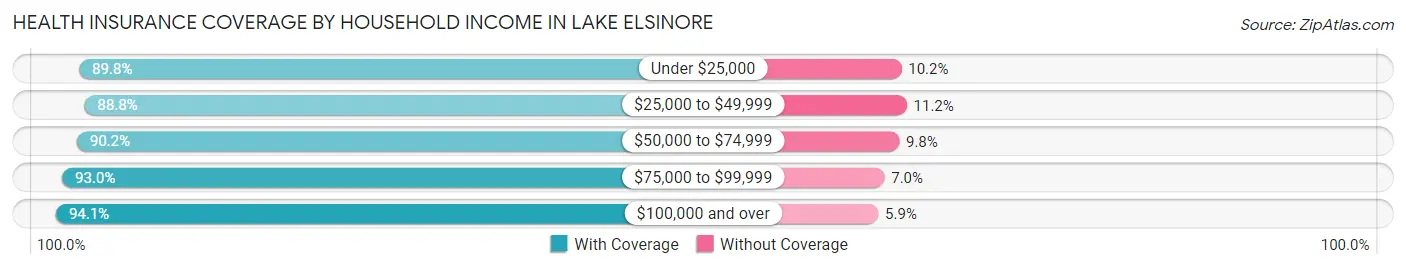
| Household Income | With Coverage | Without Coverage |
| Under $25,000 | 4,012 (89.8%) | 456 (10.2%) |
| $25,000 to $49,999 | 7,928 (88.8%) | 1,001 (11.2%) |
| $50,000 to $74,999 | 11,006 (90.2%) | 1,195 (9.8%) |
| $75,000 to $99,999 | 9,257 (93.0%) | 699 (7.0%) |
| $100,000 and over | 32,189 (94.1%) | 2,012 (5.9%) |
Public vs Private Health Insurance Coverage by Age in Lake Elsinore
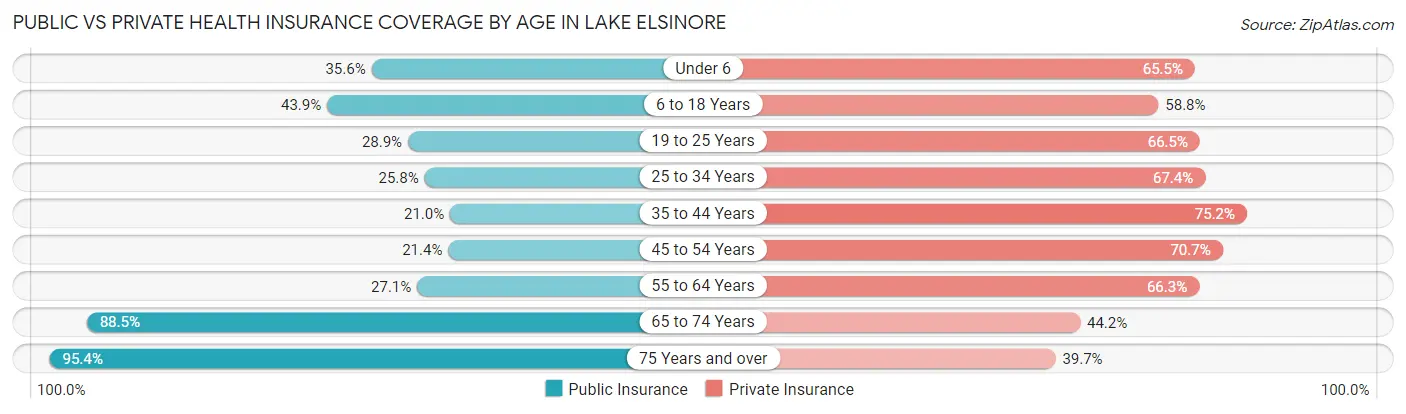
| Age Bracket | Public Insurance | Private Insurance |
| Under 6 | 2,302 (35.6%) | 4,235 (65.5%) |
| 6 to 18 Years | 6,295 (43.9%) | 8,432 (58.8%) |
| 19 to 25 Years | 1,932 (28.8%) | 4,450 (66.4%) |
| 25 to 34 Years | 2,655 (25.8%) | 6,945 (67.4%) |
| 35 to 44 Years | 2,112 (21.0%) | 7,552 (75.2%) |
| 45 to 54 Years | 1,983 (21.4%) | 6,555 (70.7%) |
| 55 to 64 Years | 1,742 (27.1%) | 4,255 (66.3%) |
| 65 to 74 Years | 3,573 (88.5%) | 1,786 (44.2%) |
| 75 Years and over | 2,080 (95.4%) | 865 (39.7%) |
| Total | 24,674 (35.4%) | 45,075 (64.6%) |
Disability Status by Sex by Age in Lake Elsinore

| Age Bracket | Male | Female |
| Under 5 Years | 28 (1.0%) | 0 (0.0%) |
| 5 to 17 Years | 349 (4.4%) | 153 (2.4%) |
| 18 to 34 Years | 819 (9.3%) | 414 (4.5%) |
| 35 to 64 Years | 1,037 (8.1%) | 1,303 (10.1%) |
| 65 to 74 Years | 291 (15.8%) | 566 (25.8%) |
| 75 Years and over | 415 (52.4%) | 880 (63.3%) |
Disability Class by Sex by Age in Lake Elsinore
Disability Class: Hearing Difficulty
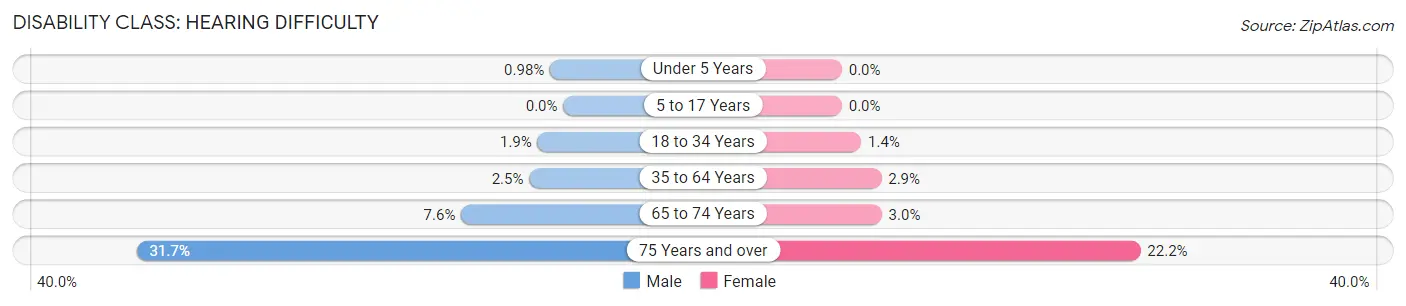
| Age Bracket | Male | Female |
| Under 5 Years | 28 (1.0%) | 0 (0.0%) |
| 5 to 17 Years | 0 (0.0%) | 0 (0.0%) |
| 18 to 34 Years | 168 (1.9%) | 132 (1.4%) |
| 35 to 64 Years | 323 (2.5%) | 380 (2.9%) |
| 65 to 74 Years | 140 (7.6%) | 65 (3.0%) |
| 75 Years and over | 251 (31.7%) | 308 (22.2%) |
Disability Class: Vision Difficulty
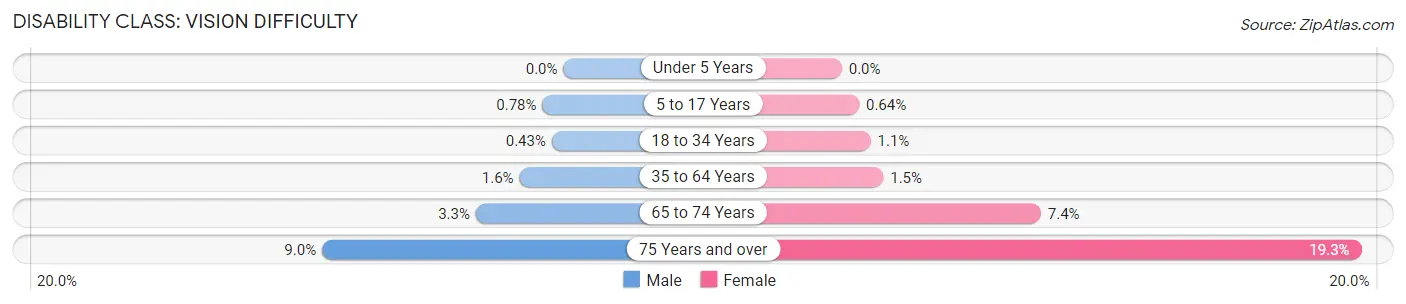
| Age Bracket | Male | Female |
| Under 5 Years | 0 (0.0%) | 0 (0.0%) |
| 5 to 17 Years | 62 (0.8%) | 41 (0.6%) |
| 18 to 34 Years | 38 (0.4%) | 99 (1.1%) |
| 35 to 64 Years | 208 (1.6%) | 200 (1.5%) |
| 65 to 74 Years | 60 (3.3%) | 162 (7.4%) |
| 75 Years and over | 71 (9.0%) | 268 (19.3%) |
Disability Class: Cognitive Difficulty
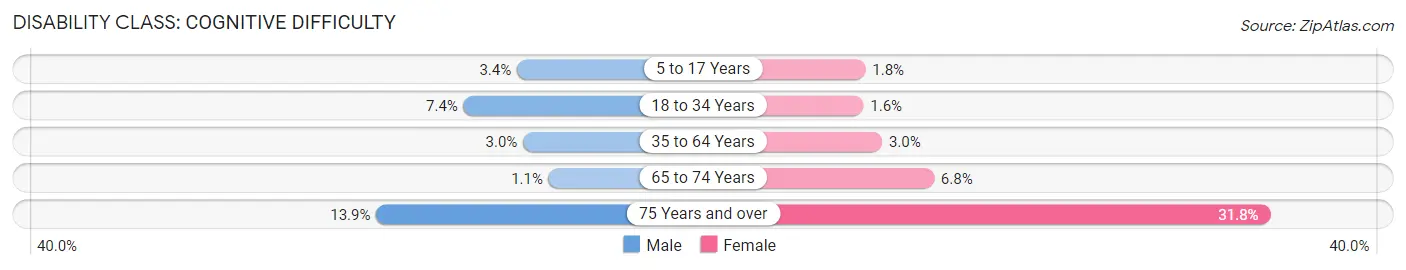
| Age Bracket | Male | Female |
| 5 to 17 Years | 272 (3.4%) | 112 (1.8%) |
| 18 to 34 Years | 650 (7.4%) | 148 (1.6%) |
| 35 to 64 Years | 381 (3.0%) | 386 (3.0%) |
| 65 to 74 Years | 20 (1.1%) | 150 (6.8%) |
| 75 Years and over | 110 (13.9%) | 442 (31.8%) |
Disability Class: Ambulatory Difficulty
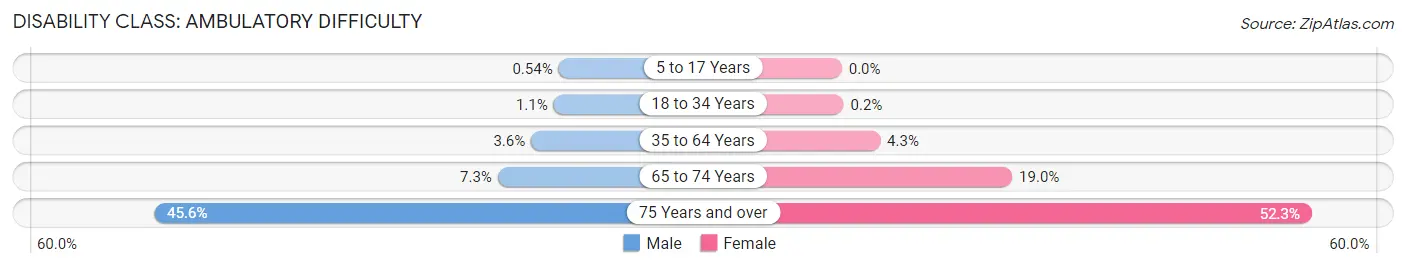
| Age Bracket | Male | Female |
| 5 to 17 Years | 43 (0.5%) | 0 (0.0%) |
| 18 to 34 Years | 96 (1.1%) | 18 (0.2%) |
| 35 to 64 Years | 460 (3.6%) | 554 (4.3%) |
| 65 to 74 Years | 135 (7.3%) | 416 (19.0%) |
| 75 Years and over | 361 (45.6%) | 727 (52.3%) |
Disability Class: Self-Care Difficulty
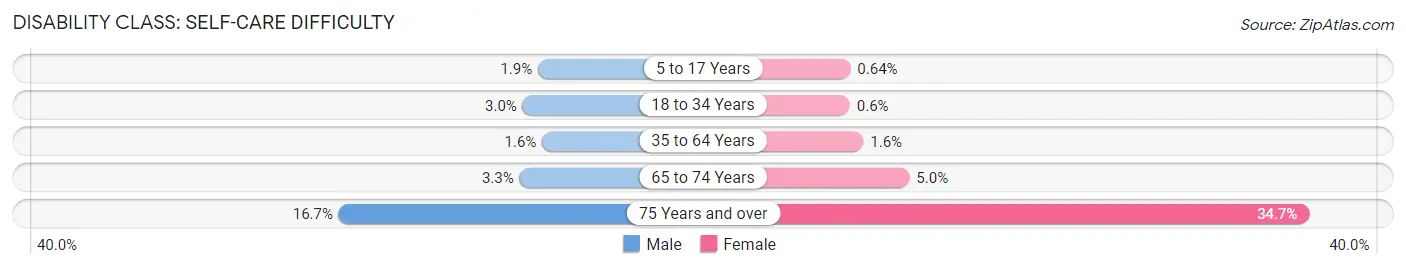
| Age Bracket | Male | Female |
| 5 to 17 Years | 149 (1.9%) | 41 (0.6%) |
| 18 to 34 Years | 265 (3.0%) | 55 (0.6%) |
| 35 to 64 Years | 201 (1.6%) | 208 (1.6%) |
| 65 to 74 Years | 60 (3.3%) | 110 (5.0%) |
| 75 Years and over | 132 (16.7%) | 482 (34.7%) |
Technology Access in Lake Elsinore
Computing Device Access in Lake Elsinore
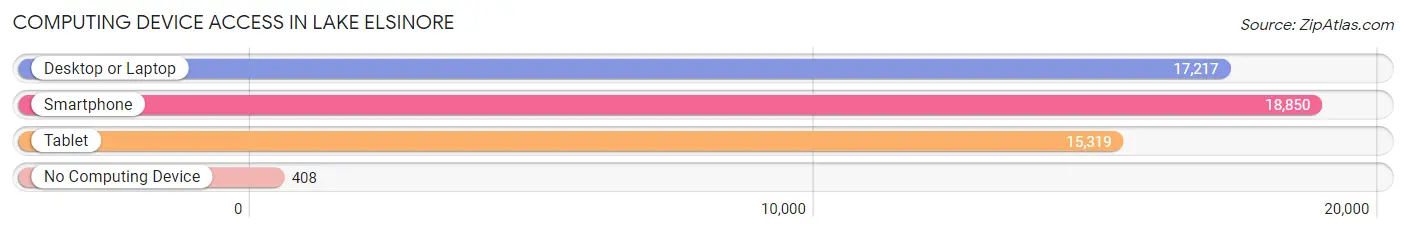
| Device Type | # Households | % Households |
| Desktop or Laptop | 17,217 | 86.1% |
| Smartphone | 18,850 | 94.2% |
| Tablet | 15,319 | 76.6% |
| No Computing Device | 408 | 2.0% |
| Total | 20,004 | 100.0% |
Internet Access in Lake Elsinore
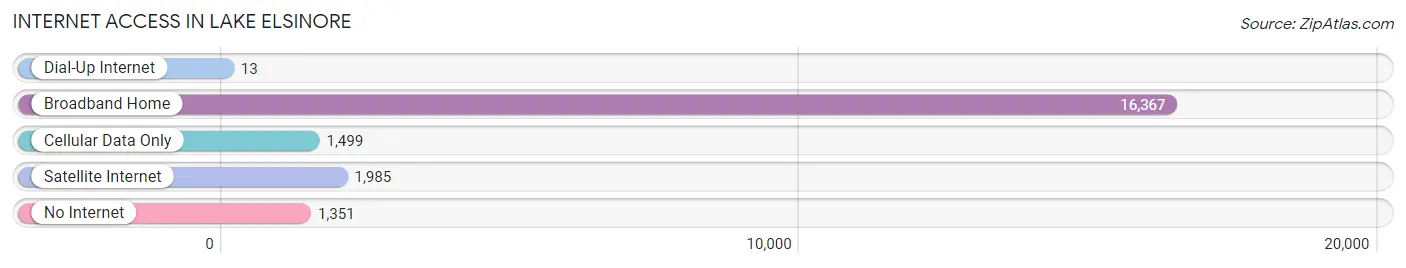
| Internet Type | # Households | % Households |
| Dial-Up Internet | 13 | 0.1% |
| Broadband Home | 16,367 | 81.8% |
| Cellular Data Only | 1,499 | 7.5% |
| Satellite Internet | 1,985 | 9.9% |
| No Internet | 1,351 | 6.8% |
| Total | 20,004 | 100.0% |
Lake Elsinore Summary
Lake Elsinore is a city located in Riverside County, California, United States. It is situated on the shore of Lake Elsinore, a natural freshwater lake about 3,000 acres in size. The city has a population of approximately 60,000 people and is the largest natural freshwater lake in Southern California.
History
The area around Lake Elsinore has been inhabited for thousands of years. The Luiseño people were the first to settle in the area, and they lived in the area for centuries before the arrival of the Spanish in the late 1700s. The Spanish established a mission in the area in 1819, and the area was later incorporated as a city in 1888.
The city was originally named La Laguna, which means “the lake” in Spanish. The name was changed to Elsinore in 1883, after the lake. The city was a popular destination for tourists in the late 1800s and early 1900s, and it was known for its hot springs and mineral baths.
Geography
Lake Elsinore is located in southwestern Riverside County, about 70 miles southeast of Los Angeles. The city is situated on the shore of Lake Elsinore, a natural freshwater lake about 3,000 acres in size. The lake is fed by the San Jacinto River and is surrounded by the Santa Ana Mountains to the north and the Temescal Mountains to the south.
The city has a total area of about 31 square miles, with about 10 square miles of land and 21 square miles of water. The city is located at an elevation of 1,400 feet above sea level.
Economy
The economy of Lake Elsinore is largely based on tourism and recreation. The city is home to several popular attractions, including the Lake Elsinore Casino, the Lake Elsinore Outlets, and the Lake Elsinore Grand Prix. The city is also home to several wineries and vineyards, as well as a number of golf courses.
The city is also home to several manufacturing and industrial businesses, including a cement plant, a steel mill, and a paper mill. The city is also home to a number of retail stores, restaurants, and other businesses.
Demographics
As of the 2010 census, the population of Lake Elsinore was 51,821. The racial makeup of the city was 68.3% White, 4.2% African American, 0.7% Native American, 1.3% Asian, 0.2% Pacific Islander, 20.2% from other races, and 4.3% from two or more races. Hispanic or Latino of any race were 37.2% of the population.
The median income for a household in the city was $45,837, and the median income for a family was $50,945. The per capita income for the city was $20,945. About 16.2% of the population was below the poverty line.
Lake Elsinore is a vibrant and diverse city with a rich history and a bright future. The city is home to a variety of attractions and businesses, and it is a popular destination for tourists and locals alike. The city is also home to a diverse population, with a variety of cultures and backgrounds.
Common Questions
What is Per Capita Income in Lake Elsinore?
Per Capita income in Lake Elsinore is $32,792.
What is the Median Family Income in Lake Elsinore?
Median Family Income in Lake Elsinore is $95,168.
What is the Median Household income in Lake Elsinore?
Median Household Income in Lake Elsinore is $89,788.
What is Income or Wage Gap in Lake Elsinore?
Income or Wage Gap in Lake Elsinore is 38.4%.
Women in Lake Elsinore earn 61.6 cents for every dollar earned by a man.
What is Inequality or Gini Index in Lake Elsinore?
Inequality or Gini Index in Lake Elsinore is 0.41.
What is the Total Population of Lake Elsinore?
Total Population of Lake Elsinore is 69,993.
What is the Total Male Population of Lake Elsinore?
Total Male Population of Lake Elsinore is 35,102.
What is the Total Female Population of Lake Elsinore?
Total Female Population of Lake Elsinore is 34,891.
What is the Ratio of Males per 100 Females in Lake Elsinore?
There are 100.60 Males per 100 Females in Lake Elsinore.
What is the Ratio of Females per 100 Males in Lake Elsinore?
There are 99.40 Females per 100 Males in Lake Elsinore.
What is the Median Population Age in Lake Elsinore?
Median Population Age in Lake Elsinore is 32.5 Years.
What is the Average Family Size in Lake Elsinore
Average Family Size in Lake Elsinore is 3.9 People.
What is the Average Household Size in Lake Elsinore
Average Household Size in Lake Elsinore is 3.5 People.
How Large is the Labor Force in Lake Elsinore?
There are 34,627 People in the Labor Forcein in Lake Elsinore.
What is the Percentage of People in the Labor Force in Lake Elsinore?
65.9% of People are in the Labor Force in Lake Elsinore.
What is the Unemployment Rate in Lake Elsinore?
Unemployment Rate in Lake Elsinore is 6.9%.