Alameda, CA Map & Demographics
Alameda Map
Alameda Overview
$68,122
PER CAPITA INCOME
$163,118
AVG FAMILY INCOME
$129,917
AVG HOUSEHOLD INCOME
17.3%
WAGE / INCOME GAP [ % ]
82.7¢/ $1
WAGE / INCOME GAP [ $ ]
$10,107
FAMILY INCOME DEFICIT
0.46
INEQUALITY / GINI INDEX
77,565
TOTAL POPULATION
37,967
MALE POPULATION
39,598
FEMALE POPULATION
95.88
MALES / 100 FEMALES
104.30
FEMALES / 100 MALES
40.6
MEDIAN AGE
3.2
AVG FAMILY SIZE
2.6
AVG HOUSEHOLD SIZE
42,746
LABOR FORCE [ PEOPLE ]
68.2%
PERCENT IN LABOR FORCE
5.1%
UNEMPLOYMENT RATE
Alameda Area Codes
Income in Alameda
Income Overview in Alameda
Per Capita Income in Alameda is $68,122, while median incomes of families and households are $163,118 and $129,917 respectively.
| Characteristic | Number | Measure |
| Per Capita Income | 77,565 | $68,122 |
| Median Family Income | 19,060 | $163,118 |
| Mean Family Income | 19,060 | $203,917 |
| Median Household Income | 29,820 | $129,917 |
| Mean Household Income | 29,820 | $171,518 |
| Income Deficit | 19,060 | $10,107 |
| Wage / Income Gap (%) | 77,565 | 17.35% |
| Wage / Income Gap ($) | 77,565 | 82.65¢ per $1 |
| Gini / Inequality Index | 77,565 | 0.46 |
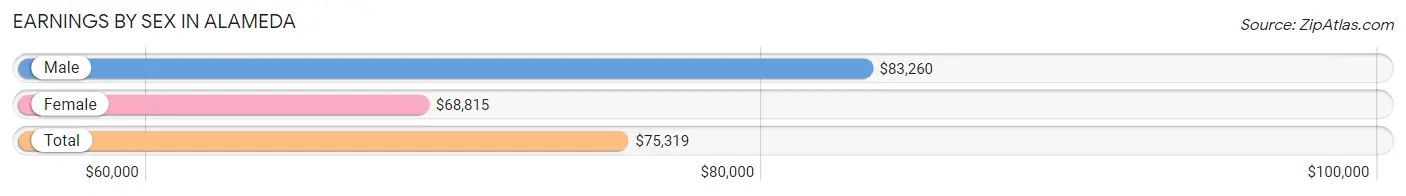
Earnings by Sex in Alameda
Average Earnings in Alameda are $75,319, $83,260 for men and $68,815 for women, a difference of 17.3%.
| Sex | Number | Average Earnings |
| Male | 22,581 (51.1%) | $83,260 |
| Female | 21,624 (48.9%) | $68,815 |
| Total | 44,205 (100.0%) | $75,319 |
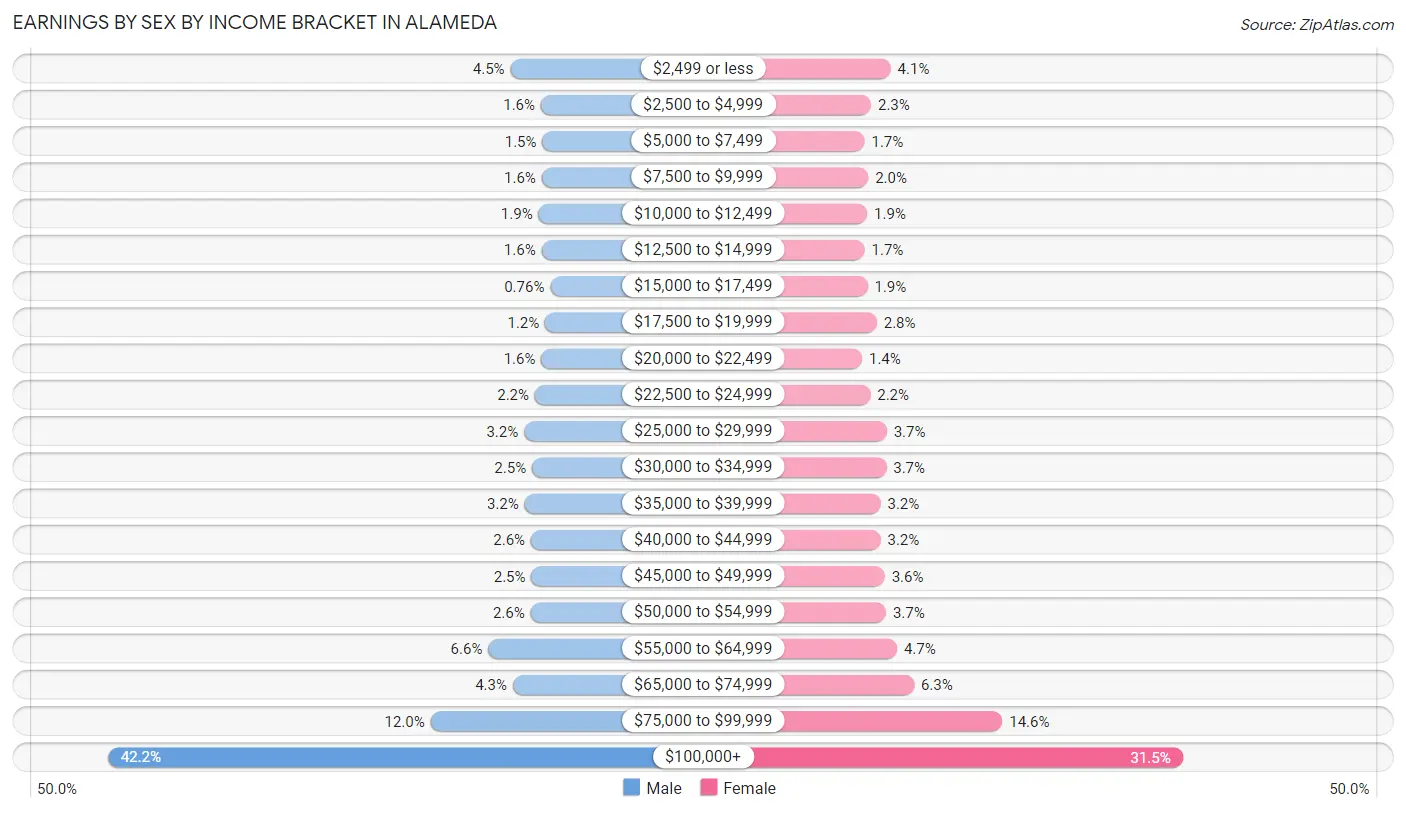
Earnings by Sex by Income Bracket in Alameda
The most common earnings brackets in Alameda are $100,000+ for men (9,532 | 42.2%) and $100,000+ for women (6,801 | 31.5%).
| Income | Male | Female |
| $2,499 or less | 1,014 (4.5%) | 888 (4.1%) |
| $2,500 to $4,999 | 370 (1.6%) | 491 (2.3%) |
| $5,000 to $7,499 | 339 (1.5%) | 359 (1.7%) |
| $7,500 to $9,999 | 353 (1.6%) | 434 (2.0%) |
| $10,000 to $12,499 | 421 (1.9%) | 412 (1.9%) |
| $12,500 to $14,999 | 357 (1.6%) | 361 (1.7%) |
| $15,000 to $17,499 | 171 (0.8%) | 420 (1.9%) |
| $17,500 to $19,999 | 279 (1.2%) | 607 (2.8%) |
| $20,000 to $22,499 | 361 (1.6%) | 309 (1.4%) |
| $22,500 to $24,999 | 496 (2.2%) | 476 (2.2%) |
| $25,000 to $29,999 | 725 (3.2%) | 808 (3.7%) |
| $30,000 to $34,999 | 558 (2.5%) | 801 (3.7%) |
| $35,000 to $39,999 | 714 (3.2%) | 684 (3.2%) |
| $40,000 to $44,999 | 581 (2.6%) | 684 (3.2%) |
| $45,000 to $49,999 | 572 (2.5%) | 767 (3.5%) |
| $50,000 to $54,999 | 586 (2.6%) | 793 (3.7%) |
| $55,000 to $64,999 | 1,484 (6.6%) | 1,017 (4.7%) |
| $65,000 to $74,999 | 964 (4.3%) | 1,361 (6.3%) |
| $75,000 to $99,999 | 2,704 (12.0%) | 3,151 (14.6%) |
| $100,000+ | 9,532 (42.2%) | 6,801 (31.5%) |
| Total | 22,581 (100.0%) | 21,624 (100.0%) |
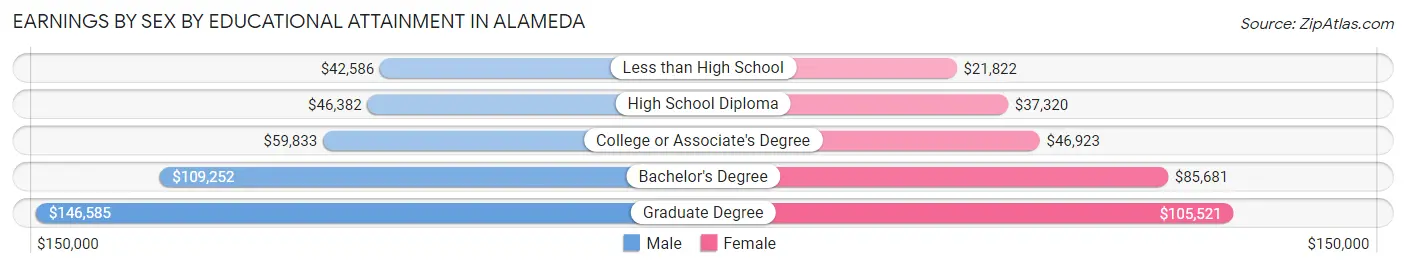
Earnings by Sex by Educational Attainment in Alameda
Average earnings in Alameda are $92,472 for men and $74,276 for women, a difference of 19.7%. Men with an educational attainment of graduate degree enjoy the highest average annual earnings of $146,585, while those with less than high school education earn the least with $42,586. Women with an educational attainment of graduate degree earn the most with the average annual earnings of $105,521, while those with less than high school education have the smallest earnings of $21,822.
| Educational Attainment | Male Income | Female Income |
| Less than High School | $42,586 | $21,822 |
| High School Diploma | $46,382 | $37,320 |
| College or Associate's Degree | $59,833 | $46,923 |
| Bachelor's Degree | $109,252 | $85,681 |
| Graduate Degree | $146,585 | $105,521 |
| Total | $92,472 | $74,276 |
Family Income in Alameda
Family Income Brackets in Alameda
According to the Alameda family income data, there are 7,586 families falling into the $200,000+ income range, which is the most common income bracket and makes up 39.8% of all families. Conversely, the $10,000 to $14,999 income bracket is the least frequent group with only 210 families (1.1%) belonging to this category.
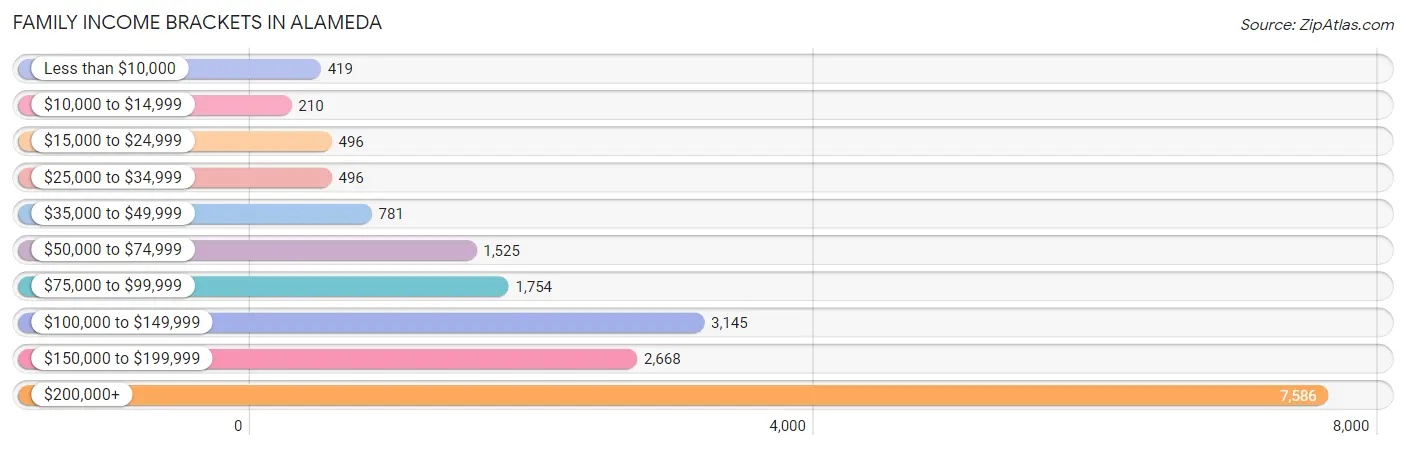
| Income Bracket | # Families | % Families |
| Less than $10,000 | 419 | 2.2% |
| $10,000 to $14,999 | 210 | 1.1% |
| $15,000 to $24,999 | 496 | 2.6% |
| $25,000 to $34,999 | 496 | 2.6% |
| $35,000 to $49,999 | 781 | 4.1% |
| $50,000 to $74,999 | 1,525 | 8.0% |
| $75,000 to $99,999 | 1,754 | 9.2% |
| $100,000 to $149,999 | 3,145 | 16.5% |
| $150,000 to $199,999 | 2,668 | 14.0% |
| $200,000+ | 7,586 | 39.8% |
Family Income by Famaliy Size in Alameda
4-person families (3,890 | 20.4%) account for the highest median family income in Alameda with $222,763 per family, while 2-person families (8,373 | 43.9%) have the highest median income of $65,524 per family member.
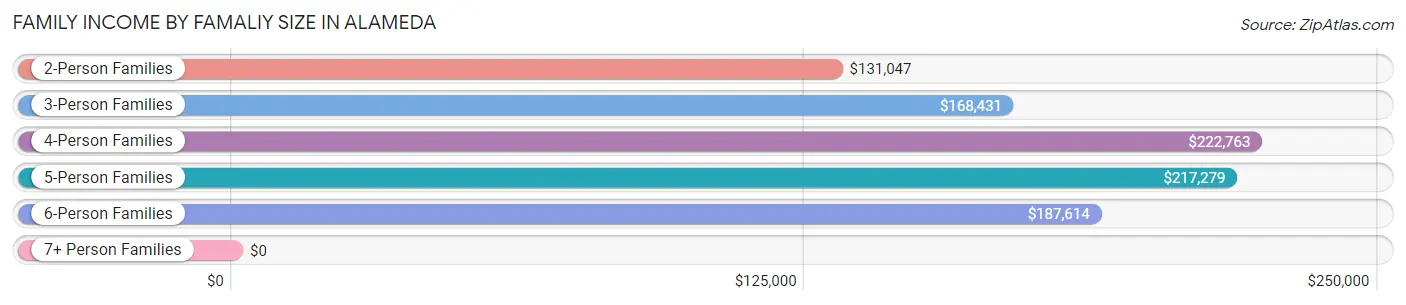
| Income Bracket | # Families | Median Income |
| 2-Person Families | 8,373 (43.9%) | $131,047 |
| 3-Person Families | 4,770 (25.0%) | $168,431 |
| 4-Person Families | 3,890 (20.4%) | $222,763 |
| 5-Person Families | 1,401 (7.3%) | $217,279 |
| 6-Person Families | 447 (2.4%) | $187,614 |
| 7+ Person Families | 179 (0.9%) | $0 |
| Total | 19,060 (100.0%) | $163,118 |
Family Income by Number of Earners in Alameda
The median family income in Alameda is $163,118, with families comprising 3+ earners (2,115) having the highest median family income of $237,361, while families with no earners (2,307) have the lowest median family income of $71,212, accounting for 11.1% and 12.1% of families, respectively.
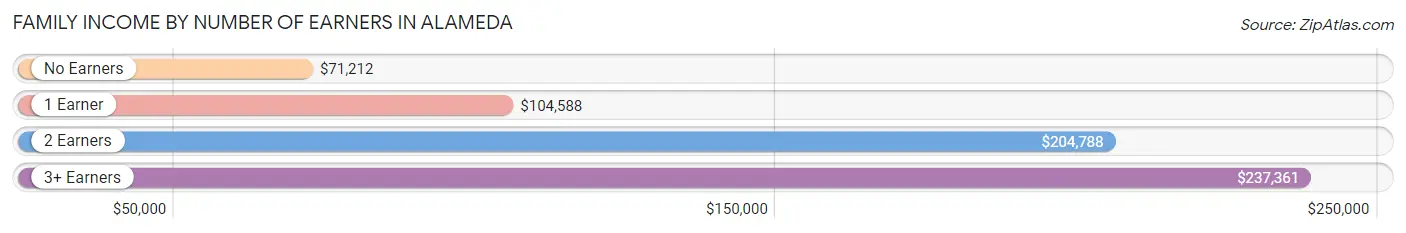
| Number of Earners | # Families | Median Income |
| No Earners | 2,307 (12.1%) | $71,212 |
| 1 Earner | 5,110 (26.8%) | $104,588 |
| 2 Earners | 9,528 (50.0%) | $204,788 |
| 3+ Earners | 2,115 (11.1%) | $237,361 |
| Total | 19,060 (100.0%) | $163,118 |
Household Income in Alameda
Household Income Brackets in Alameda
With 9,274 households falling in the category, the $200,000+ income range is the most frequent in Alameda, accounting for 31.1% of all households. In contrast, only 746 households (2.5%) fall into the $10,000 to $14,999 income bracket, making it the least populous group.
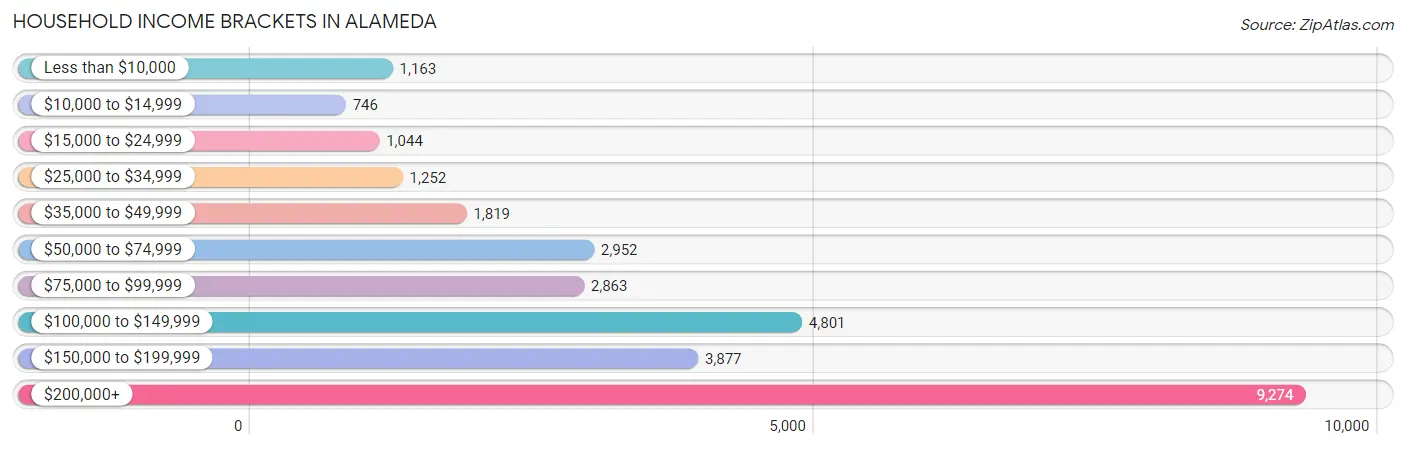
| Income Bracket | # Households | % Households |
| Less than $10,000 | 1,163 | 3.9% |
| $10,000 to $14,999 | 746 | 2.5% |
| $15,000 to $24,999 | 1,044 | 3.5% |
| $25,000 to $34,999 | 1,252 | 4.2% |
| $35,000 to $49,999 | 1,819 | 6.1% |
| $50,000 to $74,999 | 2,952 | 9.9% |
| $75,000 to $99,999 | 2,863 | 9.6% |
| $100,000 to $149,999 | 4,801 | 16.1% |
| $150,000 to $199,999 | 3,877 | 13.0% |
| $200,000+ | 9,274 | 31.1% |
Household Income by Householder Age in Alameda
The median household income in Alameda is $129,917, with the highest median household income of $159,238 found in the 45 to 64 years age bracket for the primary householder. A total of 11,399 households (38.2%) fall into this category. Meanwhile, the 15 to 24 years age bracket for the primary householder has the lowest median household income of $46,736, with 529 households (1.8%) in this group.
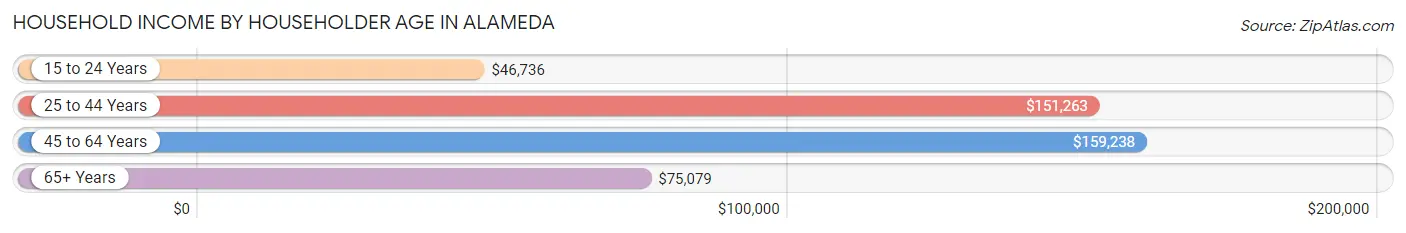
| Income Bracket | # Households | Median Income |
| 15 to 24 Years | 529 (1.8%) | $46,736 |
| 25 to 44 Years | 10,466 (35.1%) | $151,263 |
| 45 to 64 Years | 11,399 (38.2%) | $159,238 |
| 65+ Years | 7,426 (24.9%) | $75,079 |
| Total | 29,820 (100.0%) | $129,917 |
Poverty in Alameda
Income Below Poverty by Sex and Age in Alameda
With 7.1% poverty level for males and 7.2% for females among the residents of Alameda, 16 and 17 year old males and 18 to 24 year old females are the most vulnerable to poverty, with 195 males (19.6%) and 312 females (15.6%) in their respective age groups living below the poverty level.
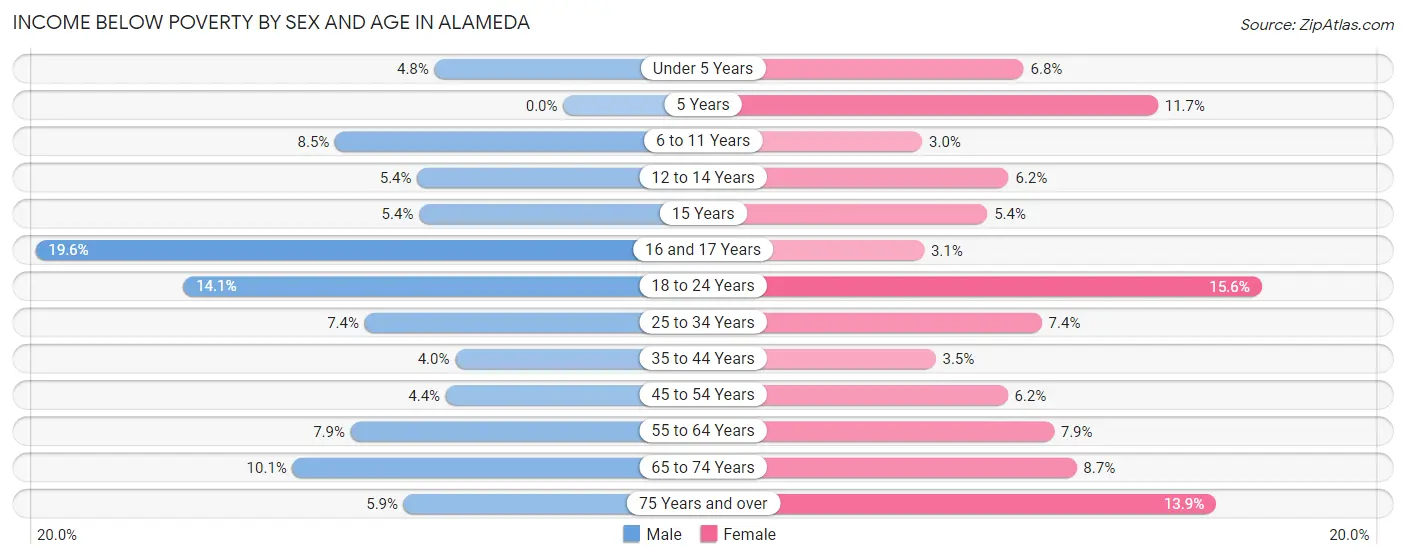
| Age Bracket | Male | Female |
| Under 5 Years | 126 (4.8%) | 144 (6.8%) |
| 5 Years | 0 (0.0%) | 46 (11.7%) |
| 6 to 11 Years | 239 (8.5%) | 87 (3.0%) |
| 12 to 14 Years | 62 (5.4%) | 74 (6.2%) |
| 15 Years | 20 (5.3%) | 21 (5.4%) |
| 16 and 17 Years | 195 (19.6%) | 21 (3.0%) |
| 18 to 24 Years | 328 (14.1%) | 312 (15.6%) |
| 25 to 34 Years | 393 (7.4%) | 389 (7.4%) |
| 35 to 44 Years | 242 (4.0%) | 224 (3.5%) |
| 45 to 54 Years | 224 (4.4%) | 348 (6.1%) |
| 55 to 64 Years | 354 (7.9%) | 374 (7.9%) |
| 65 to 74 Years | 353 (10.1%) | 391 (8.7%) |
| 75 Years and over | 113 (5.9%) | 373 (13.9%) |
| Total | 2,649 (7.1%) | 2,804 (7.2%) |
Income Above Poverty by Sex and Age in Alameda
According to the poverty statistics in Alameda, males aged 5 years and females aged 6 to 11 years are the age groups that are most secure financially, with 100.0% of males and 97.0% of females in these age groups living above the poverty line.
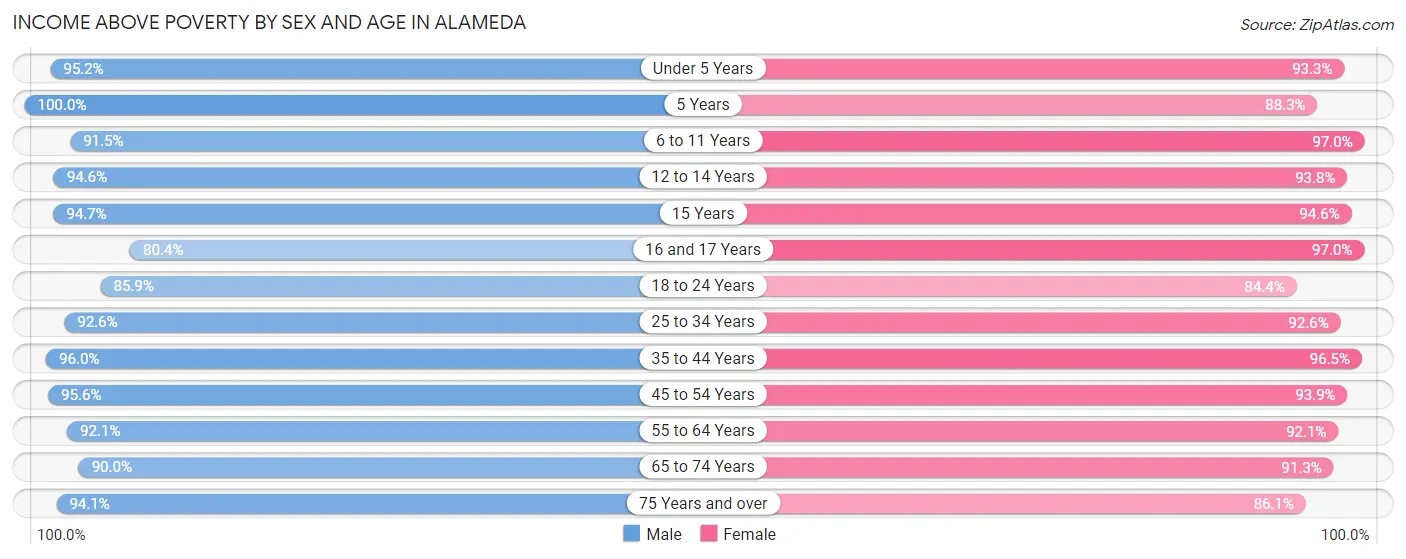
| Age Bracket | Male | Female |
| Under 5 Years | 2,509 (95.2%) | 1,989 (93.2%) |
| 5 Years | 675 (100.0%) | 346 (88.3%) |
| 6 to 11 Years | 2,584 (91.5%) | 2,834 (97.0%) |
| 12 to 14 Years | 1,081 (94.6%) | 1,121 (93.8%) |
| 15 Years | 354 (94.7%) | 368 (94.6%) |
| 16 and 17 Years | 800 (80.4%) | 667 (97.0%) |
| 18 to 24 Years | 1,997 (85.9%) | 1,690 (84.4%) |
| 25 to 34 Years | 4,939 (92.6%) | 4,855 (92.6%) |
| 35 to 44 Years | 5,796 (96.0%) | 6,217 (96.5%) |
| 45 to 54 Years | 4,918 (95.6%) | 5,310 (93.9%) |
| 55 to 64 Years | 4,130 (92.1%) | 4,381 (92.1%) |
| 65 to 74 Years | 3,161 (89.9%) | 4,098 (91.3%) |
| 75 Years and over | 1,797 (94.1%) | 2,313 (86.1%) |
| Total | 34,741 (92.9%) | 36,189 (92.8%) |
Income Below Poverty Among Married-Couple Families in Alameda
The poverty statistics for married-couple families in Alameda show that 3.2% or 480 of the total 14,828 families live below the poverty line. Families with 3 or 4 children have the highest poverty rate of 9.1%, comprising of 85 families. On the other hand, families with 1 or 2 children have the lowest poverty rate of 2.8%, which includes 169 families.
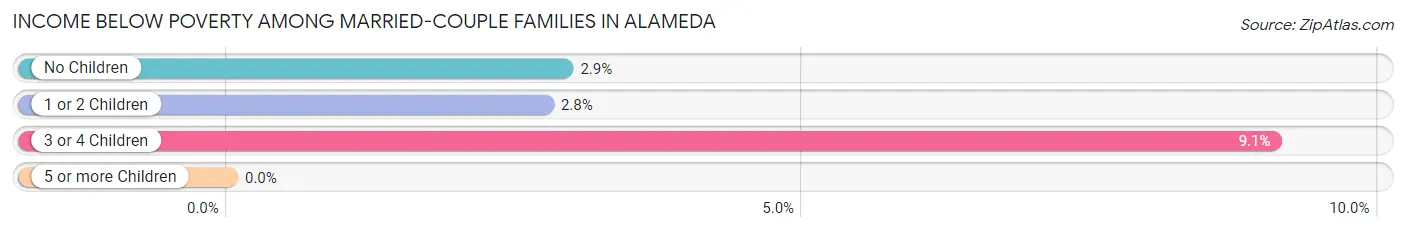
| Children | Above Poverty | Below Poverty |
| No Children | 7,523 (97.1%) | 226 (2.9%) |
| 1 or 2 Children | 5,975 (97.3%) | 169 (2.8%) |
| 3 or 4 Children | 850 (90.9%) | 85 (9.1%) |
| 5 or more Children | 0 (0.0%) | 0 (0.0%) |
| Total | 14,348 (96.8%) | 480 (3.2%) |
Income Below Poverty Among Single-Parent Households in Alameda
According to the poverty data in Alameda, 10.0% or 92 single-father households and 12.0% or 397 single-mother households are living below the poverty line. Among single-father households, those with no children have the highest poverty rate, with 57 households (11.2%) experiencing poverty. Likewise, among single-mother households, those with 1 or 2 children have the highest poverty rate, with 310 households (16.9%) falling below the poverty line.
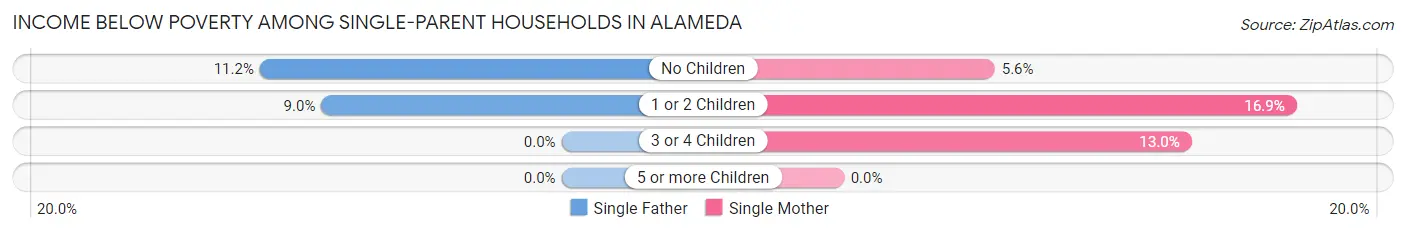
| Children | Single Father | Single Mother |
| No Children | 57 (11.2%) | 80 (5.6%) |
| 1 or 2 Children | 35 (8.9%) | 310 (16.9%) |
| 3 or 4 Children | 0 (0.0%) | 7 (13.0%) |
| 5 or more Children | 0 (0.0%) | 0 (0.0%) |
| Total | 92 (10.0%) | 397 (12.0%) |
Income Below Poverty Among Married-Couple vs Single-Parent Households in Alameda
The poverty data for Alameda shows that 480 of the married-couple family households (3.2%) and 489 of the single-parent households (11.6%) are living below the poverty level. Within the married-couple family households, those with 3 or 4 children have the highest poverty rate, with 85 households (9.1%) falling below the poverty line. Among the single-parent households, those with 1 or 2 children have the highest poverty rate, with 345 household (15.5%) living below poverty.
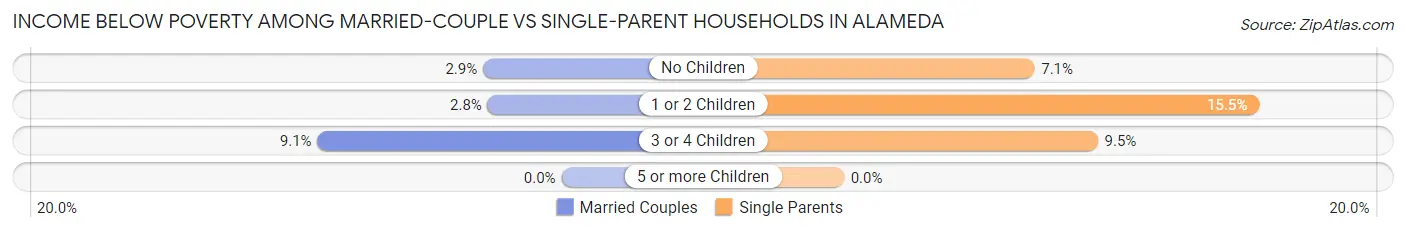
| Children | Married-Couple Families | Single-Parent Households |
| No Children | 226 (2.9%) | 137 (7.1%) |
| 1 or 2 Children | 169 (2.8%) | 345 (15.5%) |
| 3 or 4 Children | 85 (9.1%) | 7 (9.5%) |
| 5 or more Children | 0 (0.0%) | 0 (0.0%) |
| Total | 480 (3.2%) | 489 (11.6%) |
Race in Alameda
The most populous races in Alameda are White / Caucasian (34,762 | 44.8%), Asian (24,319 | 31.4%), and Hispanic or Latino (9,377 | 12.1%).
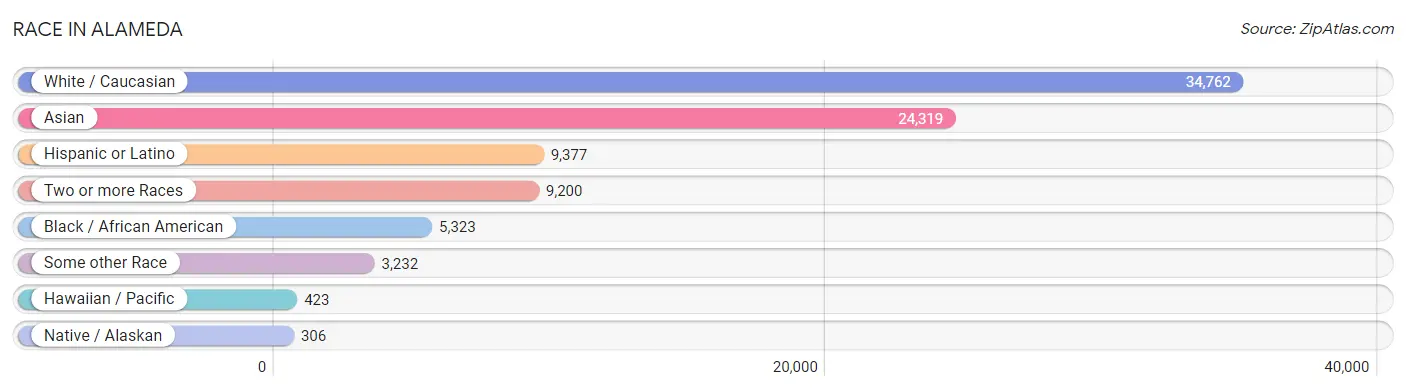
| Race | # Population | % Population |
| Asian | 24,319 | 31.4% |
| Black / African American | 5,323 | 6.9% |
| Hawaiian / Pacific | 423 | 0.5% |
| Hispanic or Latino | 9,377 | 12.1% |
| Native / Alaskan | 306 | 0.4% |
| White / Caucasian | 34,762 | 44.8% |
| Two or more Races | 9,200 | 11.9% |
| Some other Race | 3,232 | 4.2% |
| Total | 77,565 | 100.0% |
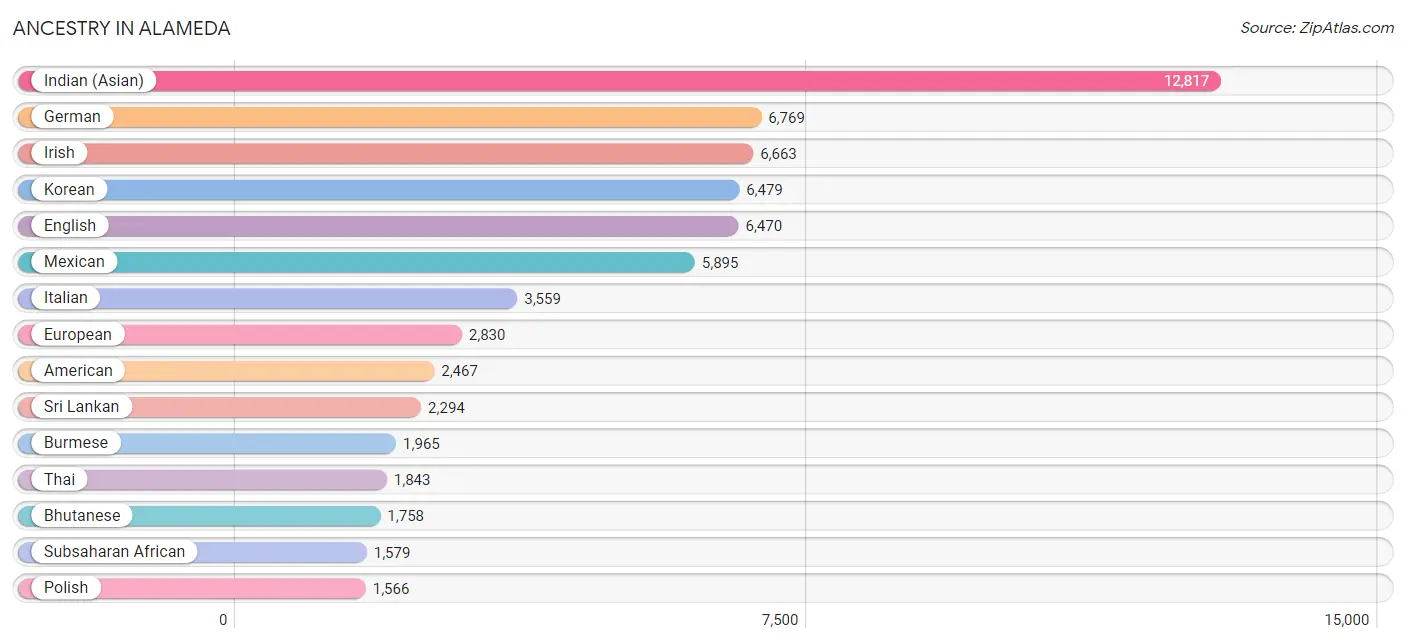
Ancestry in Alameda
The most populous ancestries reported in Alameda are Indian (Asian) (12,817 | 16.5%), German (6,769 | 8.7%), Irish (6,663 | 8.6%), Korean (6,479 | 8.4%), and English (6,470 | 8.3%), together accounting for 50.5% of all Alameda residents.
| Ancestry | # Population | % Population |
| Afghan | 749 | 1.0% |
| African | 544 | 0.7% |
| Alsatian | 9 | 0.0% |
| American | 2,467 | 3.2% |
| Apache | 115 | 0.2% |
| Arab | 585 | 0.7% |
| Argentinean | 223 | 0.3% |
| Armenian | 193 | 0.3% |
| Australian | 35 | 0.1% |
| Austrian | 75 | 0.1% |
| Bangladeshi | 27 | 0.0% |
| Barbadian | 22 | 0.0% |
| Basque | 20 | 0.0% |
| Belgian | 64 | 0.1% |
| Bhutanese | 1,758 | 2.3% |
| Brazilian | 266 | 0.3% |
| British | 1,024 | 1.3% |
| Bulgarian | 90 | 0.1% |
| Burmese | 1,965 | 2.5% |
| Cambodian | 316 | 0.4% |
| Canadian | 122 | 0.2% |
| Cape Verdean | 13 | 0.0% |
| Carpatho Rusyn | 17 | 0.0% |
| Celtic | 9 | 0.0% |
| Central American | 921 | 1.2% |
| Cherokee | 144 | 0.2% |
| Chickasaw | 11 | 0.0% |
| Chilean | 53 | 0.1% |
| Chippewa | 16 | 0.0% |
| Choctaw | 104 | 0.1% |
| Colombian | 202 | 0.3% |
| Costa Rican | 21 | 0.0% |
| Creek | 41 | 0.1% |
| Croatian | 106 | 0.1% |
| Crow | 4 | 0.0% |
| Cuban | 287 | 0.4% |
| Czech | 210 | 0.3% |
| Czechoslovakian | 71 | 0.1% |
| Danish | 261 | 0.3% |
| Dominican | 84 | 0.1% |
| Dutch | 856 | 1.1% |
| Eastern European | 368 | 0.5% |
| Ecuadorian | 8 | 0.0% |
| Egyptian | 80 | 0.1% |
| English | 6,470 | 8.3% |
| Estonian | 9 | 0.0% |
| Ethiopian | 496 | 0.6% |
| European | 2,830 | 3.6% |
| Filipino | 307 | 0.4% |
| Finnish | 73 | 0.1% |
| French | 1,257 | 1.6% |
| French Canadian | 149 | 0.2% |
| German | 6,769 | 8.7% |
| Ghanaian | 59 | 0.1% |
| Greek | 376 | 0.5% |
| Guamanian / Chamorro | 243 | 0.3% |
| Guatemalan | 340 | 0.4% |
| Haitian | 3 | 0.0% |
| Honduran | 12 | 0.0% |
| Hungarian | 273 | 0.4% |
| Icelander | 10 | 0.0% |
| Indian (Asian) | 12,817 | 16.5% |
| Indonesian | 140 | 0.2% |
| Iranian | 248 | 0.3% |
| Irish | 6,663 | 8.6% |
| Italian | 3,559 | 4.6% |
| Jamaican | 40 | 0.1% |
| Japanese | 232 | 0.3% |
| Jordanian | 18 | 0.0% |
| Kenyan | 11 | 0.0% |
| Korean | 6,479 | 8.4% |
| Laotian | 42 | 0.1% |
| Latvian | 40 | 0.1% |
| Lebanese | 82 | 0.1% |
| Lithuanian | 196 | 0.3% |
| Malaysian | 16 | 0.0% |
| Maltese | 14 | 0.0% |
| Mexican | 5,895 | 7.6% |
| Mexican American Indian | 26 | 0.0% |
| Mongolian | 16 | 0.0% |
| Moroccan | 20 | 0.0% |
| Native Hawaiian | 238 | 0.3% |
| Navajo | 138 | 0.2% |
| New Zealander | 7 | 0.0% |
| Nicaraguan | 182 | 0.2% |
| Nigerian | 47 | 0.1% |
| Northern European | 178 | 0.2% |
| Norwegian | 1,066 | 1.4% |
| Okinawan | 92 | 0.1% |
| Pakistani | 54 | 0.1% |
| Palestinian | 48 | 0.1% |
| Panamanian | 6 | 0.0% |
| Peruvian | 141 | 0.2% |
| Polish | 1,566 | 2.0% |
| Portuguese | 805 | 1.0% |
| Puerto Rican | 546 | 0.7% |
| Romanian | 51 | 0.1% |
| Russian | 775 | 1.0% |
| Salvadoran | 357 | 0.5% |
| Samoan | 167 | 0.2% |
| Scandinavian | 235 | 0.3% |
| Scotch-Irish | 503 | 0.6% |
| Scottish | 1,523 | 2.0% |
| Seminole | 42 | 0.1% |
| Serbian | 198 | 0.3% |
| Sioux | 86 | 0.1% |
| Slavic | 15 | 0.0% |
| Slovak | 59 | 0.1% |
| Slovene | 65 | 0.1% |
| South African | 25 | 0.0% |
| South American | 750 | 1.0% |
| South American Indian | 11 | 0.0% |
| Spaniard | 327 | 0.4% |
| Spanish | 186 | 0.2% |
| Spanish American | 9 | 0.0% |
| Spanish American Indian | 7 | 0.0% |
| Sri Lankan | 2,294 | 3.0% |
| Subsaharan African | 1,579 | 2.0% |
| Sudanese | 20 | 0.0% |
| Swedish | 937 | 1.2% |
| Swiss | 200 | 0.3% |
| Syrian | 42 | 0.1% |
| Thai | 1,843 | 2.4% |
| Tlingit-Haida | 12 | 0.0% |
| Trinidadian and Tobagonian | 18 | 0.0% |
| Turkish | 136 | 0.2% |
| Ukrainian | 163 | 0.2% |
| Uruguayan | 7 | 0.0% |
| Venezuelan | 116 | 0.2% |
| Vietnamese | 77 | 0.1% |
| Welsh | 392 | 0.5% |
| West Indian | 11 | 0.0% |
| Yaqui | 38 | 0.1% |
| Yugoslavian | 70 | 0.1% | View All 134 Rows |
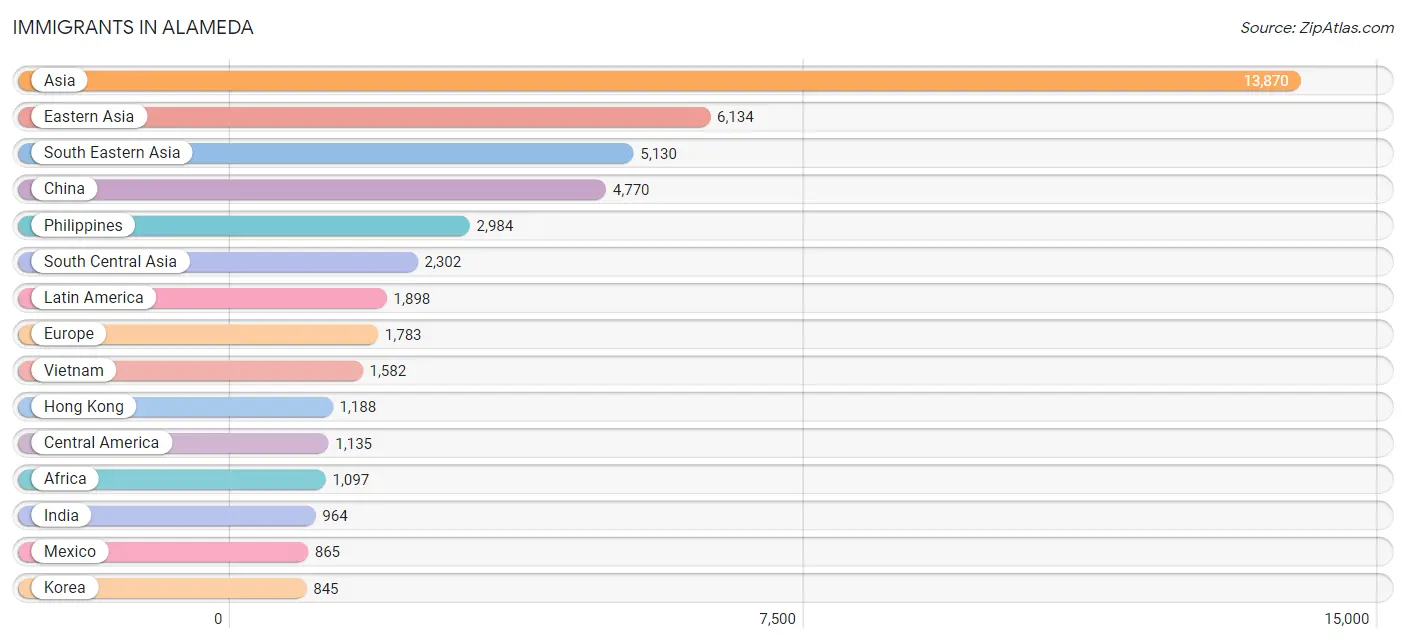
Immigrants in Alameda
The most numerous immigrant groups reported in Alameda came from Asia (13,870 | 17.9%), Eastern Asia (6,134 | 7.9%), South Eastern Asia (5,130 | 6.6%), China (4,770 | 6.1%), and Philippines (2,984 | 3.8%), together accounting for 42.4% of all Alameda residents.
| Immigration Origin | # Population | % Population |
| Afghanistan | 598 | 0.8% |
| Africa | 1,097 | 1.4% |
| Argentina | 173 | 0.2% |
| Armenia | 14 | 0.0% |
| Asia | 13,870 | 17.9% |
| Australia | 53 | 0.1% |
| Bangladesh | 93 | 0.1% |
| Belgium | 75 | 0.1% |
| Bosnia and Herzegovina | 51 | 0.1% |
| Brazil | 161 | 0.2% |
| Bulgaria | 31 | 0.0% |
| Cambodia | 73 | 0.1% |
| Canada | 318 | 0.4% |
| Caribbean | 63 | 0.1% |
| Central America | 1,135 | 1.5% |
| Chile | 31 | 0.0% |
| China | 4,770 | 6.1% |
| Colombia | 132 | 0.2% |
| Costa Rica | 3 | 0.0% |
| Croatia | 26 | 0.0% |
| Cuba | 17 | 0.0% |
| Czechoslovakia | 7 | 0.0% |
| Denmark | 47 | 0.1% |
| Dominica | 5 | 0.0% |
| Eastern Africa | 336 | 0.4% |
| Eastern Asia | 6,134 | 7.9% |
| Eastern Europe | 495 | 0.6% |
| Ecuador | 18 | 0.0% |
| Egypt | 140 | 0.2% |
| El Salvador | 186 | 0.2% |
| England | 216 | 0.3% |
| Eritrea | 147 | 0.2% |
| Ethiopia | 166 | 0.2% |
| Europe | 1,783 | 2.3% |
| Fiji | 78 | 0.1% |
| France | 104 | 0.1% |
| Germany | 222 | 0.3% |
| Ghana | 23 | 0.0% |
| Greece | 13 | 0.0% |
| Guatemala | 38 | 0.1% |
| Hong Kong | 1,188 | 1.5% |
| India | 964 | 1.2% |
| Indonesia | 177 | 0.2% |
| Iran | 196 | 0.3% |
| Iraq | 15 | 0.0% |
| Ireland | 85 | 0.1% |
| Israel | 11 | 0.0% |
| Italy | 43 | 0.1% |
| Japan | 276 | 0.4% |
| Jordan | 49 | 0.1% |
| Kazakhstan | 8 | 0.0% |
| Kenya | 11 | 0.0% |
| Korea | 845 | 1.1% |
| Laos | 27 | 0.0% |
| Latin America | 1,898 | 2.5% |
| Lebanon | 24 | 0.0% |
| Lithuania | 30 | 0.0% |
| Malaysia | 148 | 0.2% |
| Mexico | 865 | 1.1% |
| Middle Africa | 11 | 0.0% |
| Morocco | 32 | 0.0% |
| Nepal | 277 | 0.4% |
| Netherlands | 13 | 0.0% |
| Nicaragua | 43 | 0.1% |
| Nigeria | 22 | 0.0% |
| Northern Africa | 307 | 0.4% |
| Northern Europe | 782 | 1.0% |
| Norway | 44 | 0.1% |
| Oceania | 167 | 0.2% |
| Pakistan | 148 | 0.2% |
| Peru | 108 | 0.1% |
| Philippines | 2,984 | 3.8% |
| Poland | 71 | 0.1% |
| Russia | 49 | 0.1% |
| Saudi Arabia | 43 | 0.1% |
| Scotland | 10 | 0.0% |
| Senegal | 107 | 0.1% |
| Serbia | 77 | 0.1% |
| Singapore | 61 | 0.1% |
| South Africa | 82 | 0.1% |
| South America | 700 | 0.9% |
| South Central Asia | 2,302 | 3.0% |
| South Eastern Asia | 5,130 | 6.6% |
| Southern Europe | 92 | 0.1% |
| Spain | 36 | 0.1% |
| St. Vincent and the Grenadines | 11 | 0.0% |
| Sudan | 61 | 0.1% |
| Sweden | 118 | 0.2% |
| Taiwan | 234 | 0.3% |
| Thailand | 29 | 0.0% |
| Trinidad and Tobago | 30 | 0.0% |
| Turkey | 61 | 0.1% |
| Ukraine | 76 | 0.1% |
| Venezuela | 77 | 0.1% |
| Vietnam | 1,582 | 2.0% |
| Western Africa | 188 | 0.2% |
| Western Asia | 286 | 0.4% |
| Western Europe | 414 | 0.5% |
| Yemen | 59 | 0.1% | View All 99 Rows |
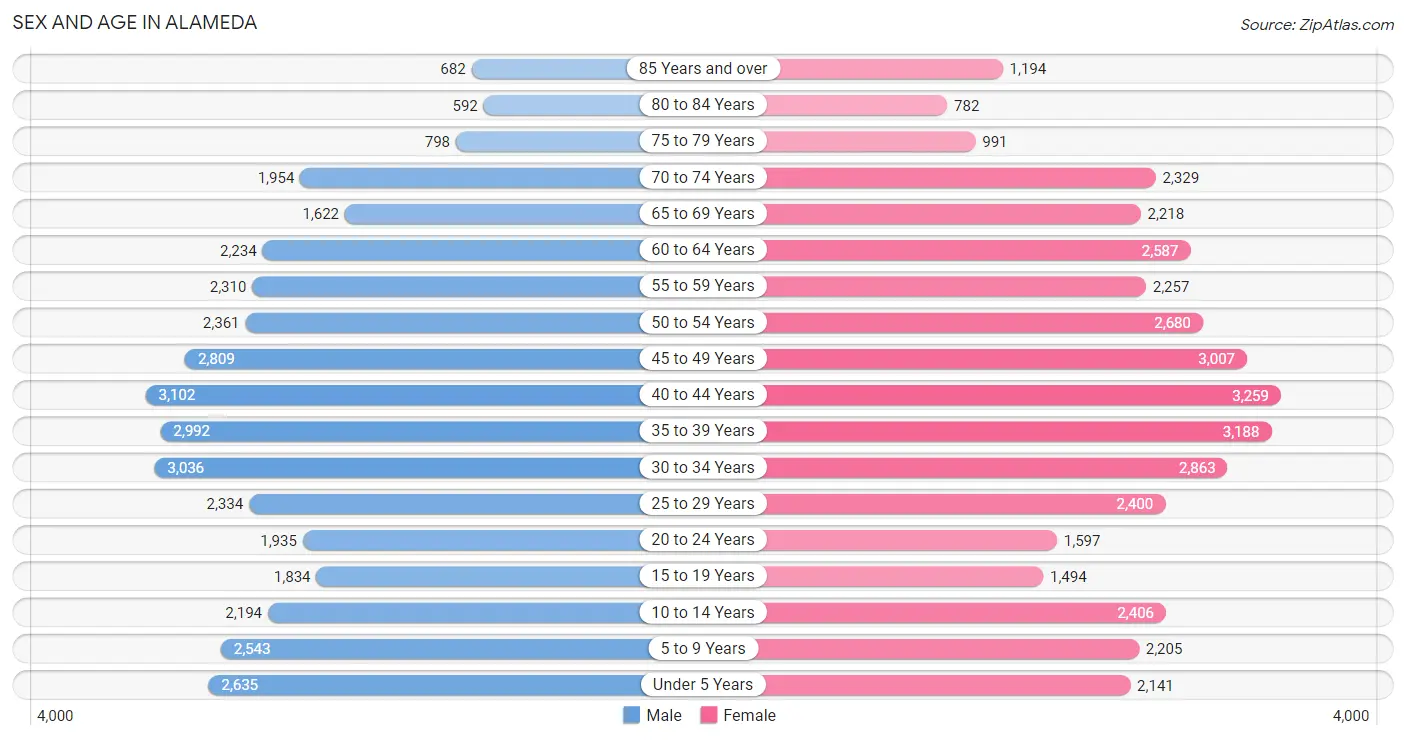
Sex and Age in Alameda
Sex and Age in Alameda
The most populous age groups in Alameda are 40 to 44 Years (3,102 | 8.2%) for men and 40 to 44 Years (3,259 | 8.2%) for women.
| Age Bracket | Male | Female |
| Under 5 Years | 2,635 (6.9%) | 2,141 (5.4%) |
| 5 to 9 Years | 2,543 (6.7%) | 2,205 (5.6%) |
| 10 to 14 Years | 2,194 (5.8%) | 2,406 (6.1%) |
| 15 to 19 Years | 1,834 (4.8%) | 1,494 (3.8%) |
| 20 to 24 Years | 1,935 (5.1%) | 1,597 (4.0%) |
| 25 to 29 Years | 2,334 (6.1%) | 2,400 (6.1%) |
| 30 to 34 Years | 3,036 (8.0%) | 2,863 (7.2%) |
| 35 to 39 Years | 2,992 (7.9%) | 3,188 (8.1%) |
| 40 to 44 Years | 3,102 (8.2%) | 3,259 (8.2%) |
| 45 to 49 Years | 2,809 (7.4%) | 3,007 (7.6%) |
| 50 to 54 Years | 2,361 (6.2%) | 2,680 (6.8%) |
| 55 to 59 Years | 2,310 (6.1%) | 2,257 (5.7%) |
| 60 to 64 Years | 2,234 (5.9%) | 2,587 (6.5%) |
| 65 to 69 Years | 1,622 (4.3%) | 2,218 (5.6%) |
| 70 to 74 Years | 1,954 (5.1%) | 2,329 (5.9%) |
| 75 to 79 Years | 798 (2.1%) | 991 (2.5%) |
| 80 to 84 Years | 592 (1.6%) | 782 (2.0%) |
| 85 Years and over | 682 (1.8%) | 1,194 (3.0%) |
| Total | 37,967 (100.0%) | 39,598 (100.0%) |
Families and Households in Alameda
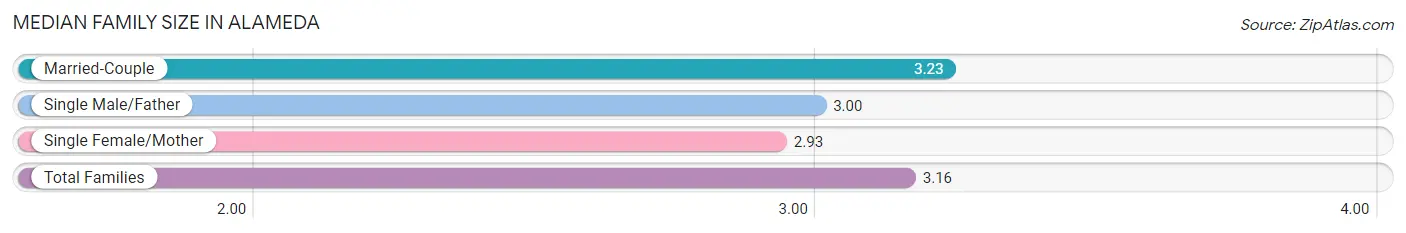
Median Family Size in Alameda
The median family size in Alameda is 3.16 persons per family, with married-couple families (14,828 | 77.8%) accounting for the largest median family size of 3.23 persons per family. On the other hand, single female/mother families (3,314 | 17.4%) represent the smallest median family size with 2.93 persons per family.
| Family Type | # Families | Family Size |
| Married-Couple | 14,828 (77.8%) | 3.23 |
| Single Male/Father | 918 (4.8%) | 3.00 |
| Single Female/Mother | 3,314 (17.4%) | 2.93 |
| Total Families | 19,060 (100.0%) | 3.16 |
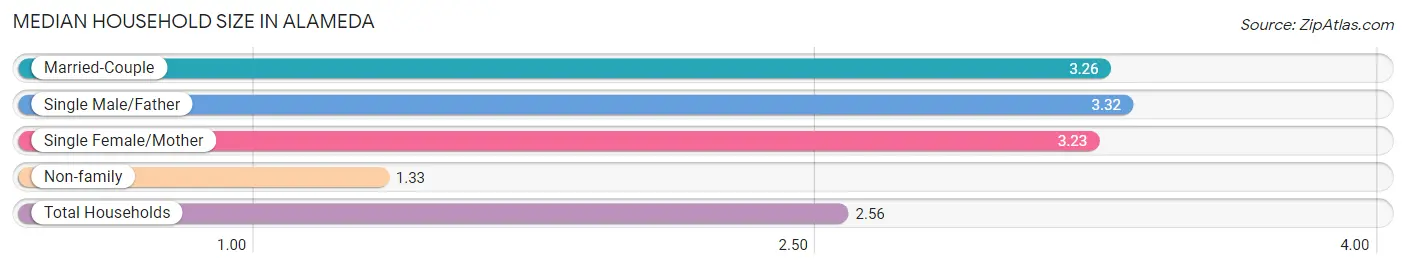
Median Household Size in Alameda
The median household size in Alameda is 2.56 persons per household, with single male/father households (918 | 3.1%) accounting for the largest median household size of 3.32 persons per household. non-family households (10,760 | 36.1%) represent the smallest median household size with 1.33 persons per household.
| Household Type | # Households | Household Size |
| Married-Couple | 14,828 (49.7%) | 3.26 |
| Single Male/Father | 918 (3.1%) | 3.32 |
| Single Female/Mother | 3,314 (11.1%) | 3.23 |
| Non-family | 10,760 (36.1%) | 1.33 |
| Total Households | 29,820 (100.0%) | 2.56 |
Household Size by Marriage Status in Alameda
Out of a total of 29,820 households in Alameda, 19,060 (63.9%) are family households, while 10,760 (36.1%) are nonfamily households. The most numerous type of family households are 2-person households, comprising 7,764, and the most common type of nonfamily households are 1-person households, comprising 8,376.
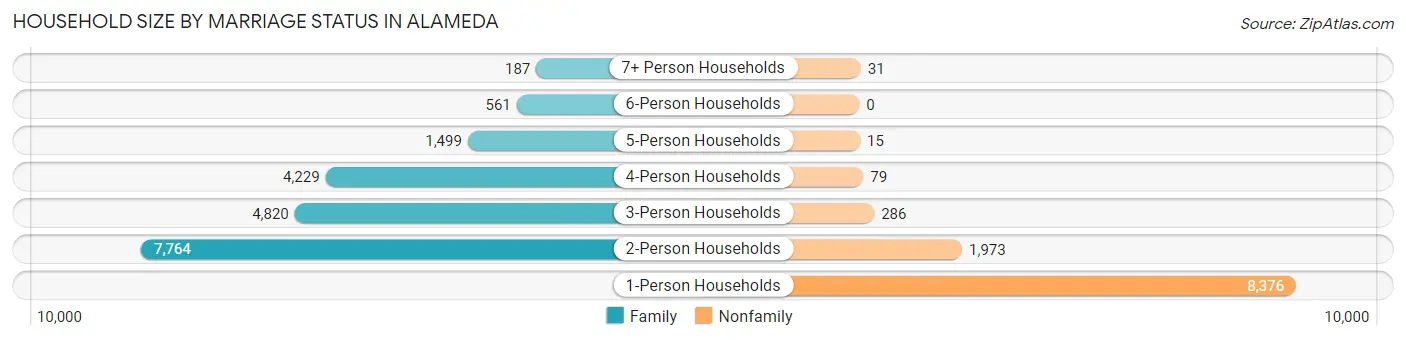
| Household Size | Family Households | Nonfamily Households |
| 1-Person Households | - | 8,376 (28.1%) |
| 2-Person Households | 7,764 (26.0%) | 1,973 (6.6%) |
| 3-Person Households | 4,820 (16.2%) | 286 (1.0%) |
| 4-Person Households | 4,229 (14.2%) | 79 (0.3%) |
| 5-Person Households | 1,499 (5.0%) | 15 (0.1%) |
| 6-Person Households | 561 (1.9%) | 0 (0.0%) |
| 7+ Person Households | 187 (0.6%) | 31 (0.1%) |
| Total | 19,060 (63.9%) | 10,760 (36.1%) |
Female Fertility in Alameda
Fertility by Age in Alameda
Average fertility rate in Alameda is 59.0 births per 1,000 women. Women in the age bracket of 20 to 34 years have the highest fertility rate with 74.0 births per 1,000 women. Women in the age bracket of 35 to 50 years acount for 53.6% of all women with births.
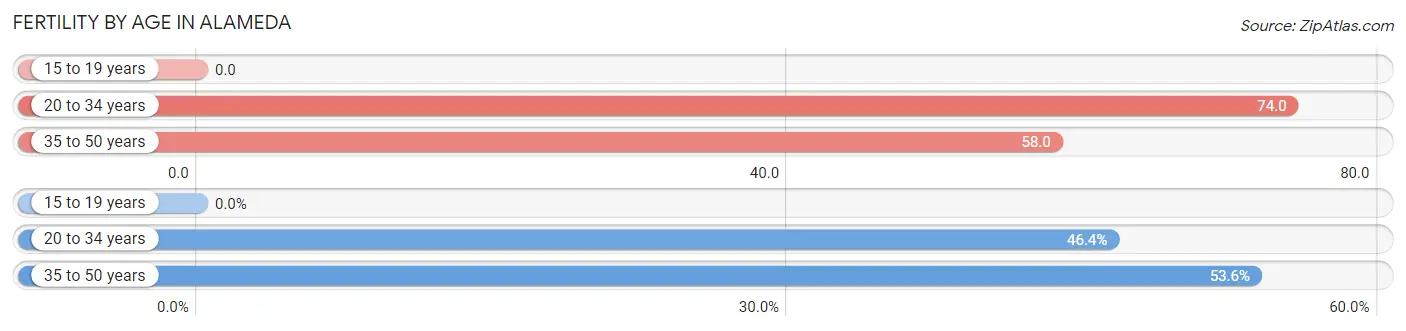
| Age Bracket | Women with Births | Births / 1,000 Women |
| 15 to 19 years | 0 (0.0%) | 0.0 |
| 20 to 34 years | 505 (46.4%) | 74.0 |
| 35 to 50 years | 584 (53.6%) | 58.0 |
| Total | 1,089 (100.0%) | 59.0 |
Fertility by Age by Marriage Status in Alameda
74.0% of women with births (1,089) in Alameda are married. The highest percentage of unmarried women with births falls into 20 to 34 years age bracket with 29.1% of them unmarried at the time of birth, while the lowest percentage of unmarried women with births belong to 35 to 50 years age bracket with 23.3% of them unmarried.

| Age Bracket | Married | Unmarried |
| 15 to 19 years | 0 (0.0%) | 0 (0.0%) |
| 20 to 34 years | 358 (70.9%) | 147 (29.1%) |
| 35 to 50 years | 448 (76.7%) | 136 (23.3%) |
| Total | 806 (74.0%) | 283 (26.0%) |
Fertility by Education in Alameda
Average fertility rate in Alameda is 59.0 births per 1,000 women. Women with the education attainment of college or associate's degree have the highest fertility rate of 91.0 births per 1,000 women, while women with the education attainment of high school diploma have the lowest fertility at 17.0 births per 1,000 women. Women with the education attainment of bachelor's degree represent 33.1% of all women with births.
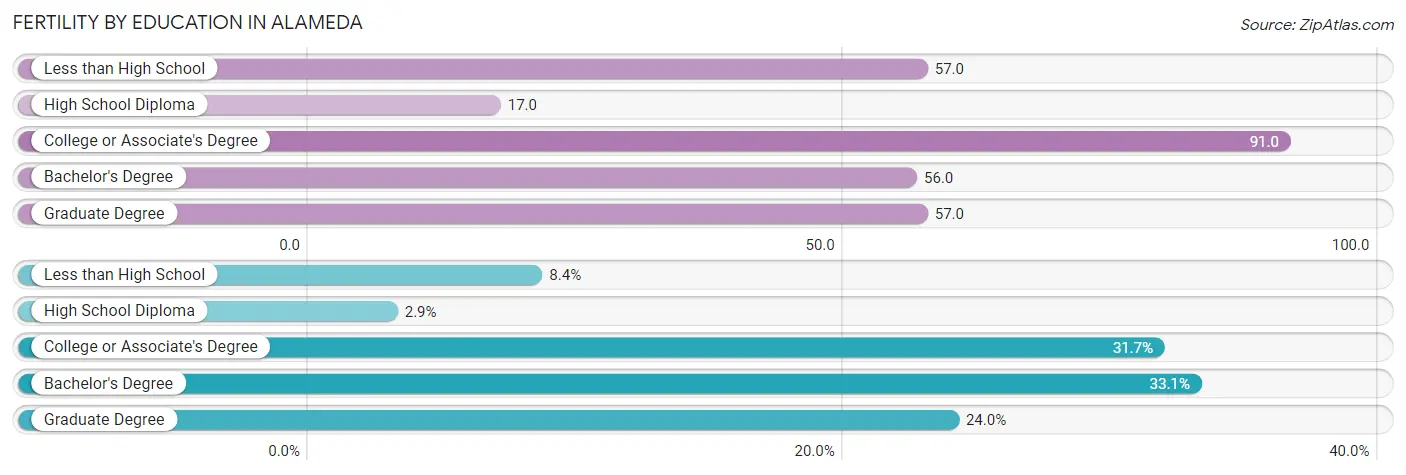
| Educational Attainment | Women with Births | Births / 1,000 Women |
| Less than High School | 91 (8.4%) | 57.0 |
| High School Diploma | 32 (2.9%) | 17.0 |
| College or Associate's Degree | 345 (31.7%) | 91.0 |
| Bachelor's Degree | 360 (33.1%) | 56.0 |
| Graduate Degree | 261 (24.0%) | 57.0 |
| Total | 1,089 (100.0%) | 59.0 |
Fertility by Education by Marriage Status in Alameda
26.0% of women with births in Alameda are unmarried. Women with the educational attainment of bachelor's degree are most likely to be married with 98.1% of them married at childbirth, while women with the educational attainment of high school diploma are least likely to be married with 68.8% of them unmarried at childbirth.
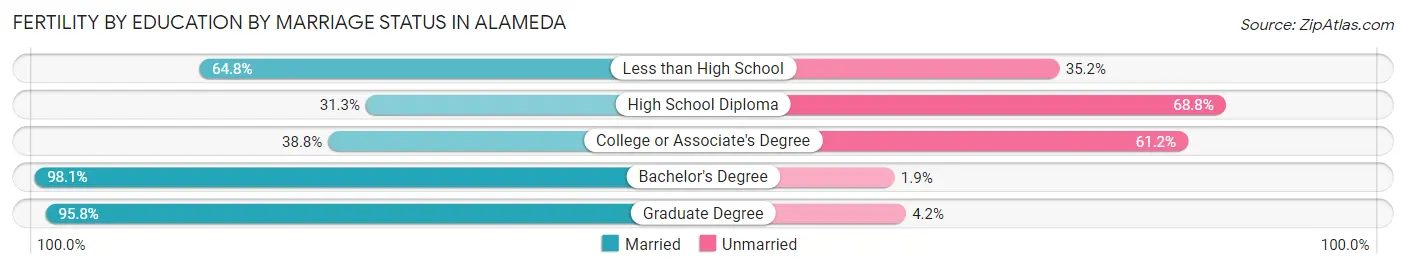
| Educational Attainment | Married | Unmarried |
| Less than High School | 59 (64.8%) | 32 (35.2%) |
| High School Diploma | 10 (31.2%) | 22 (68.8%) |
| College or Associate's Degree | 134 (38.8%) | 211 (61.2%) |
| Bachelor's Degree | 353 (98.1%) | 7 (1.9%) |
| Graduate Degree | 250 (95.8%) | 11 (4.2%) |
| Total | 806 (74.0%) | 283 (26.0%) |
Employment Characteristics in Alameda
Employment by Class of Employer in Alameda
Among the 39,671 employed individuals in Alameda, private company employees (25,017 | 63.1%), not-for-profit organizations (4,355 | 11.0%), and local government employees (3,034 | 7.6%) make up the most common classes of employment.
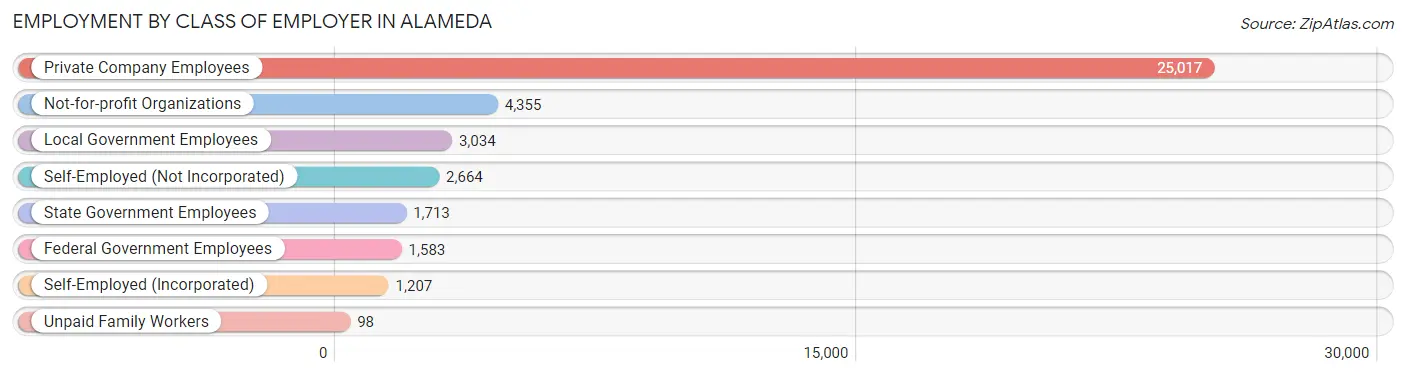
| Employer Class | # Employees | % Employees |
| Private Company Employees | 25,017 | 63.1% |
| Self-Employed (Incorporated) | 1,207 | 3.0% |
| Self-Employed (Not Incorporated) | 2,664 | 6.7% |
| Not-for-profit Organizations | 4,355 | 11.0% |
| Local Government Employees | 3,034 | 7.6% |
| State Government Employees | 1,713 | 4.3% |
| Federal Government Employees | 1,583 | 4.0% |
| Unpaid Family Workers | 98 | 0.3% |
| Total | 39,671 | 100.0% |
Employment Status by Age in Alameda
According to the labor force statistics for Alameda, out of the total population over 16 years of age (62,678), 68.2% or 42,746 individuals are in the labor force, with 5.1% or 2,180 of them unemployed. The age group with the highest labor force participation rate is 35 to 44 years, with 90.3% or 11,325 individuals in the labor force. Within the labor force, the 16 to 19 years age range has the highest percentage of unemployed individuals, with 24.5% or 190 of them being unemployed.
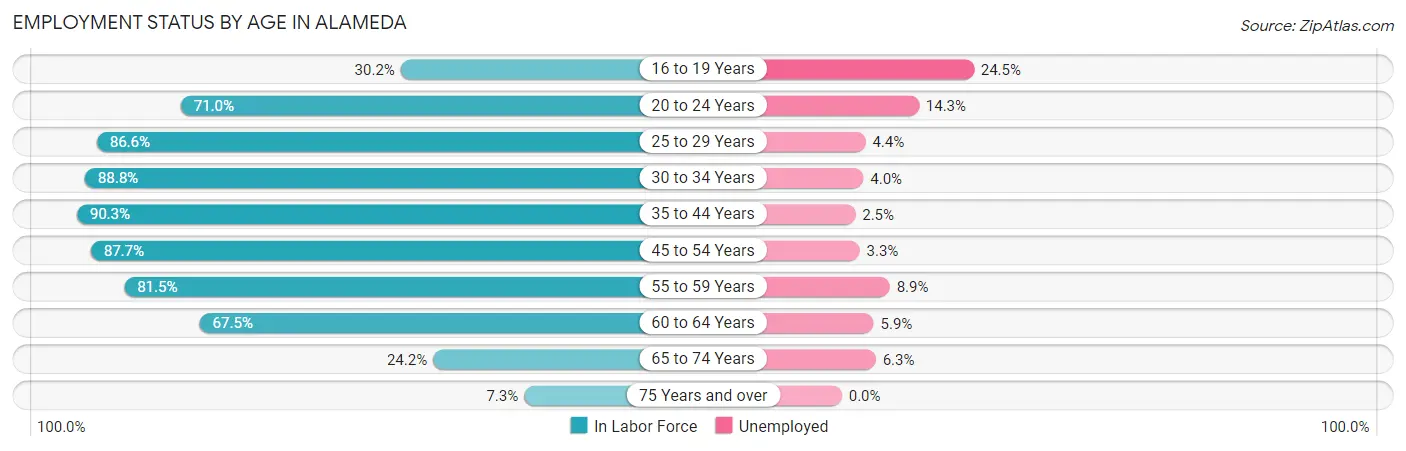
| Age Bracket | In Labor Force | Unemployed |
| 16 to 19 Years | 775 (30.2%) | 190 (24.5%) |
| 20 to 24 Years | 2,508 (71.0%) | 359 (14.3%) |
| 25 to 29 Years | 4,100 (86.6%) | 180 (4.4%) |
| 30 to 34 Years | 5,238 (88.8%) | 210 (4.0%) |
| 35 to 44 Years | 11,325 (90.3%) | 283 (2.5%) |
| 45 to 54 Years | 9,522 (87.7%) | 314 (3.3%) |
| 55 to 59 Years | 3,722 (81.5%) | 331 (8.9%) |
| 60 to 64 Years | 3,254 (67.5%) | 192 (5.9%) |
| 65 to 74 Years | 1,966 (24.2%) | 124 (6.3%) |
| 75 Years and over | 368 (7.3%) | 0 (0.0%) |
| Total | 42,746 (68.2%) | 2,180 (5.1%) |
Employment Status by Educational Attainment in Alameda
According to labor force statistics for Alameda, 85.6% of individuals (37,167) out of the total population between 25 and 64 years of age (43,419) are in the labor force, with 4.1% or 1,524 of them being unemployed. The group with the highest labor force participation rate are those with the educational attainment of bachelor's degree or higher, with 89.7% or 25,106 individuals in the labor force. Within the labor force, individuals with high school diploma education have the highest percentage of unemployment, with 6.2% or 200 of them being unemployed.
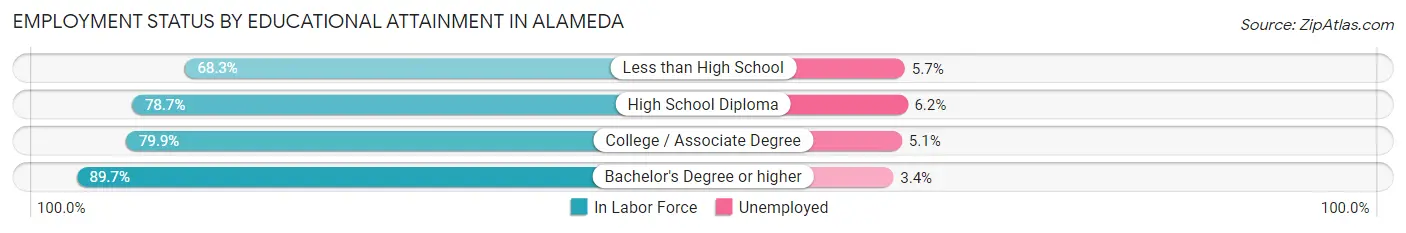
| Educational Attainment | In Labor Force | Unemployed |
| Less than High School | 1,429 (68.3%) | 119 (5.7%) |
| High School Diploma | 3,224 (78.7%) | 254 (6.2%) |
| College / Associate Degree | 7,384 (79.9%) | 471 (5.1%) |
| Bachelor's Degree or higher | 25,106 (89.7%) | 952 (3.4%) |
| Total | 37,167 (85.6%) | 1,780 (4.1%) |
Employment Occupations by Sex in Alameda
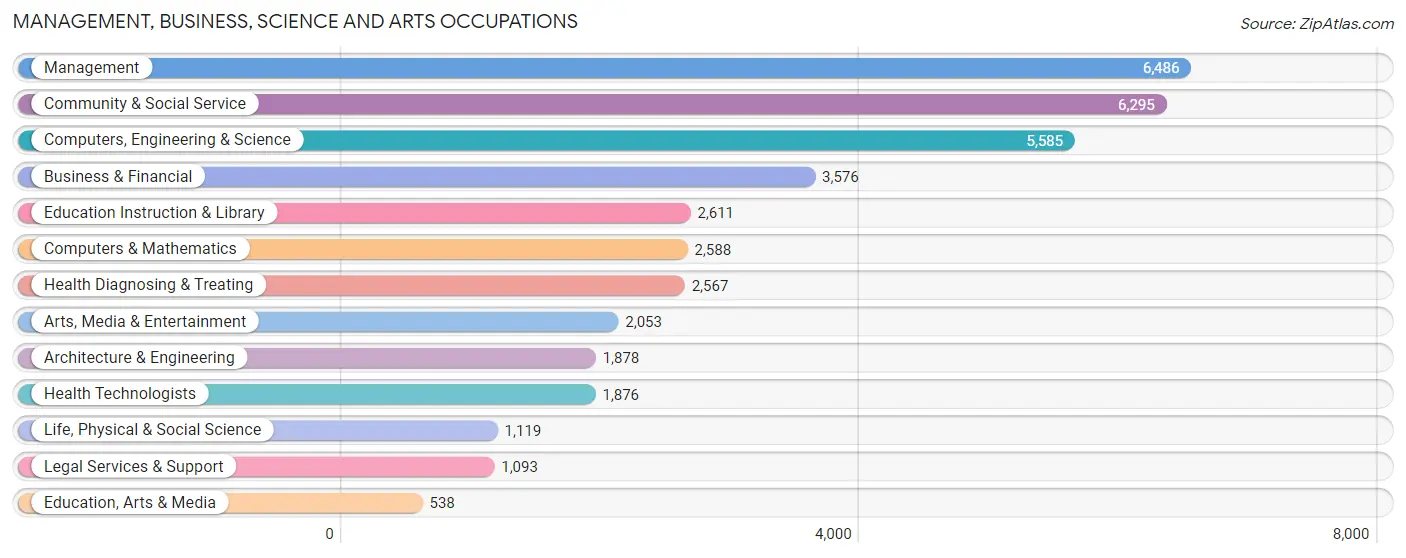
Management, Business, Science and Arts Occupations
The most common Management, Business, Science and Arts occupations in Alameda are Management (6,486 | 16.2%), Community & Social Service (6,295 | 15.7%), Computers, Engineering & Science (5,585 | 13.9%), Business & Financial (3,576 | 8.9%), and Education Instruction & Library (2,611 | 6.5%).
Management, Business, Science and Arts Occupations by Sex
Within the Management, Business, Science and Arts occupations in Alameda, the most male-oriented occupations are Computers & Mathematics (72.0%), Architecture & Engineering (69.8%), and Computers, Engineering & Science (65.7%), while the most female-oriented occupations are Education, Arts & Media (80.9%), Health Technologists (74.1%), and Health Diagnosing & Treating (68.1%).
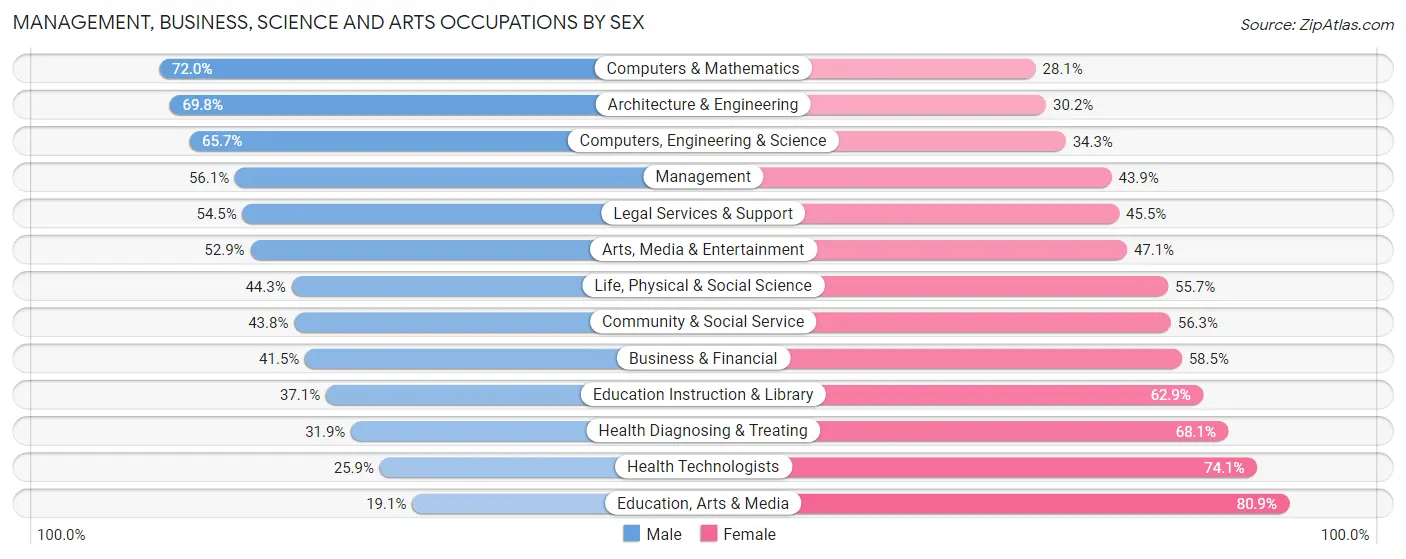
| Occupation | Male | Female |
| Management | 3,639 (56.1%) | 2,847 (43.9%) |
| Business & Financial | 1,483 (41.5%) | 2,093 (58.5%) |
| Computers, Engineering & Science | 3,668 (65.7%) | 1,917 (34.3%) |
| Computers & Mathematics | 1,862 (72.0%) | 726 (28.1%) |
| Architecture & Engineering | 1,310 (69.8%) | 568 (30.2%) |
| Life, Physical & Social Science | 496 (44.3%) | 623 (55.7%) |
| Community & Social Service | 2,754 (43.8%) | 3,541 (56.2%) |
| Education, Arts & Media | 103 (19.1%) | 435 (80.9%) |
| Legal Services & Support | 596 (54.5%) | 497 (45.5%) |
| Education Instruction & Library | 969 (37.1%) | 1,642 (62.9%) |
| Arts, Media & Entertainment | 1,086 (52.9%) | 967 (47.1%) |
| Health Diagnosing & Treating | 818 (31.9%) | 1,749 (68.1%) |
| Health Technologists | 486 (25.9%) | 1,390 (74.1%) |
| Total (Category) | 12,362 (50.4%) | 12,147 (49.6%) |
| Total (Overall) | 20,394 (50.8%) | 19,715 (49.1%) |
Services Occupations
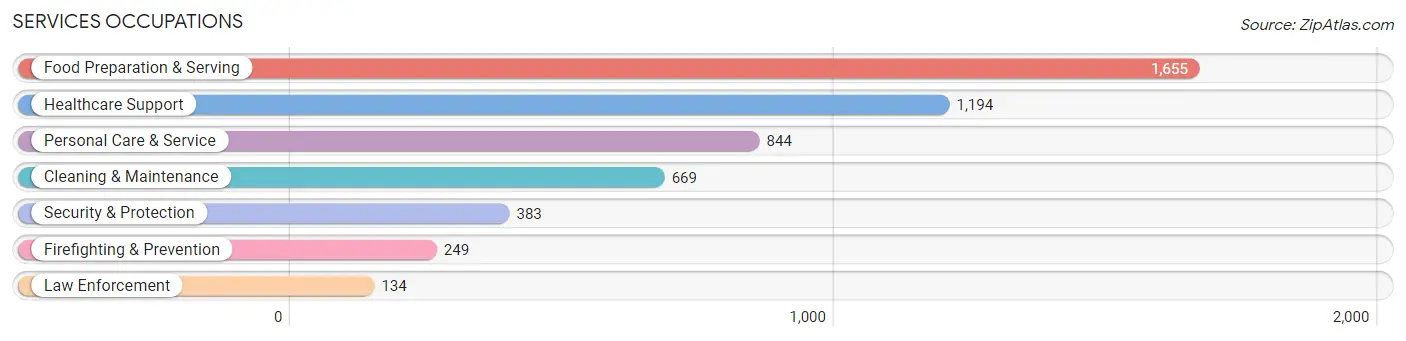
The most common Services occupations in Alameda are Food Preparation & Serving (1,655 | 4.1%), Healthcare Support (1,194 | 3.0%), Personal Care & Service (844 | 2.1%), Cleaning & Maintenance (669 | 1.7%), and Security & Protection (383 | 0.9%).
Services Occupations by Sex
Within the Services occupations in Alameda, the most male-oriented occupations are Firefighting & Prevention (86.8%), Security & Protection (82.8%), and Law Enforcement (75.4%), while the most female-oriented occupations are Healthcare Support (86.5%), Personal Care & Service (75.1%), and Food Preparation & Serving (49.1%).
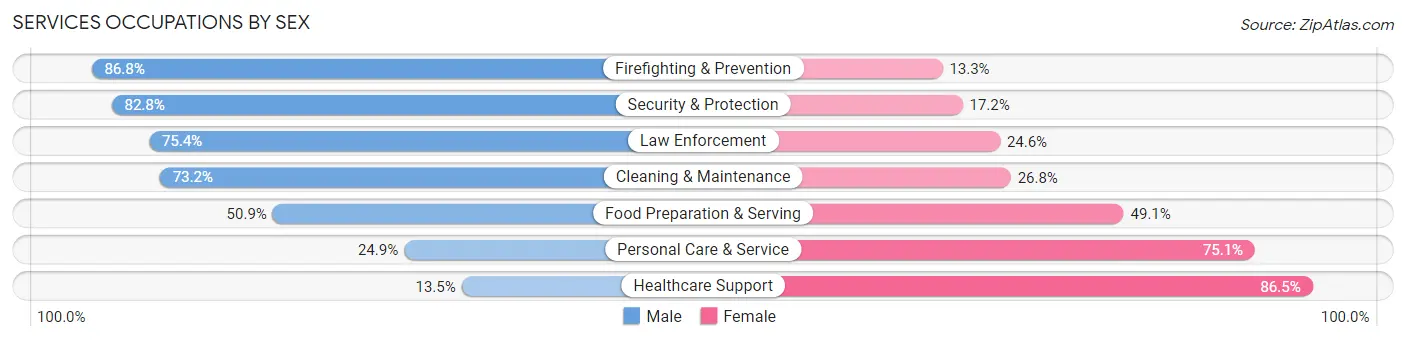
| Occupation | Male | Female |
| Healthcare Support | 161 (13.5%) | 1,033 (86.5%) |
| Security & Protection | 317 (82.8%) | 66 (17.2%) |
| Firefighting & Prevention | 216 (86.8%) | 33 (13.3%) |
| Law Enforcement | 101 (75.4%) | 33 (24.6%) |
| Food Preparation & Serving | 842 (50.9%) | 813 (49.1%) |
| Cleaning & Maintenance | 490 (73.2%) | 179 (26.8%) |
| Personal Care & Service | 210 (24.9%) | 634 (75.1%) |
| Total (Category) | 2,020 (42.6%) | 2,725 (57.4%) |
| Total (Overall) | 20,394 (50.8%) | 19,715 (49.1%) |
Sales and Office Occupations
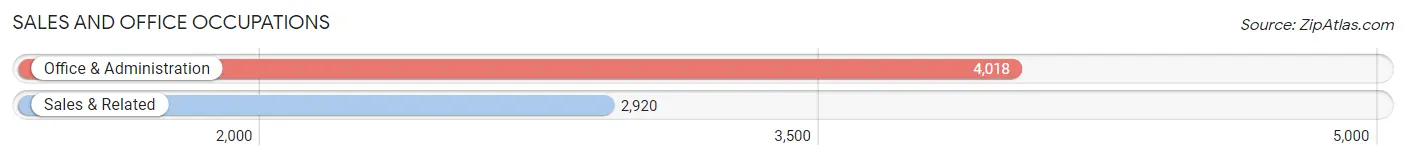
The most common Sales and Office occupations in Alameda are Office & Administration (4,018 | 10.0%), and Sales & Related (2,920 | 7.3%).
Sales and Office Occupations by Sex
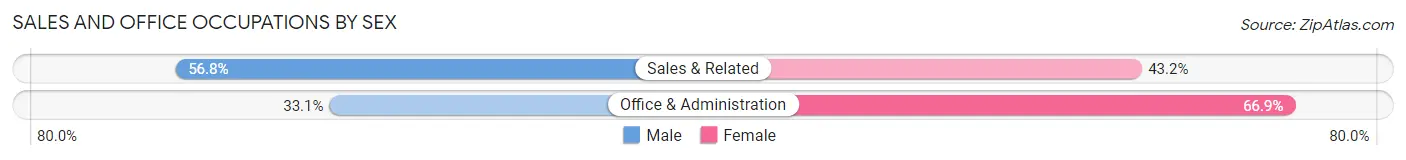
| Occupation | Male | Female |
| Sales & Related | 1,659 (56.8%) | 1,261 (43.2%) |
| Office & Administration | 1,331 (33.1%) | 2,687 (66.9%) |
| Total (Category) | 2,990 (43.1%) | 3,948 (56.9%) |
| Total (Overall) | 20,394 (50.8%) | 19,715 (49.1%) |
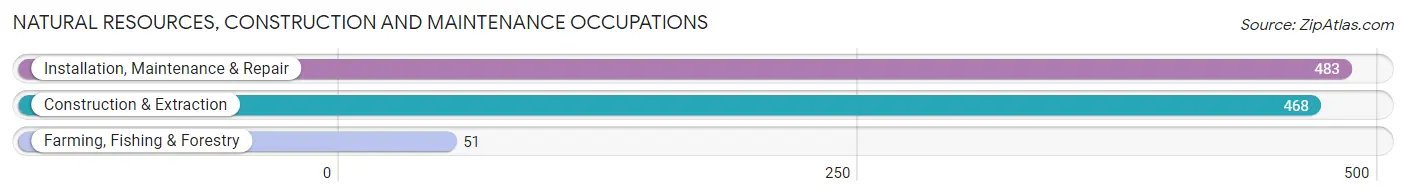
Natural Resources, Construction and Maintenance Occupations
The most common Natural Resources, Construction and Maintenance occupations in Alameda are Installation, Maintenance & Repair (483 | 1.2%), Construction & Extraction (468 | 1.2%), and Farming, Fishing & Forestry (51 | 0.1%).
Natural Resources, Construction and Maintenance Occupations by Sex
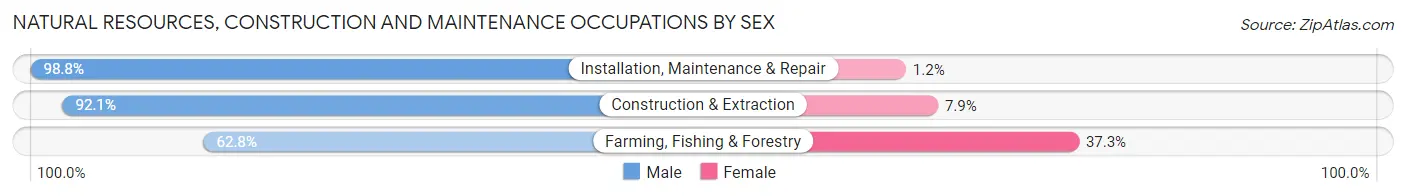
| Occupation | Male | Female |
| Farming, Fishing & Forestry | 32 (62.7%) | 19 (37.2%) |
| Construction & Extraction | 431 (92.1%) | 37 (7.9%) |
| Installation, Maintenance & Repair | 477 (98.8%) | 6 (1.2%) |
| Total (Category) | 940 (93.8%) | 62 (6.2%) |
| Total (Overall) | 20,394 (50.8%) | 19,715 (49.1%) |
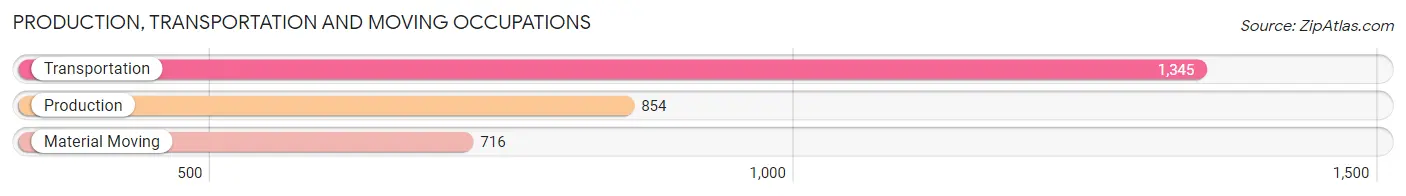
Production, Transportation and Moving Occupations
The most common Production, Transportation and Moving occupations in Alameda are Transportation (1,345 | 3.4%), Production (854 | 2.1%), and Material Moving (716 | 1.8%).
Production, Transportation and Moving Occupations by Sex
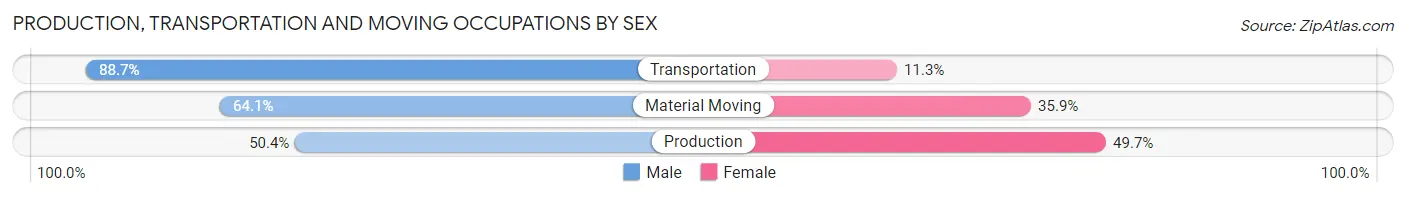
| Occupation | Male | Female |
| Production | 430 (50.3%) | 424 (49.6%) |
| Transportation | 1,193 (88.7%) | 152 (11.3%) |
| Material Moving | 459 (64.1%) | 257 (35.9%) |
| Total (Category) | 2,082 (71.4%) | 833 (28.6%) |
| Total (Overall) | 20,394 (50.8%) | 19,715 (49.1%) |
Employment Industries by Sex in Alameda
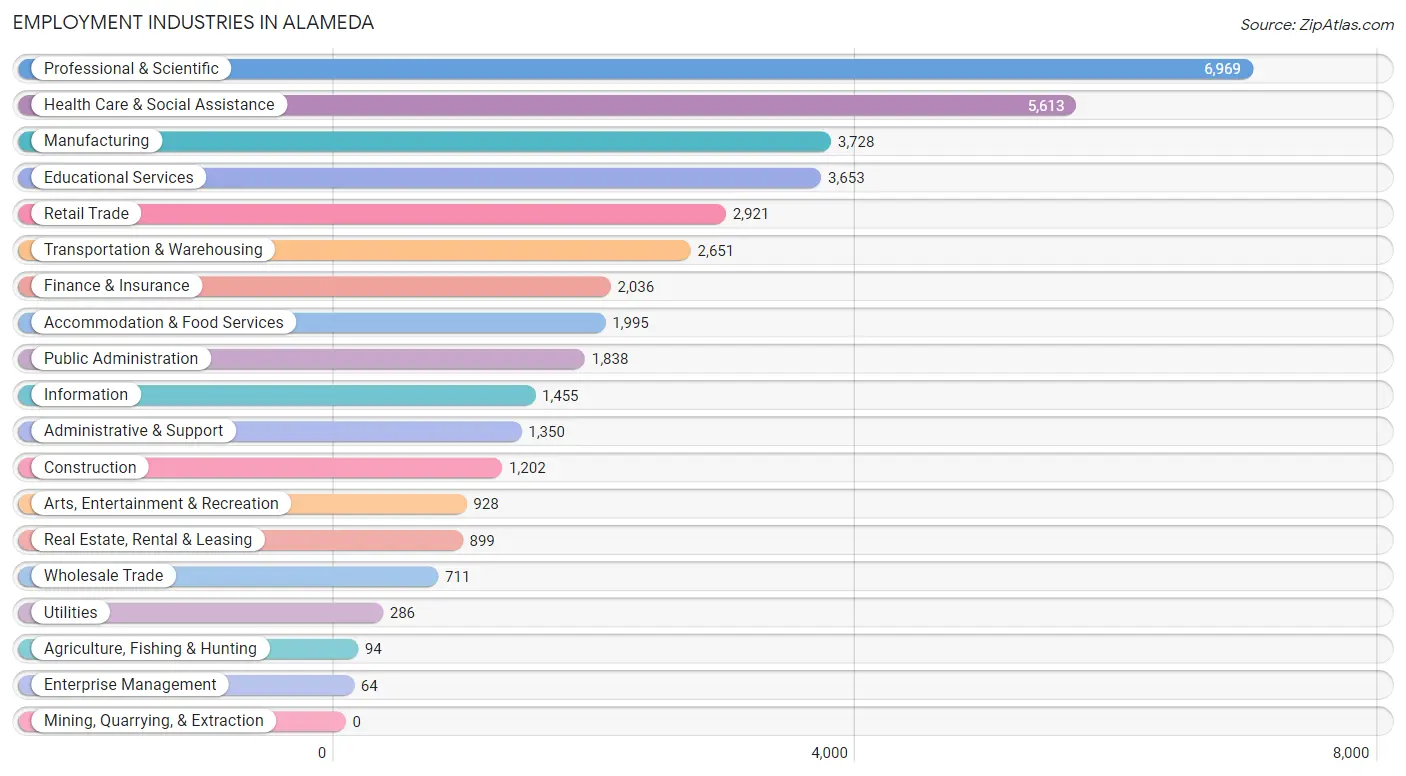
Employment Industries in Alameda
The major employment industries in Alameda include Professional & Scientific (6,969 | 17.4%), Health Care & Social Assistance (5,613 | 14.0%), Manufacturing (3,728 | 9.3%), Educational Services (3,653 | 9.1%), and Retail Trade (2,921 | 7.3%).
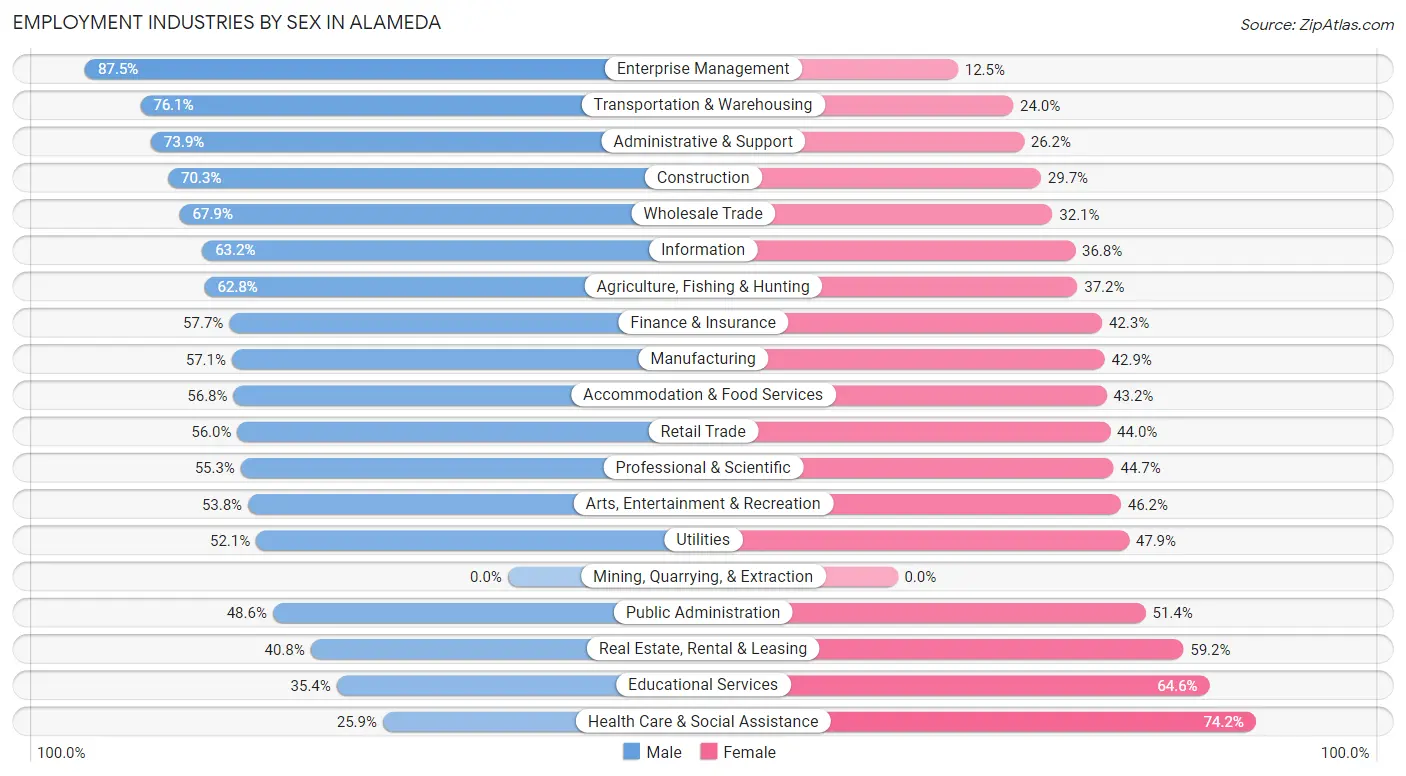
Employment Industries by Sex in Alameda
The Alameda industries that see more men than women are Enterprise Management (87.5%), Transportation & Warehousing (76.0%), and Administrative & Support (73.9%), whereas the industries that tend to have a higher number of women are Health Care & Social Assistance (74.2%), Educational Services (64.6%), and Real Estate, Rental & Leasing (59.2%).
| Industry | Male | Female |
| Agriculture, Fishing & Hunting | 59 (62.8%) | 35 (37.2%) |
| Mining, Quarrying, & Extraction | 0 (0.0%) | 0 (0.0%) |
| Construction | 845 (70.3%) | 357 (29.7%) |
| Manufacturing | 2,129 (57.1%) | 1,599 (42.9%) |
| Wholesale Trade | 483 (67.9%) | 228 (32.1%) |
| Retail Trade | 1,635 (56.0%) | 1,286 (44.0%) |
| Transportation & Warehousing | 2,016 (76.0%) | 635 (23.9%) |
| Utilities | 149 (52.1%) | 137 (47.9%) |
| Information | 920 (63.2%) | 535 (36.8%) |
| Finance & Insurance | 1,174 (57.7%) | 862 (42.3%) |
| Real Estate, Rental & Leasing | 367 (40.8%) | 532 (59.2%) |
| Professional & Scientific | 3,852 (55.3%) | 3,117 (44.7%) |
| Enterprise Management | 56 (87.5%) | 8 (12.5%) |
| Administrative & Support | 997 (73.9%) | 353 (26.2%) |
| Educational Services | 1,294 (35.4%) | 2,359 (64.6%) |
| Health Care & Social Assistance | 1,451 (25.9%) | 4,162 (74.2%) |
| Arts, Entertainment & Recreation | 499 (53.8%) | 429 (46.2%) |
| Accommodation & Food Services | 1,133 (56.8%) | 862 (43.2%) |
| Public Administration | 894 (48.6%) | 944 (51.4%) |
| Total | 20,394 (50.8%) | 19,715 (49.1%) |
Education in Alameda
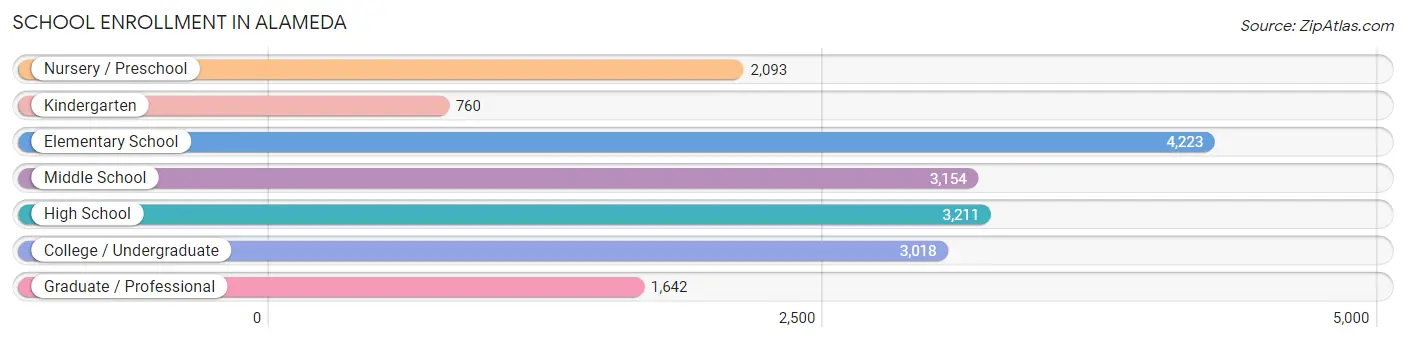
School Enrollment in Alameda
The most common levels of schooling among the 18,101 students in Alameda are elementary school (4,223 | 23.3%), high school (3,211 | 17.7%), and middle school (3,154 | 17.4%).
| School Level | # Students | % Students |
| Nursery / Preschool | 2,093 | 11.6% |
| Kindergarten | 760 | 4.2% |
| Elementary School | 4,223 | 23.3% |
| Middle School | 3,154 | 17.4% |
| High School | 3,211 | 17.7% |
| College / Undergraduate | 3,018 | 16.7% |
| Graduate / Professional | 1,642 | 9.1% |
| Total | 18,101 | 100.0% |
School Enrollment by Age by Funding Source in Alameda
Out of a total of 18,101 students who are enrolled in schools in Alameda, 3,638 (20.1%) attend a private institution, while the remaining 14,463 (79.9%) are enrolled in public schools. The age group of 3 to 4 year olds has the highest likelihood of being enrolled in private schools, with 1,048 (64.6% in the age bracket) enrolled. Conversely, the age group of 5 to 9 year old has the lowest likelihood of being enrolled in a private school, with 3,992 (87.5% in the age bracket) attending a public institution.
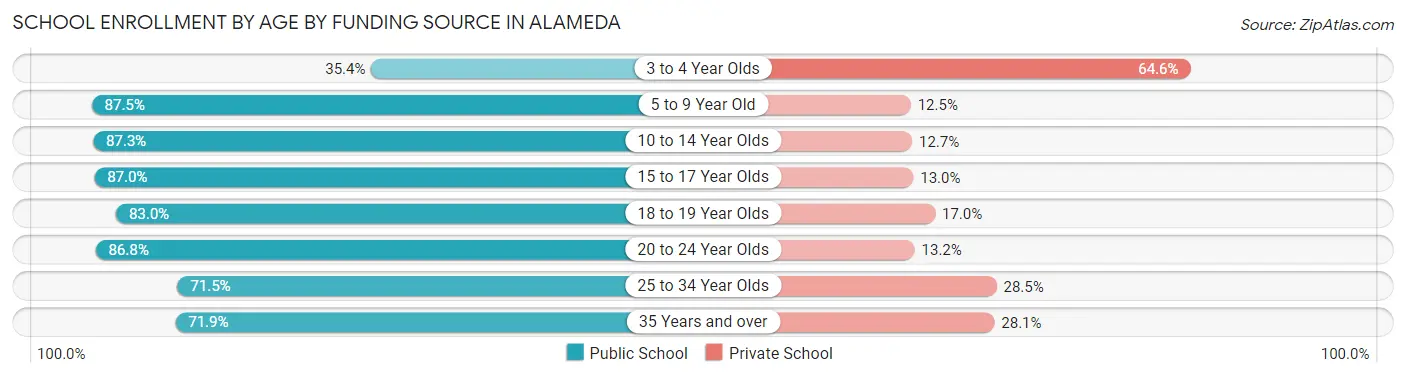
| Age Bracket | Public School | Private School |
| 3 to 4 Year Olds | 575 (35.4%) | 1,048 (64.6%) |
| 5 to 9 Year Old | 3,992 (87.5%) | 570 (12.5%) |
| 10 to 14 Year Olds | 3,875 (87.3%) | 566 (12.7%) |
| 15 to 17 Year Olds | 2,120 (87.0%) | 316 (13.0%) |
| 18 to 19 Year Olds | 546 (83.0%) | 112 (17.0%) |
| 20 to 24 Year Olds | 1,183 (86.8%) | 180 (13.2%) |
| 25 to 34 Year Olds | 1,249 (71.5%) | 497 (28.5%) |
| 35 Years and over | 915 (71.9%) | 357 (28.1%) |
| Total | 14,463 (79.9%) | 3,638 (20.1%) |
Educational Attainment by Field of Study in Alameda
Business (6,010 | 16.4%), social sciences (4,519 | 12.3%), science & technology (3,268 | 8.9%), engineering (3,251 | 8.9%), and bio, nature & agricultural (2,817 | 7.7%) are the most common fields of study among 36,670 individuals in Alameda who have obtained a bachelor's degree or higher.
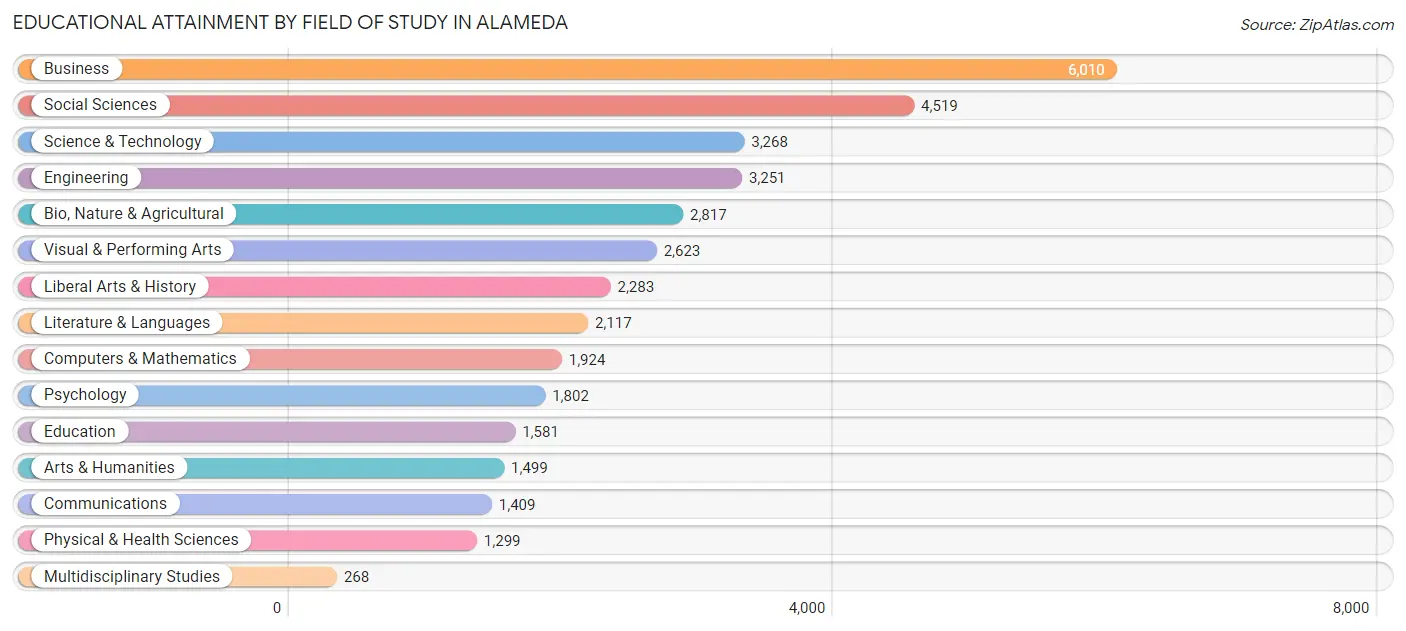
| Field of Study | # Graduates | % Graduates |
| Computers & Mathematics | 1,924 | 5.2% |
| Bio, Nature & Agricultural | 2,817 | 7.7% |
| Physical & Health Sciences | 1,299 | 3.5% |
| Psychology | 1,802 | 4.9% |
| Social Sciences | 4,519 | 12.3% |
| Engineering | 3,251 | 8.9% |
| Multidisciplinary Studies | 268 | 0.7% |
| Science & Technology | 3,268 | 8.9% |
| Business | 6,010 | 16.4% |
| Education | 1,581 | 4.3% |
| Literature & Languages | 2,117 | 5.8% |
| Liberal Arts & History | 2,283 | 6.2% |
| Visual & Performing Arts | 2,623 | 7.1% |
| Communications | 1,409 | 3.8% |
| Arts & Humanities | 1,499 | 4.1% |
| Total | 36,670 | 100.0% |
Transportation & Commute in Alameda
Vehicle Availability by Sex in Alameda
The most prevalent vehicle ownership categories in Alameda are males with 2 vehicles (9,102, accounting for 44.6%) and females with 2 vehicles (7,978, making up 47.7%).
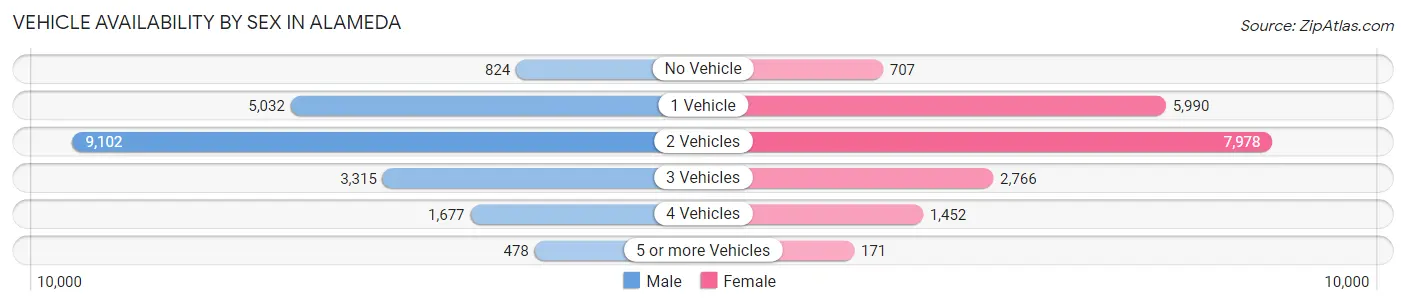
| Vehicles Available | Male | Female |
| No Vehicle | 824 (4.0%) | 707 (3.7%) |
| 1 Vehicle | 5,032 (24.6%) | 5,990 (31.4%) |
| 2 Vehicles | 9,102 (44.6%) | 7,978 (41.8%) |
| 3 Vehicles | 3,315 (16.2%) | 2,766 (14.5%) |
| 4 Vehicles | 1,677 (8.2%) | 1,452 (7.6%) |
| 5 or more Vehicles | 478 (2.3%) | 171 (0.9%) |
| Total | 20,428 (100.0%) | 19,064 (100.0%) |
Commute Time in Alameda
The most frequently occuring commute durations in Alameda are 30 to 34 minutes (4,214 commuters, 13.8%), 20 to 24 minutes (3,927 commuters, 12.9%), and 45 to 59 minutes (3,849 commuters, 12.6%).
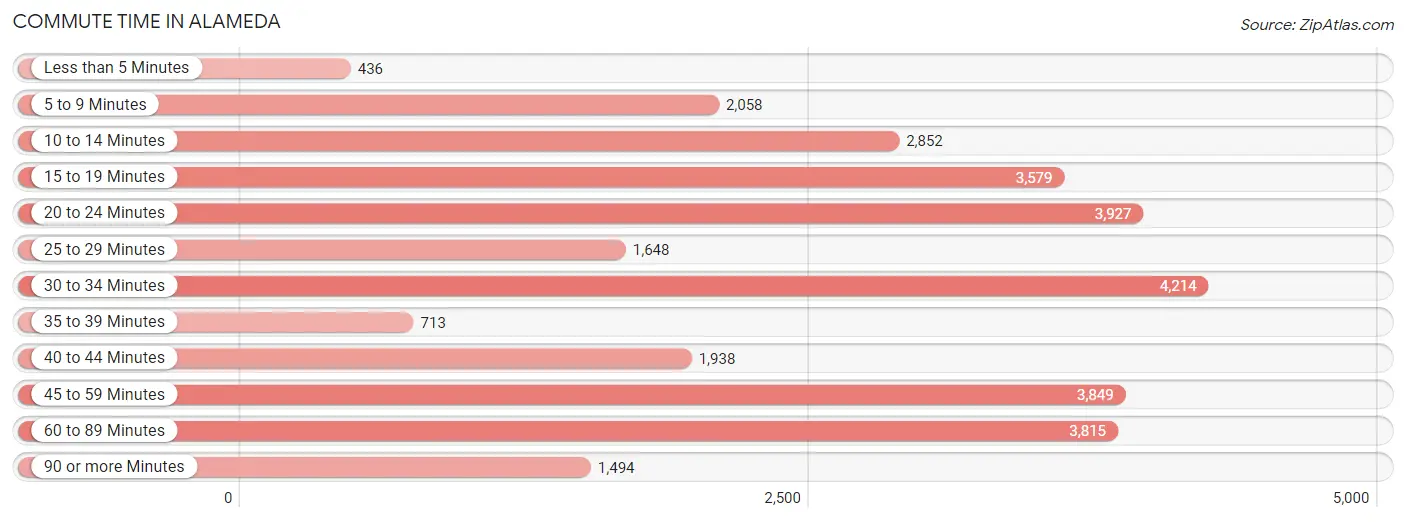
| Commute Time | # Commuters | % Commuters |
| Less than 5 Minutes | 436 | 1.4% |
| 5 to 9 Minutes | 2,058 | 6.7% |
| 10 to 14 Minutes | 2,852 | 9.3% |
| 15 to 19 Minutes | 3,579 | 11.7% |
| 20 to 24 Minutes | 3,927 | 12.9% |
| 25 to 29 Minutes | 1,648 | 5.4% |
| 30 to 34 Minutes | 4,214 | 13.8% |
| 35 to 39 Minutes | 713 | 2.3% |
| 40 to 44 Minutes | 1,938 | 6.4% |
| 45 to 59 Minutes | 3,849 | 12.6% |
| 60 to 89 Minutes | 3,815 | 12.5% |
| 90 or more Minutes | 1,494 | 4.9% |
Commute Time by Sex in Alameda
The most common commute times in Alameda are 45 to 59 minutes (2,304 commuters, 14.2%) for males and 30 to 34 minutes (2,110 commuters, 14.7%) for females.
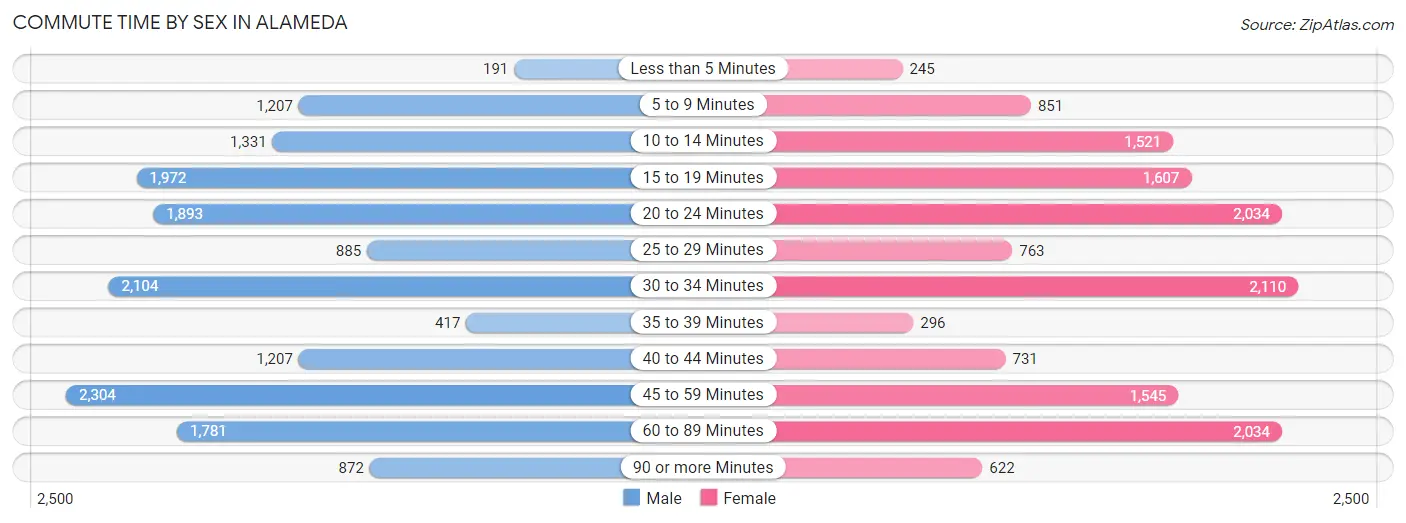
| Commute Time | Male | Female |
| Less than 5 Minutes | 191 (1.2%) | 245 (1.7%) |
| 5 to 9 Minutes | 1,207 (7.5%) | 851 (5.9%) |
| 10 to 14 Minutes | 1,331 (8.2%) | 1,521 (10.6%) |
| 15 to 19 Minutes | 1,972 (12.2%) | 1,607 (11.2%) |
| 20 to 24 Minutes | 1,893 (11.7%) | 2,034 (14.2%) |
| 25 to 29 Minutes | 885 (5.5%) | 763 (5.3%) |
| 30 to 34 Minutes | 2,104 (13.0%) | 2,110 (14.7%) |
| 35 to 39 Minutes | 417 (2.6%) | 296 (2.1%) |
| 40 to 44 Minutes | 1,207 (7.5%) | 731 (5.1%) |
| 45 to 59 Minutes | 2,304 (14.2%) | 1,545 (10.8%) |
| 60 to 89 Minutes | 1,781 (11.0%) | 2,034 (14.2%) |
| 90 or more Minutes | 872 (5.4%) | 622 (4.3%) |
Time of Departure to Work by Sex in Alameda
The most frequent times of departure to work in Alameda are 8:00 AM to 8:29 AM (2,460, 15.2%) for males and 8:00 AM to 8:29 AM (2,612, 18.2%) for females.
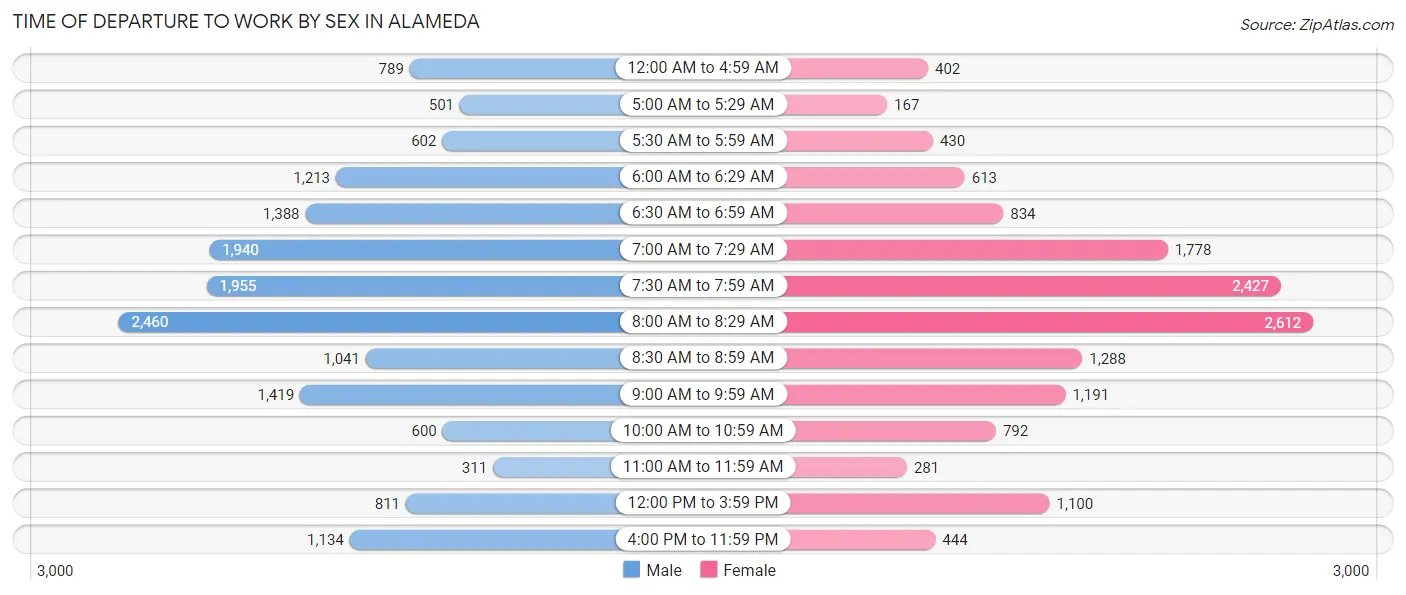
| Time of Departure | Male | Female |
| 12:00 AM to 4:59 AM | 789 (4.9%) | 402 (2.8%) |
| 5:00 AM to 5:29 AM | 501 (3.1%) | 167 (1.2%) |
| 5:30 AM to 5:59 AM | 602 (3.7%) | 430 (3.0%) |
| 6:00 AM to 6:29 AM | 1,213 (7.5%) | 613 (4.3%) |
| 6:30 AM to 6:59 AM | 1,388 (8.6%) | 834 (5.8%) |
| 7:00 AM to 7:29 AM | 1,940 (12.0%) | 1,778 (12.4%) |
| 7:30 AM to 7:59 AM | 1,955 (12.1%) | 2,427 (16.9%) |
| 8:00 AM to 8:29 AM | 2,460 (15.2%) | 2,612 (18.2%) |
| 8:30 AM to 8:59 AM | 1,041 (6.4%) | 1,288 (9.0%) |
| 9:00 AM to 9:59 AM | 1,419 (8.8%) | 1,191 (8.3%) |
| 10:00 AM to 10:59 AM | 600 (3.7%) | 792 (5.5%) |
| 11:00 AM to 11:59 AM | 311 (1.9%) | 281 (2.0%) |
| 12:00 PM to 3:59 PM | 811 (5.0%) | 1,100 (7.7%) |
| 4:00 PM to 11:59 PM | 1,134 (7.0%) | 444 (3.1%) |
| Total | 16,164 (100.0%) | 14,359 (100.0%) |
Housing Occupancy in Alameda
Occupancy by Ownership in Alameda
Of the total 29,820 dwellings in Alameda, owner-occupied units account for 14,411 (48.3%), while renter-occupied units make up 15,409 (51.7%).
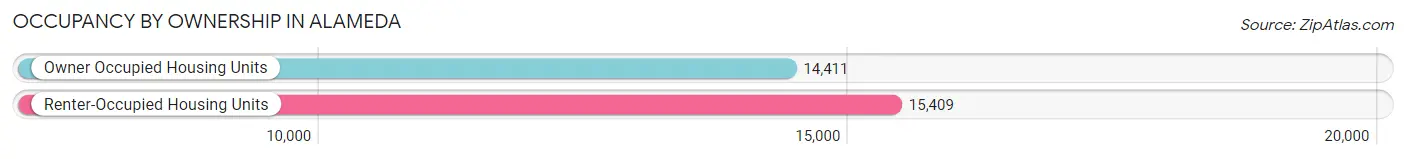
| Occupancy | # Housing Units | % Housing Units |
| Owner Occupied Housing Units | 14,411 | 48.3% |
| Renter-Occupied Housing Units | 15,409 | 51.7% |
| Total Occupied Housing Units | 29,820 | 100.0% |
Occupancy by Household Size in Alameda
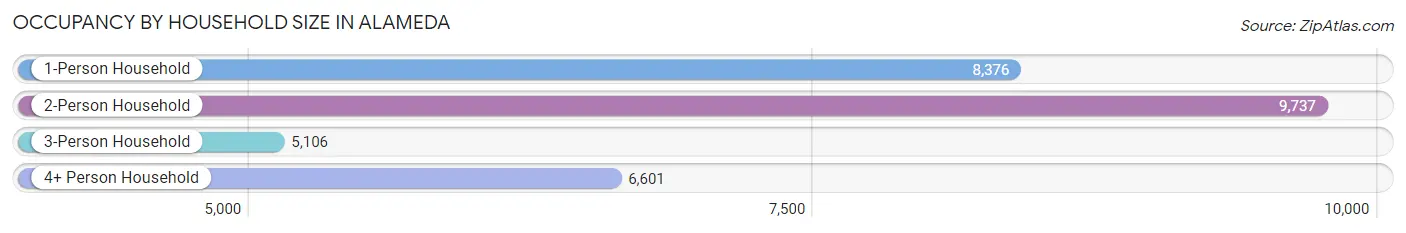
| Household Size | # Housing Units | % Housing Units |
| 1-Person Household | 8,376 | 28.1% |
| 2-Person Household | 9,737 | 32.7% |
| 3-Person Household | 5,106 | 17.1% |
| 4+ Person Household | 6,601 | 22.1% |
| Total Housing Units | 29,820 | 100.0% |
Occupancy by Ownership by Household Size in Alameda
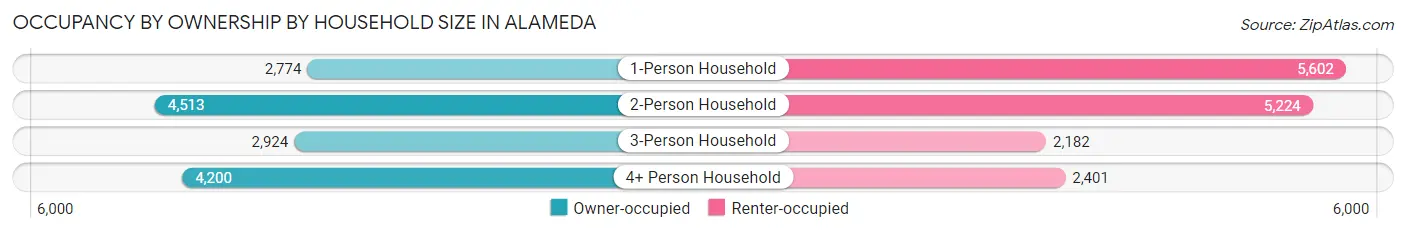
| Household Size | Owner-occupied | Renter-occupied |
| 1-Person Household | 2,774 (33.1%) | 5,602 (66.9%) |
| 2-Person Household | 4,513 (46.4%) | 5,224 (53.6%) |
| 3-Person Household | 2,924 (57.3%) | 2,182 (42.7%) |
| 4+ Person Household | 4,200 (63.6%) | 2,401 (36.4%) |
| Total Housing Units | 14,411 (48.3%) | 15,409 (51.7%) |
Occupancy by Educational Attainment in Alameda
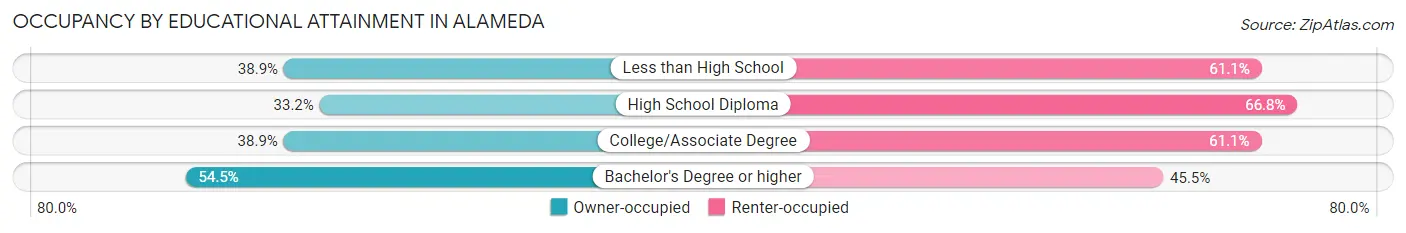
| Household Size | Owner-occupied | Renter-occupied |
| Less than High School | 515 (38.9%) | 810 (61.1%) |
| High School Diploma | 865 (33.2%) | 1,740 (66.8%) |
| College/Associate Degree | 2,689 (38.9%) | 4,221 (61.1%) |
| Bachelor's Degree or higher | 10,342 (54.5%) | 8,638 (45.5%) |
Occupancy by Age of Householder in Alameda
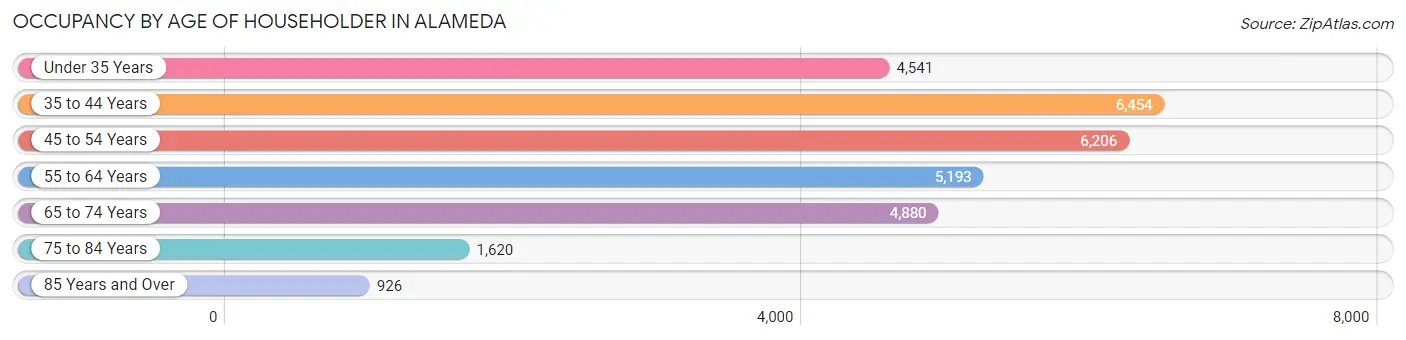
| Age Bracket | # Households | % Households |
| Under 35 Years | 4,541 | 15.2% |
| 35 to 44 Years | 6,454 | 21.6% |
| 45 to 54 Years | 6,206 | 20.8% |
| 55 to 64 Years | 5,193 | 17.4% |
| 65 to 74 Years | 4,880 | 16.4% |
| 75 to 84 Years | 1,620 | 5.4% |
| 85 Years and Over | 926 | 3.1% |
| Total | 29,820 | 100.0% |
Housing Finances in Alameda
Median Income by Occupancy in Alameda
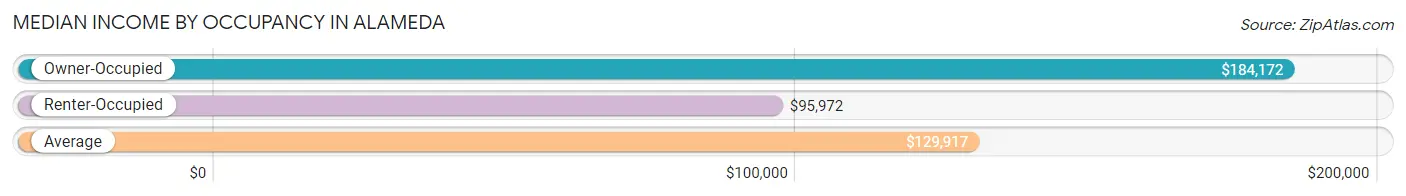
| Occupancy Type | # Households | Median Income |
| Owner-Occupied | 14,411 (48.3%) | $184,172 |
| Renter-Occupied | 15,409 (51.7%) | $95,972 |
| Average | 29,820 (100.0%) | $129,917 |
Occupancy by Householder Income Bracket in Alameda
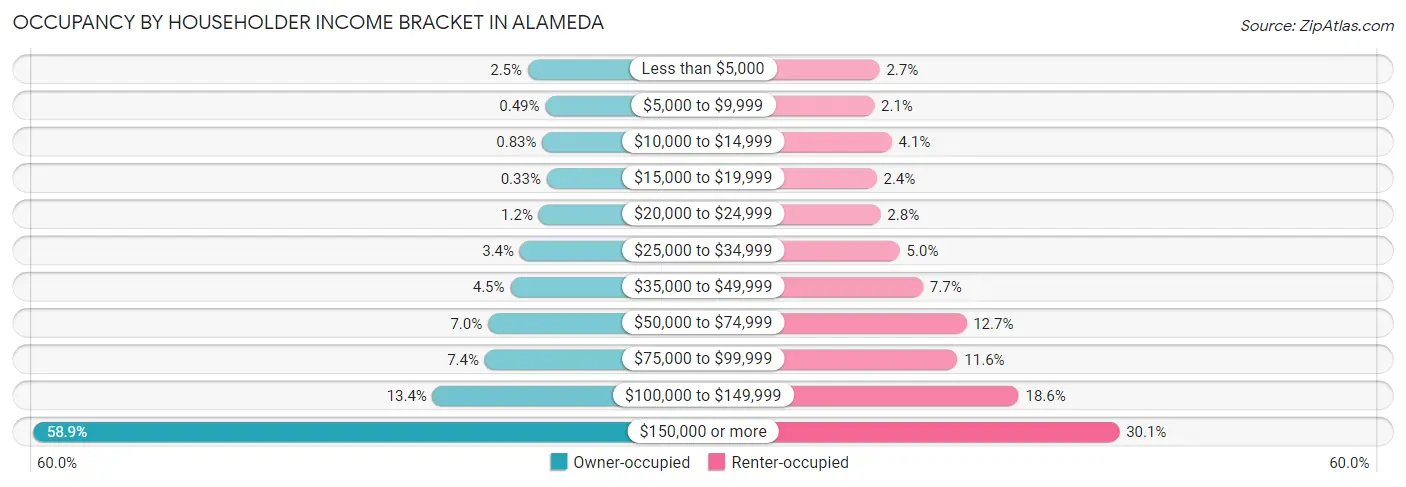
| Income Bracket | Owner-occupied | Renter-occupied |
| Less than $5,000 | 358 (2.5%) | 421 (2.7%) |
| $5,000 to $9,999 | 71 (0.5%) | 326 (2.1%) |
| $10,000 to $14,999 | 119 (0.8%) | 635 (4.1%) |
| $15,000 to $19,999 | 48 (0.3%) | 370 (2.4%) |
| $20,000 to $24,999 | 179 (1.2%) | 437 (2.8%) |
| $25,000 to $34,999 | 490 (3.4%) | 777 (5.0%) |
| $35,000 to $49,999 | 645 (4.5%) | 1,187 (7.7%) |
| $50,000 to $74,999 | 1,013 (7.0%) | 1,950 (12.7%) |
| $75,000 to $99,999 | 1,068 (7.4%) | 1,793 (11.6%) |
| $100,000 to $149,999 | 1,926 (13.4%) | 2,871 (18.6%) |
| $150,000 or more | 8,494 (58.9%) | 4,642 (30.1%) |
| Total | 14,411 (100.0%) | 15,409 (100.0%) |
Monthly Housing Cost Tiers in Alameda
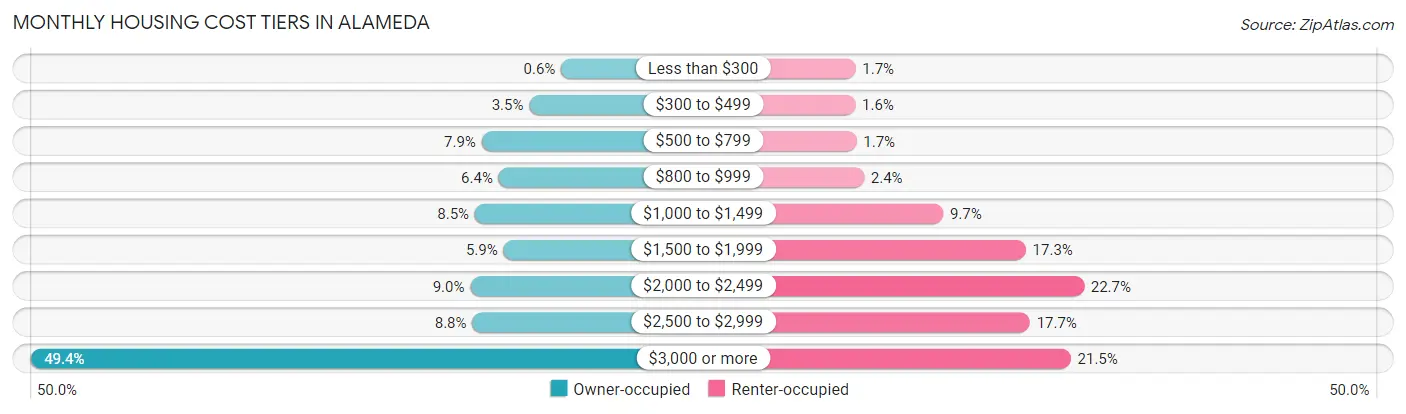
| Monthly Cost | Owner-occupied | Renter-occupied |
| Less than $300 | 87 (0.6%) | 255 (1.7%) |
| $300 to $499 | 510 (3.5%) | 251 (1.6%) |
| $500 to $799 | 1,141 (7.9%) | 268 (1.7%) |
| $800 to $999 | 915 (6.4%) | 375 (2.4%) |
| $1,000 to $1,499 | 1,230 (8.5%) | 1,497 (9.7%) |
| $1,500 to $1,999 | 852 (5.9%) | 2,671 (17.3%) |
| $2,000 to $2,499 | 1,292 (9.0%) | 3,494 (22.7%) |
| $2,500 to $2,999 | 1,266 (8.8%) | 2,727 (17.7%) |
| $3,000 or more | 7,118 (49.4%) | 3,309 (21.5%) |
| Total | 14,411 (100.0%) | 15,409 (100.0%) |
Physical Housing Characteristics in Alameda
Housing Structures in Alameda
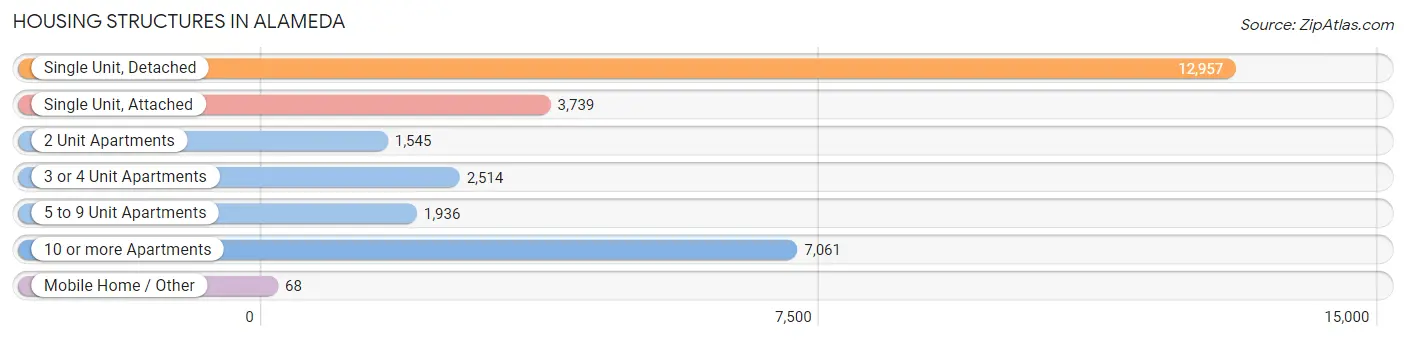
| Structure Type | # Housing Units | % Housing Units |
| Single Unit, Detached | 12,957 | 43.4% |
| Single Unit, Attached | 3,739 | 12.5% |
| 2 Unit Apartments | 1,545 | 5.2% |
| 3 or 4 Unit Apartments | 2,514 | 8.4% |
| 5 to 9 Unit Apartments | 1,936 | 6.5% |
| 10 or more Apartments | 7,061 | 23.7% |
| Mobile Home / Other | 68 | 0.2% |
| Total | 29,820 | 100.0% |
Housing Structures by Occupancy in Alameda
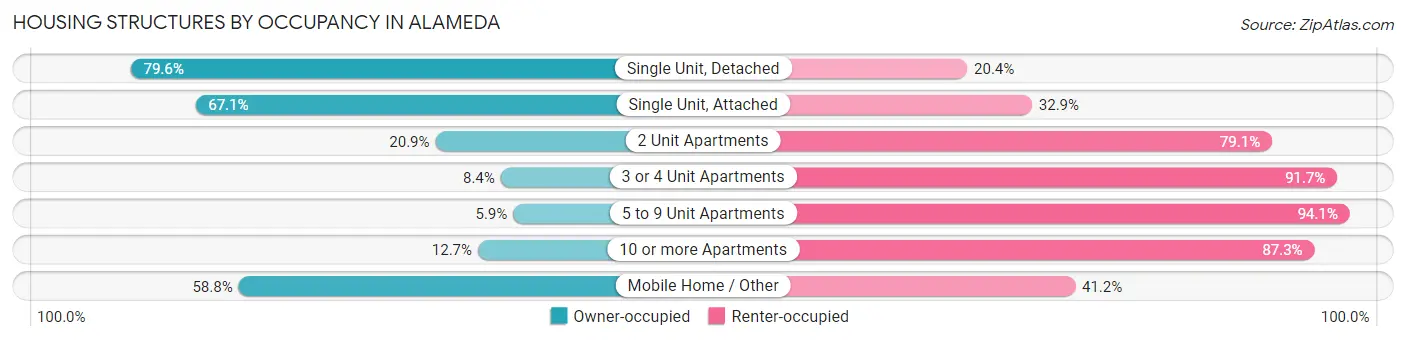
| Structure Type | Owner-occupied | Renter-occupied |
| Single Unit, Detached | 10,314 (79.6%) | 2,643 (20.4%) |
| Single Unit, Attached | 2,510 (67.1%) | 1,229 (32.9%) |
| 2 Unit Apartments | 323 (20.9%) | 1,222 (79.1%) |
| 3 or 4 Unit Apartments | 210 (8.4%) | 2,304 (91.6%) |
| 5 to 9 Unit Apartments | 115 (5.9%) | 1,821 (94.1%) |
| 10 or more Apartments | 899 (12.7%) | 6,162 (87.3%) |
| Mobile Home / Other | 40 (58.8%) | 28 (41.2%) |
| Total | 14,411 (48.3%) | 15,409 (51.7%) |
Housing Structures by Number of Rooms in Alameda
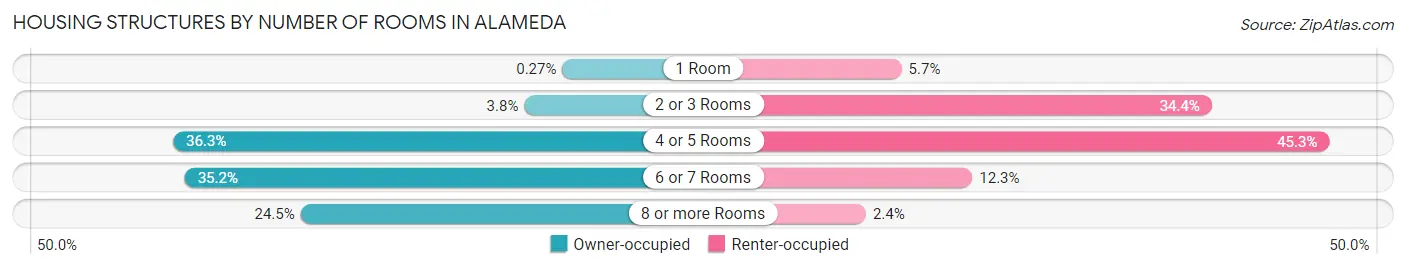
| Number of Rooms | Owner-occupied | Renter-occupied |
| 1 Room | 39 (0.3%) | 880 (5.7%) |
| 2 or 3 Rooms | 546 (3.8%) | 5,298 (34.4%) |
| 4 or 5 Rooms | 5,227 (36.3%) | 6,973 (45.3%) |
| 6 or 7 Rooms | 5,071 (35.2%) | 1,887 (12.2%) |
| 8 or more Rooms | 3,528 (24.5%) | 371 (2.4%) |
| Total | 14,411 (100.0%) | 15,409 (100.0%) |
Housing Structure by Heating Type in Alameda
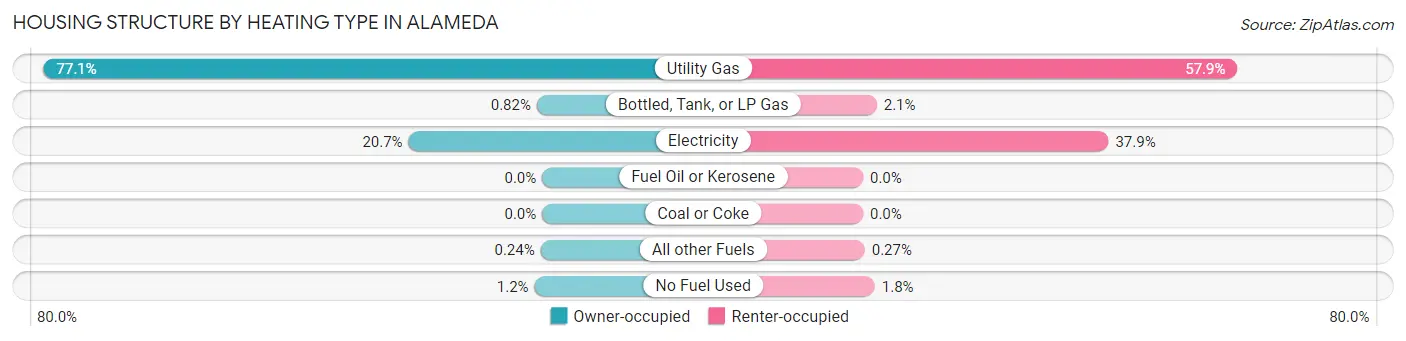
| Heating Type | Owner-occupied | Renter-occupied |
| Utility Gas | 11,110 (77.1%) | 8,914 (57.9%) |
| Bottled, Tank, or LP Gas | 118 (0.8%) | 326 (2.1%) |
| Electricity | 2,977 (20.7%) | 5,846 (37.9%) |
| Fuel Oil or Kerosene | 0 (0.0%) | 0 (0.0%) |
| Coal or Coke | 0 (0.0%) | 0 (0.0%) |
| All other Fuels | 34 (0.2%) | 42 (0.3%) |
| No Fuel Used | 172 (1.2%) | 281 (1.8%) |
| Total | 14,411 (100.0%) | 15,409 (100.0%) |
Household Vehicle Usage in Alameda
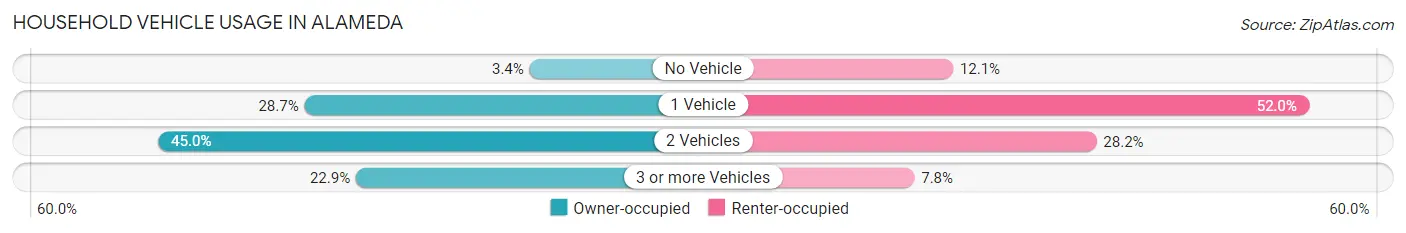
| Vehicles per Household | Owner-occupied | Renter-occupied |
| No Vehicle | 495 (3.4%) | 1,865 (12.1%) |
| 1 Vehicle | 4,129 (28.6%) | 8,007 (52.0%) |
| 2 Vehicles | 6,490 (45.0%) | 4,340 (28.2%) |
| 3 or more Vehicles | 3,297 (22.9%) | 1,197 (7.8%) |
| Total | 14,411 (100.0%) | 15,409 (100.0%) |
Real Estate & Mortgages in Alameda
Real Estate and Mortgage Overview in Alameda
| Characteristic | Without Mortgage | With Mortgage |
| Housing Units | 4,547 | 9,864 |
| Median Property Value | $1,138,500 | $1,150,800 |
| Median Household Income | $108,574 | $6,677 |
| Monthly Housing Costs | $953 | $6,875 |
| Real Estate Taxes | $6,204 | $124 |
Property Value by Mortgage Status in Alameda
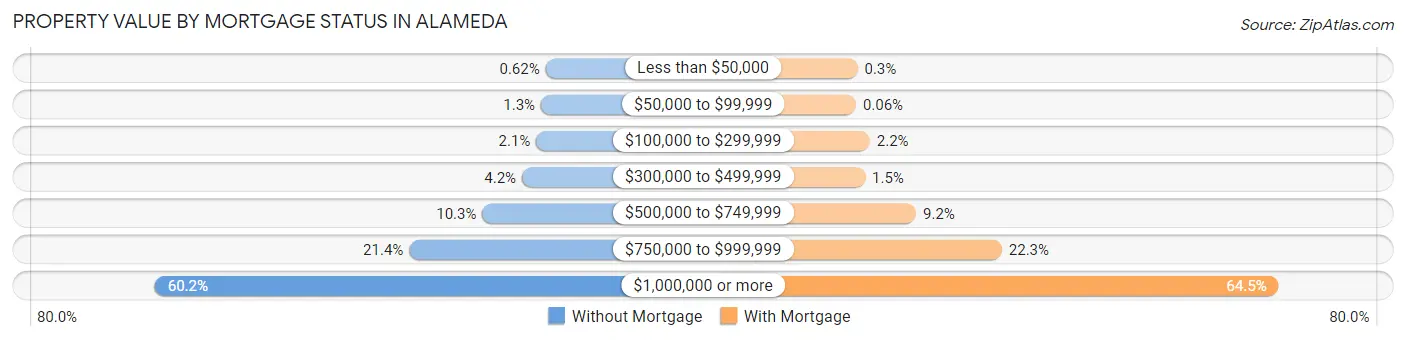
| Property Value | Without Mortgage | With Mortgage |
| Less than $50,000 | 28 (0.6%) | 30 (0.3%) |
| $50,000 to $99,999 | 60 (1.3%) | 6 (0.1%) |
| $100,000 to $299,999 | 93 (2.1%) | 215 (2.2%) |
| $300,000 to $499,999 | 192 (4.2%) | 144 (1.5%) |
| $500,000 to $749,999 | 466 (10.2%) | 910 (9.2%) |
| $750,000 to $999,999 | 973 (21.4%) | 2,200 (22.3%) |
| $1,000,000 or more | 2,735 (60.2%) | 6,359 (64.5%) |
| Total | 4,547 (100.0%) | 9,864 (100.0%) |
Household Income by Mortgage Status in Alameda
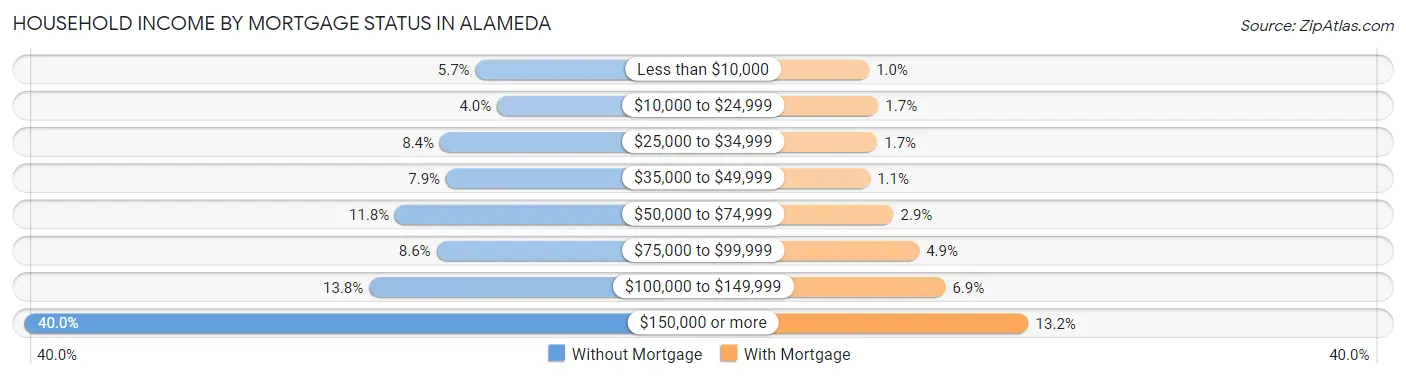
| Household Income | Without Mortgage | With Mortgage |
| Less than $10,000 | 257 (5.7%) | 103 (1.0%) |
| $10,000 to $24,999 | 182 (4.0%) | 172 (1.7%) |
| $25,000 to $34,999 | 380 (8.4%) | 164 (1.7%) |
| $35,000 to $49,999 | 359 (7.9%) | 110 (1.1%) |
| $50,000 to $74,999 | 535 (11.8%) | 286 (2.9%) |
| $75,000 to $99,999 | 392 (8.6%) | 478 (4.9%) |
| $100,000 to $149,999 | 625 (13.8%) | 676 (6.9%) |
| $150,000 or more | 1,817 (40.0%) | 1,301 (13.2%) |
| Total | 4,547 (100.0%) | 9,864 (100.0%) |
Property Value to Household Income Ratio in Alameda
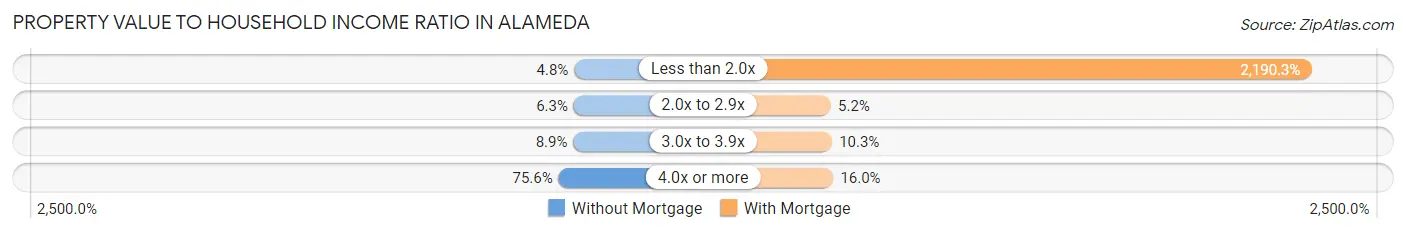
| Value-to-Income Ratio | Without Mortgage | With Mortgage |
| Less than 2.0x | 218 (4.8%) | 216,053 (2,190.3%) |
| 2.0x to 2.9x | 287 (6.3%) | 510 (5.2%) |
| 3.0x to 3.9x | 405 (8.9%) | 1,020 (10.3%) |
| 4.0x or more | 3,436 (75.6%) | 1,580 (16.0%) |
| Total | 4,547 (100.0%) | 9,864 (100.0%) |
Real Estate Taxes by Mortgage Status in Alameda
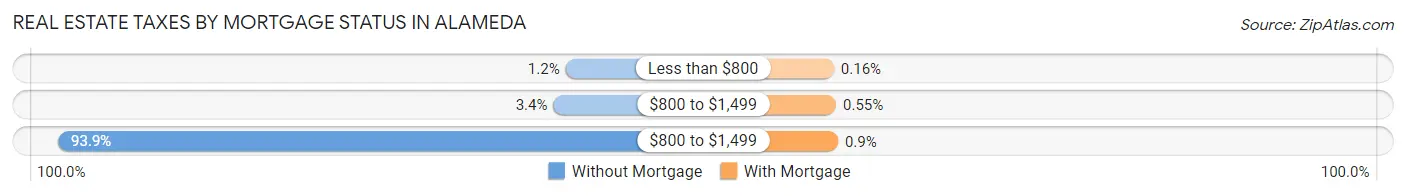
| Property Taxes | Without Mortgage | With Mortgage |
| Less than $800 | 55 (1.2%) | 16 (0.2%) |
| $800 to $1,499 | 156 (3.4%) | 54 (0.5%) |
| $800 to $1,499 | 4,270 (93.9%) | 89 (0.9%) |
| Total | 4,547 (100.0%) | 9,864 (100.0%) |
Health & Disability in Alameda
Health Insurance Coverage by Age in Alameda
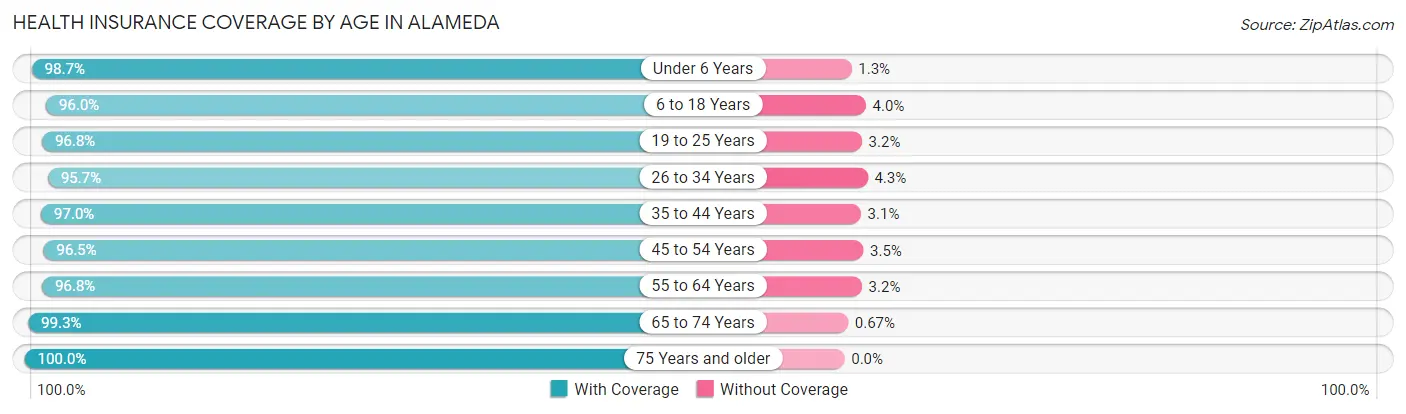
| Age Bracket | With Coverage | Without Coverage |
| Under 6 Years | 5,766 (98.7%) | 77 (1.3%) |
| 6 to 18 Years | 10,724 (96.0%) | 444 (4.0%) |
| 19 to 25 Years | 4,390 (96.8%) | 147 (3.2%) |
| 26 to 34 Years | 9,255 (95.7%) | 418 (4.3%) |
| 35 to 44 Years | 12,020 (97.0%) | 378 (3.0%) |
| 45 to 54 Years | 10,389 (96.5%) | 378 (3.5%) |
| 55 to 64 Years | 8,940 (96.8%) | 299 (3.2%) |
| 65 to 74 Years | 7,949 (99.3%) | 54 (0.7%) |
| 75 Years and older | 4,596 (100.0%) | 0 (0.0%) |
| Total | 74,029 (97.1%) | 2,195 (2.9%) |
Health Insurance Coverage by Citizenship Status in Alameda
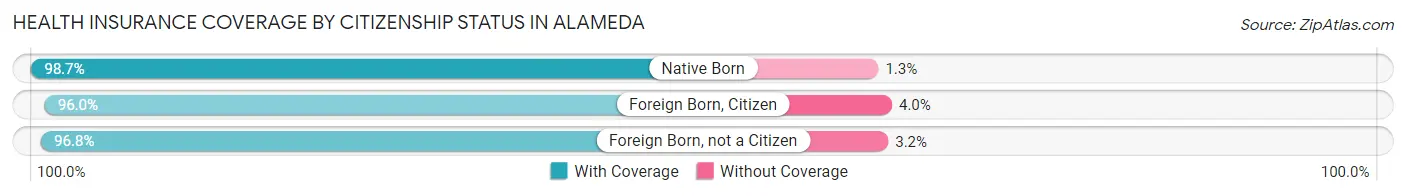
| Citizenship Status | With Coverage | Without Coverage |
| Native Born | 5,766 (98.7%) | 77 (1.3%) |
| Foreign Born, Citizen | 10,724 (96.0%) | 444 (4.0%) |
| Foreign Born, not a Citizen | 4,390 (96.8%) | 147 (3.2%) |
Health Insurance Coverage by Household Income in Alameda
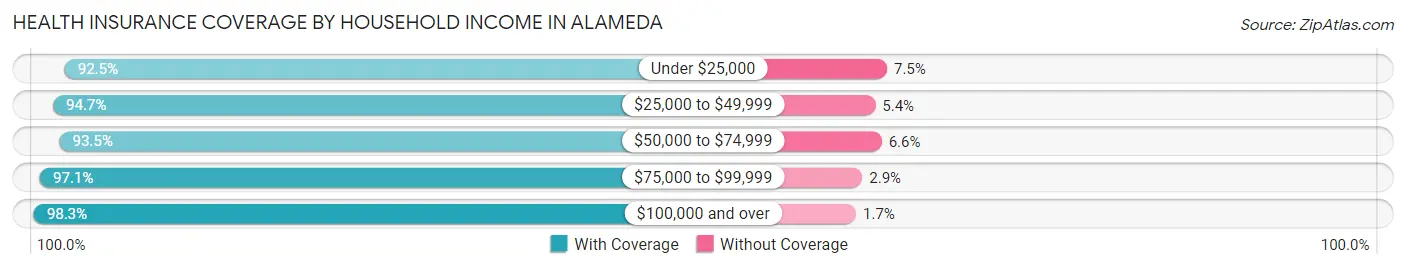
| Household Income | With Coverage | Without Coverage |
| Under $25,000 | 4,461 (92.5%) | 364 (7.5%) |
| $25,000 to $49,999 | 5,605 (94.7%) | 317 (5.3%) |
| $50,000 to $74,999 | 5,509 (93.4%) | 386 (6.6%) |
| $75,000 to $99,999 | 6,464 (97.1%) | 194 (2.9%) |
| $100,000 and over | 51,800 (98.3%) | 917 (1.7%) |
Public vs Private Health Insurance Coverage by Age in Alameda
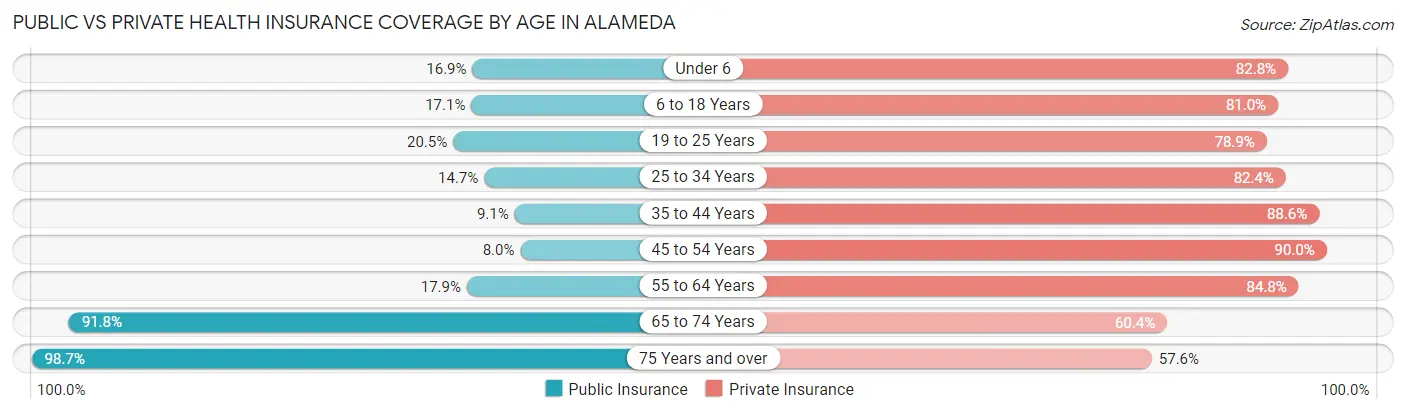
| Age Bracket | Public Insurance | Private Insurance |
| Under 6 | 987 (16.9%) | 4,838 (82.8%) |
| 6 to 18 Years | 1,910 (17.1%) | 9,041 (80.9%) |
| 19 to 25 Years | 929 (20.5%) | 3,578 (78.9%) |
| 25 to 34 Years | 1,423 (14.7%) | 7,970 (82.4%) |
| 35 to 44 Years | 1,123 (9.1%) | 10,984 (88.6%) |
| 45 to 54 Years | 860 (8.0%) | 9,689 (90.0%) |
| 55 to 64 Years | 1,656 (17.9%) | 7,834 (84.8%) |
| 65 to 74 Years | 7,346 (91.8%) | 4,832 (60.4%) |
| 75 Years and over | 4,537 (98.7%) | 2,645 (57.6%) |
| Total | 20,771 (27.3%) | 61,411 (80.6%) |
Disability Status by Sex by Age in Alameda
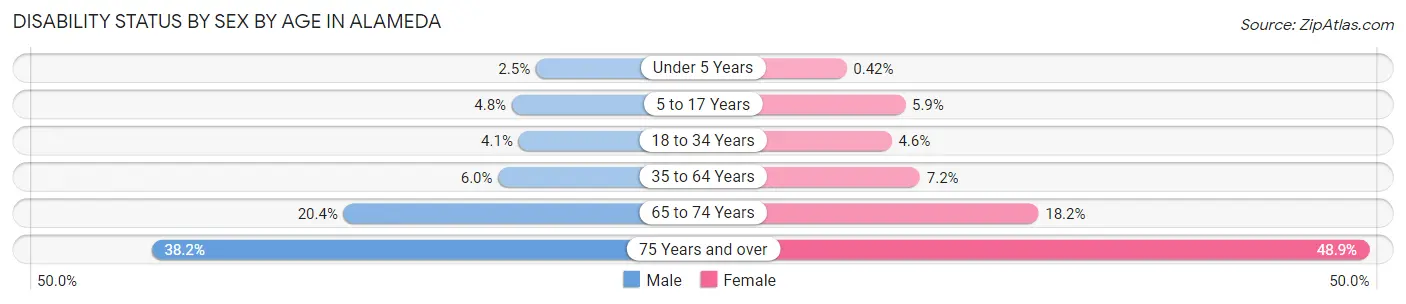
| Age Bracket | Male | Female |
| Under 5 Years | 67 (2.5%) | 9 (0.4%) |
| 5 to 17 Years | 291 (4.8%) | 334 (5.9%) |
| 18 to 34 Years | 308 (4.1%) | 332 (4.6%) |
| 35 to 64 Years | 938 (6.0%) | 1,220 (7.2%) |
| 65 to 74 Years | 716 (20.4%) | 819 (18.2%) |
| 75 Years and over | 730 (38.2%) | 1,314 (48.9%) |
Disability Class by Sex by Age in Alameda
Disability Class: Hearing Difficulty
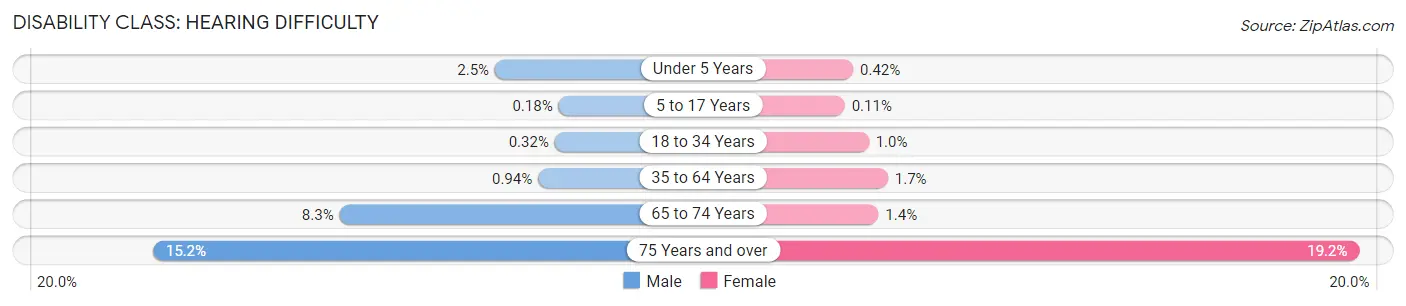
| Age Bracket | Male | Female |
| Under 5 Years | 67 (2.5%) | 9 (0.4%) |
| 5 to 17 Years | 11 (0.2%) | 6 (0.1%) |
| 18 to 34 Years | 24 (0.3%) | 72 (1.0%) |
| 35 to 64 Years | 146 (0.9%) | 288 (1.7%) |
| 65 to 74 Years | 292 (8.3%) | 61 (1.4%) |
| 75 Years and over | 291 (15.2%) | 516 (19.2%) |
Disability Class: Vision Difficulty
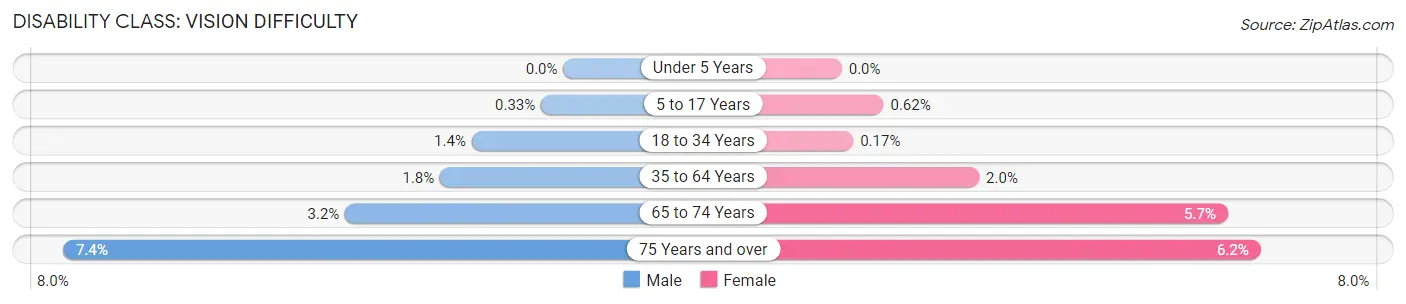
| Age Bracket | Male | Female |
| Under 5 Years | 0 (0.0%) | 0 (0.0%) |
| 5 to 17 Years | 20 (0.3%) | 35 (0.6%) |
| 18 to 34 Years | 101 (1.4%) | 12 (0.2%) |
| 35 to 64 Years | 285 (1.8%) | 344 (2.0%) |
| 65 to 74 Years | 114 (3.2%) | 257 (5.7%) |
| 75 Years and over | 142 (7.4%) | 167 (6.2%) |
Disability Class: Cognitive Difficulty
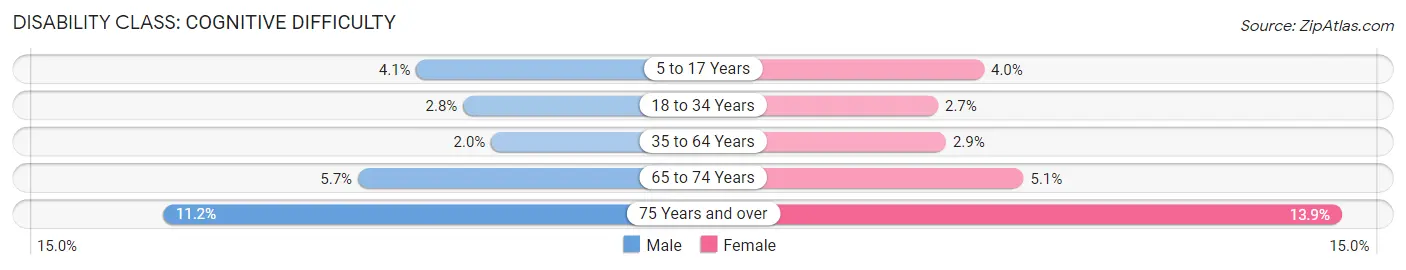
| Age Bracket | Male | Female |
| 5 to 17 Years | 250 (4.1%) | 225 (4.0%) |
| 18 to 34 Years | 208 (2.8%) | 193 (2.7%) |
| 35 to 64 Years | 312 (2.0%) | 488 (2.9%) |
| 65 to 74 Years | 201 (5.7%) | 227 (5.1%) |
| 75 Years and over | 213 (11.2%) | 374 (13.9%) |
Disability Class: Ambulatory Difficulty
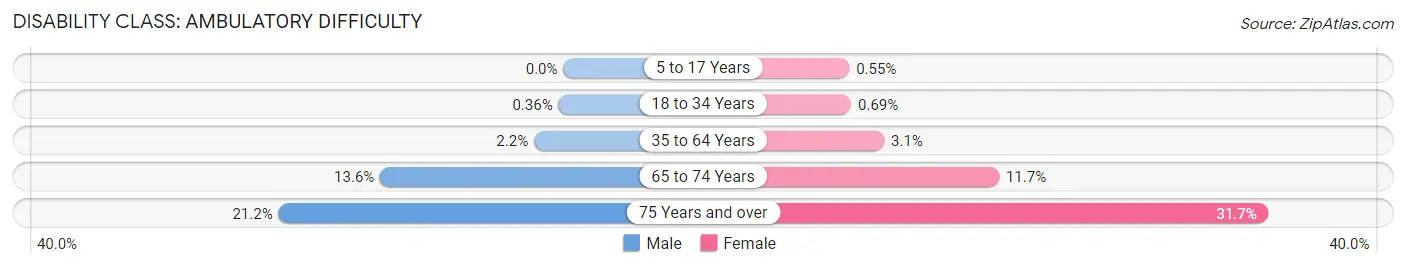
| Age Bracket | Male | Female |
| 5 to 17 Years | 0 (0.0%) | 31 (0.5%) |
| 18 to 34 Years | 27 (0.4%) | 50 (0.7%) |
| 35 to 64 Years | 339 (2.2%) | 529 (3.1%) |
| 65 to 74 Years | 478 (13.6%) | 524 (11.7%) |
| 75 Years and over | 404 (21.1%) | 851 (31.7%) |
Disability Class: Self-Care Difficulty
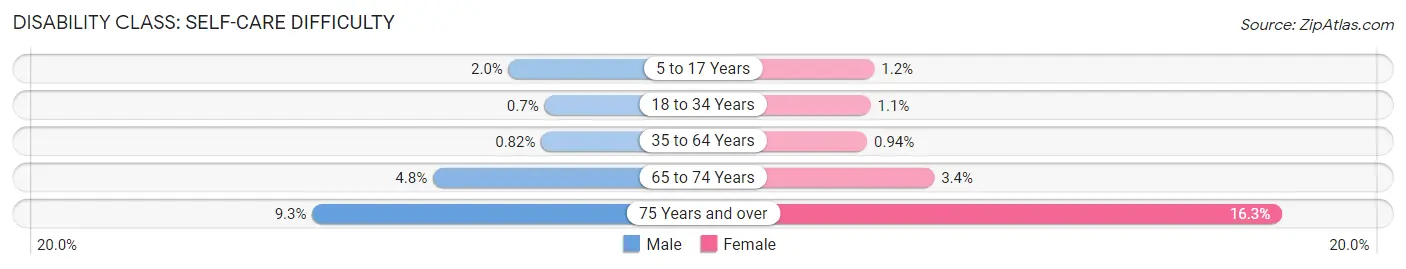
| Age Bracket | Male | Female |
| 5 to 17 Years | 124 (2.0%) | 69 (1.2%) |
| 18 to 34 Years | 52 (0.7%) | 77 (1.1%) |
| 35 to 64 Years | 127 (0.8%) | 159 (0.9%) |
| 65 to 74 Years | 170 (4.8%) | 154 (3.4%) |
| 75 Years and over | 178 (9.3%) | 439 (16.3%) |
Technology Access in Alameda
Computing Device Access in Alameda
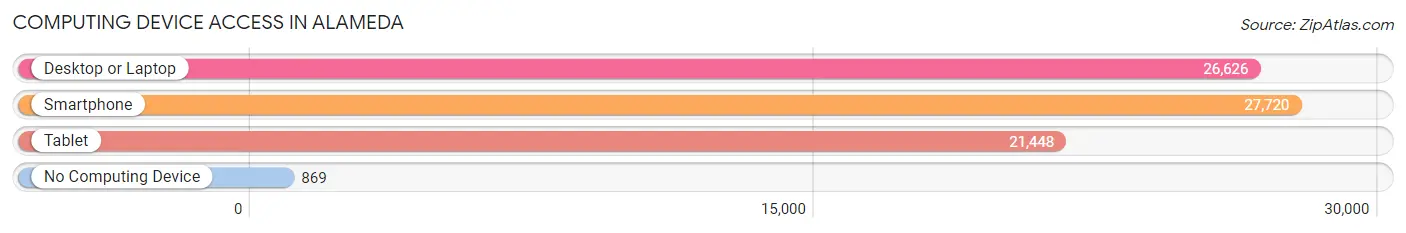
| Device Type | # Households | % Households |
| Desktop or Laptop | 26,626 | 89.3% |
| Smartphone | 27,720 | 93.0% |
| Tablet | 21,448 | 71.9% |
| No Computing Device | 869 | 2.9% |
| Total | 29,820 | 100.0% |
Internet Access in Alameda
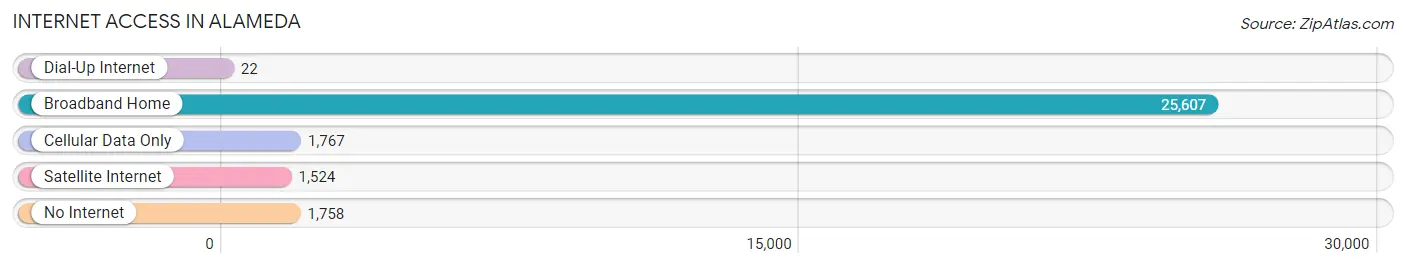
| Internet Type | # Households | % Households |
| Dial-Up Internet | 22 | 0.1% |
| Broadband Home | 25,607 | 85.9% |
| Cellular Data Only | 1,767 | 5.9% |
| Satellite Internet | 1,524 | 5.1% |
| No Internet | 1,758 | 5.9% |
| Total | 29,820 | 100.0% |
Alameda Summary
Alameda is a city located in the San Francisco Bay Area of California. It is situated on an island of the same name, which is located in the estuary of the San Francisco Bay. Alameda is the seventh most populous city in the Bay Area, with a population of 79,928 as of the 2010 census.
History
The history of Alameda dates back to the early 19th century, when the area was part of the Rancho San Antonio land grant. The land was used for cattle grazing and farming until the mid-1800s, when the area was developed into a residential community. The city was incorporated in 1872, and the first mayor was elected in 1873.
In the early 20th century, Alameda became a popular destination for vacationers, and the city experienced a period of rapid growth. During World War II, the city was home to a major naval air station, which was used to train pilots and house aircraft. After the war, the city experienced a period of decline, as the naval air station closed and the population decreased.
In the late 20th century, Alameda experienced a resurgence, as the city was redeveloped and new businesses and housing were built. Today, Alameda is a vibrant and diverse city, with a thriving economy and a strong sense of community.
Geography
Alameda is located in the San Francisco Bay Area of California, on an island of the same name. The island is situated in the estuary of the San Francisco Bay, and is connected to the mainland by two bridges. The city covers an area of 10.2 square miles, and has a population density of 7,817 people per square mile.
The city is located in a temperate climate zone, with mild temperatures year-round. The average high temperature in the summer is 75 degrees Fahrenheit, and the average low temperature in the winter is 48 degrees Fahrenheit.
Economy
Alameda has a diverse economy, with a mix of industries including retail, manufacturing, healthcare, and technology. The city is home to several major employers, including the Alameda Naval Air Station, the Alameda County Medical Center, and the Alameda Unified School District.
The city also has a thriving tourism industry, with attractions such as the USS Hornet Museum, the Alameda Beach, and the Alameda Point Antiques Faire.
Demographics
As of the 2010 census, Alameda had a population of 79,928. The racial makeup of the city was 57.2% White, 18.3% Asian, 14.2% Hispanic or Latino, 8.2% African American, and 0.7% Native American.
The median household income in Alameda was $76,837, and the median family income was $90,945. The per capita income was $37,845. The city had a poverty rate of 8.3%.
Conclusion
Alameda is a vibrant and diverse city located in the San Francisco Bay Area of California. The city has a rich history, and has experienced periods of growth and decline throughout its history. Today, Alameda is a thriving city, with a diverse economy and a strong sense of community. The city has a population of 79,928, and is home to several major employers. Alameda is a great place to live, work, and visit.
Common Questions
What is Per Capita Income in Alameda?
Per Capita income in Alameda is $68,122.
What is the Median Family Income in Alameda?
Median Family Income in Alameda is $163,118.
What is the Median Household income in Alameda?
Median Household Income in Alameda is $129,917.
What is Income or Wage Gap in Alameda?
Income or Wage Gap in Alameda is 17.3%.
Women in Alameda earn 82.7 cents for every dollar earned by a man.
What is Family Income Deficit in Alameda?
Family Income Deficit in Alameda is $10,107.
Families that are below poverty line in Alameda earn $10,107 less on average than the poverty threshold level.
What is Inequality or Gini Index in Alameda?
Inequality or Gini Index in Alameda is 0.46.
What is the Total Population of Alameda?
Total Population of Alameda is 77,565.
What is the Total Male Population of Alameda?
Total Male Population of Alameda is 37,967.
What is the Total Female Population of Alameda?
Total Female Population of Alameda is 39,598.
What is the Ratio of Males per 100 Females in Alameda?
There are 95.88 Males per 100 Females in Alameda.
What is the Ratio of Females per 100 Males in Alameda?
There are 104.30 Females per 100 Males in Alameda.
What is the Median Population Age in Alameda?
Median Population Age in Alameda is 40.6 Years.
What is the Average Family Size in Alameda
Average Family Size in Alameda is 3.2 People.
What is the Average Household Size in Alameda
Average Household Size in Alameda is 2.6 People.
How Large is the Labor Force in Alameda?
There are 42,746 People in the Labor Forcein in Alameda.
What is the Percentage of People in the Labor Force in Alameda?
68.2% of People are in the Labor Force in Alameda.
What is the Unemployment Rate in Alameda?
Unemployment Rate in Alameda is 5.1%.