Cities with the Largest Black / African American Community in Missouri
RELATED REPORTS & OPTIONS
Black / African American
Missouri
Compare Cities
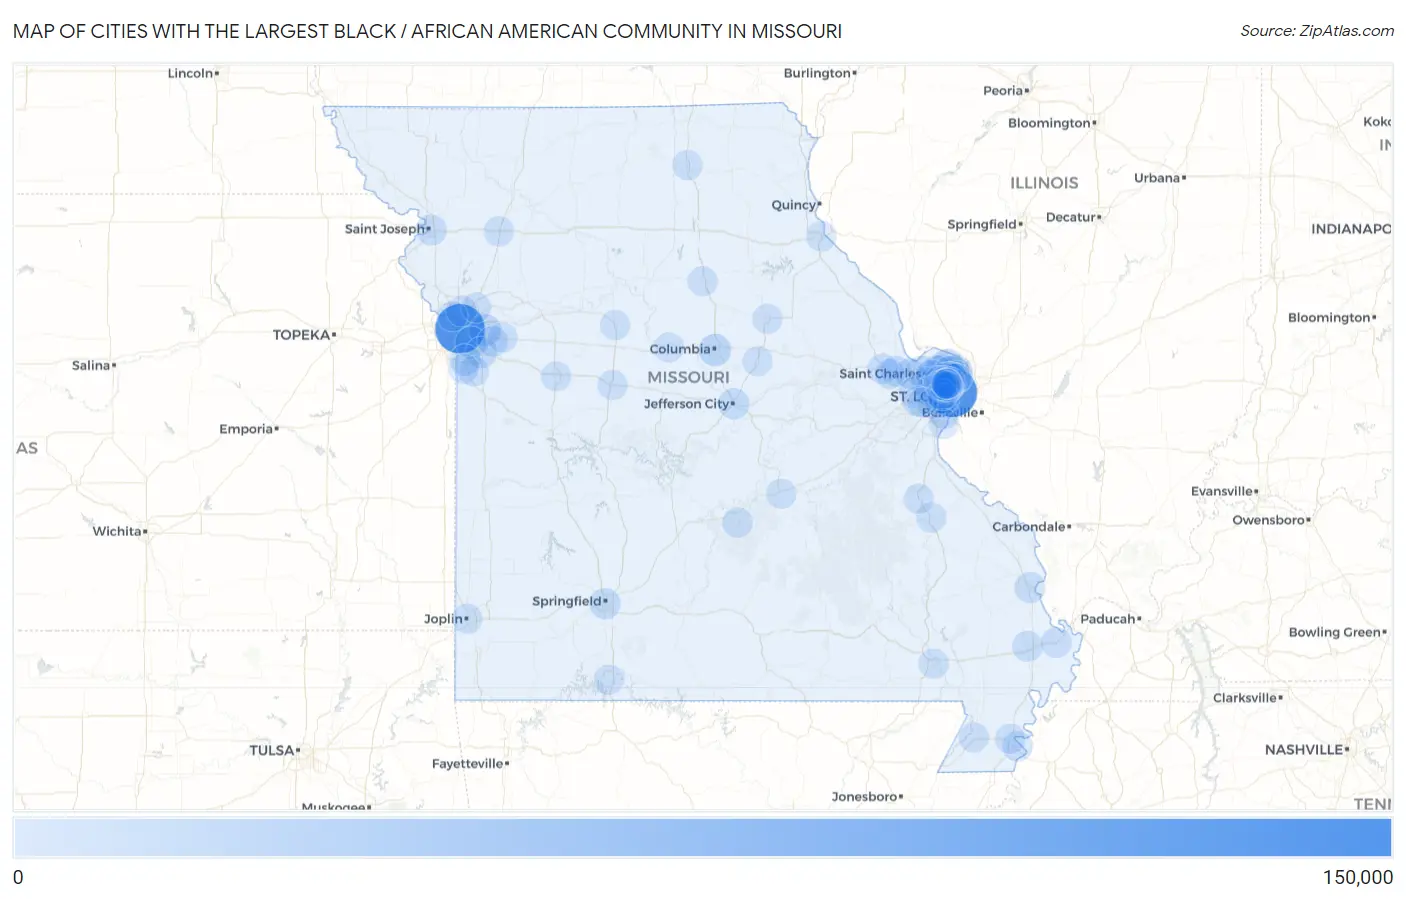
Map of Cities with the Largest Black / African American Community in Missouri
0
150,000
Cities with the Largest Black / African American Community in Missouri
| City | Black / African American | vs State | vs National | |
| 1. | Kansas City | 132,741 | 693,892(19.13%)#1 | 41,288,572(0.32%)#25 |
| 2. | St Louis | 130,753 | 693,892(18.84%)#2 | 41,288,572(0.32%)#27 |
| 3. | Florissant | 21,258 | 693,892(3.06%)#3 | 41,288,572(0.05%)#245 |
| 4. | Spanish Lake | 14,762 | 693,892(2.13%)#4 | 41,288,572(0.04%)#358 |
| 5. | Columbia | 14,111 | 693,892(2.03%)#5 | 41,288,572(0.03%)#373 |
| 6. | Independence | 13,337 | 693,892(1.92%)#6 | 41,288,572(0.03%)#394 |
| 7. | Ferguson | 13,292 | 693,892(1.92%)#7 | 41,288,572(0.03%)#399 |
| 8. | Old Jamestown | 13,168 | 693,892(1.90%)#8 | 41,288,572(0.03%)#407 |
| 9. | Raytown | 11,726 | 693,892(1.69%)#9 | 41,288,572(0.03%)#468 |
| 10. | Jennings | 11,566 | 693,892(1.67%)#10 | 41,288,572(0.03%)#476 |
| 11. | University City | 11,137 | 693,892(1.61%)#11 | 41,288,572(0.03%)#492 |
| 12. | Hazelwood | 10,130 | 693,892(1.46%)#12 | 41,288,572(0.02%)#552 |
| 13. | Lee S Summit | 9,103 | 693,892(1.31%)#13 | 41,288,572(0.02%)#617 |
| 14. | Grandview | 8,598 | 693,892(1.24%)#14 | 41,288,572(0.02%)#652 |
| 15. | Bellefontaine Neighbors | 8,535 | 693,892(1.23%)#15 | 41,288,572(0.02%)#655 |
| 16. | Jefferson City | 7,788 | 693,892(1.12%)#16 | 41,288,572(0.02%)#726 |
| 17. | Springfield | 7,252 | 693,892(1.05%)#17 | 41,288,572(0.02%)#774 |
| 18. | Berkeley | 7,035 | 693,892(1.01%)#18 | 41,288,572(0.02%)#790 |
| 19. | Cape Girardeau | 5,473 | 693,892(0.79%)#19 | 41,288,572(0.01%)#981 |
| 20. | Black Jack | 5,318 | 693,892(0.77%)#20 | 41,288,572(0.01%)#1,003 |
| 21. | St Charles | 5,141 | 693,892(0.74%)#21 | 41,288,572(0.01%)#1,030 |
| 22. | St Joseph | 4,928 | 693,892(0.71%)#22 | 41,288,572(0.01%)#1,070 |
| 23. | Glasgow Village | 4,739 | 693,892(0.68%)#23 | 41,288,572(0.01%)#1,102 |
| 24. | O Fallon | 4,554 | 693,892(0.66%)#24 | 41,288,572(0.01%)#1,144 |
| 25. | Maryland Heights | 4,271 | 693,892(0.62%)#25 | 41,288,572(0.01%)#1,208 |
| 26. | Dellwood | 4,080 | 693,892(0.59%)#26 | 41,288,572(0.01%)#1,258 |
| 27. | Sikeston | 4,013 | 693,892(0.58%)#27 | 41,288,572(0.01%)#1,283 |
| 28. | St Ann | 4,012 | 693,892(0.58%)#28 | 41,288,572(0.01%)#1,285 |
| 29. | Blue Springs | 3,955 | 693,892(0.57%)#29 | 41,288,572(0.01%)#1,301 |
| 30. | Overland | 3,521 | 693,892(0.51%)#30 | 41,288,572(0.01%)#1,417 |
| 31. | Northwoods | 3,365 | 693,892(0.48%)#31 | 41,288,572(0.01%)#1,467 |
| 32. | Normandy | 3,067 | 693,892(0.44%)#32 | 41,288,572(0.01%)#1,591 |
| 33. | St Peters | 3,038 | 693,892(0.44%)#33 | 41,288,572(0.01%)#1,605 |
| 34. | Fort Leonard Wood | 2,751 | 693,892(0.40%)#34 | 41,288,572(0.01%)#1,719 |
| 35. | Charleston | 2,716 | 693,892(0.39%)#35 | 41,288,572(0.01%)#1,729 |
| 36. | Castle Point | 2,684 | 693,892(0.39%)#36 | 41,288,572(0.01%)#1,750 |
| 37. | Wentzville | 2,676 | 693,892(0.39%)#37 | 41,288,572(0.01%)#1,754 |
| 38. | Pine Lawn | 2,647 | 693,892(0.38%)#38 | 41,288,572(0.01%)#1,772 |
| 39. | Moline Acres | 2,641 | 693,892(0.38%)#39 | 41,288,572(0.01%)#1,776 |
| 40. | St John | 2,552 | 693,892(0.37%)#40 | 41,288,572(0.01%)#1,829 |
| 41. | Bridgeton | 2,441 | 693,892(0.35%)#41 | 41,288,572(0.01%)#1,901 |
| 42. | Pagedale | 2,426 | 693,892(0.35%)#42 | 41,288,572(0.01%)#1,910 |
| 43. | Raymore | 2,395 | 693,892(0.35%)#43 | 41,288,572(0.01%)#1,929 |
| 44. | Gladstone | 2,263 | 693,892(0.33%)#44 | 41,288,572(0.01%)#2,009 |
| 45. | Riverview | 2,171 | 693,892(0.31%)#45 | 41,288,572(0.01%)#2,072 |
| 46. | Bel Ridge | 2,158 | 693,892(0.31%)#46 | 41,288,572(0.01%)#2,083 |
| 47. | Caruthersville | 2,116 | 693,892(0.30%)#47 | 41,288,572(0.01%)#2,123 |
| 48. | Olivette | 1,948 | 693,892(0.28%)#48 | 41,288,572(0.00%)#2,264 |
| 49. | Creve Coeur | 1,866 | 693,892(0.27%)#49 | 41,288,572(0.00%)#2,335 |
| 50. | Wellston | 1,769 | 693,892(0.25%)#50 | 41,288,572(0.00%)#2,411 |
| 51. | Chesterfield | 1,692 | 693,892(0.24%)#51 | 41,288,572(0.00%)#2,467 |
| 52. | Mehlville | 1,600 | 693,892(0.23%)#52 | 41,288,572(0.00%)#2,555 |
| 53. | Poplar Bluff | 1,582 | 693,892(0.23%)#53 | 41,288,572(0.00%)#2,576 |
| 54. | Belton | 1,516 | 693,892(0.22%)#54 | 41,288,572(0.00%)#2,649 |
| 55. | Clayton | 1,488 | 693,892(0.21%)#55 | 41,288,572(0.00%)#2,692 |
| 56. | Kennett | 1,466 | 693,892(0.21%)#56 | 41,288,572(0.00%)#2,709 |
| 57. | Joplin | 1,458 | 693,892(0.21%)#57 | 41,288,572(0.00%)#2,724 |
| 58. | Liberty | 1,376 | 693,892(0.20%)#58 | 41,288,572(0.00%)#2,832 |
| 59. | Flordell Hills | 1,338 | 693,892(0.19%)#59 | 41,288,572(0.00%)#2,873 |
| 60. | Hannibal | 1,294 | 693,892(0.19%)#60 | 41,288,572(0.00%)#2,931 |
| 61. | Kirkwood | 1,292 | 693,892(0.19%)#61 | 41,288,572(0.00%)#2,938 |
| 62. | Hanley Hills | 1,280 | 693,892(0.18%)#62 | 41,288,572(0.00%)#2,952 |
| 63. | Breckenridge Hills | 1,219 | 693,892(0.18%)#63 | 41,288,572(0.00%)#3,022 |
| 64. | Vinita Park | 1,211 | 693,892(0.17%)#64 | 41,288,572(0.00%)#3,044 |
| 65. | Rock Hill | 1,209 | 693,892(0.17%)#65 | 41,288,572(0.00%)#3,047 |
| 66. | Velda City | 1,196 | 693,892(0.17%)#66 | 41,288,572(0.00%)#3,062 |
| 67. | Fulton | 1,190 | 693,892(0.17%)#67 | 41,288,572(0.00%)#3,070 |
| 68. | Moberly | 1,183 | 693,892(0.17%)#68 | 41,288,572(0.00%)#3,079 |
| 69. | Woodson Terrace | 1,066 | 693,892(0.15%)#69 | 41,288,572(0.00%)#3,299 |
| 70. | Country Club Hills | 1,066 | 693,892(0.15%)#70 | 41,288,572(0.00%)#3,300 |
| 71. | Cool Valley | 1,048 | 693,892(0.15%)#71 | 41,288,572(0.00%)#3,341 |
| 72. | Hillsdale | 1,044 | 693,892(0.15%)#72 | 41,288,572(0.00%)#3,348 |
| 73. | Farmington | 1,040 | 693,892(0.15%)#73 | 41,288,572(0.00%)#3,356 |
| 74. | Kirksville | 1,031 | 693,892(0.15%)#74 | 41,288,572(0.00%)#3,370 |
| 75. | Marshall | 999 | 693,892(0.14%)#75 | 41,288,572(0.00%)#3,431 |
| 76. | Sedalia | 968 | 693,892(0.14%)#76 | 41,288,572(0.00%)#3,488 |
| 77. | Webster Groves | 958 | 693,892(0.14%)#77 | 41,288,572(0.00%)#3,509 |
| 78. | Cameron | 947 | 693,892(0.14%)#78 | 41,288,572(0.00%)#3,532 |
| 79. | Maplewood | 899 | 693,892(0.13%)#79 | 41,288,572(0.00%)#3,631 |
| 80. | Warrensburg | 875 | 693,892(0.13%)#80 | 41,288,572(0.00%)#3,687 |
| 81. | Pasadena Hills | 856 | 693,892(0.12%)#81 | 41,288,572(0.00%)#3,740 |
| 82. | Velda Village Hills | 836 | 693,892(0.12%)#82 | 41,288,572(0.00%)#3,789 |
| 83. | Bonne Terre | 793 | 693,892(0.11%)#83 | 41,288,572(0.00%)#3,909 |
| 84. | Oakville | 769 | 693,892(0.11%)#84 | 41,288,572(0.00%)#3,968 |
| 85. | Rolla | 767 | 693,892(0.11%)#85 | 41,288,572(0.00%)#3,972 |
| 86. | Lake St Louis | 751 | 693,892(0.11%)#86 | 41,288,572(0.00%)#3,997 |
| 87. | Branson | 745 | 693,892(0.11%)#87 | 41,288,572(0.00%)#4,020 |
| 88. | Boonville | 743 | 693,892(0.11%)#88 | 41,288,572(0.00%)#4,030 |
| 89. | Hayti | 729 | 693,892(0.11%)#89 | 41,288,572(0.00%)#4,069 |
| 90. | Riverside | 703 | 693,892(0.10%)#90 | 41,288,572(0.00%)#4,139 |
| 91. | Richmond Heights | 683 | 693,892(0.10%)#91 | 41,288,572(0.00%)#4,207 |
| 92. | Greendale | 681 | 693,892(0.10%)#92 | 41,288,572(0.00%)#4,216 |
| 93. | Mexico | 668 | 693,892(0.10%)#93 | 41,288,572(0.00%)#4,253 |
| 94. | Ballwin | 652 | 693,892(0.09%)#94 | 41,288,572(0.00%)#4,302 |
| 95. | Charlack | 634 | 693,892(0.09%)#95 | 41,288,572(0.00%)#4,368 |
| 96. | Bel Nor | 632 | 693,892(0.09%)#96 | 41,288,572(0.00%)#4,371 |
| 97. | Norwood Court | 611 | 693,892(0.09%)#97 | 41,288,572(0.00%)#4,443 |
| 98. | Grain Valley | 609 | 693,892(0.09%)#98 | 41,288,572(0.00%)#4,448 |
| 99. | Pasadena Park | 599 | 693,892(0.09%)#99 | 41,288,572(0.00%)#4,496 |
| 100. | Manchester | 597 | 693,892(0.09%)#100 | 41,288,572(0.00%)#4,504 |
Common Questions
What are the Top 10 Cities with the Largest Black / African American Community in Missouri?
Top 10 Cities with the Largest Black / African American Community in Missouri are:
#1
132,741
#2
130,753
#3
21,258
#4
14,762
#5
14,111
#6
13,337
#7
13,292
#8
13,168
#9
11,726
#10
11,566
What city has the Largest Black / African American Community in Missouri?
Kansas City has the Largest Black / African American Community in Missouri with 132,741.
What is the Total Black / African American Population in the State of Missouri?
Total Black / African American Population in Missouri is 693,892.
What is the Total Black / African American Population in the United States?
Total Black / African American Population in the United States is 41,288,572.