Castro Valley, CA Map & Demographics
Castro Valley Map
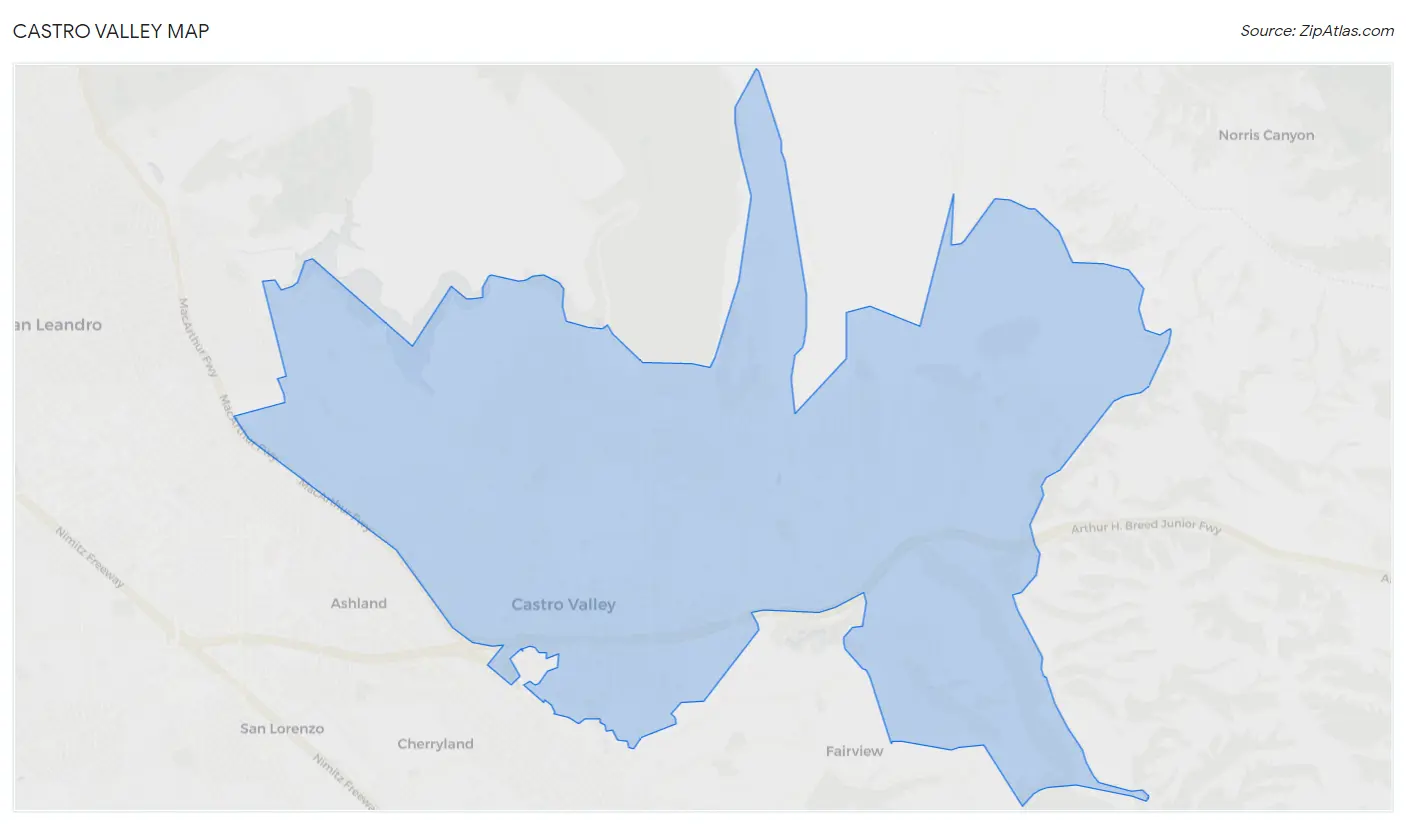
Castro Valley Overview
$56,942
PER CAPITA INCOME
$153,183
AVG FAMILY INCOME
$132,174
AVG HOUSEHOLD INCOME
22.0%
WAGE / INCOME GAP [ % ]
78.0¢/ $1
WAGE / INCOME GAP [ $ ]
$8,704
FAMILY INCOME DEFICIT
0.42
INEQUALITY / GINI INDEX
65,444
TOTAL POPULATION
31,629
MALE POPULATION
33,815
FEMALE POPULATION
93.54
MALES / 100 FEMALES
106.91
FEMALES / 100 MALES
42.7
MEDIAN AGE
3.3
AVG FAMILY SIZE
2.9
AVG HOUSEHOLD SIZE
34,472
LABOR FORCE [ PEOPLE ]
64.6%
PERCENT IN LABOR FORCE
3.9%
UNEMPLOYMENT RATE
Castro Valley Area Codes
Income in Castro Valley
Income Overview in Castro Valley
Per Capita Income in Castro Valley is $56,942, while median incomes of families and households are $153,183 and $132,174 respectively.
| Characteristic | Number | Measure |
| Per Capita Income | 65,444 | $56,942 |
| Median Family Income | 16,623 | $153,183 |
| Mean Family Income | 16,623 | $183,476 |
| Median Household Income | 22,117 | $132,174 |
| Mean Household Income | 22,117 | $163,067 |
| Income Deficit | 16,623 | $8,704 |
| Wage / Income Gap (%) | 65,444 | 21.96% |
| Wage / Income Gap ($) | 65,444 | 78.04¢ per $1 |
| Gini / Inequality Index | 65,444 | 0.42 |
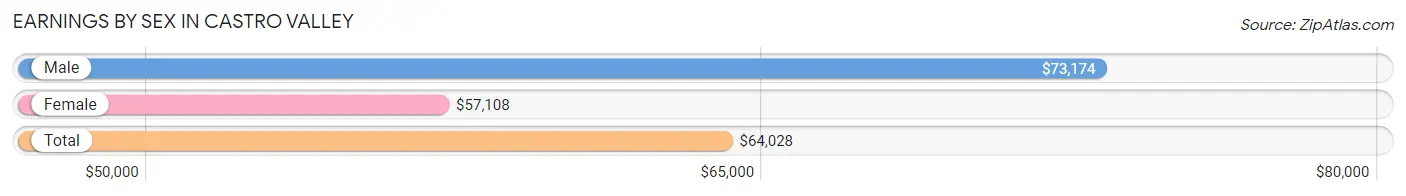
Earnings by Sex in Castro Valley
Average Earnings in Castro Valley are $64,028, $73,174 for men and $57,108 for women, a difference of 22.0%.
| Sex | Number | Average Earnings |
| Male | 18,098 (50.8%) | $73,174 |
| Female | 17,533 (49.2%) | $57,108 |
| Total | 35,631 (100.0%) | $64,028 |
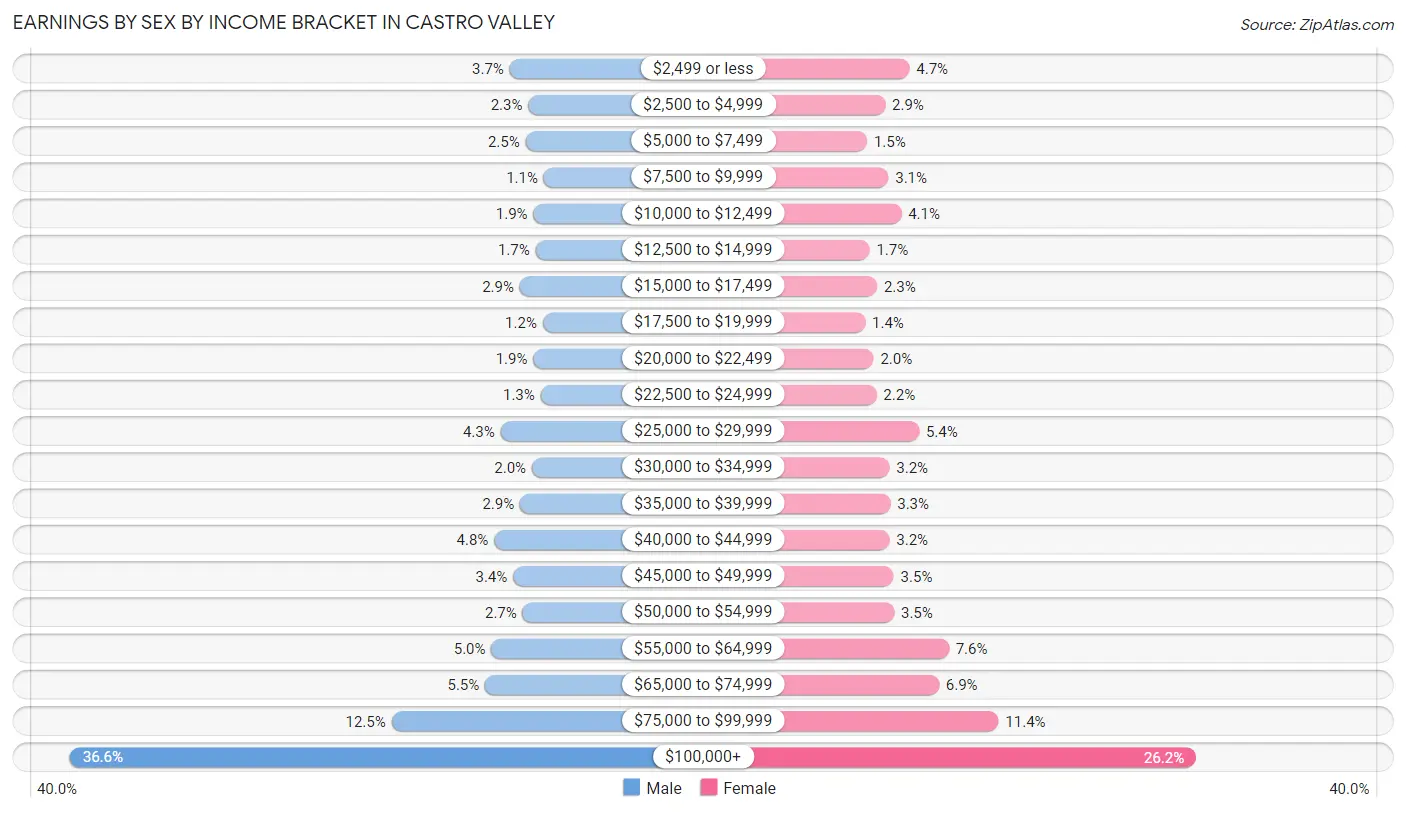
Earnings by Sex by Income Bracket in Castro Valley
The most common earnings brackets in Castro Valley are $100,000+ for men (6,626 | 36.6%) and $100,000+ for women (4,588 | 26.2%).
| Income | Male | Female |
| $2,499 or less | 661 (3.6%) | 822 (4.7%) |
| $2,500 to $4,999 | 407 (2.2%) | 503 (2.9%) |
| $5,000 to $7,499 | 446 (2.5%) | 264 (1.5%) |
| $7,500 to $9,999 | 197 (1.1%) | 546 (3.1%) |
| $10,000 to $12,499 | 339 (1.9%) | 715 (4.1%) |
| $12,500 to $14,999 | 309 (1.7%) | 298 (1.7%) |
| $15,000 to $17,499 | 523 (2.9%) | 397 (2.3%) |
| $17,500 to $19,999 | 212 (1.2%) | 241 (1.4%) |
| $20,000 to $22,499 | 341 (1.9%) | 351 (2.0%) |
| $22,500 to $24,999 | 241 (1.3%) | 390 (2.2%) |
| $25,000 to $29,999 | 783 (4.3%) | 948 (5.4%) |
| $30,000 to $34,999 | 359 (2.0%) | 560 (3.2%) |
| $35,000 to $39,999 | 520 (2.9%) | 572 (3.3%) |
| $40,000 to $44,999 | 871 (4.8%) | 560 (3.2%) |
| $45,000 to $49,999 | 613 (3.4%) | 616 (3.5%) |
| $50,000 to $54,999 | 485 (2.7%) | 621 (3.5%) |
| $55,000 to $64,999 | 908 (5.0%) | 1,340 (7.6%) |
| $65,000 to $74,999 | 994 (5.5%) | 1,209 (6.9%) |
| $75,000 to $99,999 | 2,263 (12.5%) | 1,992 (11.4%) |
| $100,000+ | 6,626 (36.6%) | 4,588 (26.2%) |
| Total | 18,098 (100.0%) | 17,533 (100.0%) |
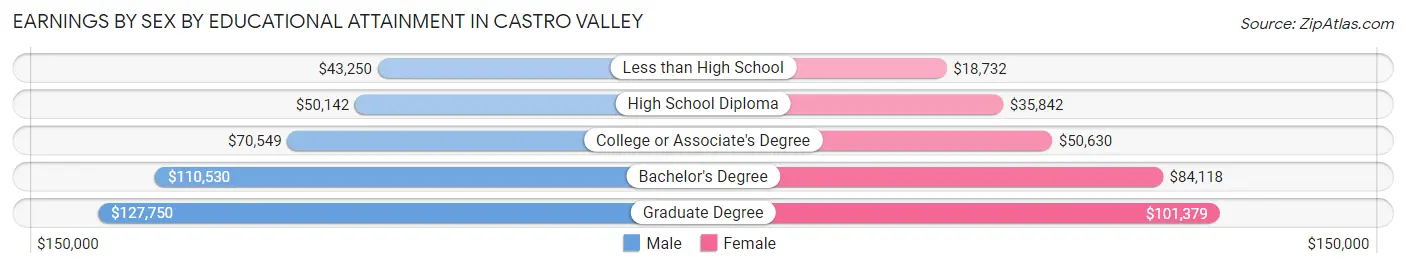
Earnings by Sex by Educational Attainment in Castro Valley
Average earnings in Castro Valley are $82,813 for men and $62,814 for women, a difference of 24.1%. Men with an educational attainment of graduate degree enjoy the highest average annual earnings of $127,750, while those with less than high school education earn the least with $43,250. Women with an educational attainment of graduate degree earn the most with the average annual earnings of $101,379, while those with less than high school education have the smallest earnings of $18,732.
| Educational Attainment | Male Income | Female Income |
| Less than High School | $43,250 | $18,732 |
| High School Diploma | $50,142 | $35,842 |
| College or Associate's Degree | $70,549 | $50,630 |
| Bachelor's Degree | $110,530 | $84,118 |
| Graduate Degree | $127,750 | $101,379 |
| Total | $82,813 | $62,814 |
Family Income in Castro Valley
Family Income Brackets in Castro Valley
According to the Castro Valley family income data, there are 6,001 families falling into the $200,000+ income range, which is the most common income bracket and makes up 36.1% of all families. Conversely, the $10,000 to $14,999 income bracket is the least frequent group with only 116 families (0.7%) belonging to this category.
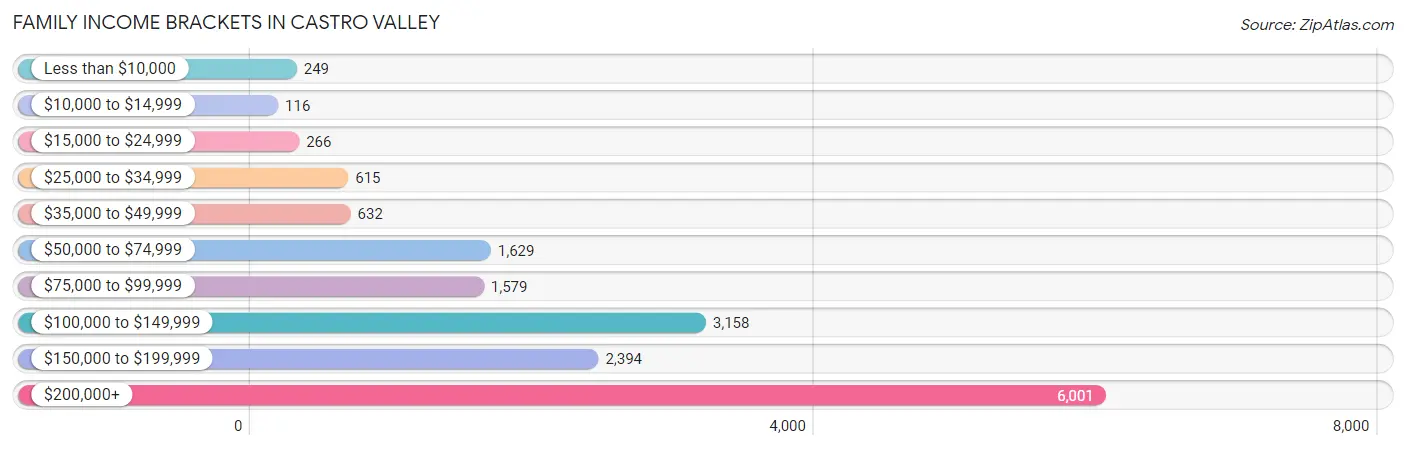
| Income Bracket | # Families | % Families |
| Less than $10,000 | 249 | 1.5% |
| $10,000 to $14,999 | 116 | 0.7% |
| $15,000 to $24,999 | 266 | 1.6% |
| $25,000 to $34,999 | 615 | 3.7% |
| $35,000 to $49,999 | 632 | 3.8% |
| $50,000 to $74,999 | 1,629 | 9.8% |
| $75,000 to $99,999 | 1,579 | 9.5% |
| $100,000 to $149,999 | 3,158 | 19.0% |
| $150,000 to $199,999 | 2,394 | 14.4% |
| $200,000+ | 6,001 | 36.1% |
Family Income by Famaliy Size in Castro Valley
5-person families (1,428 | 8.6%) account for the highest median family income in Castro Valley with $182,461 per family, while 2-person families (6,662 | 40.1%) have the highest median income of $63,804 per family member.
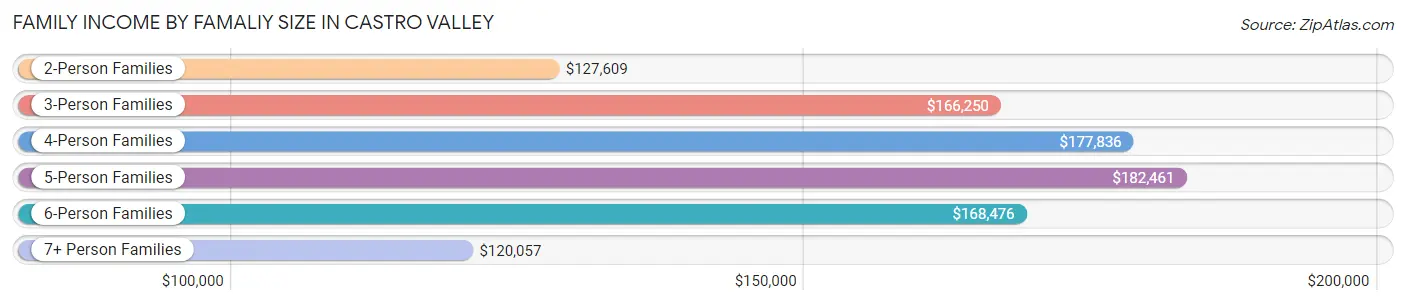
| Income Bracket | # Families | Median Income |
| 2-Person Families | 6,662 (40.1%) | $127,609 |
| 3-Person Families | 3,781 (22.8%) | $166,250 |
| 4-Person Families | 3,863 (23.2%) | $177,836 |
| 5-Person Families | 1,428 (8.6%) | $182,461 |
| 6-Person Families | 736 (4.4%) | $168,476 |
| 7+ Person Families | 153 (0.9%) | $120,057 |
| Total | 16,623 (100.0%) | $153,183 |
Family Income by Number of Earners in Castro Valley
The median family income in Castro Valley is $153,183, with families comprising 3+ earners (2,663) having the highest median family income of $208,051, while families with no earners (1,956) have the lowest median family income of $77,203, accounting for 16.0% and 11.8% of families, respectively.
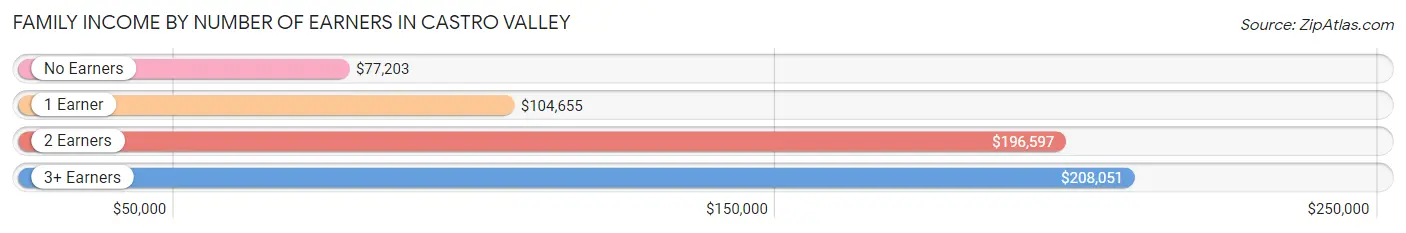
| Number of Earners | # Families | Median Income |
| No Earners | 1,956 (11.8%) | $77,203 |
| 1 Earner | 4,394 (26.4%) | $104,655 |
| 2 Earners | 7,610 (45.8%) | $196,597 |
| 3+ Earners | 2,663 (16.0%) | $208,051 |
| Total | 16,623 (100.0%) | $153,183 |
Household Income in Castro Valley
Household Income Brackets in Castro Valley
With 6,679 households falling in the category, the $200,000+ income range is the most frequent in Castro Valley, accounting for 30.2% of all households. In contrast, only 288 households (1.3%) fall into the $10,000 to $14,999 income bracket, making it the least populous group.
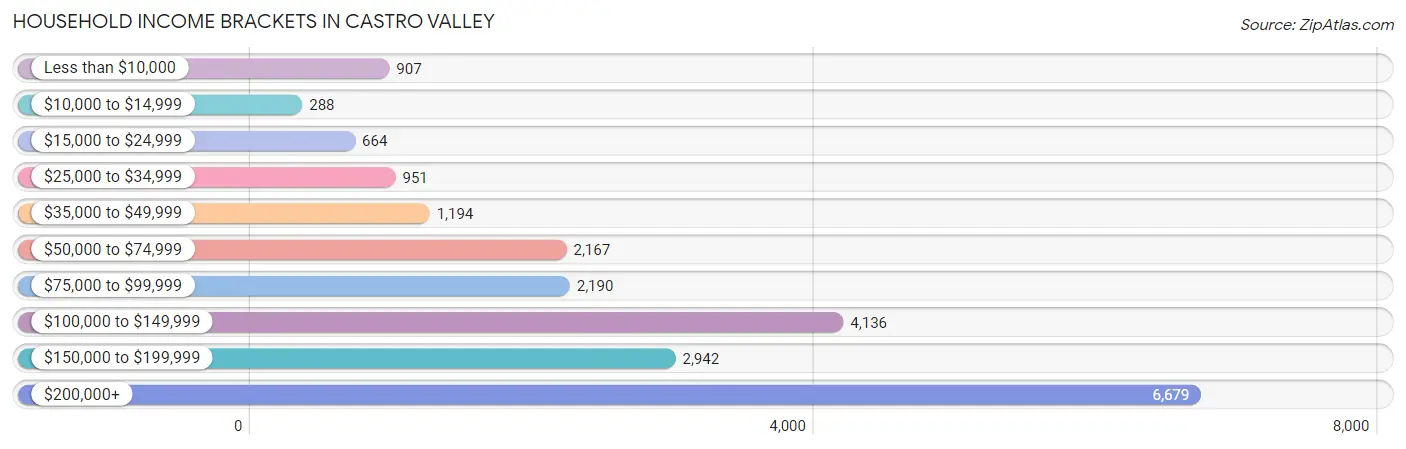
| Income Bracket | # Households | % Households |
| Less than $10,000 | 907 | 4.1% |
| $10,000 to $14,999 | 288 | 1.3% |
| $15,000 to $24,999 | 664 | 3.0% |
| $25,000 to $34,999 | 951 | 4.3% |
| $35,000 to $49,999 | 1,194 | 5.4% |
| $50,000 to $74,999 | 2,167 | 9.8% |
| $75,000 to $99,999 | 2,190 | 9.9% |
| $100,000 to $149,999 | 4,136 | 18.7% |
| $150,000 to $199,999 | 2,942 | 13.3% |
| $200,000+ | 6,679 | 30.2% |
Household Income by Householder Age in Castro Valley
The median household income in Castro Valley is $132,174, with the highest median household income of $149,279 found in the 25 to 44 years age bracket for the primary householder. A total of 6,637 households (30.0%) fall into this category. Meanwhile, the 15 to 24 years age bracket for the primary householder has the lowest median household income of $0, with 144 households (0.6%) in this group.
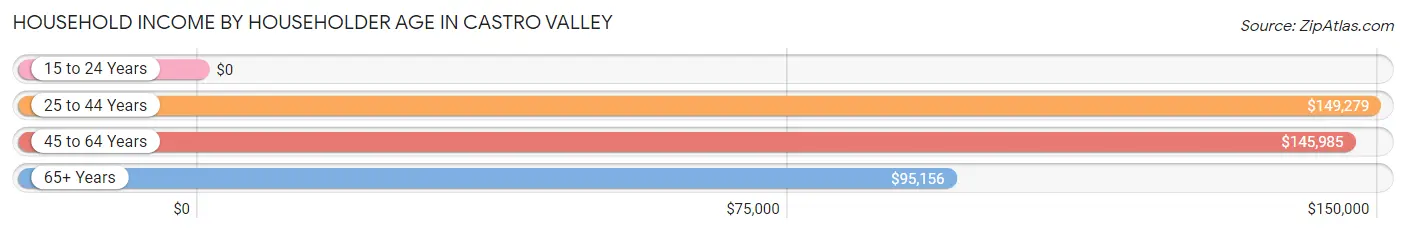
| Income Bracket | # Households | Median Income |
| 15 to 24 Years | 144 (0.6%) | $0 |
| 25 to 44 Years | 6,637 (30.0%) | $149,279 |
| 45 to 64 Years | 9,170 (41.5%) | $145,985 |
| 65+ Years | 6,166 (27.9%) | $95,156 |
| Total | 22,117 (100.0%) | $132,174 |
Poverty in Castro Valley
Income Below Poverty by Sex and Age in Castro Valley
With 6.5% poverty level for males and 7.7% for females among the residents of Castro Valley, 15 year old males and 65 to 74 year old females are the most vulnerable to poverty, with 101 males (14.9%) and 445 females (12.6%) in their respective age groups living below the poverty level.
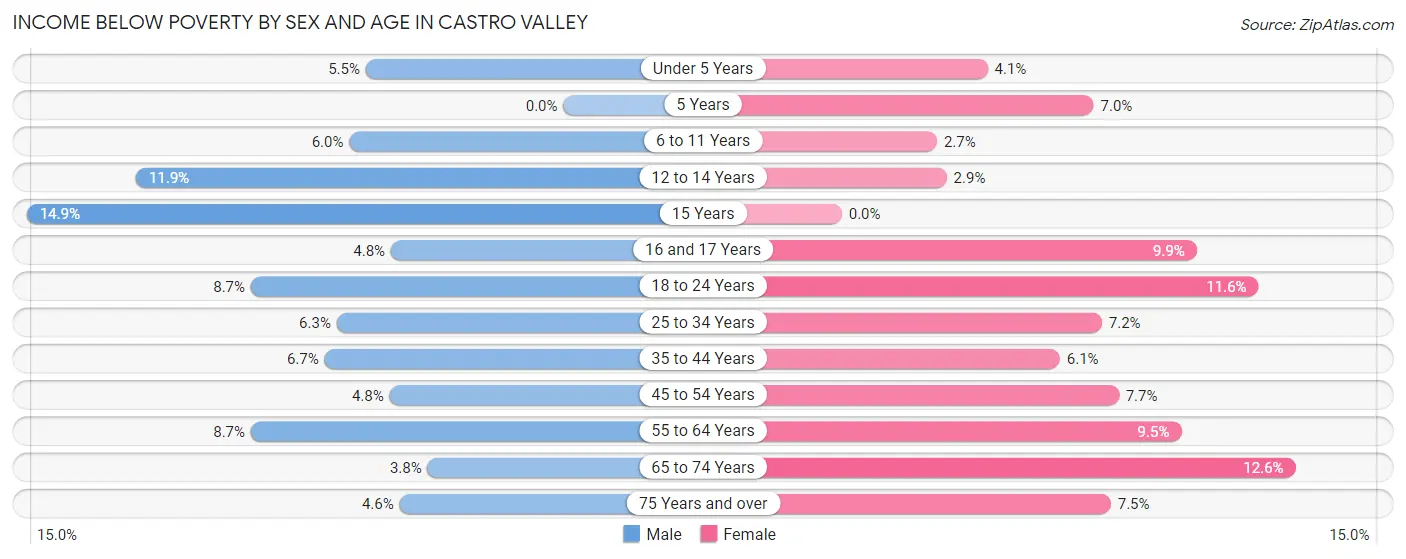
| Age Bracket | Male | Female |
| Under 5 Years | 81 (5.5%) | 64 (4.1%) |
| 5 Years | 0 (0.0%) | 30 (7.0%) |
| 6 to 11 Years | 148 (6.0%) | 64 (2.6%) |
| 12 to 14 Years | 150 (11.9%) | 29 (2.9%) |
| 15 Years | 101 (14.9%) | 0 (0.0%) |
| 16 and 17 Years | 38 (4.8%) | 98 (9.9%) |
| 18 to 24 Years | 152 (8.7%) | 204 (11.6%) |
| 25 to 34 Years | 211 (6.3%) | 289 (7.2%) |
| 35 to 44 Years | 322 (6.7%) | 314 (6.1%) |
| 45 to 54 Years | 206 (4.8%) | 357 (7.7%) |
| 55 to 64 Years | 401 (8.7%) | 472 (9.5%) |
| 65 to 74 Years | 138 (3.8%) | 445 (12.6%) |
| 75 Years and over | 80 (4.6%) | 197 (7.5%) |
| Total | 2,028 (6.5%) | 2,563 (7.7%) |
Income Above Poverty by Sex and Age in Castro Valley
According to the poverty statistics in Castro Valley, males aged 5 years and females aged 15 years are the age groups that are most secure financially, with 100.0% of males and 100.0% of females in these age groups living above the poverty line.
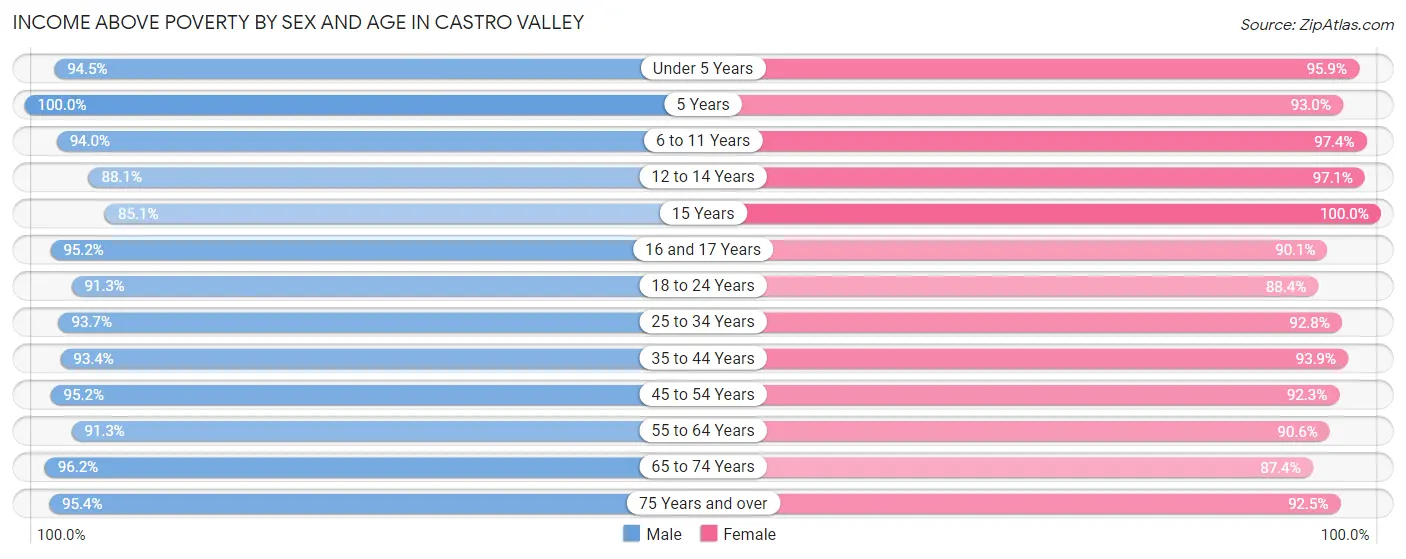
| Age Bracket | Male | Female |
| Under 5 Years | 1,392 (94.5%) | 1,514 (95.9%) |
| 5 Years | 376 (100.0%) | 398 (93.0%) |
| 6 to 11 Years | 2,334 (94.0%) | 2,348 (97.4%) |
| 12 to 14 Years | 1,110 (88.1%) | 963 (97.1%) |
| 15 Years | 575 (85.1%) | 325 (100.0%) |
| 16 and 17 Years | 753 (95.2%) | 894 (90.1%) |
| 18 to 24 Years | 1,596 (91.3%) | 1,554 (88.4%) |
| 25 to 34 Years | 3,134 (93.7%) | 3,700 (92.8%) |
| 35 to 44 Years | 4,523 (93.3%) | 4,862 (93.9%) |
| 45 to 54 Years | 4,048 (95.2%) | 4,273 (92.3%) |
| 55 to 64 Years | 4,210 (91.3%) | 4,525 (90.5%) |
| 65 to 74 Years | 3,516 (96.2%) | 3,079 (87.4%) |
| 75 Years and over | 1,675 (95.4%) | 2,432 (92.5%) |
| Total | 29,242 (93.5%) | 30,867 (92.3%) |
Income Below Poverty Among Married-Couple Families in Castro Valley
The poverty statistics for married-couple families in Castro Valley show that 3.0% or 399 of the total 13,180 families live below the poverty line. Families with 1 or 2 children have the highest poverty rate of 3.5%, comprising of 180 families. On the other hand, families with 5 or more children have the lowest poverty rate of 0.0%, which includes 0 families.
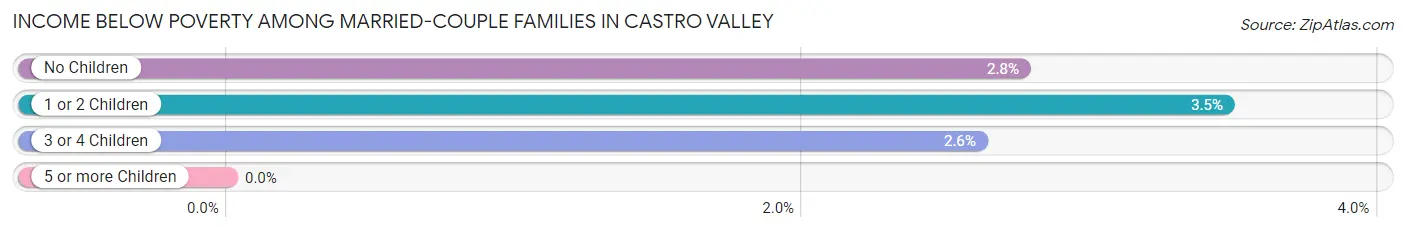
| Children | Above Poverty | Below Poverty |
| No Children | 7,073 (97.2%) | 201 (2.8%) |
| 1 or 2 Children | 5,006 (96.5%) | 180 (3.5%) |
| 3 or 4 Children | 672 (97.4%) | 18 (2.6%) |
| 5 or more Children | 30 (100.0%) | 0 (0.0%) |
| Total | 12,781 (97.0%) | 399 (3.0%) |
Income Below Poverty Among Single-Parent Households in Castro Valley
According to the poverty data in Castro Valley, 7.0% or 75 single-father households and 10.6% or 252 single-mother households are living below the poverty line. Among single-father households, those with 1 or 2 children have the highest poverty rate, with 60 households (12.4%) experiencing poverty. Likewise, among single-mother households, those with 3 or 4 children have the highest poverty rate, with 49 households (46.7%) falling below the poverty line.
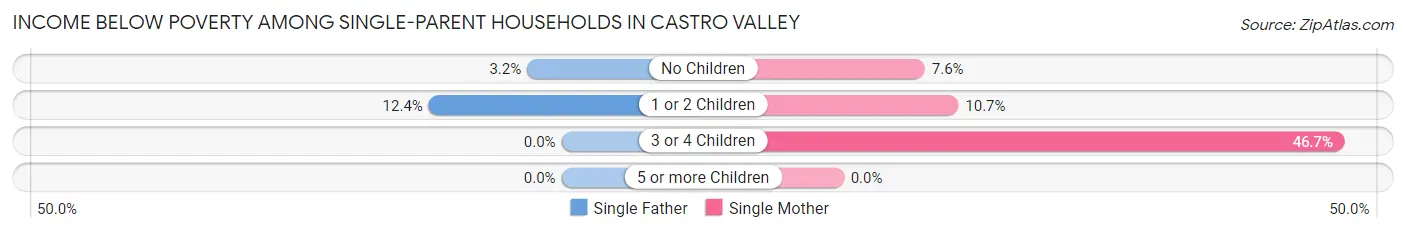
| Children | Single Father | Single Mother |
| No Children | 15 (3.2%) | 81 (7.6%) |
| 1 or 2 Children | 60 (12.4%) | 122 (10.7%) |
| 3 or 4 Children | 0 (0.0%) | 49 (46.7%) |
| 5 or more Children | 0 (0.0%) | 0 (0.0%) |
| Total | 75 (7.0%) | 252 (10.6%) |
Income Below Poverty Among Married-Couple vs Single-Parent Households in Castro Valley
The poverty data for Castro Valley shows that 399 of the married-couple family households (3.0%) and 327 of the single-parent households (9.5%) are living below the poverty level. Within the married-couple family households, those with 1 or 2 children have the highest poverty rate, with 180 households (3.5%) falling below the poverty line. Among the single-parent households, those with 3 or 4 children have the highest poverty rate, with 49 household (22.3%) living below poverty.
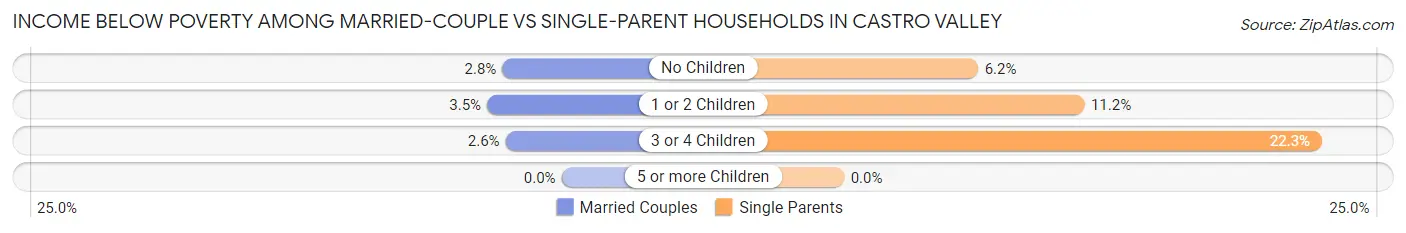
| Children | Married-Couple Families | Single-Parent Households |
| No Children | 201 (2.8%) | 96 (6.2%) |
| 1 or 2 Children | 180 (3.5%) | 182 (11.2%) |
| 3 or 4 Children | 18 (2.6%) | 49 (22.3%) |
| 5 or more Children | 0 (0.0%) | 0 (0.0%) |
| Total | 399 (3.0%) | 327 (9.5%) |
Race in Castro Valley
The most populous races in Castro Valley are White / Caucasian (27,746 | 42.4%), Asian (20,731 | 31.7%), and Hispanic or Latino (11,175 | 17.1%).
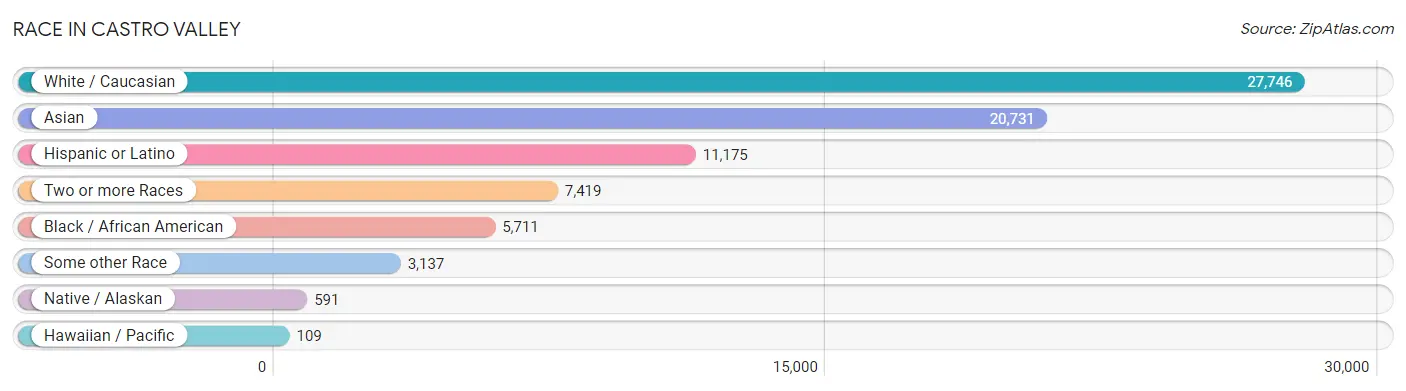
| Race | # Population | % Population |
| Asian | 20,731 | 31.7% |
| Black / African American | 5,711 | 8.7% |
| Hawaiian / Pacific | 109 | 0.2% |
| Hispanic or Latino | 11,175 | 17.1% |
| Native / Alaskan | 591 | 0.9% |
| White / Caucasian | 27,746 | 42.4% |
| Two or more Races | 7,419 | 11.3% |
| Some other Race | 3,137 | 4.8% |
| Total | 65,444 | 100.0% |
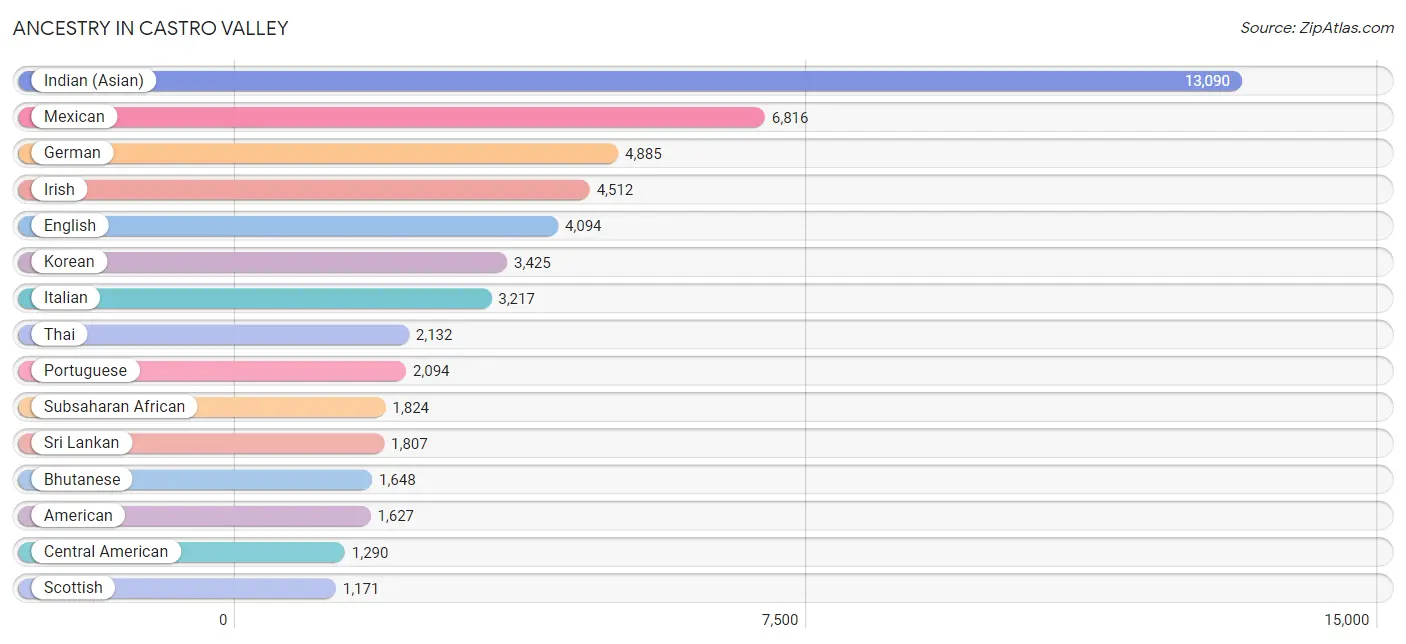
Ancestry in Castro Valley
The most populous ancestries reported in Castro Valley are Indian (Asian) (13,090 | 20.0%), Mexican (6,816 | 10.4%), German (4,885 | 7.5%), Irish (4,512 | 6.9%), and English (4,094 | 6.3%), together accounting for 51.0% of all Castro Valley residents.
| Ancestry | # Population | % Population |
| Afghan | 33 | 0.1% |
| African | 165 | 0.3% |
| American | 1,627 | 2.5% |
| Apache | 101 | 0.2% |
| Arab | 838 | 1.3% |
| Argentinean | 123 | 0.2% |
| Armenian | 38 | 0.1% |
| Assyrian / Chaldean / Syriac | 87 | 0.1% |
| Australian | 5 | 0.0% |
| Austrian | 156 | 0.2% |
| Bangladeshi | 34 | 0.1% |
| Basque | 36 | 0.1% |
| Belgian | 117 | 0.2% |
| Bhutanese | 1,648 | 2.5% |
| Brazilian | 45 | 0.1% |
| British | 616 | 0.9% |
| Burmese | 1,087 | 1.7% |
| Canadian | 21 | 0.0% |
| Central American | 1,290 | 2.0% |
| Central American Indian | 82 | 0.1% |
| Cherokee | 281 | 0.4% |
| Cheyenne | 1 | 0.0% |
| Chickasaw | 2 | 0.0% |
| Chilean | 10 | 0.0% |
| Choctaw | 114 | 0.2% |
| Colombian | 123 | 0.2% |
| Comanche | 40 | 0.1% |
| Costa Rican | 98 | 0.2% |
| Croatian | 186 | 0.3% |
| Cuban | 70 | 0.1% |
| Czech | 99 | 0.2% |
| Czechoslovakian | 10 | 0.0% |
| Danish | 284 | 0.4% |
| Dominican | 10 | 0.0% |
| Dutch | 368 | 0.6% |
| Eastern European | 118 | 0.2% |
| Ecuadorian | 26 | 0.0% |
| Egyptian | 224 | 0.3% |
| English | 4,094 | 6.3% |
| Estonian | 8 | 0.0% |
| Ethiopian | 301 | 0.5% |
| European | 943 | 1.4% |
| Filipino | 359 | 0.5% |
| Finnish | 126 | 0.2% |
| French | 1,126 | 1.7% |
| French Canadian | 102 | 0.2% |
| German | 4,885 | 7.5% |
| Ghanaian | 111 | 0.2% |
| Greek | 733 | 1.1% |
| Guamanian / Chamorro | 181 | 0.3% |
| Guatemalan | 262 | 0.4% |
| Hopi | 1 | 0.0% |
| Hungarian | 87 | 0.1% |
| Icelander | 25 | 0.0% |
| Indian (Asian) | 13,090 | 20.0% |
| Inupiat | 17 | 0.0% |
| Iranian | 261 | 0.4% |
| Irish | 4,512 | 6.9% |
| Italian | 3,217 | 4.9% |
| Japanese | 355 | 0.5% |
| Kenyan | 75 | 0.1% |
| Korean | 3,425 | 5.2% |
| Laotian | 44 | 0.1% |
| Latvian | 16 | 0.0% |
| Lebanese | 83 | 0.1% |
| Lithuanian | 100 | 0.2% |
| Luxembourger | 20 | 0.0% |
| Malaysian | 13 | 0.0% |
| Mexican | 6,816 | 10.4% |
| Mexican American Indian | 243 | 0.4% |
| Moroccan | 29 | 0.0% |
| Native Hawaiian | 161 | 0.3% |
| Navajo | 57 | 0.1% |
| Nicaraguan | 397 | 0.6% |
| Nigerian | 934 | 1.4% |
| Northern European | 326 | 0.5% |
| Norwegian | 671 | 1.0% |
| Osage | 2 | 0.0% |
| Pakistani | 106 | 0.2% |
| Palestinian | 121 | 0.2% |
| Panamanian | 15 | 0.0% |
| Peruvian | 652 | 1.0% |
| Polish | 604 | 0.9% |
| Portuguese | 2,094 | 3.2% |
| Puerto Rican | 387 | 0.6% |
| Romanian | 208 | 0.3% |
| Russian | 838 | 1.3% |
| Salvadoran | 510 | 0.8% |
| Samoan | 211 | 0.3% |
| Scandinavian | 255 | 0.4% |
| Scotch-Irish | 238 | 0.4% |
| Scottish | 1,171 | 1.8% |
| Seminole | 35 | 0.1% |
| Serbian | 12 | 0.0% |
| Shoshone | 11 | 0.0% |
| Sierra Leonean | 96 | 0.2% |
| Sioux | 97 | 0.2% |
| Slavic | 7 | 0.0% |
| Slovene | 18 | 0.0% |
| South African | 170 | 0.3% |
| South American | 1,159 | 1.8% |
| South American Indian | 74 | 0.1% |
| Spaniard | 503 | 0.8% |
| Spanish | 545 | 0.8% |
| Spanish American | 153 | 0.2% |
| Sri Lankan | 1,807 | 2.8% |
| Subsaharan African | 1,824 | 2.8% |
| Swedish | 995 | 1.5% |
| Swiss | 179 | 0.3% |
| Syrian | 18 | 0.0% |
| Thai | 2,132 | 3.3% |
| Tohono O'Odham | 32 | 0.1% |
| Tongan | 108 | 0.2% |
| Trinidadian and Tobagonian | 11 | 0.0% |
| Turkish | 139 | 0.2% |
| Ukrainian | 337 | 0.5% |
| Uruguayan | 141 | 0.2% |
| Ute | 15 | 0.0% |
| Venezuelan | 14 | 0.0% |
| Vietnamese | 41 | 0.1% |
| Welsh | 320 | 0.5% |
| Yaqui | 8 | 0.0% |
| Yugoslavian | 117 | 0.2% | View All 123 Rows |
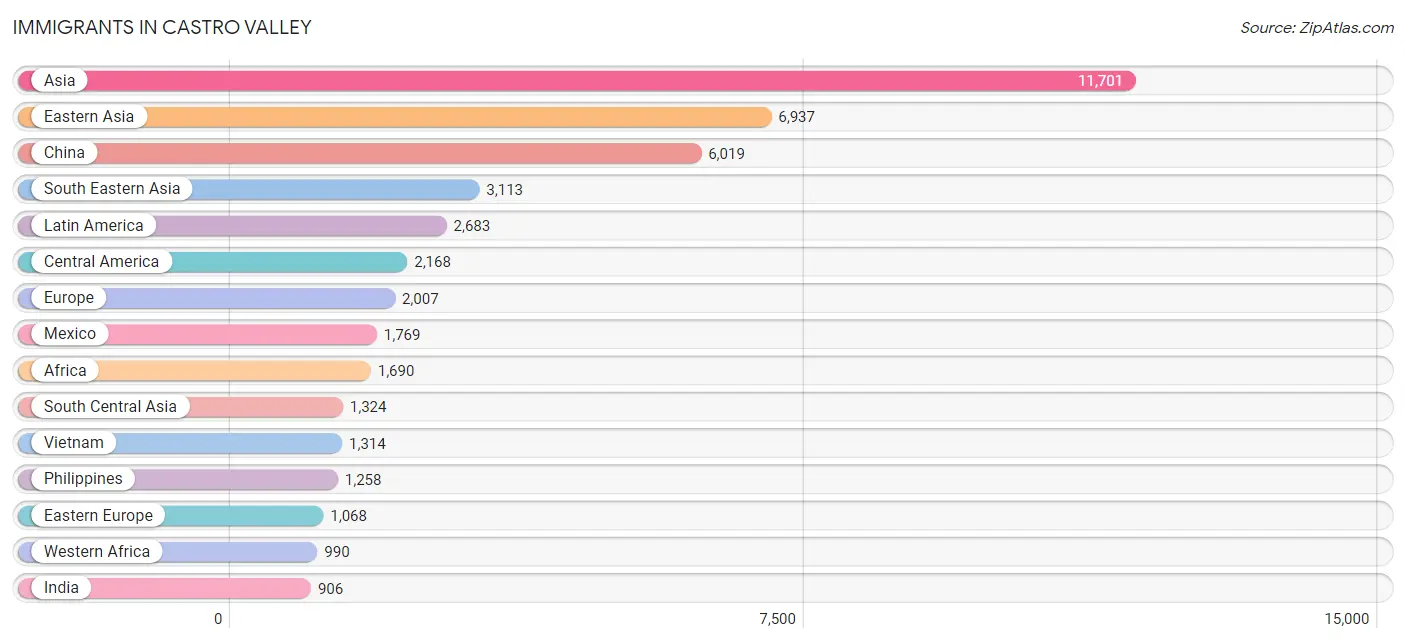
Immigrants in Castro Valley
The most numerous immigrant groups reported in Castro Valley came from Asia (11,701 | 17.9%), Eastern Asia (6,937 | 10.6%), China (6,019 | 9.2%), South Eastern Asia (3,113 | 4.8%), and Latin America (2,683 | 4.1%), together accounting for 46.5% of all Castro Valley residents.
| Immigration Origin | # Population | % Population |
| Afghanistan | 33 | 0.1% |
| Africa | 1,690 | 2.6% |
| Argentina | 13 | 0.0% |
| Armenia | 14 | 0.0% |
| Asia | 11,701 | 17.9% |
| Australia | 5 | 0.0% |
| Azores | 33 | 0.1% |
| Bangladesh | 32 | 0.1% |
| Belarus | 22 | 0.0% |
| Brazil | 28 | 0.0% |
| Bulgaria | 9 | 0.0% |
| Cambodia | 188 | 0.3% |
| Canada | 189 | 0.3% |
| Caribbean | 26 | 0.0% |
| Central America | 2,168 | 3.3% |
| China | 6,019 | 9.2% |
| Colombia | 26 | 0.0% |
| Costa Rica | 56 | 0.1% |
| Croatia | 14 | 0.0% |
| Cuba | 6 | 0.0% |
| Denmark | 5 | 0.0% |
| Dominican Republic | 5 | 0.0% |
| Eastern Africa | 324 | 0.5% |
| Eastern Asia | 6,937 | 10.6% |
| Eastern Europe | 1,068 | 1.6% |
| Ecuador | 6 | 0.0% |
| Egypt | 200 | 0.3% |
| El Salvador | 61 | 0.1% |
| England | 119 | 0.2% |
| Eritrea | 157 | 0.2% |
| Ethiopia | 59 | 0.1% |
| Europe | 2,007 | 3.1% |
| Fiji | 238 | 0.4% |
| France | 72 | 0.1% |
| Germany | 135 | 0.2% |
| Greece | 58 | 0.1% |
| Guatemala | 173 | 0.3% |
| Haiti | 1 | 0.0% |
| Hong Kong | 764 | 1.2% |
| Hungary | 9 | 0.0% |
| India | 906 | 1.4% |
| Indonesia | 45 | 0.1% |
| Iran | 142 | 0.2% |
| Iraq | 35 | 0.1% |
| Ireland | 5 | 0.0% |
| Italy | 51 | 0.1% |
| Japan | 404 | 0.6% |
| Jordan | 6 | 0.0% |
| Kazakhstan | 10 | 0.0% |
| Kenya | 101 | 0.2% |
| Korea | 514 | 0.8% |
| Kuwait | 89 | 0.1% |
| Latin America | 2,683 | 4.1% |
| Lebanon | 9 | 0.0% |
| Liberia | 23 | 0.0% |
| Malaysia | 101 | 0.2% |
| Mexico | 1,769 | 2.7% |
| Moldova | 89 | 0.1% |
| Morocco | 29 | 0.0% |
| Nepal | 97 | 0.2% |
| Netherlands | 21 | 0.0% |
| Nicaragua | 109 | 0.2% |
| Nigeria | 866 | 1.3% |
| Northern Africa | 258 | 0.4% |
| Northern Europe | 246 | 0.4% |
| Oceania | 328 | 0.5% |
| Pakistan | 73 | 0.1% |
| Peru | 291 | 0.4% |
| Philippines | 1,258 | 1.9% |
| Poland | 35 | 0.1% |
| Portugal | 349 | 0.5% |
| Romania | 92 | 0.1% |
| Russia | 202 | 0.3% |
| Sierra Leone | 75 | 0.1% |
| Singapore | 10 | 0.0% |
| South Africa | 118 | 0.2% |
| South America | 489 | 0.7% |
| South Central Asia | 1,324 | 2.0% |
| South Eastern Asia | 3,113 | 4.8% |
| Southern Europe | 465 | 0.7% |
| Spain | 7 | 0.0% |
| Sri Lanka | 25 | 0.0% |
| Taiwan | 323 | 0.5% |
| Thailand | 99 | 0.2% |
| Trinidad and Tobago | 14 | 0.0% |
| Turkey | 94 | 0.1% |
| Ukraine | 265 | 0.4% |
| Uruguay | 105 | 0.2% |
| Uzbekistan | 6 | 0.0% |
| Vietnam | 1,314 | 2.0% |
| Western Africa | 990 | 1.5% |
| Western Asia | 321 | 0.5% |
| Western Europe | 228 | 0.4% |
| Yemen | 74 | 0.1% | View All 94 Rows |
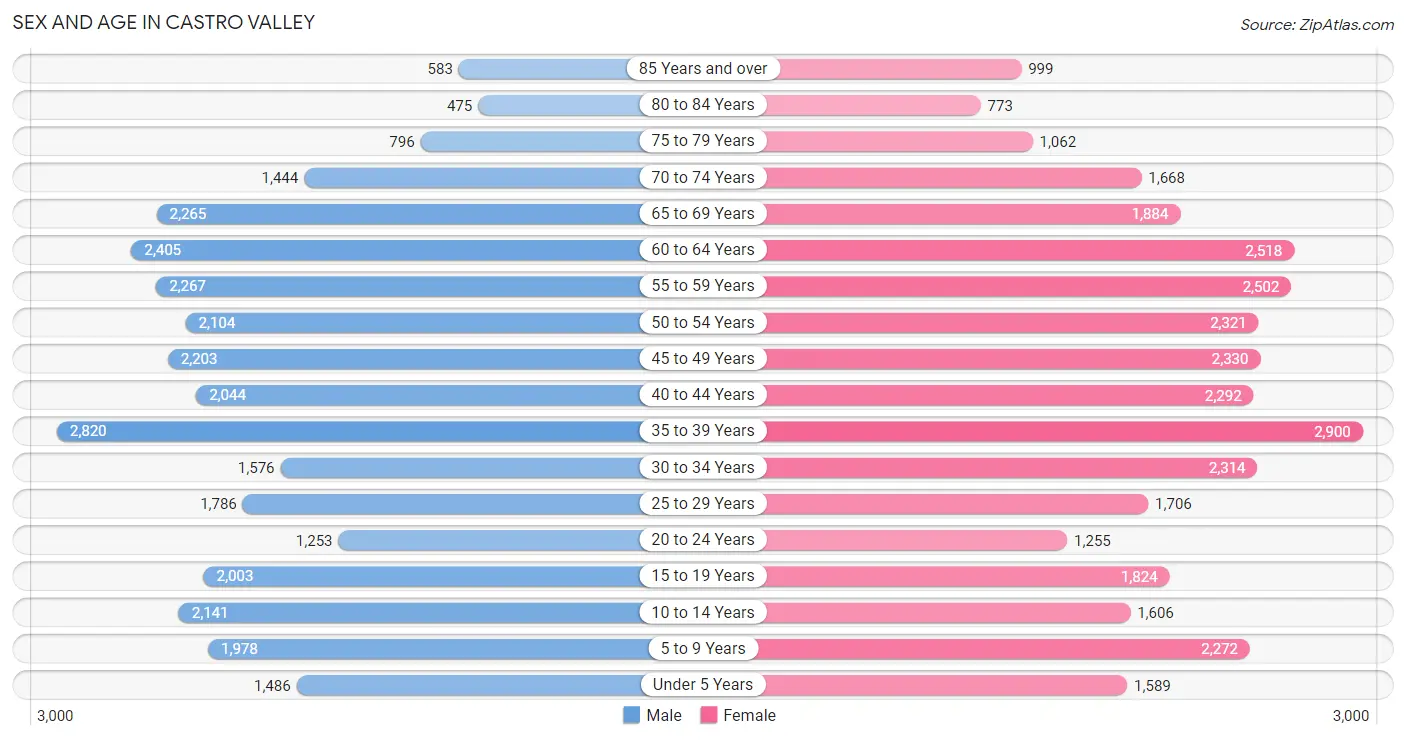
Sex and Age in Castro Valley
Sex and Age in Castro Valley
The most populous age groups in Castro Valley are 35 to 39 Years (2,820 | 8.9%) for men and 35 to 39 Years (2,900 | 8.6%) for women.
| Age Bracket | Male | Female |
| Under 5 Years | 1,486 (4.7%) | 1,589 (4.7%) |
| 5 to 9 Years | 1,978 (6.2%) | 2,272 (6.7%) |
| 10 to 14 Years | 2,141 (6.8%) | 1,606 (4.8%) |
| 15 to 19 Years | 2,003 (6.3%) | 1,824 (5.4%) |
| 20 to 24 Years | 1,253 (4.0%) | 1,255 (3.7%) |
| 25 to 29 Years | 1,786 (5.7%) | 1,706 (5.1%) |
| 30 to 34 Years | 1,576 (5.0%) | 2,314 (6.8%) |
| 35 to 39 Years | 2,820 (8.9%) | 2,900 (8.6%) |
| 40 to 44 Years | 2,044 (6.5%) | 2,292 (6.8%) |
| 45 to 49 Years | 2,203 (7.0%) | 2,330 (6.9%) |
| 50 to 54 Years | 2,104 (6.7%) | 2,321 (6.9%) |
| 55 to 59 Years | 2,267 (7.2%) | 2,502 (7.4%) |
| 60 to 64 Years | 2,405 (7.6%) | 2,518 (7.4%) |
| 65 to 69 Years | 2,265 (7.2%) | 1,884 (5.6%) |
| 70 to 74 Years | 1,444 (4.6%) | 1,668 (4.9%) |
| 75 to 79 Years | 796 (2.5%) | 1,062 (3.1%) |
| 80 to 84 Years | 475 (1.5%) | 773 (2.3%) |
| 85 Years and over | 583 (1.8%) | 999 (2.9%) |
| Total | 31,629 (100.0%) | 33,815 (100.0%) |
Families and Households in Castro Valley
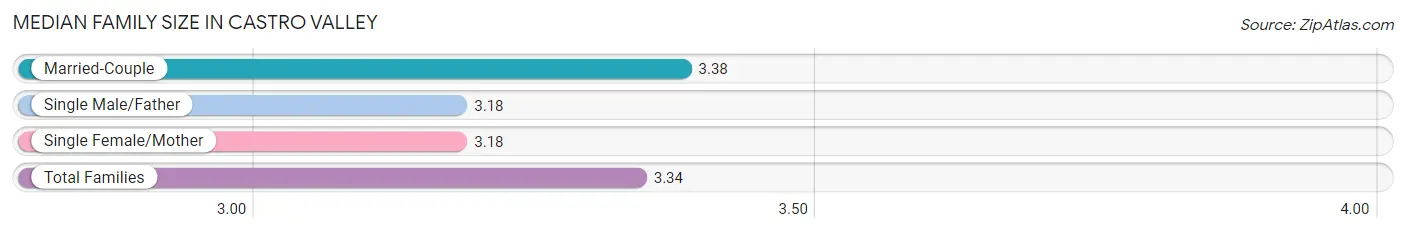
Median Family Size in Castro Valley
The median family size in Castro Valley is 3.34 persons per family, with married-couple families (13,180 | 79.3%) accounting for the largest median family size of 3.38 persons per family. On the other hand, single male/father families (1,067 | 6.4%) represent the smallest median family size with 3.18 persons per family.
| Family Type | # Families | Family Size |
| Married-Couple | 13,180 (79.3%) | 3.38 |
| Single Male/Father | 1,067 (6.4%) | 3.18 |
| Single Female/Mother | 2,376 (14.3%) | 3.18 |
| Total Families | 16,623 (100.0%) | 3.34 |
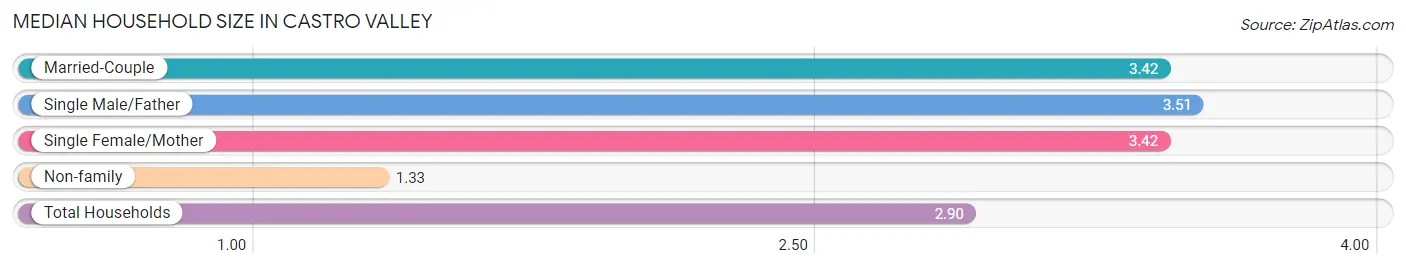
Median Household Size in Castro Valley
The median household size in Castro Valley is 2.90 persons per household, with single male/father households (1,067 | 4.8%) accounting for the largest median household size of 3.51 persons per household. non-family households (5,494 | 24.8%) represent the smallest median household size with 1.33 persons per household.
| Household Type | # Households | Household Size |
| Married-Couple | 13,180 (59.6%) | 3.42 |
| Single Male/Father | 1,067 (4.8%) | 3.51 |
| Single Female/Mother | 2,376 (10.7%) | 3.42 |
| Non-family | 5,494 (24.8%) | 1.33 |
| Total Households | 22,117 (100.0%) | 2.90 |
Household Size by Marriage Status in Castro Valley
Out of a total of 22,117 households in Castro Valley, 16,623 (75.2%) are family households, while 5,494 (24.8%) are nonfamily households. The most numerous type of family households are 2-person households, comprising 6,303, and the most common type of nonfamily households are 1-person households, comprising 4,129.
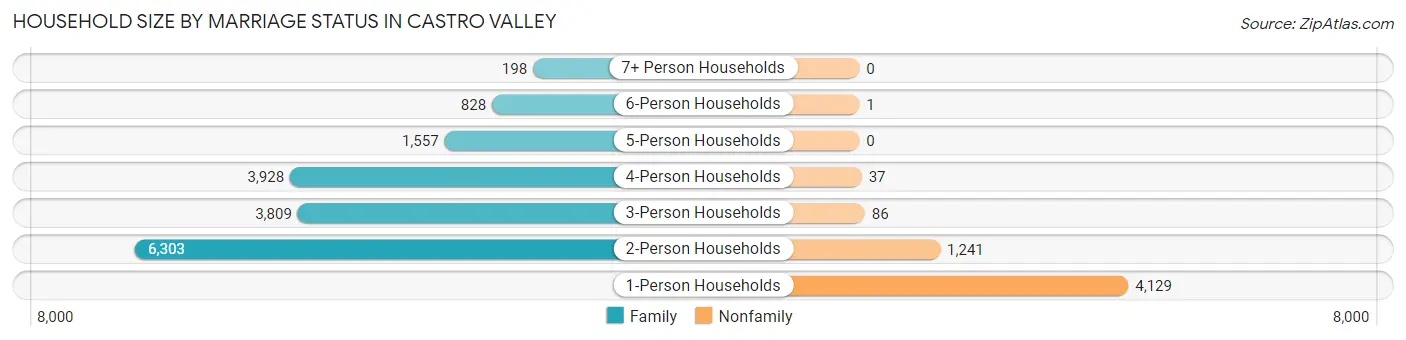
| Household Size | Family Households | Nonfamily Households |
| 1-Person Households | - | 4,129 (18.7%) |
| 2-Person Households | 6,303 (28.5%) | 1,241 (5.6%) |
| 3-Person Households | 3,809 (17.2%) | 86 (0.4%) |
| 4-Person Households | 3,928 (17.8%) | 37 (0.2%) |
| 5-Person Households | 1,557 (7.0%) | 0 (0.0%) |
| 6-Person Households | 828 (3.7%) | 1 (0.0%) |
| 7+ Person Households | 198 (0.9%) | 0 (0.0%) |
| Total | 16,623 (75.2%) | 5,494 (24.8%) |
Female Fertility in Castro Valley
Fertility by Age in Castro Valley
Average fertility rate in Castro Valley is 45.0 births per 1,000 women. Women in the age bracket of 20 to 34 years have the highest fertility rate with 64.0 births per 1,000 women. Women in the age bracket of 35 to 50 years acount for 50.9% of all women with births.
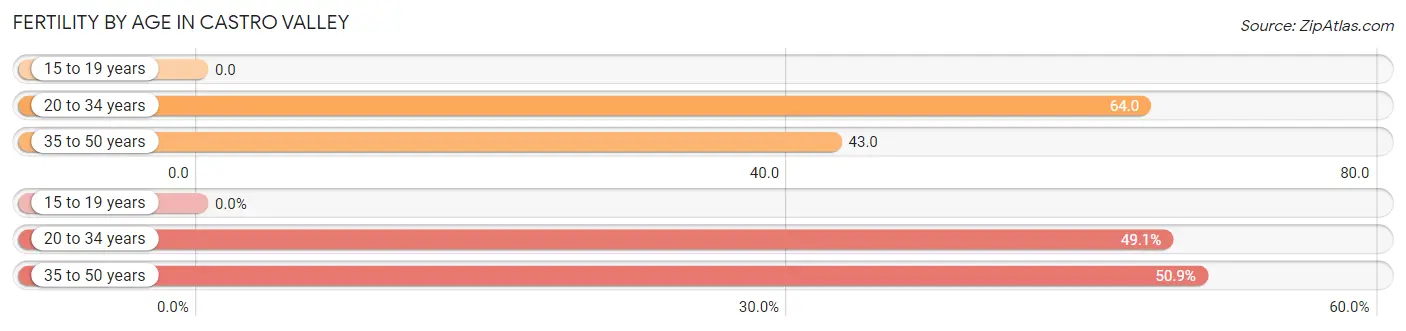
| Age Bracket | Women with Births | Births / 1,000 Women |
| 15 to 19 years | 0 (0.0%) | 0.0 |
| 20 to 34 years | 335 (49.1%) | 64.0 |
| 35 to 50 years | 347 (50.9%) | 43.0 |
| Total | 682 (100.0%) | 45.0 |
Fertility by Age by Marriage Status in Castro Valley
76.8% of women with births (682) in Castro Valley are married. The highest percentage of unmarried women with births falls into 35 to 50 years age bracket with 29.4% of them unmarried at the time of birth, while the lowest percentage of unmarried women with births belong to 20 to 34 years age bracket with 16.7% of them unmarried.
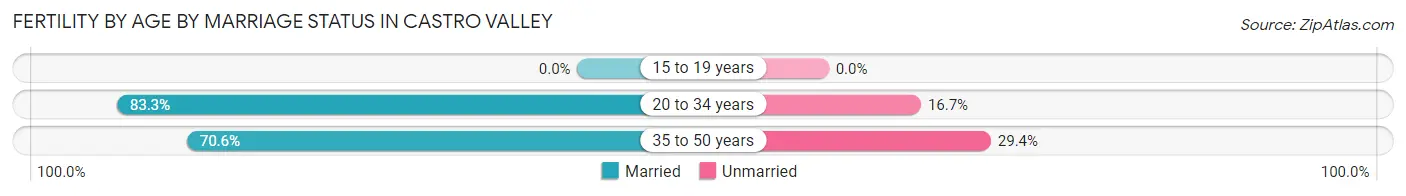
| Age Bracket | Married | Unmarried |
| 15 to 19 years | 0 (0.0%) | 0 (0.0%) |
| 20 to 34 years | 279 (83.3%) | 56 (16.7%) |
| 35 to 50 years | 245 (70.6%) | 102 (29.4%) |
| Total | 524 (76.8%) | 158 (23.2%) |
Fertility by Education in Castro Valley
Average fertility rate in Castro Valley is 45.0 births per 1,000 women. Women with the education attainment of graduate degree have the highest fertility rate of 106.0 births per 1,000 women, while women with the education attainment of less than high school have the lowest fertility at 13.0 births per 1,000 women. Women with the education attainment of graduate degree represent 36.8% of all women with births.
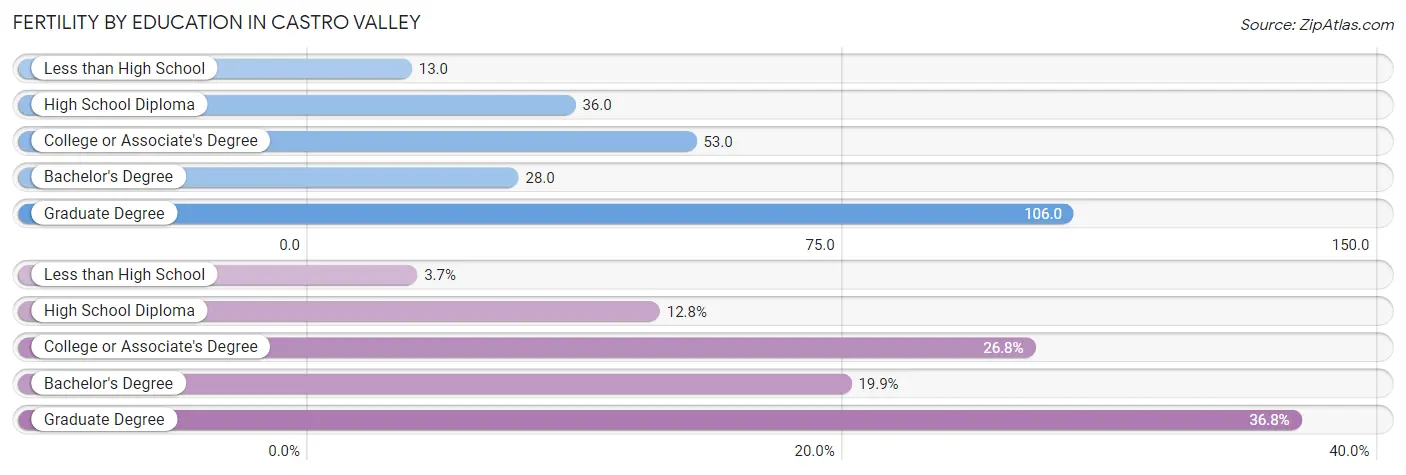
| Educational Attainment | Women with Births | Births / 1,000 Women |
| Less than High School | 25 (3.7%) | 13.0 |
| High School Diploma | 87 (12.8%) | 36.0 |
| College or Associate's Degree | 183 (26.8%) | 53.0 |
| Bachelor's Degree | 136 (19.9%) | 28.0 |
| Graduate Degree | 251 (36.8%) | 106.0 |
| Total | 682 (100.0%) | 45.0 |
Fertility by Education by Marriage Status in Castro Valley
23.2% of women with births in Castro Valley are unmarried. Women with the educational attainment of bachelor's degree are most likely to be married with 100.0% of them married at childbirth, while women with the educational attainment of high school diploma are least likely to be married with 78.2% of them unmarried at childbirth.
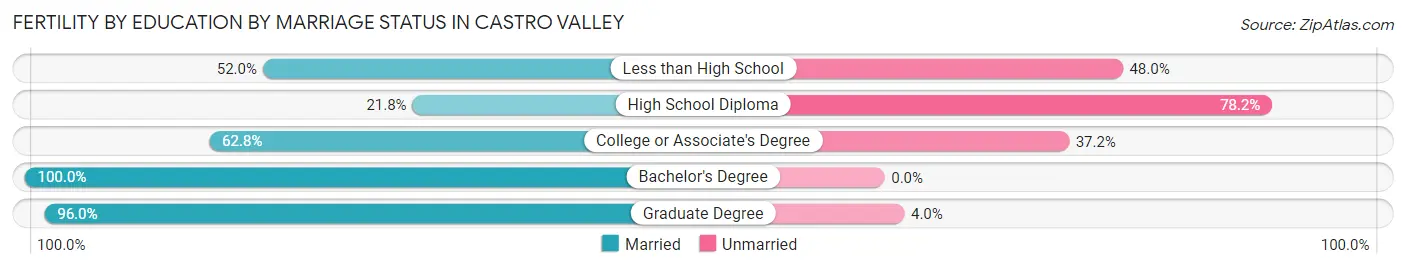
| Educational Attainment | Married | Unmarried |
| Less than High School | 13 (52.0%) | 12 (48.0%) |
| High School Diploma | 19 (21.8%) | 68 (78.2%) |
| College or Associate's Degree | 115 (62.8%) | 68 (37.2%) |
| Bachelor's Degree | 136 (100.0%) | 0 (0.0%) |
| Graduate Degree | 241 (96.0%) | 10 (4.0%) |
| Total | 524 (76.8%) | 158 (23.2%) |
Employment Characteristics in Castro Valley
Employment by Class of Employer in Castro Valley
Among the 32,225 employed individuals in Castro Valley, private company employees (21,507 | 66.7%), local government employees (3,225 | 10.0%), and not-for-profit organizations (2,529 | 7.9%) make up the most common classes of employment.
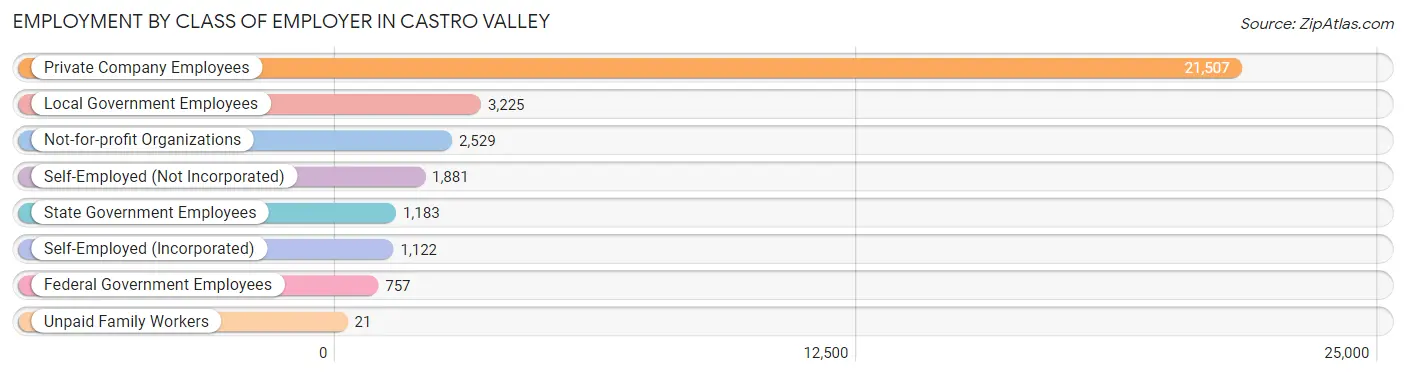
| Employer Class | # Employees | % Employees |
| Private Company Employees | 21,507 | 66.7% |
| Self-Employed (Incorporated) | 1,122 | 3.5% |
| Self-Employed (Not Incorporated) | 1,881 | 5.8% |
| Not-for-profit Organizations | 2,529 | 7.9% |
| Local Government Employees | 3,225 | 10.0% |
| State Government Employees | 1,183 | 3.7% |
| Federal Government Employees | 757 | 2.4% |
| Unpaid Family Workers | 21 | 0.1% |
| Total | 32,225 | 100.0% |
Employment Status by Age in Castro Valley
According to the labor force statistics for Castro Valley, out of the total population over 16 years of age (53,363), 64.6% or 34,472 individuals are in the labor force, with 3.9% or 1,344 of them unemployed. The age group with the highest labor force participation rate is 25 to 29 years, with 88.1% or 3,076 individuals in the labor force. Within the labor force, the 20 to 24 years age range has the highest percentage of unemployed individuals, with 9.5% or 170 of them being unemployed.
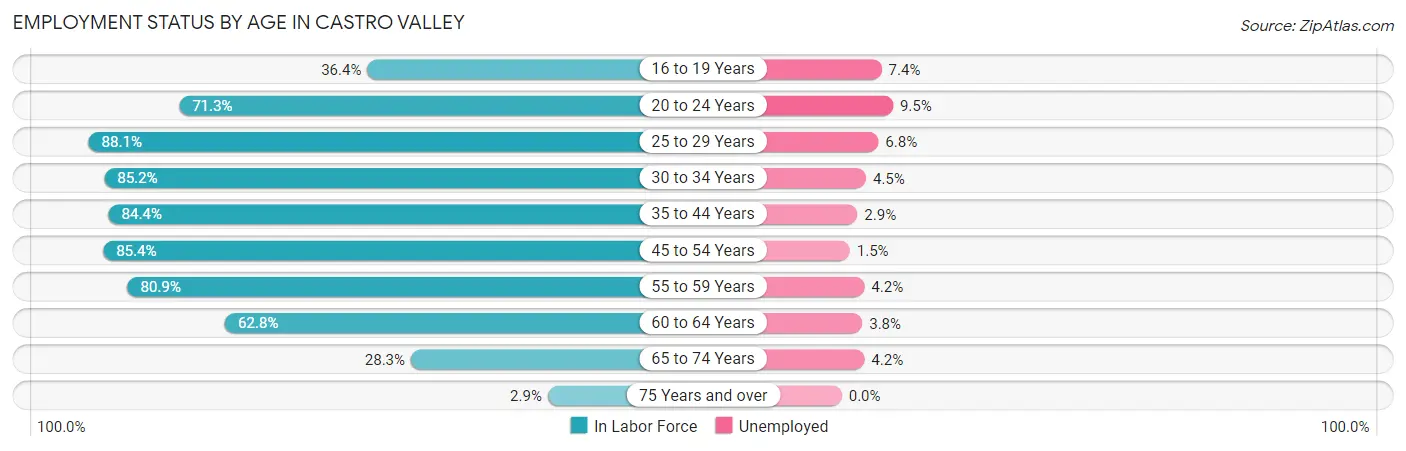
| Age Bracket | In Labor Force | Unemployed |
| 16 to 19 Years | 1,026 (36.4%) | 76 (7.4%) |
| 20 to 24 Years | 1,788 (71.3%) | 170 (9.5%) |
| 25 to 29 Years | 3,076 (88.1%) | 209 (6.8%) |
| 30 to 34 Years | 3,314 (85.2%) | 149 (4.5%) |
| 35 to 44 Years | 8,487 (84.4%) | 246 (2.9%) |
| 45 to 54 Years | 7,650 (85.4%) | 115 (1.5%) |
| 55 to 59 Years | 3,858 (80.9%) | 162 (4.2%) |
| 60 to 64 Years | 3,092 (62.8%) | 117 (3.8%) |
| 65 to 74 Years | 2,055 (28.3%) | 86 (4.2%) |
| 75 Years and over | 136 (2.9%) | 0 (0.0%) |
| Total | 34,472 (64.6%) | 1,344 (3.9%) |
Employment Status by Educational Attainment in Castro Valley
According to labor force statistics for Castro Valley, 81.7% of individuals (29,484) out of the total population between 25 and 64 years of age (36,088) are in the labor force, with 3.4% or 1,002 of them being unemployed. The group with the highest labor force participation rate are those with the educational attainment of bachelor's degree or higher, with 89.1% or 15,107 individuals in the labor force. Within the labor force, individuals with less than high school education have the highest percentage of unemployment, with 6.9% or 118 of them being unemployed.
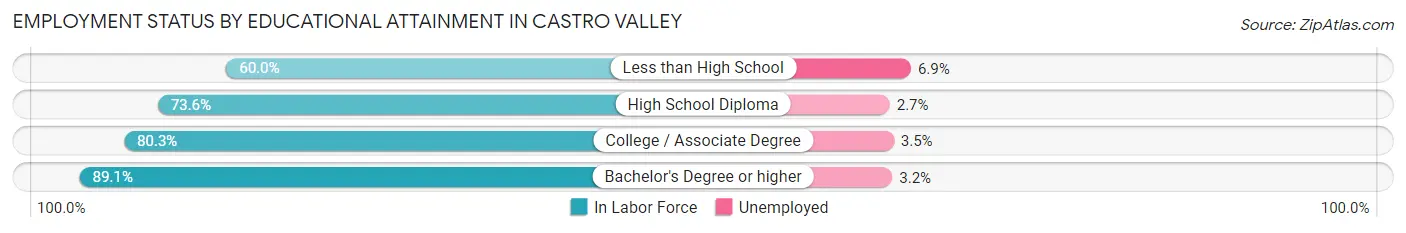
| Educational Attainment | In Labor Force | Unemployed |
| Less than High School | 1,706 (60.0%) | 196 (6.9%) |
| High School Diploma | 4,482 (73.6%) | 164 (2.7%) |
| College / Associate Degree | 8,191 (80.3%) | 357 (3.5%) |
| Bachelor's Degree or higher | 15,107 (89.1%) | 543 (3.2%) |
| Total | 29,484 (81.7%) | 1,227 (3.4%) |
Employment Occupations by Sex in Castro Valley
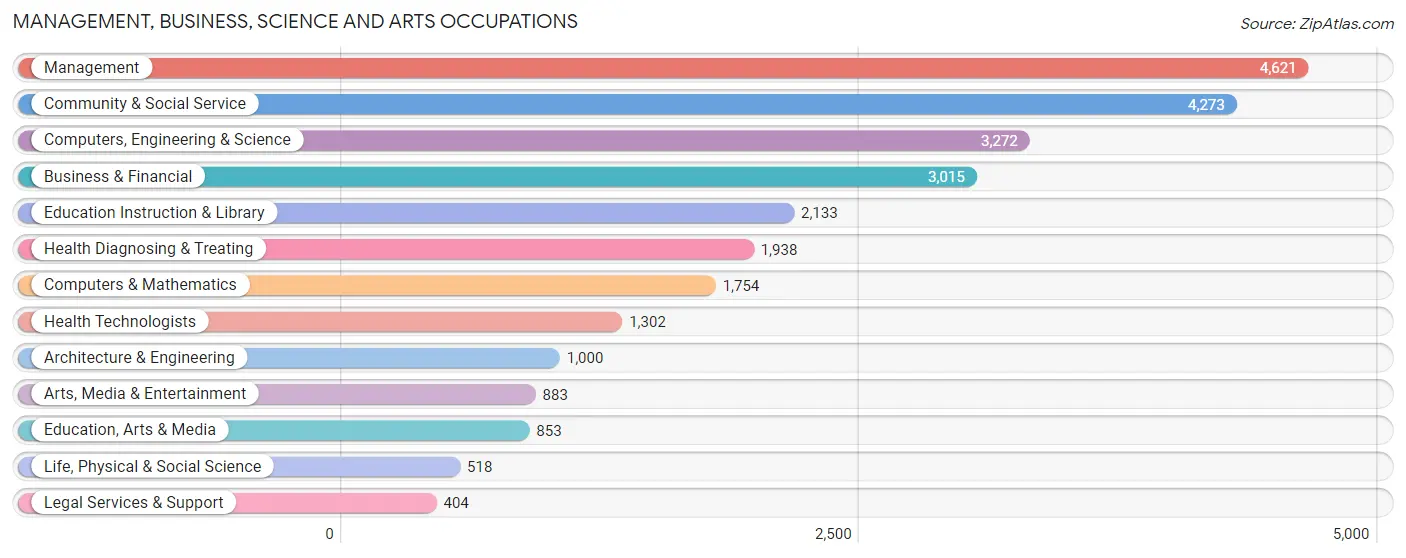
Management, Business, Science and Arts Occupations
The most common Management, Business, Science and Arts occupations in Castro Valley are Management (4,621 | 13.9%), Community & Social Service (4,273 | 12.9%), Computers, Engineering & Science (3,272 | 9.9%), Business & Financial (3,015 | 9.1%), and Education Instruction & Library (2,133 | 6.4%).
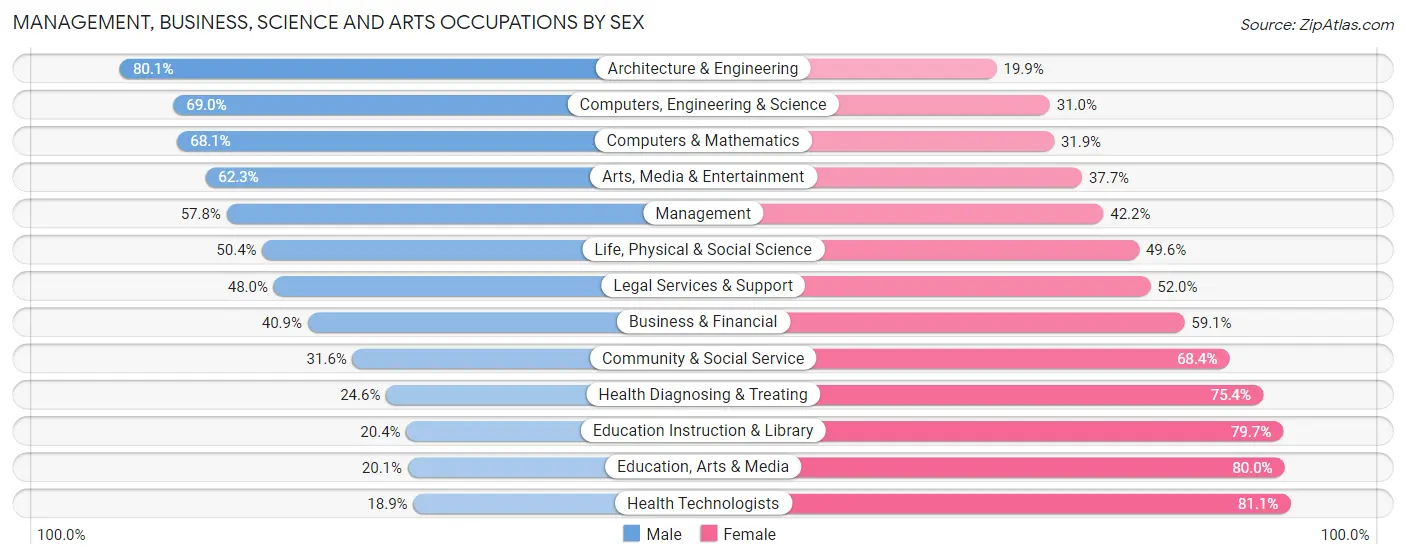
Management, Business, Science and Arts Occupations by Sex
Within the Management, Business, Science and Arts occupations in Castro Valley, the most male-oriented occupations are Architecture & Engineering (80.1%), Computers, Engineering & Science (69.0%), and Computers & Mathematics (68.1%), while the most female-oriented occupations are Health Technologists (81.1%), Education, Arts & Media (79.9%), and Education Instruction & Library (79.6%).
| Occupation | Male | Female |
| Management | 2,673 (57.8%) | 1,948 (42.2%) |
| Business & Financial | 1,234 (40.9%) | 1,781 (59.1%) |
| Computers, Engineering & Science | 2,257 (69.0%) | 1,015 (31.0%) |
| Computers & Mathematics | 1,195 (68.1%) | 559 (31.9%) |
| Architecture & Engineering | 801 (80.1%) | 199 (19.9%) |
| Life, Physical & Social Science | 261 (50.4%) | 257 (49.6%) |
| Community & Social Service | 1,349 (31.6%) | 2,924 (68.4%) |
| Education, Arts & Media | 171 (20.1%) | 682 (79.9%) |
| Legal Services & Support | 194 (48.0%) | 210 (52.0%) |
| Education Instruction & Library | 434 (20.3%) | 1,699 (79.6%) |
| Arts, Media & Entertainment | 550 (62.3%) | 333 (37.7%) |
| Health Diagnosing & Treating | 476 (24.6%) | 1,462 (75.4%) |
| Health Technologists | 246 (18.9%) | 1,056 (81.1%) |
| Total (Category) | 7,989 (46.7%) | 9,130 (53.3%) |
| Total (Overall) | 16,729 (50.5%) | 16,415 (49.5%) |
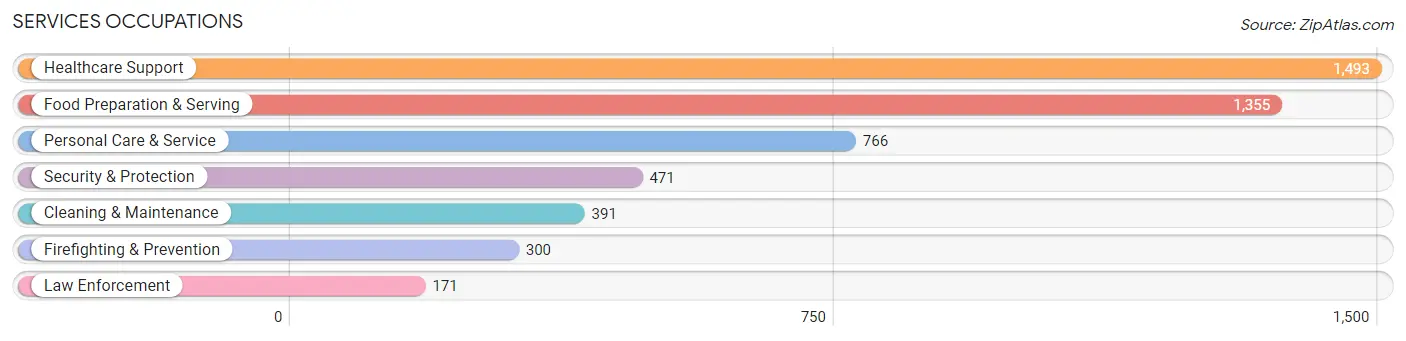
Services Occupations
The most common Services occupations in Castro Valley are Healthcare Support (1,493 | 4.5%), Food Preparation & Serving (1,355 | 4.1%), Personal Care & Service (766 | 2.3%), Security & Protection (471 | 1.4%), and Cleaning & Maintenance (391 | 1.2%).
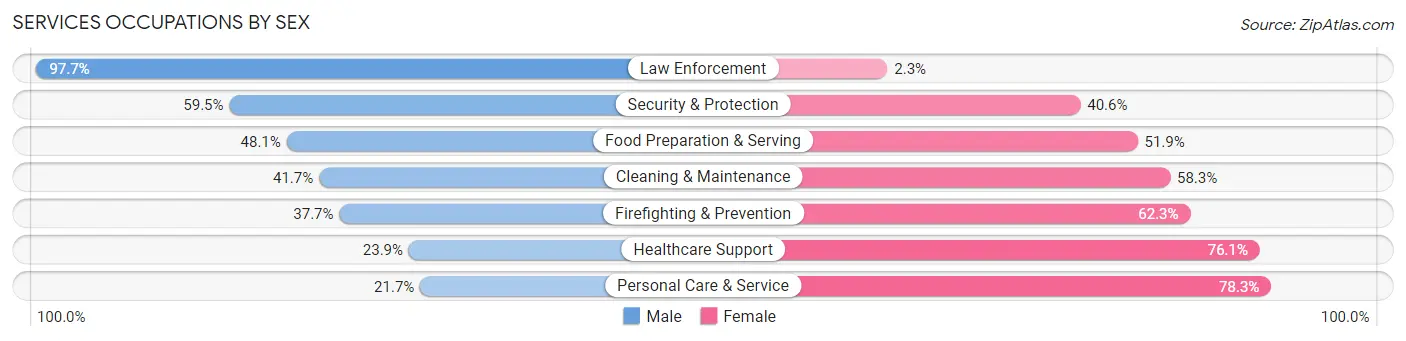
Services Occupations by Sex
Within the Services occupations in Castro Valley, the most male-oriented occupations are Law Enforcement (97.7%), Security & Protection (59.5%), and Food Preparation & Serving (48.1%), while the most female-oriented occupations are Personal Care & Service (78.3%), Healthcare Support (76.1%), and Firefighting & Prevention (62.3%).
| Occupation | Male | Female |
| Healthcare Support | 357 (23.9%) | 1,136 (76.1%) |
| Security & Protection | 280 (59.5%) | 191 (40.6%) |
| Firefighting & Prevention | 113 (37.7%) | 187 (62.3%) |
| Law Enforcement | 167 (97.7%) | 4 (2.3%) |
| Food Preparation & Serving | 652 (48.1%) | 703 (51.9%) |
| Cleaning & Maintenance | 163 (41.7%) | 228 (58.3%) |
| Personal Care & Service | 166 (21.7%) | 600 (78.3%) |
| Total (Category) | 1,618 (36.1%) | 2,858 (63.8%) |
| Total (Overall) | 16,729 (50.5%) | 16,415 (49.5%) |
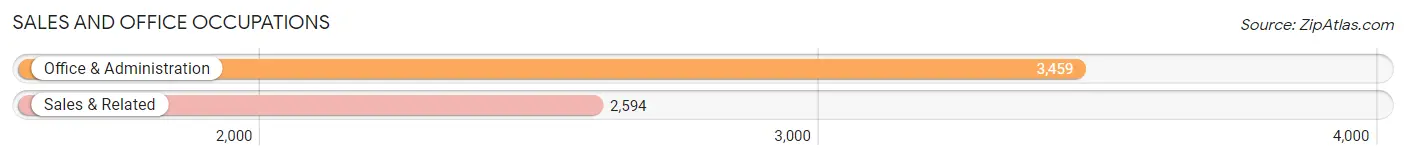
Sales and Office Occupations
The most common Sales and Office occupations in Castro Valley are Office & Administration (3,459 | 10.4%), and Sales & Related (2,594 | 7.8%).
Sales and Office Occupations by Sex
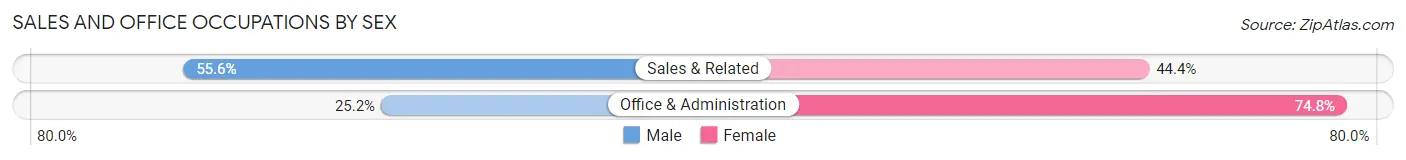
| Occupation | Male | Female |
| Sales & Related | 1,442 (55.6%) | 1,152 (44.4%) |
| Office & Administration | 871 (25.2%) | 2,588 (74.8%) |
| Total (Category) | 2,313 (38.2%) | 3,740 (61.8%) |
| Total (Overall) | 16,729 (50.5%) | 16,415 (49.5%) |
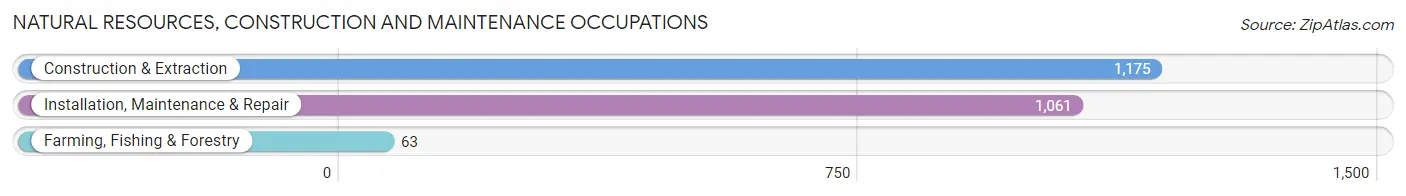
Natural Resources, Construction and Maintenance Occupations
The most common Natural Resources, Construction and Maintenance occupations in Castro Valley are Construction & Extraction (1,175 | 3.5%), Installation, Maintenance & Repair (1,061 | 3.2%), and Farming, Fishing & Forestry (63 | 0.2%).
Natural Resources, Construction and Maintenance Occupations by Sex
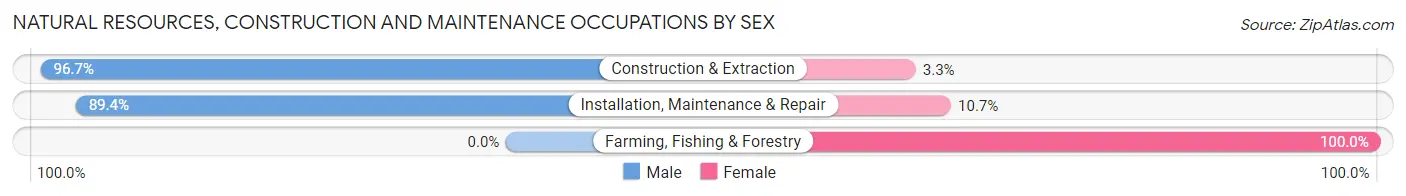
| Occupation | Male | Female |
| Farming, Fishing & Forestry | 0 (0.0%) | 63 (100.0%) |
| Construction & Extraction | 1,136 (96.7%) | 39 (3.3%) |
| Installation, Maintenance & Repair | 948 (89.3%) | 113 (10.6%) |
| Total (Category) | 2,084 (90.6%) | 215 (9.3%) |
| Total (Overall) | 16,729 (50.5%) | 16,415 (49.5%) |
Production, Transportation and Moving Occupations
The most common Production, Transportation and Moving occupations in Castro Valley are Transportation (1,216 | 3.7%), Material Moving (1,153 | 3.5%), and Production (828 | 2.5%).
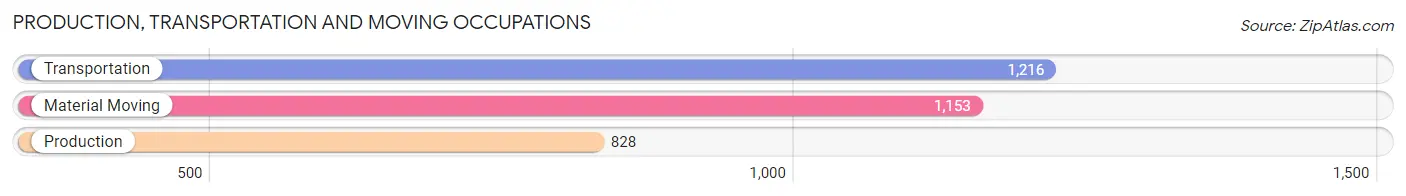
Production, Transportation and Moving Occupations by Sex
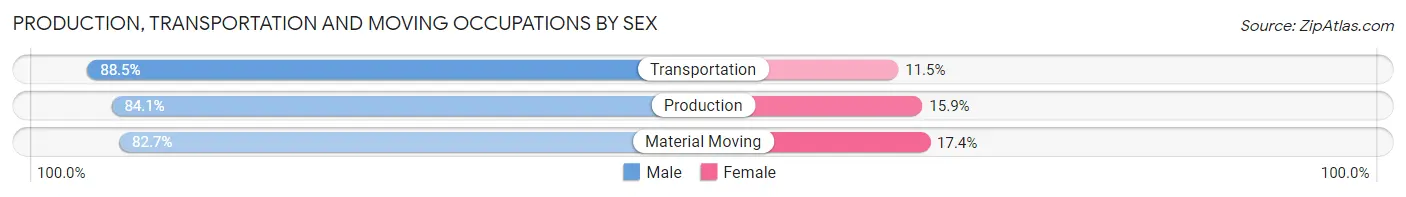
| Occupation | Male | Female |
| Production | 696 (84.1%) | 132 (15.9%) |
| Transportation | 1,076 (88.5%) | 140 (11.5%) |
| Material Moving | 953 (82.7%) | 200 (17.3%) |
| Total (Category) | 2,725 (85.2%) | 472 (14.8%) |
| Total (Overall) | 16,729 (50.5%) | 16,415 (49.5%) |
Employment Industries by Sex in Castro Valley
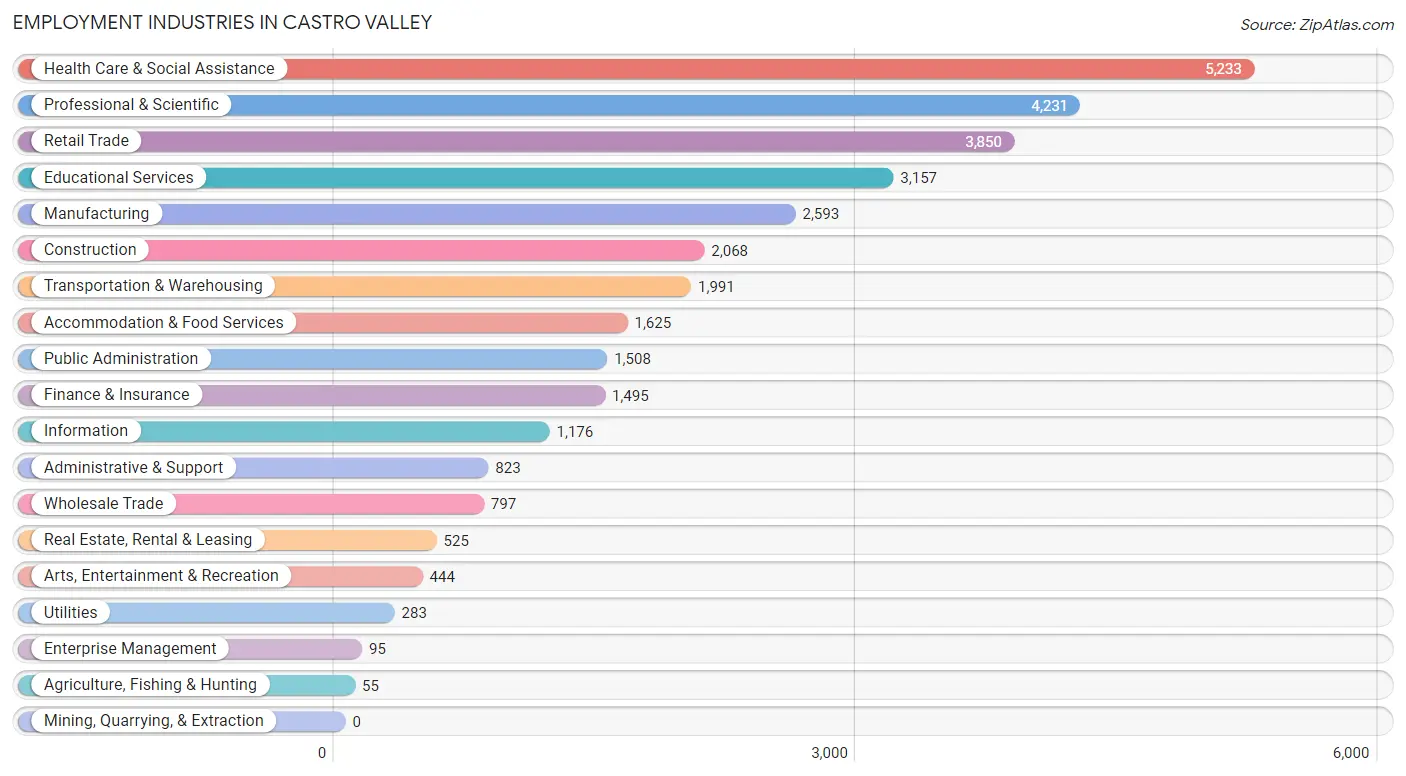
Employment Industries in Castro Valley
The major employment industries in Castro Valley include Health Care & Social Assistance (5,233 | 15.8%), Professional & Scientific (4,231 | 12.8%), Retail Trade (3,850 | 11.6%), Educational Services (3,157 | 9.5%), and Manufacturing (2,593 | 7.8%).
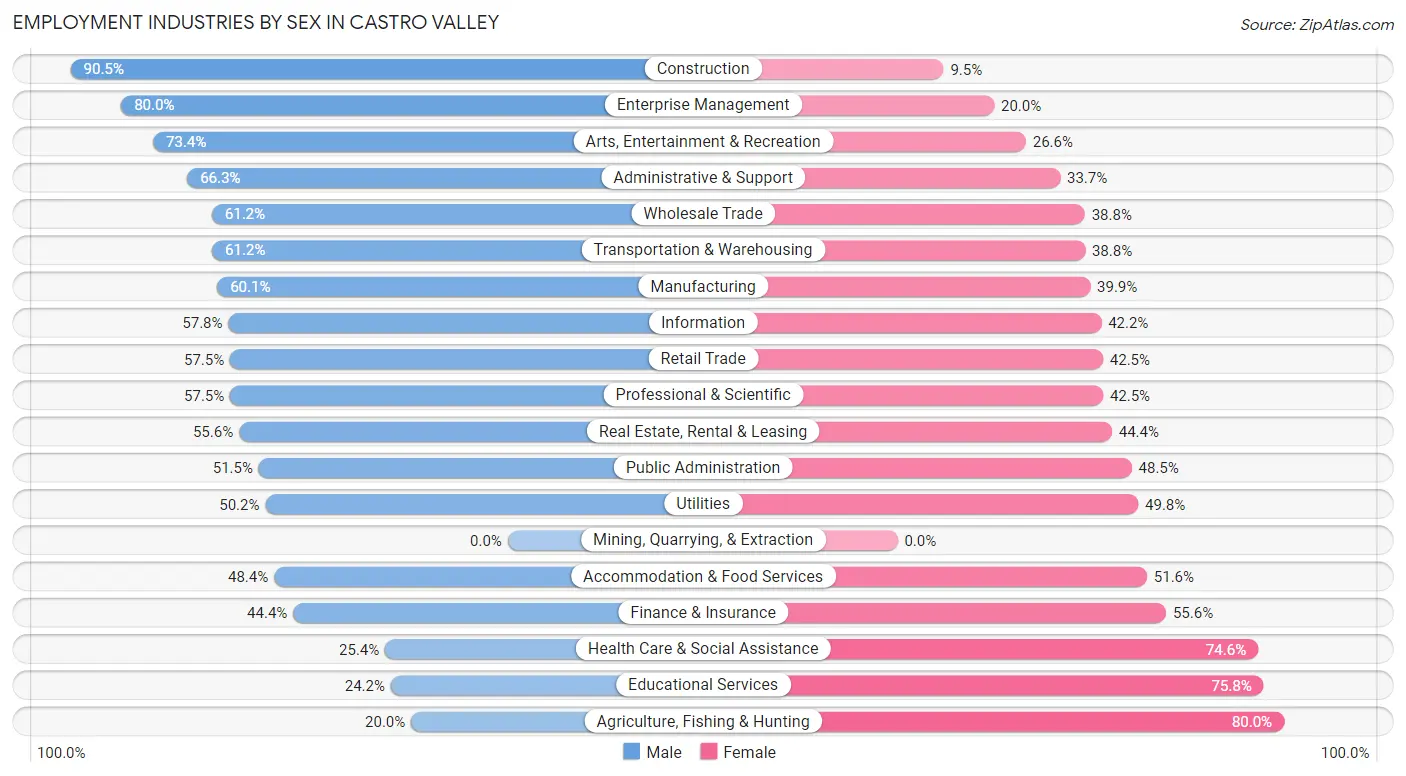
Employment Industries by Sex in Castro Valley
The Castro Valley industries that see more men than women are Construction (90.5%), Enterprise Management (80.0%), and Arts, Entertainment & Recreation (73.4%), whereas the industries that tend to have a higher number of women are Agriculture, Fishing & Hunting (80.0%), Educational Services (75.8%), and Health Care & Social Assistance (74.6%).
| Industry | Male | Female |
| Agriculture, Fishing & Hunting | 11 (20.0%) | 44 (80.0%) |
| Mining, Quarrying, & Extraction | 0 (0.0%) | 0 (0.0%) |
| Construction | 1,871 (90.5%) | 197 (9.5%) |
| Manufacturing | 1,559 (60.1%) | 1,034 (39.9%) |
| Wholesale Trade | 488 (61.2%) | 309 (38.8%) |
| Retail Trade | 2,213 (57.5%) | 1,637 (42.5%) |
| Transportation & Warehousing | 1,218 (61.2%) | 773 (38.8%) |
| Utilities | 142 (50.2%) | 141 (49.8%) |
| Information | 680 (57.8%) | 496 (42.2%) |
| Finance & Insurance | 664 (44.4%) | 831 (55.6%) |
| Real Estate, Rental & Leasing | 292 (55.6%) | 233 (44.4%) |
| Professional & Scientific | 2,431 (57.5%) | 1,800 (42.5%) |
| Enterprise Management | 76 (80.0%) | 19 (20.0%) |
| Administrative & Support | 546 (66.3%) | 277 (33.7%) |
| Educational Services | 764 (24.2%) | 2,393 (75.8%) |
| Health Care & Social Assistance | 1,328 (25.4%) | 3,905 (74.6%) |
| Arts, Entertainment & Recreation | 326 (73.4%) | 118 (26.6%) |
| Accommodation & Food Services | 786 (48.4%) | 839 (51.6%) |
| Public Administration | 777 (51.5%) | 731 (48.5%) |
| Total | 16,729 (50.5%) | 16,415 (49.5%) |
Education in Castro Valley
School Enrollment in Castro Valley
The most common levels of schooling among the 15,533 students in Castro Valley are high school (3,818 | 24.6%), elementary school (3,351 | 21.6%), and college / undergraduate (2,916 | 18.8%).
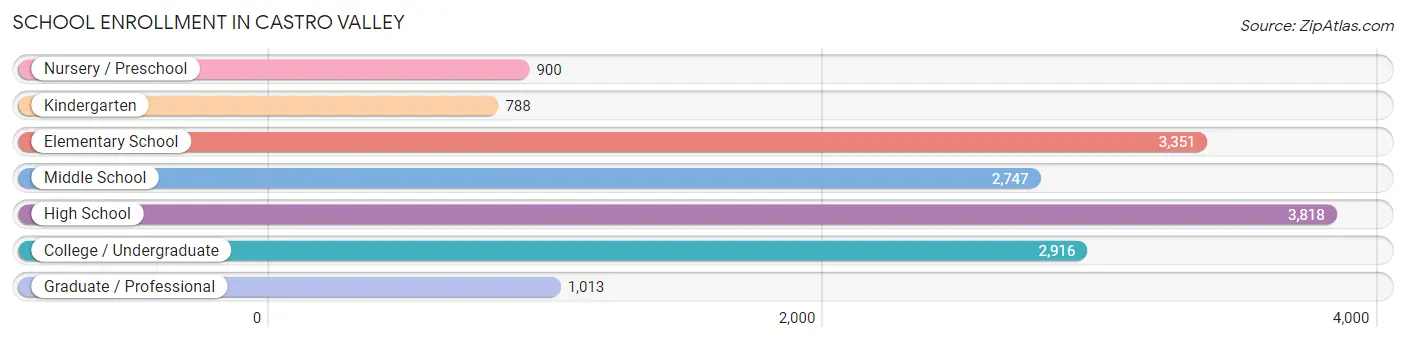
| School Level | # Students | % Students |
| Nursery / Preschool | 900 | 5.8% |
| Kindergarten | 788 | 5.1% |
| Elementary School | 3,351 | 21.6% |
| Middle School | 2,747 | 17.7% |
| High School | 3,818 | 24.6% |
| College / Undergraduate | 2,916 | 18.8% |
| Graduate / Professional | 1,013 | 6.5% |
| Total | 15,533 | 100.0% |
School Enrollment by Age by Funding Source in Castro Valley
Out of a total of 15,533 students who are enrolled in schools in Castro Valley, 2,283 (14.7%) attend a private institution, while the remaining 13,250 (85.3%) are enrolled in public schools. The age group of 3 to 4 year olds has the highest likelihood of being enrolled in private schools, with 464 (61.7% in the age bracket) enrolled. Conversely, the age group of 10 to 14 year olds has the lowest likelihood of being enrolled in a private school, with 3,486 (94.4% in the age bracket) attending a public institution.
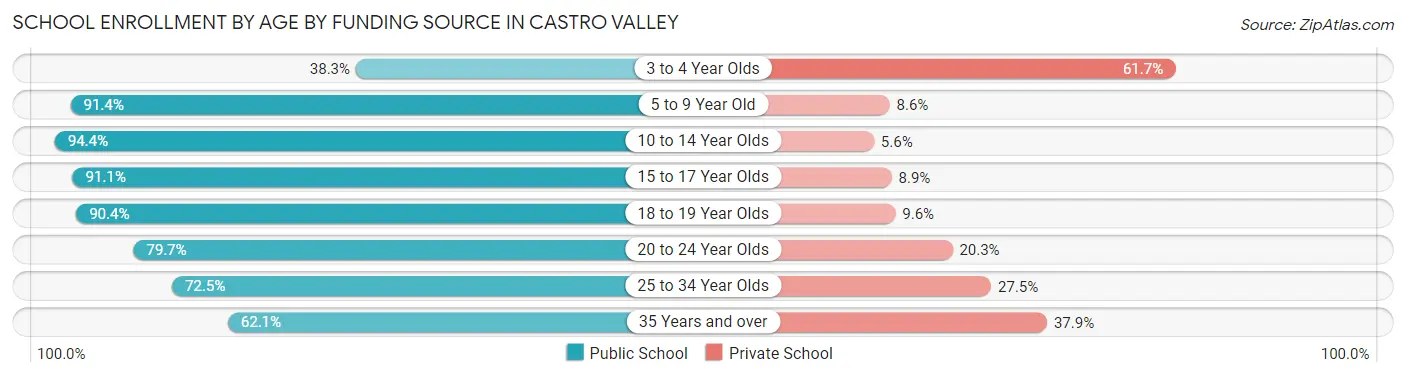
| Age Bracket | Public School | Private School |
| 3 to 4 Year Olds | 288 (38.3%) | 464 (61.7%) |
| 5 to 9 Year Old | 3,655 (91.4%) | 342 (8.6%) |
| 10 to 14 Year Olds | 3,486 (94.4%) | 208 (5.6%) |
| 15 to 17 Year Olds | 2,539 (91.1%) | 249 (8.9%) |
| 18 to 19 Year Olds | 864 (90.4%) | 92 (9.6%) |
| 20 to 24 Year Olds | 1,153 (79.7%) | 293 (20.3%) |
| 25 to 34 Year Olds | 589 (72.5%) | 223 (27.5%) |
| 35 Years and over | 676 (62.1%) | 412 (37.9%) |
| Total | 13,250 (85.3%) | 2,283 (14.7%) |
Educational Attainment by Field of Study in Castro Valley
Business (4,716 | 20.6%), social sciences (2,568 | 11.2%), science & technology (2,082 | 9.1%), computers & mathematics (1,792 | 7.8%), and engineering (1,789 | 7.8%) are the most common fields of study among 22,884 individuals in Castro Valley who have obtained a bachelor's degree or higher.
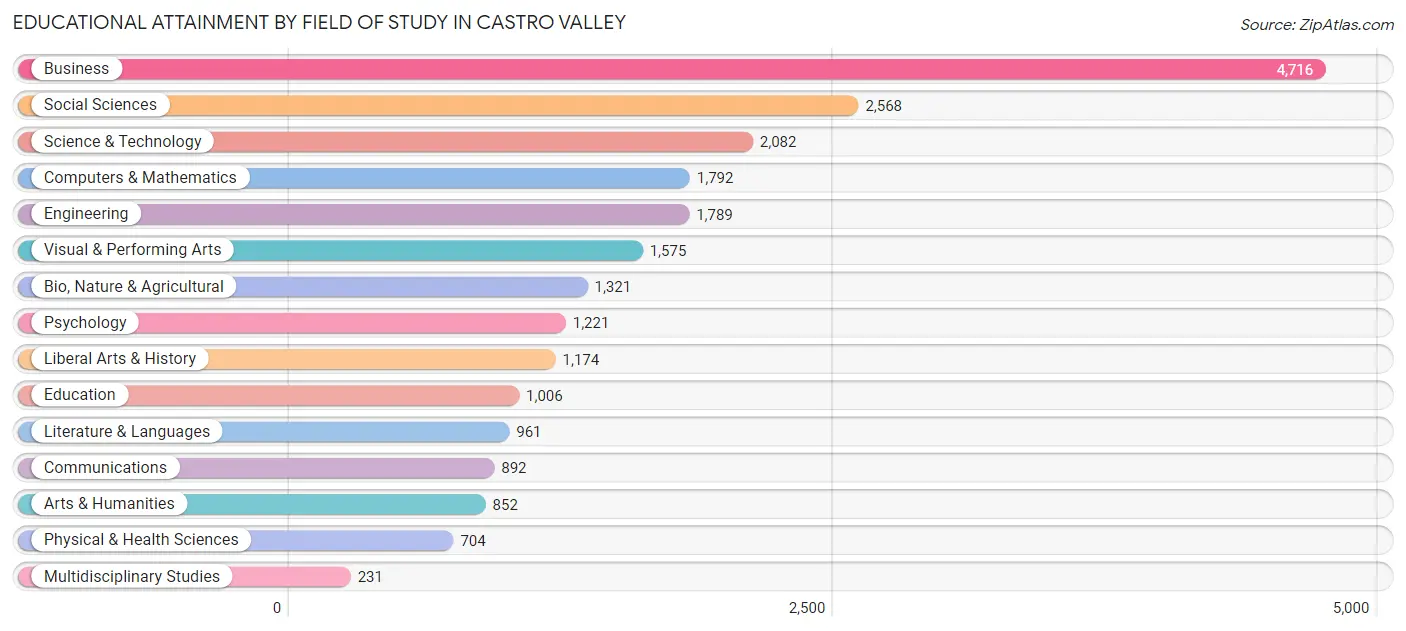
| Field of Study | # Graduates | % Graduates |
| Computers & Mathematics | 1,792 | 7.8% |
| Bio, Nature & Agricultural | 1,321 | 5.8% |
| Physical & Health Sciences | 704 | 3.1% |
| Psychology | 1,221 | 5.3% |
| Social Sciences | 2,568 | 11.2% |
| Engineering | 1,789 | 7.8% |
| Multidisciplinary Studies | 231 | 1.0% |
| Science & Technology | 2,082 | 9.1% |
| Business | 4,716 | 20.6% |
| Education | 1,006 | 4.4% |
| Literature & Languages | 961 | 4.2% |
| Liberal Arts & History | 1,174 | 5.1% |
| Visual & Performing Arts | 1,575 | 6.9% |
| Communications | 892 | 3.9% |
| Arts & Humanities | 852 | 3.7% |
| Total | 22,884 | 100.0% |
Transportation & Commute in Castro Valley
Vehicle Availability by Sex in Castro Valley
The most prevalent vehicle ownership categories in Castro Valley are males with 2 vehicles (6,674, accounting for 40.8%) and females with 2 vehicles (6,257, making up 42.3%).
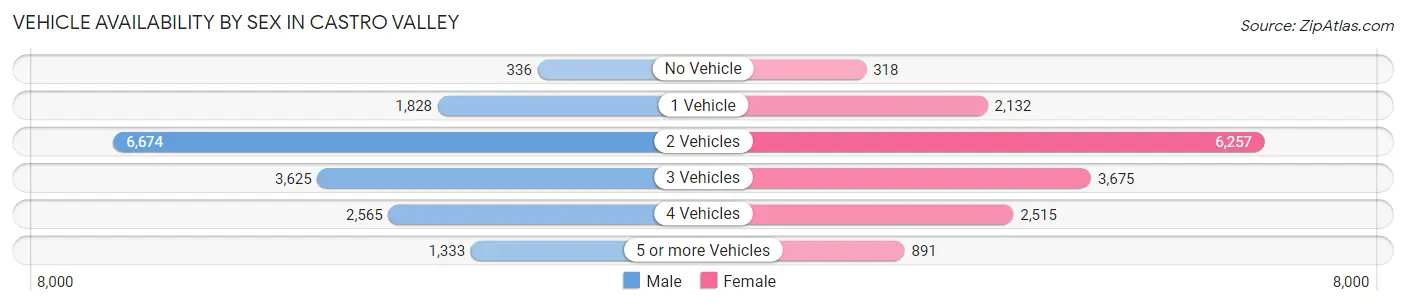
| Vehicles Available | Male | Female |
| No Vehicle | 336 (2.1%) | 318 (2.0%) |
| 1 Vehicle | 1,828 (11.2%) | 2,132 (13.5%) |
| 2 Vehicles | 6,674 (40.8%) | 6,257 (39.6%) |
| 3 Vehicles | 3,625 (22.2%) | 3,675 (23.3%) |
| 4 Vehicles | 2,565 (15.7%) | 2,515 (15.9%) |
| 5 or more Vehicles | 1,333 (8.2%) | 891 (5.6%) |
| Total | 16,361 (100.0%) | 15,788 (100.0%) |
Commute Time in Castro Valley
The most frequently occuring commute durations in Castro Valley are 30 to 34 minutes (4,564 commuters, 17.0%), 20 to 24 minutes (3,854 commuters, 14.4%), and 60 to 89 minutes (3,178 commuters, 11.9%).
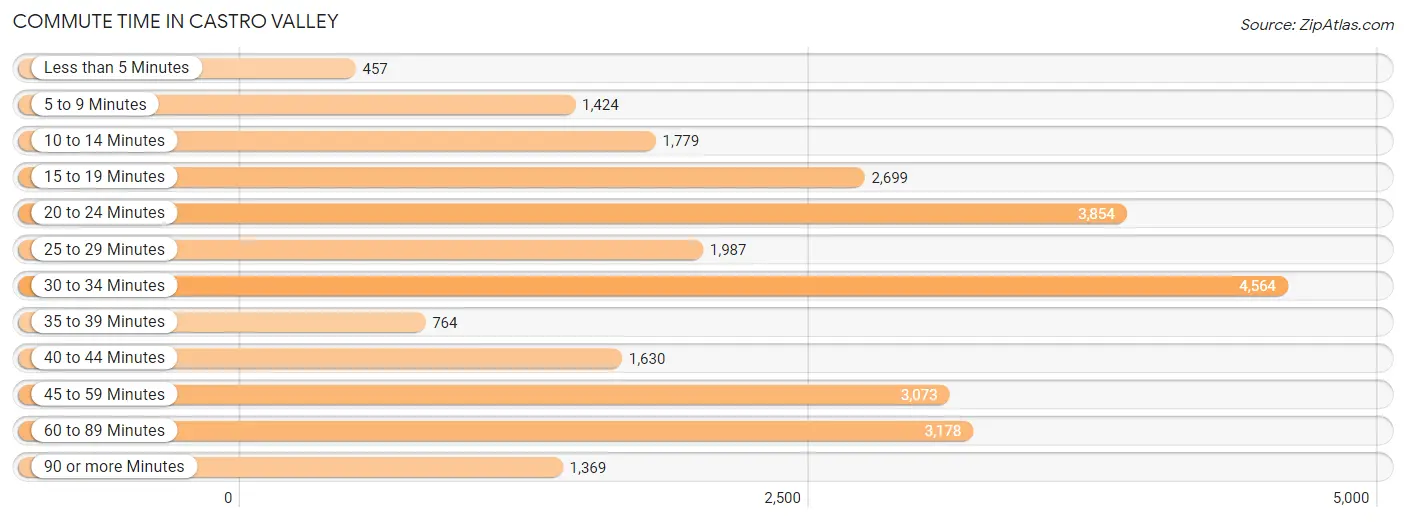
| Commute Time | # Commuters | % Commuters |
| Less than 5 Minutes | 457 | 1.7% |
| 5 to 9 Minutes | 1,424 | 5.3% |
| 10 to 14 Minutes | 1,779 | 6.6% |
| 15 to 19 Minutes | 2,699 | 10.1% |
| 20 to 24 Minutes | 3,854 | 14.4% |
| 25 to 29 Minutes | 1,987 | 7.4% |
| 30 to 34 Minutes | 4,564 | 17.0% |
| 35 to 39 Minutes | 764 | 2.9% |
| 40 to 44 Minutes | 1,630 | 6.1% |
| 45 to 59 Minutes | 3,073 | 11.5% |
| 60 to 89 Minutes | 3,178 | 11.9% |
| 90 or more Minutes | 1,369 | 5.1% |
Commute Time by Sex in Castro Valley
The most common commute times in Castro Valley are 30 to 34 minutes (2,614 commuters, 19.1%) for males and 30 to 34 minutes (1,950 commuters, 14.9%) for females.
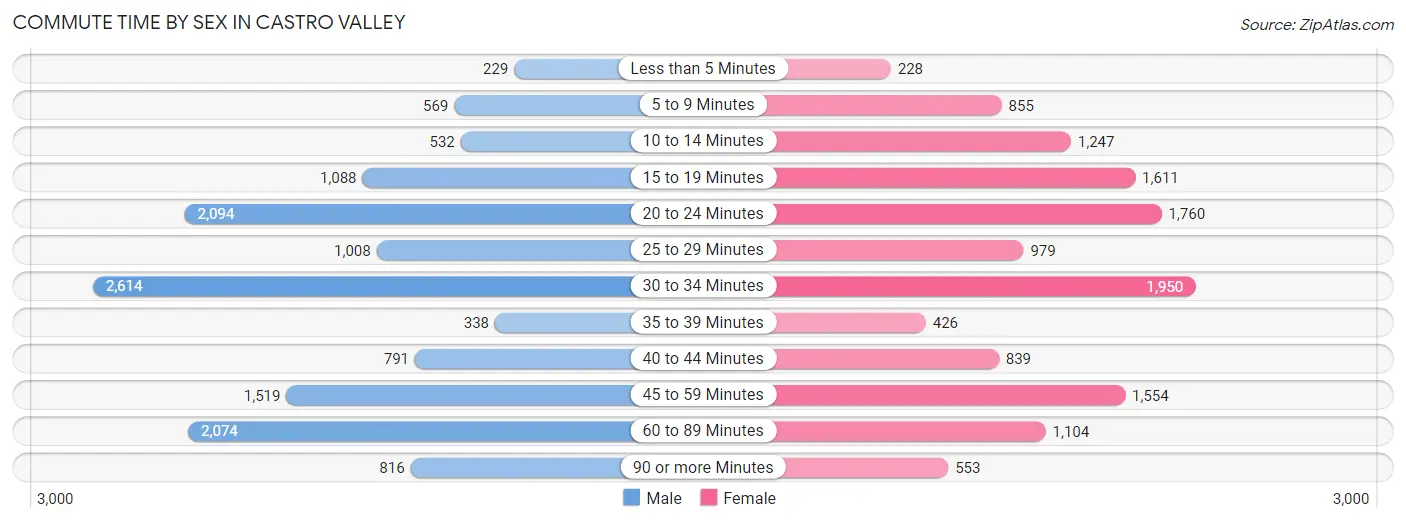
| Commute Time | Male | Female |
| Less than 5 Minutes | 229 (1.7%) | 228 (1.7%) |
| 5 to 9 Minutes | 569 (4.2%) | 855 (6.5%) |
| 10 to 14 Minutes | 532 (3.9%) | 1,247 (9.5%) |
| 15 to 19 Minutes | 1,088 (8.0%) | 1,611 (12.3%) |
| 20 to 24 Minutes | 2,094 (15.3%) | 1,760 (13.4%) |
| 25 to 29 Minutes | 1,008 (7.4%) | 979 (7.5%) |
| 30 to 34 Minutes | 2,614 (19.1%) | 1,950 (14.9%) |
| 35 to 39 Minutes | 338 (2.5%) | 426 (3.3%) |
| 40 to 44 Minutes | 791 (5.8%) | 839 (6.4%) |
| 45 to 59 Minutes | 1,519 (11.1%) | 1,554 (11.9%) |
| 60 to 89 Minutes | 2,074 (15.2%) | 1,104 (8.4%) |
| 90 or more Minutes | 816 (6.0%) | 553 (4.2%) |
Time of Departure to Work by Sex in Castro Valley
The most frequent times of departure to work in Castro Valley are 7:00 AM to 7:29 AM (1,670, 12.2%) for males and 7:30 AM to 7:59 AM (2,165, 16.5%) for females.
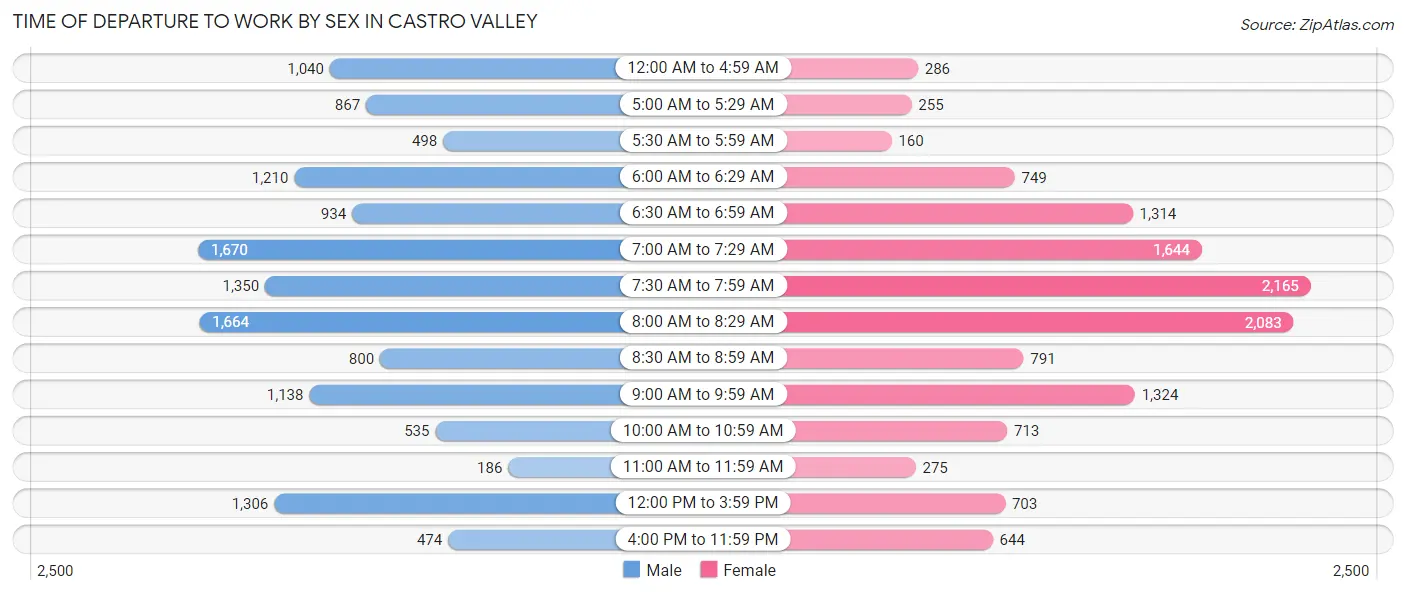
| Time of Departure | Male | Female |
| 12:00 AM to 4:59 AM | 1,040 (7.6%) | 286 (2.2%) |
| 5:00 AM to 5:29 AM | 867 (6.3%) | 255 (1.9%) |
| 5:30 AM to 5:59 AM | 498 (3.6%) | 160 (1.2%) |
| 6:00 AM to 6:29 AM | 1,210 (8.8%) | 749 (5.7%) |
| 6:30 AM to 6:59 AM | 934 (6.8%) | 1,314 (10.0%) |
| 7:00 AM to 7:29 AM | 1,670 (12.2%) | 1,644 (12.5%) |
| 7:30 AM to 7:59 AM | 1,350 (9.9%) | 2,165 (16.5%) |
| 8:00 AM to 8:29 AM | 1,664 (12.2%) | 2,083 (15.9%) |
| 8:30 AM to 8:59 AM | 800 (5.9%) | 791 (6.0%) |
| 9:00 AM to 9:59 AM | 1,138 (8.3%) | 1,324 (10.1%) |
| 10:00 AM to 10:59 AM | 535 (3.9%) | 713 (5.4%) |
| 11:00 AM to 11:59 AM | 186 (1.4%) | 275 (2.1%) |
| 12:00 PM to 3:59 PM | 1,306 (9.6%) | 703 (5.4%) |
| 4:00 PM to 11:59 PM | 474 (3.5%) | 644 (4.9%) |
| Total | 13,672 (100.0%) | 13,106 (100.0%) |
Housing Occupancy in Castro Valley
Occupancy by Ownership in Castro Valley
Of the total 22,117 dwellings in Castro Valley, owner-occupied units account for 15,790 (71.4%), while renter-occupied units make up 6,327 (28.6%).
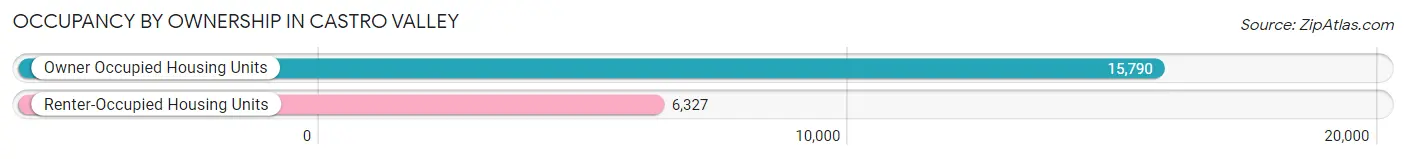
| Occupancy | # Housing Units | % Housing Units |
| Owner Occupied Housing Units | 15,790 | 71.4% |
| Renter-Occupied Housing Units | 6,327 | 28.6% |
| Total Occupied Housing Units | 22,117 | 100.0% |
Occupancy by Household Size in Castro Valley
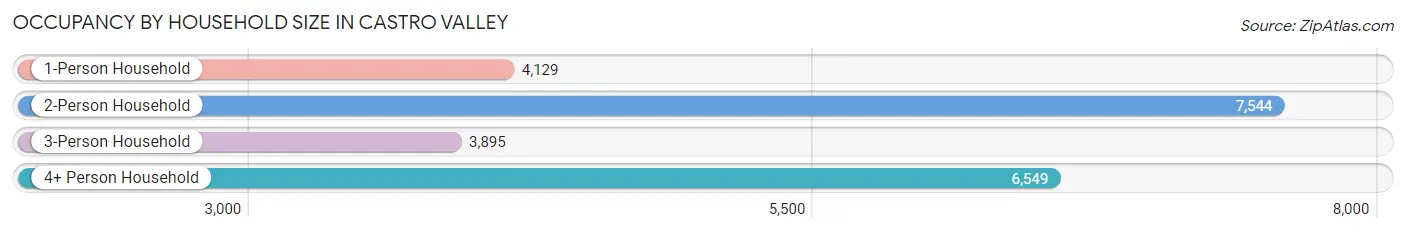
| Household Size | # Housing Units | % Housing Units |
| 1-Person Household | 4,129 | 18.7% |
| 2-Person Household | 7,544 | 34.1% |
| 3-Person Household | 3,895 | 17.6% |
| 4+ Person Household | 6,549 | 29.6% |
| Total Housing Units | 22,117 | 100.0% |
Occupancy by Ownership by Household Size in Castro Valley
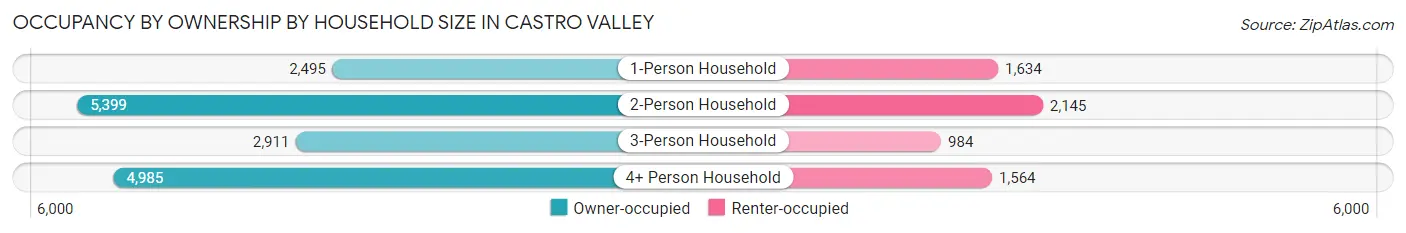
| Household Size | Owner-occupied | Renter-occupied |
| 1-Person Household | 2,495 (60.4%) | 1,634 (39.6%) |
| 2-Person Household | 5,399 (71.6%) | 2,145 (28.4%) |
| 3-Person Household | 2,911 (74.7%) | 984 (25.3%) |
| 4+ Person Household | 4,985 (76.1%) | 1,564 (23.9%) |
| Total Housing Units | 15,790 (71.4%) | 6,327 (28.6%) |
Occupancy by Educational Attainment in Castro Valley
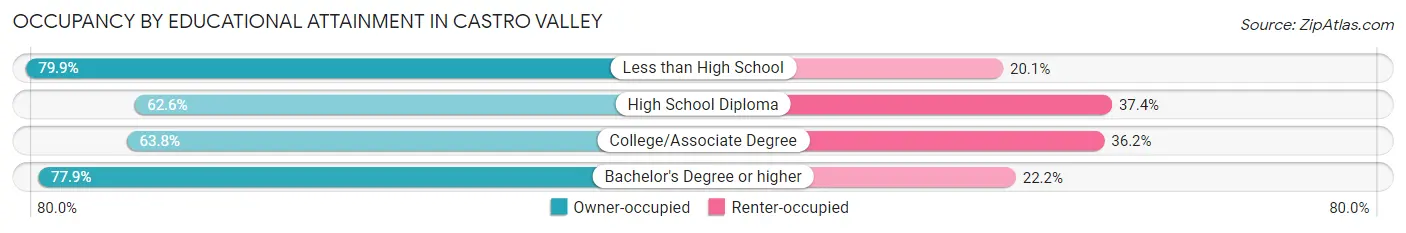
| Household Size | Owner-occupied | Renter-occupied |
| Less than High School | 1,052 (79.9%) | 265 (20.1%) |
| High School Diploma | 1,918 (62.6%) | 1,146 (37.4%) |
| College/Associate Degree | 4,487 (63.8%) | 2,545 (36.2%) |
| Bachelor's Degree or higher | 8,333 (77.8%) | 2,371 (22.2%) |
Occupancy by Age of Householder in Castro Valley
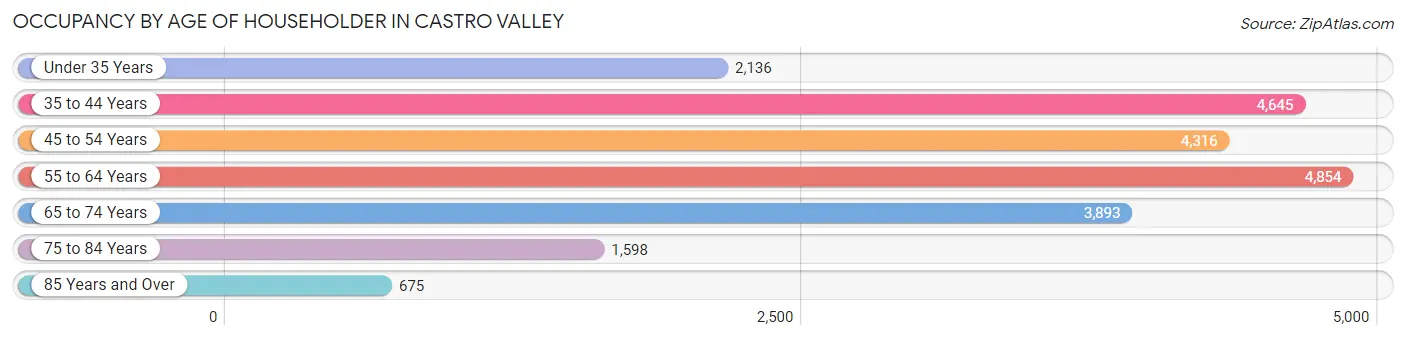
| Age Bracket | # Households | % Households |
| Under 35 Years | 2,136 | 9.7% |
| 35 to 44 Years | 4,645 | 21.0% |
| 45 to 54 Years | 4,316 | 19.5% |
| 55 to 64 Years | 4,854 | 22.0% |
| 65 to 74 Years | 3,893 | 17.6% |
| 75 to 84 Years | 1,598 | 7.2% |
| 85 Years and Over | 675 | 3.0% |
| Total | 22,117 | 100.0% |
Housing Finances in Castro Valley
Median Income by Occupancy in Castro Valley
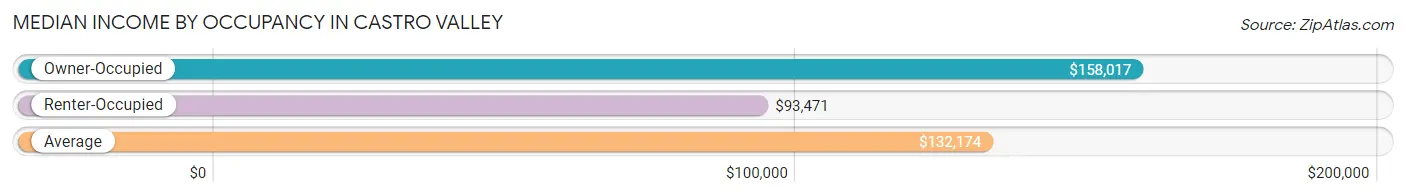
| Occupancy Type | # Households | Median Income |
| Owner-Occupied | 15,790 (71.4%) | $158,017 |
| Renter-Occupied | 6,327 (28.6%) | $93,471 |
| Average | 22,117 (100.0%) | $132,174 |
Occupancy by Householder Income Bracket in Castro Valley
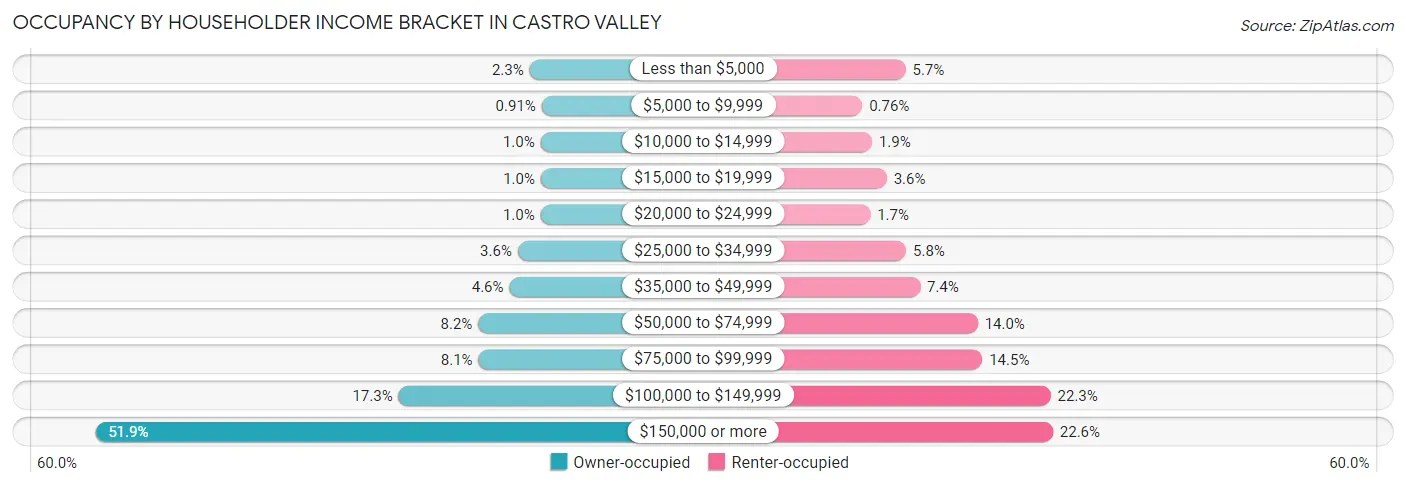
| Income Bracket | Owner-occupied | Renter-occupied |
| Less than $5,000 | 361 (2.3%) | 361 (5.7%) |
| $5,000 to $9,999 | 144 (0.9%) | 48 (0.8%) |
| $10,000 to $14,999 | 163 (1.0%) | 119 (1.9%) |
| $15,000 to $19,999 | 160 (1.0%) | 225 (3.6%) |
| $20,000 to $24,999 | 162 (1.0%) | 106 (1.7%) |
| $25,000 to $34,999 | 575 (3.6%) | 366 (5.8%) |
| $35,000 to $49,999 | 726 (4.6%) | 466 (7.4%) |
| $50,000 to $74,999 | 1,289 (8.2%) | 883 (14.0%) |
| $75,000 to $99,999 | 1,284 (8.1%) | 916 (14.5%) |
| $100,000 to $149,999 | 2,727 (17.3%) | 1,410 (22.3%) |
| $150,000 or more | 8,199 (51.9%) | 1,427 (22.6%) |
| Total | 15,790 (100.0%) | 6,327 (100.0%) |
Monthly Housing Cost Tiers in Castro Valley
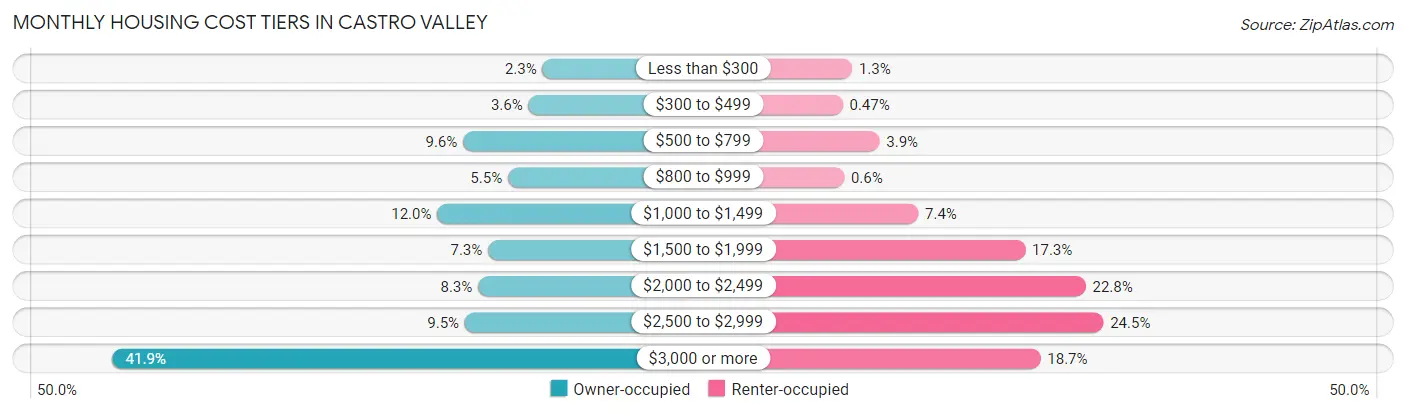
| Monthly Cost | Owner-occupied | Renter-occupied |
| Less than $300 | 366 (2.3%) | 85 (1.3%) |
| $300 to $499 | 570 (3.6%) | 30 (0.5%) |
| $500 to $799 | 1,520 (9.6%) | 244 (3.9%) |
| $800 to $999 | 869 (5.5%) | 38 (0.6%) |
| $1,000 to $1,499 | 1,896 (12.0%) | 470 (7.4%) |
| $1,500 to $1,999 | 1,158 (7.3%) | 1,093 (17.3%) |
| $2,000 to $2,499 | 1,303 (8.3%) | 1,445 (22.8%) |
| $2,500 to $2,999 | 1,493 (9.5%) | 1,548 (24.5%) |
| $3,000 or more | 6,615 (41.9%) | 1,182 (18.7%) |
| Total | 15,790 (100.0%) | 6,327 (100.0%) |
Physical Housing Characteristics in Castro Valley
Housing Structures in Castro Valley
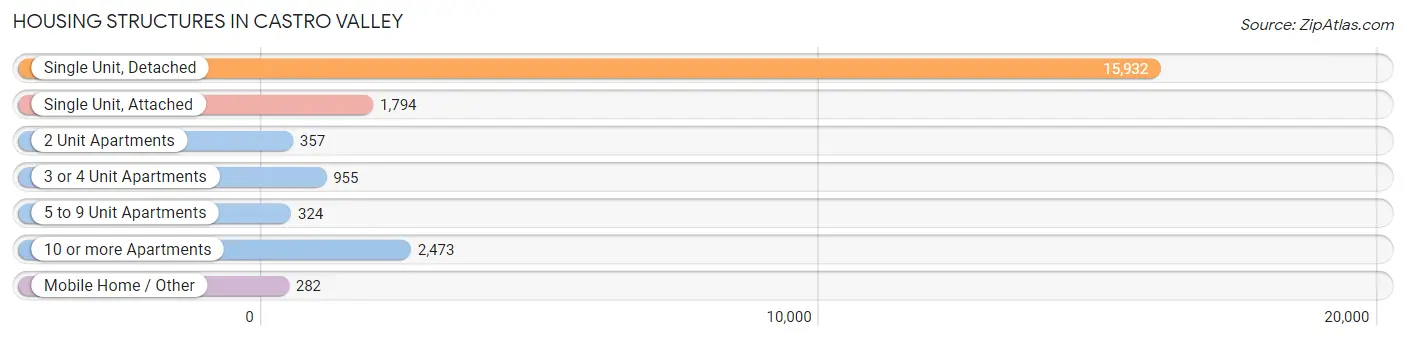
| Structure Type | # Housing Units | % Housing Units |
| Single Unit, Detached | 15,932 | 72.0% |
| Single Unit, Attached | 1,794 | 8.1% |
| 2 Unit Apartments | 357 | 1.6% |
| 3 or 4 Unit Apartments | 955 | 4.3% |
| 5 to 9 Unit Apartments | 324 | 1.5% |
| 10 or more Apartments | 2,473 | 11.2% |
| Mobile Home / Other | 282 | 1.3% |
| Total | 22,117 | 100.0% |
Housing Structures by Occupancy in Castro Valley
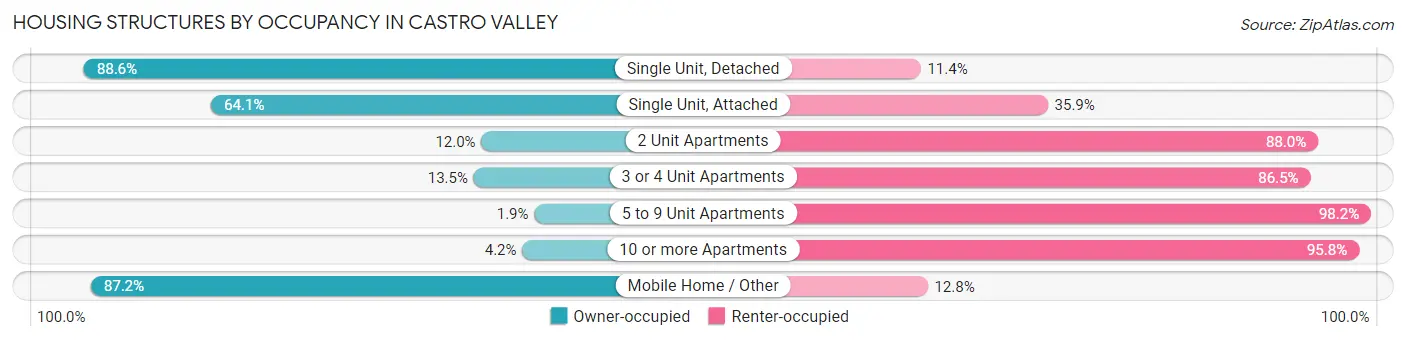
| Structure Type | Owner-occupied | Renter-occupied |
| Single Unit, Detached | 14,113 (88.6%) | 1,819 (11.4%) |
| Single Unit, Attached | 1,150 (64.1%) | 644 (35.9%) |
| 2 Unit Apartments | 43 (12.0%) | 314 (88.0%) |
| 3 or 4 Unit Apartments | 129 (13.5%) | 826 (86.5%) |
| 5 to 9 Unit Apartments | 6 (1.8%) | 318 (98.2%) |
| 10 or more Apartments | 103 (4.2%) | 2,370 (95.8%) |
| Mobile Home / Other | 246 (87.2%) | 36 (12.8%) |
| Total | 15,790 (71.4%) | 6,327 (28.6%) |
Housing Structures by Number of Rooms in Castro Valley
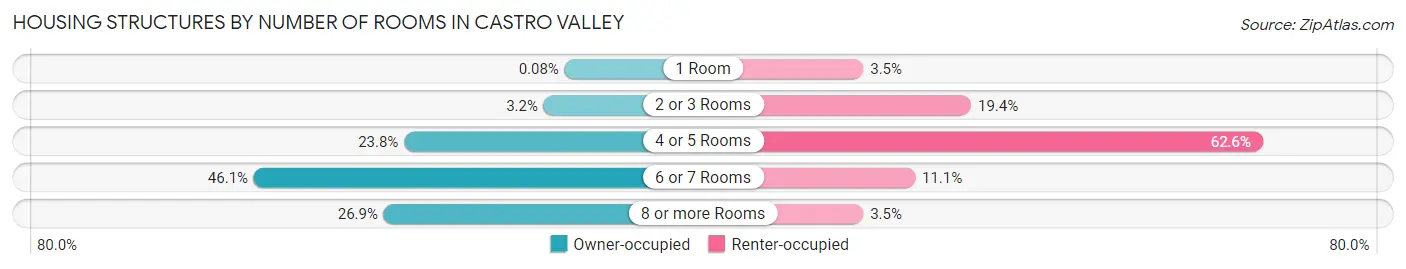
| Number of Rooms | Owner-occupied | Renter-occupied |
| 1 Room | 12 (0.1%) | 219 (3.5%) |
| 2 or 3 Rooms | 501 (3.2%) | 1,228 (19.4%) |
| 4 or 5 Rooms | 3,763 (23.8%) | 3,959 (62.6%) |
| 6 or 7 Rooms | 7,275 (46.1%) | 703 (11.1%) |
| 8 or more Rooms | 4,239 (26.9%) | 218 (3.5%) |
| Total | 15,790 (100.0%) | 6,327 (100.0%) |
Housing Structure by Heating Type in Castro Valley
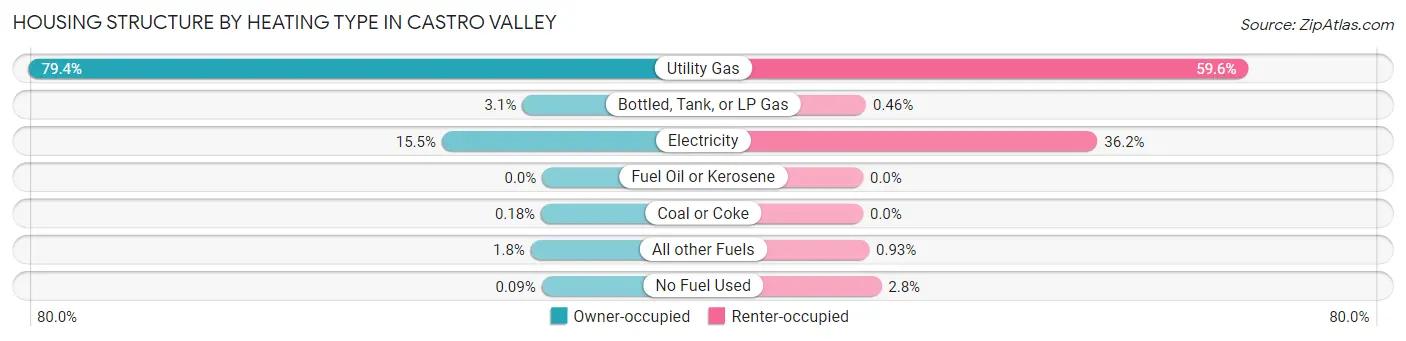
| Heating Type | Owner-occupied | Renter-occupied |
| Utility Gas | 12,533 (79.4%) | 3,768 (59.6%) |
| Bottled, Tank, or LP Gas | 485 (3.1%) | 29 (0.5%) |
| Electricity | 2,449 (15.5%) | 2,292 (36.2%) |
| Fuel Oil or Kerosene | 0 (0.0%) | 0 (0.0%) |
| Coal or Coke | 29 (0.2%) | 0 (0.0%) |
| All other Fuels | 279 (1.8%) | 59 (0.9%) |
| No Fuel Used | 15 (0.1%) | 179 (2.8%) |
| Total | 15,790 (100.0%) | 6,327 (100.0%) |
Household Vehicle Usage in Castro Valley
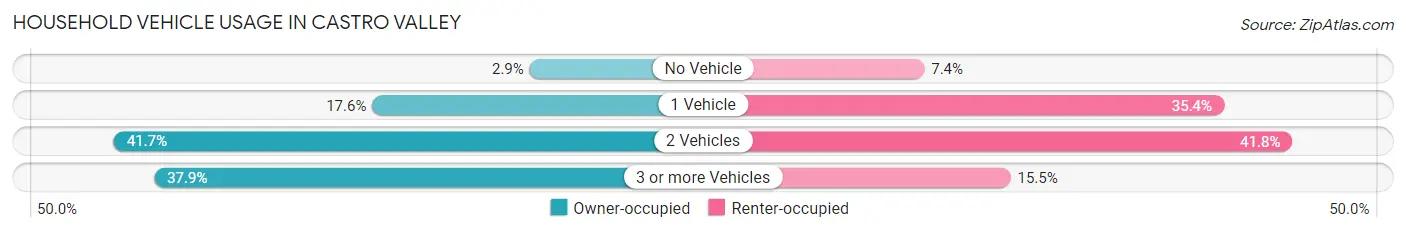
| Vehicles per Household | Owner-occupied | Renter-occupied |
| No Vehicle | 452 (2.9%) | 469 (7.4%) |
| 1 Vehicle | 2,771 (17.5%) | 2,238 (35.4%) |
| 2 Vehicles | 6,580 (41.7%) | 2,642 (41.8%) |
| 3 or more Vehicles | 5,987 (37.9%) | 978 (15.5%) |
| Total | 15,790 (100.0%) | 6,327 (100.0%) |
Real Estate & Mortgages in Castro Valley
Real Estate and Mortgage Overview in Castro Valley
| Characteristic | Without Mortgage | With Mortgage |
| Housing Units | 5,218 | 10,572 |
| Median Property Value | $972,400 | $1,032,400 |
| Median Household Income | $120,955 | $6,176 |
| Monthly Housing Costs | $853 | $6,586 |
| Real Estate Taxes | $5,770 | $118 |
Property Value by Mortgage Status in Castro Valley
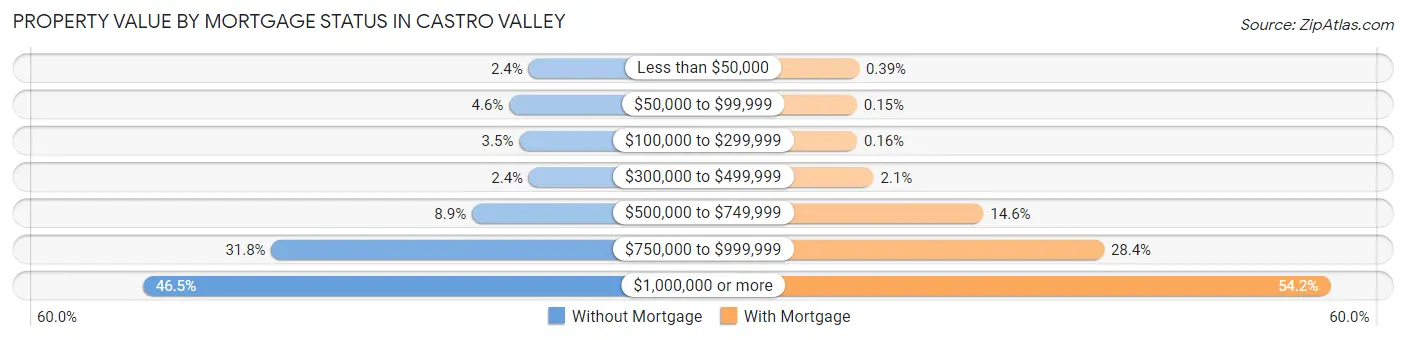
| Property Value | Without Mortgage | With Mortgage |
| Less than $50,000 | 125 (2.4%) | 41 (0.4%) |
| $50,000 to $99,999 | 241 (4.6%) | 16 (0.2%) |
| $100,000 to $299,999 | 181 (3.5%) | 17 (0.2%) |
| $300,000 to $499,999 | 123 (2.4%) | 218 (2.1%) |
| $500,000 to $749,999 | 463 (8.9%) | 1,545 (14.6%) |
| $750,000 to $999,999 | 1,659 (31.8%) | 3,001 (28.4%) |
| $1,000,000 or more | 2,426 (46.5%) | 5,734 (54.2%) |
| Total | 5,218 (100.0%) | 10,572 (100.0%) |
Household Income by Mortgage Status in Castro Valley
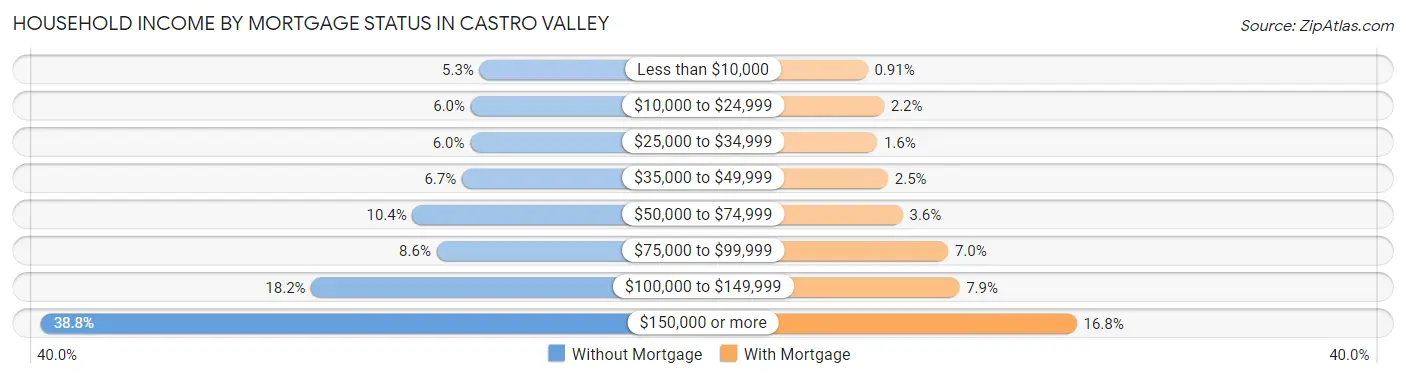
| Household Income | Without Mortgage | With Mortgage |
| Less than $10,000 | 278 (5.3%) | 96 (0.9%) |
| $10,000 to $24,999 | 313 (6.0%) | 227 (2.1%) |
| $25,000 to $34,999 | 315 (6.0%) | 172 (1.6%) |
| $35,000 to $49,999 | 348 (6.7%) | 260 (2.5%) |
| $50,000 to $74,999 | 545 (10.4%) | 378 (3.6%) |
| $75,000 to $99,999 | 449 (8.6%) | 744 (7.0%) |
| $100,000 to $149,999 | 947 (18.1%) | 835 (7.9%) |
| $150,000 or more | 2,023 (38.8%) | 1,780 (16.8%) |
| Total | 5,218 (100.0%) | 10,572 (100.0%) |
Property Value to Household Income Ratio in Castro Valley
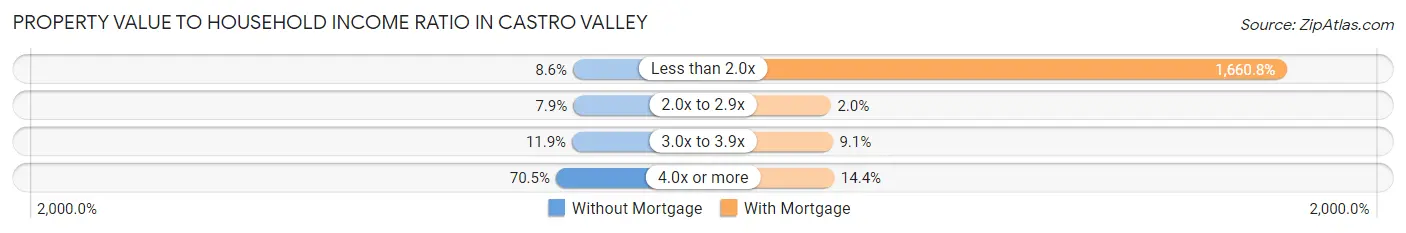
| Value-to-Income Ratio | Without Mortgage | With Mortgage |
| Less than 2.0x | 450 (8.6%) | 175,575 (1,660.8%) |
| 2.0x to 2.9x | 411 (7.9%) | 208 (2.0%) |
| 3.0x to 3.9x | 620 (11.9%) | 963 (9.1%) |
| 4.0x or more | 3,681 (70.5%) | 1,524 (14.4%) |
| Total | 5,218 (100.0%) | 10,572 (100.0%) |
Real Estate Taxes by Mortgage Status in Castro Valley
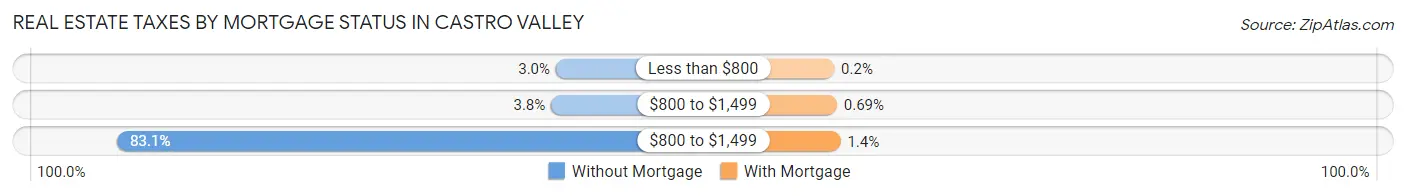
| Property Taxes | Without Mortgage | With Mortgage |
| Less than $800 | 155 (3.0%) | 21 (0.2%) |
| $800 to $1,499 | 200 (3.8%) | 73 (0.7%) |
| $800 to $1,499 | 4,337 (83.1%) | 144 (1.4%) |
| Total | 5,218 (100.0%) | 10,572 (100.0%) |
Health & Disability in Castro Valley
Health Insurance Coverage by Age in Castro Valley
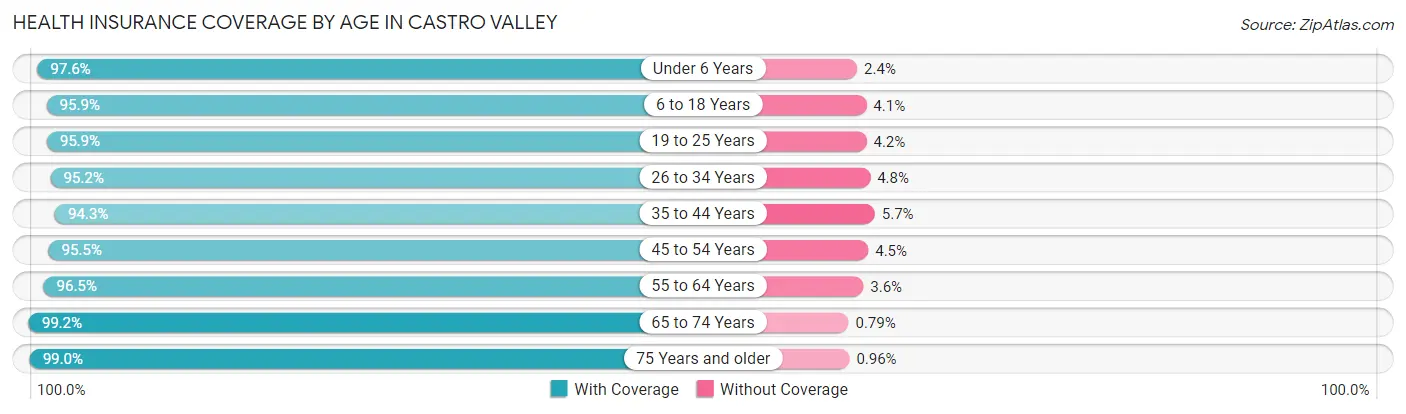
| Age Bracket | With Coverage | Without Coverage |
| Under 6 Years | 3,785 (97.6%) | 93 (2.4%) |
| 6 to 18 Years | 10,079 (95.9%) | 433 (4.1%) |
| 19 to 25 Years | 3,345 (95.9%) | 145 (4.2%) |
| 26 to 34 Years | 6,485 (95.2%) | 329 (4.8%) |
| 35 to 44 Years | 9,451 (94.3%) | 570 (5.7%) |
| 45 to 54 Years | 8,481 (95.5%) | 397 (4.5%) |
| 55 to 64 Years | 9,267 (96.5%) | 341 (3.5%) |
| 65 to 74 Years | 7,121 (99.2%) | 57 (0.8%) |
| 75 Years and older | 4,342 (99.0%) | 42 (1.0%) |
| Total | 62,356 (96.3%) | 2,407 (3.7%) |
Health Insurance Coverage by Citizenship Status in Castro Valley
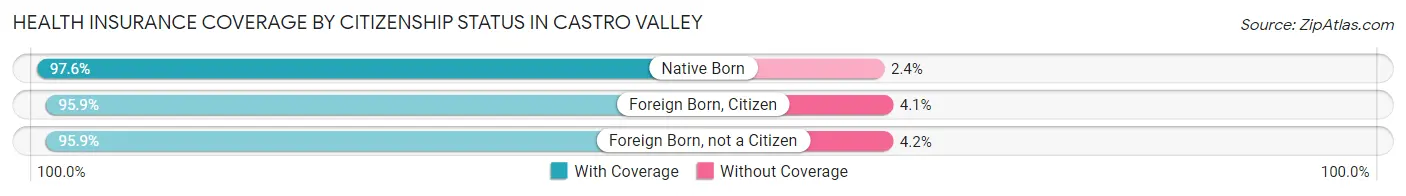
| Citizenship Status | With Coverage | Without Coverage |
| Native Born | 3,785 (97.6%) | 93 (2.4%) |
| Foreign Born, Citizen | 10,079 (95.9%) | 433 (4.1%) |
| Foreign Born, not a Citizen | 3,345 (95.9%) | 145 (4.2%) |
Health Insurance Coverage by Household Income in Castro Valley
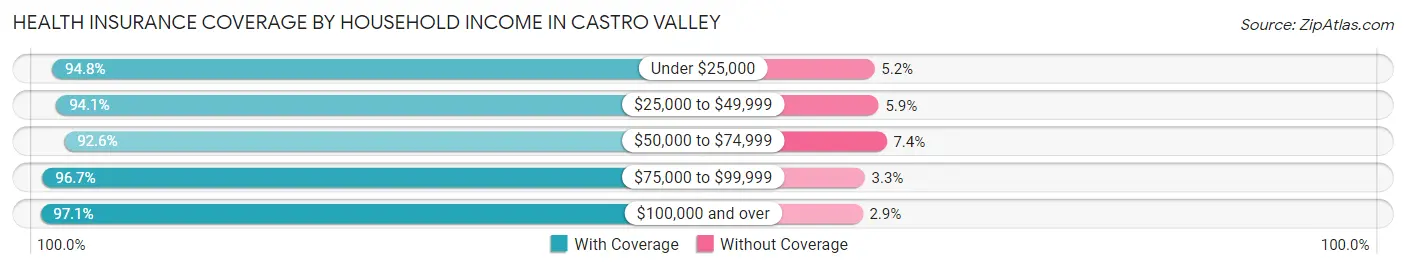
| Household Income | With Coverage | Without Coverage |
| Under $25,000 | 2,897 (94.8%) | 158 (5.2%) |
| $25,000 to $49,999 | 4,331 (94.1%) | 273 (5.9%) |
| $50,000 to $74,999 | 4,757 (92.6%) | 382 (7.4%) |
| $75,000 to $99,999 | 6,453 (96.7%) | 222 (3.3%) |
| $100,000 and over | 43,448 (97.1%) | 1,314 (2.9%) |
Public vs Private Health Insurance Coverage by Age in Castro Valley
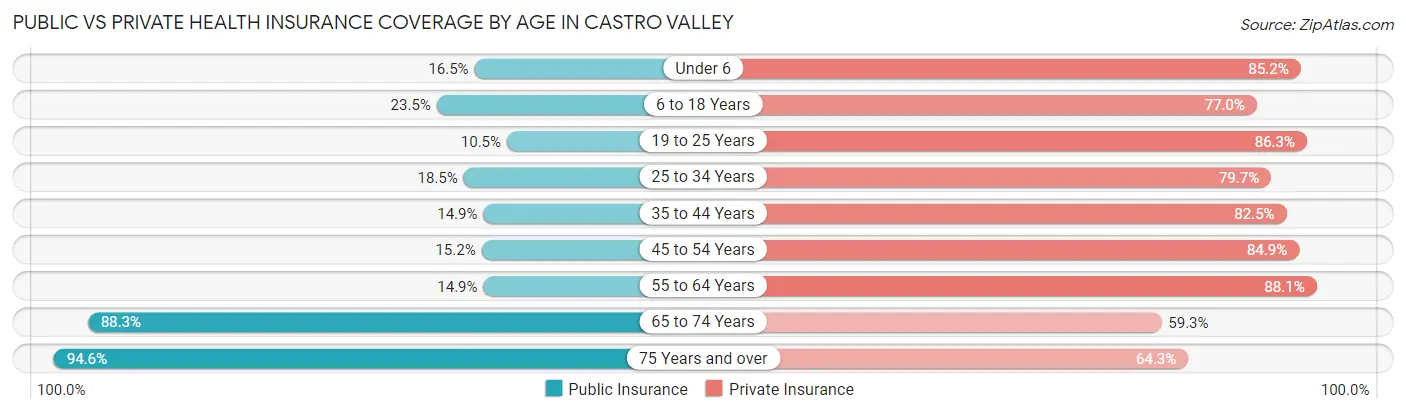
| Age Bracket | Public Insurance | Private Insurance |
| Under 6 | 640 (16.5%) | 3,302 (85.2%) |
| 6 to 18 Years | 2,472 (23.5%) | 8,096 (77.0%) |
| 19 to 25 Years | 366 (10.5%) | 3,012 (86.3%) |
| 25 to 34 Years | 1,262 (18.5%) | 5,428 (79.7%) |
| 35 to 44 Years | 1,489 (14.9%) | 8,269 (82.5%) |
| 45 to 54 Years | 1,349 (15.2%) | 7,535 (84.9%) |
| 55 to 64 Years | 1,427 (14.8%) | 8,465 (88.1%) |
| 65 to 74 Years | 6,337 (88.3%) | 4,257 (59.3%) |
| 75 Years and over | 4,146 (94.6%) | 2,818 (64.3%) |
| Total | 19,488 (30.1%) | 51,182 (79.0%) |
Disability Status by Sex by Age in Castro Valley
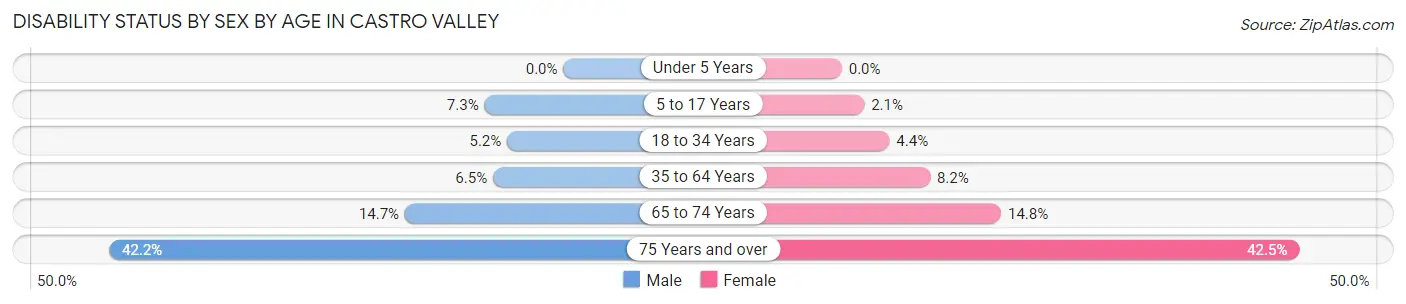
| Age Bracket | Male | Female |
| Under 5 Years | 0 (0.0%) | 0 (0.0%) |
| 5 to 17 Years | 409 (7.3%) | 108 (2.1%) |
| 18 to 34 Years | 266 (5.2%) | 254 (4.4%) |
| 35 to 64 Years | 895 (6.5%) | 1,211 (8.2%) |
| 65 to 74 Years | 537 (14.7%) | 521 (14.8%) |
| 75 Years and over | 740 (42.2%) | 1,116 (42.4%) |
Disability Class by Sex by Age in Castro Valley
Disability Class: Hearing Difficulty
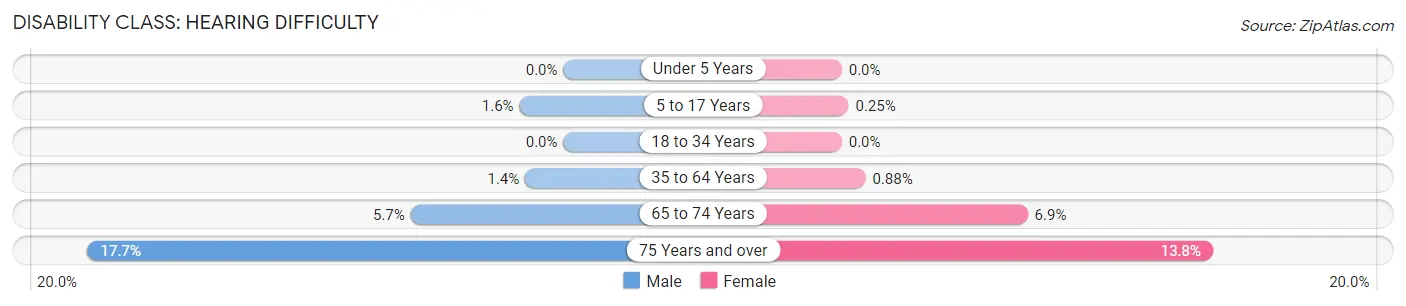
| Age Bracket | Male | Female |
| Under 5 Years | 0 (0.0%) | 0 (0.0%) |
| 5 to 17 Years | 91 (1.6%) | 13 (0.3%) |
| 18 to 34 Years | 0 (0.0%) | 0 (0.0%) |
| 35 to 64 Years | 194 (1.4%) | 130 (0.9%) |
| 65 to 74 Years | 207 (5.7%) | 243 (6.9%) |
| 75 Years and over | 310 (17.7%) | 362 (13.8%) |
Disability Class: Vision Difficulty
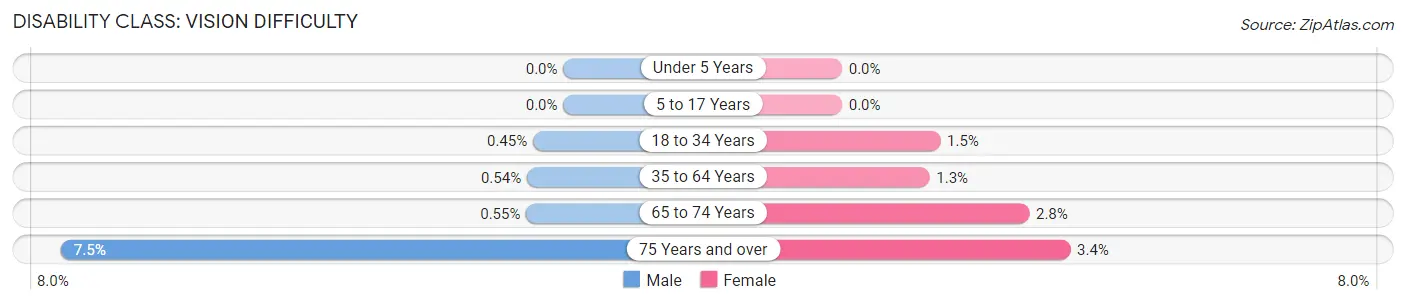
| Age Bracket | Male | Female |
| Under 5 Years | 0 (0.0%) | 0 (0.0%) |
| 5 to 17 Years | 0 (0.0%) | 0 (0.0%) |
| 18 to 34 Years | 23 (0.4%) | 84 (1.5%) |
| 35 to 64 Years | 74 (0.5%) | 193 (1.3%) |
| 65 to 74 Years | 20 (0.5%) | 98 (2.8%) |
| 75 Years and over | 131 (7.5%) | 89 (3.4%) |
Disability Class: Cognitive Difficulty
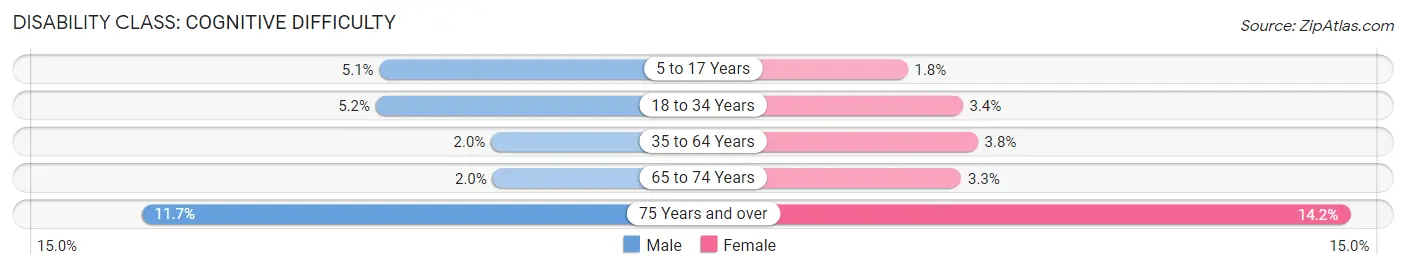
| Age Bracket | Male | Female |
| 5 to 17 Years | 286 (5.1%) | 95 (1.8%) |
| 18 to 34 Years | 266 (5.2%) | 193 (3.4%) |
| 35 to 64 Years | 276 (2.0%) | 560 (3.8%) |
| 65 to 74 Years | 72 (2.0%) | 117 (3.3%) |
| 75 Years and over | 206 (11.7%) | 372 (14.1%) |
Disability Class: Ambulatory Difficulty
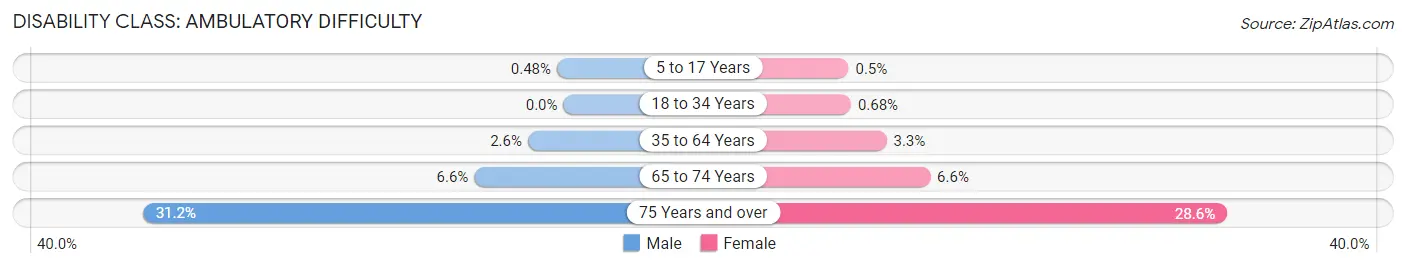
| Age Bracket | Male | Female |
| 5 to 17 Years | 27 (0.5%) | 26 (0.5%) |
| 18 to 34 Years | 0 (0.0%) | 39 (0.7%) |
| 35 to 64 Years | 362 (2.6%) | 491 (3.3%) |
| 65 to 74 Years | 242 (6.6%) | 231 (6.6%) |
| 75 Years and over | 548 (31.2%) | 752 (28.6%) |
Disability Class: Self-Care Difficulty
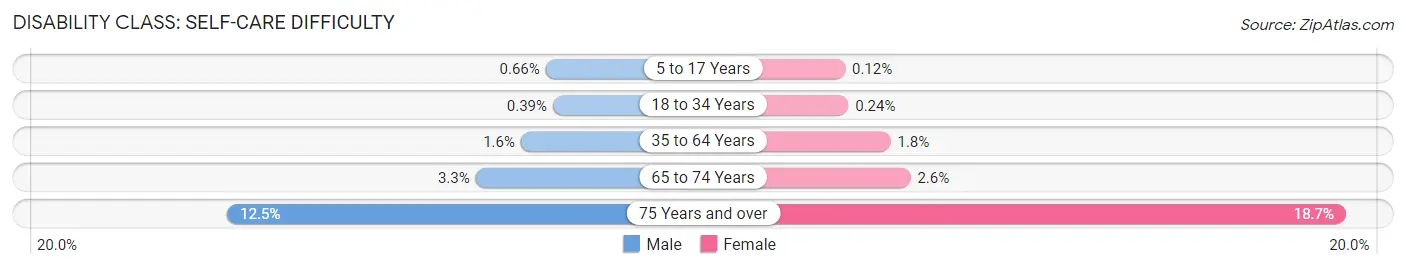
| Age Bracket | Male | Female |
| 5 to 17 Years | 37 (0.7%) | 6 (0.1%) |
| 18 to 34 Years | 20 (0.4%) | 14 (0.2%) |
| 35 to 64 Years | 216 (1.6%) | 268 (1.8%) |
| 65 to 74 Years | 119 (3.3%) | 90 (2.5%) |
| 75 Years and over | 219 (12.5%) | 492 (18.7%) |
Technology Access in Castro Valley
Computing Device Access in Castro Valley
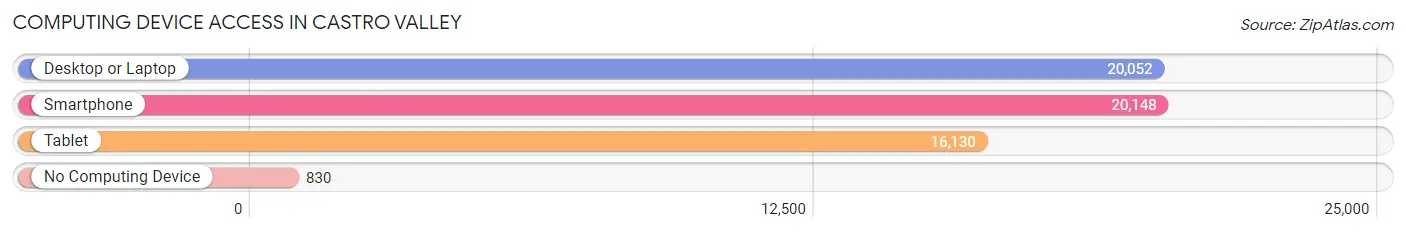
| Device Type | # Households | % Households |
| Desktop or Laptop | 20,052 | 90.7% |
| Smartphone | 20,148 | 91.1% |
| Tablet | 16,130 | 72.9% |
| No Computing Device | 830 | 3.7% |
| Total | 22,117 | 100.0% |
Internet Access in Castro Valley
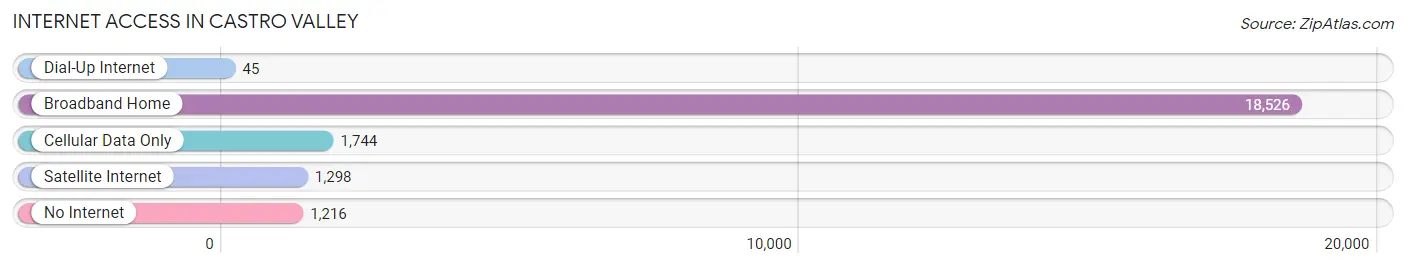
| Internet Type | # Households | % Households |
| Dial-Up Internet | 45 | 0.2% |
| Broadband Home | 18,526 | 83.8% |
| Cellular Data Only | 1,744 | 7.9% |
| Satellite Internet | 1,298 | 5.9% |
| No Internet | 1,216 | 5.5% |
| Total | 22,117 | 100.0% |
Castro Valley Summary
Castro Valley, California is a census-designated place located in Alameda County, California. It is situated in the East Bay region of the San Francisco Bay Area, approximately 25 miles east of Oakland. The population of Castro Valley was 61,388 at the 2010 census, making it the fifth largest community in Alameda County.
History
The area now known as Castro Valley was originally inhabited by the Chocheño, a branch of the Ohlone Native American people. The first recorded European to visit the area was Don Luis Maria Peralta in 1820. Peralta was a Spanish soldier and rancher who was granted the land that is now Castro Valley by the Mexican government. The area was named after Don Guillermo Castro, who was a soldier in the Mexican-American War and a rancher in the area.
In the late 19th century, the area was settled by farmers and ranchers, and the town of Castro Valley was established in 1891. The town was incorporated in 1956, and the population has grown steadily since then.
Geography
Castro Valley is located in the East Bay region of the San Francisco Bay Area. It is situated in the San Francisco Bay watershed, and is bordered by Hayward to the north, San Leandro to the east, and San Lorenzo to the south. The town is located in a valley, with the hills of the East Bay Regional Park District to the west and south.
The town has a total area of 8.3 square miles, of which 8.2 square miles is land and 0.1 square miles is water.
Economy
Castro Valley is a primarily residential community, with a strong retail and service sector. The town is home to a variety of businesses, including retail stores, restaurants, banks, and professional services. The town is also home to several large employers, including the Eden Medical Center, the Castro Valley Unified School District, and the Alameda County Sheriff's Office.
Demographics
As of the 2010 census, there were 61,388 people, 22,945 households, and 16,845 families residing in Castro Valley. The population density was 7,421.3 people per square mile. The racial makeup of the town was 57.2% White, 11.3% African American, 0.7% Native American, 17.2% Asian, 0.3% Pacific Islander, 8.2% from other races, and 5.3% from two or more races. Hispanic or Latino of any race were 19.3% of the population.
The median income for a household in the town was $81,824, and the median income for a family was $95,837. The per capita income for the town was $37,945. About 4.2% of families and 6.2% of the population were below the poverty line, including 8.2% of those under age 18 and 5.2% of those age 65 or over.
Common Questions
What is Per Capita Income in Castro Valley?
Per Capita income in Castro Valley is $56,942.
What is the Median Family Income in Castro Valley?
Median Family Income in Castro Valley is $153,183.
What is the Median Household income in Castro Valley?
Median Household Income in Castro Valley is $132,174.
What is Income or Wage Gap in Castro Valley?
Income or Wage Gap in Castro Valley is 22.0%.
Women in Castro Valley earn 78.0 cents for every dollar earned by a man.
What is Family Income Deficit in Castro Valley?
Family Income Deficit in Castro Valley is $8,704.
Families that are below poverty line in Castro Valley earn $8,704 less on average than the poverty threshold level.
What is Inequality or Gini Index in Castro Valley?
Inequality or Gini Index in Castro Valley is 0.42.
What is the Total Population of Castro Valley?
Total Population of Castro Valley is 65,444.
What is the Total Male Population of Castro Valley?
Total Male Population of Castro Valley is 31,629.
What is the Total Female Population of Castro Valley?
Total Female Population of Castro Valley is 33,815.
What is the Ratio of Males per 100 Females in Castro Valley?
There are 93.54 Males per 100 Females in Castro Valley.
What is the Ratio of Females per 100 Males in Castro Valley?
There are 106.91 Females per 100 Males in Castro Valley.
What is the Median Population Age in Castro Valley?
Median Population Age in Castro Valley is 42.7 Years.
What is the Average Family Size in Castro Valley
Average Family Size in Castro Valley is 3.3 People.
What is the Average Household Size in Castro Valley
Average Household Size in Castro Valley is 2.9 People.
How Large is the Labor Force in Castro Valley?
There are 34,472 People in the Labor Forcein in Castro Valley.
What is the Percentage of People in the Labor Force in Castro Valley?
64.6% of People are in the Labor Force in Castro Valley.
What is the Unemployment Rate in Castro Valley?
Unemployment Rate in Castro Valley is 3.9%.