Santa Clarita, CA Map & Demographics
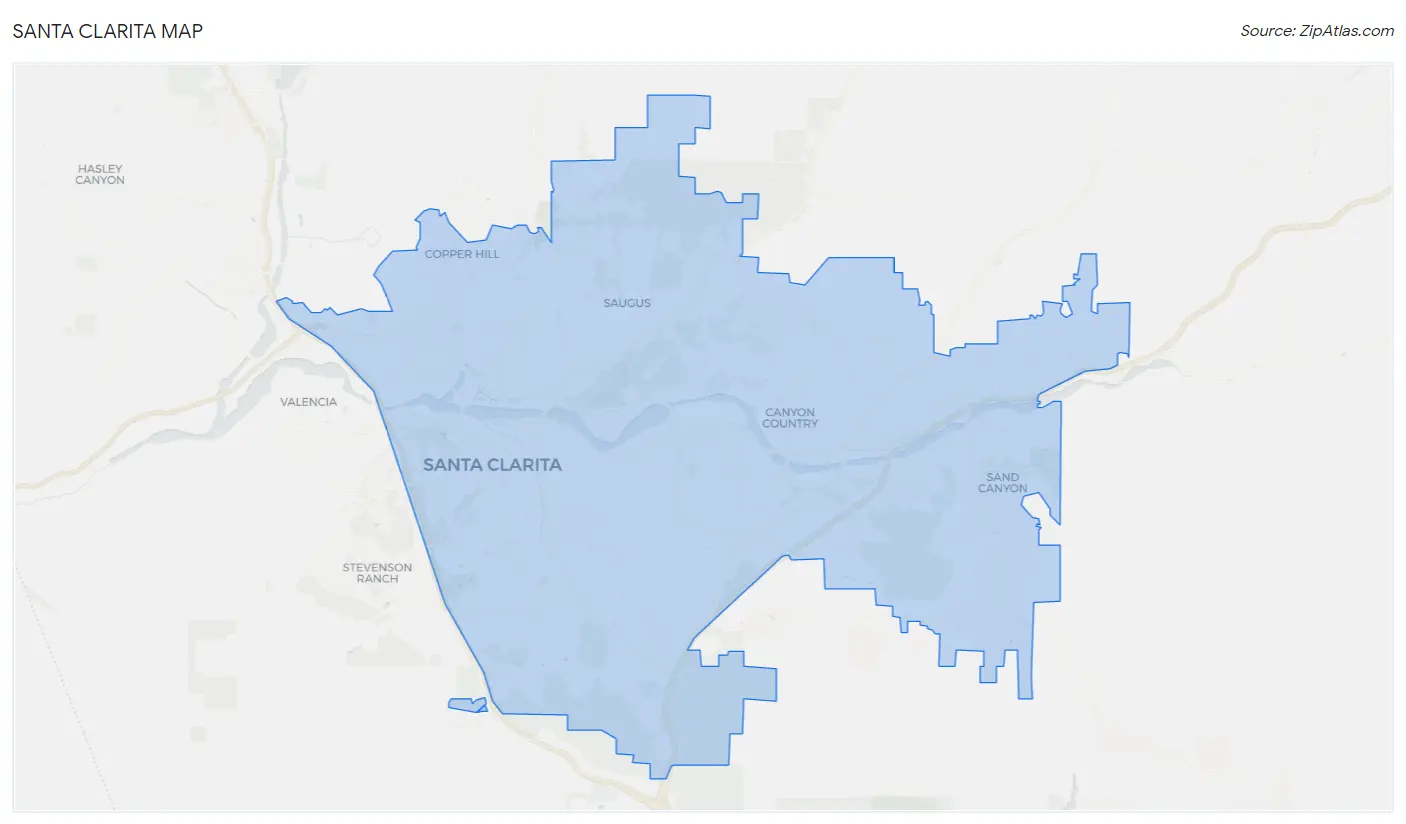
Santa Clarita Map
Santa Clarita Overview
$47,057
PER CAPITA INCOME
$128,916
AVG FAMILY INCOME
$116,186
AVG HOUSEHOLD INCOME
38.0%
WAGE / INCOME GAP [ % ]
62.0¢/ $1
WAGE / INCOME GAP [ $ ]
$11,963
FAMILY INCOME DEFICIT
0.41
INEQUALITY / GINI INDEX
225,850
TOTAL POPULATION
112,189
MALE POPULATION
113,661
FEMALE POPULATION
98.70
MALES / 100 FEMALES
101.31
FEMALES / 100 MALES
37.3
MEDIAN AGE
3.5
AVG FAMILY SIZE
3.0
AVG HOUSEHOLD SIZE
117,716
LABOR FORCE [ PEOPLE ]
67.3%
PERCENT IN LABOR FORCE
5.5%
UNEMPLOYMENT RATE
Income in Santa Clarita
Income Overview in Santa Clarita
Per Capita Income in Santa Clarita is $47,057, while median incomes of families and households are $128,916 and $116,186 respectively.
| Characteristic | Number | Measure |
| Per Capita Income | 225,850 | $47,057 |
| Median Family Income | 56,157 | $128,916 |
| Mean Family Income | 56,157 | $153,638 |
| Median Household Income | 73,362 | $116,186 |
| Mean Household Income | 73,362 | $141,907 |
| Income Deficit | 56,157 | $11,963 |
| Wage / Income Gap (%) | 225,850 | 37.97% |
| Wage / Income Gap ($) | 225,850 | 62.03¢ per $1 |
| Gini / Inequality Index | 225,850 | 0.41 |
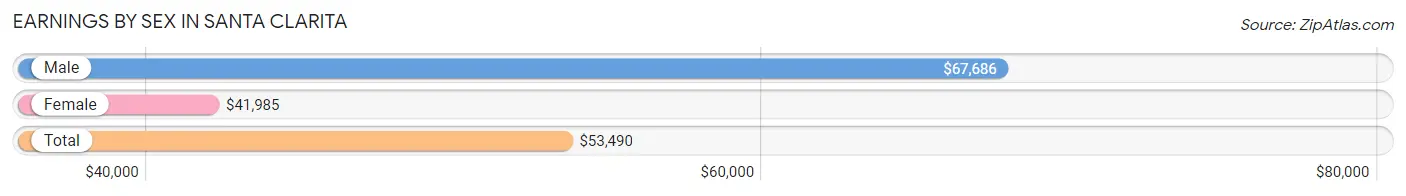
Earnings by Sex in Santa Clarita
Average Earnings in Santa Clarita are $53,490, $67,686 for men and $41,985 for women, a difference of 38.0%.
| Sex | Number | Average Earnings |
| Male | 65,771 (54.8%) | $67,686 |
| Female | 54,271 (45.2%) | $41,985 |
| Total | 120,042 (100.0%) | $53,490 |
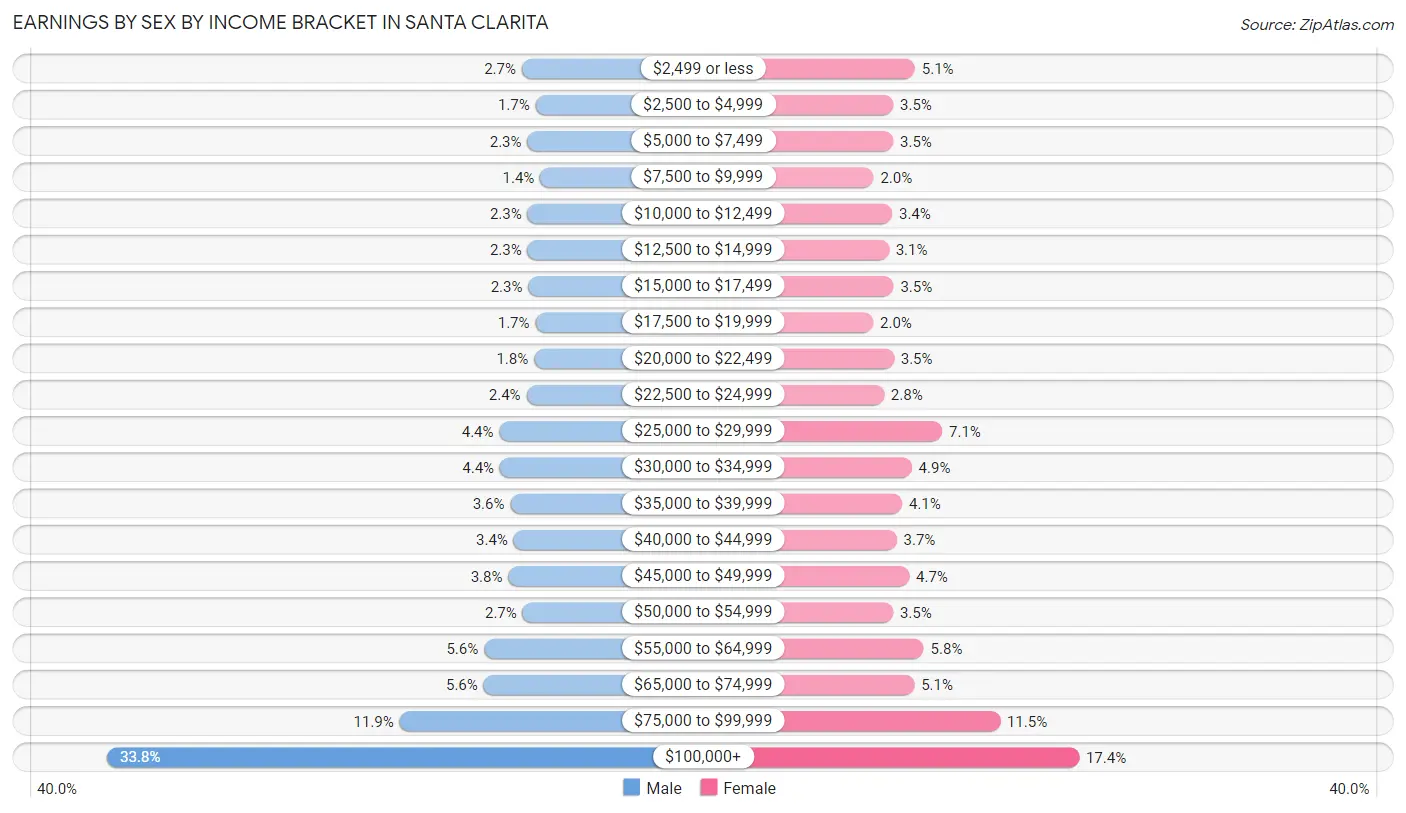
Earnings by Sex by Income Bracket in Santa Clarita
The most common earnings brackets in Santa Clarita are $100,000+ for men (22,246 | 33.8%) and $100,000+ for women (9,441 | 17.4%).
| Income | Male | Female |
| $2,499 or less | 1,799 (2.7%) | 2,768 (5.1%) |
| $2,500 to $4,999 | 1,124 (1.7%) | 1,881 (3.5%) |
| $5,000 to $7,499 | 1,525 (2.3%) | 1,883 (3.5%) |
| $7,500 to $9,999 | 892 (1.4%) | 1,088 (2.0%) |
| $10,000 to $12,499 | 1,518 (2.3%) | 1,839 (3.4%) |
| $12,500 to $14,999 | 1,517 (2.3%) | 1,702 (3.1%) |
| $15,000 to $17,499 | 1,479 (2.2%) | 1,901 (3.5%) |
| $17,500 to $19,999 | 1,134 (1.7%) | 1,070 (2.0%) |
| $20,000 to $22,499 | 1,199 (1.8%) | 1,909 (3.5%) |
| $22,500 to $24,999 | 1,574 (2.4%) | 1,510 (2.8%) |
| $25,000 to $29,999 | 2,910 (4.4%) | 3,876 (7.1%) |
| $30,000 to $34,999 | 2,879 (4.4%) | 2,635 (4.9%) |
| $35,000 to $39,999 | 2,366 (3.6%) | 2,246 (4.1%) |
| $40,000 to $44,999 | 2,203 (3.4%) | 2,022 (3.7%) |
| $45,000 to $49,999 | 2,465 (3.7%) | 2,532 (4.7%) |
| $50,000 to $54,999 | 1,765 (2.7%) | 1,877 (3.5%) |
| $55,000 to $64,999 | 3,664 (5.6%) | 3,124 (5.8%) |
| $65,000 to $74,999 | 3,683 (5.6%) | 2,739 (5.1%) |
| $75,000 to $99,999 | 7,829 (11.9%) | 6,228 (11.5%) |
| $100,000+ | 22,246 (33.8%) | 9,441 (17.4%) |
| Total | 65,771 (100.0%) | 54,271 (100.0%) |
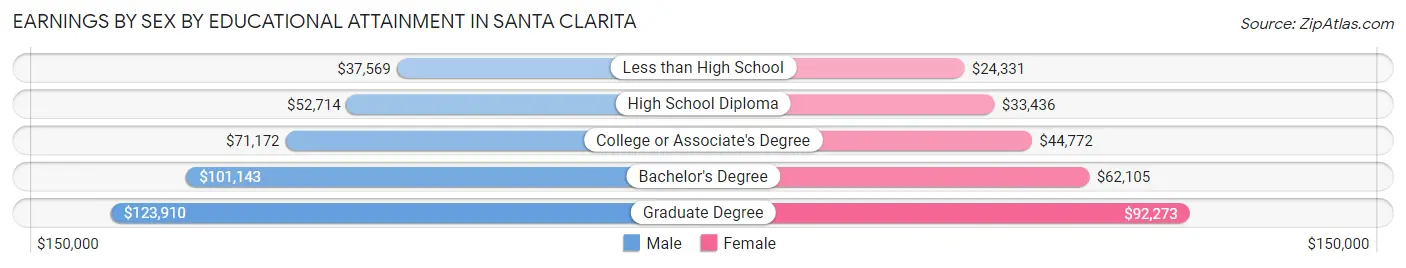
Earnings by Sex by Educational Attainment in Santa Clarita
Average earnings in Santa Clarita are $77,242 for men and $49,588 for women, a difference of 35.8%. Men with an educational attainment of graduate degree enjoy the highest average annual earnings of $123,910, while those with less than high school education earn the least with $37,569. Women with an educational attainment of graduate degree earn the most with the average annual earnings of $92,273, while those with less than high school education have the smallest earnings of $24,331.
| Educational Attainment | Male Income | Female Income |
| Less than High School | $37,569 | $24,331 |
| High School Diploma | $52,714 | $33,436 |
| College or Associate's Degree | $71,172 | $44,772 |
| Bachelor's Degree | $101,143 | $62,105 |
| Graduate Degree | $123,910 | $92,273 |
| Total | $77,242 | $49,588 |
Family Income in Santa Clarita
Family Income Brackets in Santa Clarita
According to the Santa Clarita family income data, there are 13,983 families falling into the $200,000+ income range, which is the most common income bracket and makes up 24.9% of all families. Conversely, the $10,000 to $14,999 income bracket is the least frequent group with only 393 families (0.7%) belonging to this category.
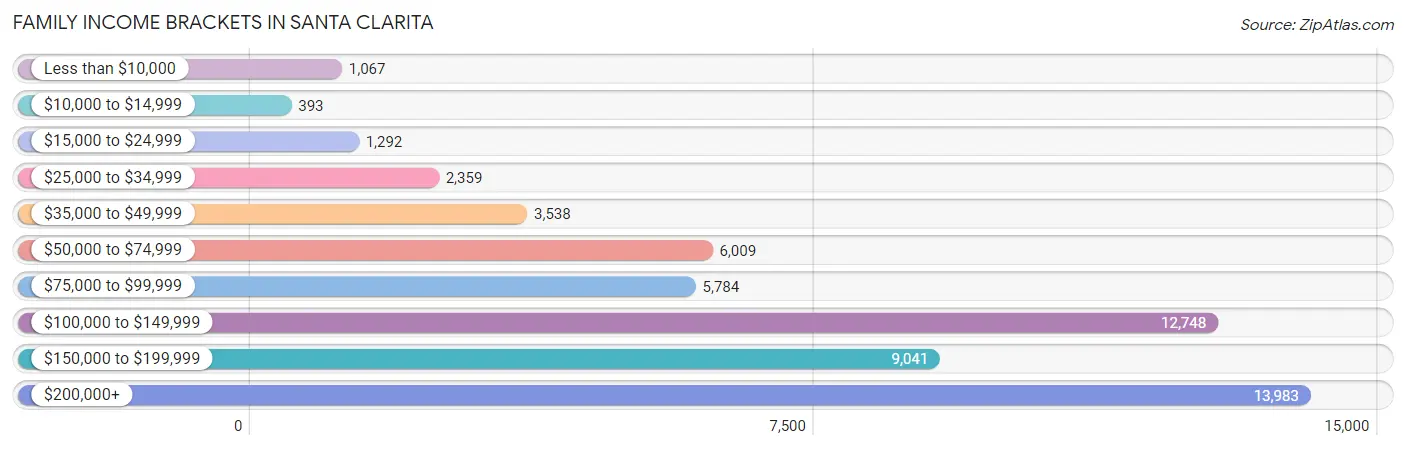
| Income Bracket | # Families | % Families |
| Less than $10,000 | 1,067 | 1.9% |
| $10,000 to $14,999 | 393 | 0.7% |
| $15,000 to $24,999 | 1,292 | 2.3% |
| $25,000 to $34,999 | 2,359 | 4.2% |
| $35,000 to $49,999 | 3,538 | 6.3% |
| $50,000 to $74,999 | 6,009 | 10.7% |
| $75,000 to $99,999 | 5,784 | 10.3% |
| $100,000 to $149,999 | 12,748 | 22.7% |
| $150,000 to $199,999 | 9,041 | 16.1% |
| $200,000+ | 13,983 | 24.9% |
Family Income by Famaliy Size in Santa Clarita
4-person families (13,174 | 23.5%) account for the highest median family income in Santa Clarita with $152,955 per family, while 2-person families (20,141 | 35.9%) have the highest median income of $54,209 per family member.
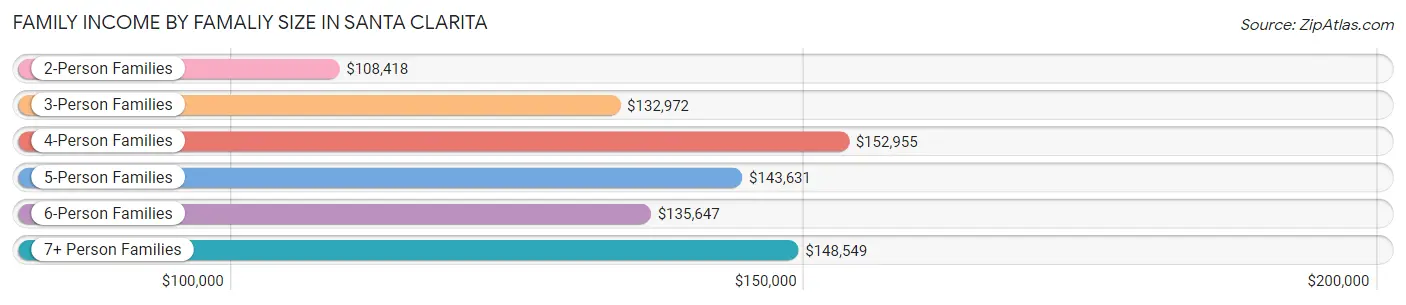
| Income Bracket | # Families | Median Income |
| 2-Person Families | 20,141 (35.9%) | $108,418 |
| 3-Person Families | 13,679 (24.4%) | $132,972 |
| 4-Person Families | 13,174 (23.5%) | $152,955 |
| 5-Person Families | 5,546 (9.9%) | $143,631 |
| 6-Person Families | 2,303 (4.1%) | $135,647 |
| 7+ Person Families | 1,314 (2.3%) | $148,549 |
| Total | 56,157 (100.0%) | $128,916 |
Family Income by Number of Earners in Santa Clarita
The median family income in Santa Clarita is $128,916, with families comprising 3+ earners (8,777) having the highest median family income of $182,703, while families with no earners (4,946) have the lowest median family income of $61,823, accounting for 15.6% and 8.8% of families, respectively.
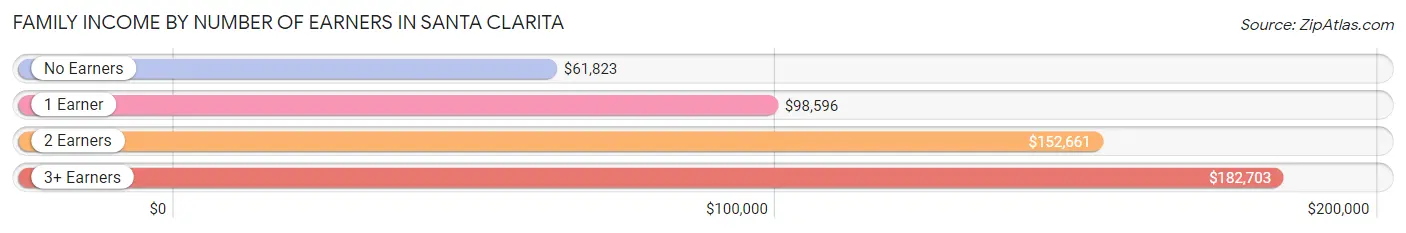
| Number of Earners | # Families | Median Income |
| No Earners | 4,946 (8.8%) | $61,823 |
| 1 Earner | 18,065 (32.2%) | $98,596 |
| 2 Earners | 24,369 (43.4%) | $152,661 |
| 3+ Earners | 8,777 (15.6%) | $182,703 |
| Total | 56,157 (100.0%) | $128,916 |
Household Income in Santa Clarita
Household Income Brackets in Santa Clarita
With 16,140 households falling in the category, the $200,000+ income range is the most frequent in Santa Clarita, accounting for 22.0% of all households. In contrast, only 1,100 households (1.5%) fall into the $10,000 to $14,999 income bracket, making it the least populous group.
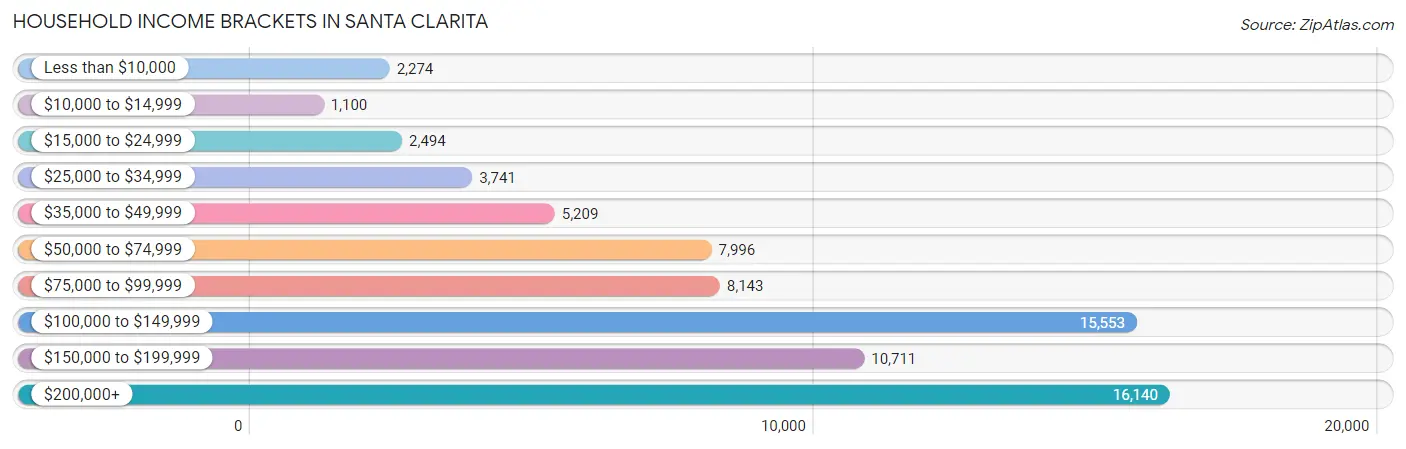
| Income Bracket | # Households | % Households |
| Less than $10,000 | 2,274 | 3.1% |
| $10,000 to $14,999 | 1,100 | 1.5% |
| $15,000 to $24,999 | 2,494 | 3.4% |
| $25,000 to $34,999 | 3,741 | 5.1% |
| $35,000 to $49,999 | 5,209 | 7.1% |
| $50,000 to $74,999 | 7,996 | 10.9% |
| $75,000 to $99,999 | 8,143 | 11.1% |
| $100,000 to $149,999 | 15,553 | 21.2% |
| $150,000 to $199,999 | 10,711 | 14.6% |
| $200,000+ | 16,140 | 22.0% |
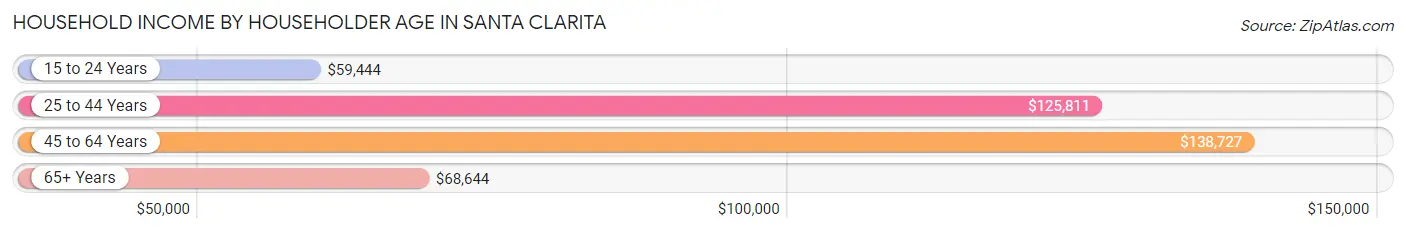
Household Income by Householder Age in Santa Clarita
The median household income in Santa Clarita is $116,186, with the highest median household income of $138,727 found in the 45 to 64 years age bracket for the primary householder. A total of 32,387 households (44.2%) fall into this category. Meanwhile, the 15 to 24 years age bracket for the primary householder has the lowest median household income of $59,444, with 1,072 households (1.5%) in this group.
| Income Bracket | # Households | Median Income |
| 15 to 24 Years | 1,072 (1.5%) | $59,444 |
| 25 to 44 Years | 23,819 (32.5%) | $125,811 |
| 45 to 64 Years | 32,387 (44.2%) | $138,727 |
| 65+ Years | 16,084 (21.9%) | $68,644 |
| Total | 73,362 (100.0%) | $116,186 |
Poverty in Santa Clarita
Income Below Poverty by Sex and Age in Santa Clarita
With 7.4% poverty level for males and 8.5% for females among the residents of Santa Clarita, 18 to 24 year old males and 75 year old and over females are the most vulnerable to poverty, with 1,434 males (14.9%) and 988 females (14.7%) in their respective age groups living below the poverty level.
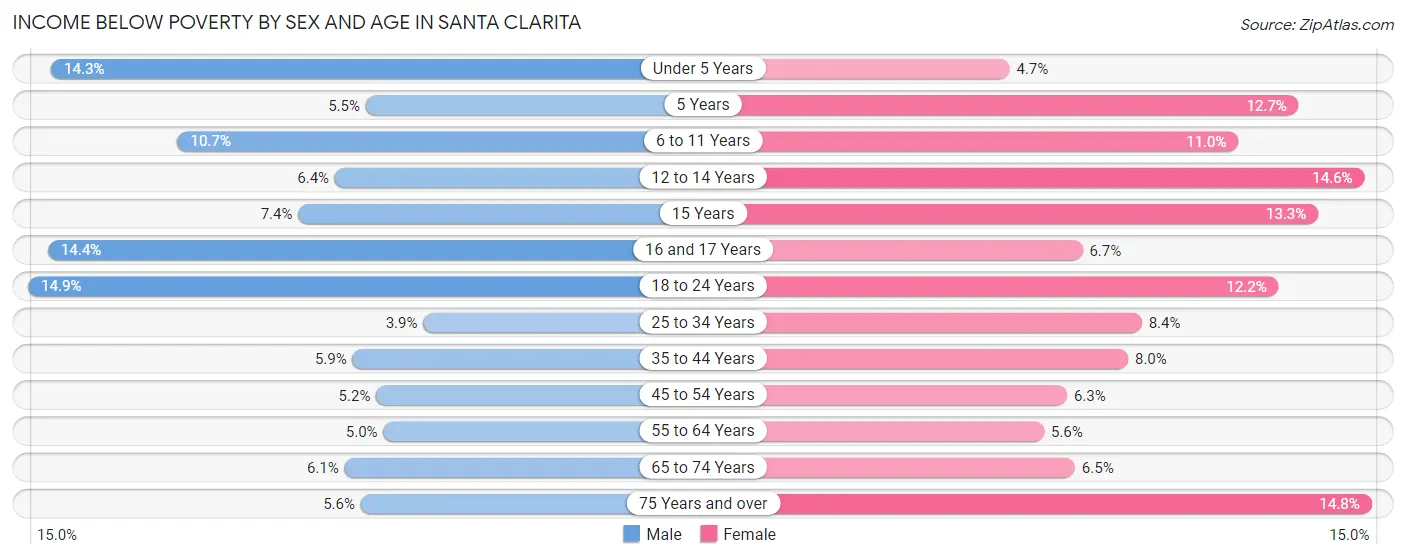
| Age Bracket | Male | Female |
| Under 5 Years | 1,079 (14.3%) | 345 (4.7%) |
| 5 Years | 79 (5.5%) | 133 (12.7%) |
| 6 to 11 Years | 987 (10.7%) | 1,012 (11.0%) |
| 12 to 14 Years | 355 (6.4%) | 741 (14.5%) |
| 15 Years | 124 (7.4%) | 258 (13.3%) |
| 16 and 17 Years | 412 (14.3%) | 237 (6.7%) |
| 18 to 24 Years | 1,434 (14.9%) | 1,046 (12.2%) |
| 25 to 34 Years | 559 (3.9%) | 1,186 (8.4%) |
| 35 to 44 Years | 945 (5.9%) | 1,227 (8.0%) |
| 45 to 54 Years | 859 (5.2%) | 1,024 (6.3%) |
| 55 to 64 Years | 725 (5.0%) | 774 (5.6%) |
| 65 to 74 Years | 463 (6.1%) | 609 (6.5%) |
| 75 Years and over | 239 (5.6%) | 988 (14.7%) |
| Total | 8,260 (7.4%) | 9,580 (8.5%) |
Income Above Poverty by Sex and Age in Santa Clarita
According to the poverty statistics in Santa Clarita, males aged 25 to 34 years and females aged under 5 years are the age groups that are most secure financially, with 96.1% of males and 95.3% of females in these age groups living above the poverty line.
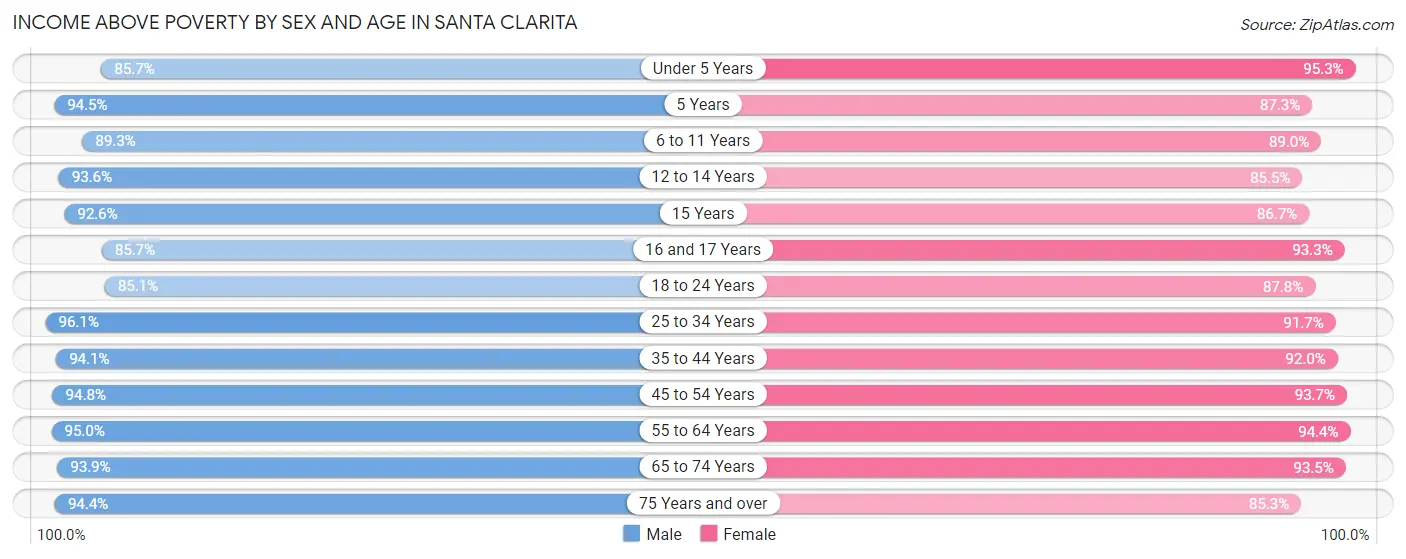
| Age Bracket | Male | Female |
| Under 5 Years | 6,490 (85.7%) | 7,046 (95.3%) |
| 5 Years | 1,358 (94.5%) | 913 (87.3%) |
| 6 to 11 Years | 8,206 (89.3%) | 8,152 (89.0%) |
| 12 to 14 Years | 5,229 (93.6%) | 4,351 (85.5%) |
| 15 Years | 1,557 (92.6%) | 1,687 (86.7%) |
| 16 and 17 Years | 2,459 (85.7%) | 3,298 (93.3%) |
| 18 to 24 Years | 8,193 (85.1%) | 7,558 (87.8%) |
| 25 to 34 Years | 13,776 (96.1%) | 13,022 (91.6%) |
| 35 to 44 Years | 15,147 (94.1%) | 14,161 (92.0%) |
| 45 to 54 Years | 15,632 (94.8%) | 15,320 (93.7%) |
| 55 to 64 Years | 13,757 (95.0%) | 12,967 (94.4%) |
| 65 to 74 Years | 7,140 (93.9%) | 8,781 (93.5%) |
| 75 Years and over | 3,999 (94.4%) | 5,710 (85.3%) |
| Total | 102,943 (92.6%) | 102,966 (91.5%) |
Income Below Poverty Among Married-Couple Families in Santa Clarita
The poverty statistics for married-couple families in Santa Clarita show that 3.5% or 1,551 of the total 43,772 families live below the poverty line. Families with 5 or more children have the highest poverty rate of 8.7%, comprising of 35 families. On the other hand, families with no children have the lowest poverty rate of 2.3%, which includes 518 families.
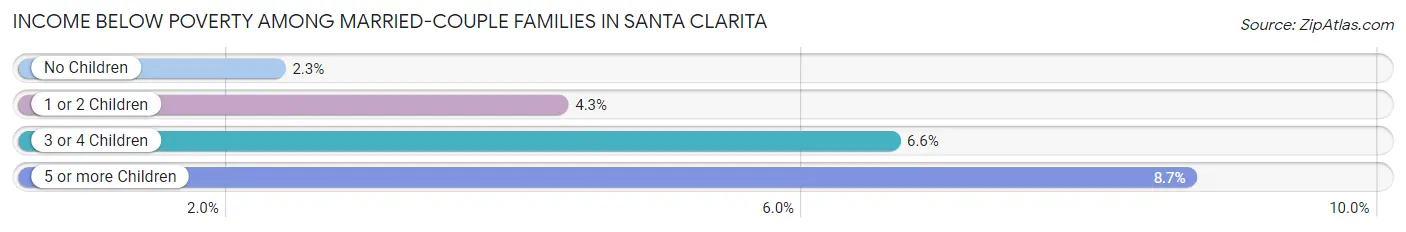
| Children | Above Poverty | Below Poverty |
| No Children | 21,734 (97.7%) | 518 (2.3%) |
| 1 or 2 Children | 16,518 (95.7%) | 743 (4.3%) |
| 3 or 4 Children | 3,601 (93.4%) | 255 (6.6%) |
| 5 or more Children | 368 (91.3%) | 35 (8.7%) |
| Total | 42,221 (96.5%) | 1,551 (3.5%) |
Income Below Poverty Among Single-Parent Households in Santa Clarita
According to the poverty data in Santa Clarita, 8.0% or 331 single-father households and 13.0% or 1,071 single-mother households are living below the poverty line. Among single-father households, those with 3 or 4 children have the highest poverty rate, with 34 households (18.9%) experiencing poverty. Likewise, among single-mother households, those with 3 or 4 children have the highest poverty rate, with 399 households (58.0%) falling below the poverty line.
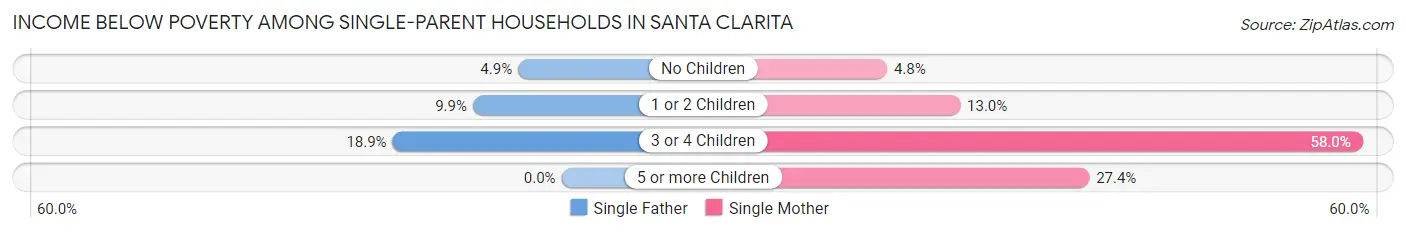
| Children | Single Father | Single Mother |
| No Children | 84 (4.9%) | 200 (4.8%) |
| 1 or 2 Children | 213 (9.9%) | 427 (13.0%) |
| 3 or 4 Children | 34 (18.9%) | 399 (58.0%) |
| 5 or more Children | 0 (0.0%) | 45 (27.4%) |
| Total | 331 (8.0%) | 1,071 (13.0%) |
Income Below Poverty Among Married-Couple vs Single-Parent Households in Santa Clarita
The poverty data for Santa Clarita shows that 1,551 of the married-couple family households (3.5%) and 1,402 of the single-parent households (11.3%) are living below the poverty level. Within the married-couple family households, those with 5 or more children have the highest poverty rate, with 35 households (8.7%) falling below the poverty line. Among the single-parent households, those with 3 or 4 children have the highest poverty rate, with 433 household (49.9%) living below poverty.
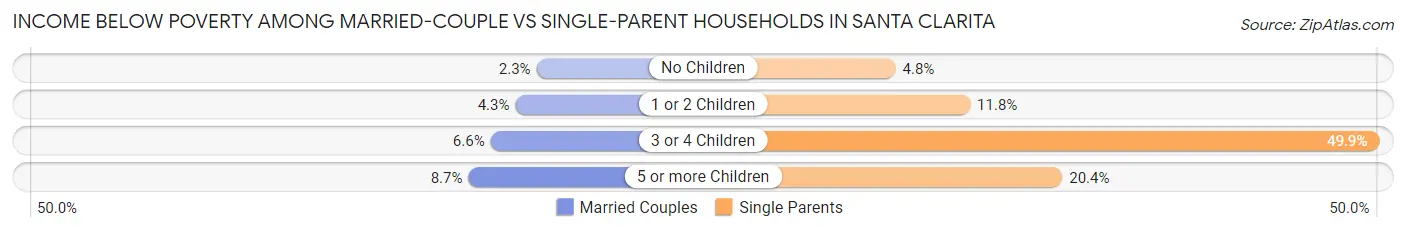
| Children | Married-Couple Families | Single-Parent Households |
| No Children | 518 (2.3%) | 284 (4.8%) |
| 1 or 2 Children | 743 (4.3%) | 640 (11.8%) |
| 3 or 4 Children | 255 (6.6%) | 433 (49.9%) |
| 5 or more Children | 35 (8.7%) | 45 (20.4%) |
| Total | 1,551 (3.5%) | 1,402 (11.3%) |
Race in Santa Clarita
The most populous races in Santa Clarita are White / Caucasian (127,919 | 56.6%), Hispanic or Latino (82,873 | 36.7%), and Two or more Races (36,905 | 16.3%).
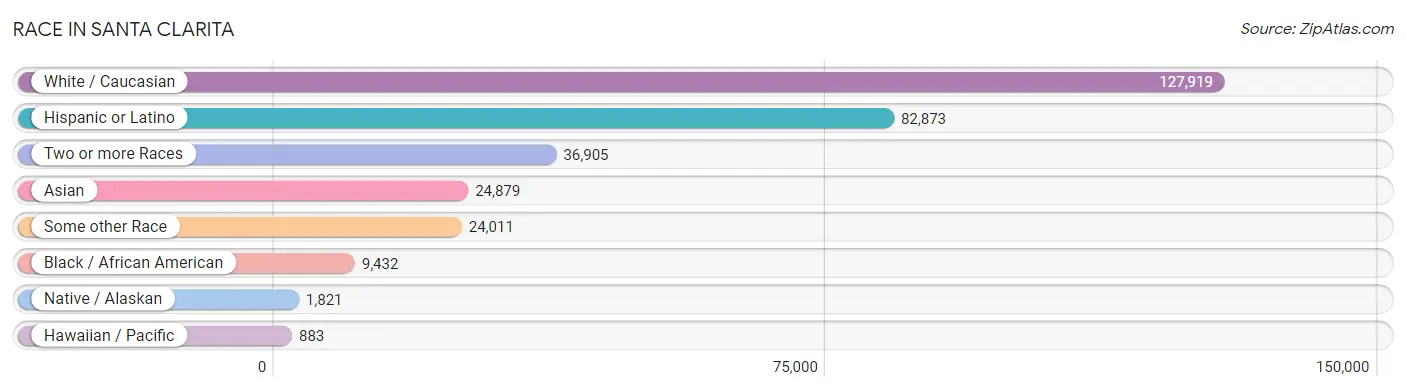
| Race | # Population | % Population |
| Asian | 24,879 | 11.0% |
| Black / African American | 9,432 | 4.2% |
| Hawaiian / Pacific | 883 | 0.4% |
| Hispanic or Latino | 82,873 | 36.7% |
| Native / Alaskan | 1,821 | 0.8% |
| White / Caucasian | 127,919 | 56.6% |
| Two or more Races | 36,905 | 16.3% |
| Some other Race | 24,011 | 10.6% |
| Total | 225,850 | 100.0% |
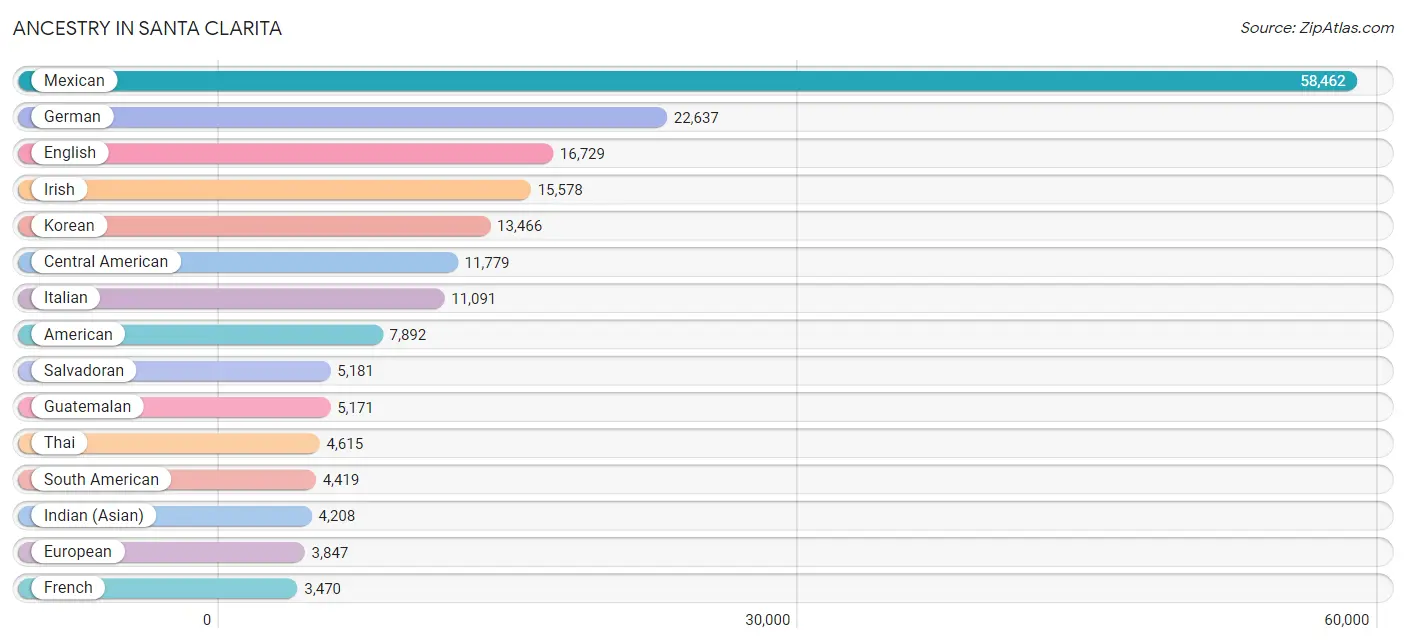
Ancestry in Santa Clarita
The most populous ancestries reported in Santa Clarita are Mexican (58,462 | 25.9%), German (22,637 | 10.0%), English (16,729 | 7.4%), Irish (15,578 | 6.9%), and Korean (13,466 | 6.0%), together accounting for 56.2% of all Santa Clarita residents.
| Ancestry | # Population | % Population |
| Afghan | 159 | 0.1% |
| African | 597 | 0.3% |
| Alaskan Athabascan | 17 | 0.0% |
| Albanian | 20 | 0.0% |
| American | 7,892 | 3.5% |
| Apache | 361 | 0.2% |
| Arab | 3,354 | 1.5% |
| Argentinean | 756 | 0.3% |
| Armenian | 2,877 | 1.3% |
| Assyrian / Chaldean / Syriac | 307 | 0.1% |
| Australian | 116 | 0.1% |
| Austrian | 367 | 0.2% |
| Bangladeshi | 71 | 0.0% |
| Barbadian | 5 | 0.0% |
| Basque | 40 | 0.0% |
| Belgian | 210 | 0.1% |
| Belizean | 61 | 0.0% |
| Bhutanese | 2,357 | 1.0% |
| Blackfeet | 160 | 0.1% |
| Bolivian | 77 | 0.0% |
| Brazilian | 980 | 0.4% |
| British | 1,295 | 0.6% |
| British West Indian | 3 | 0.0% |
| Bulgarian | 91 | 0.0% |
| Burmese | 3,430 | 1.5% |
| Cajun | 22 | 0.0% |
| Canadian | 692 | 0.3% |
| Central American | 11,779 | 5.2% |
| Central American Indian | 879 | 0.4% |
| Cherokee | 800 | 0.4% |
| Chickasaw | 18 | 0.0% |
| Chilean | 414 | 0.2% |
| Chinese | 11 | 0.0% |
| Chippewa | 27 | 0.0% |
| Choctaw | 245 | 0.1% |
| Colombian | 888 | 0.4% |
| Comanche | 2 | 0.0% |
| Costa Rican | 167 | 0.1% |
| Cree | 14 | 0.0% |
| Creek | 22 | 0.0% |
| Croatian | 208 | 0.1% |
| Cuban | 1,193 | 0.5% |
| Czech | 702 | 0.3% |
| Czechoslovakian | 146 | 0.1% |
| Danish | 1,074 | 0.5% |
| Dominican | 58 | 0.0% |
| Dutch | 1,512 | 0.7% |
| Dutch West Indian | 9 | 0.0% |
| Eastern European | 771 | 0.3% |
| Ecuadorian | 561 | 0.3% |
| Egyptian | 793 | 0.4% |
| English | 16,729 | 7.4% |
| Ethiopian | 40 | 0.0% |
| European | 3,847 | 1.7% |
| Filipino | 329 | 0.2% |
| Finnish | 260 | 0.1% |
| French | 3,470 | 1.5% |
| French American Indian | 116 | 0.1% |
| French Canadian | 734 | 0.3% |
| German | 22,637 | 10.0% |
| Ghanaian | 23 | 0.0% |
| Greek | 782 | 0.4% |
| Guamanian / Chamorro | 292 | 0.1% |
| Guatemalan | 5,171 | 2.3% |
| Guyanese | 3 | 0.0% |
| Haitian | 92 | 0.0% |
| Honduran | 463 | 0.2% |
| Hungarian | 1,524 | 0.7% |
| Icelander | 237 | 0.1% |
| Indian (Asian) | 4,208 | 1.9% |
| Inupiat | 53 | 0.0% |
| Iranian | 1,099 | 0.5% |
| Iraqi | 94 | 0.0% |
| Irish | 15,578 | 6.9% |
| Iroquois | 9 | 0.0% |
| Israeli | 114 | 0.1% |
| Italian | 11,091 | 4.9% |
| Jamaican | 153 | 0.1% |
| Japanese | 113 | 0.1% |
| Jordanian | 159 | 0.1% |
| Kenyan | 50 | 0.0% |
| Korean | 13,466 | 6.0% |
| Laotian | 289 | 0.1% |
| Latvian | 20 | 0.0% |
| Lebanese | 654 | 0.3% |
| Lithuanian | 300 | 0.1% |
| Luxembourger | 8 | 0.0% |
| Malaysian | 66 | 0.0% |
| Maltese | 9 | 0.0% |
| Mexican | 58,462 | 25.9% |
| Mexican American Indian | 311 | 0.1% |
| Moroccan | 76 | 0.0% |
| Native Hawaiian | 445 | 0.2% |
| Navajo | 134 | 0.1% |
| Nicaraguan | 773 | 0.3% |
| Nigerian | 140 | 0.1% |
| Northern European | 338 | 0.2% |
| Norwegian | 2,261 | 1.0% |
| Pakistani | 741 | 0.3% |
| Palestinian | 134 | 0.1% |
| Panamanian | 24 | 0.0% |
| Pennsylvania German | 58 | 0.0% |
| Peruvian | 1,255 | 0.6% |
| Pima | 70 | 0.0% |
| Polish | 3,182 | 1.4% |
| Portuguese | 764 | 0.3% |
| Potawatomi | 12 | 0.0% |
| Pueblo | 11 | 0.0% |
| Puerto Rican | 1,604 | 0.7% |
| Puget Sound Salish | 7 | 0.0% |
| Romanian | 451 | 0.2% |
| Russian | 3,141 | 1.4% |
| Salvadoran | 5,181 | 2.3% |
| Samoan | 378 | 0.2% |
| Scandinavian | 587 | 0.3% |
| Scotch-Irish | 1,030 | 0.5% |
| Scottish | 2,828 | 1.3% |
| Serbian | 40 | 0.0% |
| Sioux | 12 | 0.0% |
| Slavic | 250 | 0.1% |
| Slovak | 223 | 0.1% |
| Slovene | 160 | 0.1% |
| South African | 13 | 0.0% |
| South American | 4,419 | 2.0% |
| South American Indian | 32 | 0.0% |
| Spaniard | 1,858 | 0.8% |
| Spanish | 978 | 0.4% |
| Spanish American | 20 | 0.0% |
| Spanish American Indian | 20 | 0.0% |
| Sri Lankan | 1,270 | 0.6% |
| Subsaharan African | 1,019 | 0.4% |
| Swedish | 2,212 | 1.0% |
| Swiss | 532 | 0.2% |
| Syrian | 721 | 0.3% |
| Thai | 4,615 | 2.0% |
| Tongan | 50 | 0.0% |
| Turkish | 166 | 0.1% |
| Ugandan | 61 | 0.0% |
| Ukrainian | 764 | 0.3% |
| Uruguayan | 29 | 0.0% |
| Venezuelan | 425 | 0.2% |
| Vietnamese | 124 | 0.1% |
| Welsh | 1,132 | 0.5% |
| West Indian | 402 | 0.2% |
| Yaqui | 8 | 0.0% |
| Yugoslavian | 90 | 0.0% |
| Yuman | 21 | 0.0% |
| Zimbabwean | 37 | 0.0% | View All 148 Rows |
Immigrants in Santa Clarita
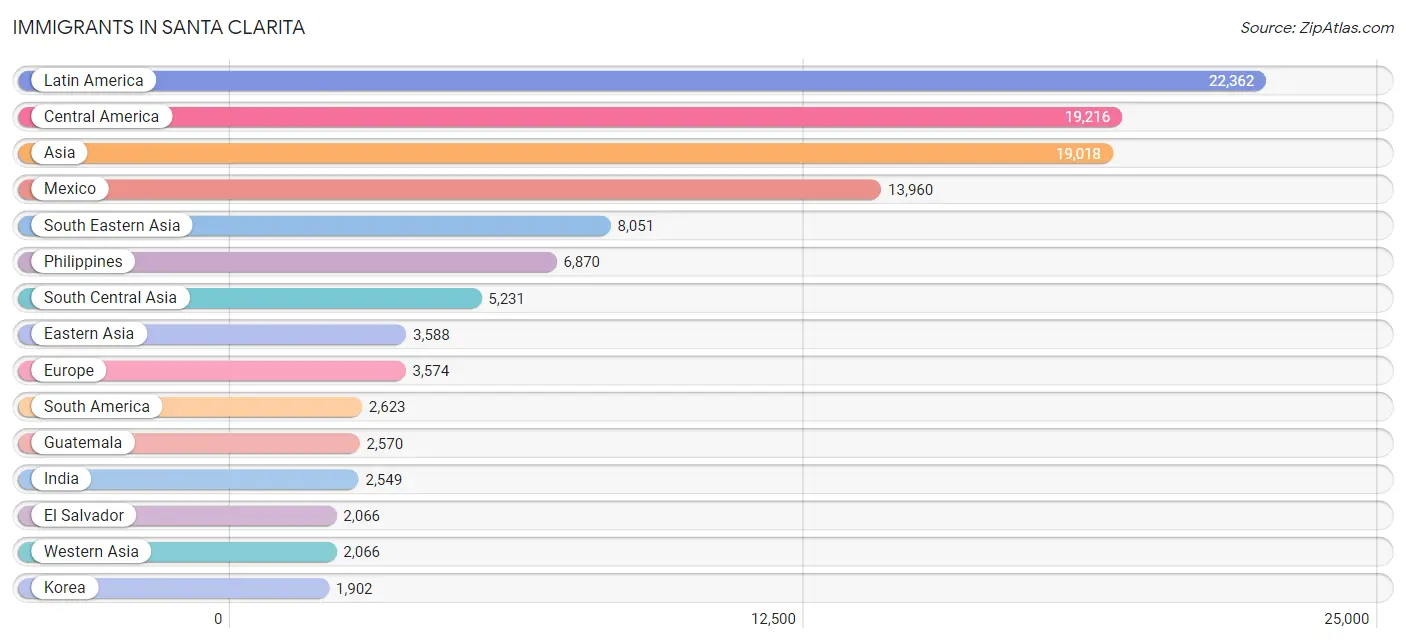
The most numerous immigrant groups reported in Santa Clarita came from Latin America (22,362 | 9.9%), Central America (19,216 | 8.5%), Asia (19,018 | 8.4%), Mexico (13,960 | 6.2%), and South Eastern Asia (8,051 | 3.6%), together accounting for 36.6% of all Santa Clarita residents.
| Immigration Origin | # Population | % Population |
| Afghanistan | 128 | 0.1% |
| Africa | 1,703 | 0.7% |
| Argentina | 394 | 0.2% |
| Armenia | 614 | 0.3% |
| Asia | 19,018 | 8.4% |
| Australia | 112 | 0.1% |
| Austria | 29 | 0.0% |
| Azores | 13 | 0.0% |
| Bahamas | 40 | 0.0% |
| Bangladesh | 408 | 0.2% |
| Barbados | 5 | 0.0% |
| Belarus | 59 | 0.0% |
| Belgium | 71 | 0.0% |
| Belize | 50 | 0.0% |
| Bolivia | 33 | 0.0% |
| Brazil | 491 | 0.2% |
| Bulgaria | 67 | 0.0% |
| Cambodia | 43 | 0.0% |
| Canada | 707 | 0.3% |
| Caribbean | 523 | 0.2% |
| Central America | 19,216 | 8.5% |
| Chile | 177 | 0.1% |
| China | 1,455 | 0.6% |
| Colombia | 514 | 0.2% |
| Congo | 40 | 0.0% |
| Costa Rica | 26 | 0.0% |
| Croatia | 18 | 0.0% |
| Cuba | 301 | 0.1% |
| Czechoslovakia | 140 | 0.1% |
| Denmark | 87 | 0.0% |
| Dominican Republic | 34 | 0.0% |
| Eastern Africa | 199 | 0.1% |
| Eastern Asia | 3,588 | 1.6% |
| Eastern Europe | 1,354 | 0.6% |
| Ecuador | 208 | 0.1% |
| Egypt | 879 | 0.4% |
| El Salvador | 2,066 | 0.9% |
| England | 505 | 0.2% |
| Europe | 3,574 | 1.6% |
| Fiji | 299 | 0.1% |
| France | 75 | 0.0% |
| Germany | 367 | 0.2% |
| Ghana | 42 | 0.0% |
| Greece | 41 | 0.0% |
| Guatemala | 2,570 | 1.1% |
| Guyana | 6 | 0.0% |
| Haiti | 8 | 0.0% |
| Honduras | 201 | 0.1% |
| Hong Kong | 211 | 0.1% |
| Hungary | 170 | 0.1% |
| India | 2,549 | 1.1% |
| Indonesia | 130 | 0.1% |
| Iran | 1,284 | 0.6% |
| Iraq | 123 | 0.1% |
| Ireland | 139 | 0.1% |
| Israel | 56 | 0.0% |
| Italy | 106 | 0.1% |
| Jamaica | 22 | 0.0% |
| Japan | 231 | 0.1% |
| Jordan | 249 | 0.1% |
| Kazakhstan | 7 | 0.0% |
| Kenya | 92 | 0.0% |
| Korea | 1,902 | 0.8% |
| Kuwait | 4 | 0.0% |
| Laos | 34 | 0.0% |
| Latin America | 22,362 | 9.9% |
| Latvia | 5 | 0.0% |
| Lebanon | 366 | 0.2% |
| Lithuania | 42 | 0.0% |
| Malaysia | 73 | 0.0% |
| Mexico | 13,960 | 6.2% |
| Micronesia | 12 | 0.0% |
| Middle Africa | 217 | 0.1% |
| Moldova | 100 | 0.0% |
| Nepal | 59 | 0.0% |
| Netherlands | 240 | 0.1% |
| Nicaragua | 329 | 0.2% |
| Nigeria | 173 | 0.1% |
| Northern Africa | 888 | 0.4% |
| Northern Europe | 1,090 | 0.5% |
| Oceania | 455 | 0.2% |
| Pakistan | 295 | 0.1% |
| Panama | 14 | 0.0% |
| Peru | 593 | 0.3% |
| Philippines | 6,870 | 3.0% |
| Poland | 186 | 0.1% |
| Portugal | 23 | 0.0% |
| Romania | 90 | 0.0% |
| Russia | 227 | 0.1% |
| Saudi Arabia | 37 | 0.0% |
| Scotland | 10 | 0.0% |
| Serbia | 33 | 0.0% |
| South Africa | 93 | 0.0% |
| South America | 2,623 | 1.2% |
| South Central Asia | 5,231 | 2.3% |
| South Eastern Asia | 8,051 | 3.6% |
| Southern Europe | 278 | 0.1% |
| Spain | 108 | 0.1% |
| Sri Lanka | 251 | 0.1% |
| Sweden | 31 | 0.0% |
| Switzerland | 26 | 0.0% |
| Syria | 465 | 0.2% |
| Taiwan | 438 | 0.2% |
| Thailand | 302 | 0.1% |
| Trinidad and Tobago | 69 | 0.0% |
| Turkey | 64 | 0.0% |
| Uganda | 85 | 0.0% |
| Ukraine | 108 | 0.1% |
| Uruguay | 45 | 0.0% |
| Uzbekistan | 230 | 0.1% |
| Venezuela | 162 | 0.1% |
| Vietnam | 599 | 0.3% |
| Western Africa | 273 | 0.1% |
| Western Asia | 2,066 | 0.9% |
| Western Europe | 816 | 0.4% |
| Zaire | 177 | 0.1% |
| Zimbabwe | 17 | 0.0% | View All 117 Rows |
Sex and Age in Santa Clarita
Sex and Age in Santa Clarita
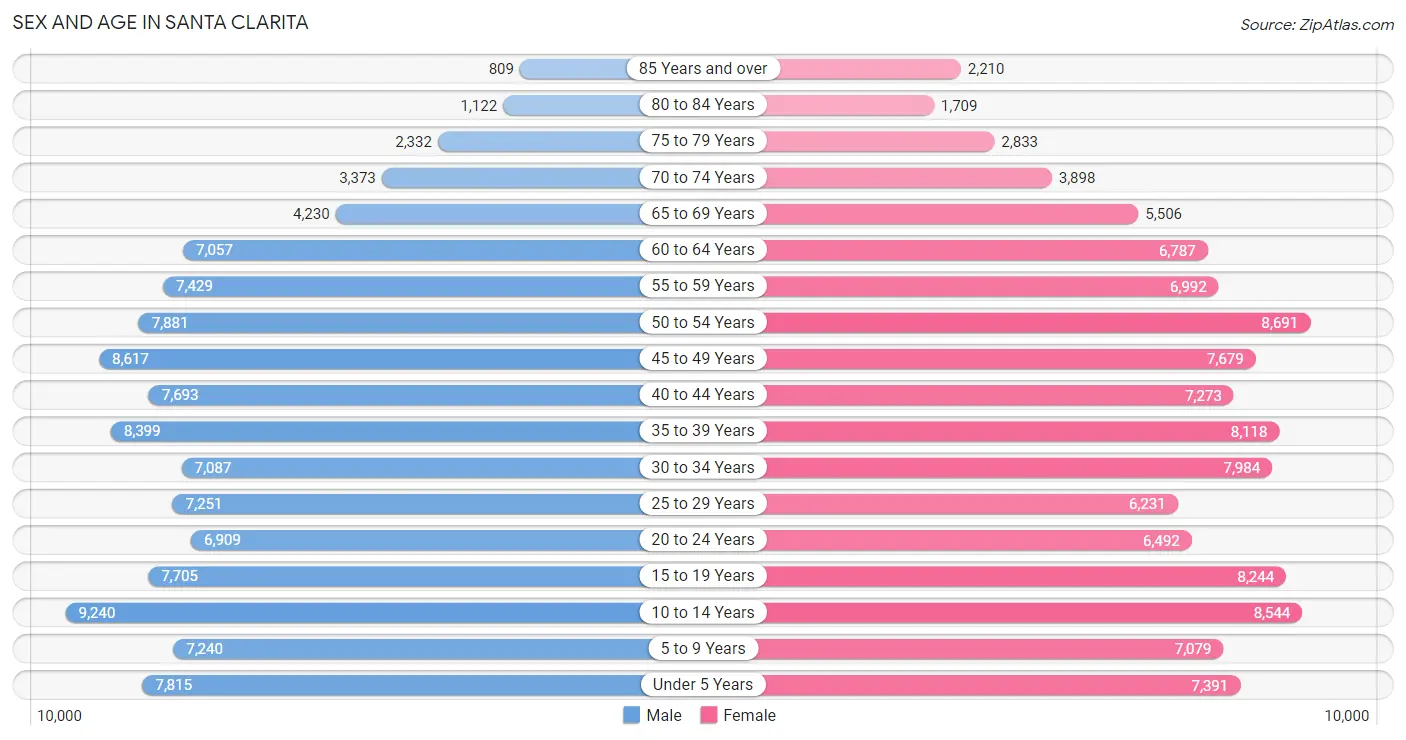
The most populous age groups in Santa Clarita are 10 to 14 Years (9,240 | 8.2%) for men and 50 to 54 Years (8,691 | 7.6%) for women.
| Age Bracket | Male | Female |
| Under 5 Years | 7,815 (7.0%) | 7,391 (6.5%) |
| 5 to 9 Years | 7,240 (6.5%) | 7,079 (6.2%) |
| 10 to 14 Years | 9,240 (8.2%) | 8,544 (7.5%) |
| 15 to 19 Years | 7,705 (6.9%) | 8,244 (7.2%) |
| 20 to 24 Years | 6,909 (6.2%) | 6,492 (5.7%) |
| 25 to 29 Years | 7,251 (6.5%) | 6,231 (5.5%) |
| 30 to 34 Years | 7,087 (6.3%) | 7,984 (7.0%) |
| 35 to 39 Years | 8,399 (7.5%) | 8,118 (7.1%) |
| 40 to 44 Years | 7,693 (6.9%) | 7,273 (6.4%) |
| 45 to 49 Years | 8,617 (7.7%) | 7,679 (6.8%) |
| 50 to 54 Years | 7,881 (7.0%) | 8,691 (7.6%) |
| 55 to 59 Years | 7,429 (6.6%) | 6,992 (6.1%) |
| 60 to 64 Years | 7,057 (6.3%) | 6,787 (6.0%) |
| 65 to 69 Years | 4,230 (3.8%) | 5,506 (4.8%) |
| 70 to 74 Years | 3,373 (3.0%) | 3,898 (3.4%) |
| 75 to 79 Years | 2,332 (2.1%) | 2,833 (2.5%) |
| 80 to 84 Years | 1,122 (1.0%) | 1,709 (1.5%) |
| 85 Years and over | 809 (0.7%) | 2,210 (1.9%) |
| Total | 112,189 (100.0%) | 113,661 (100.0%) |
Families and Households in Santa Clarita
Median Family Size in Santa Clarita
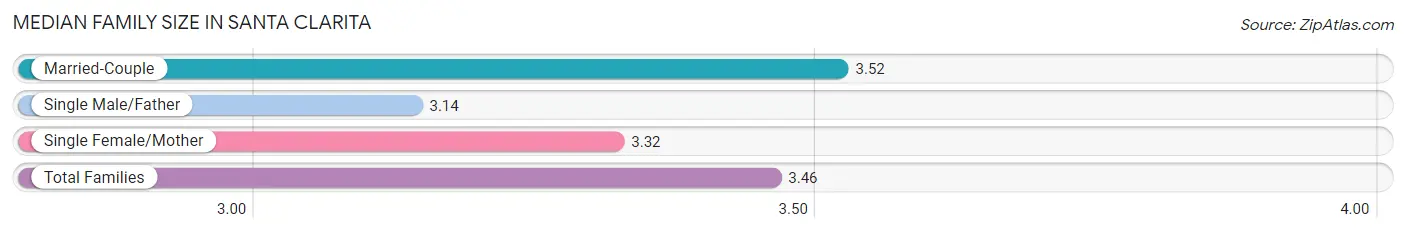
The median family size in Santa Clarita is 3.46 persons per family, with married-couple families (43,772 | 77.9%) accounting for the largest median family size of 3.52 persons per family. On the other hand, single male/father families (4,115 | 7.3%) represent the smallest median family size with 3.14 persons per family.
| Family Type | # Families | Family Size |
| Married-Couple | 43,772 (77.9%) | 3.52 |
| Single Male/Father | 4,115 (7.3%) | 3.14 |
| Single Female/Mother | 8,270 (14.7%) | 3.32 |
| Total Families | 56,157 (100.0%) | 3.46 |
Median Household Size in Santa Clarita
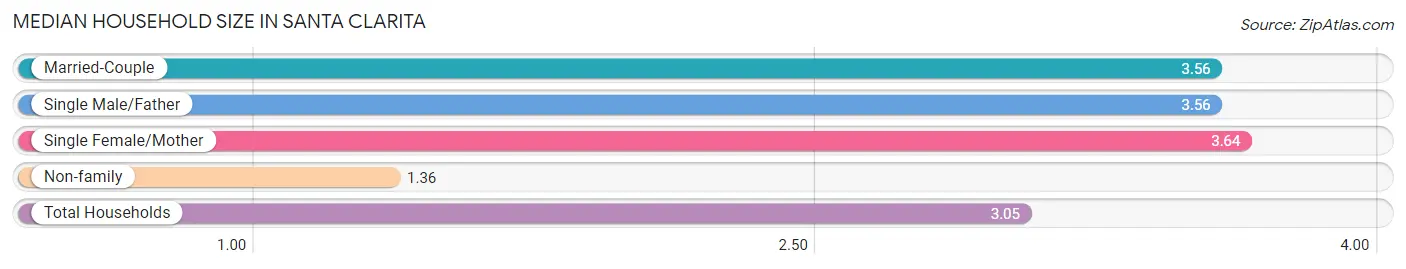
The median household size in Santa Clarita is 3.05 persons per household, with single female/mother households (8,270 | 11.3%) accounting for the largest median household size of 3.64 persons per household. non-family households (17,205 | 23.4%) represent the smallest median household size with 1.36 persons per household.
| Household Type | # Households | Household Size |
| Married-Couple | 43,772 (59.7%) | 3.56 |
| Single Male/Father | 4,115 (5.6%) | 3.56 |
| Single Female/Mother | 8,270 (11.3%) | 3.64 |
| Non-family | 17,205 (23.4%) | 1.36 |
| Total Households | 73,362 (100.0%) | 3.05 |
Household Size by Marriage Status in Santa Clarita
Out of a total of 73,362 households in Santa Clarita, 56,157 (76.5%) are family households, while 17,205 (23.4%) are nonfamily households. The most numerous type of family households are 2-person households, comprising 17,981, and the most common type of nonfamily households are 1-person households, comprising 13,132.
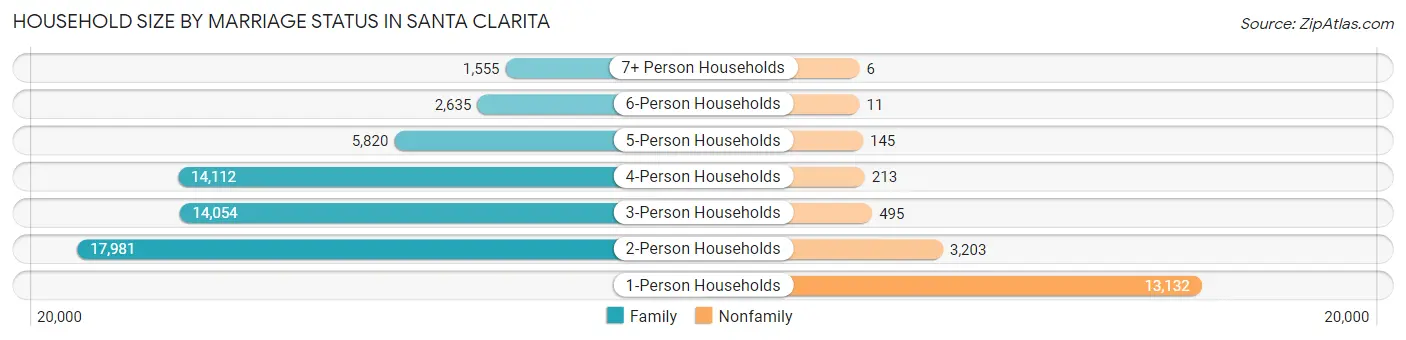
| Household Size | Family Households | Nonfamily Households |
| 1-Person Households | - | 13,132 (17.9%) |
| 2-Person Households | 17,981 (24.5%) | 3,203 (4.4%) |
| 3-Person Households | 14,054 (19.2%) | 495 (0.7%) |
| 4-Person Households | 14,112 (19.2%) | 213 (0.3%) |
| 5-Person Households | 5,820 (7.9%) | 145 (0.2%) |
| 6-Person Households | 2,635 (3.6%) | 11 (0.0%) |
| 7+ Person Households | 1,555 (2.1%) | 6 (0.0%) |
| Total | 56,157 (76.5%) | 17,205 (23.4%) |
Female Fertility in Santa Clarita
Fertility by Age in Santa Clarita
Average fertility rate in Santa Clarita is 56.0 births per 1,000 women. Women in the age bracket of 20 to 34 years have the highest fertility rate with 91.0 births per 1,000 women. Women in the age bracket of 20 to 34 years acount for 63.4% of all women with births.
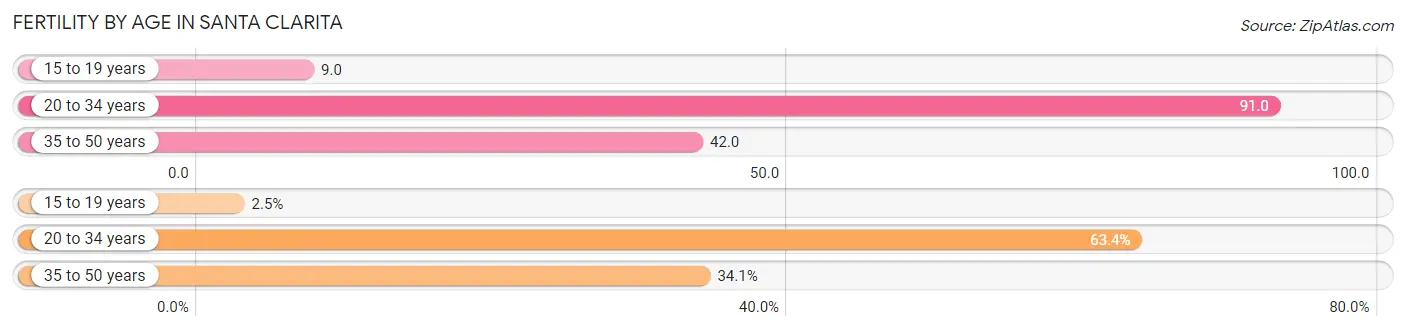
| Age Bracket | Women with Births | Births / 1,000 Women |
| 15 to 19 years | 74 (2.5%) | 9.0 |
| 20 to 34 years | 1,891 (63.4%) | 91.0 |
| 35 to 50 years | 1,017 (34.1%) | 42.0 |
| Total | 2,982 (100.0%) | 56.0 |
Fertility by Age by Marriage Status in Santa Clarita
71.4% of women with births (2,982) in Santa Clarita are married. The highest percentage of unmarried women with births falls into 15 to 19 years age bracket with 85.1% of them unmarried at the time of birth, while the lowest percentage of unmarried women with births belong to 35 to 50 years age bracket with 15.2% of them unmarried.
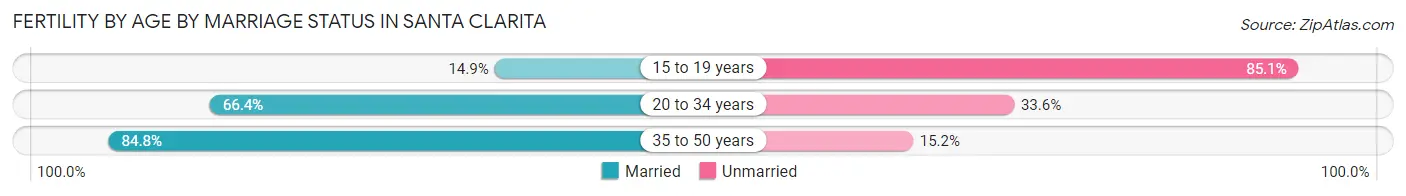
| Age Bracket | Married | Unmarried |
| 15 to 19 years | 11 (14.9%) | 63 (85.1%) |
| 20 to 34 years | 1,256 (66.4%) | 635 (33.6%) |
| 35 to 50 years | 862 (84.8%) | 155 (15.2%) |
| Total | 2,129 (71.4%) | 853 (28.6%) |
Fertility by Education in Santa Clarita
Average fertility rate in Santa Clarita is 56.0 births per 1,000 women. Women with the education attainment of bachelor's degree have the highest fertility rate of 79.0 births per 1,000 women, while women with the education attainment of less than high school have the lowest fertility at 22.0 births per 1,000 women. Women with the education attainment of bachelor's degree represent 36.0% of all women with births.
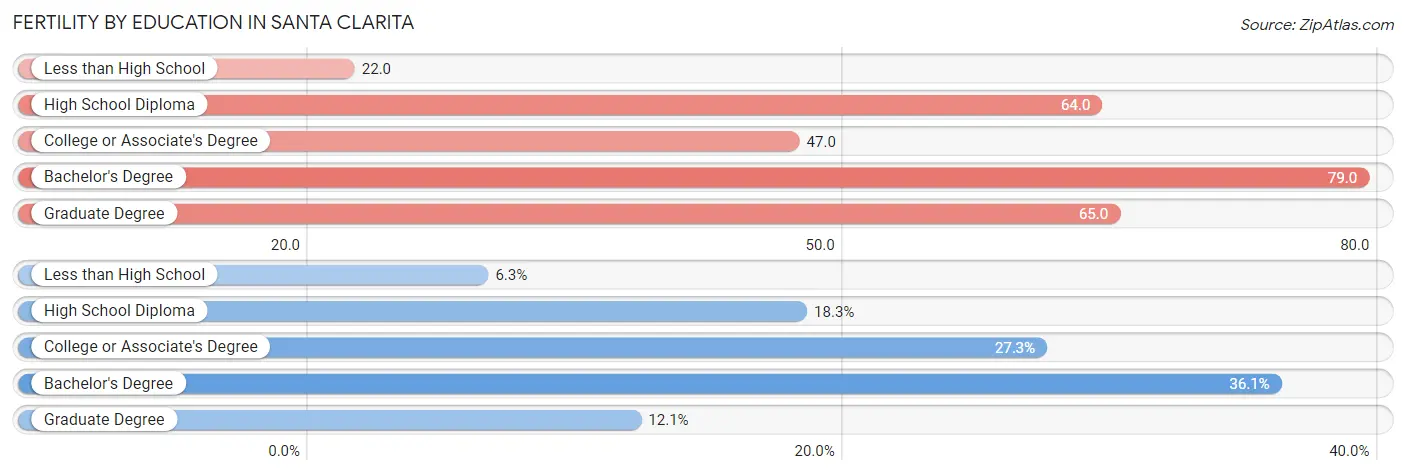
| Educational Attainment | Women with Births | Births / 1,000 Women |
| Less than High School | 189 (6.3%) | 22.0 |
| High School Diploma | 545 (18.3%) | 64.0 |
| College or Associate's Degree | 813 (27.3%) | 47.0 |
| Bachelor's Degree | 1,075 (36.0%) | 79.0 |
| Graduate Degree | 360 (12.1%) | 65.0 |
| Total | 2,982 (100.0%) | 56.0 |
Fertility by Education by Marriage Status in Santa Clarita
28.6% of women with births in Santa Clarita are unmarried. Women with the educational attainment of bachelor's degree are most likely to be married with 88.7% of them married at childbirth, while women with the educational attainment of high school diploma are least likely to be married with 47.7% of them unmarried at childbirth.
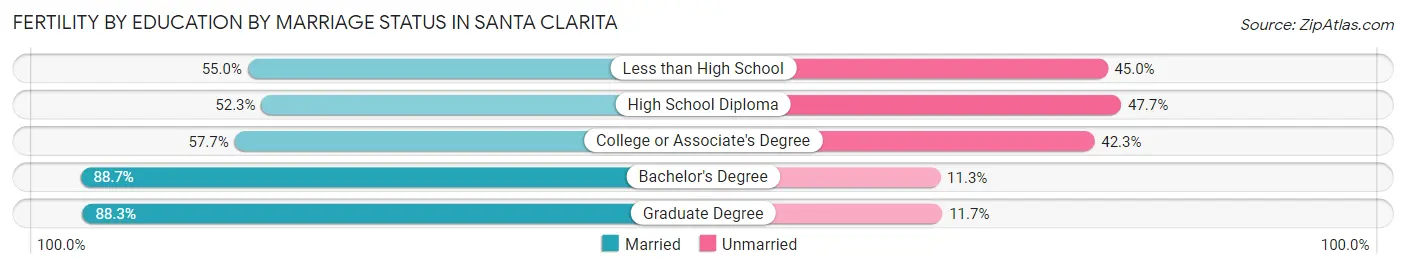
| Educational Attainment | Married | Unmarried |
| Less than High School | 104 (55.0%) | 85 (45.0%) |
| High School Diploma | 285 (52.3%) | 260 (47.7%) |
| College or Associate's Degree | 469 (57.7%) | 344 (42.3%) |
| Bachelor's Degree | 954 (88.7%) | 121 (11.3%) |
| Graduate Degree | 318 (88.3%) | 42 (11.7%) |
| Total | 2,129 (71.4%) | 853 (28.6%) |
Employment Characteristics in Santa Clarita
Employment by Class of Employer in Santa Clarita
Among the 108,304 employed individuals in Santa Clarita, private company employees (69,987 | 64.6%), local government employees (11,810 | 10.9%), and not-for-profit organizations (8,755 | 8.1%) make up the most common classes of employment.
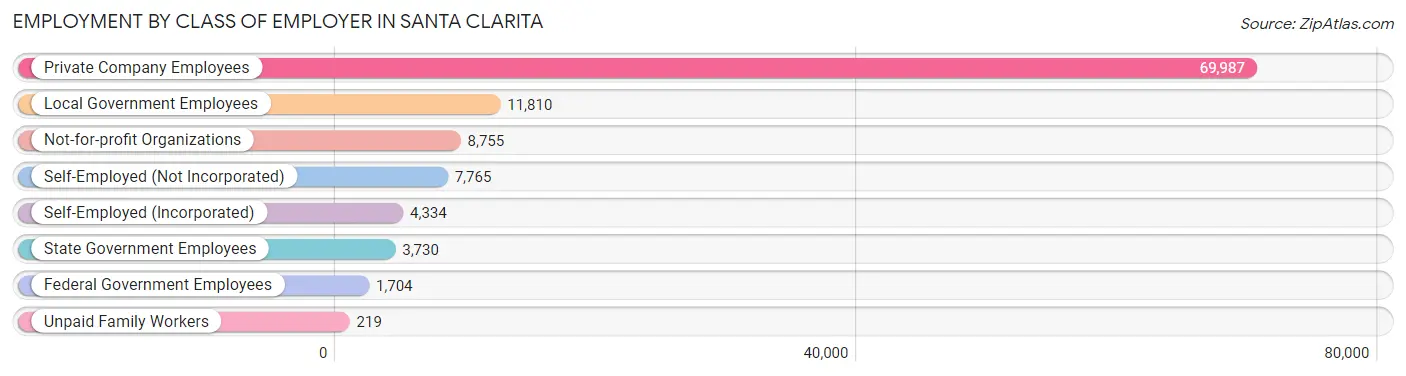
| Employer Class | # Employees | % Employees |
| Private Company Employees | 69,987 | 64.6% |
| Self-Employed (Incorporated) | 4,334 | 4.0% |
| Self-Employed (Not Incorporated) | 7,765 | 7.2% |
| Not-for-profit Organizations | 8,755 | 8.1% |
| Local Government Employees | 11,810 | 10.9% |
| State Government Employees | 3,730 | 3.4% |
| Federal Government Employees | 1,704 | 1.6% |
| Unpaid Family Workers | 219 | 0.2% |
| Total | 108,304 | 100.0% |
Employment Status by Age in Santa Clarita
According to the labor force statistics for Santa Clarita, out of the total population over 16 years of age (174,913), 67.3% or 117,716 individuals are in the labor force, with 5.5% or 6,474 of them unemployed. The age group with the highest labor force participation rate is 30 to 34 years, with 84.7% or 12,765 individuals in the labor force. Within the labor force, the 16 to 19 years age range has the highest percentage of unemployed individuals, with 19.2% or 799 of them being unemployed.
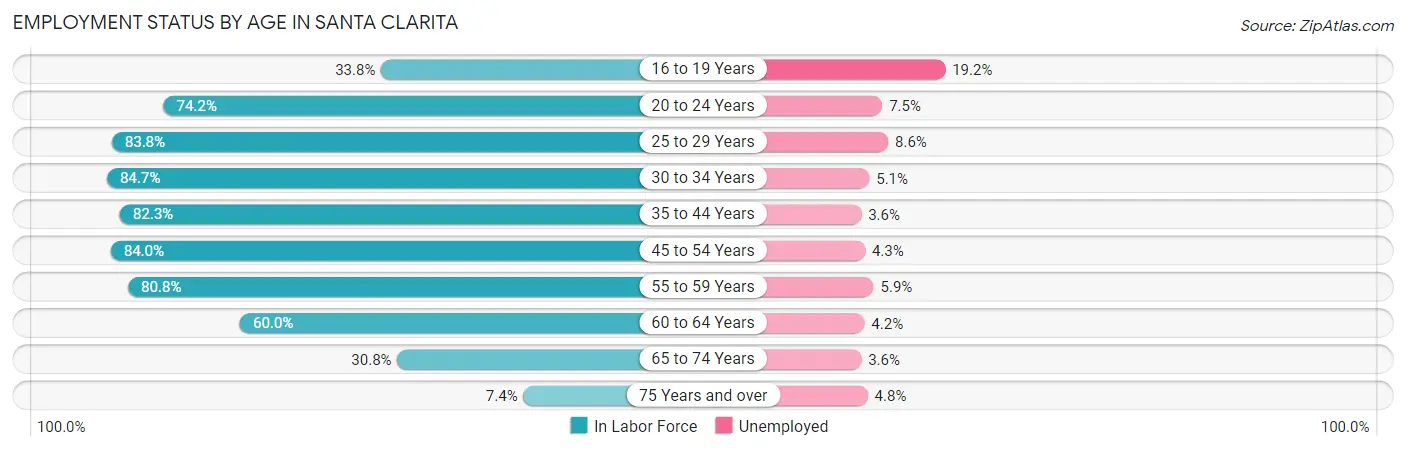
| Age Bracket | In Labor Force | Unemployed |
| 16 to 19 Years | 4,164 (33.8%) | 799 (19.2%) |
| 20 to 24 Years | 9,944 (74.2%) | 746 (7.5%) |
| 25 to 29 Years | 11,298 (83.8%) | 972 (8.6%) |
| 30 to 34 Years | 12,765 (84.7%) | 651 (5.1%) |
| 35 to 44 Years | 25,911 (82.3%) | 933 (3.6%) |
| 45 to 54 Years | 27,609 (84.0%) | 1,187 (4.3%) |
| 55 to 59 Years | 11,652 (80.8%) | 687 (5.9%) |
| 60 to 64 Years | 8,306 (60.0%) | 349 (4.2%) |
| 65 to 74 Years | 5,238 (30.8%) | 189 (3.6%) |
| 75 Years and over | 815 (7.4%) | 39 (4.8%) |
| Total | 117,716 (67.3%) | 6,474 (5.5%) |
Employment Status by Educational Attainment in Santa Clarita
According to labor force statistics for Santa Clarita, 80.5% of individuals (97,541) out of the total population between 25 and 64 years of age (121,169) are in the labor force, with 4.9% or 4,780 of them being unemployed. The group with the highest labor force participation rate are those with the educational attainment of bachelor's degree or higher, with 85.2% or 41,553 individuals in the labor force. Within the labor force, individuals with college / associate degree education have the highest percentage of unemployment, with 6.2% or 2,054 of them being unemployed.
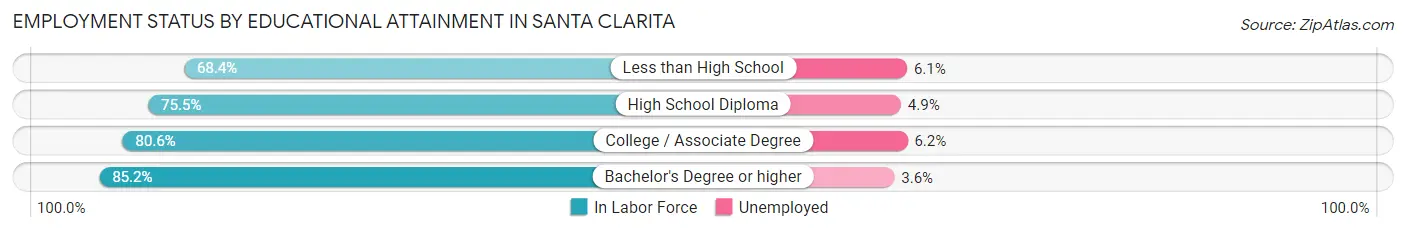
| Educational Attainment | In Labor Force | Unemployed |
| Less than High School | 6,939 (68.4%) | 619 (6.1%) |
| High School Diploma | 15,974 (75.5%) | 1,037 (4.9%) |
| College / Associate Degree | 33,123 (80.6%) | 2,548 (6.2%) |
| Bachelor's Degree or higher | 41,553 (85.2%) | 1,756 (3.6%) |
| Total | 97,541 (80.5%) | 5,937 (4.9%) |
Employment Occupations by Sex in Santa Clarita
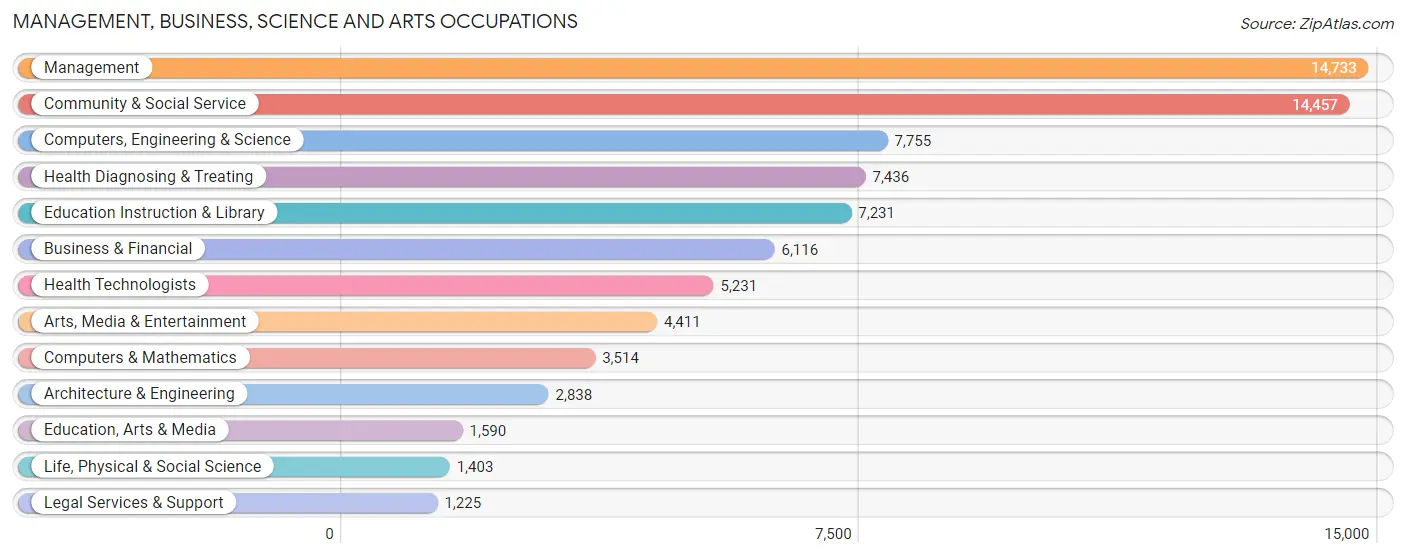
Management, Business, Science and Arts Occupations
The most common Management, Business, Science and Arts occupations in Santa Clarita are Management (14,733 | 13.3%), Community & Social Service (14,457 | 13.0%), Computers, Engineering & Science (7,755 | 7.0%), Health Diagnosing & Treating (7,436 | 6.7%), and Education Instruction & Library (7,231 | 6.5%).
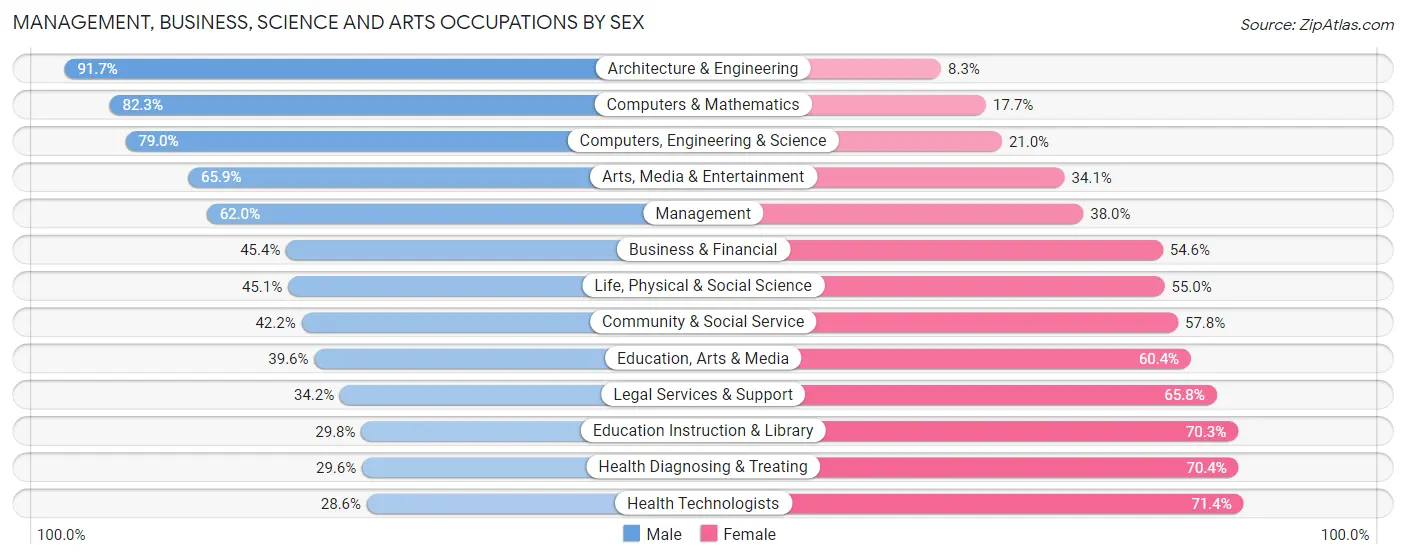
Management, Business, Science and Arts Occupations by Sex
Within the Management, Business, Science and Arts occupations in Santa Clarita, the most male-oriented occupations are Architecture & Engineering (91.7%), Computers & Mathematics (82.3%), and Computers, Engineering & Science (79.0%), while the most female-oriented occupations are Health Technologists (71.4%), Health Diagnosing & Treating (70.4%), and Education Instruction & Library (70.3%).
| Occupation | Male | Female |
| Management | 9,135 (62.0%) | 5,598 (38.0%) |
| Business & Financial | 2,778 (45.4%) | 3,338 (54.6%) |
| Computers, Engineering & Science | 6,125 (79.0%) | 1,630 (21.0%) |
| Computers & Mathematics | 2,891 (82.3%) | 623 (17.7%) |
| Architecture & Engineering | 2,602 (91.7%) | 236 (8.3%) |
| Life, Physical & Social Science | 632 (45.1%) | 771 (54.9%) |
| Community & Social Service | 6,106 (42.2%) | 8,351 (57.8%) |
| Education, Arts & Media | 629 (39.6%) | 961 (60.4%) |
| Legal Services & Support | 419 (34.2%) | 806 (65.8%) |
| Education Instruction & Library | 2,151 (29.7%) | 5,080 (70.3%) |
| Arts, Media & Entertainment | 2,907 (65.9%) | 1,504 (34.1%) |
| Health Diagnosing & Treating | 2,202 (29.6%) | 5,234 (70.4%) |
| Health Technologists | 1,496 (28.6%) | 3,735 (71.4%) |
| Total (Category) | 26,346 (52.2%) | 24,151 (47.8%) |
| Total (Overall) | 61,387 (55.2%) | 49,759 (44.8%) |
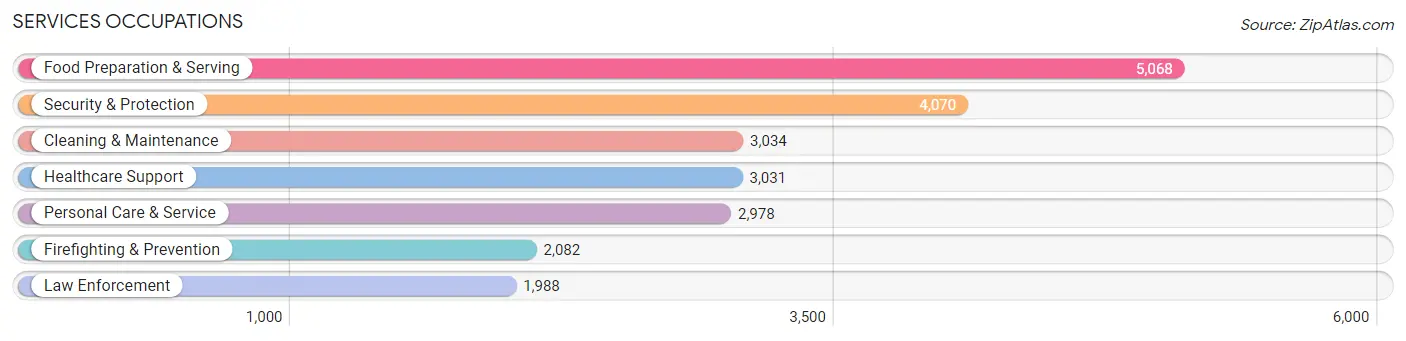
Services Occupations
The most common Services occupations in Santa Clarita are Food Preparation & Serving (5,068 | 4.6%), Security & Protection (4,070 | 3.7%), Cleaning & Maintenance (3,034 | 2.7%), Healthcare Support (3,031 | 2.7%), and Personal Care & Service (2,978 | 2.7%).
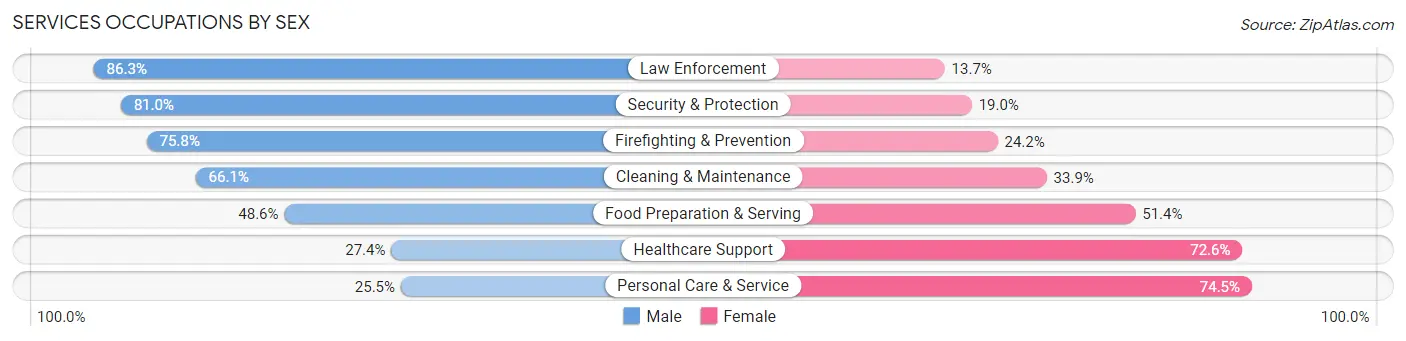
Services Occupations by Sex
Within the Services occupations in Santa Clarita, the most male-oriented occupations are Law Enforcement (86.3%), Security & Protection (81.0%), and Firefighting & Prevention (75.8%), while the most female-oriented occupations are Personal Care & Service (74.5%), Healthcare Support (72.6%), and Food Preparation & Serving (51.4%).
| Occupation | Male | Female |
| Healthcare Support | 830 (27.4%) | 2,201 (72.6%) |
| Security & Protection | 3,295 (81.0%) | 775 (19.0%) |
| Firefighting & Prevention | 1,579 (75.8%) | 503 (24.2%) |
| Law Enforcement | 1,716 (86.3%) | 272 (13.7%) |
| Food Preparation & Serving | 2,461 (48.6%) | 2,607 (51.4%) |
| Cleaning & Maintenance | 2,006 (66.1%) | 1,028 (33.9%) |
| Personal Care & Service | 759 (25.5%) | 2,219 (74.5%) |
| Total (Category) | 9,351 (51.4%) | 8,830 (48.6%) |
| Total (Overall) | 61,387 (55.2%) | 49,759 (44.8%) |
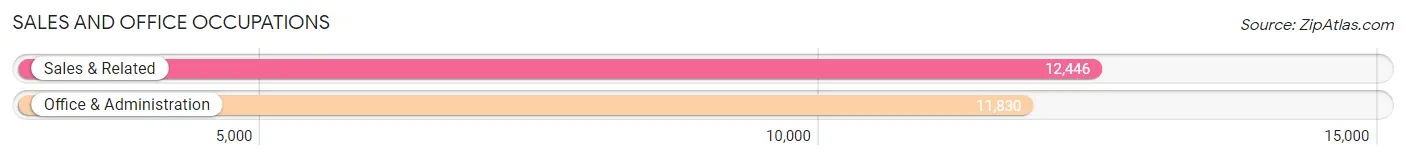
Sales and Office Occupations
The most common Sales and Office occupations in Santa Clarita are Sales & Related (12,446 | 11.2%), and Office & Administration (11,830 | 10.6%).
Sales and Office Occupations by Sex
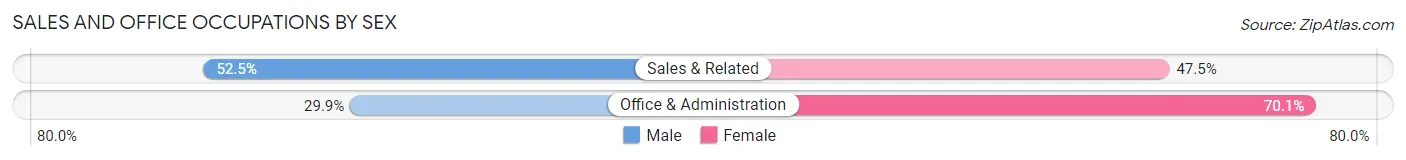
| Occupation | Male | Female |
| Sales & Related | 6,531 (52.5%) | 5,915 (47.5%) |
| Office & Administration | 3,539 (29.9%) | 8,291 (70.1%) |
| Total (Category) | 10,070 (41.5%) | 14,206 (58.5%) |
| Total (Overall) | 61,387 (55.2%) | 49,759 (44.8%) |
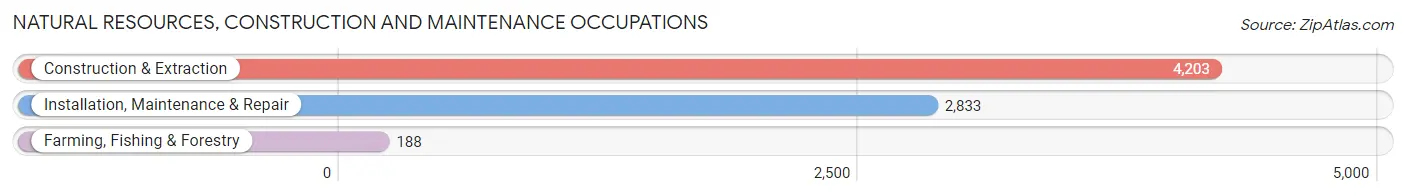
Natural Resources, Construction and Maintenance Occupations
The most common Natural Resources, Construction and Maintenance occupations in Santa Clarita are Construction & Extraction (4,203 | 3.8%), Installation, Maintenance & Repair (2,833 | 2.5%), and Farming, Fishing & Forestry (188 | 0.2%).
Natural Resources, Construction and Maintenance Occupations by Sex
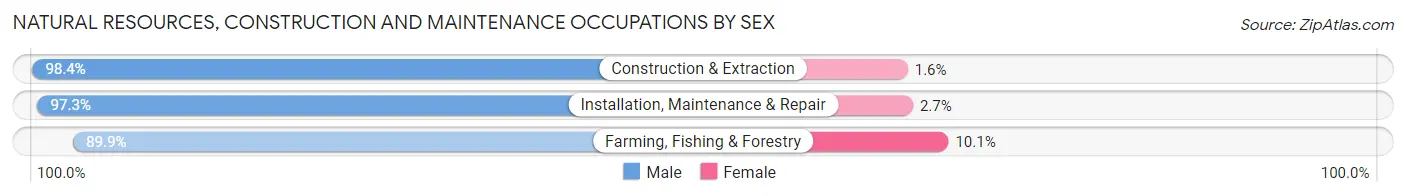
| Occupation | Male | Female |
| Farming, Fishing & Forestry | 169 (89.9%) | 19 (10.1%) |
| Construction & Extraction | 4,134 (98.4%) | 69 (1.6%) |
| Installation, Maintenance & Repair | 2,756 (97.3%) | 77 (2.7%) |
| Total (Category) | 7,059 (97.7%) | 165 (2.3%) |
| Total (Overall) | 61,387 (55.2%) | 49,759 (44.8%) |
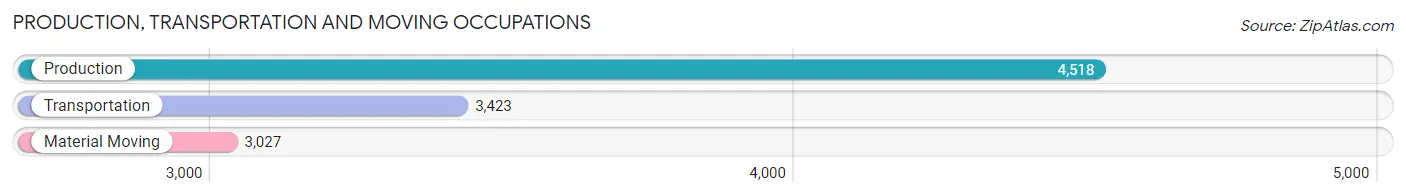
Production, Transportation and Moving Occupations
The most common Production, Transportation and Moving occupations in Santa Clarita are Production (4,518 | 4.1%), Transportation (3,423 | 3.1%), and Material Moving (3,027 | 2.7%).
Production, Transportation and Moving Occupations by Sex
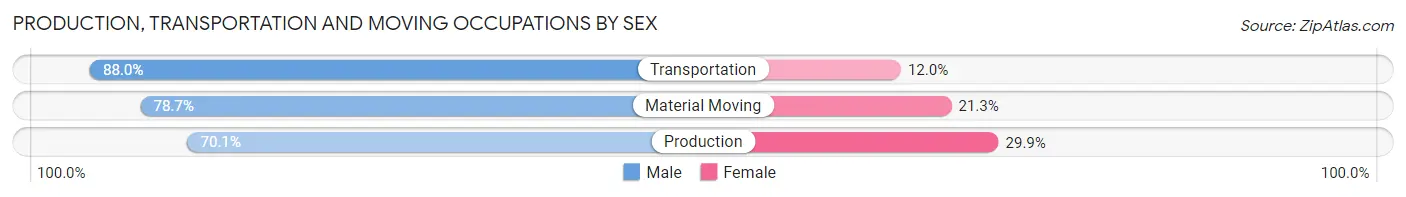
| Occupation | Male | Female |
| Production | 3,166 (70.1%) | 1,352 (29.9%) |
| Transportation | 3,012 (88.0%) | 411 (12.0%) |
| Material Moving | 2,383 (78.7%) | 644 (21.3%) |
| Total (Category) | 8,561 (78.0%) | 2,407 (22.0%) |
| Total (Overall) | 61,387 (55.2%) | 49,759 (44.8%) |
Employment Industries by Sex in Santa Clarita
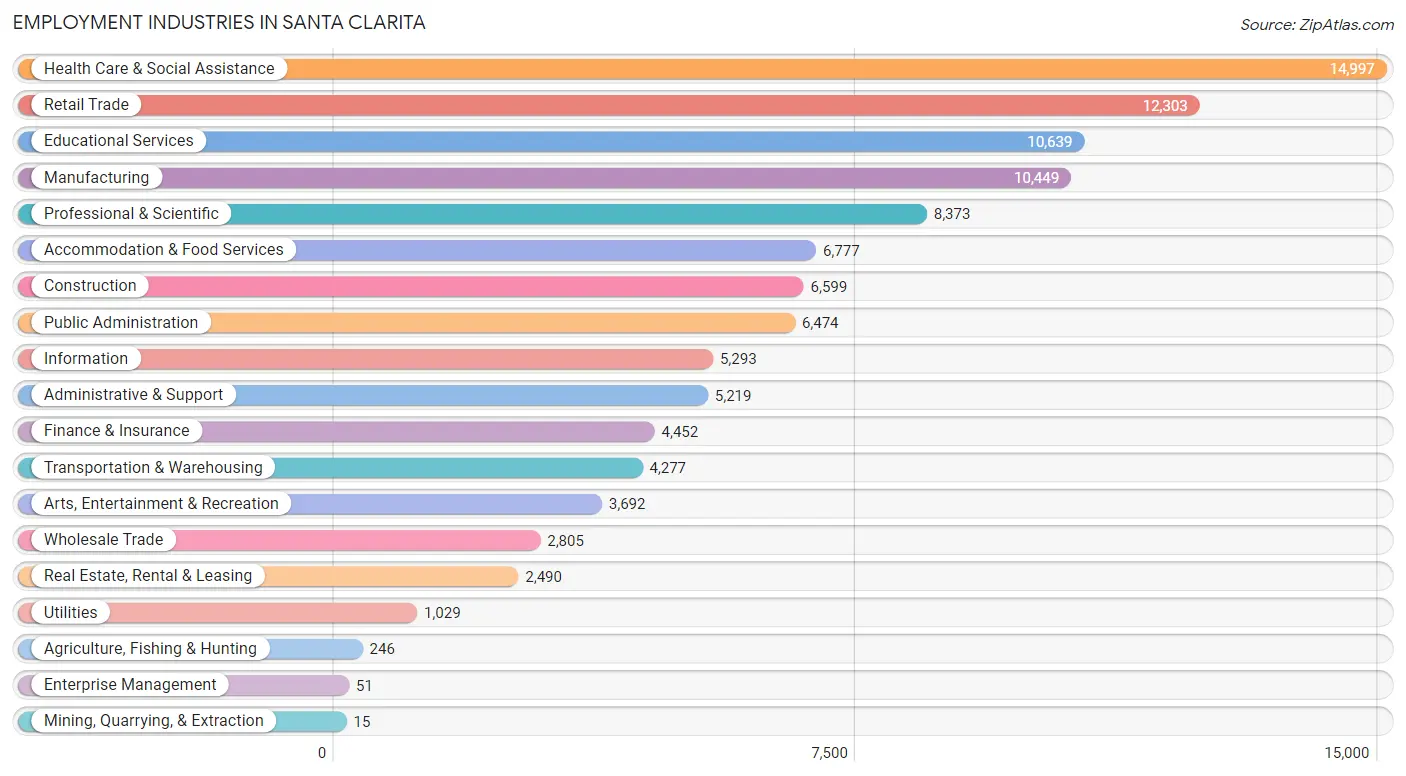
Employment Industries in Santa Clarita
The major employment industries in Santa Clarita include Health Care & Social Assistance (14,997 | 13.5%), Retail Trade (12,303 | 11.1%), Educational Services (10,639 | 9.6%), Manufacturing (10,449 | 9.4%), and Professional & Scientific (8,373 | 7.5%).
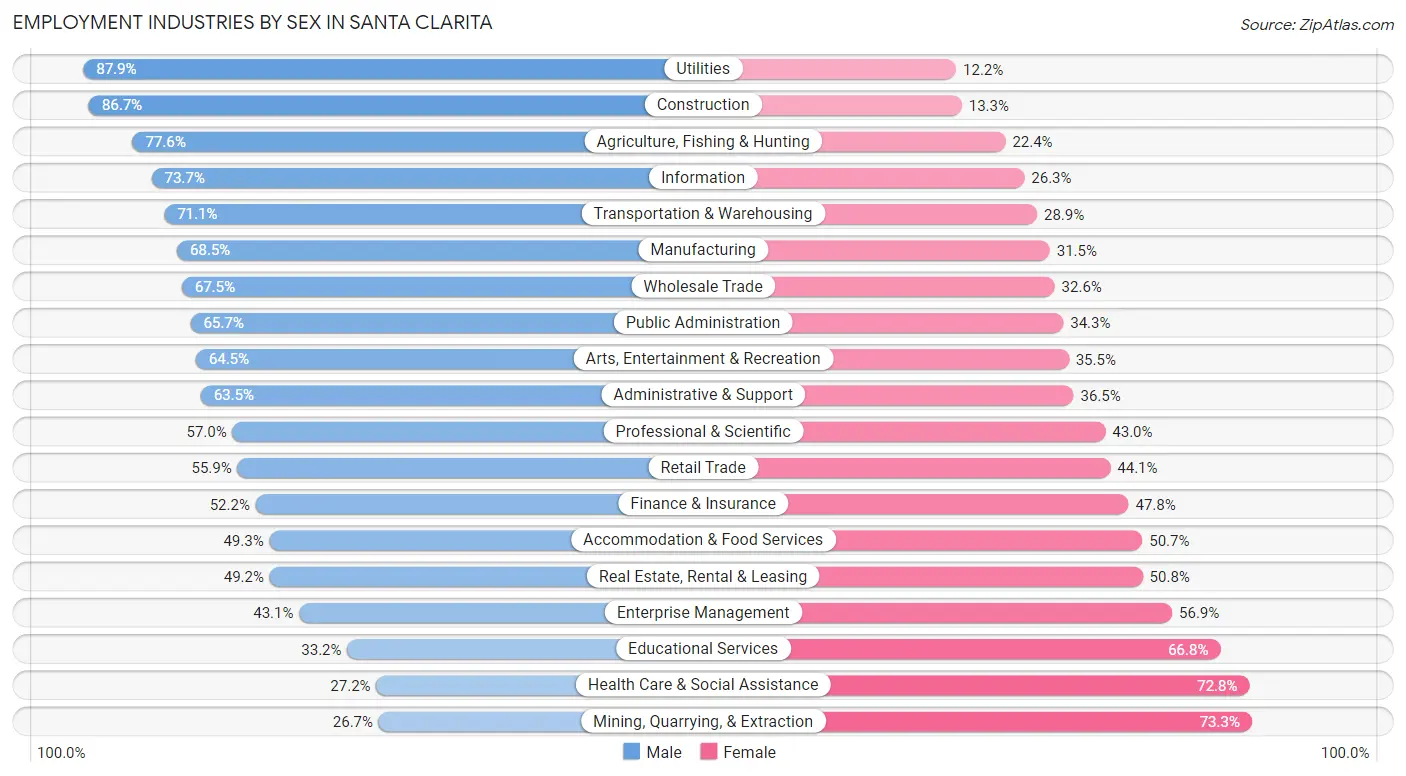
Employment Industries by Sex in Santa Clarita
The Santa Clarita industries that see more men than women are Utilities (87.8%), Construction (86.7%), and Agriculture, Fishing & Hunting (77.6%), whereas the industries that tend to have a higher number of women are Mining, Quarrying, & Extraction (73.3%), Health Care & Social Assistance (72.8%), and Educational Services (66.8%).
| Industry | Male | Female |
| Agriculture, Fishing & Hunting | 191 (77.6%) | 55 (22.4%) |
| Mining, Quarrying, & Extraction | 4 (26.7%) | 11 (73.3%) |
| Construction | 5,720 (86.7%) | 879 (13.3%) |
| Manufacturing | 7,153 (68.5%) | 3,296 (31.5%) |
| Wholesale Trade | 1,892 (67.4%) | 913 (32.6%) |
| Retail Trade | 6,881 (55.9%) | 5,422 (44.1%) |
| Transportation & Warehousing | 3,041 (71.1%) | 1,236 (28.9%) |
| Utilities | 904 (87.8%) | 125 (12.1%) |
| Information | 3,902 (73.7%) | 1,391 (26.3%) |
| Finance & Insurance | 2,322 (52.2%) | 2,130 (47.8%) |
| Real Estate, Rental & Leasing | 1,226 (49.2%) | 1,264 (50.8%) |
| Professional & Scientific | 4,769 (57.0%) | 3,604 (43.0%) |
| Enterprise Management | 22 (43.1%) | 29 (56.9%) |
| Administrative & Support | 3,316 (63.5%) | 1,903 (36.5%) |
| Educational Services | 3,531 (33.2%) | 7,108 (66.8%) |
| Health Care & Social Assistance | 4,076 (27.2%) | 10,921 (72.8%) |
| Arts, Entertainment & Recreation | 2,383 (64.5%) | 1,309 (35.5%) |
| Accommodation & Food Services | 3,342 (49.3%) | 3,435 (50.7%) |
| Public Administration | 4,251 (65.7%) | 2,223 (34.3%) |
| Total | 61,387 (55.2%) | 49,759 (44.8%) |
Education in Santa Clarita
School Enrollment in Santa Clarita
The most common levels of schooling among the 62,904 students in Santa Clarita are college / undergraduate (14,392 | 22.9%), high school (13,916 | 22.1%), and middle school (13,336 | 21.2%).
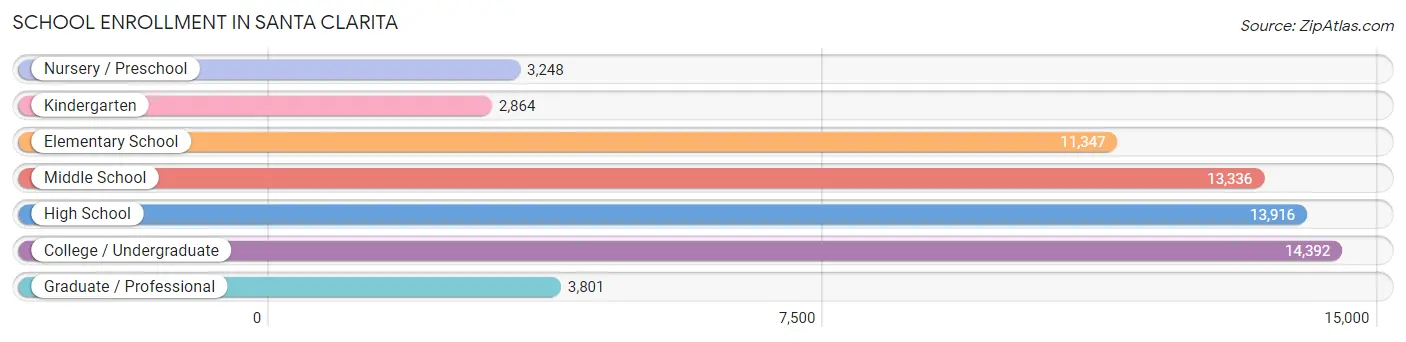
| School Level | # Students | % Students |
| Nursery / Preschool | 3,248 | 5.2% |
| Kindergarten | 2,864 | 4.5% |
| Elementary School | 11,347 | 18.0% |
| Middle School | 13,336 | 21.2% |
| High School | 13,916 | 22.1% |
| College / Undergraduate | 14,392 | 22.9% |
| Graduate / Professional | 3,801 | 6.0% |
| Total | 62,904 | 100.0% |
School Enrollment by Age by Funding Source in Santa Clarita
Out of a total of 62,904 students who are enrolled in schools in Santa Clarita, 10,757 (17.1%) attend a private institution, while the remaining 52,147 (82.9%) are enrolled in public schools. The age group of 3 to 4 year olds has the highest likelihood of being enrolled in private schools, with 1,604 (56.9% in the age bracket) enrolled. Conversely, the age group of 10 to 14 year olds has the lowest likelihood of being enrolled in a private school, with 16,235 (93.3% in the age bracket) attending a public institution.
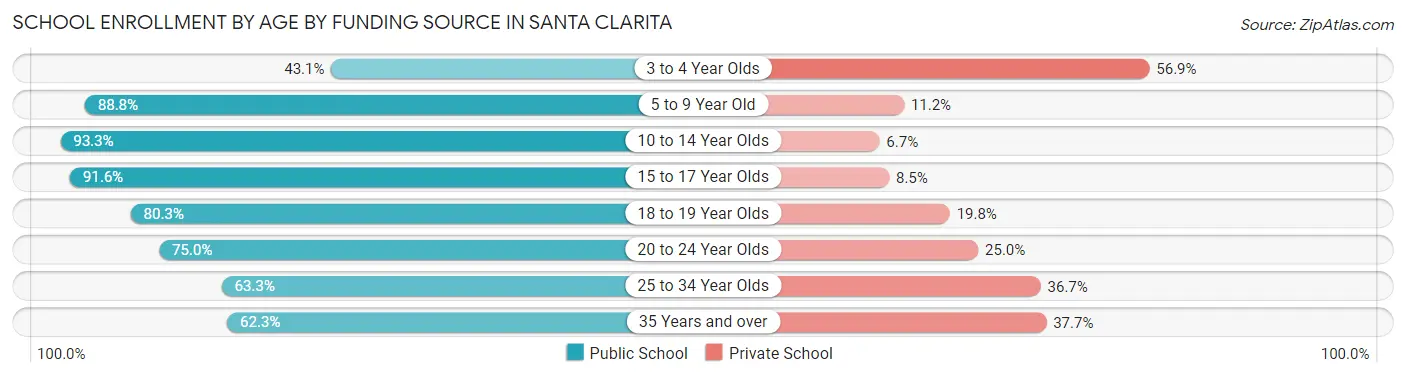
| Age Bracket | Public School | Private School |
| 3 to 4 Year Olds | 1,213 (43.1%) | 1,604 (56.9%) |
| 5 to 9 Year Old | 11,804 (88.8%) | 1,494 (11.2%) |
| 10 to 14 Year Olds | 16,235 (93.3%) | 1,159 (6.7%) |
| 15 to 17 Year Olds | 9,116 (91.5%) | 841 (8.5%) |
| 18 to 19 Year Olds | 3,674 (80.2%) | 904 (19.8%) |
| 20 to 24 Year Olds | 4,822 (75.0%) | 1,611 (25.0%) |
| 25 to 34 Year Olds | 2,750 (63.3%) | 1,593 (36.7%) |
| 35 Years and over | 2,543 (62.3%) | 1,541 (37.7%) |
| Total | 52,147 (82.9%) | 10,757 (17.1%) |
Educational Attainment by Field of Study in Santa Clarita
Business (11,383 | 18.6%), science & technology (6,427 | 10.5%), engineering (5,532 | 9.0%), social sciences (5,239 | 8.6%), and education (4,168 | 6.8%) are the most common fields of study among 61,125 individuals in Santa Clarita who have obtained a bachelor's degree or higher.
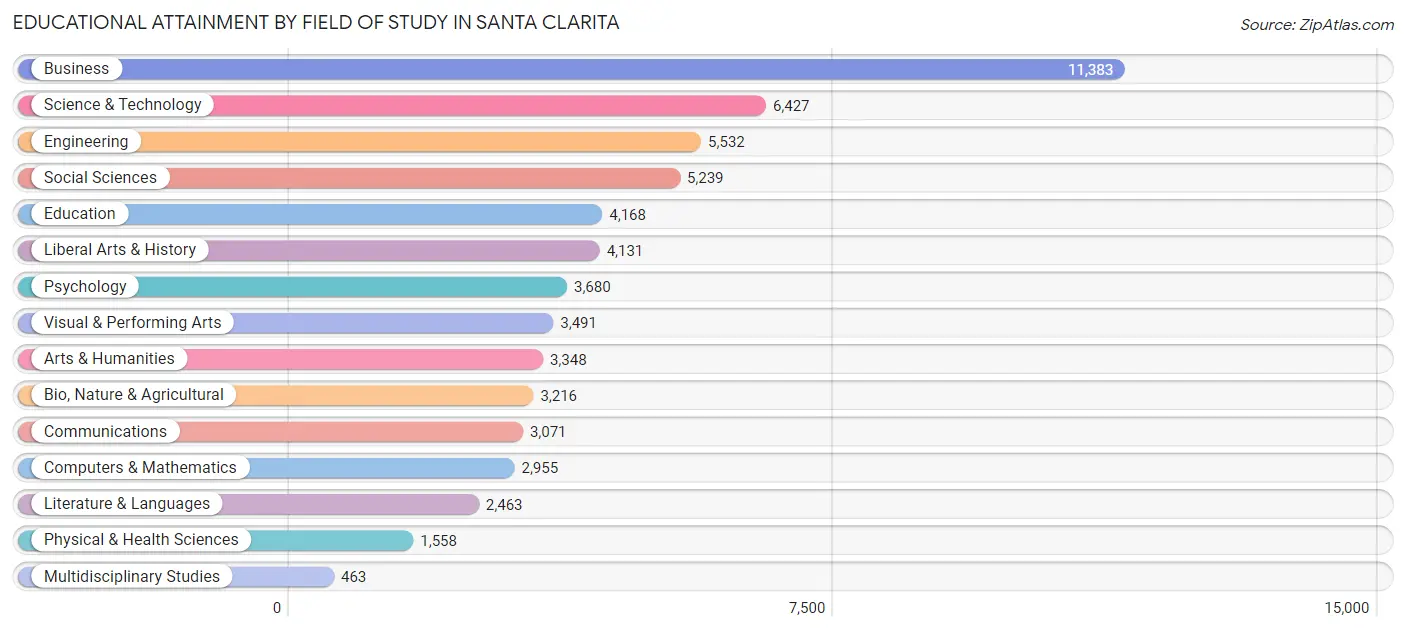
| Field of Study | # Graduates | % Graduates |
| Computers & Mathematics | 2,955 | 4.8% |
| Bio, Nature & Agricultural | 3,216 | 5.3% |
| Physical & Health Sciences | 1,558 | 2.5% |
| Psychology | 3,680 | 6.0% |
| Social Sciences | 5,239 | 8.6% |
| Engineering | 5,532 | 9.0% |
| Multidisciplinary Studies | 463 | 0.8% |
| Science & Technology | 6,427 | 10.5% |
| Business | 11,383 | 18.6% |
| Education | 4,168 | 6.8% |
| Literature & Languages | 2,463 | 4.0% |
| Liberal Arts & History | 4,131 | 6.8% |
| Visual & Performing Arts | 3,491 | 5.7% |
| Communications | 3,071 | 5.0% |
| Arts & Humanities | 3,348 | 5.5% |
| Total | 61,125 | 100.0% |
Transportation & Commute in Santa Clarita
Vehicle Availability by Sex in Santa Clarita
The most prevalent vehicle ownership categories in Santa Clarita are males with 2 vehicles (24,599, accounting for 41.0%) and females with 2 vehicles (18,518, making up 51.4%).
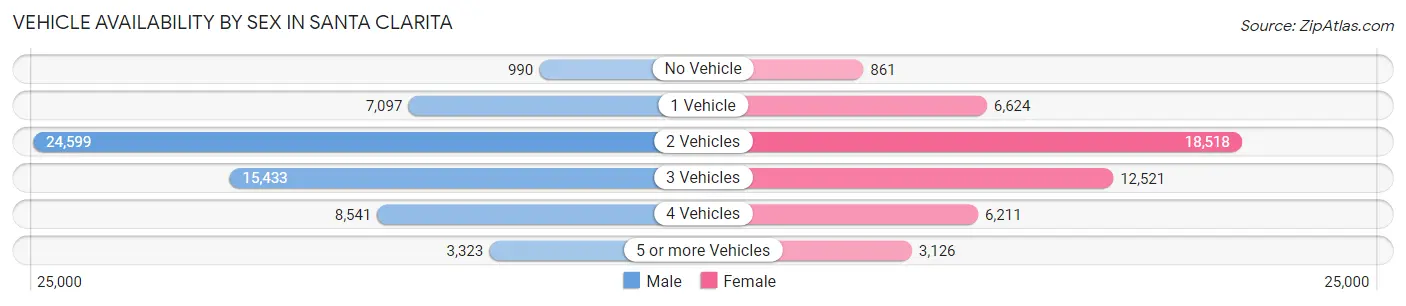
| Vehicles Available | Male | Female |
| No Vehicle | 990 (1.7%) | 861 (1.8%) |
| 1 Vehicle | 7,097 (11.8%) | 6,624 (13.8%) |
| 2 Vehicles | 24,599 (41.0%) | 18,518 (38.7%) |
| 3 Vehicles | 15,433 (25.7%) | 12,521 (26.2%) |
| 4 Vehicles | 8,541 (14.2%) | 6,211 (13.0%) |
| 5 or more Vehicles | 3,323 (5.5%) | 3,126 (6.5%) |
| Total | 59,983 (100.0%) | 47,861 (100.0%) |
Commute Time in Santa Clarita
The most frequently occuring commute durations in Santa Clarita are 60 to 89 minutes (13,028 commuters, 13.9%), 15 to 19 minutes (12,670 commuters, 13.6%), and 45 to 59 minutes (11,709 commuters, 12.5%).
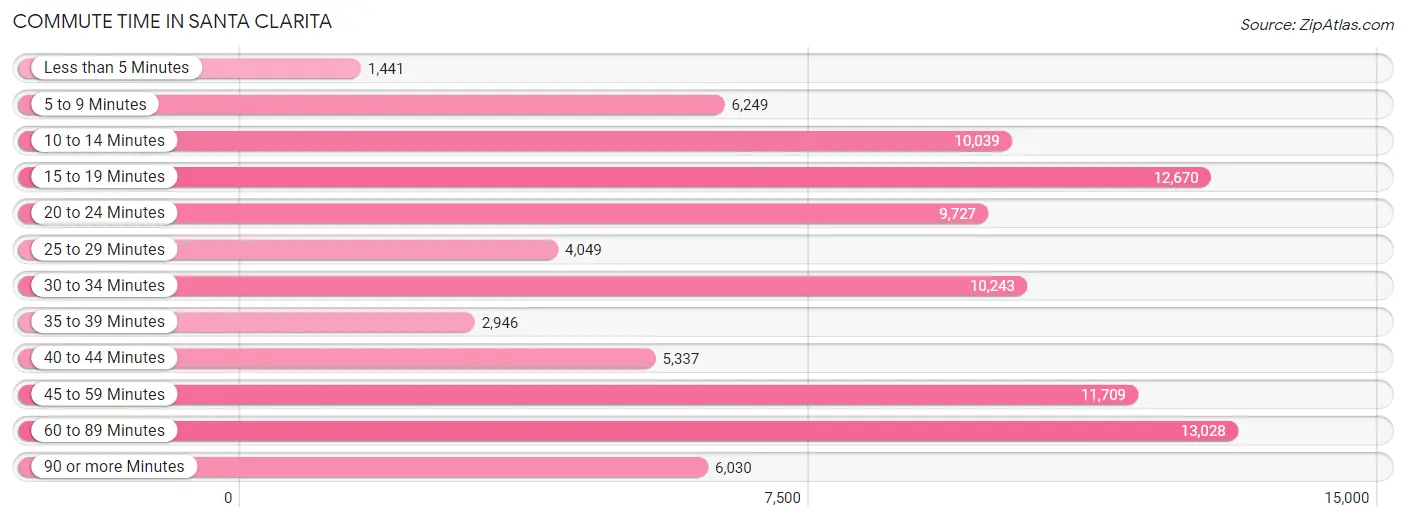
| Commute Time | # Commuters | % Commuters |
| Less than 5 Minutes | 1,441 | 1.5% |
| 5 to 9 Minutes | 6,249 | 6.7% |
| 10 to 14 Minutes | 10,039 | 10.7% |
| 15 to 19 Minutes | 12,670 | 13.6% |
| 20 to 24 Minutes | 9,727 | 10.4% |
| 25 to 29 Minutes | 4,049 | 4.3% |
| 30 to 34 Minutes | 10,243 | 11.0% |
| 35 to 39 Minutes | 2,946 | 3.2% |
| 40 to 44 Minutes | 5,337 | 5.7% |
| 45 to 59 Minutes | 11,709 | 12.5% |
| 60 to 89 Minutes | 13,028 | 13.9% |
| 90 or more Minutes | 6,030 | 6.5% |
Commute Time by Sex in Santa Clarita
The most common commute times in Santa Clarita are 60 to 89 minutes (7,961 commuters, 15.1%) for males and 15 to 19 minutes (6,307 commuters, 15.4%) for females.
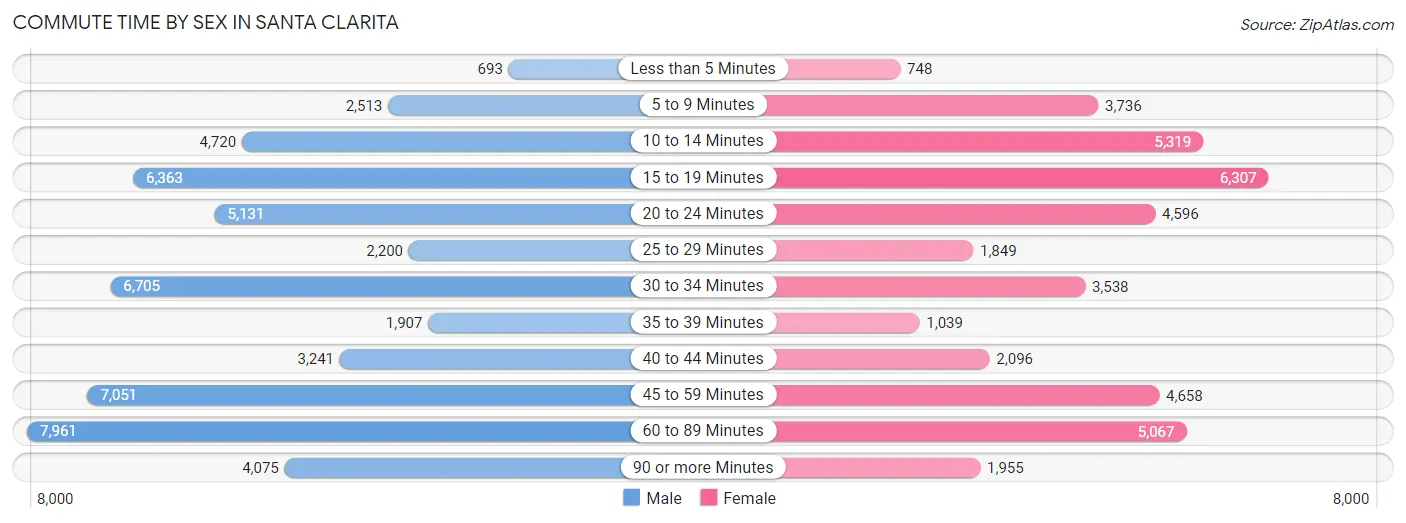
| Commute Time | Male | Female |
| Less than 5 Minutes | 693 (1.3%) | 748 (1.8%) |
| 5 to 9 Minutes | 2,513 (4.8%) | 3,736 (9.1%) |
| 10 to 14 Minutes | 4,720 (9.0%) | 5,319 (13.0%) |
| 15 to 19 Minutes | 6,363 (12.1%) | 6,307 (15.4%) |
| 20 to 24 Minutes | 5,131 (9.8%) | 4,596 (11.2%) |
| 25 to 29 Minutes | 2,200 (4.2%) | 1,849 (4.5%) |
| 30 to 34 Minutes | 6,705 (12.8%) | 3,538 (8.6%) |
| 35 to 39 Minutes | 1,907 (3.6%) | 1,039 (2.5%) |
| 40 to 44 Minutes | 3,241 (6.2%) | 2,096 (5.1%) |
| 45 to 59 Minutes | 7,051 (13.4%) | 4,658 (11.4%) |
| 60 to 89 Minutes | 7,961 (15.1%) | 5,067 (12.4%) |
| 90 or more Minutes | 4,075 (7.7%) | 1,955 (4.8%) |
Time of Departure to Work by Sex in Santa Clarita
The most frequent times of departure to work in Santa Clarita are 7:00 AM to 7:29 AM (6,755, 12.9%) for males and 7:00 AM to 7:29 AM (5,969, 14.6%) for females.
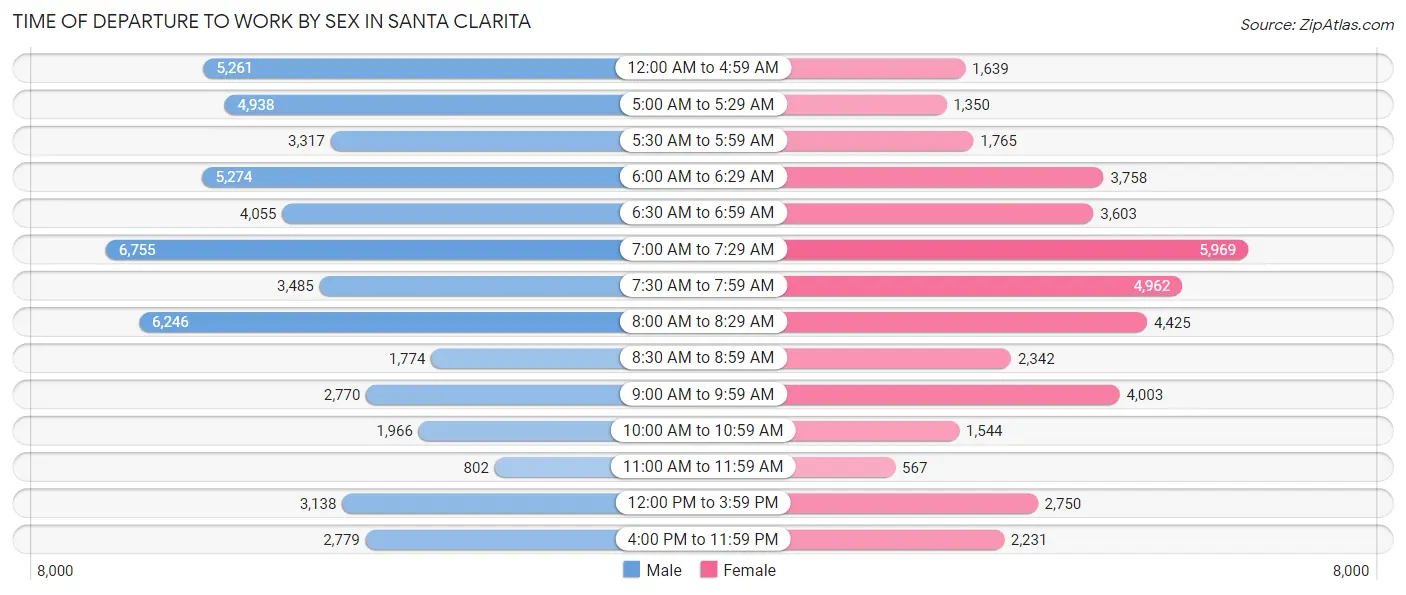
| Time of Departure | Male | Female |
| 12:00 AM to 4:59 AM | 5,261 (10.0%) | 1,639 (4.0%) |
| 5:00 AM to 5:29 AM | 4,938 (9.4%) | 1,350 (3.3%) |
| 5:30 AM to 5:59 AM | 3,317 (6.3%) | 1,765 (4.3%) |
| 6:00 AM to 6:29 AM | 5,274 (10.0%) | 3,758 (9.2%) |
| 6:30 AM to 6:59 AM | 4,055 (7.7%) | 3,603 (8.8%) |
| 7:00 AM to 7:29 AM | 6,755 (12.9%) | 5,969 (14.6%) |
| 7:30 AM to 7:59 AM | 3,485 (6.6%) | 4,962 (12.1%) |
| 8:00 AM to 8:29 AM | 6,246 (11.9%) | 4,425 (10.8%) |
| 8:30 AM to 8:59 AM | 1,774 (3.4%) | 2,342 (5.7%) |
| 9:00 AM to 9:59 AM | 2,770 (5.3%) | 4,003 (9.8%) |
| 10:00 AM to 10:59 AM | 1,966 (3.7%) | 1,544 (3.8%) |
| 11:00 AM to 11:59 AM | 802 (1.5%) | 567 (1.4%) |
| 12:00 PM to 3:59 PM | 3,138 (6.0%) | 2,750 (6.7%) |
| 4:00 PM to 11:59 PM | 2,779 (5.3%) | 2,231 (5.4%) |
| Total | 52,560 (100.0%) | 40,908 (100.0%) |
Housing Occupancy in Santa Clarita
Occupancy by Ownership in Santa Clarita
Of the total 73,362 dwellings in Santa Clarita, owner-occupied units account for 52,192 (71.1%), while renter-occupied units make up 21,170 (28.9%).
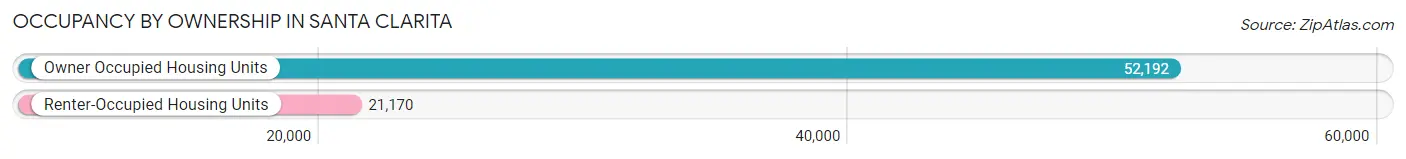
| Occupancy | # Housing Units | % Housing Units |
| Owner Occupied Housing Units | 52,192 | 71.1% |
| Renter-Occupied Housing Units | 21,170 | 28.9% |
| Total Occupied Housing Units | 73,362 | 100.0% |
Occupancy by Household Size in Santa Clarita
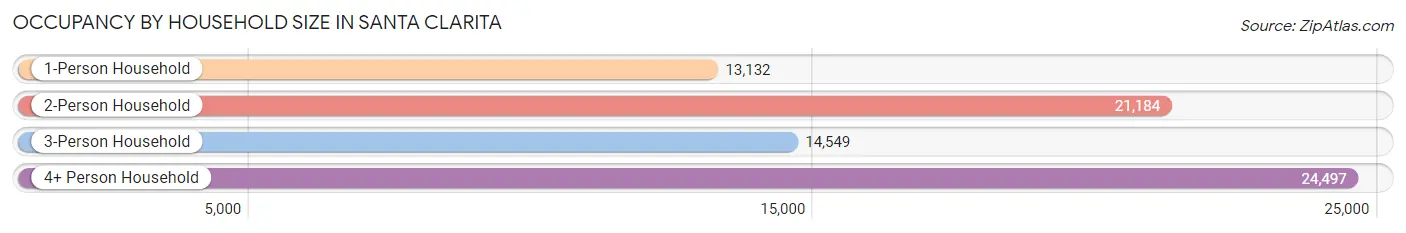
| Household Size | # Housing Units | % Housing Units |
| 1-Person Household | 13,132 | 17.9% |
| 2-Person Household | 21,184 | 28.9% |
| 3-Person Household | 14,549 | 19.8% |
| 4+ Person Household | 24,497 | 33.4% |
| Total Housing Units | 73,362 | 100.0% |
Occupancy by Ownership by Household Size in Santa Clarita
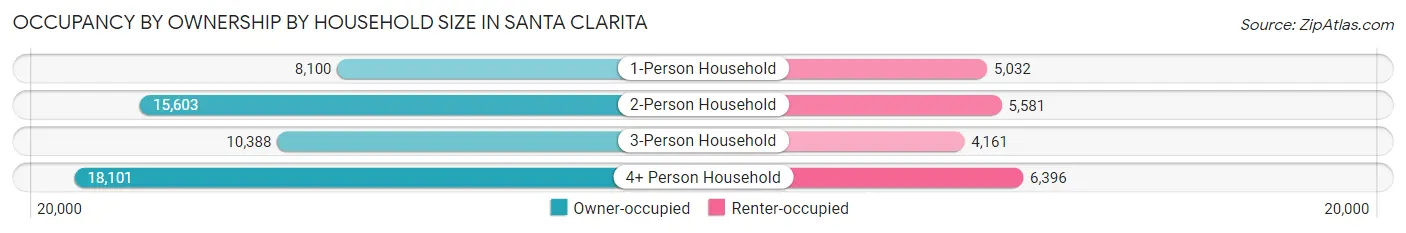
| Household Size | Owner-occupied | Renter-occupied |
| 1-Person Household | 8,100 (61.7%) | 5,032 (38.3%) |
| 2-Person Household | 15,603 (73.7%) | 5,581 (26.4%) |
| 3-Person Household | 10,388 (71.4%) | 4,161 (28.6%) |
| 4+ Person Household | 18,101 (73.9%) | 6,396 (26.1%) |
| Total Housing Units | 52,192 (71.1%) | 21,170 (28.9%) |
Occupancy by Educational Attainment in Santa Clarita
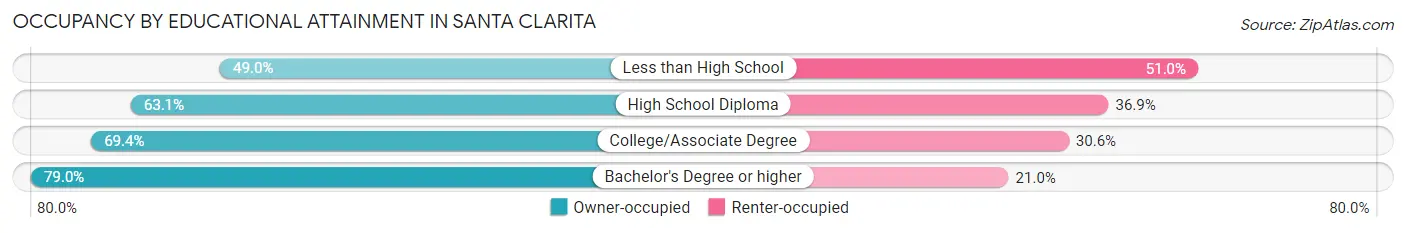
| Household Size | Owner-occupied | Renter-occupied |
| Less than High School | 2,460 (49.0%) | 2,562 (51.0%) |
| High School Diploma | 6,930 (63.1%) | 4,046 (36.9%) |
| College/Associate Degree | 18,232 (69.4%) | 8,026 (30.6%) |
| Bachelor's Degree or higher | 24,570 (79.0%) | 6,536 (21.0%) |
Occupancy by Age of Householder in Santa Clarita
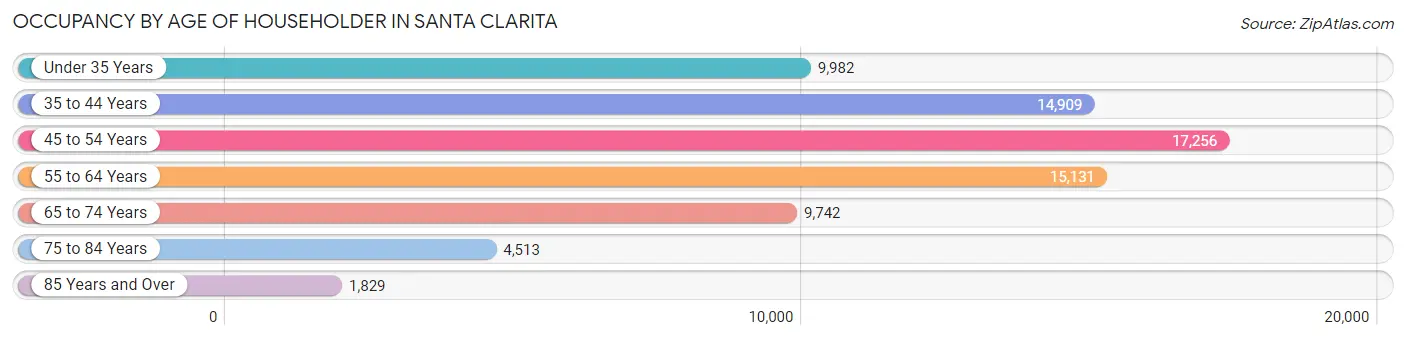
| Age Bracket | # Households | % Households |
| Under 35 Years | 9,982 | 13.6% |
| 35 to 44 Years | 14,909 | 20.3% |
| 45 to 54 Years | 17,256 | 23.5% |
| 55 to 64 Years | 15,131 | 20.6% |
| 65 to 74 Years | 9,742 | 13.3% |
| 75 to 84 Years | 4,513 | 6.1% |
| 85 Years and Over | 1,829 | 2.5% |
| Total | 73,362 | 100.0% |
Housing Finances in Santa Clarita
Median Income by Occupancy in Santa Clarita
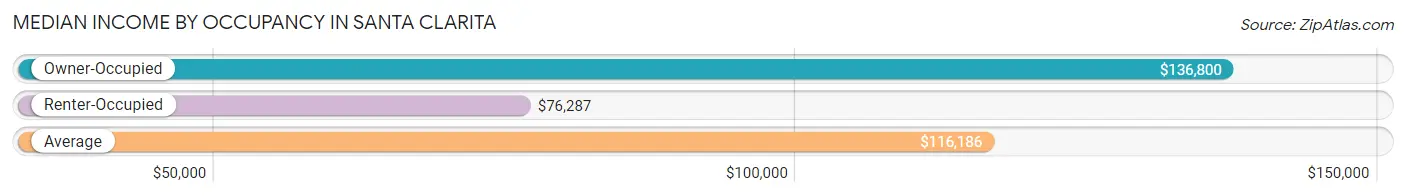
| Occupancy Type | # Households | Median Income |
| Owner-Occupied | 52,192 (71.1%) | $136,800 |
| Renter-Occupied | 21,170 (28.9%) | $76,287 |
| Average | 73,362 (100.0%) | $116,186 |
Occupancy by Householder Income Bracket in Santa Clarita
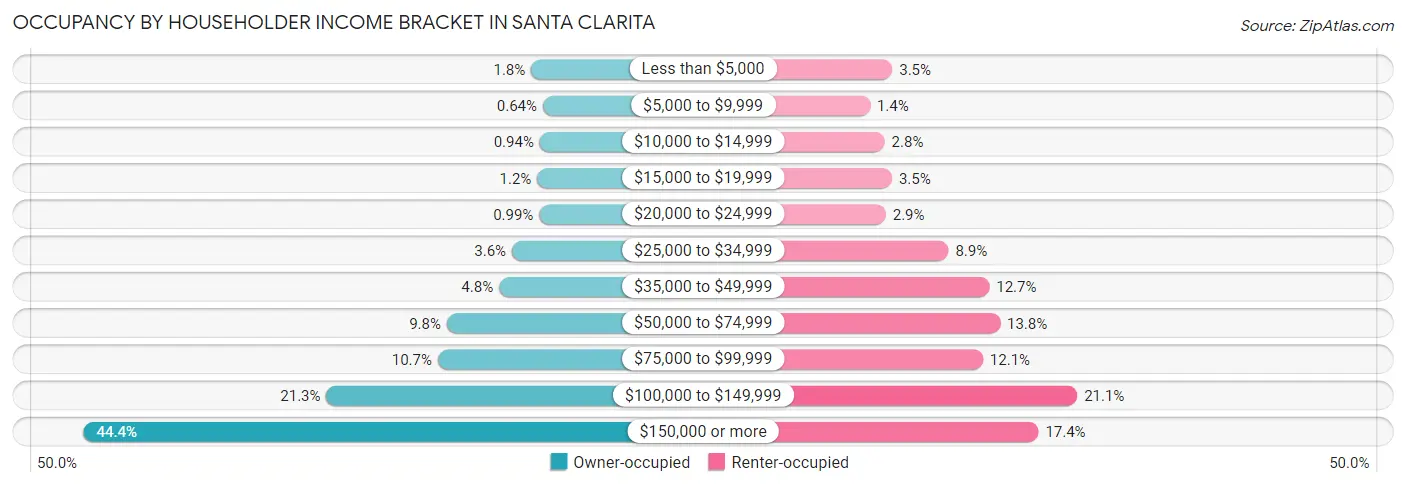
| Income Bracket | Owner-occupied | Renter-occupied |
| Less than $5,000 | 920 (1.8%) | 741 (3.5%) |
| $5,000 to $9,999 | 332 (0.6%) | 290 (1.4%) |
| $10,000 to $14,999 | 491 (0.9%) | 587 (2.8%) |
| $15,000 to $19,999 | 617 (1.2%) | 735 (3.5%) |
| $20,000 to $24,999 | 516 (1.0%) | 609 (2.9%) |
| $25,000 to $34,999 | 1,875 (3.6%) | 1,874 (8.8%) |
| $35,000 to $49,999 | 2,517 (4.8%) | 2,697 (12.7%) |
| $50,000 to $74,999 | 5,111 (9.8%) | 2,912 (13.8%) |
| $75,000 to $99,999 | 5,559 (10.6%) | 2,567 (12.1%) |
| $100,000 to $149,999 | 11,094 (21.3%) | 4,470 (21.1%) |
| $150,000 or more | 23,160 (44.4%) | 3,688 (17.4%) |
| Total | 52,192 (100.0%) | 21,170 (100.0%) |
Monthly Housing Cost Tiers in Santa Clarita
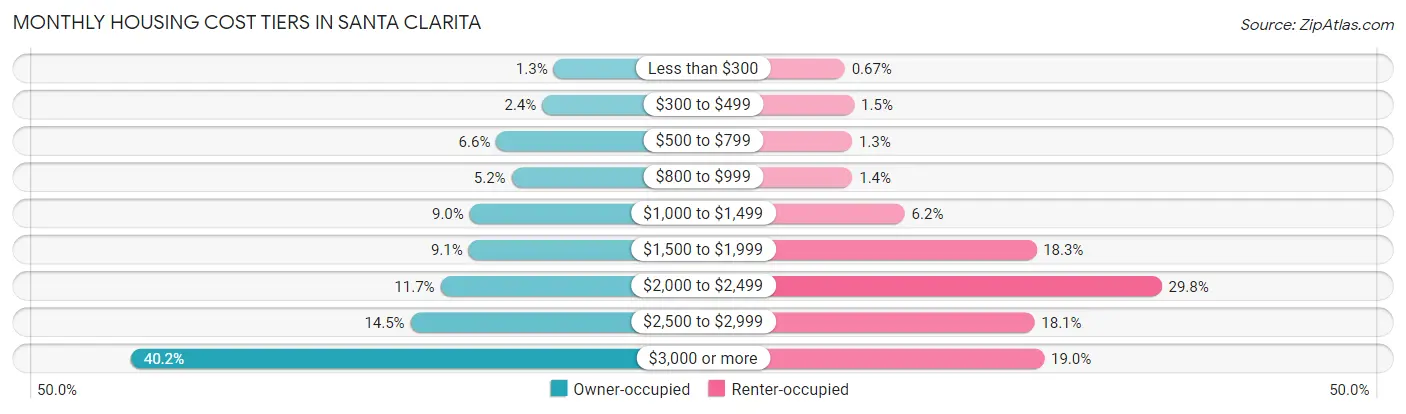
| Monthly Cost | Owner-occupied | Renter-occupied |
| Less than $300 | 682 (1.3%) | 142 (0.7%) |
| $300 to $499 | 1,230 (2.4%) | 327 (1.5%) |
| $500 to $799 | 3,432 (6.6%) | 283 (1.3%) |
| $800 to $999 | 2,701 (5.2%) | 289 (1.4%) |
| $1,000 to $1,499 | 4,712 (9.0%) | 1,310 (6.2%) |
| $1,500 to $1,999 | 4,763 (9.1%) | 3,874 (18.3%) |
| $2,000 to $2,499 | 6,119 (11.7%) | 6,318 (29.8%) |
| $2,500 to $2,999 | 7,559 (14.5%) | 3,839 (18.1%) |
| $3,000 or more | 20,994 (40.2%) | 4,026 (19.0%) |
| Total | 52,192 (100.0%) | 21,170 (100.0%) |
Physical Housing Characteristics in Santa Clarita
Housing Structures in Santa Clarita
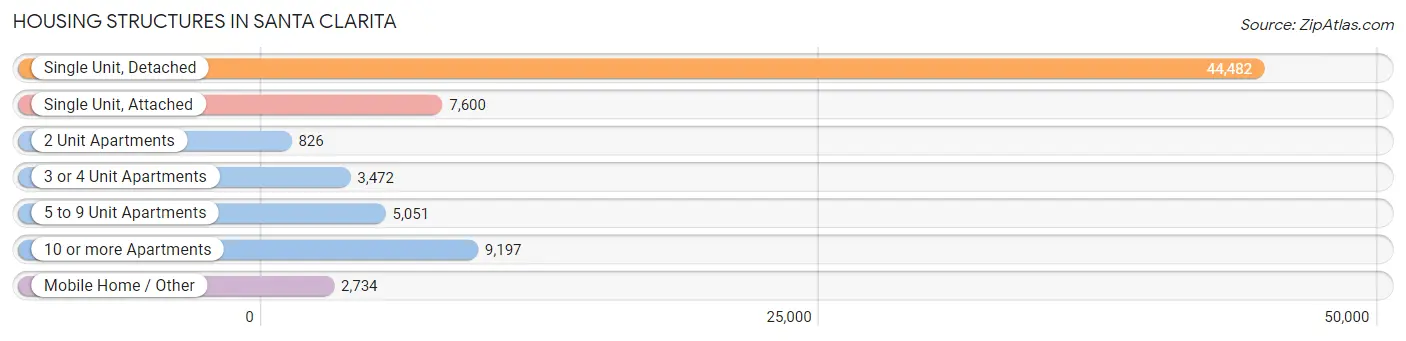
| Structure Type | # Housing Units | % Housing Units |
| Single Unit, Detached | 44,482 | 60.6% |
| Single Unit, Attached | 7,600 | 10.4% |
| 2 Unit Apartments | 826 | 1.1% |
| 3 or 4 Unit Apartments | 3,472 | 4.7% |
| 5 to 9 Unit Apartments | 5,051 | 6.9% |
| 10 or more Apartments | 9,197 | 12.5% |
| Mobile Home / Other | 2,734 | 3.7% |
| Total | 73,362 | 100.0% |
Housing Structures by Occupancy in Santa Clarita
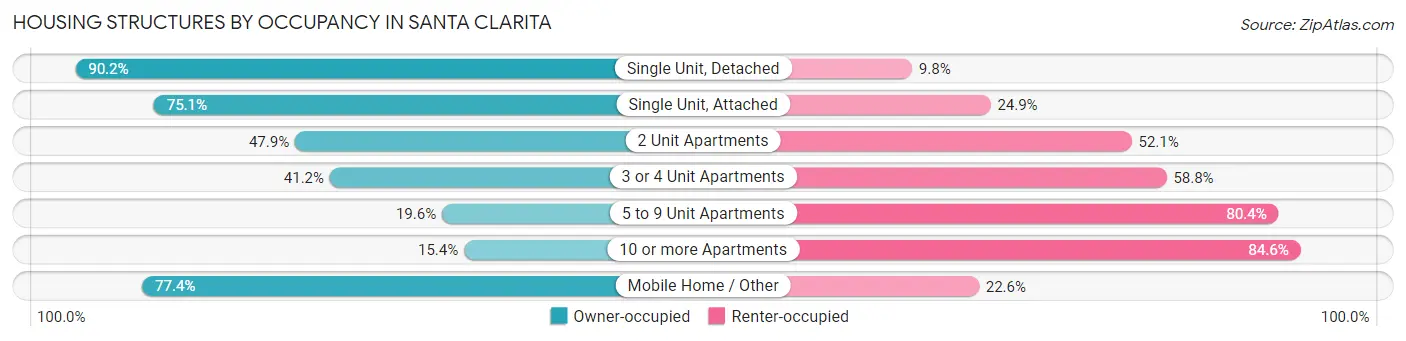
| Structure Type | Owner-occupied | Renter-occupied |
| Single Unit, Detached | 40,135 (90.2%) | 4,347 (9.8%) |
| Single Unit, Attached | 5,708 (75.1%) | 1,892 (24.9%) |
| 2 Unit Apartments | 396 (47.9%) | 430 (52.1%) |
| 3 or 4 Unit Apartments | 1,431 (41.2%) | 2,041 (58.8%) |
| 5 to 9 Unit Apartments | 992 (19.6%) | 4,059 (80.4%) |
| 10 or more Apartments | 1,415 (15.4%) | 7,782 (84.6%) |
| Mobile Home / Other | 2,115 (77.4%) | 619 (22.6%) |
| Total | 52,192 (71.1%) | 21,170 (28.9%) |
Housing Structures by Number of Rooms in Santa Clarita
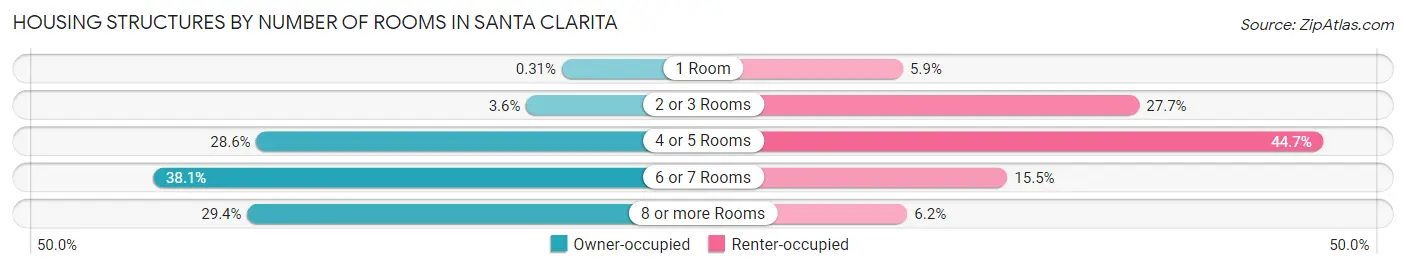
| Number of Rooms | Owner-occupied | Renter-occupied |
| 1 Room | 162 (0.3%) | 1,239 (5.9%) |
| 2 or 3 Rooms | 1,877 (3.6%) | 5,864 (27.7%) |
| 4 or 5 Rooms | 14,908 (28.6%) | 9,468 (44.7%) |
| 6 or 7 Rooms | 19,900 (38.1%) | 3,279 (15.5%) |
| 8 or more Rooms | 15,345 (29.4%) | 1,320 (6.2%) |
| Total | 52,192 (100.0%) | 21,170 (100.0%) |
Housing Structure by Heating Type in Santa Clarita
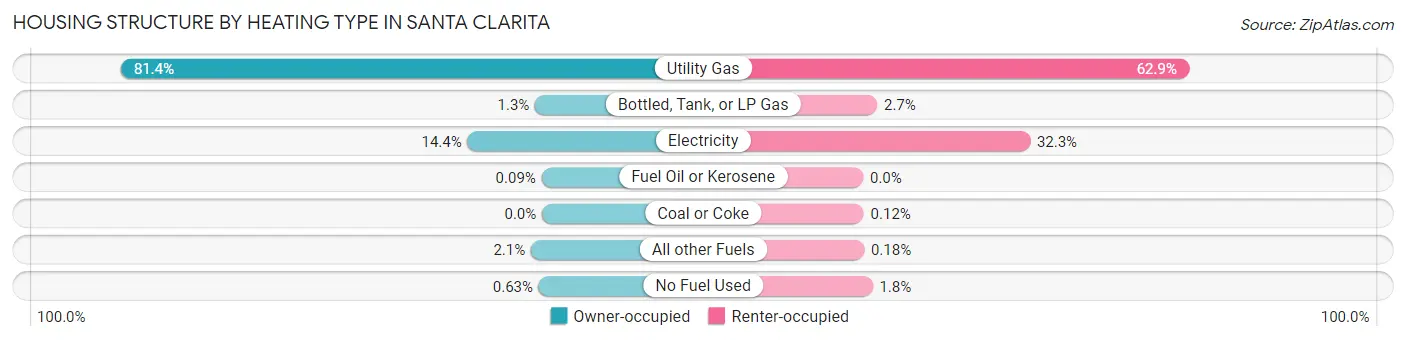
| Heating Type | Owner-occupied | Renter-occupied |
| Utility Gas | 42,485 (81.4%) | 13,323 (62.9%) |
| Bottled, Tank, or LP Gas | 699 (1.3%) | 571 (2.7%) |
| Electricity | 7,518 (14.4%) | 6,827 (32.3%) |
| Fuel Oil or Kerosene | 48 (0.1%) | 0 (0.0%) |
| Coal or Coke | 0 (0.0%) | 25 (0.1%) |
| All other Fuels | 1,113 (2.1%) | 38 (0.2%) |
| No Fuel Used | 329 (0.6%) | 386 (1.8%) |
| Total | 52,192 (100.0%) | 21,170 (100.0%) |
Household Vehicle Usage in Santa Clarita
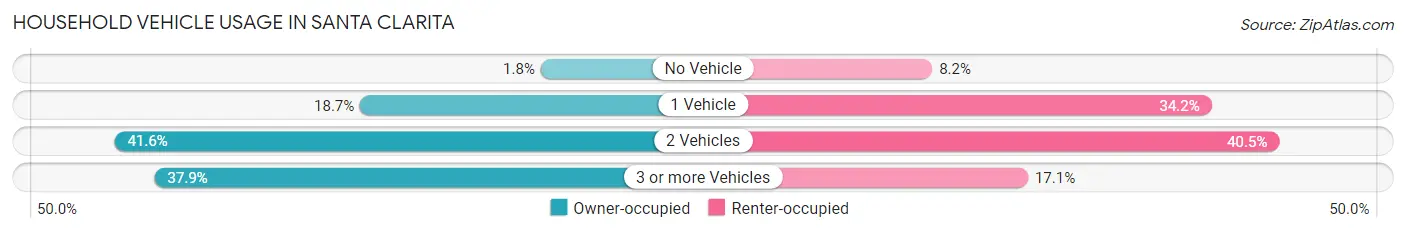
| Vehicles per Household | Owner-occupied | Renter-occupied |
| No Vehicle | 950 (1.8%) | 1,725 (8.2%) |
| 1 Vehicle | 9,751 (18.7%) | 7,245 (34.2%) |
| 2 Vehicles | 21,719 (41.6%) | 8,583 (40.5%) |
| 3 or more Vehicles | 19,772 (37.9%) | 3,617 (17.1%) |
| Total | 52,192 (100.0%) | 21,170 (100.0%) |
Real Estate & Mortgages in Santa Clarita
Real Estate and Mortgage Overview in Santa Clarita
| Characteristic | Without Mortgage | With Mortgage |
| Housing Units | 11,924 | 40,268 |
| Median Property Value | $619,800 | $683,600 |
| Median Household Income | $95,479 | $19,780 |
| Monthly Housing Costs | $865 | $20,939 |
| Real Estate Taxes | $4,860 | $818 |
Property Value by Mortgage Status in Santa Clarita
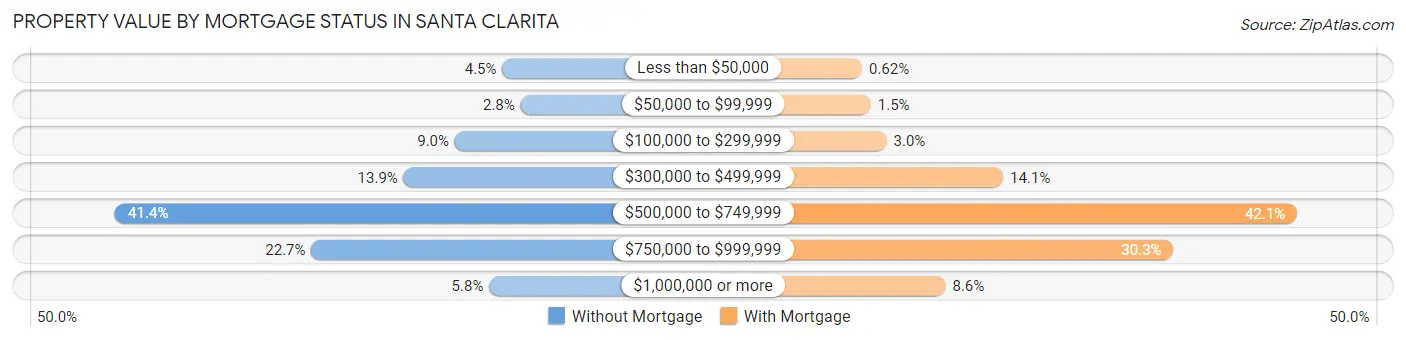
| Property Value | Without Mortgage | With Mortgage |
| Less than $50,000 | 536 (4.5%) | 251 (0.6%) |
| $50,000 to $99,999 | 329 (2.8%) | 587 (1.5%) |
| $100,000 to $299,999 | 1,075 (9.0%) | 1,193 (3.0%) |
| $300,000 to $499,999 | 1,658 (13.9%) | 5,662 (14.1%) |
| $500,000 to $749,999 | 4,934 (41.4%) | 16,937 (42.1%) |
| $750,000 to $999,999 | 2,706 (22.7%) | 12,189 (30.3%) |
| $1,000,000 or more | 686 (5.8%) | 3,449 (8.6%) |
| Total | 11,924 (100.0%) | 40,268 (100.0%) |
Household Income by Mortgage Status in Santa Clarita
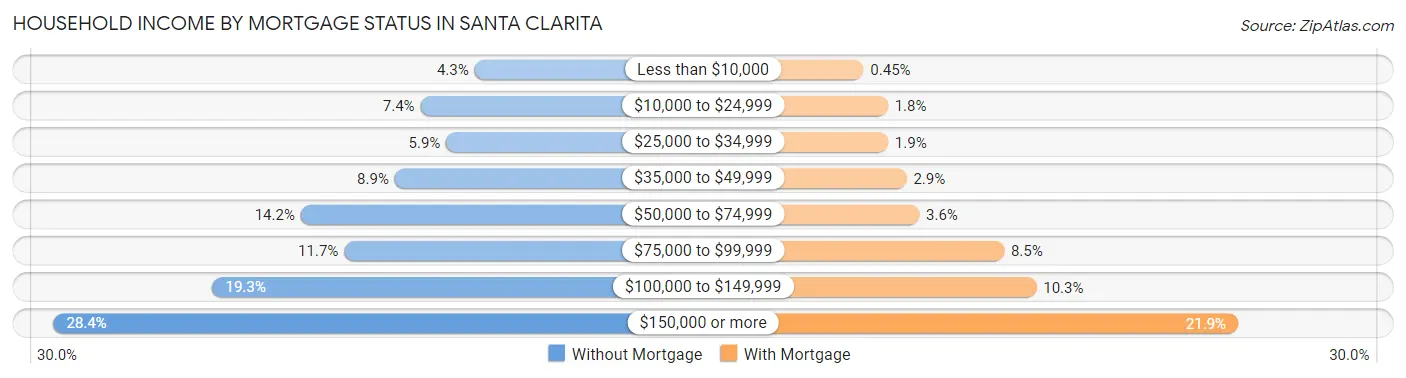
| Household Income | Without Mortgage | With Mortgage |
| Less than $10,000 | 511 (4.3%) | 183 (0.4%) |
| $10,000 to $24,999 | 880 (7.4%) | 741 (1.8%) |
| $25,000 to $34,999 | 705 (5.9%) | 744 (1.8%) |
| $35,000 to $49,999 | 1,055 (8.8%) | 1,170 (2.9%) |
| $50,000 to $74,999 | 1,696 (14.2%) | 1,462 (3.6%) |
| $75,000 to $99,999 | 1,400 (11.7%) | 3,415 (8.5%) |
| $100,000 to $149,999 | 2,297 (19.3%) | 4,159 (10.3%) |
| $150,000 or more | 3,380 (28.3%) | 8,797 (21.8%) |
| Total | 11,924 (100.0%) | 40,268 (100.0%) |
Property Value to Household Income Ratio in Santa Clarita
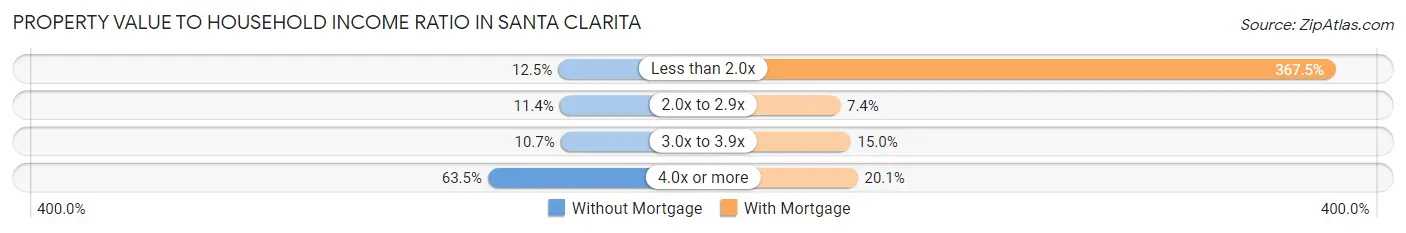
| Value-to-Income Ratio | Without Mortgage | With Mortgage |
| Less than 2.0x | 1,490 (12.5%) | 147,993 (367.5%) |
| 2.0x to 2.9x | 1,358 (11.4%) | 2,965 (7.4%) |
| 3.0x to 3.9x | 1,273 (10.7%) | 6,028 (15.0%) |
| 4.0x or more | 7,575 (63.5%) | 8,079 (20.1%) |
| Total | 11,924 (100.0%) | 40,268 (100.0%) |
Real Estate Taxes by Mortgage Status in Santa Clarita
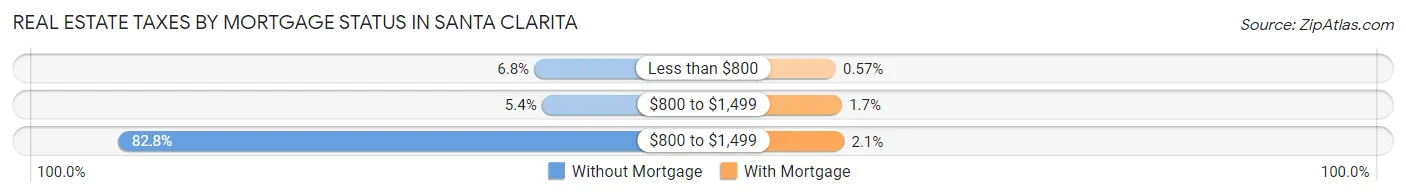
| Property Taxes | Without Mortgage | With Mortgage |
| Less than $800 | 810 (6.8%) | 230 (0.6%) |
| $800 to $1,499 | 645 (5.4%) | 675 (1.7%) |
| $800 to $1,499 | 9,871 (82.8%) | 847 (2.1%) |
| Total | 11,924 (100.0%) | 40,268 (100.0%) |
Health & Disability in Santa Clarita
Health Insurance Coverage by Age in Santa Clarita
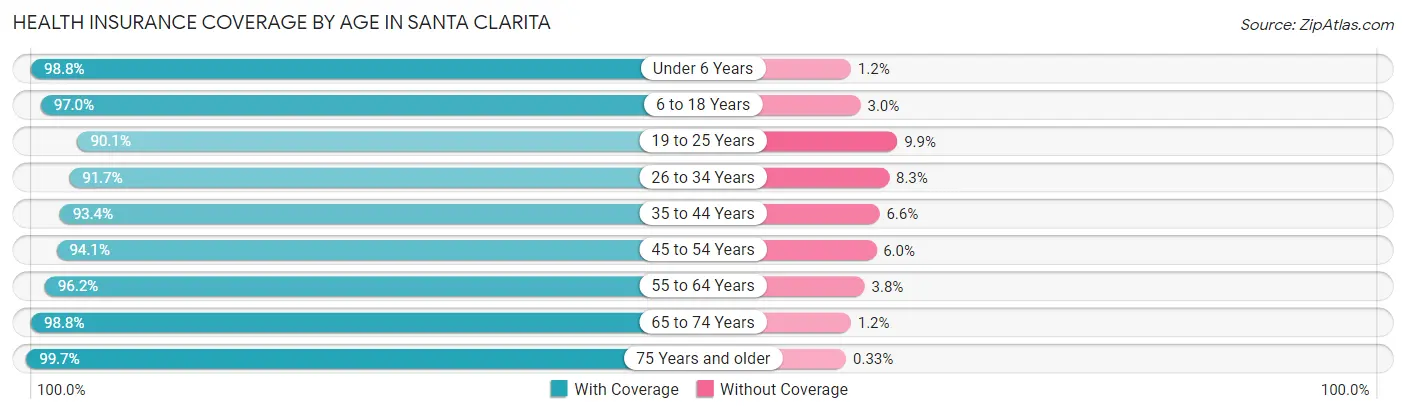
| Age Bracket | With Coverage | Without Coverage |
| Under 6 Years | 17,562 (98.8%) | 219 (1.2%) |
| 6 to 18 Years | 41,008 (97.0%) | 1,281 (3.0%) |
| 19 to 25 Years | 17,224 (90.1%) | 1,887 (9.9%) |
| 26 to 34 Years | 23,732 (91.7%) | 2,158 (8.3%) |
| 35 to 44 Years | 29,392 (93.4%) | 2,065 (6.6%) |
| 45 to 54 Years | 30,866 (94.1%) | 1,952 (5.9%) |
| 55 to 64 Years | 27,154 (96.2%) | 1,069 (3.8%) |
| 65 to 74 Years | 16,788 (98.8%) | 205 (1.2%) |
| 75 Years and older | 10,900 (99.7%) | 36 (0.3%) |
| Total | 214,626 (95.2%) | 10,872 (4.8%) |
Health Insurance Coverage by Citizenship Status in Santa Clarita
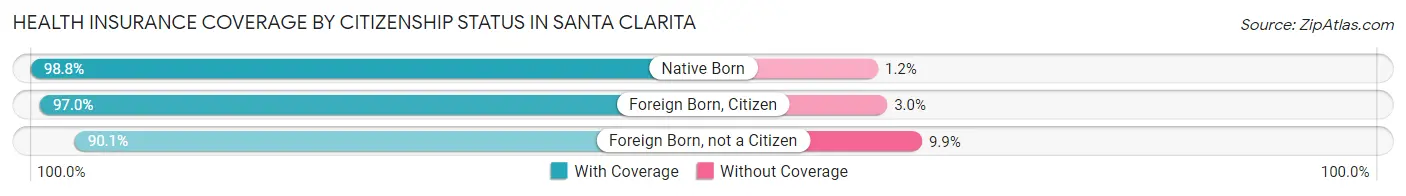
| Citizenship Status | With Coverage | Without Coverage |
| Native Born | 17,562 (98.8%) | 219 (1.2%) |
| Foreign Born, Citizen | 41,008 (97.0%) | 1,281 (3.0%) |
| Foreign Born, not a Citizen | 17,224 (90.1%) | 1,887 (9.9%) |
Health Insurance Coverage by Household Income in Santa Clarita
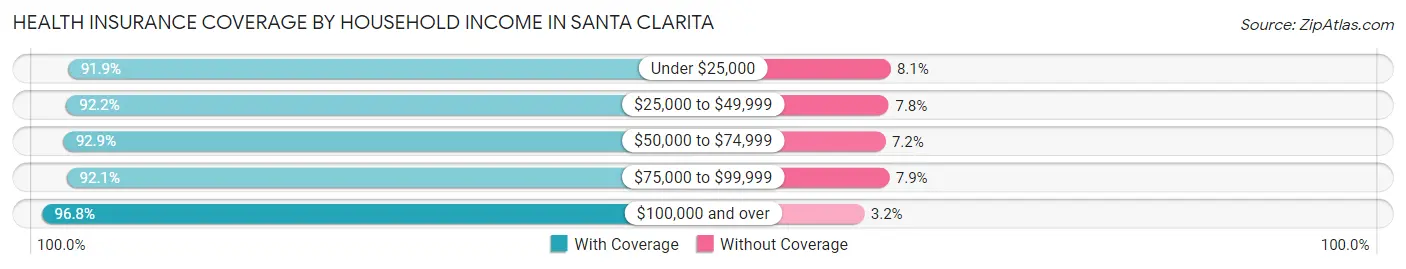
| Household Income | With Coverage | Without Coverage |
| Under $25,000 | 11,142 (91.9%) | 980 (8.1%) |
| $25,000 to $49,999 | 20,067 (92.2%) | 1,703 (7.8%) |
| $50,000 to $74,999 | 21,029 (92.8%) | 1,620 (7.1%) |
| $75,000 to $99,999 | 21,618 (92.1%) | 1,848 (7.9%) |
| $100,000 and over | 139,358 (96.8%) | 4,587 (3.2%) |
Public vs Private Health Insurance Coverage by Age in Santa Clarita
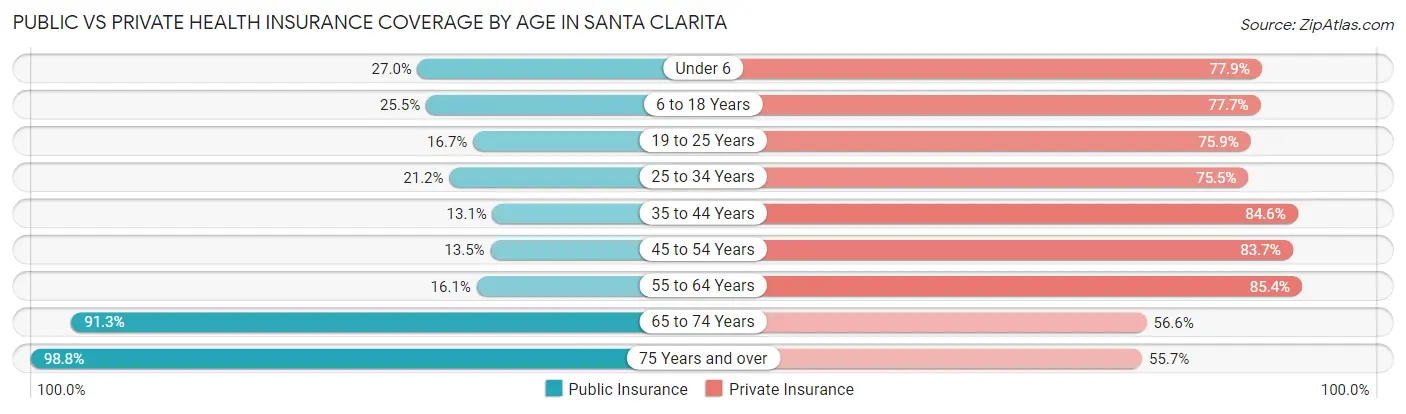
| Age Bracket | Public Insurance | Private Insurance |
| Under 6 | 4,808 (27.0%) | 13,853 (77.9%) |
| 6 to 18 Years | 10,771 (25.5%) | 32,858 (77.7%) |
| 19 to 25 Years | 3,200 (16.7%) | 14,496 (75.8%) |
| 25 to 34 Years | 5,478 (21.2%) | 19,533 (75.4%) |
| 35 to 44 Years | 4,128 (13.1%) | 26,612 (84.6%) |
| 45 to 54 Years | 4,443 (13.5%) | 27,453 (83.7%) |
| 55 to 64 Years | 4,541 (16.1%) | 24,103 (85.4%) |
| 65 to 74 Years | 15,520 (91.3%) | 9,611 (56.6%) |
| 75 Years and over | 10,809 (98.8%) | 6,095 (55.7%) |
| Total | 63,698 (28.2%) | 174,614 (77.4%) |
Disability Status by Sex by Age in Santa Clarita
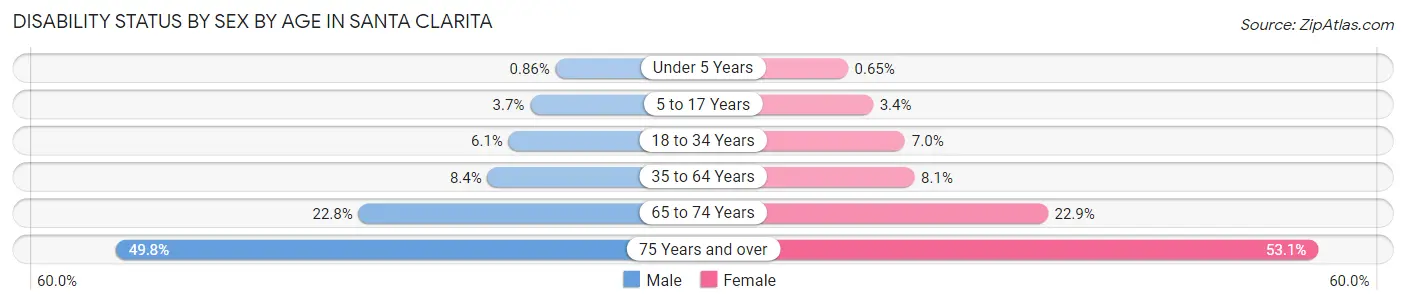
| Age Bracket | Male | Female |
| Under 5 Years | 67 (0.9%) | 48 (0.6%) |
| 5 to 17 Years | 776 (3.7%) | 726 (3.4%) |
| 18 to 34 Years | 1,483 (6.1%) | 1,643 (7.0%) |
| 35 to 64 Years | 3,967 (8.4%) | 3,665 (8.1%) |
| 65 to 74 Years | 1,734 (22.8%) | 2,151 (22.9%) |
| 75 Years and over | 2,112 (49.8%) | 3,553 (53.0%) |
Disability Class by Sex by Age in Santa Clarita
Disability Class: Hearing Difficulty
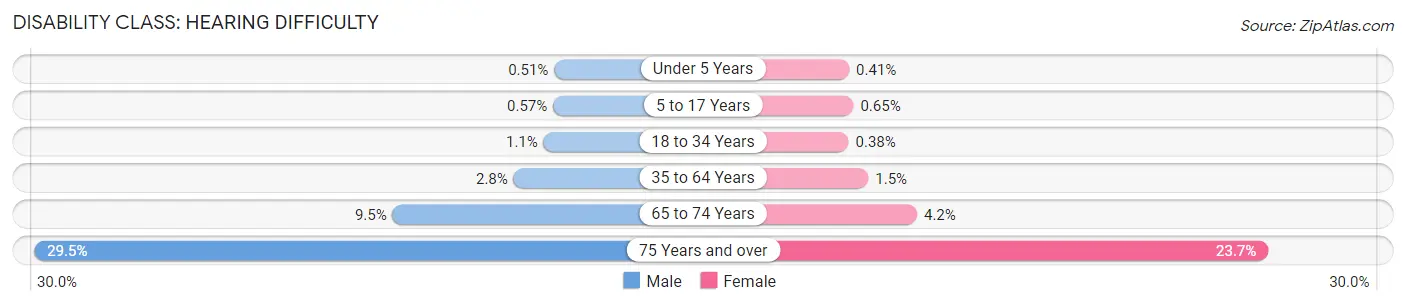
| Age Bracket | Male | Female |
| Under 5 Years | 40 (0.5%) | 30 (0.4%) |
| 5 to 17 Years | 120 (0.6%) | 138 (0.6%) |
| 18 to 34 Years | 267 (1.1%) | 89 (0.4%) |
| 35 to 64 Years | 1,304 (2.8%) | 673 (1.5%) |
| 65 to 74 Years | 723 (9.5%) | 393 (4.2%) |
| 75 Years and over | 1,249 (29.5%) | 1,590 (23.7%) |
Disability Class: Vision Difficulty
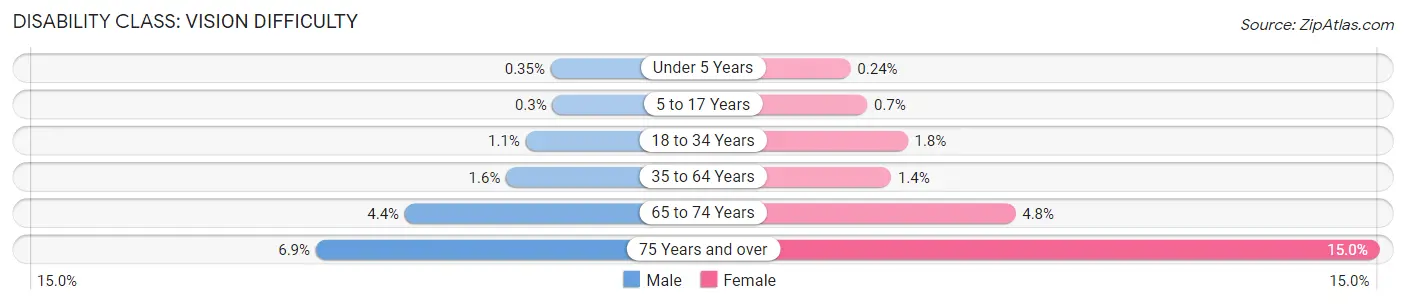
| Age Bracket | Male | Female |
| Under 5 Years | 27 (0.4%) | 18 (0.2%) |
| 5 to 17 Years | 63 (0.3%) | 148 (0.7%) |
| 18 to 34 Years | 255 (1.1%) | 427 (1.8%) |
| 35 to 64 Years | 750 (1.6%) | 621 (1.4%) |
| 65 to 74 Years | 335 (4.4%) | 454 (4.8%) |
| 75 Years and over | 292 (6.9%) | 1,003 (15.0%) |
Disability Class: Cognitive Difficulty
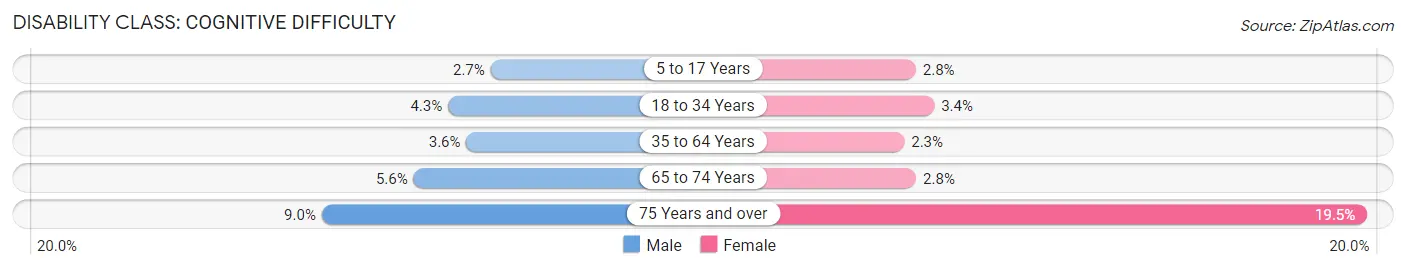
| Age Bracket | Male | Female |
| 5 to 17 Years | 567 (2.7%) | 581 (2.8%) |
| 18 to 34 Years | 1,042 (4.3%) | 802 (3.4%) |
| 35 to 64 Years | 1,692 (3.6%) | 1,054 (2.3%) |
| 65 to 74 Years | 423 (5.6%) | 259 (2.8%) |
| 75 Years and over | 380 (9.0%) | 1,306 (19.5%) |
Disability Class: Ambulatory Difficulty
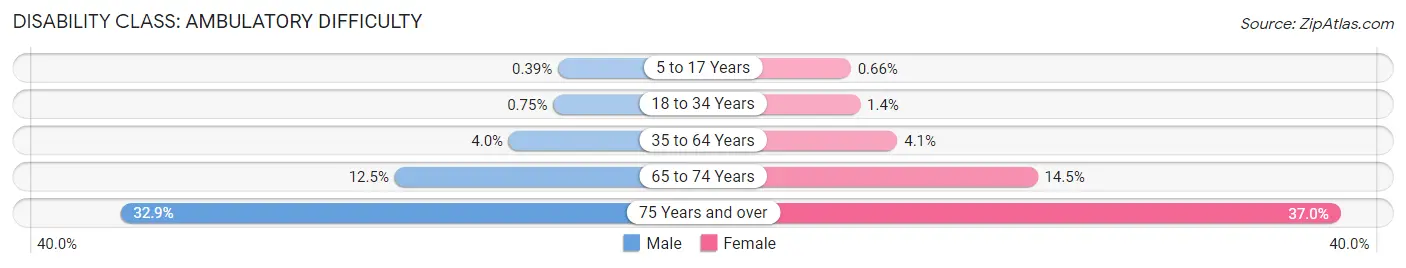
| Age Bracket | Male | Female |
| 5 to 17 Years | 82 (0.4%) | 140 (0.7%) |
| 18 to 34 Years | 183 (0.7%) | 319 (1.4%) |
| 35 to 64 Years | 1,902 (4.0%) | 1,874 (4.1%) |
| 65 to 74 Years | 952 (12.5%) | 1,364 (14.5%) |
| 75 Years and over | 1,394 (32.9%) | 2,480 (37.0%) |
Disability Class: Self-Care Difficulty
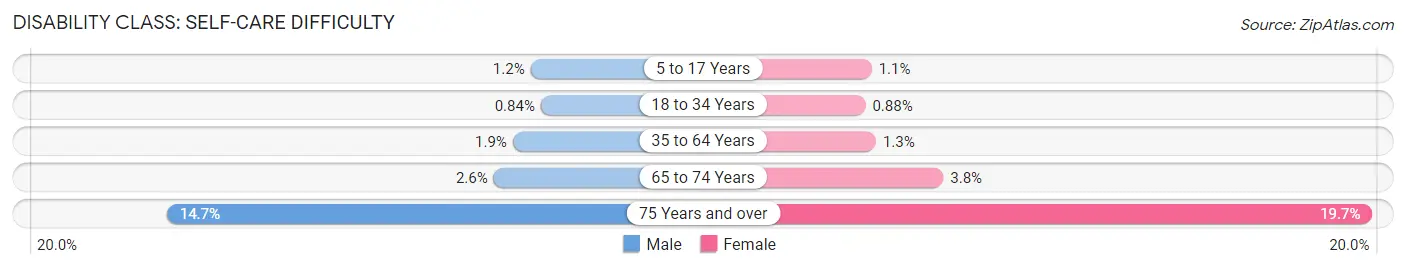
| Age Bracket | Male | Female |
| 5 to 17 Years | 257 (1.2%) | 234 (1.1%) |
| 18 to 34 Years | 204 (0.8%) | 206 (0.9%) |
| 35 to 64 Years | 882 (1.9%) | 579 (1.3%) |
| 65 to 74 Years | 197 (2.6%) | 354 (3.8%) |
| 75 Years and over | 624 (14.7%) | 1,319 (19.7%) |
Technology Access in Santa Clarita
Computing Device Access in Santa Clarita
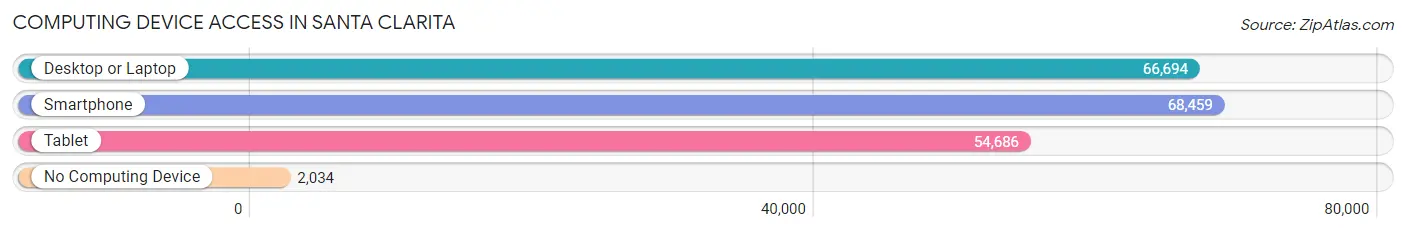
| Device Type | # Households | % Households |
| Desktop or Laptop | 66,694 | 90.9% |
| Smartphone | 68,459 | 93.3% |
| Tablet | 54,686 | 74.5% |
| No Computing Device | 2,034 | 2.8% |
| Total | 73,362 | 100.0% |
Internet Access in Santa Clarita
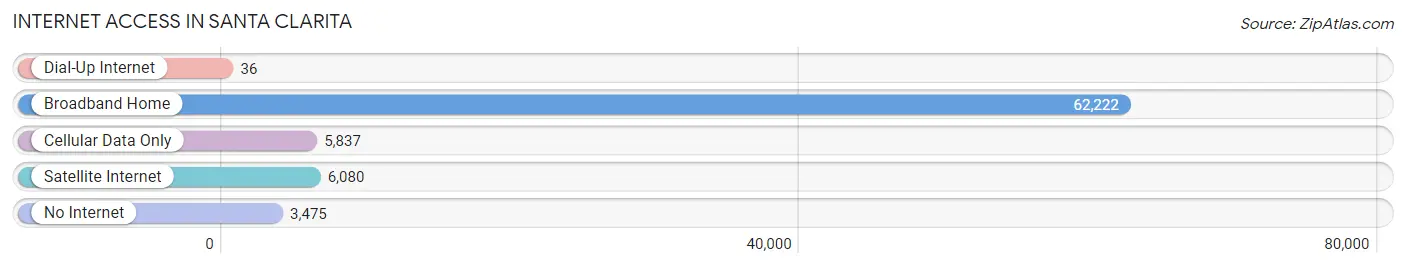
| Internet Type | # Households | % Households |
| Dial-Up Internet | 36 | 0.1% |
| Broadband Home | 62,222 | 84.8% |
| Cellular Data Only | 5,837 | 8.0% |
| Satellite Internet | 6,080 | 8.3% |
| No Internet | 3,475 | 4.7% |
| Total | 73,362 | 100.0% |
Santa Clarita Summary
Santa Clarita, California is a city located in the northwestern part of Los Angeles County, California. It is the third largest city in Los Angeles County and the twenty-fourth largest city in the state of California. The city is located in the Santa Clarita Valley, which is part of the larger Los Angeles metropolitan area. The city was incorporated in 1987 and is home to over 200,000 people.
Geography
Santa Clarita is located in the Santa Clarita Valley, which is part of the larger Los Angeles metropolitan area. The city is bordered by the San Gabriel Mountains to the north, the Santa Susana Mountains to the east, and the Sierra Pelona Mountains to the west. The city is located approximately 40 miles northwest of downtown Los Angeles. The city covers an area of about 62 square miles and has an elevation of 1,000 feet.
The city is divided into several distinct neighborhoods, including Valencia, Canyon Country, Saugus, Newhall, and Castaic. The city is also home to several parks, including Central Park, Valencia Meadows Park, and Castaic Lake State Recreation Area.
History
The area that is now Santa Clarita was originally inhabited by the Tataviam people. The area was later settled by Spanish colonists in the late 18th century. The area was known as Rancho San Francisco and was part of the larger Rancho San Francisco land grant.
In 1876, the area was renamed Newhall after Henry Newhall, a businessman who had purchased the land. The area was later incorporated as a city in 1987.
Economy
Santa Clarita is home to a diverse economy. The city is home to several major employers, including Six Flags Magic Mountain, Princess Cruises, and the William S. Hart Union High School District. The city is also home to several major shopping centers, including the Valencia Town Center and the Westfield Valencia Town Center.
The city is also home to several major film and television studios, including the Santa Clarita Studios, which is home to the television series NCIS: Los Angeles. The city is also home to several major manufacturing companies, including Boeing, Lockheed Martin, and Northrop Grumman.
Demographics
As of the 2010 census, the city had a population of 176,320. The racial makeup of the city was 68.2% White, 8.3% African American, 0.7% Native American, 11.2% Asian, 0.2% Pacific Islander, 8.3% from other races, and 3.2% from two or more races. Hispanic or Latino of any race were 24.4% of the population.
The median household income in the city was $76,843 and the median family income was $87,813. The per capita income in the city was $32,945. About 8.3% of families and 11.2% of the population were below the poverty line, including 15.2% of those under age 18 and 6.2% of those age 65 or over.
Common Questions
What is Per Capita Income in Santa Clarita?
Per Capita income in Santa Clarita is $47,057.
What is the Median Family Income in Santa Clarita?
Median Family Income in Santa Clarita is $128,916.
What is the Median Household income in Santa Clarita?
Median Household Income in Santa Clarita is $116,186.
What is Income or Wage Gap in Santa Clarita?
Income or Wage Gap in Santa Clarita is 38.0%.
Women in Santa Clarita earn 62.0 cents for every dollar earned by a man.
What is Family Income Deficit in Santa Clarita?
Family Income Deficit in Santa Clarita is $11,963.
Families that are below poverty line in Santa Clarita earn $11,963 less on average than the poverty threshold level.
What is Inequality or Gini Index in Santa Clarita?
Inequality or Gini Index in Santa Clarita is 0.41.
What is the Total Population of Santa Clarita?
Total Population of Santa Clarita is 225,850.
What is the Total Male Population of Santa Clarita?
Total Male Population of Santa Clarita is 112,189.
What is the Total Female Population of Santa Clarita?
Total Female Population of Santa Clarita is 113,661.
What is the Ratio of Males per 100 Females in Santa Clarita?
There are 98.70 Males per 100 Females in Santa Clarita.
What is the Ratio of Females per 100 Males in Santa Clarita?
There are 101.31 Females per 100 Males in Santa Clarita.
What is the Median Population Age in Santa Clarita?
Median Population Age in Santa Clarita is 37.3 Years.
What is the Average Family Size in Santa Clarita
Average Family Size in Santa Clarita is 3.5 People.
What is the Average Household Size in Santa Clarita
Average Household Size in Santa Clarita is 3.0 People.
How Large is the Labor Force in Santa Clarita?
There are 117,716 People in the Labor Forcein in Santa Clarita.
What is the Percentage of People in the Labor Force in Santa Clarita?
67.3% of People are in the Labor Force in Santa Clarita.
What is the Unemployment Rate in Santa Clarita?
Unemployment Rate in Santa Clarita is 5.5%.