Cities with the Largest Black / African American Community in North Carolina
RELATED REPORTS & OPTIONS
Black / African American
North Carolina
Compare Cities
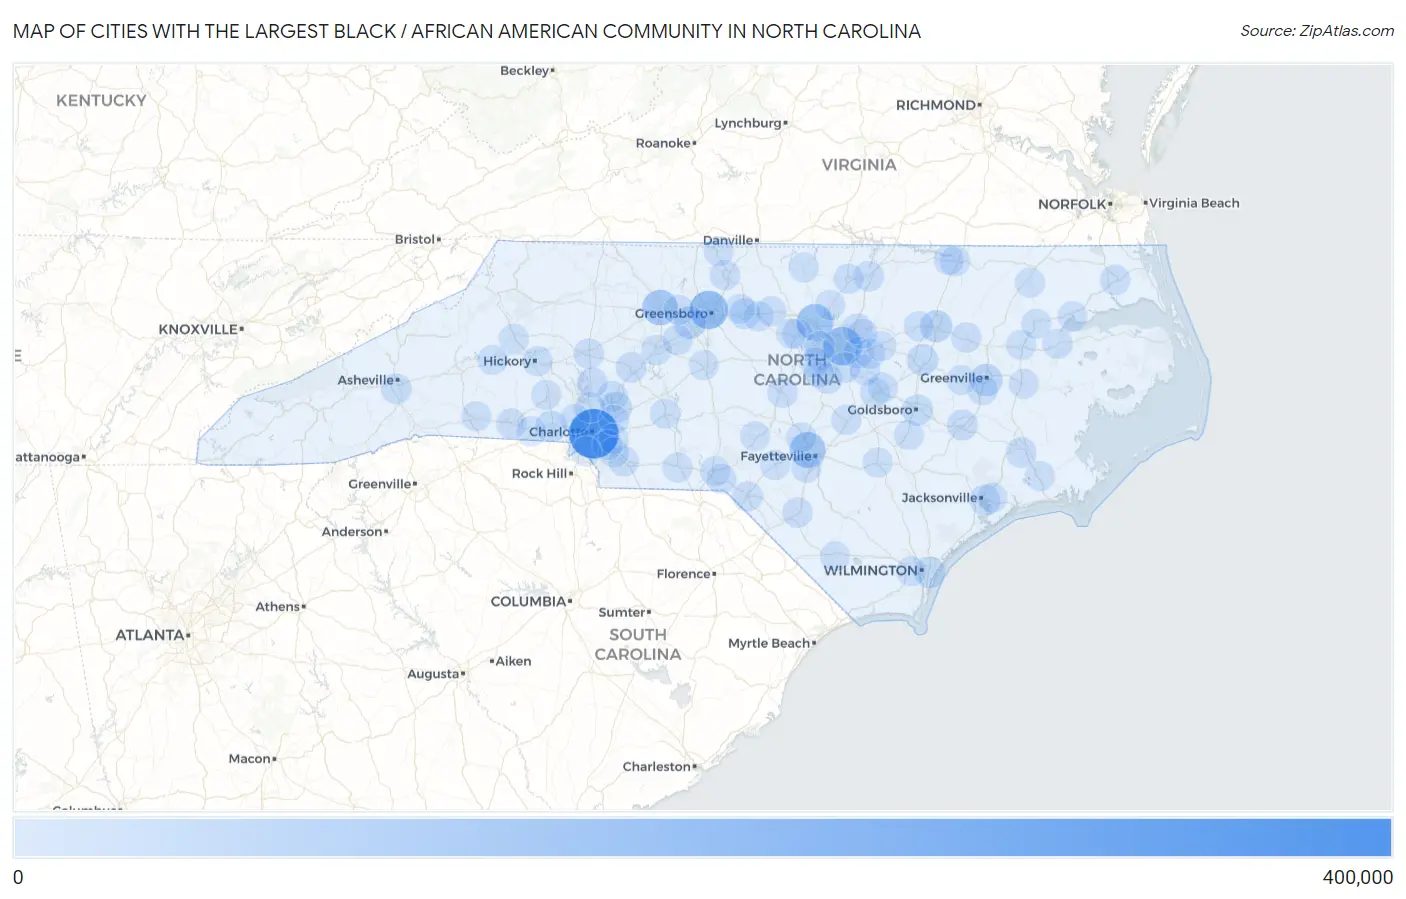
Map of Cities with the Largest Black / African American Community in North Carolina
0
400,000
Cities with the Largest Black / African American Community in North Carolina
| City | Black / African American | vs State | vs National | |
| 1. | Charlotte | 308,131 | 2,192,455(14.05%)#1 | 41,288,572(0.75%)#9 |
| 2. | Raleigh | 131,013 | 2,192,455(5.98%)#2 | 41,288,572(0.32%)#26 |
| 3. | Greensboro | 127,965 | 2,192,455(5.84%)#3 | 41,288,572(0.31%)#28 |
| 4. | Durham | 102,698 | 2,192,455(4.68%)#4 | 41,288,572(0.25%)#36 |
| 5. | Fayetteville | 88,538 | 2,192,455(4.04%)#5 | 41,288,572(0.21%)#47 |
| 6. | Winston Salem | 82,945 | 2,192,455(3.78%)#6 | 41,288,572(0.20%)#52 |
| 7. | High Point | 36,808 | 2,192,455(1.68%)#7 | 41,288,572(0.09%)#126 |
| 8. | Greenville | 35,218 | 2,192,455(1.61%)#8 | 41,288,572(0.09%)#132 |
| 9. | Rocky Mount | 33,720 | 2,192,455(1.54%)#9 | 41,288,572(0.08%)#135 |
| 10. | Gastonia | 24,031 | 2,192,455(1.10%)#10 | 41,288,572(0.06%)#213 |
| 11. | Wilson | 23,718 | 2,192,455(1.08%)#11 | 41,288,572(0.06%)#216 |
| 12. | Concord | 23,368 | 2,192,455(1.07%)#12 | 41,288,572(0.06%)#220 |
| 13. | Wilmington | 18,955 | 2,192,455(0.86%)#13 | 41,288,572(0.05%)#273 |
| 14. | Goldsboro | 18,321 | 2,192,455(0.84%)#14 | 41,288,572(0.04%)#284 |
| 15. | Burlington | 16,292 | 2,192,455(0.74%)#15 | 41,288,572(0.04%)#325 |
| 16. | Cary | 14,477 | 2,192,455(0.66%)#16 | 41,288,572(0.04%)#364 |
| 17. | Kinston | 13,626 | 2,192,455(0.62%)#17 | 41,288,572(0.03%)#386 |
| 18. | Jacksonville | 13,428 | 2,192,455(0.61%)#18 | 41,288,572(0.03%)#390 |
| 19. | Salisbury | 13,217 | 2,192,455(0.60%)#19 | 41,288,572(0.03%)#402 |
| 20. | Kannapolis | 11,955 | 2,192,455(0.55%)#20 | 41,288,572(0.03%)#456 |
| 21. | Asheville | 9,735 | 2,192,455(0.44%)#21 | 41,288,572(0.02%)#569 |
| 22. | New Bern | 9,653 | 2,192,455(0.44%)#22 | 41,288,572(0.02%)#575 |
| 23. | Henderson | 9,471 | 2,192,455(0.43%)#23 | 41,288,572(0.02%)#585 |
| 24. | Elizabeth City | 9,171 | 2,192,455(0.42%)#24 | 41,288,572(0.02%)#614 |
| 25. | Knightdale | 9,030 | 2,192,455(0.41%)#25 | 41,288,572(0.02%)#623 |
| 26. | Wake Forest | 8,647 | 2,192,455(0.39%)#26 | 41,288,572(0.02%)#649 |
| 27. | Statesville | 8,531 | 2,192,455(0.39%)#27 | 41,288,572(0.02%)#656 |
| 28. | Huntersville | 8,073 | 2,192,455(0.37%)#28 | 41,288,572(0.02%)#697 |
| 29. | Monroe | 8,044 | 2,192,455(0.37%)#29 | 41,288,572(0.02%)#701 |
| 30. | Sanford | 7,901 | 2,192,455(0.36%)#30 | 41,288,572(0.02%)#716 |
| 31. | Garner | 7,836 | 2,192,455(0.36%)#31 | 41,288,572(0.02%)#720 |
| 32. | Laurinburg | 7,326 | 2,192,455(0.33%)#32 | 41,288,572(0.02%)#765 |
| 33. | Shelby | 7,269 | 2,192,455(0.33%)#33 | 41,288,572(0.02%)#771 |
| 34. | Lumberton | 6,989 | 2,192,455(0.32%)#34 | 41,288,572(0.02%)#796 |
| 35. | Clayton | 6,432 | 2,192,455(0.29%)#35 | 41,288,572(0.02%)#846 |
| 36. | Chapel Hill | 6,161 | 2,192,455(0.28%)#36 | 41,288,572(0.01%)#886 |
| 37. | Lexington | 6,090 | 2,192,455(0.28%)#37 | 41,288,572(0.01%)#892 |
| 38. | Hope Mills | 5,978 | 2,192,455(0.27%)#38 | 41,288,572(0.01%)#907 |
| 39. | Hickory | 5,782 | 2,192,455(0.26%)#39 | 41,288,572(0.01%)#934 |
| 40. | Fuquay Varina | 5,555 | 2,192,455(0.25%)#40 | 41,288,572(0.01%)#964 |
| 41. | Reidsville | 5,371 | 2,192,455(0.24%)#41 | 41,288,572(0.01%)#995 |
| 42. | Tarboro | 5,316 | 2,192,455(0.24%)#42 | 41,288,572(0.01%)#1,004 |
| 43. | Roanoke Rapids | 5,218 | 2,192,455(0.24%)#43 | 41,288,572(0.01%)#1,018 |
| 44. | Mooresville | 5,179 | 2,192,455(0.24%)#44 | 41,288,572(0.01%)#1,024 |
| 45. | Apex | 5,149 | 2,192,455(0.23%)#45 | 41,288,572(0.01%)#1,028 |
| 46. | Thomasville | 4,863 | 2,192,455(0.22%)#46 | 41,288,572(0.01%)#1,078 |
| 47. | Oxford | 4,833 | 2,192,455(0.22%)#47 | 41,288,572(0.01%)#1,086 |
| 48. | Kernersville | 4,628 | 2,192,455(0.21%)#48 | 41,288,572(0.01%)#1,127 |
| 49. | Eden | 4,520 | 2,192,455(0.21%)#49 | 41,288,572(0.01%)#1,152 |
| 50. | Mebane | 4,390 | 2,192,455(0.20%)#50 | 41,288,572(0.01%)#1,175 |
| 51. | Washington | 4,209 | 2,192,455(0.19%)#51 | 41,288,572(0.01%)#1,230 |
| 52. | Graham | 4,059 | 2,192,455(0.19%)#52 | 41,288,572(0.01%)#1,263 |
| 53. | Mint Hill | 4,040 | 2,192,455(0.18%)#53 | 41,288,572(0.01%)#1,271 |
| 54. | Albemarle | 4,035 | 2,192,455(0.18%)#54 | 41,288,572(0.01%)#1,276 |
| 55. | Holly Springs | 4,024 | 2,192,455(0.18%)#55 | 41,288,572(0.01%)#1,280 |
| 56. | Anderson Creek | 4,012 | 2,192,455(0.18%)#56 | 41,288,572(0.01%)#1,284 |
| 57. | Winterville | 3,825 | 2,192,455(0.17%)#57 | 41,288,572(0.01%)#1,336 |
| 58. | Asheboro | 3,785 | 2,192,455(0.17%)#58 | 41,288,572(0.01%)#1,347 |
| 59. | Spring Lake | 3,720 | 2,192,455(0.17%)#59 | 41,288,572(0.01%)#1,367 |
| 60. | Indian Trail | 3,653 | 2,192,455(0.17%)#60 | 41,288,572(0.01%)#1,381 |
| 61. | Matthews | 3,592 | 2,192,455(0.16%)#61 | 41,288,572(0.01%)#1,400 |
| 62. | Nashville | 3,470 | 2,192,455(0.16%)#62 | 41,288,572(0.01%)#1,432 |
| 63. | Wadesboro | 3,459 | 2,192,455(0.16%)#63 | 41,288,572(0.01%)#1,439 |
| 64. | Morrisville | 3,435 | 2,192,455(0.16%)#64 | 41,288,572(0.01%)#1,446 |
| 65. | Smithfield | 3,404 | 2,192,455(0.16%)#65 | 41,288,572(0.01%)#1,453 |
| 66. | Harrisburg | 3,334 | 2,192,455(0.15%)#66 | 41,288,572(0.01%)#1,486 |
| 67. | Dunn | 3,311 | 2,192,455(0.15%)#67 | 41,288,572(0.01%)#1,500 |
| 68. | Rockingham | 3,256 | 2,192,455(0.15%)#68 | 41,288,572(0.01%)#1,514 |
| 69. | Clinton | 3,211 | 2,192,455(0.15%)#69 | 41,288,572(0.01%)#1,539 |
| 70. | Wendell | 3,040 | 2,192,455(0.14%)#70 | 41,288,572(0.01%)#1,603 |
| 71. | Piney Green | 3,018 | 2,192,455(0.14%)#71 | 41,288,572(0.01%)#1,613 |
| 72. | Ahoskie | 2,922 | 2,192,455(0.13%)#72 | 41,288,572(0.01%)#1,655 |
| 73. | Selma | 2,911 | 2,192,455(0.13%)#73 | 41,288,572(0.01%)#1,658 |
| 74. | Kings Mountain | 2,907 | 2,192,455(0.13%)#74 | 41,288,572(0.01%)#1,660 |
| 75. | Carrboro | 2,891 | 2,192,455(0.13%)#75 | 41,288,572(0.01%)#1,666 |
| 76. | Butner | 2,883 | 2,192,455(0.13%)#76 | 41,288,572(0.01%)#1,672 |
| 77. | Roxboro | 2,815 | 2,192,455(0.13%)#77 | 41,288,572(0.01%)#1,694 |
| 78. | Havelock | 2,772 | 2,192,455(0.13%)#78 | 41,288,572(0.01%)#1,708 |
| 79. | Williamston | 2,753 | 2,192,455(0.13%)#79 | 41,288,572(0.01%)#1,718 |
| 80. | Hamlet | 2,729 | 2,192,455(0.12%)#80 | 41,288,572(0.01%)#1,726 |
| 81. | Gibsonville | 2,620 | 2,192,455(0.12%)#81 | 41,288,572(0.01%)#1,782 |
| 82. | Edenton | 2,605 | 2,192,455(0.12%)#82 | 41,288,572(0.01%)#1,792 |
| 83. | Zebulon | 2,596 | 2,192,455(0.12%)#83 | 41,288,572(0.01%)#1,800 |
| 84. | Pineville | 2,579 | 2,192,455(0.12%)#84 | 41,288,572(0.01%)#1,809 |
| 85. | Lenoir | 2,578 | 2,192,455(0.12%)#85 | 41,288,572(0.01%)#1,812 |
| 86. | Mount Holly | 2,543 | 2,192,455(0.12%)#86 | 41,288,572(0.01%)#1,837 |
| 87. | Rolesville | 2,448 | 2,192,455(0.11%)#87 | 41,288,572(0.01%)#1,896 |
| 88. | Windsor | 2,382 | 2,192,455(0.11%)#88 | 41,288,572(0.01%)#1,938 |
| 89. | Morganton | 2,358 | 2,192,455(0.11%)#89 | 41,288,572(0.01%)#1,950 |
| 90. | Lincolnton | 2,322 | 2,192,455(0.11%)#90 | 41,288,572(0.01%)#1,975 |
| 91. | Mount Olive | 2,301 | 2,192,455(0.10%)#91 | 41,288,572(0.01%)#1,989 |
| 92. | Spout Springs | 2,267 | 2,192,455(0.10%)#92 | 41,288,572(0.01%)#2,006 |
| 93. | Plymouth | 2,206 | 2,192,455(0.10%)#93 | 41,288,572(0.01%)#2,044 |
| 94. | Leland | 2,140 | 2,192,455(0.10%)#94 | 41,288,572(0.01%)#2,098 |
| 95. | Whiteville | 2,133 | 2,192,455(0.10%)#95 | 41,288,572(0.01%)#2,104 |
| 96. | Forest City | 2,091 | 2,192,455(0.10%)#96 | 41,288,572(0.01%)#2,142 |
| 97. | Southern Pines | 2,087 | 2,192,455(0.10%)#97 | 41,288,572(0.01%)#2,147 |
| 98. | Raeford | 2,062 | 2,192,455(0.09%)#98 | 41,288,572(0.00%)#2,173 |
| 99. | Farmville | 2,045 | 2,192,455(0.09%)#99 | 41,288,572(0.00%)#2,184 |
| 100. | South Rosemary | 2,017 | 2,192,455(0.09%)#100 | 41,288,572(0.00%)#2,208 |
Common Questions
What are the Top 10 Cities with the Largest Black / African American Community in North Carolina?
Top 10 Cities with the Largest Black / African American Community in North Carolina are:
#1
308,131
#2
131,013
#3
127,965
#4
102,698
#5
88,538
#6
82,945
#7
36,808
#8
35,218
#9
33,720
#10
24,031
What city has the Largest Black / African American Community in North Carolina?
Charlotte has the Largest Black / African American Community in North Carolina with 308,131.
What is the Total Black / African American Population in the State of North Carolina?
Total Black / African American Population in North Carolina is 2,192,455.
What is the Total Black / African American Population in the United States?
Total Black / African American Population in the United States is 41,288,572.