Atlantic City, NJ Map & Demographics
Atlantic City Map
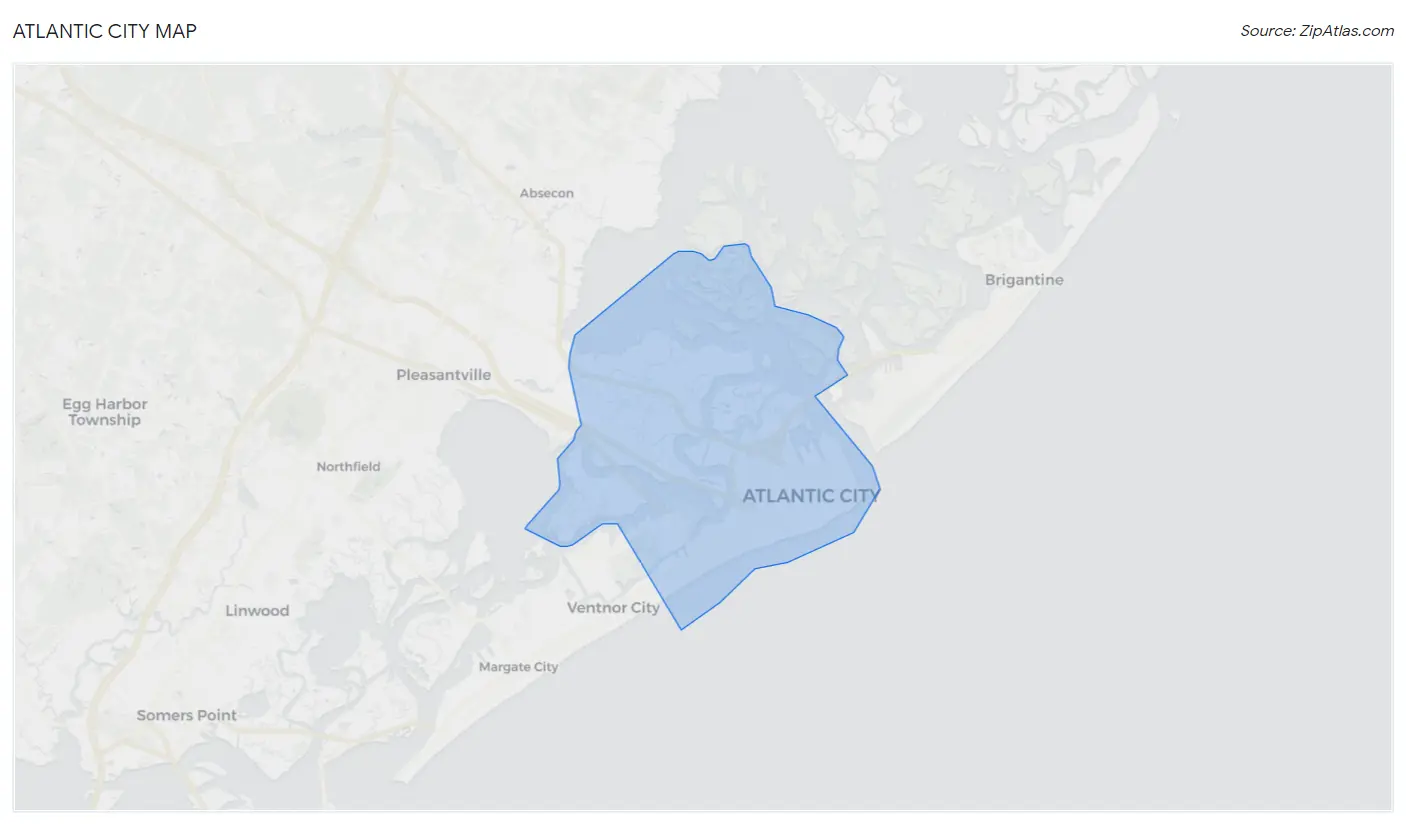
Atlantic City Overview
$24,172
PER CAPITA INCOME
$38,992
AVG FAMILY INCOME
$35,188
AVG HOUSEHOLD INCOME
12.3%
WAGE / INCOME GAP [ % ]
87.7¢/ $1
WAGE / INCOME GAP [ $ ]
$8,893
FAMILY INCOME DEFICIT
0.53
INEQUALITY / GINI INDEX
38,487
TOTAL POPULATION
19,117
MALE POPULATION
19,370
FEMALE POPULATION
98.69
MALES / 100 FEMALES
101.32
FEMALES / 100 MALES
39.5
MEDIAN AGE
3.1
AVG FAMILY SIZE
2.3
AVG HOUSEHOLD SIZE
17,803
LABOR FORCE [ PEOPLE ]
58.6%
PERCENT IN LABOR FORCE
13.1%
UNEMPLOYMENT RATE
Atlantic City Zip Codes
Atlantic City Area Codes
Income in Atlantic City
Income Overview in Atlantic City
Per Capita Income in Atlantic City is $24,172, while median incomes of families and households are $38,992 and $35,188 respectively.
| Characteristic | Number | Measure |
| Per Capita Income | 38,487 | $24,172 |
| Median Family Income | 8,571 | $38,992 |
| Mean Family Income | 8,571 | $65,755 |
| Median Household Income | 16,473 | $35,188 |
| Mean Household Income | 16,473 | $56,167 |
| Income Deficit | 8,571 | $8,893 |
| Wage / Income Gap (%) | 38,487 | 12.35% |
| Wage / Income Gap ($) | 38,487 | 87.65¢ per $1 |
| Gini / Inequality Index | 38,487 | 0.53 |
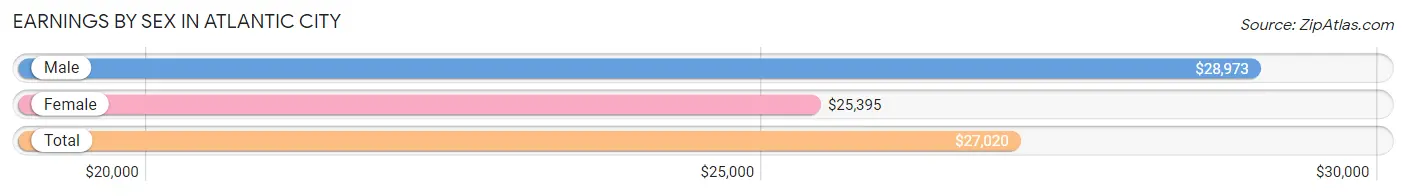
Earnings by Sex in Atlantic City
Average Earnings in Atlantic City are $27,020, $28,973 for men and $25,395 for women, a difference of 12.3%.
| Sex | Number | Average Earnings |
| Male | 9,247 (52.2%) | $28,973 |
| Female | 8,472 (47.8%) | $25,395 |
| Total | 17,719 (100.0%) | $27,020 |
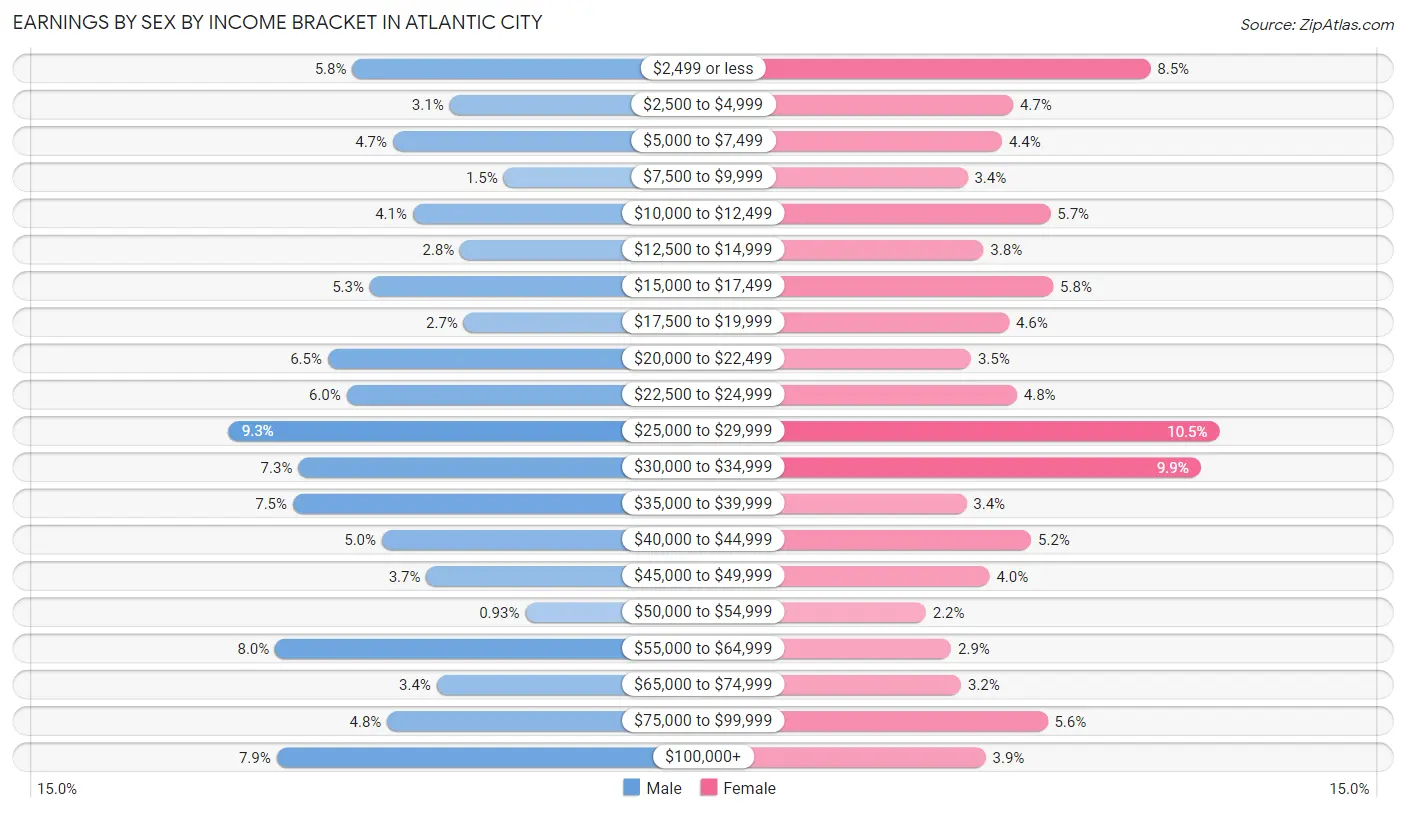
Earnings by Sex by Income Bracket in Atlantic City
The most common earnings brackets in Atlantic City are $25,000 to $29,999 for men (856 | 9.3%) and $25,000 to $29,999 for women (887 | 10.5%).
| Income | Male | Female |
| $2,499 or less | 535 (5.8%) | 723 (8.5%) |
| $2,500 to $4,999 | 283 (3.1%) | 396 (4.7%) |
| $5,000 to $7,499 | 430 (4.6%) | 369 (4.4%) |
| $7,500 to $9,999 | 142 (1.5%) | 287 (3.4%) |
| $10,000 to $12,499 | 378 (4.1%) | 485 (5.7%) |
| $12,500 to $14,999 | 255 (2.8%) | 325 (3.8%) |
| $15,000 to $17,499 | 490 (5.3%) | 491 (5.8%) |
| $17,500 to $19,999 | 246 (2.7%) | 386 (4.6%) |
| $20,000 to $22,499 | 599 (6.5%) | 296 (3.5%) |
| $22,500 to $24,999 | 550 (5.9%) | 405 (4.8%) |
| $25,000 to $29,999 | 856 (9.3%) | 887 (10.5%) |
| $30,000 to $34,999 | 676 (7.3%) | 842 (9.9%) |
| $35,000 to $39,999 | 690 (7.5%) | 285 (3.4%) |
| $40,000 to $44,999 | 459 (5.0%) | 439 (5.2%) |
| $45,000 to $49,999 | 343 (3.7%) | 340 (4.0%) |
| $50,000 to $54,999 | 86 (0.9%) | 188 (2.2%) |
| $55,000 to $64,999 | 736 (8.0%) | 248 (2.9%) |
| $65,000 to $74,999 | 316 (3.4%) | 272 (3.2%) |
| $75,000 to $99,999 | 445 (4.8%) | 478 (5.6%) |
| $100,000+ | 732 (7.9%) | 330 (3.9%) |
| Total | 9,247 (100.0%) | 8,472 (100.0%) |
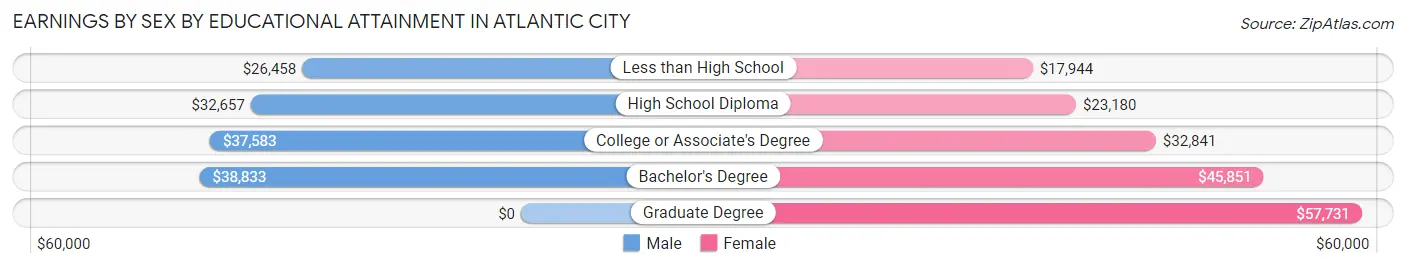
Earnings by Sex by Educational Attainment in Atlantic City
Average earnings in Atlantic City are $32,662 for men and $26,939 for women, a difference of 17.5%. Men with an educational attainment of bachelor's degree enjoy the highest average annual earnings of $38,833, while those with less than high school education earn the least with $26,458. Women with an educational attainment of graduate degree earn the most with the average annual earnings of $57,731, while those with less than high school education have the smallest earnings of $17,944.
| Educational Attainment | Male Income | Female Income |
| Less than High School | $26,458 | $17,944 |
| High School Diploma | $32,657 | $23,180 |
| College or Associate's Degree | $37,583 | $32,841 |
| Bachelor's Degree | $38,833 | $45,851 |
| Graduate Degree | - | - |
| Total | $32,662 | $26,939 |
Family Income in Atlantic City
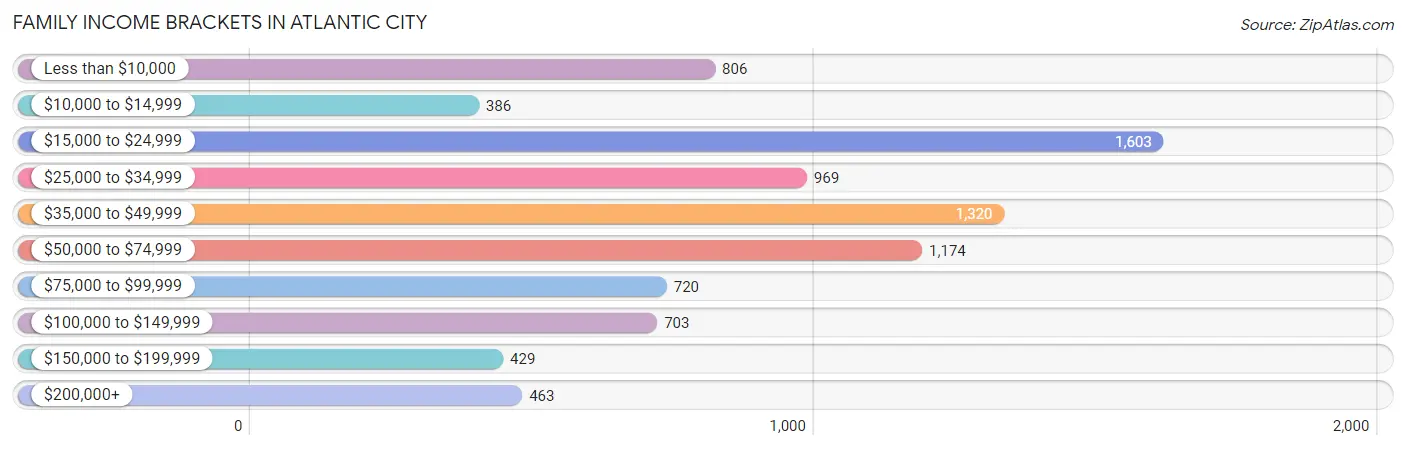
Family Income Brackets in Atlantic City
According to the Atlantic City family income data, there are 1,603 families falling into the $15,000 to $24,999 income range, which is the most common income bracket and makes up 18.7% of all families. Conversely, the $10,000 to $14,999 income bracket is the least frequent group with only 386 families (4.5%) belonging to this category.
| Income Bracket | # Families | % Families |
| Less than $10,000 | 806 | 9.4% |
| $10,000 to $14,999 | 386 | 4.5% |
| $15,000 to $24,999 | 1,603 | 18.7% |
| $25,000 to $34,999 | 969 | 11.3% |
| $35,000 to $49,999 | 1,320 | 15.4% |
| $50,000 to $74,999 | 1,174 | 13.7% |
| $75,000 to $99,999 | 720 | 8.4% |
| $100,000 to $149,999 | 703 | 8.2% |
| $150,000 to $199,999 | 429 | 5.0% |
| $200,000+ | 463 | 5.4% |
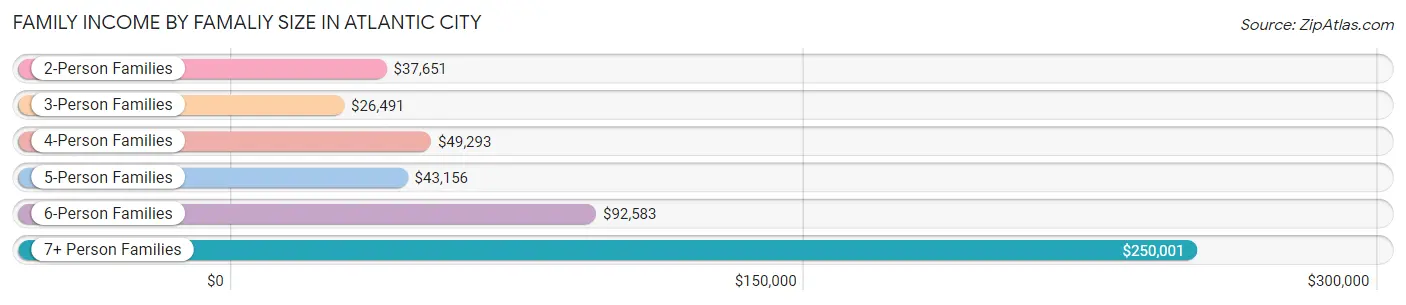
Family Income by Famaliy Size in Atlantic City
7+ person families (131 | 1.5%) account for the highest median family income in Atlantic City with $250,001 per family, while 7+ person families (131 | 1.5%) have the highest median income of $35,714 per family member.
| Income Bracket | # Families | Median Income |
| 2-Person Families | 3,863 (45.1%) | $37,651 |
| 3-Person Families | 2,346 (27.4%) | $26,491 |
| 4-Person Families | 1,227 (14.3%) | $49,293 |
| 5-Person Families | 589 (6.9%) | $43,156 |
| 6-Person Families | 415 (4.8%) | $92,583 |
| 7+ Person Families | 131 (1.5%) | $250,001 |
| Total | 8,571 (100.0%) | $38,992 |
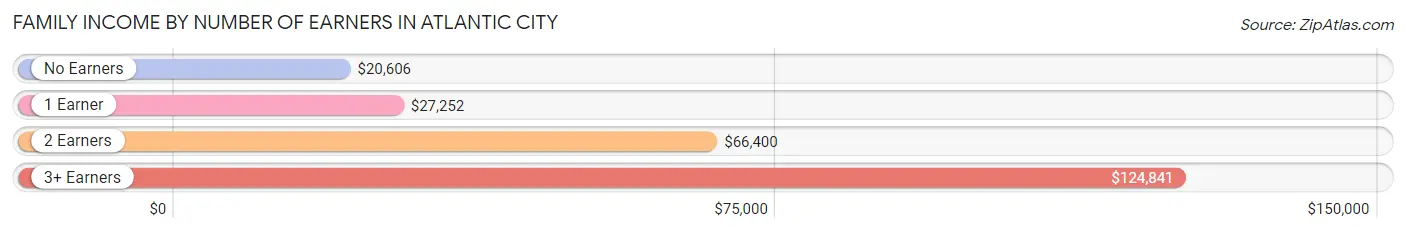
Family Income by Number of Earners in Atlantic City
The median family income in Atlantic City is $38,992, with families comprising 3+ earners (646) having the highest median family income of $124,841, while families with no earners (1,581) have the lowest median family income of $20,606, accounting for 7.5% and 18.4% of families, respectively.
| Number of Earners | # Families | Median Income |
| No Earners | 1,581 (18.4%) | $20,606 |
| 1 Earner | 3,330 (38.9%) | $27,252 |
| 2 Earners | 3,014 (35.2%) | $66,400 |
| 3+ Earners | 646 (7.5%) | $124,841 |
| Total | 8,571 (100.0%) | $38,992 |
Household Income in Atlantic City
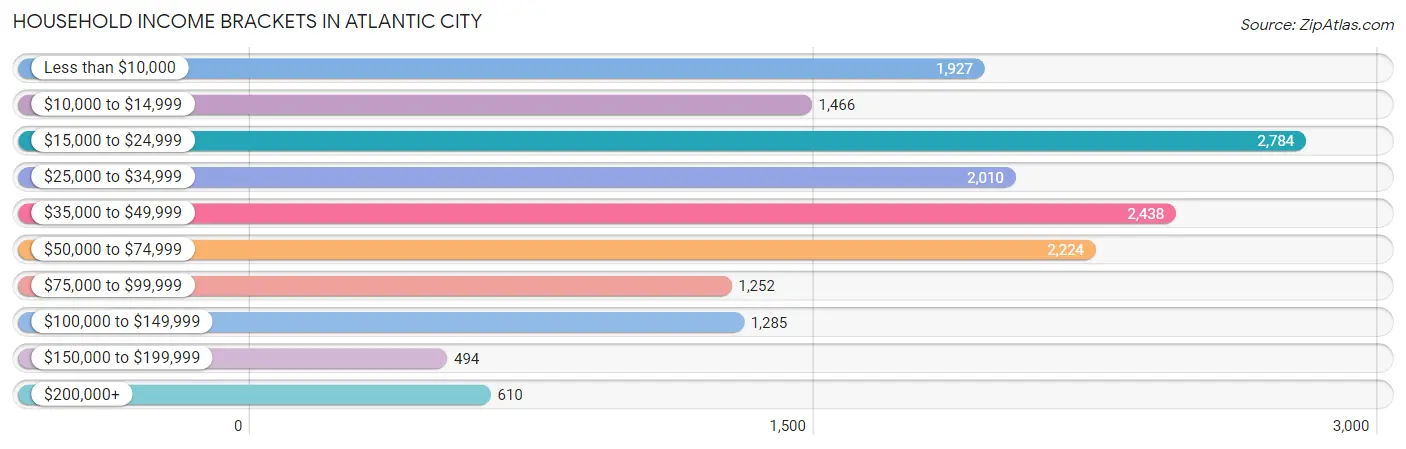
Household Income Brackets in Atlantic City
With 2,784 households falling in the category, the $15,000 to $24,999 income range is the most frequent in Atlantic City, accounting for 16.9% of all households. In contrast, only 494 households (3.0%) fall into the $150,000 to $199,999 income bracket, making it the least populous group.
| Income Bracket | # Households | % Households |
| Less than $10,000 | 1,927 | 11.7% |
| $10,000 to $14,999 | 1,466 | 8.9% |
| $15,000 to $24,999 | 2,784 | 16.9% |
| $25,000 to $34,999 | 2,010 | 12.2% |
| $35,000 to $49,999 | 2,438 | 14.8% |
| $50,000 to $74,999 | 2,224 | 13.5% |
| $75,000 to $99,999 | 1,252 | 7.6% |
| $100,000 to $149,999 | 1,285 | 7.8% |
| $150,000 to $199,999 | 494 | 3.0% |
| $200,000+ | 610 | 3.7% |
Household Income by Householder Age in Atlantic City
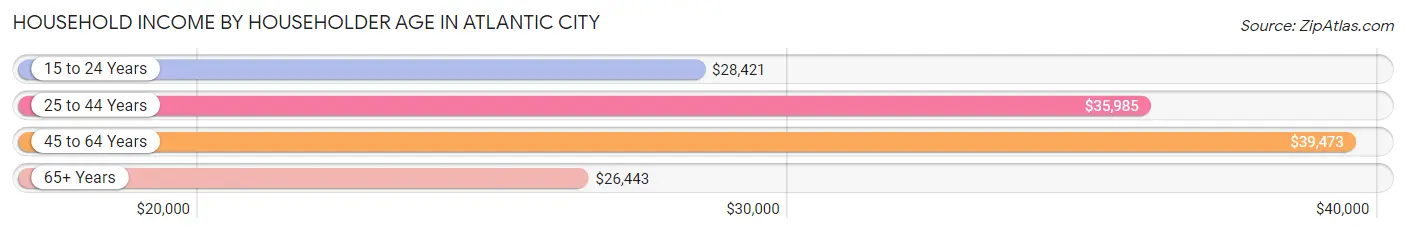
The median household income in Atlantic City is $35,188, with the highest median household income of $39,473 found in the 45 to 64 years age bracket for the primary householder. A total of 7,171 households (43.5%) fall into this category. Meanwhile, the 65+ years age bracket for the primary householder has the lowest median household income of $26,443, with 4,524 households (27.5%) in this group.
| Income Bracket | # Households | Median Income |
| 15 to 24 Years | 847 (5.1%) | $28,421 |
| 25 to 44 Years | 3,931 (23.9%) | $35,985 |
| 45 to 64 Years | 7,171 (43.5%) | $39,473 |
| 65+ Years | 4,524 (27.5%) | $26,443 |
| Total | 16,473 (100.0%) | $35,188 |
Poverty in Atlantic City
Income Below Poverty by Sex and Age in Atlantic City
With 30.8% poverty level for males and 34.0% for females among the residents of Atlantic City, under 5 year old males and 15 year old females are the most vulnerable to poverty, with 898 males (65.7%) and 98 females (52.7%) in their respective age groups living below the poverty level.
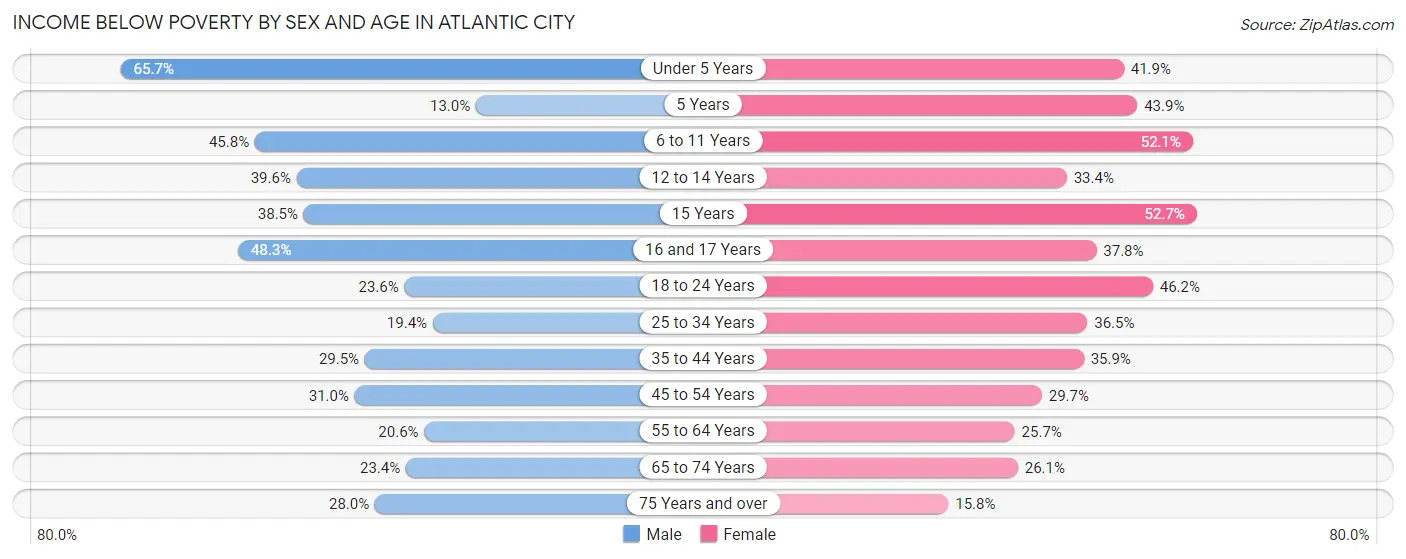
| Age Bracket | Male | Female |
| Under 5 Years | 898 (65.7%) | 590 (41.9%) |
| 5 Years | 21 (13.0%) | 118 (43.9%) |
| 6 to 11 Years | 723 (45.8%) | 678 (52.1%) |
| 12 to 14 Years | 293 (39.6%) | 168 (33.4%) |
| 15 Years | 42 (38.5%) | 98 (52.7%) |
| 16 and 17 Years | 314 (48.3%) | 254 (37.8%) |
| 18 to 24 Years | 432 (23.6%) | 858 (46.2%) |
| 25 to 34 Years | 411 (19.4%) | 681 (36.5%) |
| 35 to 44 Years | 585 (29.5%) | 805 (35.9%) |
| 45 to 54 Years | 791 (31.0%) | 741 (29.7%) |
| 55 to 64 Years | 624 (20.6%) | 759 (25.7%) |
| 65 to 74 Years | 463 (23.4%) | 498 (26.1%) |
| 75 Years and over | 210 (28.0%) | 211 (15.8%) |
| Total | 5,807 (30.8%) | 6,459 (34.0%) |
Income Above Poverty by Sex and Age in Atlantic City
According to the poverty statistics in Atlantic City, males aged 5 years and females aged 75 years and over are the age groups that are most secure financially, with 87.0% of males and 84.2% of females in these age groups living above the poverty line.
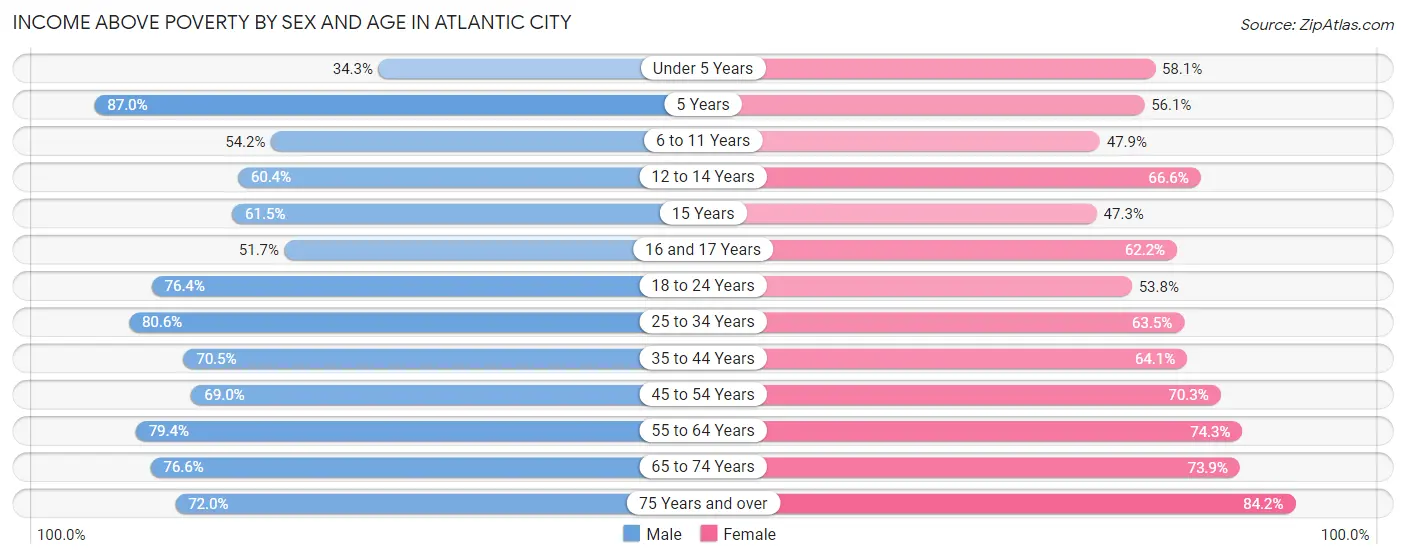
| Age Bracket | Male | Female |
| Under 5 Years | 468 (34.3%) | 819 (58.1%) |
| 5 Years | 141 (87.0%) | 151 (56.1%) |
| 6 to 11 Years | 856 (54.2%) | 623 (47.9%) |
| 12 to 14 Years | 447 (60.4%) | 335 (66.6%) |
| 15 Years | 67 (61.5%) | 88 (47.3%) |
| 16 and 17 Years | 336 (51.7%) | 418 (62.2%) |
| 18 to 24 Years | 1,400 (76.4%) | 1,000 (53.8%) |
| 25 to 34 Years | 1,711 (80.6%) | 1,187 (63.5%) |
| 35 to 44 Years | 1,401 (70.5%) | 1,436 (64.1%) |
| 45 to 54 Years | 1,763 (69.0%) | 1,754 (70.3%) |
| 55 to 64 Years | 2,401 (79.4%) | 2,198 (74.3%) |
| 65 to 74 Years | 1,519 (76.6%) | 1,408 (73.9%) |
| 75 Years and over | 541 (72.0%) | 1,123 (84.2%) |
| Total | 13,051 (69.2%) | 12,540 (66.0%) |
Income Below Poverty Among Married-Couple Families in Atlantic City
The poverty statistics for married-couple families in Atlantic City show that 16.4% or 651 of the total 3,972 families live below the poverty line. Families with 1 or 2 children have the highest poverty rate of 28.4%, comprising of 301 families. On the other hand, families with no children have the lowest poverty rate of 12.0%, which includes 286 families.
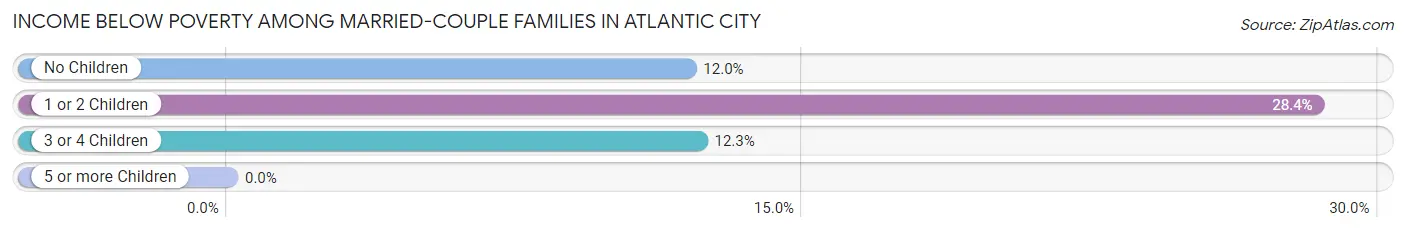
| Children | Above Poverty | Below Poverty |
| No Children | 2,103 (88.0%) | 286 (12.0%) |
| 1 or 2 Children | 760 (71.6%) | 301 (28.4%) |
| 3 or 4 Children | 458 (87.7%) | 64 (12.3%) |
| 5 or more Children | 0 (0.0%) | 0 (0.0%) |
| Total | 3,321 (83.6%) | 651 (16.4%) |
Income Below Poverty Among Single-Parent Households in Atlantic City
According to the poverty data in Atlantic City, 42.3% or 511 single-father households and 44.7% or 1,517 single-mother households are living below the poverty line. Among single-father households, those with 3 or 4 children have the highest poverty rate, with 85 households (100.0%) experiencing poverty. Likewise, among single-mother households, those with 5 or more children have the highest poverty rate, with 25 households (86.2%) falling below the poverty line.
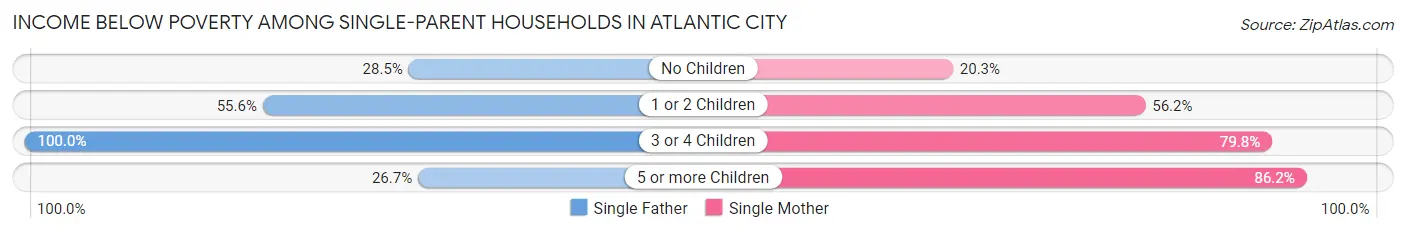
| Children | Single Father | Single Mother |
| No Children | 177 (28.5%) | 250 (20.3%) |
| 1 or 2 Children | 222 (55.6%) | 1,096 (56.2%) |
| 3 or 4 Children | 85 (100.0%) | 146 (79.8%) |
| 5 or more Children | 27 (26.7%) | 25 (86.2%) |
| Total | 511 (42.3%) | 1,517 (44.7%) |
Income Below Poverty Among Married-Couple vs Single-Parent Households in Atlantic City
The poverty data for Atlantic City shows that 651 of the married-couple family households (16.4%) and 2,028 of the single-parent households (44.1%) are living below the poverty level. Within the married-couple family households, those with 1 or 2 children have the highest poverty rate, with 301 households (28.4%) falling below the poverty line. Among the single-parent households, those with 3 or 4 children have the highest poverty rate, with 231 household (86.2%) living below poverty.
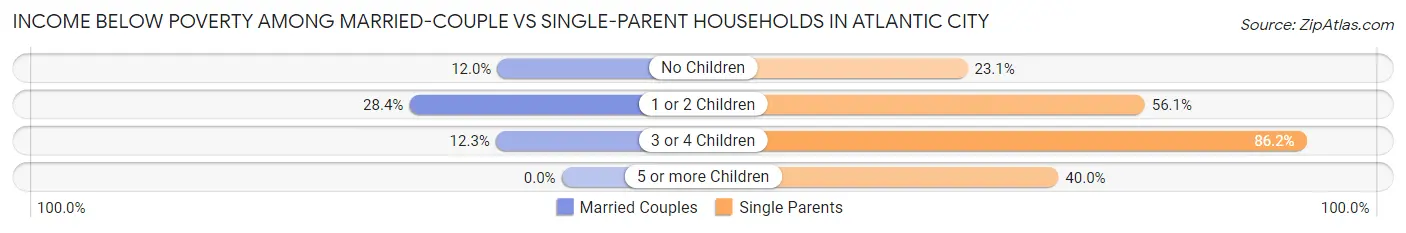
| Children | Married-Couple Families | Single-Parent Households |
| No Children | 286 (12.0%) | 427 (23.1%) |
| 1 or 2 Children | 301 (28.4%) | 1,318 (56.1%) |
| 3 or 4 Children | 64 (12.3%) | 231 (86.2%) |
| 5 or more Children | 0 (0.0%) | 52 (40.0%) |
| Total | 651 (16.4%) | 2,028 (44.1%) |
Race in Atlantic City
The most populous races in Atlantic City are Hispanic or Latino (12,867 | 33.4%), Black / African American (11,698 | 30.4%), and White / Caucasian (8,606 | 22.4%).
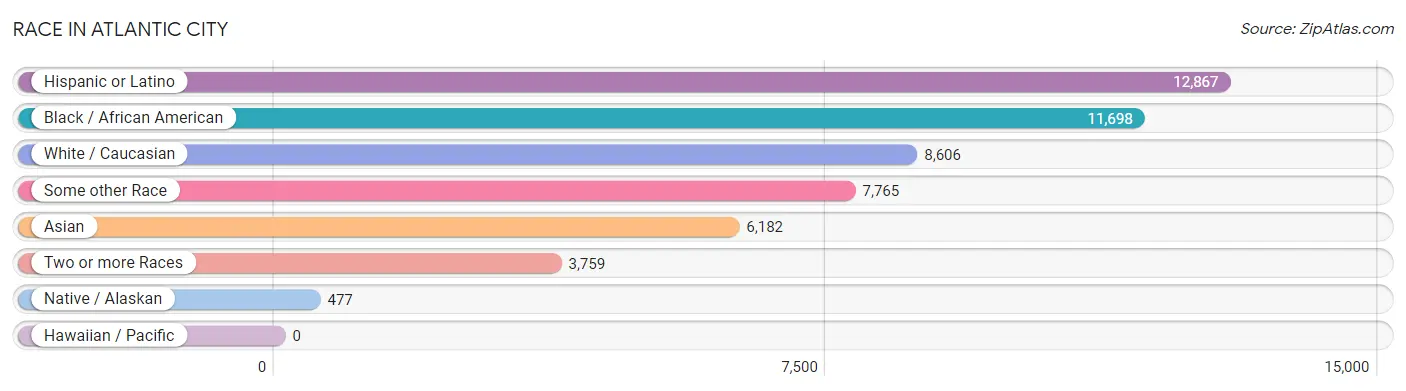
| Race | # Population | % Population |
| Asian | 6,182 | 16.1% |
| Black / African American | 11,698 | 30.4% |
| Hawaiian / Pacific | 0 | 0.0% |
| Hispanic or Latino | 12,867 | 33.4% |
| Native / Alaskan | 477 | 1.2% |
| White / Caucasian | 8,606 | 22.4% |
| Two or more Races | 3,759 | 9.8% |
| Some other Race | 7,765 | 20.2% |
| Total | 38,487 | 100.0% |
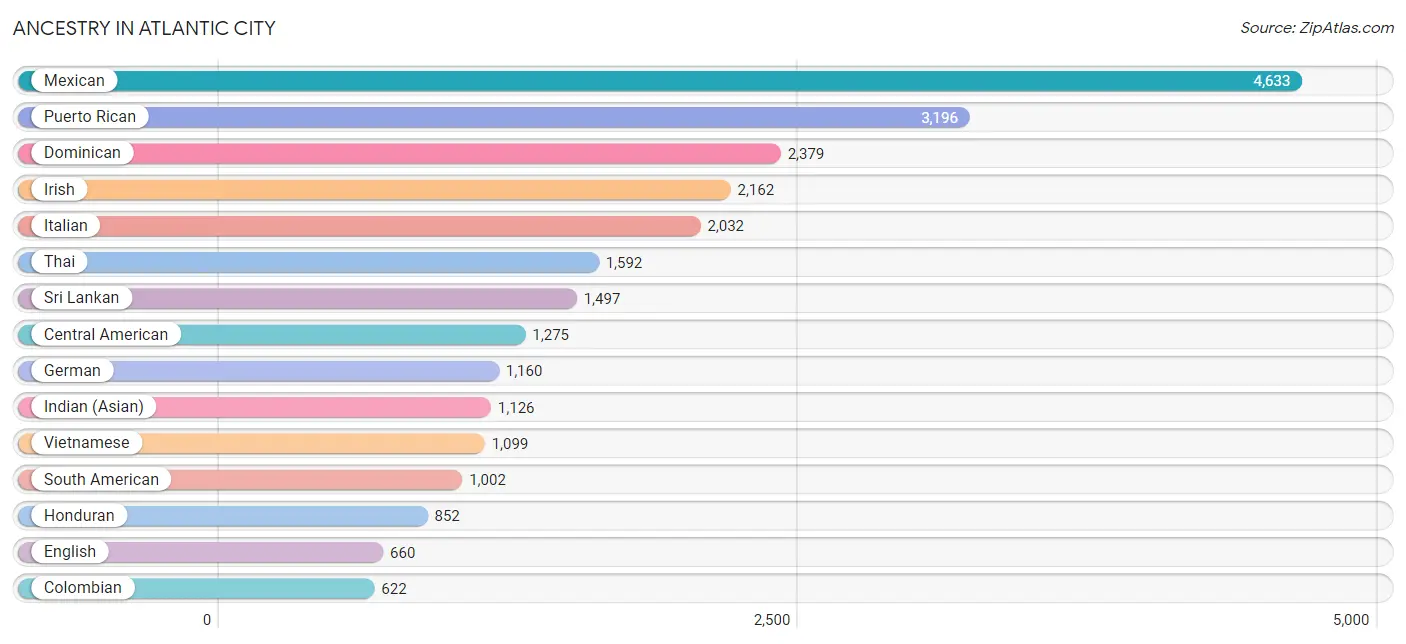
Ancestry in Atlantic City
The most populous ancestries reported in Atlantic City are Mexican (4,633 | 12.0%), Puerto Rican (3,196 | 8.3%), Dominican (2,379 | 6.2%), Irish (2,162 | 5.6%), and Italian (2,032 | 5.3%), together accounting for 37.4% of all Atlantic City residents.
| Ancestry | # Population | % Population |
| Afghan | 32 | 0.1% |
| African | 180 | 0.5% |
| American | 448 | 1.2% |
| Arab | 252 | 0.6% |
| Argentinean | 47 | 0.1% |
| Barbadian | 47 | 0.1% |
| Bhutanese | 6 | 0.0% |
| Blackfeet | 30 | 0.1% |
| Brazilian | 14 | 0.0% |
| British | 1 | 0.0% |
| British West Indian | 12 | 0.0% |
| Burmese | 134 | 0.4% |
| Central American | 1,275 | 3.3% |
| Central American Indian | 98 | 0.3% |
| Cherokee | 44 | 0.1% |
| Choctaw | 28 | 0.1% |
| Colombian | 622 | 1.6% |
| Costa Rican | 18 | 0.1% |
| Cuban | 181 | 0.5% |
| Czech | 1 | 0.0% |
| Delaware | 96 | 0.3% |
| Dominican | 2,379 | 6.2% |
| Dutch | 34 | 0.1% |
| Ecuadorian | 125 | 0.3% |
| Egyptian | 63 | 0.2% |
| English | 660 | 1.7% |
| European | 84 | 0.2% |
| Finnish | 10 | 0.0% |
| French | 139 | 0.4% |
| German | 1,160 | 3.0% |
| Ghanaian | 18 | 0.1% |
| Greek | 69 | 0.2% |
| Guatemalan | 33 | 0.1% |
| Haitian | 318 | 0.8% |
| Honduran | 852 | 2.2% |
| Hungarian | 23 | 0.1% |
| Indian (Asian) | 1,126 | 2.9% |
| Iranian | 36 | 0.1% |
| Irish | 2,162 | 5.6% |
| Iroquois | 2 | 0.0% |
| Israeli | 14 | 0.0% |
| Italian | 2,032 | 5.3% |
| Jamaican | 208 | 0.5% |
| Japanese | 6 | 0.0% |
| Jordanian | 50 | 0.1% |
| Korean | 426 | 1.1% |
| Latvian | 12 | 0.0% |
| Liberian | 70 | 0.2% |
| Lithuanian | 3 | 0.0% |
| Malaysian | 33 | 0.1% |
| Mexican | 4,633 | 12.0% |
| Mexican American Indian | 404 | 1.1% |
| Moroccan | 52 | 0.1% |
| Navajo | 13 | 0.0% |
| Nicaraguan | 10 | 0.0% |
| Nigerian | 26 | 0.1% |
| Norwegian | 2 | 0.0% |
| Pakistani | 212 | 0.5% |
| Palestinian | 18 | 0.1% |
| Panamanian | 63 | 0.2% |
| Pennsylvania German | 94 | 0.2% |
| Peruvian | 208 | 0.5% |
| Polish | 601 | 1.6% |
| Portuguese | 67 | 0.2% |
| Puerto Rican | 3,196 | 8.3% |
| Romanian | 53 | 0.1% |
| Russian | 192 | 0.5% |
| Salvadoran | 299 | 0.8% |
| Scandinavian | 13 | 0.0% |
| Scotch-Irish | 20 | 0.1% |
| Scottish | 35 | 0.1% |
| Sioux | 16 | 0.0% |
| Slovak | 42 | 0.1% |
| Slovene | 19 | 0.1% |
| South American | 1,002 | 2.6% |
| Spanish | 31 | 0.1% |
| Spanish American | 6 | 0.0% |
| Spanish American Indian | 5 | 0.0% |
| Sri Lankan | 1,497 | 3.9% |
| Subsaharan African | 286 | 0.7% |
| Thai | 1,592 | 4.1% |
| Trinidadian and Tobagonian | 67 | 0.2% |
| Turkish | 8 | 0.0% |
| Ukrainian | 19 | 0.1% |
| Vietnamese | 1,099 | 2.9% |
| Welsh | 8 | 0.0% |
| West Indian | 36 | 0.1% |
| Yugoslavian | 25 | 0.1% | View All 88 Rows |
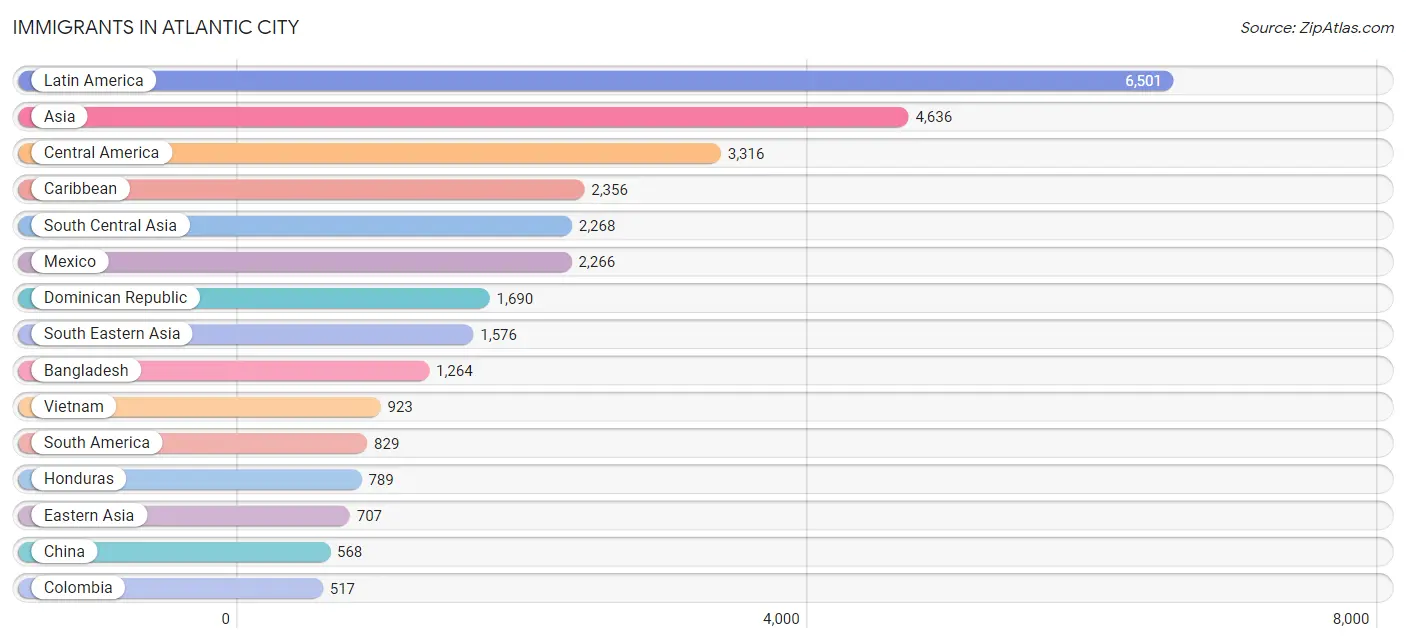
Immigrants in Atlantic City
The most numerous immigrant groups reported in Atlantic City came from Latin America (6,501 | 16.9%), Asia (4,636 | 12.0%), Central America (3,316 | 8.6%), Caribbean (2,356 | 6.1%), and South Central Asia (2,268 | 5.9%), together accounting for 49.6% of all Atlantic City residents.
| Immigration Origin | # Population | % Population |
| Afghanistan | 32 | 0.1% |
| Africa | 429 | 1.1% |
| Argentina | 55 | 0.1% |
| Asia | 4,636 | 12.0% |
| Bangladesh | 1,264 | 3.3% |
| Barbados | 18 | 0.1% |
| Belarus | 9 | 0.0% |
| Belgium | 6 | 0.0% |
| Brazil | 14 | 0.0% |
| Cambodia | 8 | 0.0% |
| Canada | 10 | 0.0% |
| Caribbean | 2,356 | 6.1% |
| Central America | 3,316 | 8.6% |
| China | 568 | 1.5% |
| Colombia | 517 | 1.3% |
| Costa Rica | 10 | 0.0% |
| Cuba | 113 | 0.3% |
| Dominica | 41 | 0.1% |
| Dominican Republic | 1,690 | 4.4% |
| Eastern Asia | 707 | 1.8% |
| Eastern Europe | 107 | 0.3% |
| Ecuador | 77 | 0.2% |
| Egypt | 78 | 0.2% |
| El Salvador | 201 | 0.5% |
| Europe | 241 | 0.6% |
| Germany | 11 | 0.0% |
| Ghana | 18 | 0.1% |
| Greece | 39 | 0.1% |
| Guatemala | 33 | 0.1% |
| Guyana | 22 | 0.1% |
| Haiti | 249 | 0.6% |
| Honduras | 789 | 2.1% |
| Hong Kong | 61 | 0.2% |
| India | 353 | 0.9% |
| Iran | 49 | 0.1% |
| Ireland | 11 | 0.0% |
| Israel | 8 | 0.0% |
| Italy | 37 | 0.1% |
| Jamaica | 148 | 0.4% |
| Korea | 139 | 0.4% |
| Laos | 4 | 0.0% |
| Latin America | 6,501 | 16.9% |
| Liberia | 48 | 0.1% |
| Malaysia | 110 | 0.3% |
| Mexico | 2,266 | 5.9% |
| Morocco | 52 | 0.1% |
| Nicaragua | 10 | 0.0% |
| Nigeria | 10 | 0.0% |
| Northern Africa | 130 | 0.3% |
| Northern Europe | 41 | 0.1% |
| Pakistan | 422 | 1.1% |
| Panama | 7 | 0.0% |
| Peru | 131 | 0.3% |
| Philippines | 469 | 1.2% |
| Poland | 14 | 0.0% |
| Romania | 36 | 0.1% |
| Russia | 37 | 0.1% |
| Saudi Arabia | 69 | 0.2% |
| South America | 829 | 2.1% |
| South Central Asia | 2,268 | 5.9% |
| South Eastern Asia | 1,576 | 4.1% |
| Southern Europe | 76 | 0.2% |
| Taiwan | 21 | 0.1% |
| Thailand | 62 | 0.2% |
| Trinidad and Tobago | 97 | 0.3% |
| Turkey | 8 | 0.0% |
| Ukraine | 11 | 0.0% |
| Venezuela | 13 | 0.0% |
| Vietnam | 923 | 2.4% |
| Western Africa | 76 | 0.2% |
| Western Asia | 85 | 0.2% |
| Western Europe | 17 | 0.0% | View All 72 Rows |
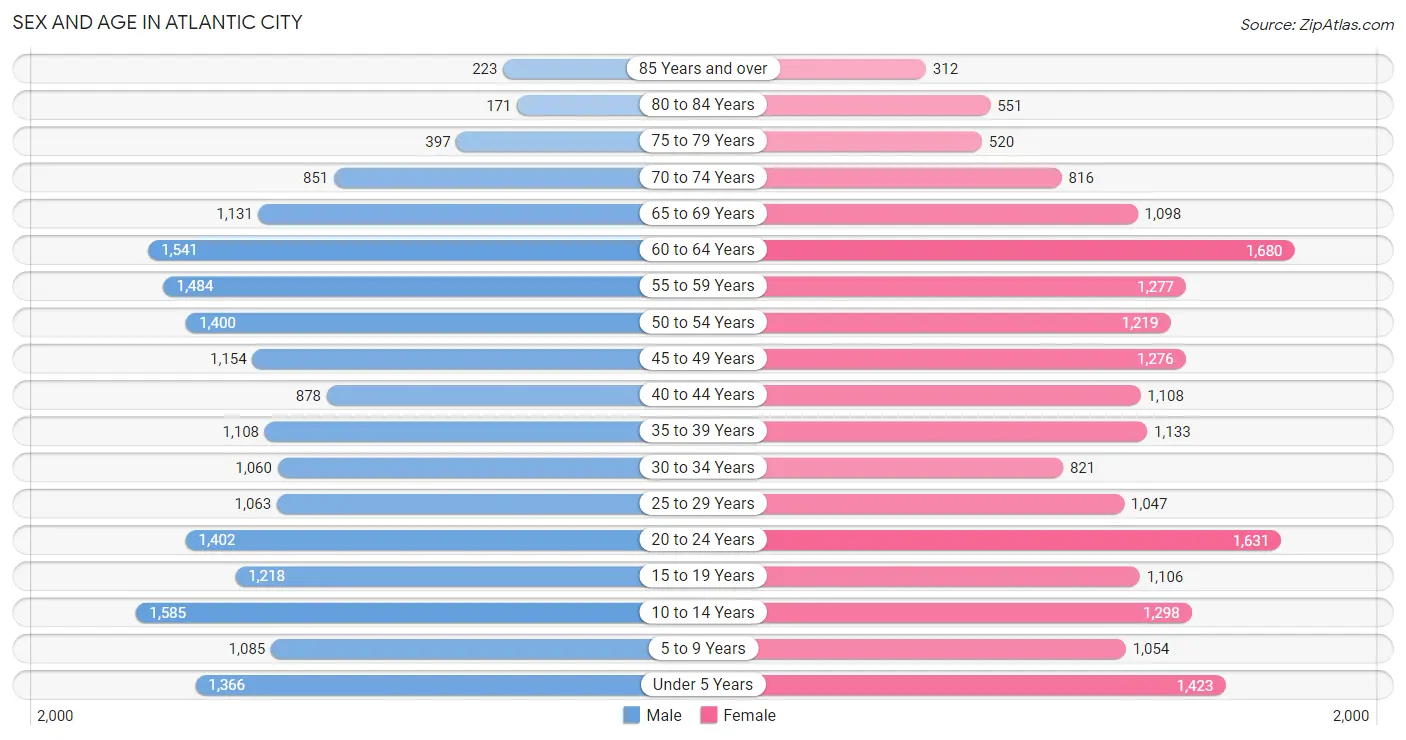
Sex and Age in Atlantic City
Sex and Age in Atlantic City
The most populous age groups in Atlantic City are 10 to 14 Years (1,585 | 8.3%) for men and 60 to 64 Years (1,680 | 8.7%) for women.
| Age Bracket | Male | Female |
| Under 5 Years | 1,366 (7.1%) | 1,423 (7.3%) |
| 5 to 9 Years | 1,085 (5.7%) | 1,054 (5.4%) |
| 10 to 14 Years | 1,585 (8.3%) | 1,298 (6.7%) |
| 15 to 19 Years | 1,218 (6.4%) | 1,106 (5.7%) |
| 20 to 24 Years | 1,402 (7.3%) | 1,631 (8.4%) |
| 25 to 29 Years | 1,063 (5.6%) | 1,047 (5.4%) |
| 30 to 34 Years | 1,060 (5.5%) | 821 (4.2%) |
| 35 to 39 Years | 1,108 (5.8%) | 1,133 (5.9%) |
| 40 to 44 Years | 878 (4.6%) | 1,108 (5.7%) |
| 45 to 49 Years | 1,154 (6.0%) | 1,276 (6.6%) |
| 50 to 54 Years | 1,400 (7.3%) | 1,219 (6.3%) |
| 55 to 59 Years | 1,484 (7.8%) | 1,277 (6.6%) |
| 60 to 64 Years | 1,541 (8.1%) | 1,680 (8.7%) |
| 65 to 69 Years | 1,131 (5.9%) | 1,098 (5.7%) |
| 70 to 74 Years | 851 (4.4%) | 816 (4.2%) |
| 75 to 79 Years | 397 (2.1%) | 520 (2.7%) |
| 80 to 84 Years | 171 (0.9%) | 551 (2.8%) |
| 85 Years and over | 223 (1.2%) | 312 (1.6%) |
| Total | 19,117 (100.0%) | 19,370 (100.0%) |
Families and Households in Atlantic City
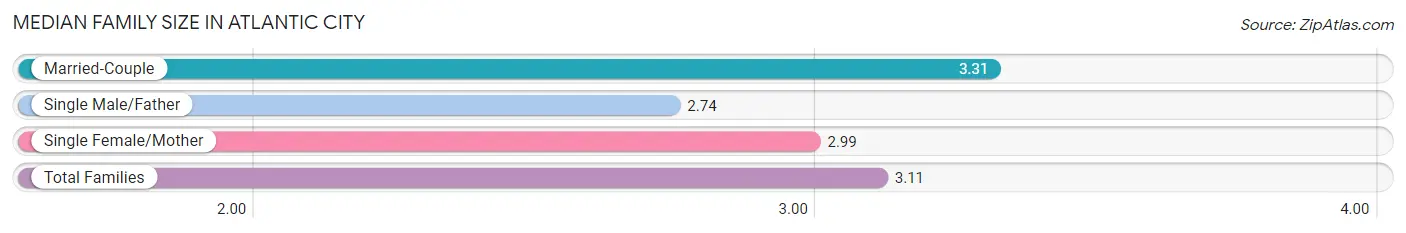
Median Family Size in Atlantic City
The median family size in Atlantic City is 3.11 persons per family, with married-couple families (3,972 | 46.3%) accounting for the largest median family size of 3.31 persons per family. On the other hand, single male/father families (1,207 | 14.1%) represent the smallest median family size with 2.74 persons per family.
| Family Type | # Families | Family Size |
| Married-Couple | 3,972 (46.3%) | 3.31 |
| Single Male/Father | 1,207 (14.1%) | 2.74 |
| Single Female/Mother | 3,392 (39.6%) | 2.99 |
| Total Families | 8,571 (100.0%) | 3.11 |
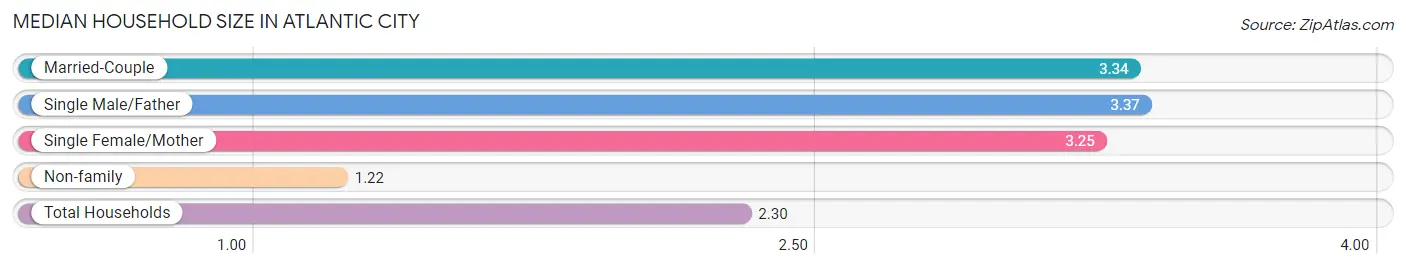
Median Household Size in Atlantic City
The median household size in Atlantic City is 2.30 persons per household, with single male/father households (1,207 | 7.3%) accounting for the largest median household size of 3.37 persons per household. non-family households (7,902 | 48.0%) represent the smallest median household size with 1.22 persons per household.
| Household Type | # Households | Household Size |
| Married-Couple | 3,972 (24.1%) | 3.34 |
| Single Male/Father | 1,207 (7.3%) | 3.37 |
| Single Female/Mother | 3,392 (20.6%) | 3.25 |
| Non-family | 7,902 (48.0%) | 1.22 |
| Total Households | 16,473 (100.0%) | 2.30 |
Household Size by Marriage Status in Atlantic City
Out of a total of 16,473 households in Atlantic City, 8,571 (52.0%) are family households, while 7,902 (48.0%) are nonfamily households. The most numerous type of family households are 2-person households, comprising 3,489, and the most common type of nonfamily households are 1-person households, comprising 6,575.
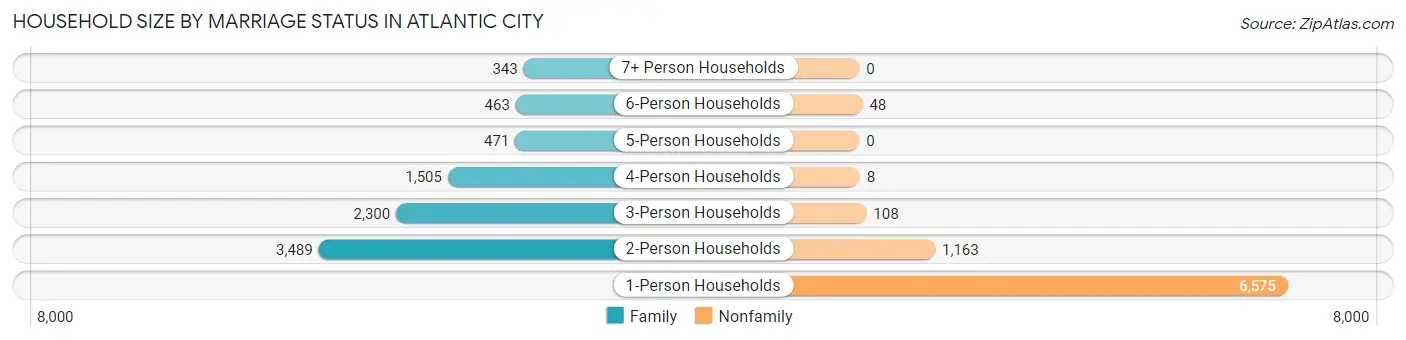
| Household Size | Family Households | Nonfamily Households |
| 1-Person Households | - | 6,575 (39.9%) |
| 2-Person Households | 3,489 (21.2%) | 1,163 (7.1%) |
| 3-Person Households | 2,300 (14.0%) | 108 (0.7%) |
| 4-Person Households | 1,505 (9.1%) | 8 (0.1%) |
| 5-Person Households | 471 (2.9%) | 0 (0.0%) |
| 6-Person Households | 463 (2.8%) | 48 (0.3%) |
| 7+ Person Households | 343 (2.1%) | 0 (0.0%) |
| Total | 8,571 (52.0%) | 7,902 (48.0%) |
Female Fertility in Atlantic City
Fertility by Age in Atlantic City
Average fertility rate in Atlantic City is 74.0 births per 1,000 women. Women in the age bracket of 20 to 34 years have the highest fertility rate with 145.0 births per 1,000 women. Women in the age bracket of 20 to 34 years acount for 81.6% of all women with births.
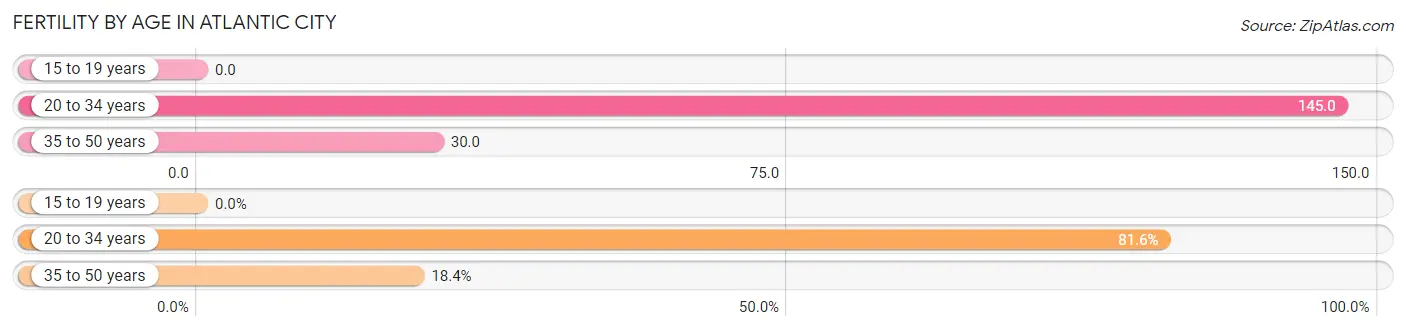
| Age Bracket | Women with Births | Births / 1,000 Women |
| 15 to 19 years | 0 (0.0%) | 0.0 |
| 20 to 34 years | 507 (81.6%) | 145.0 |
| 35 to 50 years | 114 (18.4%) | 30.0 |
| Total | 621 (100.0%) | 74.0 |
Fertility by Age by Marriage Status in Atlantic City
37.5% of women with births (621) in Atlantic City are married. The highest percentage of unmarried women with births falls into 20 to 34 years age bracket with 62.5% of them unmarried at the time of birth, while the lowest percentage of unmarried women with births belong to 35 to 50 years age bracket with 62.3% of them unmarried.
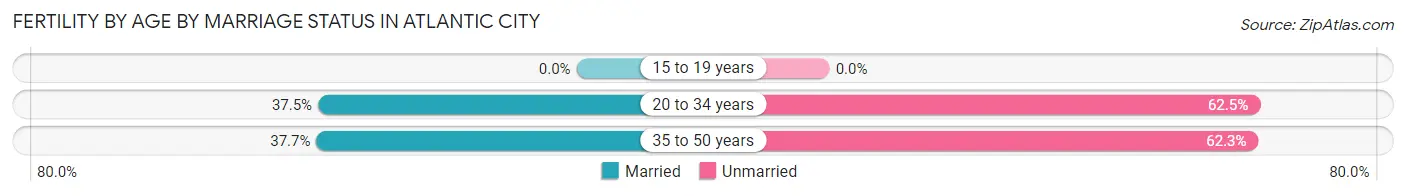
| Age Bracket | Married | Unmarried |
| 15 to 19 years | 0 (0.0%) | 0 (0.0%) |
| 20 to 34 years | 190 (37.5%) | 317 (62.5%) |
| 35 to 50 years | 43 (37.7%) | 71 (62.3%) |
| Total | 233 (37.5%) | 388 (62.5%) |
Fertility by Education in Atlantic City
Average fertility rate in Atlantic City is 74.0 births per 1,000 women. Women with the education attainment of college or associate's degree have the highest fertility rate of 126.0 births per 1,000 women, while women with the education attainment of bachelor's degree have the lowest fertility at 12.0 births per 1,000 women. Women with the education attainment of college or associate's degree represent 54.1% of all women with births.
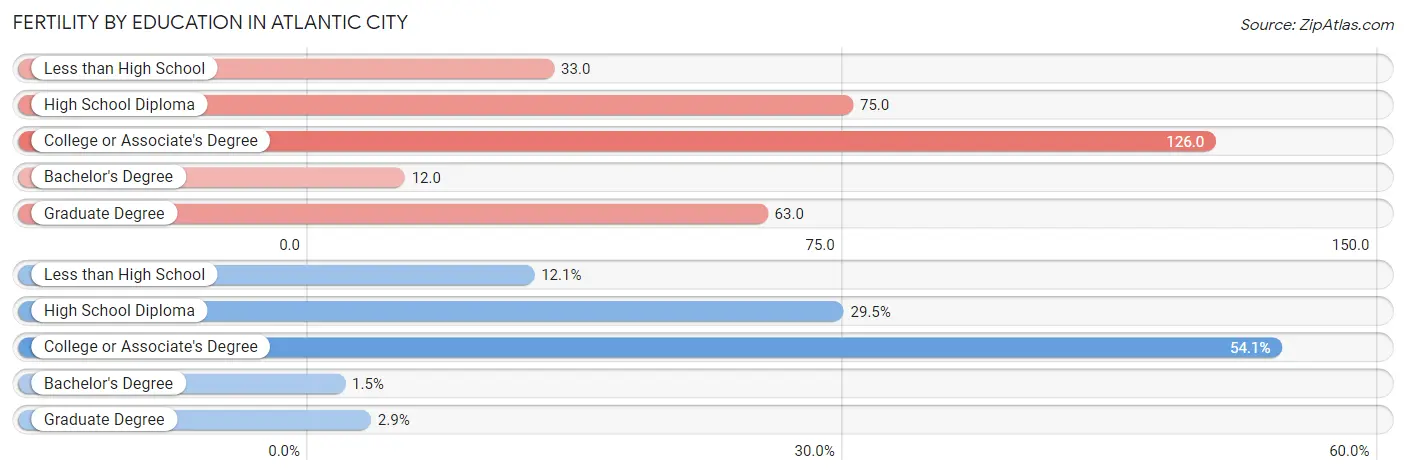
| Educational Attainment | Women with Births | Births / 1,000 Women |
| Less than High School | 75 (12.1%) | 33.0 |
| High School Diploma | 183 (29.5%) | 75.0 |
| College or Associate's Degree | 336 (54.1%) | 126.0 |
| Bachelor's Degree | 9 (1.5%) | 12.0 |
| Graduate Degree | 18 (2.9%) | 63.0 |
| Total | 621 (100.0%) | 74.0 |
Fertility by Education by Marriage Status in Atlantic City
62.5% of women with births in Atlantic City are unmarried. Women with the educational attainment of bachelor's degree are most likely to be married with 100.0% of them married at childbirth, while women with the educational attainment of high school diploma are least likely to be married with 88.0% of them unmarried at childbirth.
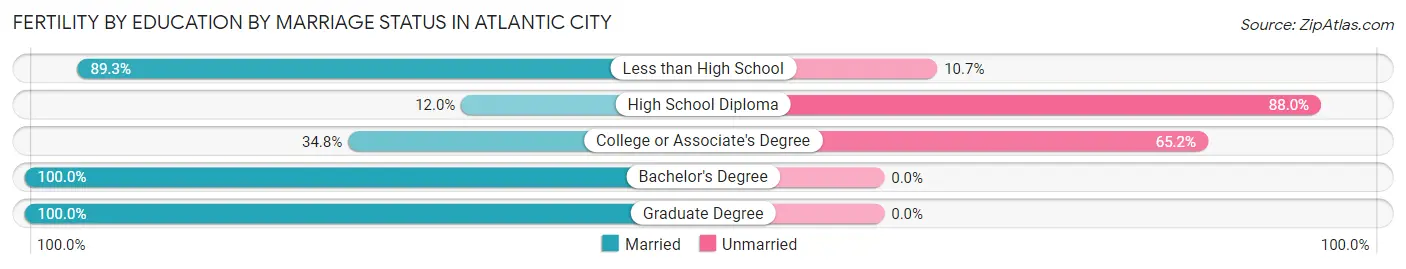
| Educational Attainment | Married | Unmarried |
| Less than High School | 67 (89.3%) | 8 (10.7%) |
| High School Diploma | 22 (12.0%) | 161 (88.0%) |
| College or Associate's Degree | 117 (34.8%) | 219 (65.2%) |
| Bachelor's Degree | 9 (100.0%) | 0 (0.0%) |
| Graduate Degree | 18 (100.0%) | 0 (0.0%) |
| Total | 233 (37.5%) | 388 (62.5%) |
Employment Characteristics in Atlantic City
Employment by Class of Employer in Atlantic City
Among the 14,842 employed individuals in Atlantic City, private company employees (11,432 | 77.0%), local government employees (1,045 | 7.0%), and not-for-profit organizations (779 | 5.2%) make up the most common classes of employment.
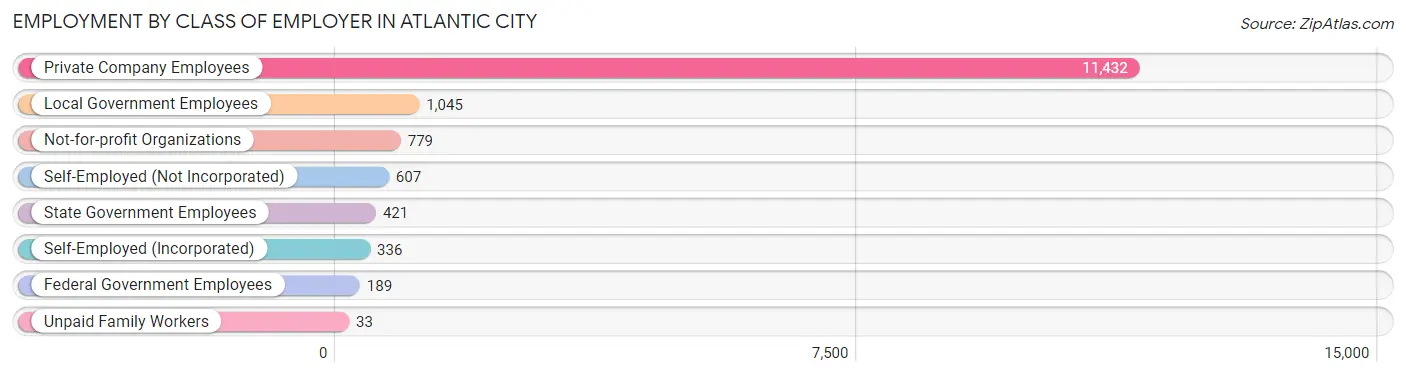
| Employer Class | # Employees | % Employees |
| Private Company Employees | 11,432 | 77.0% |
| Self-Employed (Incorporated) | 336 | 2.3% |
| Self-Employed (Not Incorporated) | 607 | 4.1% |
| Not-for-profit Organizations | 779 | 5.2% |
| Local Government Employees | 1,045 | 7.0% |
| State Government Employees | 421 | 2.8% |
| Federal Government Employees | 189 | 1.3% |
| Unpaid Family Workers | 33 | 0.2% |
| Total | 14,842 | 100.0% |
Employment Status by Age in Atlantic City
According to the labor force statistics for Atlantic City, out of the total population over 16 years of age (30,381), 58.6% or 17,803 individuals are in the labor force, with 13.1% or 2,332 of them unemployed. The age group with the highest labor force participation rate is 30 to 34 years, with 87.0% or 1,636 individuals in the labor force. Within the labor force, the 16 to 19 years age range has the highest percentage of unemployed individuals, with 31.7% or 183 of them being unemployed.
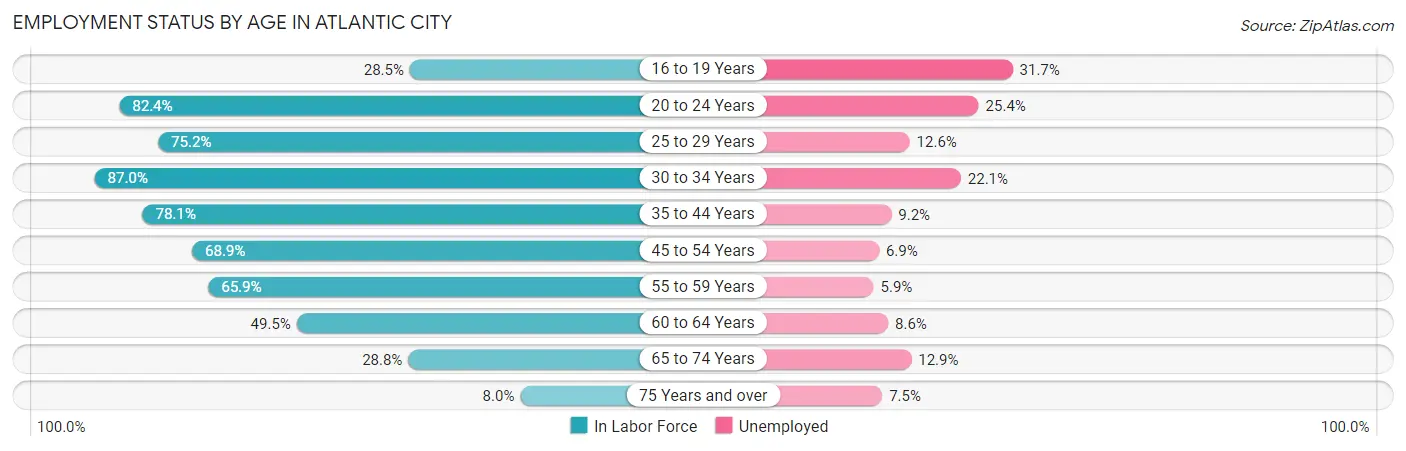
| Age Bracket | In Labor Force | Unemployed |
| 16 to 19 Years | 578 (28.5%) | 183 (31.7%) |
| 20 to 24 Years | 2,499 (82.4%) | 635 (25.4%) |
| 25 to 29 Years | 1,587 (75.2%) | 200 (12.6%) |
| 30 to 34 Years | 1,636 (87.0%) | 362 (22.1%) |
| 35 to 44 Years | 3,301 (78.1%) | 304 (9.2%) |
| 45 to 54 Years | 3,479 (68.9%) | 240 (6.9%) |
| 55 to 59 Years | 1,819 (65.9%) | 107 (5.9%) |
| 60 to 64 Years | 1,594 (49.5%) | 137 (8.6%) |
| 65 to 74 Years | 1,122 (28.8%) | 145 (12.9%) |
| 75 Years and over | 174 (8.0%) | 13 (7.5%) |
| Total | 17,803 (58.6%) | 2,332 (13.1%) |
Employment Status by Educational Attainment in Atlantic City
According to labor force statistics for Atlantic City, 69.7% of individuals (13,417) out of the total population between 25 and 64 years of age (19,249) are in the labor force, with 10.1% or 1,355 of them being unemployed. The group with the highest labor force participation rate are those with the educational attainment of bachelor's degree or higher, with 81.8% or 2,917 individuals in the labor force. Within the labor force, individuals with less than high school education have the highest percentage of unemployment, with 12.2% or 345 of them being unemployed.
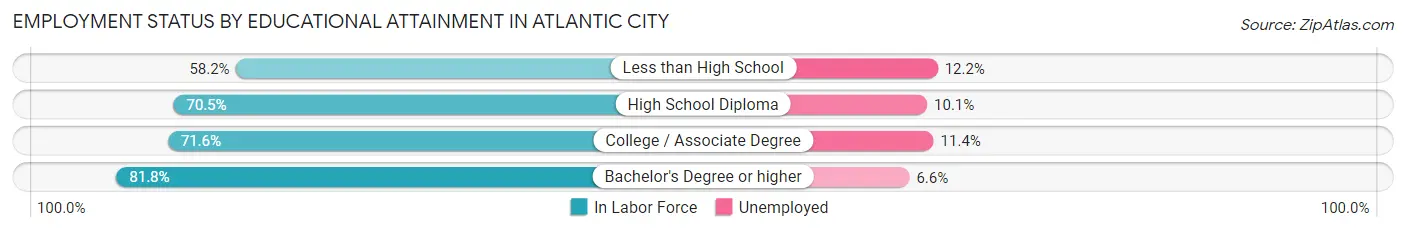
| Educational Attainment | In Labor Force | Unemployed |
| Less than High School | 2,824 (58.2%) | 592 (12.2%) |
| High School Diploma | 4,728 (70.5%) | 677 (10.1%) |
| College / Associate Degree | 2,952 (71.6%) | 470 (11.4%) |
| Bachelor's Degree or higher | 2,917 (81.8%) | 235 (6.6%) |
| Total | 13,417 (69.7%) | 1,944 (10.1%) |
Employment Occupations by Sex in Atlantic City
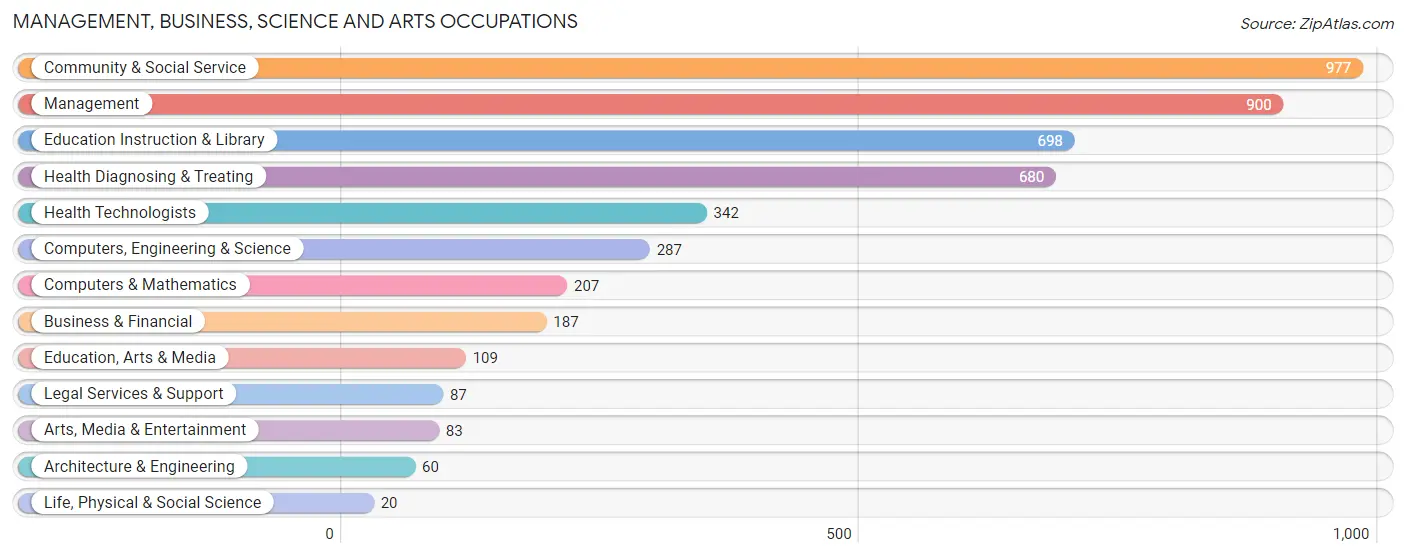
Management, Business, Science and Arts Occupations
The most common Management, Business, Science and Arts occupations in Atlantic City are Community & Social Service (977 | 6.3%), Management (900 | 5.8%), Education Instruction & Library (698 | 4.5%), Health Diagnosing & Treating (680 | 4.4%), and Health Technologists (342 | 2.2%).
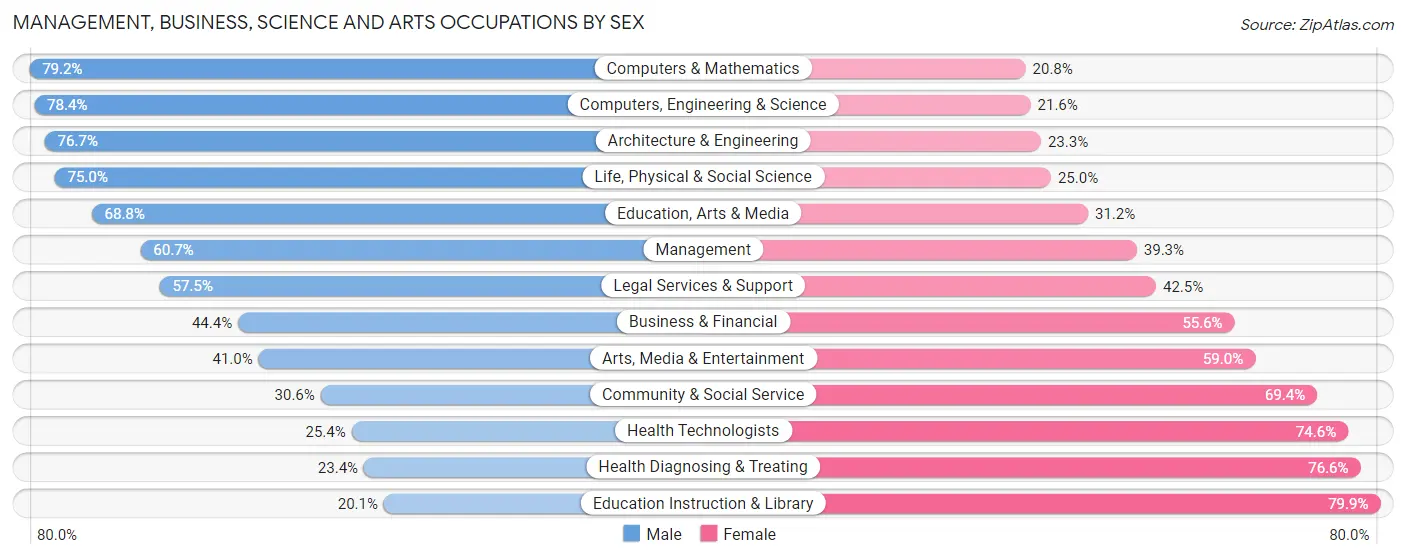
Management, Business, Science and Arts Occupations by Sex
Within the Management, Business, Science and Arts occupations in Atlantic City, the most male-oriented occupations are Computers & Mathematics (79.2%), Computers, Engineering & Science (78.4%), and Architecture & Engineering (76.7%), while the most female-oriented occupations are Education Instruction & Library (79.9%), Health Diagnosing & Treating (76.6%), and Health Technologists (74.6%).
| Occupation | Male | Female |
| Management | 546 (60.7%) | 354 (39.3%) |
| Business & Financial | 83 (44.4%) | 104 (55.6%) |
| Computers, Engineering & Science | 225 (78.4%) | 62 (21.6%) |
| Computers & Mathematics | 164 (79.2%) | 43 (20.8%) |
| Architecture & Engineering | 46 (76.7%) | 14 (23.3%) |
| Life, Physical & Social Science | 15 (75.0%) | 5 (25.0%) |
| Community & Social Service | 299 (30.6%) | 678 (69.4%) |
| Education, Arts & Media | 75 (68.8%) | 34 (31.2%) |
| Legal Services & Support | 50 (57.5%) | 37 (42.5%) |
| Education Instruction & Library | 140 (20.1%) | 558 (79.9%) |
| Arts, Media & Entertainment | 34 (41.0%) | 49 (59.0%) |
| Health Diagnosing & Treating | 159 (23.4%) | 521 (76.6%) |
| Health Technologists | 87 (25.4%) | 255 (74.6%) |
| Total (Category) | 1,312 (43.3%) | 1,719 (56.7%) |
| Total (Overall) | 8,032 (52.0%) | 7,424 (48.0%) |
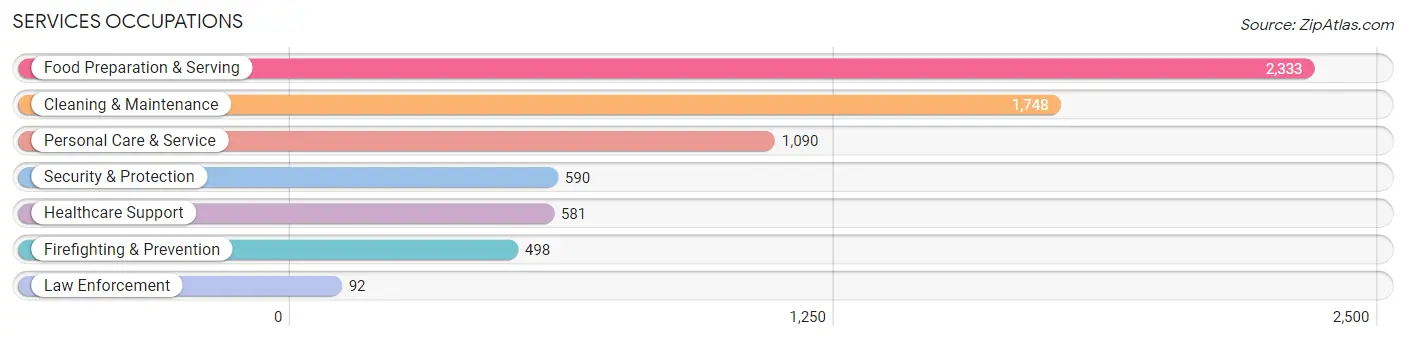
Services Occupations
The most common Services occupations in Atlantic City are Food Preparation & Serving (2,333 | 15.1%), Cleaning & Maintenance (1,748 | 11.3%), Personal Care & Service (1,090 | 7.0%), Security & Protection (590 | 3.8%), and Healthcare Support (581 | 3.8%).
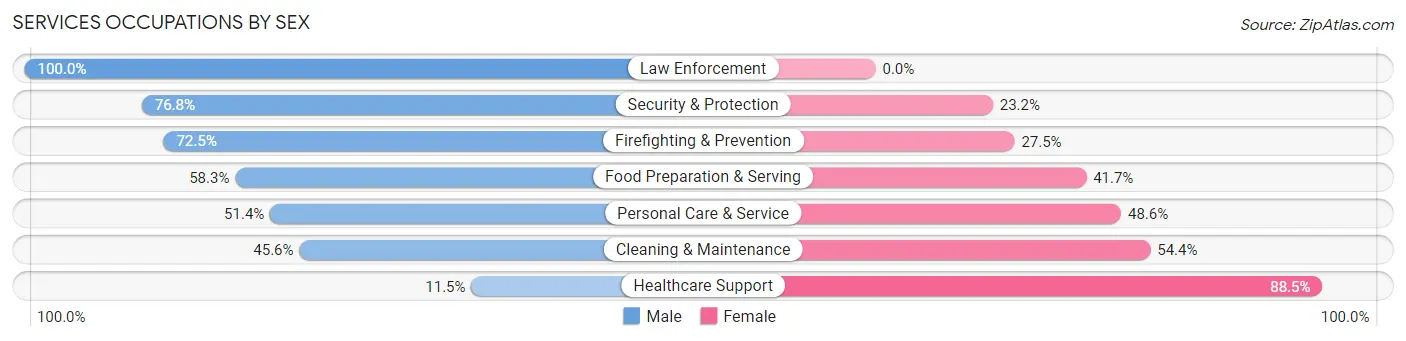
Services Occupations by Sex
Within the Services occupations in Atlantic City, the most male-oriented occupations are Law Enforcement (100.0%), Security & Protection (76.8%), and Firefighting & Prevention (72.5%), while the most female-oriented occupations are Healthcare Support (88.5%), Cleaning & Maintenance (54.4%), and Personal Care & Service (48.6%).
| Occupation | Male | Female |
| Healthcare Support | 67 (11.5%) | 514 (88.5%) |
| Security & Protection | 453 (76.8%) | 137 (23.2%) |
| Firefighting & Prevention | 361 (72.5%) | 137 (27.5%) |
| Law Enforcement | 92 (100.0%) | 0 (0.0%) |
| Food Preparation & Serving | 1,360 (58.3%) | 973 (41.7%) |
| Cleaning & Maintenance | 797 (45.6%) | 951 (54.4%) |
| Personal Care & Service | 560 (51.4%) | 530 (48.6%) |
| Total (Category) | 3,237 (51.0%) | 3,105 (49.0%) |
| Total (Overall) | 8,032 (52.0%) | 7,424 (48.0%) |
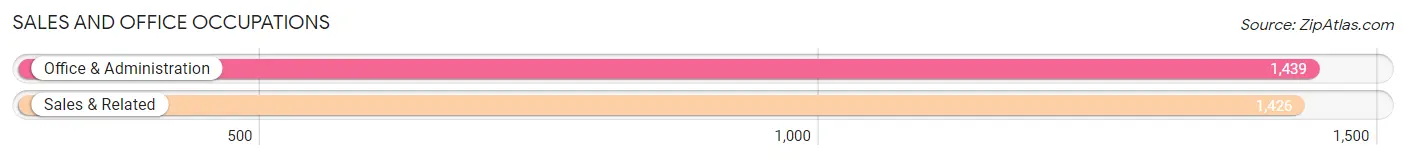
Sales and Office Occupations
The most common Sales and Office occupations in Atlantic City are Office & Administration (1,439 | 9.3%), and Sales & Related (1,426 | 9.2%).
Sales and Office Occupations by Sex
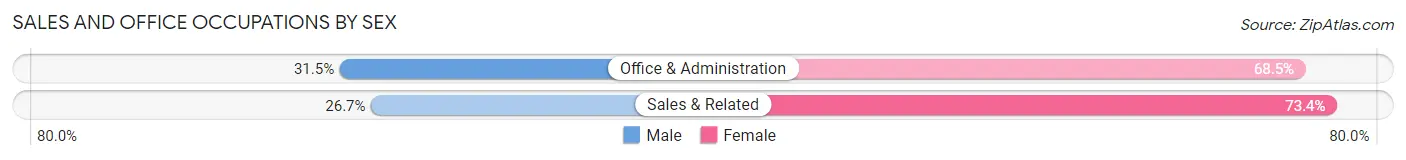
| Occupation | Male | Female |
| Sales & Related | 380 (26.7%) | 1,046 (73.4%) |
| Office & Administration | 453 (31.5%) | 986 (68.5%) |
| Total (Category) | 833 (29.1%) | 2,032 (70.9%) |
| Total (Overall) | 8,032 (52.0%) | 7,424 (48.0%) |
Natural Resources, Construction and Maintenance Occupations
The most common Natural Resources, Construction and Maintenance occupations in Atlantic City are Construction & Extraction (1,139 | 7.4%), and Installation, Maintenance & Repair (252 | 1.6%).

Natural Resources, Construction and Maintenance Occupations by Sex

| Occupation | Male | Female |
| Farming, Fishing & Forestry | 0 (0.0%) | 0 (0.0%) |
| Construction & Extraction | 1,028 (90.2%) | 111 (9.8%) |
| Installation, Maintenance & Repair | 252 (100.0%) | 0 (0.0%) |
| Total (Category) | 1,280 (92.0%) | 111 (8.0%) |
| Total (Overall) | 8,032 (52.0%) | 7,424 (48.0%) |
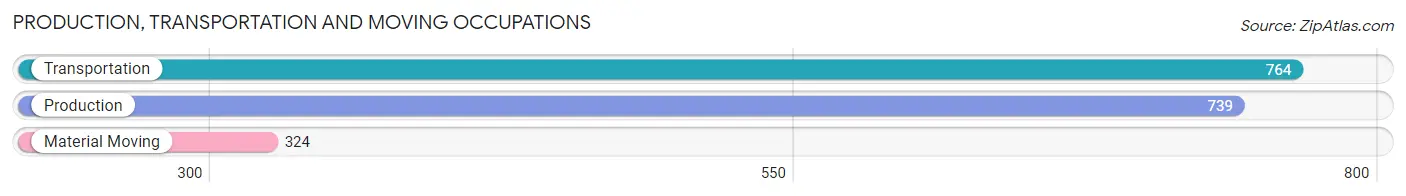
Production, Transportation and Moving Occupations
The most common Production, Transportation and Moving occupations in Atlantic City are Transportation (764 | 4.9%), Production (739 | 4.8%), and Material Moving (324 | 2.1%).
Production, Transportation and Moving Occupations by Sex
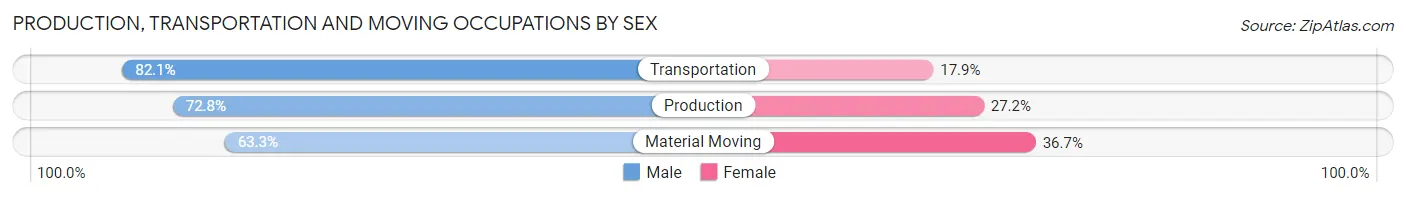
| Occupation | Male | Female |
| Production | 538 (72.8%) | 201 (27.2%) |
| Transportation | 627 (82.1%) | 137 (17.9%) |
| Material Moving | 205 (63.3%) | 119 (36.7%) |
| Total (Category) | 1,370 (75.0%) | 457 (25.0%) |
| Total (Overall) | 8,032 (52.0%) | 7,424 (48.0%) |
Employment Industries by Sex in Atlantic City
Employment Industries in Atlantic City
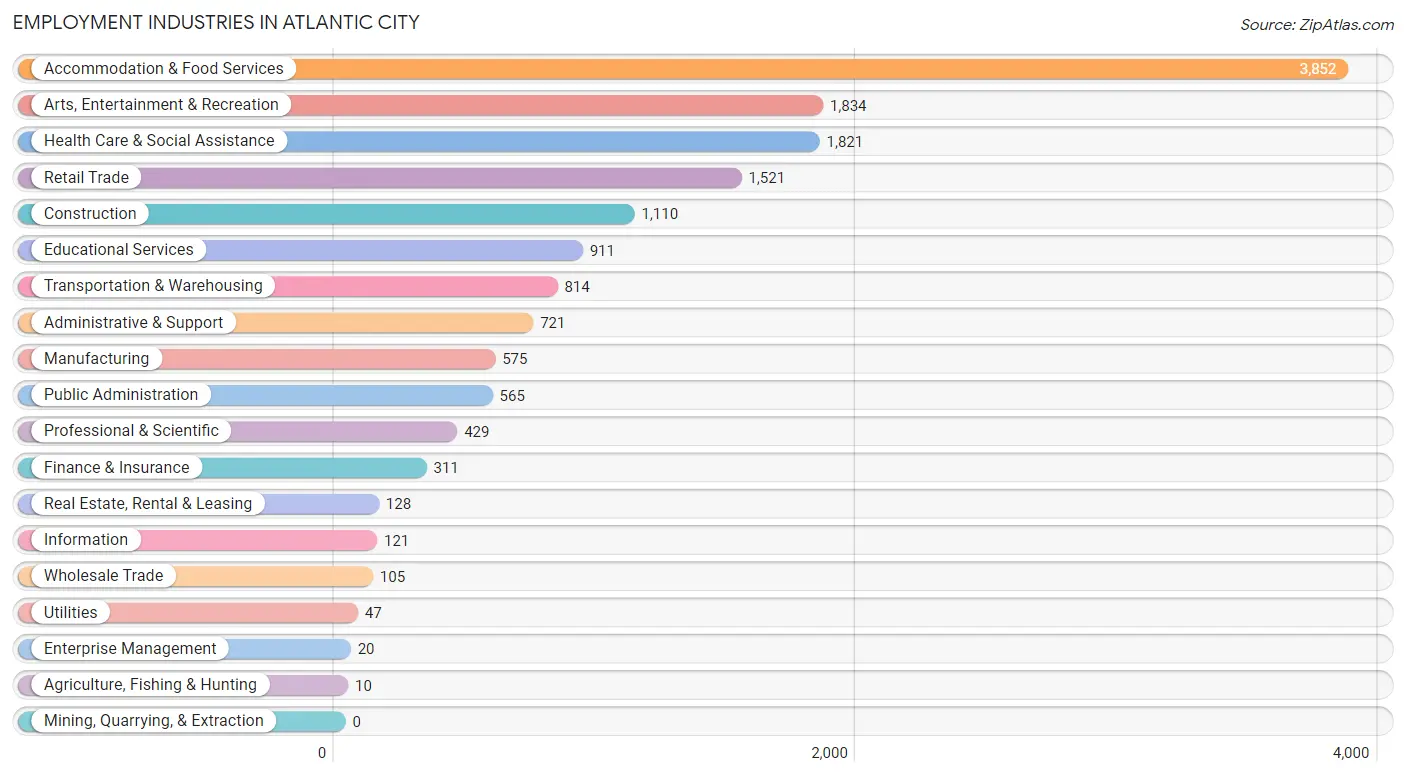
The major employment industries in Atlantic City include Accommodation & Food Services (3,852 | 24.9%), Arts, Entertainment & Recreation (1,834 | 11.9%), Health Care & Social Assistance (1,821 | 11.8%), Retail Trade (1,521 | 9.8%), and Construction (1,110 | 7.2%).
Employment Industries by Sex in Atlantic City
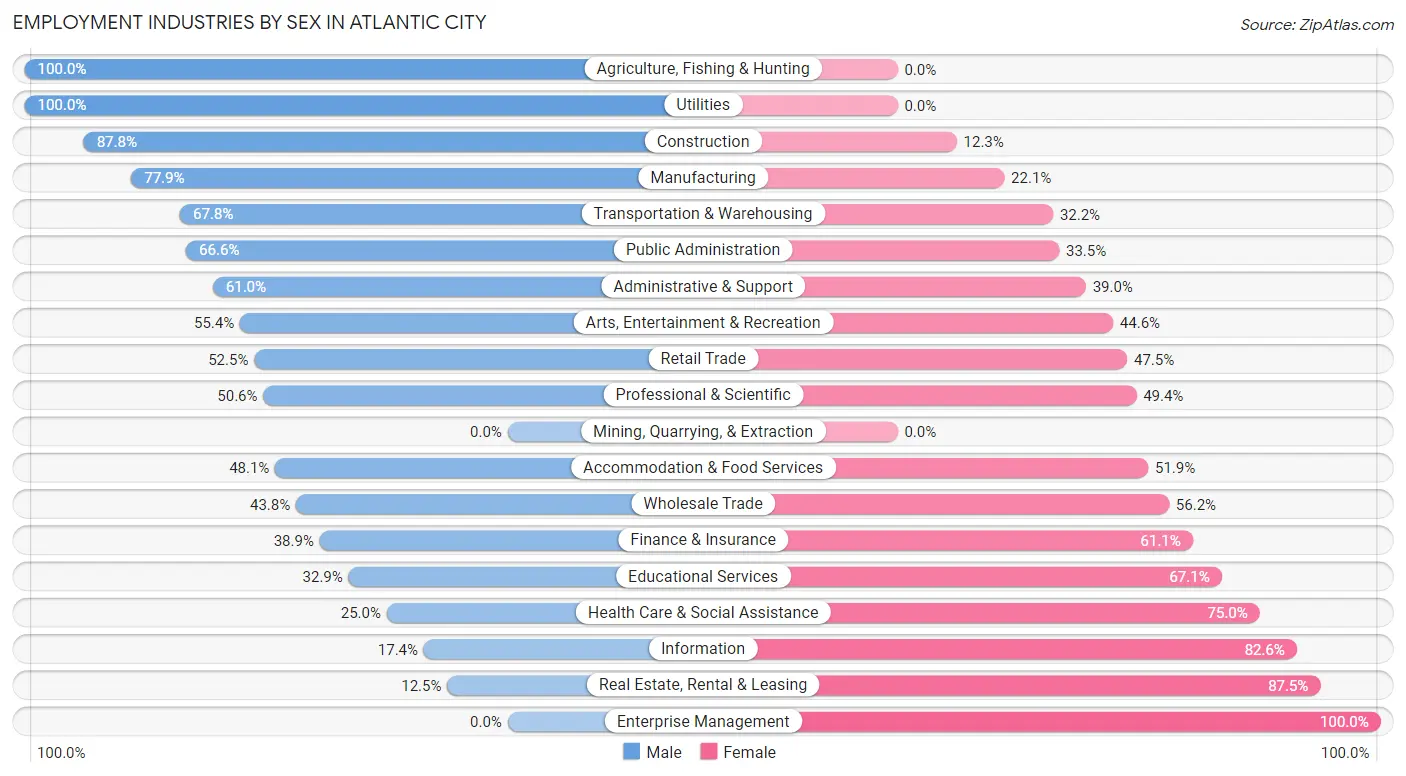
The Atlantic City industries that see more men than women are Agriculture, Fishing & Hunting (100.0%), Utilities (100.0%), and Construction (87.7%), whereas the industries that tend to have a higher number of women are Enterprise Management (100.0%), Real Estate, Rental & Leasing (87.5%), and Information (82.6%).
| Industry | Male | Female |
| Agriculture, Fishing & Hunting | 10 (100.0%) | 0 (0.0%) |
| Mining, Quarrying, & Extraction | 0 (0.0%) | 0 (0.0%) |
| Construction | 974 (87.7%) | 136 (12.2%) |
| Manufacturing | 448 (77.9%) | 127 (22.1%) |
| Wholesale Trade | 46 (43.8%) | 59 (56.2%) |
| Retail Trade | 798 (52.5%) | 723 (47.5%) |
| Transportation & Warehousing | 552 (67.8%) | 262 (32.2%) |
| Utilities | 47 (100.0%) | 0 (0.0%) |
| Information | 21 (17.4%) | 100 (82.6%) |
| Finance & Insurance | 121 (38.9%) | 190 (61.1%) |
| Real Estate, Rental & Leasing | 16 (12.5%) | 112 (87.5%) |
| Professional & Scientific | 217 (50.6%) | 212 (49.4%) |
| Enterprise Management | 0 (0.0%) | 20 (100.0%) |
| Administrative & Support | 440 (61.0%) | 281 (39.0%) |
| Educational Services | 300 (32.9%) | 611 (67.1%) |
| Health Care & Social Assistance | 456 (25.0%) | 1,365 (75.0%) |
| Arts, Entertainment & Recreation | 1,016 (55.4%) | 818 (44.6%) |
| Accommodation & Food Services | 1,854 (48.1%) | 1,998 (51.9%) |
| Public Administration | 376 (66.5%) | 189 (33.5%) |
| Total | 8,032 (52.0%) | 7,424 (48.0%) |
Education in Atlantic City
School Enrollment in Atlantic City
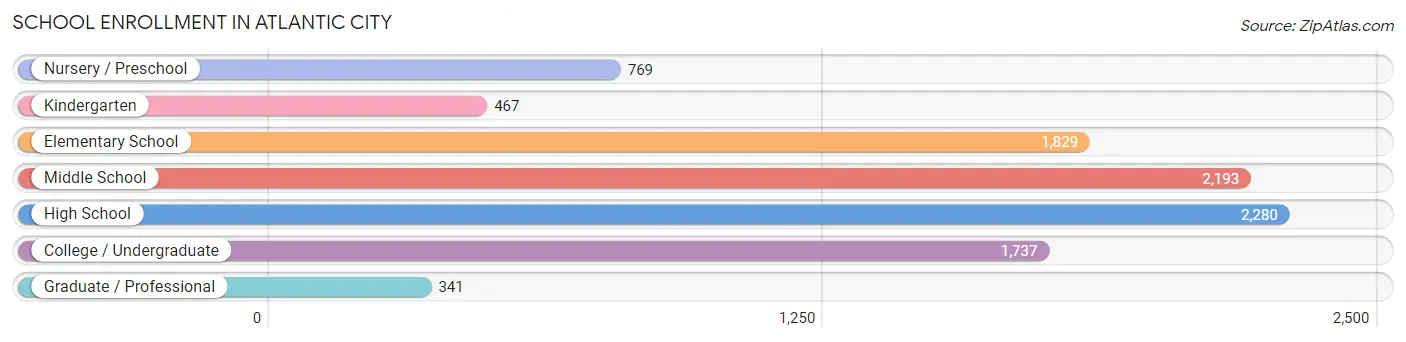
The most common levels of schooling among the 9,616 students in Atlantic City are high school (2,280 | 23.7%), middle school (2,193 | 22.8%), and elementary school (1,829 | 19.0%).
| School Level | # Students | % Students |
| Nursery / Preschool | 769 | 8.0% |
| Kindergarten | 467 | 4.9% |
| Elementary School | 1,829 | 19.0% |
| Middle School | 2,193 | 22.8% |
| High School | 2,280 | 23.7% |
| College / Undergraduate | 1,737 | 18.1% |
| Graduate / Professional | 341 | 3.5% |
| Total | 9,616 | 100.0% |
School Enrollment by Age by Funding Source in Atlantic City
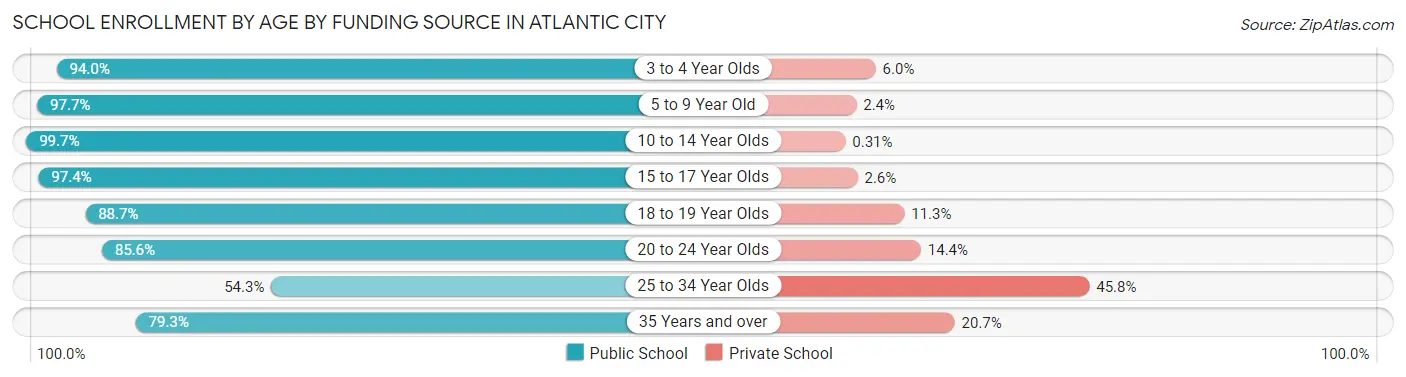
Out of a total of 9,616 students who are enrolled in schools in Atlantic City, 606 (6.3%) attend a private institution, while the remaining 9,010 (93.7%) are enrolled in public schools. The age group of 25 to 34 year olds has the highest likelihood of being enrolled in private schools, with 140 (45.8% in the age bracket) enrolled. Conversely, the age group of 10 to 14 year olds has the lowest likelihood of being enrolled in a private school, with 2,864 (99.7% in the age bracket) attending a public institution.
| Age Bracket | Public School | Private School |
| 3 to 4 Year Olds | 647 (94.0%) | 41 (6.0%) |
| 5 to 9 Year Old | 1,992 (97.7%) | 48 (2.4%) |
| 10 to 14 Year Olds | 2,864 (99.7%) | 9 (0.3%) |
| 15 to 17 Year Olds | 1,546 (97.4%) | 41 (2.6%) |
| 18 to 19 Year Olds | 385 (88.7%) | 49 (11.3%) |
| 20 to 24 Year Olds | 1,006 (85.6%) | 169 (14.4%) |
| 25 to 34 Year Olds | 166 (54.2%) | 140 (45.8%) |
| 35 Years and over | 407 (79.3%) | 106 (20.7%) |
| Total | 9,010 (93.7%) | 606 (6.3%) |
Educational Attainment by Field of Study in Atlantic City
Business (1,162 | 22.6%), education (548 | 10.7%), social sciences (531 | 10.3%), science & technology (516 | 10.0%), and psychology (388 | 7.5%) are the most common fields of study among 5,143 individuals in Atlantic City who have obtained a bachelor's degree or higher.
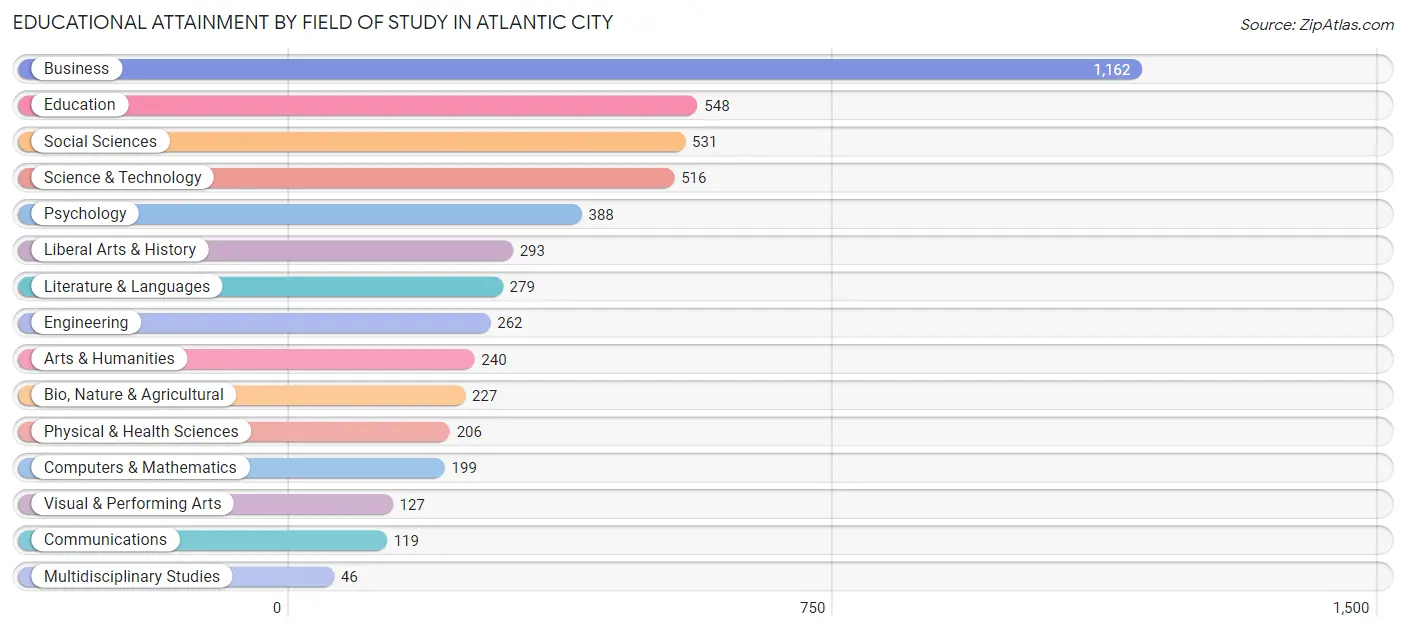
| Field of Study | # Graduates | % Graduates |
| Computers & Mathematics | 199 | 3.9% |
| Bio, Nature & Agricultural | 227 | 4.4% |
| Physical & Health Sciences | 206 | 4.0% |
| Psychology | 388 | 7.5% |
| Social Sciences | 531 | 10.3% |
| Engineering | 262 | 5.1% |
| Multidisciplinary Studies | 46 | 0.9% |
| Science & Technology | 516 | 10.0% |
| Business | 1,162 | 22.6% |
| Education | 548 | 10.7% |
| Literature & Languages | 279 | 5.4% |
| Liberal Arts & History | 293 | 5.7% |
| Visual & Performing Arts | 127 | 2.5% |
| Communications | 119 | 2.3% |
| Arts & Humanities | 240 | 4.7% |
| Total | 5,143 | 100.0% |
Transportation & Commute in Atlantic City
Vehicle Availability by Sex in Atlantic City
The most prevalent vehicle ownership categories in Atlantic City are males with 1 vehicle (2,901, accounting for 37.5%) and females with 1 vehicle (2,479, making up 41.1%).
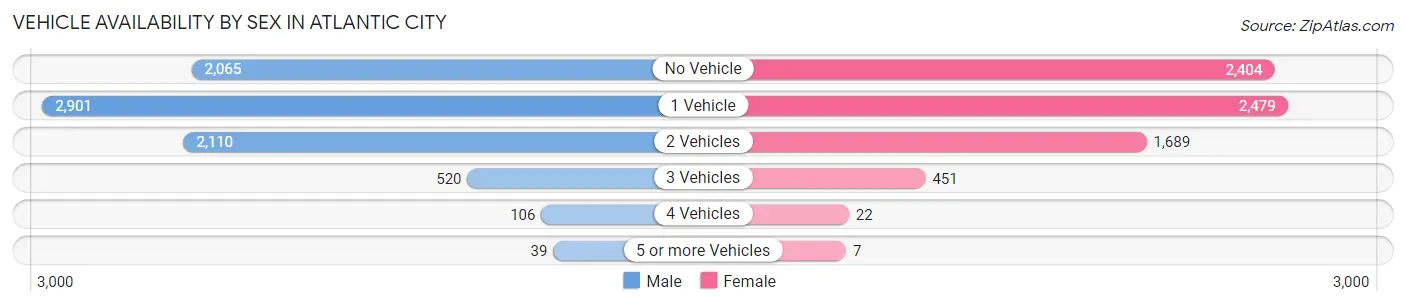
| Vehicles Available | Male | Female |
| No Vehicle | 2,065 (26.7%) | 2,404 (34.1%) |
| 1 Vehicle | 2,901 (37.5%) | 2,479 (35.1%) |
| 2 Vehicles | 2,110 (27.3%) | 1,689 (23.9%) |
| 3 Vehicles | 520 (6.7%) | 451 (6.4%) |
| 4 Vehicles | 106 (1.4%) | 22 (0.3%) |
| 5 or more Vehicles | 39 (0.5%) | 7 (0.1%) |
| Total | 7,741 (100.0%) | 7,052 (100.0%) |
Commute Time in Atlantic City
The most frequently occuring commute durations in Atlantic City are 10 to 14 minutes (3,360 commuters, 23.8%), 15 to 19 minutes (2,701 commuters, 19.1%), and 20 to 24 minutes (1,946 commuters, 13.8%).
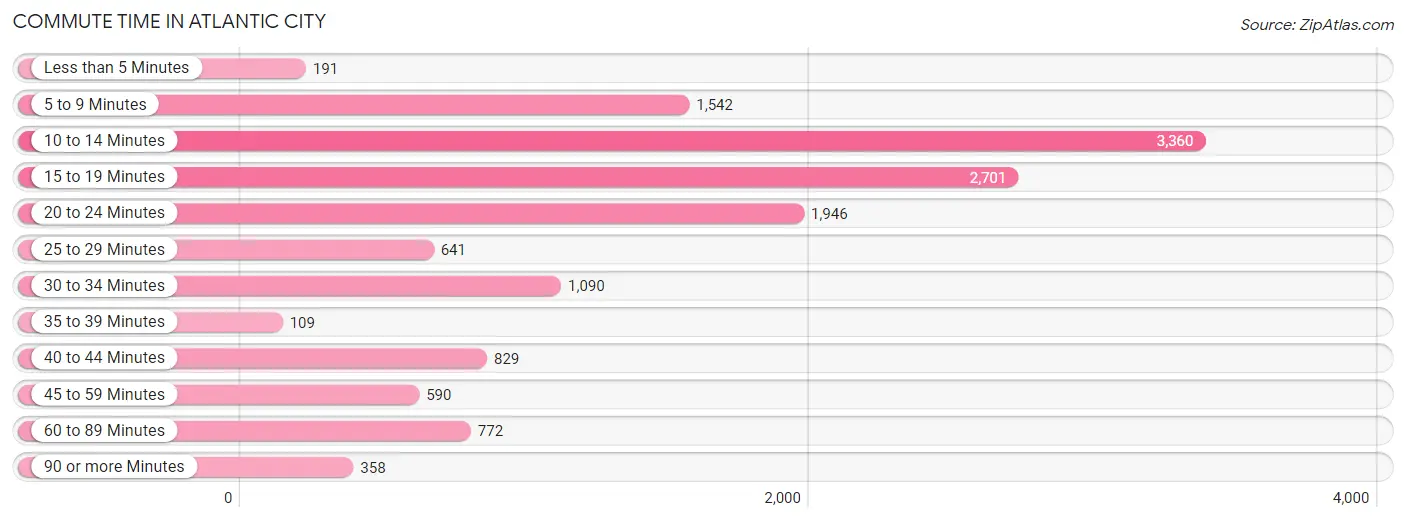
| Commute Time | # Commuters | % Commuters |
| Less than 5 Minutes | 191 | 1.3% |
| 5 to 9 Minutes | 1,542 | 10.9% |
| 10 to 14 Minutes | 3,360 | 23.8% |
| 15 to 19 Minutes | 2,701 | 19.1% |
| 20 to 24 Minutes | 1,946 | 13.8% |
| 25 to 29 Minutes | 641 | 4.5% |
| 30 to 34 Minutes | 1,090 | 7.7% |
| 35 to 39 Minutes | 109 | 0.8% |
| 40 to 44 Minutes | 829 | 5.9% |
| 45 to 59 Minutes | 590 | 4.2% |
| 60 to 89 Minutes | 772 | 5.5% |
| 90 or more Minutes | 358 | 2.5% |
Commute Time by Sex in Atlantic City
The most common commute times in Atlantic City are 10 to 14 minutes (1,773 commuters, 24.3%) for males and 10 to 14 minutes (1,587 commuters, 23.3%) for females.
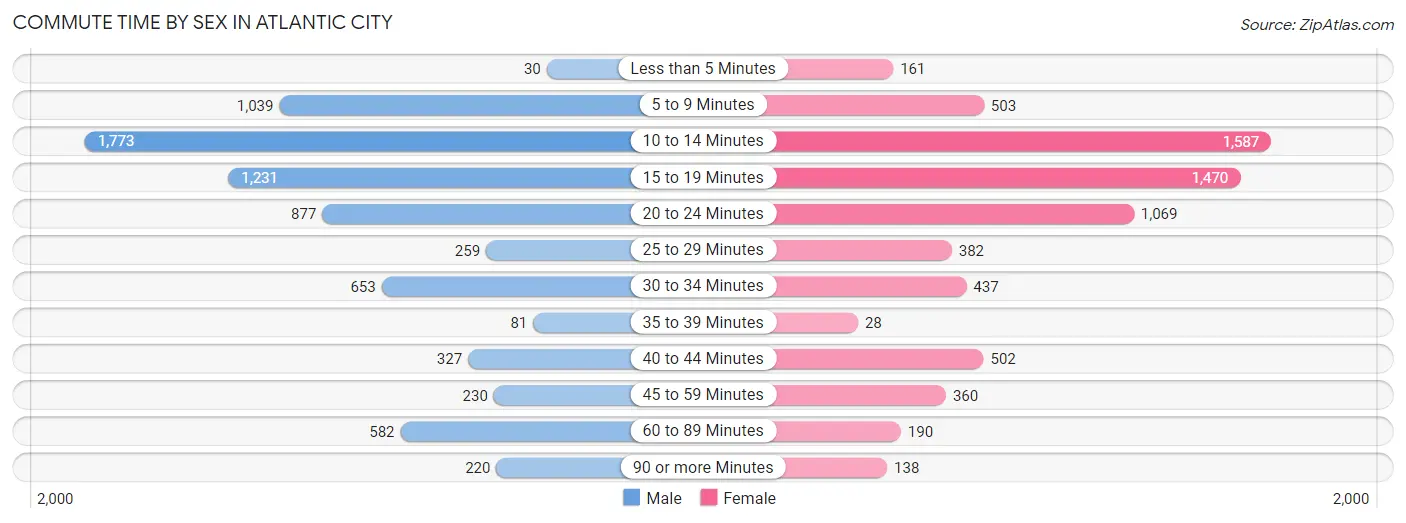
| Commute Time | Male | Female |
| Less than 5 Minutes | 30 (0.4%) | 161 (2.4%) |
| 5 to 9 Minutes | 1,039 (14.2%) | 503 (7.4%) |
| 10 to 14 Minutes | 1,773 (24.3%) | 1,587 (23.3%) |
| 15 to 19 Minutes | 1,231 (16.9%) | 1,470 (21.5%) |
| 20 to 24 Minutes | 877 (12.0%) | 1,069 (15.7%) |
| 25 to 29 Minutes | 259 (3.5%) | 382 (5.6%) |
| 30 to 34 Minutes | 653 (8.9%) | 437 (6.4%) |
| 35 to 39 Minutes | 81 (1.1%) | 28 (0.4%) |
| 40 to 44 Minutes | 327 (4.5%) | 502 (7.3%) |
| 45 to 59 Minutes | 230 (3.2%) | 360 (5.3%) |
| 60 to 89 Minutes | 582 (8.0%) | 190 (2.8%) |
| 90 or more Minutes | 220 (3.0%) | 138 (2.0%) |
Time of Departure to Work by Sex in Atlantic City
The most frequent times of departure to work in Atlantic City are 12:00 PM to 3:59 PM (1,171, 16.0%) for males and 12:00 PM to 3:59 PM (1,073, 15.7%) for females.
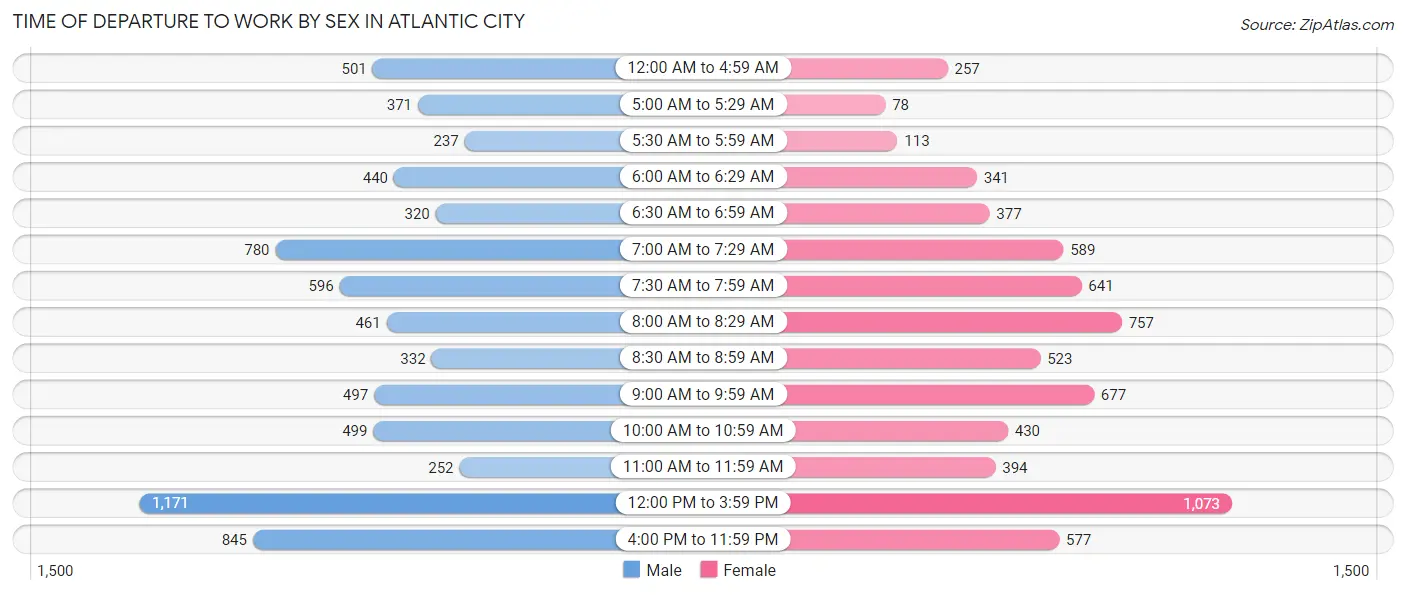
| Time of Departure | Male | Female |
| 12:00 AM to 4:59 AM | 501 (6.9%) | 257 (3.8%) |
| 5:00 AM to 5:29 AM | 371 (5.1%) | 78 (1.1%) |
| 5:30 AM to 5:59 AM | 237 (3.3%) | 113 (1.7%) |
| 6:00 AM to 6:29 AM | 440 (6.0%) | 341 (5.0%) |
| 6:30 AM to 6:59 AM | 320 (4.4%) | 377 (5.5%) |
| 7:00 AM to 7:29 AM | 780 (10.7%) | 589 (8.6%) |
| 7:30 AM to 7:59 AM | 596 (8.2%) | 641 (9.4%) |
| 8:00 AM to 8:29 AM | 461 (6.3%) | 757 (11.1%) |
| 8:30 AM to 8:59 AM | 332 (4.5%) | 523 (7.7%) |
| 9:00 AM to 9:59 AM | 497 (6.8%) | 677 (9.9%) |
| 10:00 AM to 10:59 AM | 499 (6.8%) | 430 (6.3%) |
| 11:00 AM to 11:59 AM | 252 (3.5%) | 394 (5.8%) |
| 12:00 PM to 3:59 PM | 1,171 (16.0%) | 1,073 (15.7%) |
| 4:00 PM to 11:59 PM | 845 (11.6%) | 577 (8.5%) |
| Total | 7,302 (100.0%) | 6,827 (100.0%) |
Housing Occupancy in Atlantic City
Occupancy by Ownership in Atlantic City
Of the total 16,473 dwellings in Atlantic City, owner-occupied units account for 5,075 (30.8%), while renter-occupied units make up 11,398 (69.2%).
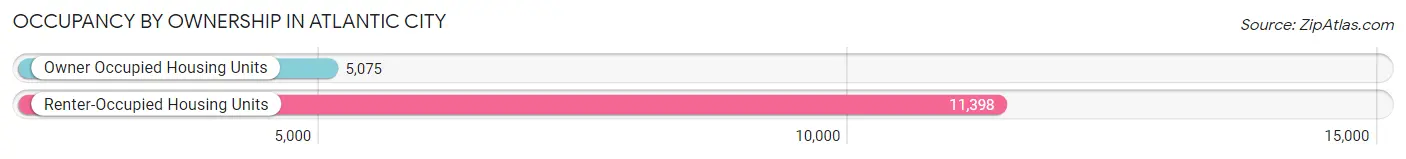
| Occupancy | # Housing Units | % Housing Units |
| Owner Occupied Housing Units | 5,075 | 30.8% |
| Renter-Occupied Housing Units | 11,398 | 69.2% |
| Total Occupied Housing Units | 16,473 | 100.0% |
Occupancy by Household Size in Atlantic City
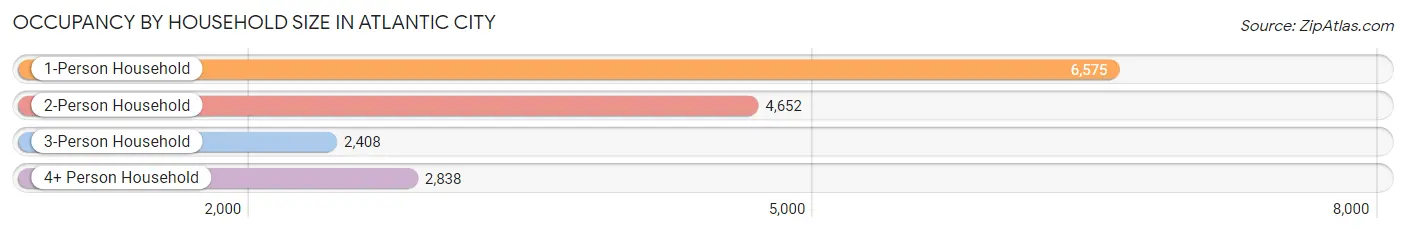
| Household Size | # Housing Units | % Housing Units |
| 1-Person Household | 6,575 | 39.9% |
| 2-Person Household | 4,652 | 28.2% |
| 3-Person Household | 2,408 | 14.6% |
| 4+ Person Household | 2,838 | 17.2% |
| Total Housing Units | 16,473 | 100.0% |
Occupancy by Ownership by Household Size in Atlantic City
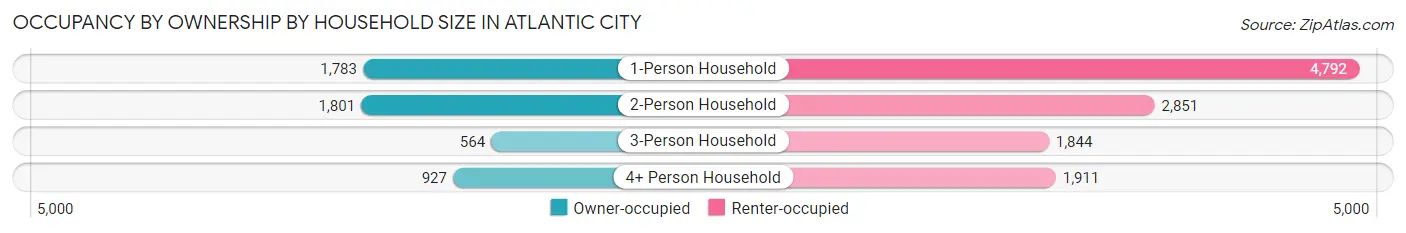
| Household Size | Owner-occupied | Renter-occupied |
| 1-Person Household | 1,783 (27.1%) | 4,792 (72.9%) |
| 2-Person Household | 1,801 (38.7%) | 2,851 (61.3%) |
| 3-Person Household | 564 (23.4%) | 1,844 (76.6%) |
| 4+ Person Household | 927 (32.7%) | 1,911 (67.3%) |
| Total Housing Units | 5,075 (30.8%) | 11,398 (69.2%) |
Occupancy by Educational Attainment in Atlantic City
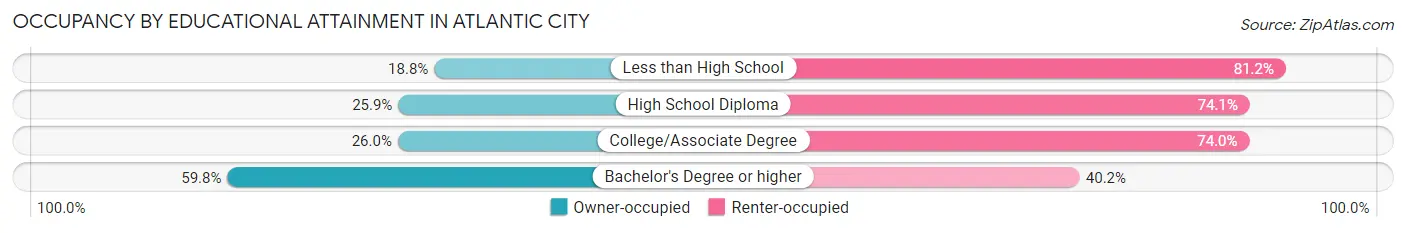
| Household Size | Owner-occupied | Renter-occupied |
| Less than High School | 703 (18.8%) | 3,037 (81.2%) |
| High School Diploma | 1,457 (25.9%) | 4,162 (74.1%) |
| College/Associate Degree | 1,032 (26.0%) | 2,934 (74.0%) |
| Bachelor's Degree or higher | 1,883 (59.8%) | 1,265 (40.2%) |
Occupancy by Age of Householder in Atlantic City
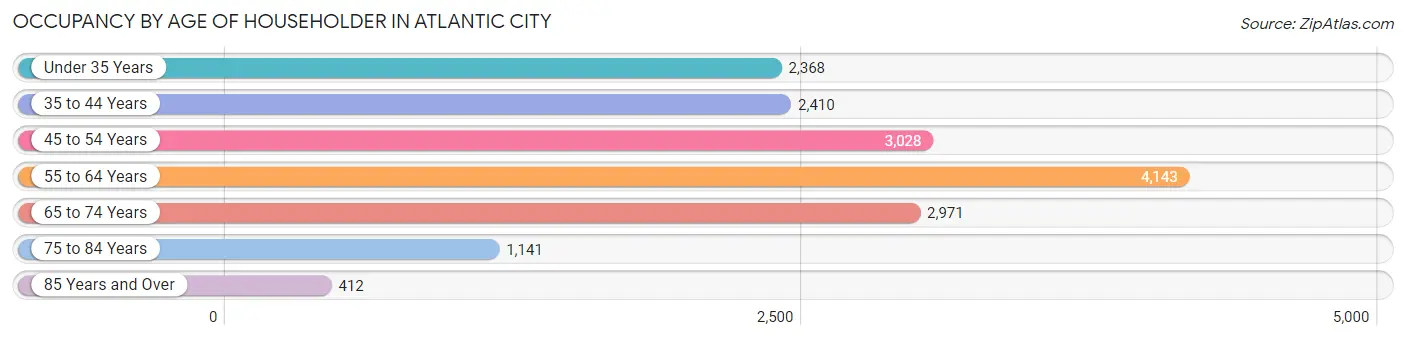
| Age Bracket | # Households | % Households |
| Under 35 Years | 2,368 | 14.4% |
| 35 to 44 Years | 2,410 | 14.6% |
| 45 to 54 Years | 3,028 | 18.4% |
| 55 to 64 Years | 4,143 | 25.2% |
| 65 to 74 Years | 2,971 | 18.0% |
| 75 to 84 Years | 1,141 | 6.9% |
| 85 Years and Over | 412 | 2.5% |
| Total | 16,473 | 100.0% |
Housing Finances in Atlantic City
Median Income by Occupancy in Atlantic City
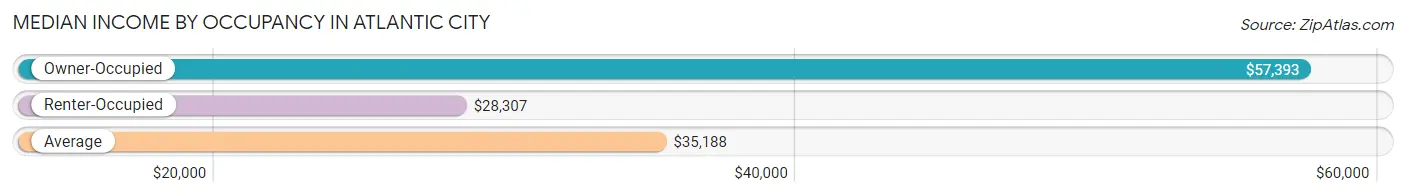
| Occupancy Type | # Households | Median Income |
| Owner-Occupied | 5,075 (30.8%) | $57,393 |
| Renter-Occupied | 11,398 (69.2%) | $28,307 |
| Average | 16,473 (100.0%) | $35,188 |
Occupancy by Householder Income Bracket in Atlantic City
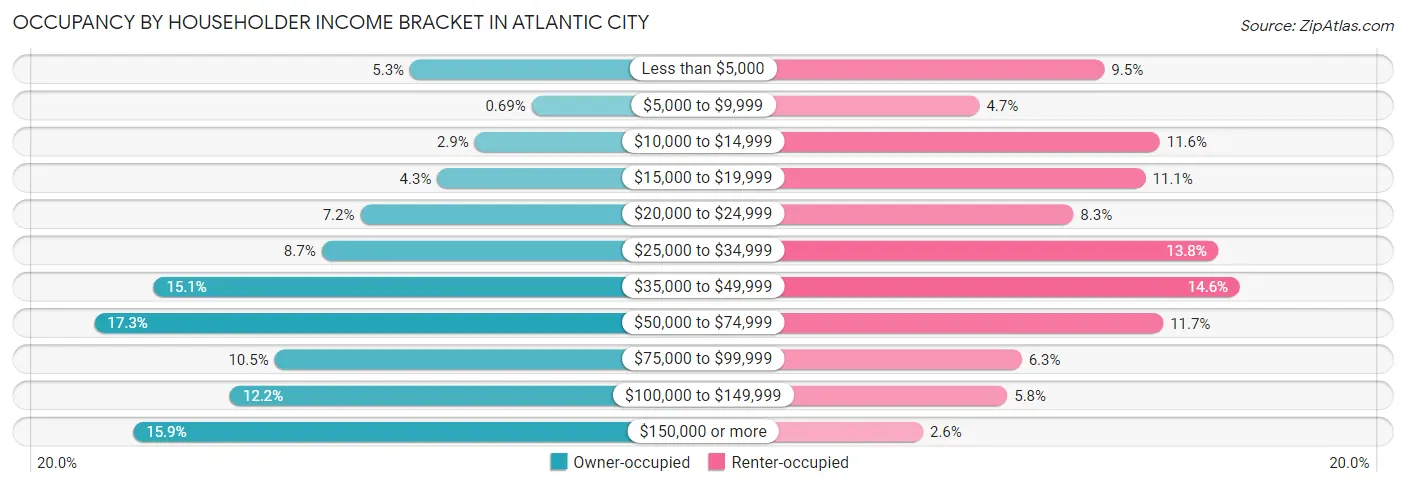
| Income Bracket | Owner-occupied | Renter-occupied |
| Less than $5,000 | 270 (5.3%) | 1,080 (9.5%) |
| $5,000 to $9,999 | 35 (0.7%) | 538 (4.7%) |
| $10,000 to $14,999 | 145 (2.9%) | 1,321 (11.6%) |
| $15,000 to $19,999 | 217 (4.3%) | 1,259 (11.1%) |
| $20,000 to $24,999 | 366 (7.2%) | 946 (8.3%) |
| $25,000 to $34,999 | 441 (8.7%) | 1,576 (13.8%) |
| $35,000 to $49,999 | 766 (15.1%) | 1,669 (14.6%) |
| $50,000 to $74,999 | 880 (17.3%) | 1,336 (11.7%) |
| $75,000 to $99,999 | 532 (10.5%) | 721 (6.3%) |
| $100,000 to $149,999 | 618 (12.2%) | 659 (5.8%) |
| $150,000 or more | 805 (15.9%) | 293 (2.6%) |
| Total | 5,075 (100.0%) | 11,398 (100.0%) |
Monthly Housing Cost Tiers in Atlantic City
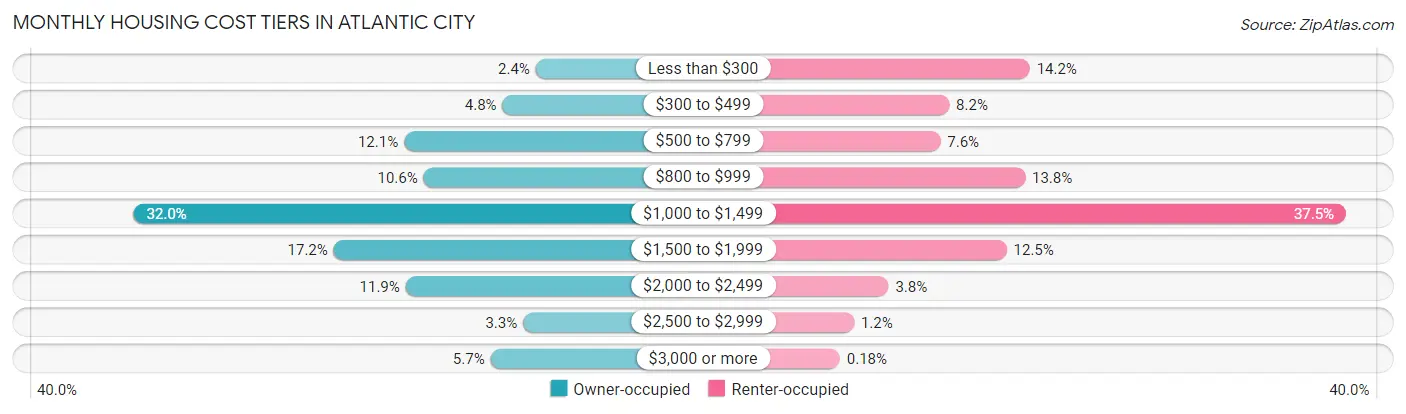
| Monthly Cost | Owner-occupied | Renter-occupied |
| Less than $300 | 120 (2.4%) | 1,614 (14.2%) |
| $300 to $499 | 244 (4.8%) | 938 (8.2%) |
| $500 to $799 | 612 (12.1%) | 864 (7.6%) |
| $800 to $999 | 539 (10.6%) | 1,575 (13.8%) |
| $1,000 to $1,499 | 1,623 (32.0%) | 4,268 (37.4%) |
| $1,500 to $1,999 | 875 (17.2%) | 1,420 (12.5%) |
| $2,000 to $2,499 | 606 (11.9%) | 428 (3.8%) |
| $2,500 to $2,999 | 167 (3.3%) | 139 (1.2%) |
| $3,000 or more | 289 (5.7%) | 20 (0.2%) |
| Total | 5,075 (100.0%) | 11,398 (100.0%) |
Physical Housing Characteristics in Atlantic City
Housing Structures in Atlantic City
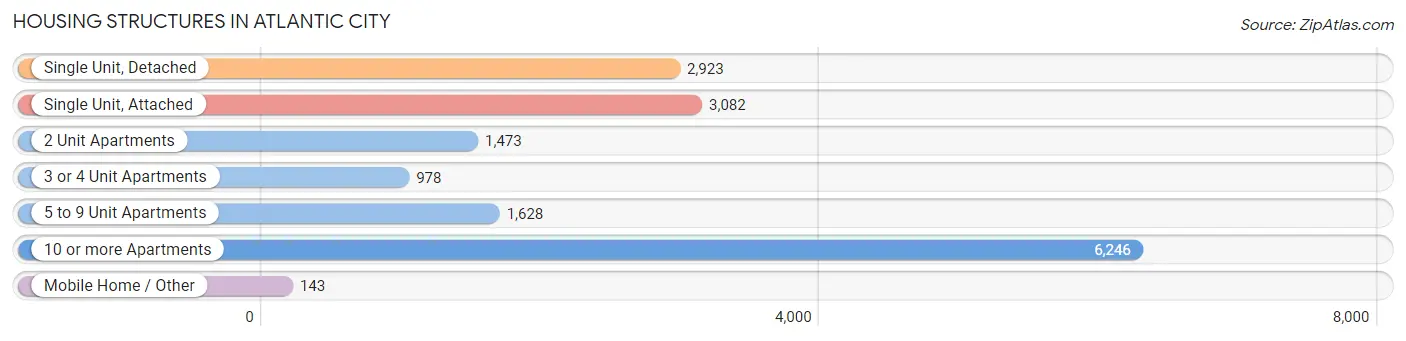
| Structure Type | # Housing Units | % Housing Units |
| Single Unit, Detached | 2,923 | 17.7% |
| Single Unit, Attached | 3,082 | 18.7% |
| 2 Unit Apartments | 1,473 | 8.9% |
| 3 or 4 Unit Apartments | 978 | 5.9% |
| 5 to 9 Unit Apartments | 1,628 | 9.9% |
| 10 or more Apartments | 6,246 | 37.9% |
| Mobile Home / Other | 143 | 0.9% |
| Total | 16,473 | 100.0% |
Housing Structures by Occupancy in Atlantic City
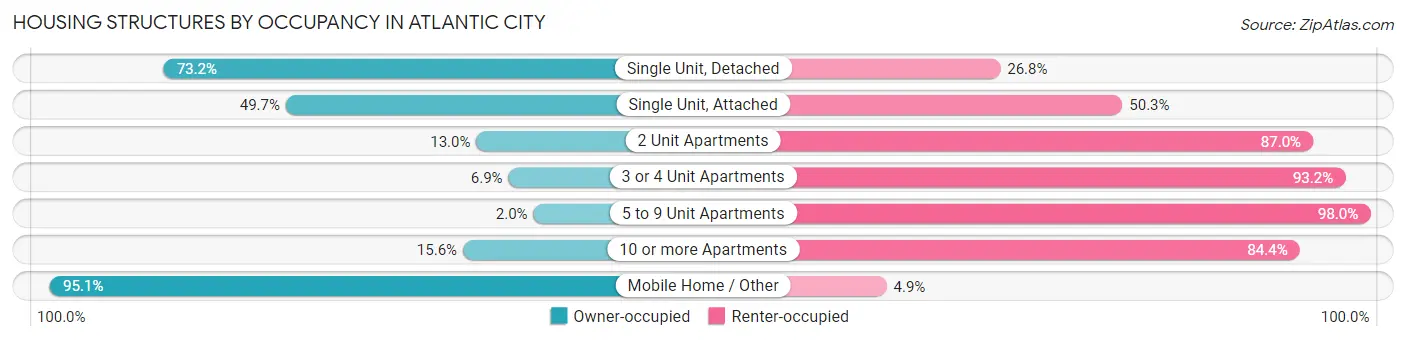
| Structure Type | Owner-occupied | Renter-occupied |
| Single Unit, Detached | 2,140 (73.2%) | 783 (26.8%) |
| Single Unit, Attached | 1,532 (49.7%) | 1,550 (50.3%) |
| 2 Unit Apartments | 192 (13.0%) | 1,281 (87.0%) |
| 3 or 4 Unit Apartments | 67 (6.9%) | 911 (93.1%) |
| 5 to 9 Unit Apartments | 33 (2.0%) | 1,595 (98.0%) |
| 10 or more Apartments | 975 (15.6%) | 5,271 (84.4%) |
| Mobile Home / Other | 136 (95.1%) | 7 (4.9%) |
| Total | 5,075 (30.8%) | 11,398 (69.2%) |
Housing Structures by Number of Rooms in Atlantic City
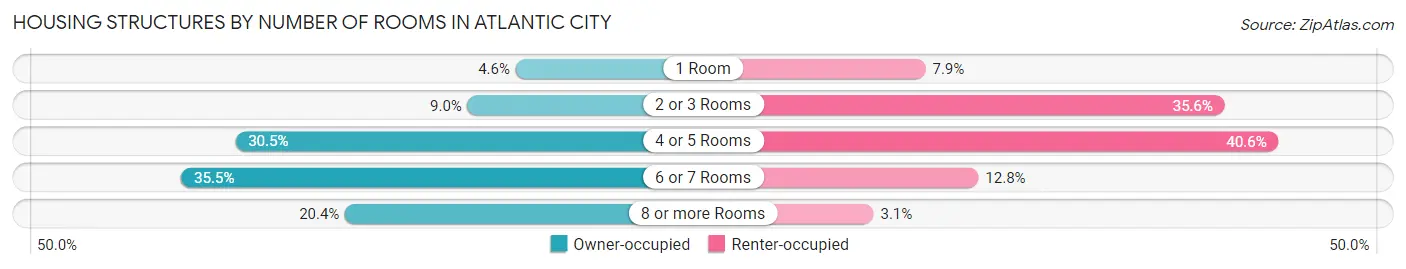
| Number of Rooms | Owner-occupied | Renter-occupied |
| 1 Room | 232 (4.6%) | 903 (7.9%) |
| 2 or 3 Rooms | 458 (9.0%) | 4,057 (35.6%) |
| 4 or 5 Rooms | 1,549 (30.5%) | 4,623 (40.6%) |
| 6 or 7 Rooms | 1,803 (35.5%) | 1,460 (12.8%) |
| 8 or more Rooms | 1,033 (20.3%) | 355 (3.1%) |
| Total | 5,075 (100.0%) | 11,398 (100.0%) |
Housing Structure by Heating Type in Atlantic City
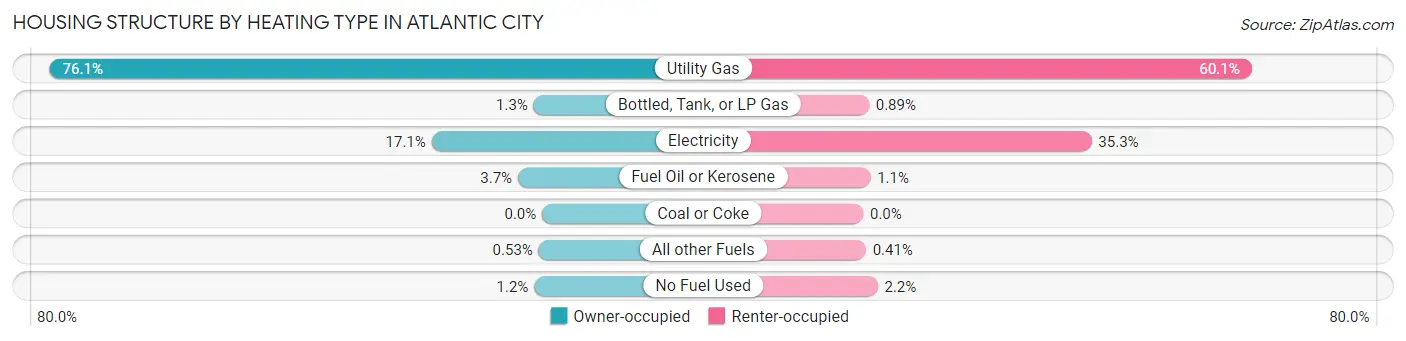
| Heating Type | Owner-occupied | Renter-occupied |
| Utility Gas | 3,863 (76.1%) | 6,844 (60.1%) |
| Bottled, Tank, or LP Gas | 66 (1.3%) | 102 (0.9%) |
| Electricity | 867 (17.1%) | 4,024 (35.3%) |
| Fuel Oil or Kerosene | 190 (3.7%) | 126 (1.1%) |
| Coal or Coke | 0 (0.0%) | 0 (0.0%) |
| All other Fuels | 27 (0.5%) | 47 (0.4%) |
| No Fuel Used | 62 (1.2%) | 255 (2.2%) |
| Total | 5,075 (100.0%) | 11,398 (100.0%) |
Household Vehicle Usage in Atlantic City
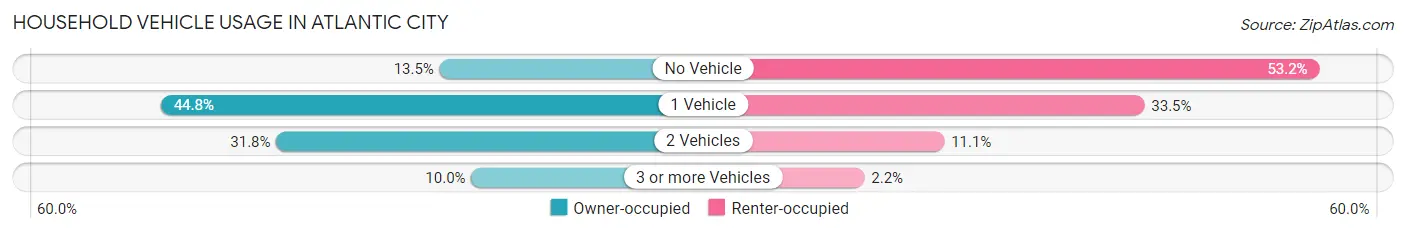
| Vehicles per Household | Owner-occupied | Renter-occupied |
| No Vehicle | 685 (13.5%) | 6,058 (53.1%) |
| 1 Vehicle | 2,271 (44.8%) | 3,823 (33.5%) |
| 2 Vehicles | 1,614 (31.8%) | 1,268 (11.1%) |
| 3 or more Vehicles | 505 (10.0%) | 249 (2.2%) |
| Total | 5,075 (100.0%) | 11,398 (100.0%) |
Real Estate & Mortgages in Atlantic City
Real Estate and Mortgage Overview in Atlantic City
| Characteristic | Without Mortgage | With Mortgage |
| Housing Units | 2,500 | 2,575 |
| Median Property Value | $176,600 | $170,300 |
| Median Household Income | $49,298 | $485 |
| Monthly Housing Costs | $920 | $278 |
| Real Estate Taxes | $5,342 | $17 |
Property Value by Mortgage Status in Atlantic City
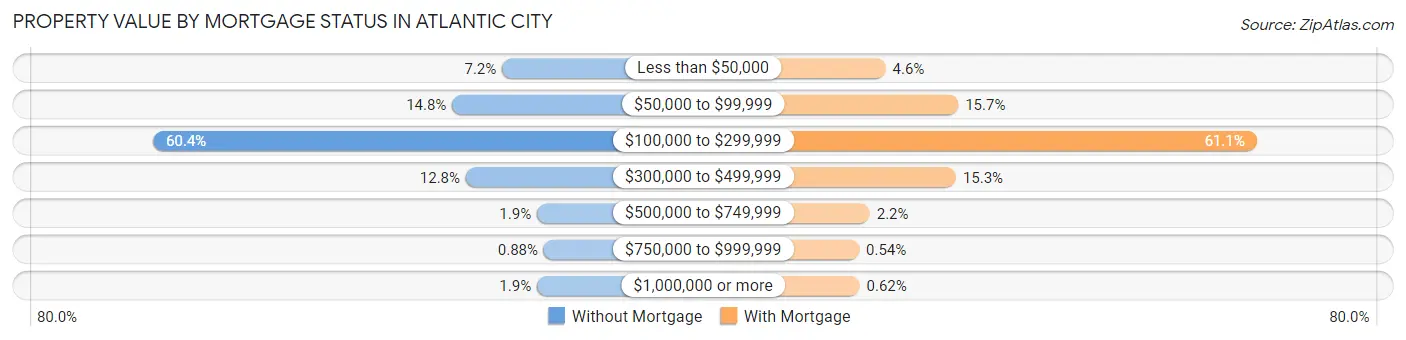
| Property Value | Without Mortgage | With Mortgage |
| Less than $50,000 | 181 (7.2%) | 118 (4.6%) |
| $50,000 to $99,999 | 371 (14.8%) | 403 (15.7%) |
| $100,000 to $299,999 | 1,511 (60.4%) | 1,574 (61.1%) |
| $300,000 to $499,999 | 319 (12.8%) | 394 (15.3%) |
| $500,000 to $749,999 | 48 (1.9%) | 56 (2.2%) |
| $750,000 to $999,999 | 22 (0.9%) | 14 (0.5%) |
| $1,000,000 or more | 48 (1.9%) | 16 (0.6%) |
| Total | 2,500 (100.0%) | 2,575 (100.0%) |
Household Income by Mortgage Status in Atlantic City
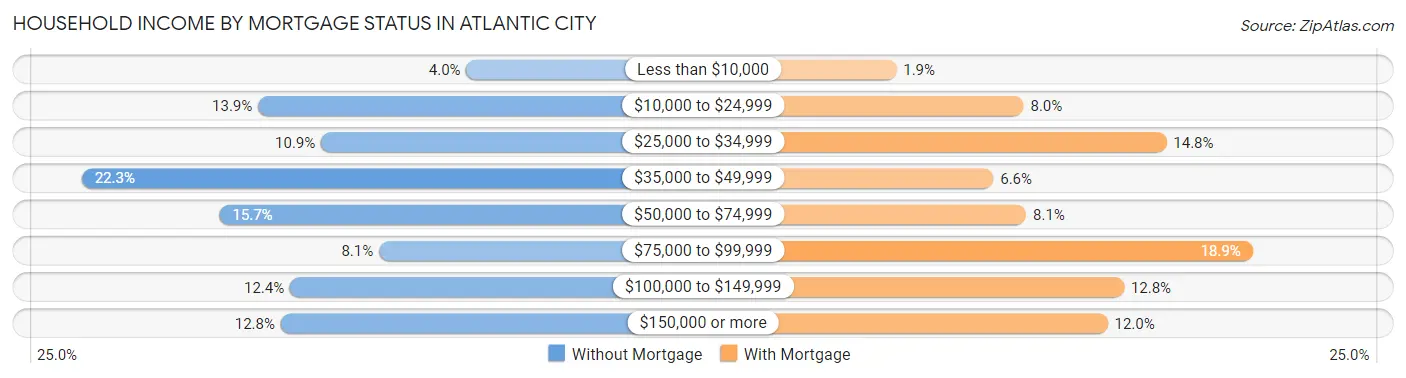
| Household Income | Without Mortgage | With Mortgage |
| Less than $10,000 | 99 (4.0%) | 50 (1.9%) |
| $10,000 to $24,999 | 347 (13.9%) | 206 (8.0%) |
| $25,000 to $34,999 | 272 (10.9%) | 381 (14.8%) |
| $35,000 to $49,999 | 557 (22.3%) | 169 (6.6%) |
| $50,000 to $74,999 | 393 (15.7%) | 209 (8.1%) |
| $75,000 to $99,999 | 203 (8.1%) | 487 (18.9%) |
| $100,000 to $149,999 | 309 (12.4%) | 329 (12.8%) |
| $150,000 or more | 320 (12.8%) | 309 (12.0%) |
| Total | 2,500 (100.0%) | 2,575 (100.0%) |
Property Value to Household Income Ratio in Atlantic City
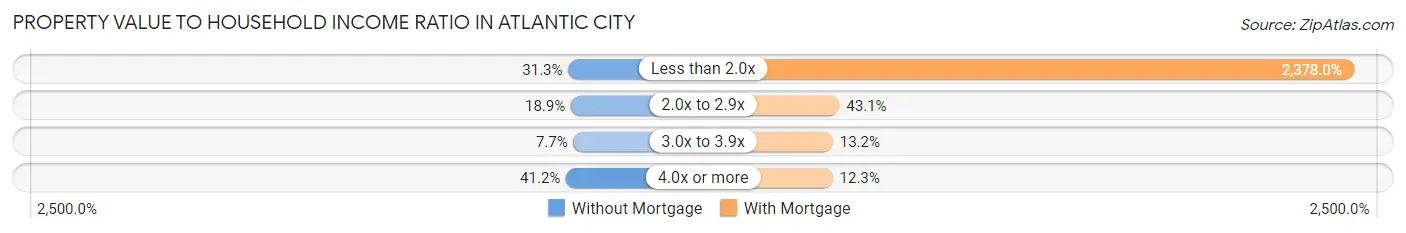
| Value-to-Income Ratio | Without Mortgage | With Mortgage |
| Less than 2.0x | 782 (31.3%) | 61,233 (2,378.0%) |
| 2.0x to 2.9x | 472 (18.9%) | 1,110 (43.1%) |
| 3.0x to 3.9x | 192 (7.7%) | 340 (13.2%) |
| 4.0x or more | 1,029 (41.2%) | 317 (12.3%) |
| Total | 2,500 (100.0%) | 2,575 (100.0%) |
Real Estate Taxes by Mortgage Status in Atlantic City

| Property Taxes | Without Mortgage | With Mortgage |
| Less than $800 | 0 (0.0%) | 142 (5.5%) |
| $800 to $1,499 | 66 (2.6%) | 24 (0.9%) |
| $800 to $1,499 | 2,232 (89.3%) | 49 (1.9%) |
| Total | 2,500 (100.0%) | 2,575 (100.0%) |
Health & Disability in Atlantic City
Health Insurance Coverage by Age in Atlantic City
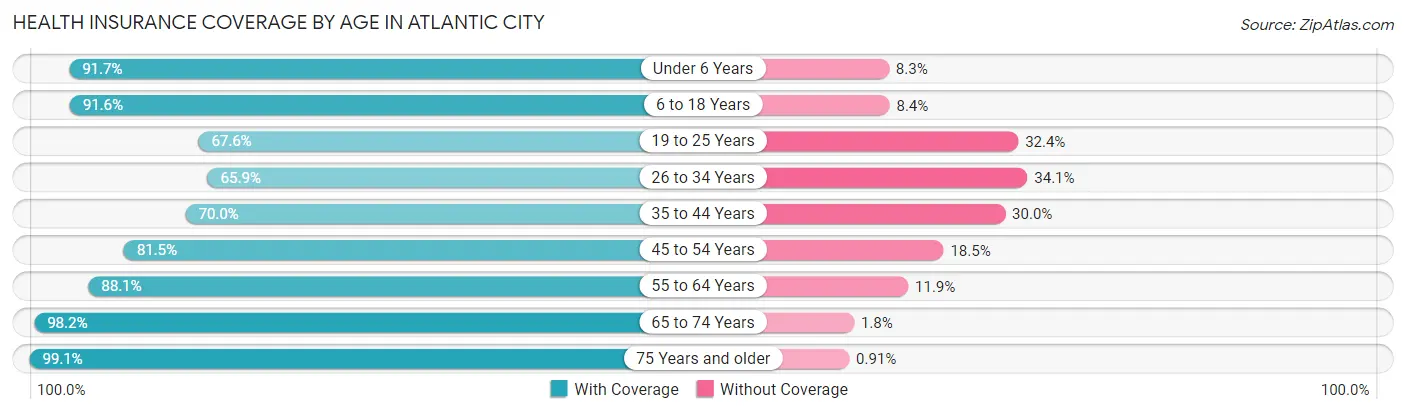
| Age Bracket | With Coverage | Without Coverage |
| Under 6 Years | 2,952 (91.7%) | 268 (8.3%) |
| 6 to 18 Years | 5,988 (91.6%) | 552 (8.4%) |
| 19 to 25 Years | 2,521 (67.6%) | 1,210 (32.4%) |
| 26 to 34 Years | 2,408 (65.9%) | 1,248 (34.1%) |
| 35 to 44 Years | 2,959 (70.0%) | 1,268 (30.0%) |
| 45 to 54 Years | 4,115 (81.5%) | 934 (18.5%) |
| 55 to 64 Years | 5,270 (88.1%) | 712 (11.9%) |
| 65 to 74 Years | 3,818 (98.2%) | 70 (1.8%) |
| 75 Years and older | 2,066 (99.1%) | 19 (0.9%) |
| Total | 32,097 (83.6%) | 6,281 (16.4%) |
Health Insurance Coverage by Citizenship Status in Atlantic City
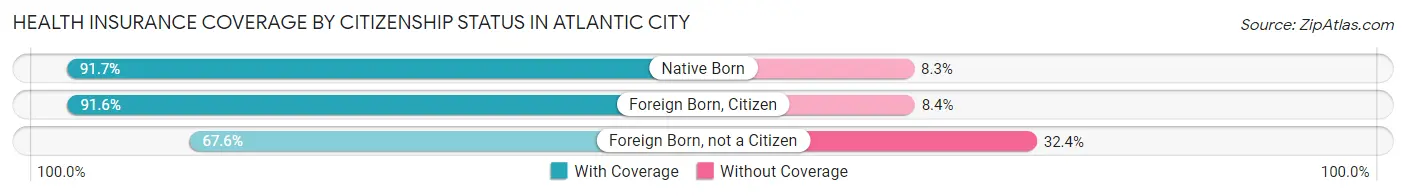
| Citizenship Status | With Coverage | Without Coverage |
| Native Born | 2,952 (91.7%) | 268 (8.3%) |
| Foreign Born, Citizen | 5,988 (91.6%) | 552 (8.4%) |
| Foreign Born, not a Citizen | 2,521 (67.6%) | 1,210 (32.4%) |
Health Insurance Coverage by Household Income in Atlantic City
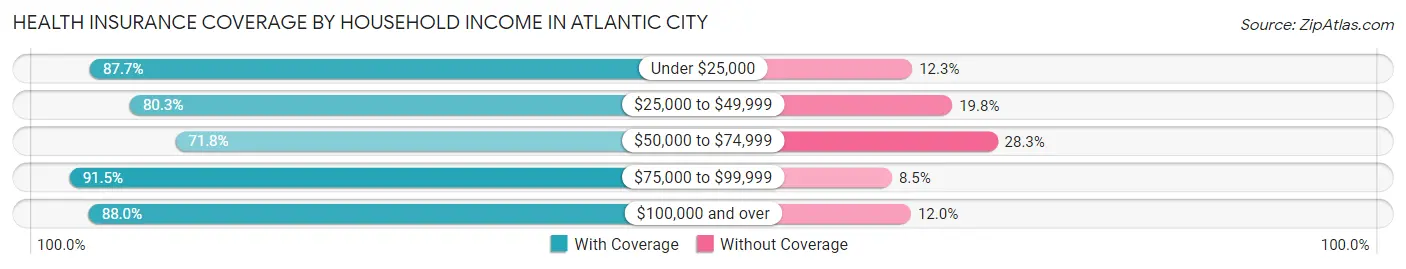
| Household Income | With Coverage | Without Coverage |
| Under $25,000 | 9,771 (87.7%) | 1,365 (12.3%) |
| $25,000 to $49,999 | 8,332 (80.2%) | 2,051 (19.8%) |
| $50,000 to $74,999 | 4,332 (71.8%) | 1,706 (28.2%) |
| $75,000 to $99,999 | 3,495 (91.5%) | 323 (8.5%) |
| $100,000 and over | 5,793 (88.0%) | 792 (12.0%) |
Public vs Private Health Insurance Coverage by Age in Atlantic City
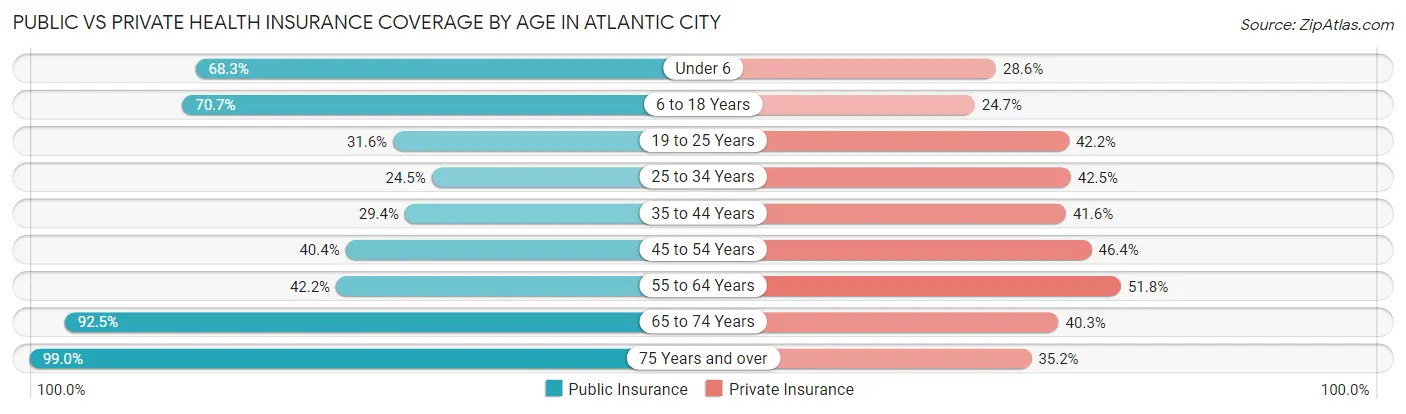
| Age Bracket | Public Insurance | Private Insurance |
| Under 6 | 2,198 (68.3%) | 922 (28.6%) |
| 6 to 18 Years | 4,625 (70.7%) | 1,615 (24.7%) |
| 19 to 25 Years | 1,180 (31.6%) | 1,573 (42.2%) |
| 25 to 34 Years | 894 (24.4%) | 1,554 (42.5%) |
| 35 to 44 Years | 1,244 (29.4%) | 1,759 (41.6%) |
| 45 to 54 Years | 2,042 (40.4%) | 2,340 (46.4%) |
| 55 to 64 Years | 2,525 (42.2%) | 3,100 (51.8%) |
| 65 to 74 Years | 3,597 (92.5%) | 1,565 (40.3%) |
| 75 Years and over | 2,065 (99.0%) | 734 (35.2%) |
| Total | 20,370 (53.1%) | 15,162 (39.5%) |
Disability Status by Sex by Age in Atlantic City
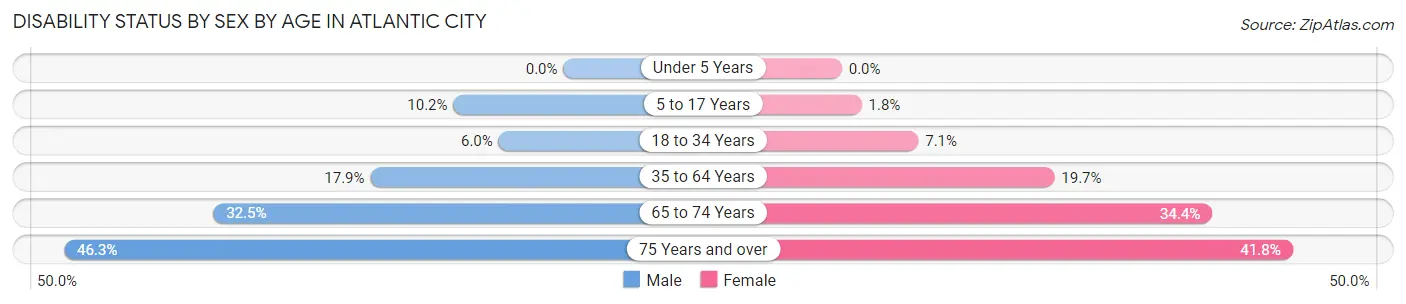
| Age Bracket | Male | Female |
| Under 5 Years | 0 (0.0%) | 0 (0.0%) |
| 5 to 17 Years | 350 (10.2%) | 59 (1.8%) |
| 18 to 34 Years | 239 (6.0%) | 266 (7.1%) |
| 35 to 64 Years | 1,355 (17.9%) | 1,518 (19.7%) |
| 65 to 74 Years | 644 (32.5%) | 655 (34.4%) |
| 75 Years and over | 348 (46.3%) | 558 (41.8%) |
Disability Class by Sex by Age in Atlantic City
Disability Class: Hearing Difficulty
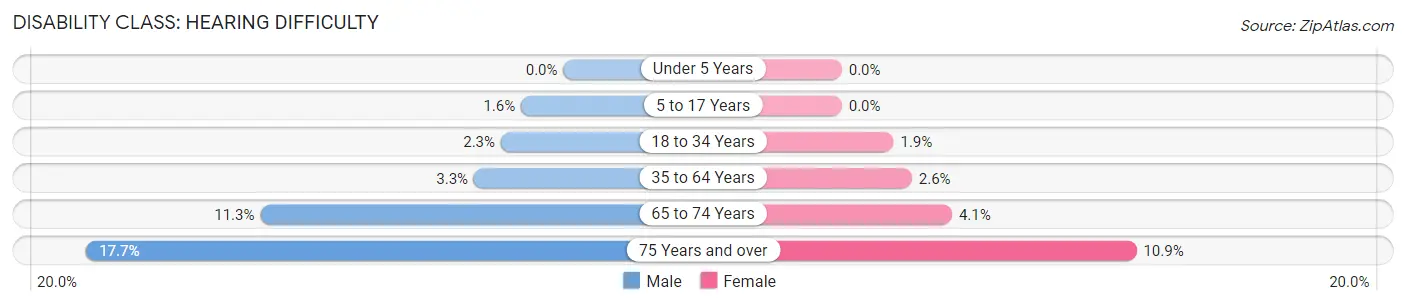
| Age Bracket | Male | Female |
| Under 5 Years | 0 (0.0%) | 0 (0.0%) |
| 5 to 17 Years | 54 (1.6%) | 0 (0.0%) |
| 18 to 34 Years | 92 (2.3%) | 72 (1.9%) |
| 35 to 64 Years | 251 (3.3%) | 200 (2.6%) |
| 65 to 74 Years | 223 (11.3%) | 78 (4.1%) |
| 75 Years and over | 133 (17.7%) | 146 (10.9%) |
Disability Class: Vision Difficulty
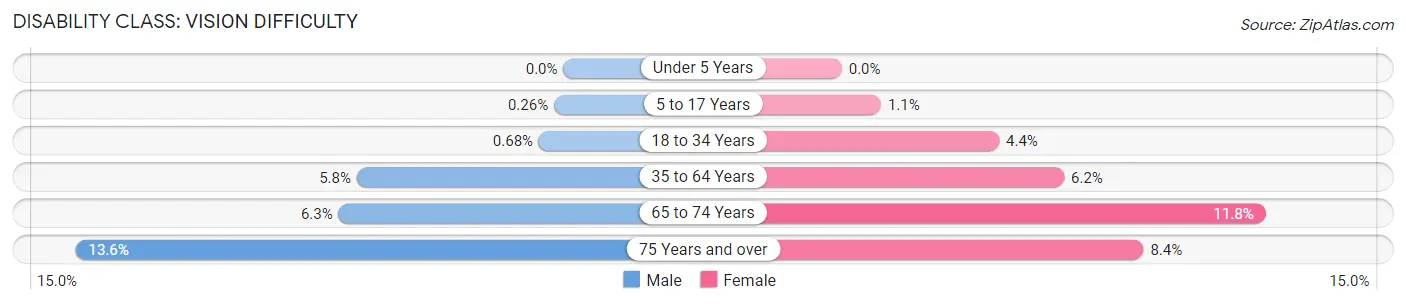
| Age Bracket | Male | Female |
| Under 5 Years | 0 (0.0%) | 0 (0.0%) |
| 5 to 17 Years | 9 (0.3%) | 35 (1.1%) |
| 18 to 34 Years | 27 (0.7%) | 164 (4.4%) |
| 35 to 64 Years | 435 (5.8%) | 476 (6.2%) |
| 65 to 74 Years | 124 (6.3%) | 225 (11.8%) |
| 75 Years and over | 102 (13.6%) | 112 (8.4%) |
Disability Class: Cognitive Difficulty
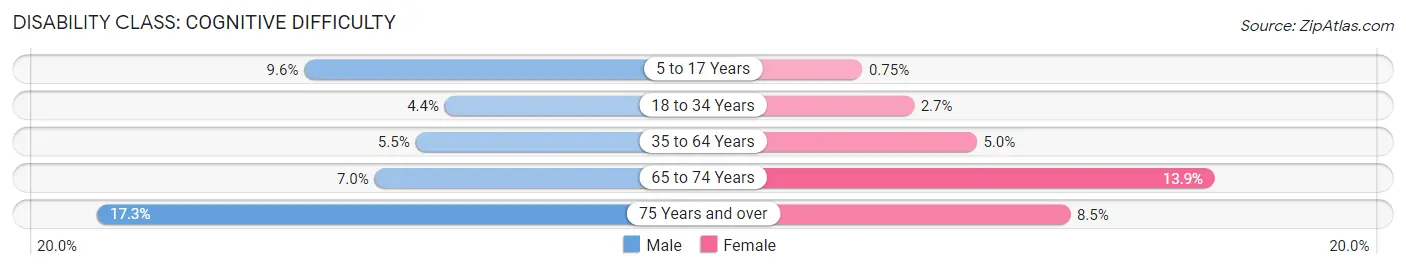
| Age Bracket | Male | Female |
| 5 to 17 Years | 330 (9.6%) | 24 (0.7%) |
| 18 to 34 Years | 175 (4.4%) | 100 (2.7%) |
| 35 to 64 Years | 415 (5.5%) | 385 (5.0%) |
| 65 to 74 Years | 139 (7.0%) | 264 (13.9%) |
| 75 Years and over | 130 (17.3%) | 113 (8.5%) |
Disability Class: Ambulatory Difficulty
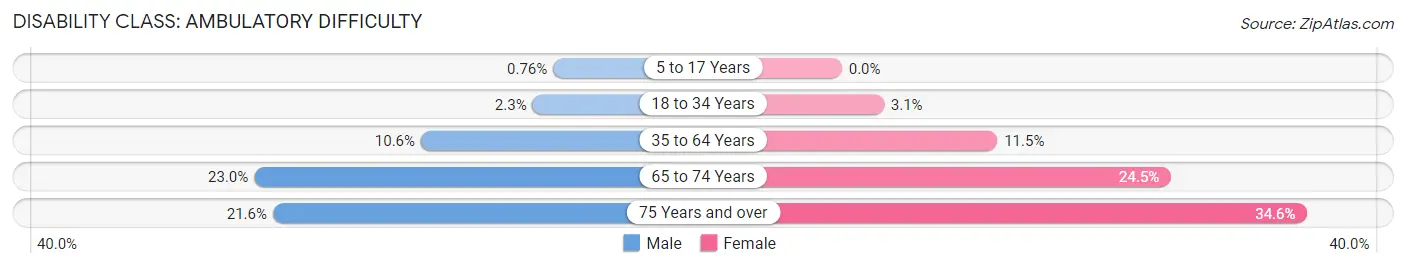
| Age Bracket | Male | Female |
| 5 to 17 Years | 26 (0.8%) | 0 (0.0%) |
| 18 to 34 Years | 91 (2.3%) | 117 (3.1%) |
| 35 to 64 Years | 800 (10.6%) | 888 (11.5%) |
| 65 to 74 Years | 455 (23.0%) | 466 (24.4%) |
| 75 Years and over | 162 (21.6%) | 461 (34.6%) |
Disability Class: Self-Care Difficulty
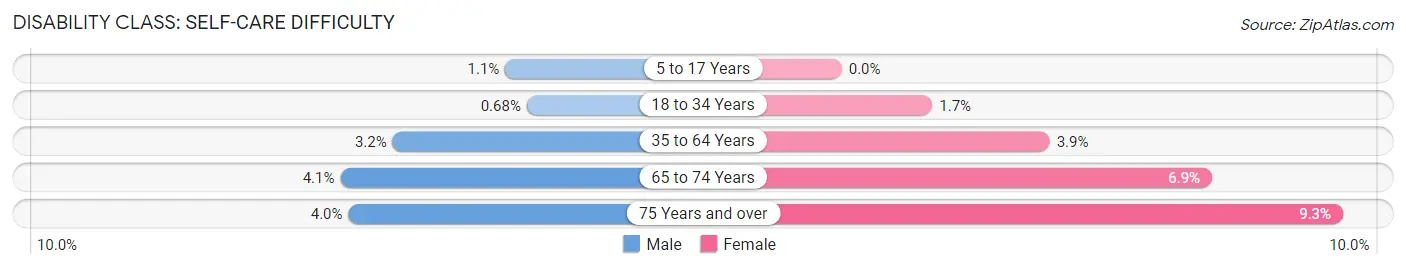
| Age Bracket | Male | Female |
| 5 to 17 Years | 37 (1.1%) | 0 (0.0%) |
| 18 to 34 Years | 27 (0.7%) | 63 (1.7%) |
| 35 to 64 Years | 240 (3.2%) | 297 (3.9%) |
| 65 to 74 Years | 82 (4.1%) | 131 (6.9%) |
| 75 Years and over | 30 (4.0%) | 124 (9.3%) |
Technology Access in Atlantic City
Computing Device Access in Atlantic City
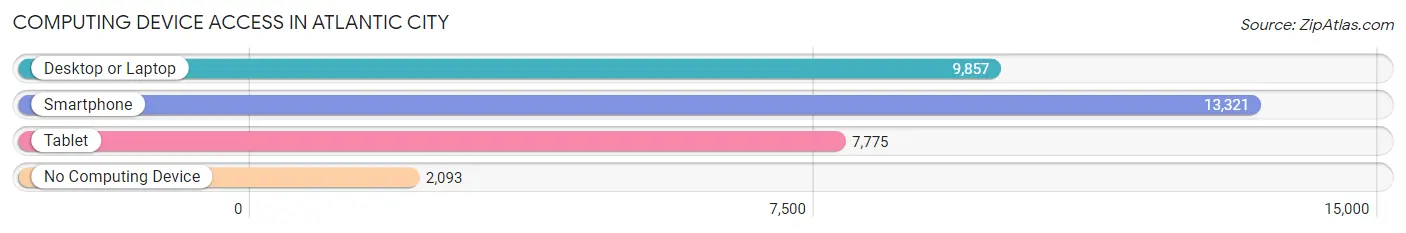
| Device Type | # Households | % Households |
| Desktop or Laptop | 9,857 | 59.8% |
| Smartphone | 13,321 | 80.9% |
| Tablet | 7,775 | 47.2% |
| No Computing Device | 2,093 | 12.7% |
| Total | 16,473 | 100.0% |
Internet Access in Atlantic City
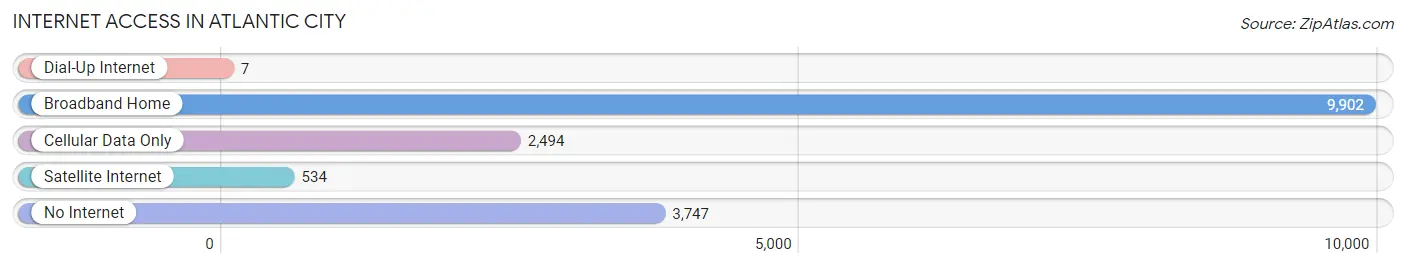
| Internet Type | # Households | % Households |
| Dial-Up Internet | 7 | 0.0% |
| Broadband Home | 9,902 | 60.1% |
| Cellular Data Only | 2,494 | 15.1% |
| Satellite Internet | 534 | 3.2% |
| No Internet | 3,747 | 22.8% |
| Total | 16,473 | 100.0% |
Atlantic City Summary
Atlantic City, NJ is a city located in Atlantic County, New Jersey, United States. It is situated on Absecon Island, along the Atlantic Ocean, and is the county seat of Atlantic County. The city is known for its boardwalk, casinos, and beaches. As of the 2010 United States Census, the city had a population of 39,558.
Geography
Atlantic City is located at 39°21'N 74°25'W (39.35, -74.42). It is situated on Absecon Island, along the Atlantic Ocean, and is the county seat of Atlantic County. The city is bordered to the north by Ventnor City, to the east by Margate City, to the south by Longport Borough, and to the west by Pleasantville. The city is approximately 8 miles (13 km) south of Absecon, 15 miles (24 km) southeast of Vineland, and 25 miles (40 km) east of Philadelphia.
The city has a total area of 11.1 square miles (28.7 km2), of which 10.3 square miles (26.7 km2) is land and 0.8 square miles (2.0 km2) is water. The city is located on a barrier island, and is surrounded by the Atlantic Ocean to the east and the back bays of the mainland to the west.
History
Atlantic City was founded in 1854 by Richard Osborne and Dr. Jonathan Pitney. The city was originally intended to be a health resort, and was named after the oceanfront boardwalk that was built in 1870. The city quickly became a popular destination for vacationers, and by the early 1900s, it had become a major tourist destination.
In the 1920s, the city was known as the "Playground of the Nation," and was home to numerous casinos, hotels, and other attractions. The city was also home to the Miss America pageant from 1921 to 2005.
In 1978, the city legalized gambling, and the first casino opened in 1979. This led to a major revitalization of the city, and by the 1990s, Atlantic City had become the second-largest gambling destination in the United States, behind Las Vegas.
Economy
Atlantic City's economy is largely based on tourism and gambling. The city is home to numerous casinos, hotels, restaurants, and other attractions. The city is also home to the Atlantic City Convention Center, which hosts numerous conventions and events throughout the year.
The city's unemployment rate was 8.2% in 2019, which is higher than the national average of 3.7%. The median household income in Atlantic City was $37,845 in 2019, which is lower than the national average of $61,937.
Demographics
As of the 2010 United States Census, there were 39,558 people, 16,845 households, and 9,845 families residing in the city. The population density was 3,845.3 people per square mile (1,484.2/km2). There were 20,845 housing units at an average density of 2,019.2 per square mile (779.2/km2). The racial makeup of the city was 54.2% White, 33.2% African American, 0.3% Native American, 1.7% Asian, 0.1% Pacific Islander, 8.2% from other races, and 2.3% from two or more races. Hispanic or Latino of any race were 15.3% of the population.
The median age in the city was 38.3 years. 22.2% of residents were under the age of 18; 10.2% were between the ages of 18 and 24; 25.7% were from 25 to 44; 27.2% were from 45 to 64; and 14.7% were 65 years of age or older. The gender makeup of the city was 48.2% male and 51.8% female.
Conclusion
Atlantic City, NJ is a city located in Atlantic County, New Jersey, United States. It is situated on Absecon Island, along the Atlantic Ocean, and is the county seat of Atlantic County. The city is known for its boardwalk, casinos, and beaches. As of the 2010 United States Census, the city had a population of 39,558. The city's economy is largely based on tourism and gambling, and the city is home to numerous casinos, hotels, restaurants, and other attractions. The city's population is diverse, with 54.2% White, 33.2% African American, 0.3% Native American, 1.7% Asian, 0.1% Pacific Islander, 8.2% from other races, and 2.3% from two or more races. The median age in the city was 38.3 years, and the median household income was $37,845 in 2019.
Common Questions
What is Per Capita Income in Atlantic City?
Per Capita income in Atlantic City is $24,172.
What is the Median Family Income in Atlantic City?
Median Family Income in Atlantic City is $38,992.
What is the Median Household income in Atlantic City?
Median Household Income in Atlantic City is $35,188.
What is Income or Wage Gap in Atlantic City?
Income or Wage Gap in Atlantic City is 12.3%.
Women in Atlantic City earn 87.7 cents for every dollar earned by a man.
What is Family Income Deficit in Atlantic City?
Family Income Deficit in Atlantic City is $8,893.
Families that are below poverty line in Atlantic City earn $8,893 less on average than the poverty threshold level.
What is Inequality or Gini Index in Atlantic City?
Inequality or Gini Index in Atlantic City is 0.53.
What is the Total Population of Atlantic City?
Total Population of Atlantic City is 38,487.
What is the Total Male Population of Atlantic City?
Total Male Population of Atlantic City is 19,117.
What is the Total Female Population of Atlantic City?
Total Female Population of Atlantic City is 19,370.
What is the Ratio of Males per 100 Females in Atlantic City?
There are 98.69 Males per 100 Females in Atlantic City.
What is the Ratio of Females per 100 Males in Atlantic City?
There are 101.32 Females per 100 Males in Atlantic City.
What is the Median Population Age in Atlantic City?
Median Population Age in Atlantic City is 39.5 Years.
What is the Average Family Size in Atlantic City
Average Family Size in Atlantic City is 3.1 People.
What is the Average Household Size in Atlantic City
Average Household Size in Atlantic City is 2.3 People.
How Large is the Labor Force in Atlantic City?
There are 17,803 People in the Labor Forcein in Atlantic City.
What is the Percentage of People in the Labor Force in Atlantic City?
58.6% of People are in the Labor Force in Atlantic City.
What is the Unemployment Rate in Atlantic City?
Unemployment Rate in Atlantic City is 13.1%.