Zip Codes with the Highest Percentage of Population Employed in Food Preparation & Serving in Paterson, NJ
RELATED REPORTS & OPTIONS
Food Preparation & Serving
Paterson
Compare Zip Codes
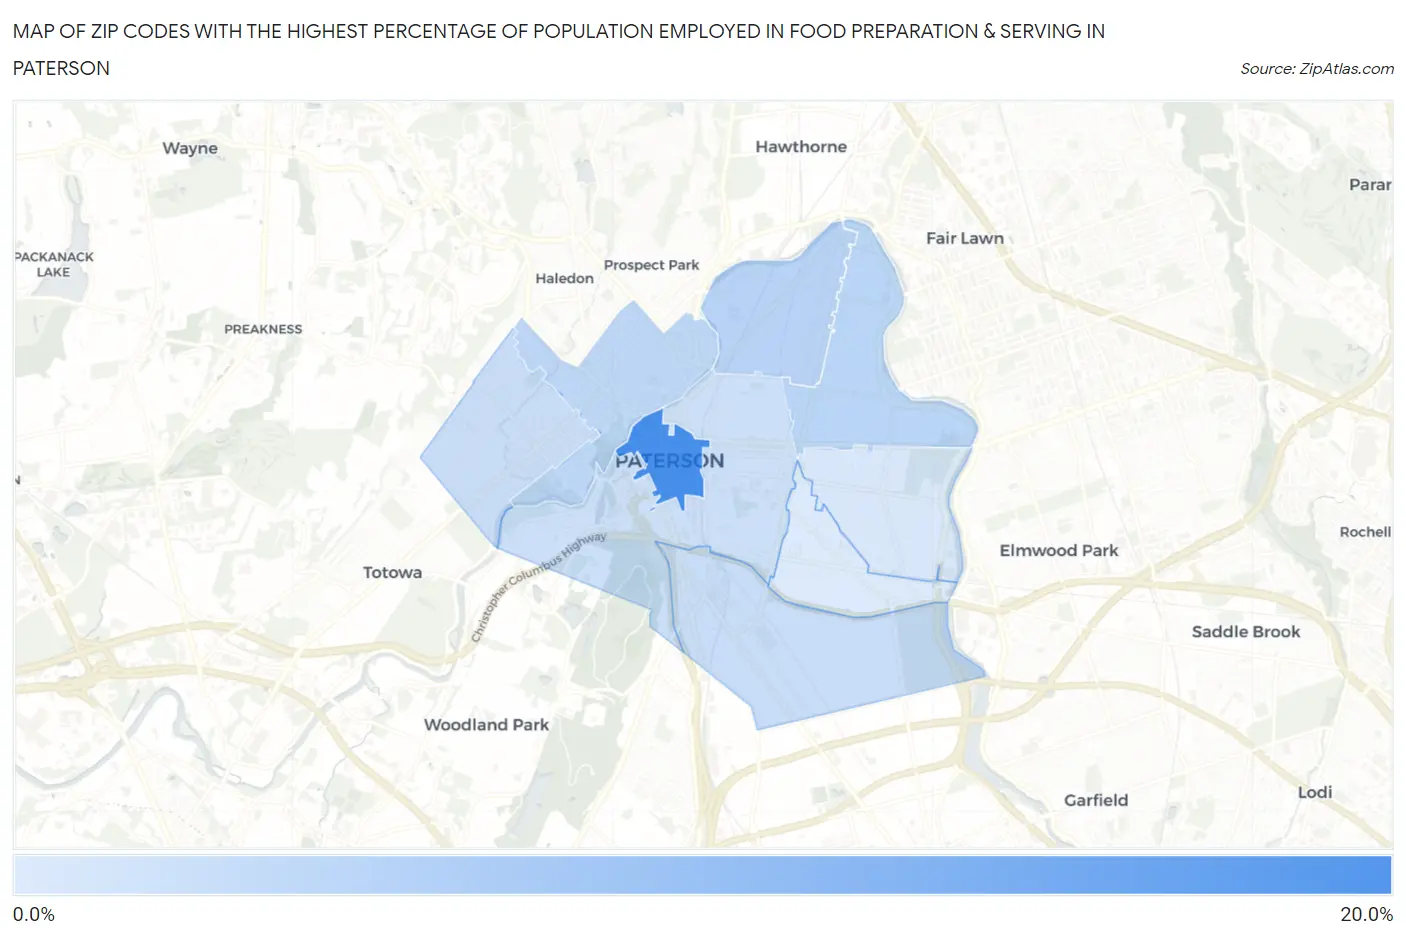
Map of Zip Codes with the Highest Percentage of Population Employed in Food Preparation & Serving in Paterson
2.8%
17.7%
Zip Codes with the Highest Percentage of Population Employed in Food Preparation & Serving in Paterson, NJ
| Zip Code | % Employed | vs State | vs National | |
| 1. | 07505 | 17.7% | 4.0%(+13.7)#2 | 5.3%(+12.4)#684 |
| 2. | 07524 | 6.2% | 4.0%(+2.24)#77 | 5.3%(+0.917)#8,717 |
| 3. | 07514 | 6.2% | 4.0%(+2.23)#78 | 5.3%(+0.902)#8,771 |
| 4. | 07522 | 5.6% | 4.0%(+1.66)#102 | 5.3%(+0.333)#10,644 |
| 5. | 07503 | 4.7% | 4.0%(+0.722)#155 | 5.3%(-0.601)#14,219 |
| 6. | 07502 | 4.6% | 4.0%(+0.633)#163 | 5.3%(-0.691)#14,621 |
| 7. | 07501 | 4.3% | 4.0%(+0.356)#190 | 5.3%(-0.968)#15,803 |
| 8. | 07504 | 3.3% | 4.0%(-0.693)#298 | 5.3%(-2.02)#20,205 |
| 9. | 07513 | 2.8% | 4.0%(-1.11)#355 | 5.3%(-2.44)#21,860 |
1
Common Questions
What are the Top 5 Zip Codes with the Highest Percentage of Population Employed in Food Preparation & Serving in Paterson, NJ?
Top 5 Zip Codes with the Highest Percentage of Population Employed in Food Preparation & Serving in Paterson, NJ are:
What zip code has the Highest Percentage of Population Employed in Food Preparation & Serving in Paterson, NJ?
07505 has the Highest Percentage of Population Employed in Food Preparation & Serving in Paterson, NJ with 17.7%.
What is the Percentage of Population Employed in Food Preparation & Serving in Paterson, NJ?
Percentage of Population Employed in Food Preparation & Serving in Paterson is 5.0%.
What is the Percentage of Population Employed in Food Preparation & Serving in New Jersey?
Percentage of Population Employed in Food Preparation & Serving in New Jersey is 4.0%.
What is the Percentage of Population Employed in Food Preparation & Serving in the United States?
Percentage of Population Employed in Food Preparation & Serving in the United States is 5.3%.