Lebanon borough, NJ Map & Demographics
Lebanon borough Overview
$63,113
PER CAPITA INCOME
$160,469
AVG FAMILY INCOME
$106,389
AVG HOUSEHOLD INCOME
42.4%
WAGE / INCOME GAP [ % ]
57.6¢/ $1
WAGE / INCOME GAP [ $ ]
0.45
INEQUALITY / GINI INDEX
1,864
TOTAL POPULATION
768
MALE POPULATION
1,096
FEMALE POPULATION
70.07
MALES / 100 FEMALES
142.71
FEMALES / 100 MALES
41.3
MEDIAN AGE
3.1
AVG FAMILY SIZE
2.4
AVG HOUSEHOLD SIZE
1,129
LABOR FORCE [ PEOPLE ]
71.4%
PERCENT IN LABOR FORCE
2.8%
UNEMPLOYMENT RATE
Income in Lebanon borough
Income Overview in Lebanon borough
Per Capita Income in Lebanon borough is $63,113, while median incomes of families and households are $160,469 and $106,389 respectively.
| Characteristic | Number | Measure |
| Per Capita Income | 1,864 | $63,113 |
| Median Family Income | 469 | $160,469 |
| Mean Family Income | 469 | $184,362 |
| Median Household Income | 780 | $106,389 |
| Mean Household Income | 780 | $148,488 |
| Income Deficit | 469 | $0 |
| Wage / Income Gap (%) | 1,864 | 42.39% |
| Wage / Income Gap ($) | 1,864 | 57.61¢ per $1 |
| Gini / Inequality Index | 1,864 | 0.45 |
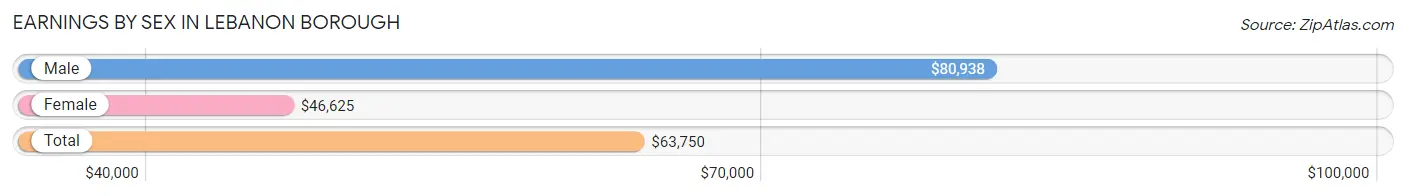
Earnings by Sex in Lebanon borough
Average Earnings in Lebanon borough are $63,750, $80,938 for men and $46,625 for women, a difference of 42.4%.
| Sex | Number | Average Earnings |
| Male | 568 (48.0%) | $80,938 |
| Female | 614 (51.9%) | $46,625 |
| Total | 1,182 (100.0%) | $63,750 |
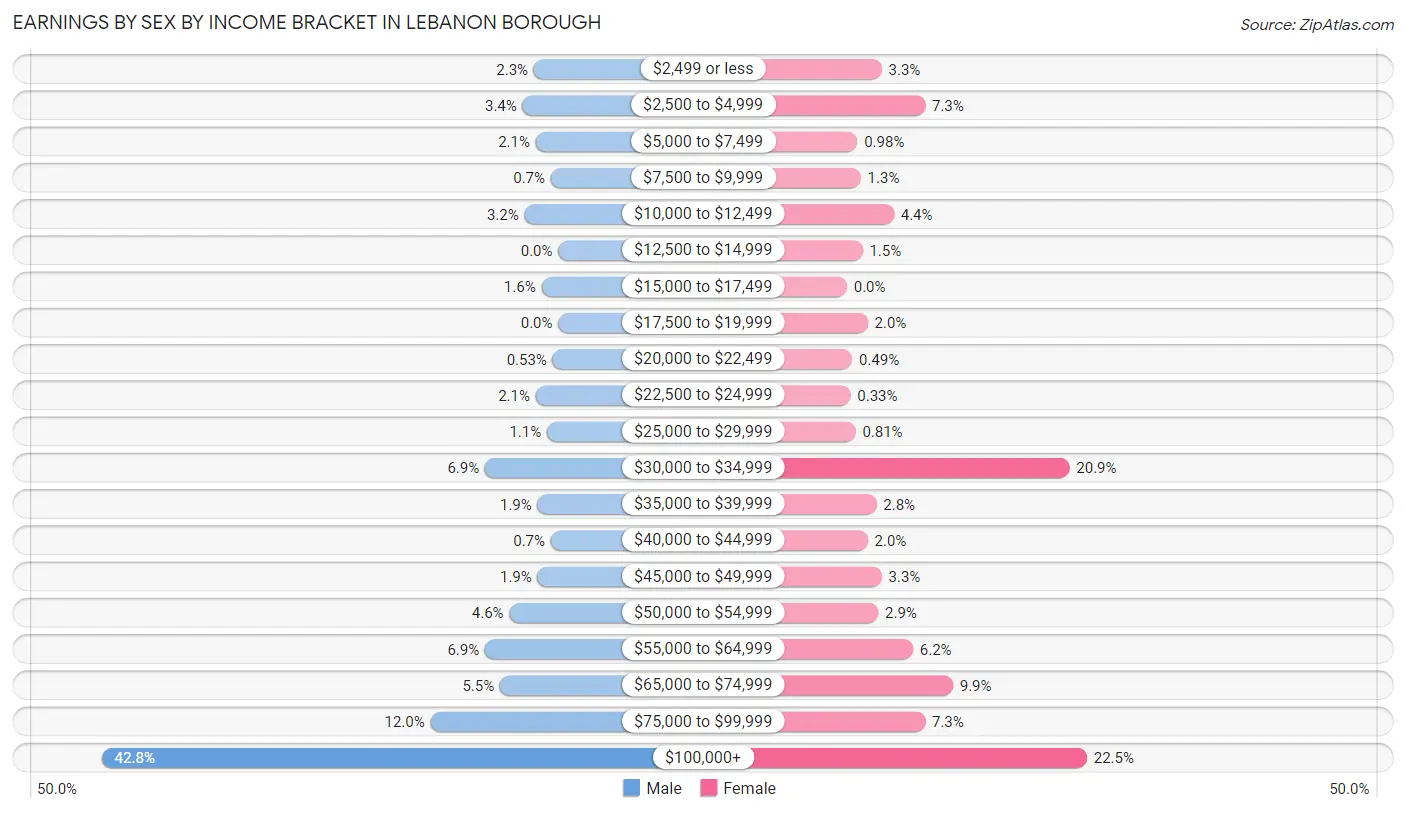
Earnings by Sex by Income Bracket in Lebanon borough
The most common earnings brackets in Lebanon borough are $100,000+ for men (243 | 42.8%) and $100,000+ for women (138 | 22.5%).
| Income | Male | Female |
| $2,499 or less | 13 (2.3%) | 20 (3.3%) |
| $2,500 to $4,999 | 19 (3.4%) | 45 (7.3%) |
| $5,000 to $7,499 | 12 (2.1%) | 6 (1.0%) |
| $7,500 to $9,999 | 4 (0.7%) | 8 (1.3%) |
| $10,000 to $12,499 | 18 (3.2%) | 27 (4.4%) |
| $12,500 to $14,999 | 0 (0.0%) | 9 (1.5%) |
| $15,000 to $17,499 | 9 (1.6%) | 0 (0.0%) |
| $17,500 to $19,999 | 0 (0.0%) | 12 (1.9%) |
| $20,000 to $22,499 | 3 (0.5%) | 3 (0.5%) |
| $22,500 to $24,999 | 12 (2.1%) | 2 (0.3%) |
| $25,000 to $29,999 | 6 (1.1%) | 5 (0.8%) |
| $30,000 to $34,999 | 39 (6.9%) | 128 (20.8%) |
| $35,000 to $39,999 | 11 (1.9%) | 17 (2.8%) |
| $40,000 to $44,999 | 4 (0.7%) | 12 (1.9%) |
| $45,000 to $49,999 | 11 (1.9%) | 20 (3.3%) |
| $50,000 to $54,999 | 26 (4.6%) | 18 (2.9%) |
| $55,000 to $64,999 | 39 (6.9%) | 38 (6.2%) |
| $65,000 to $74,999 | 31 (5.5%) | 61 (9.9%) |
| $75,000 to $99,999 | 68 (12.0%) | 45 (7.3%) |
| $100,000+ | 243 (42.8%) | 138 (22.5%) |
| Total | 568 (100.0%) | 614 (100.0%) |
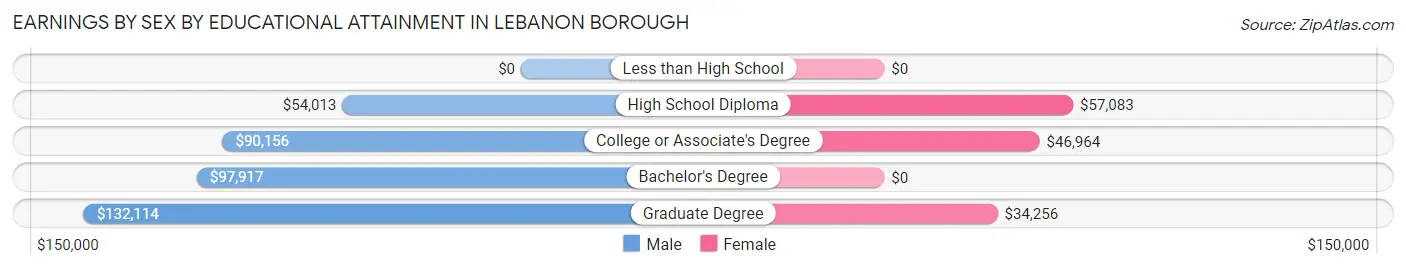
Earnings by Sex by Educational Attainment in Lebanon borough
Average earnings in Lebanon borough are $99,167 for men and $54,643 for women, a difference of 44.9%. Men with an educational attainment of graduate degree enjoy the highest average annual earnings of $132,114, while those with high school diploma education earn the least with $54,013. Women with an educational attainment of high school diploma earn the most with the average annual earnings of $57,083, while those with graduate degree education have the smallest earnings of $34,256.
| Educational Attainment | Male Income | Female Income |
| Less than High School | - | - |
| High School Diploma | $54,013 | $57,083 |
| College or Associate's Degree | $90,156 | $46,964 |
| Bachelor's Degree | $97,917 | $0 |
| Graduate Degree | $132,114 | $34,256 |
| Total | $99,167 | $54,643 |
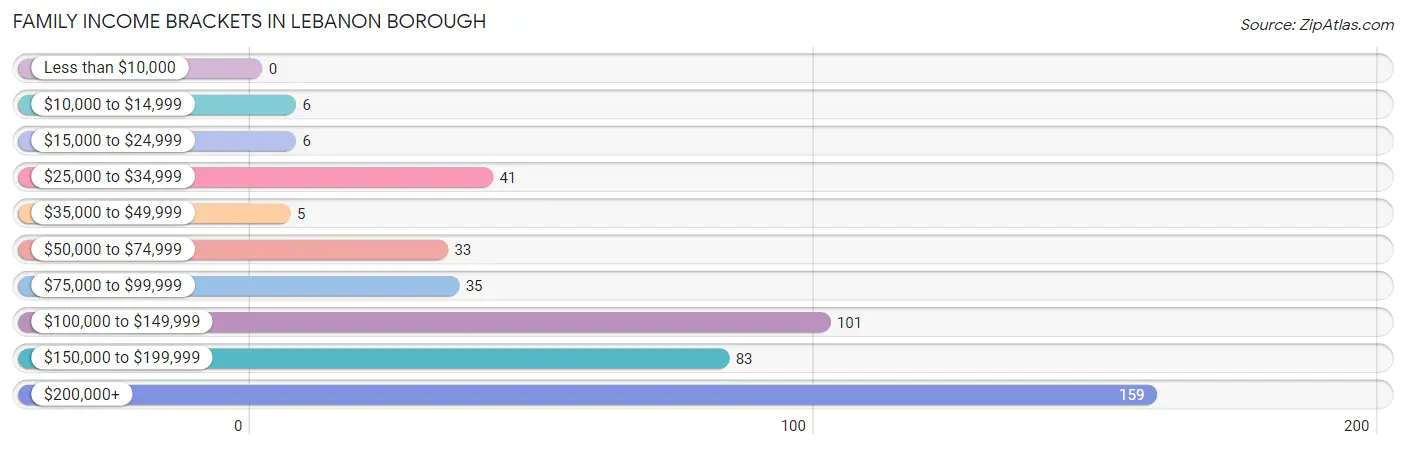
Family Income in Lebanon borough
Family Income Brackets in Lebanon borough
According to the Lebanon borough family income data, there are 159 families falling into the $200,000+ income range, which is the most common income bracket and makes up 33.9% of all families.
| Income Bracket | # Families | % Families |
| Less than $10,000 | 0 | 0.0% |
| $10,000 to $14,999 | 6 | 1.3% |
| $15,000 to $24,999 | 6 | 1.3% |
| $25,000 to $34,999 | 41 | 8.7% |
| $35,000 to $49,999 | 5 | 1.1% |
| $50,000 to $74,999 | 33 | 7.0% |
| $75,000 to $99,999 | 35 | 7.5% |
| $100,000 to $149,999 | 101 | 21.5% |
| $150,000 to $199,999 | 83 | 17.7% |
| $200,000+ | 159 | 33.9% |
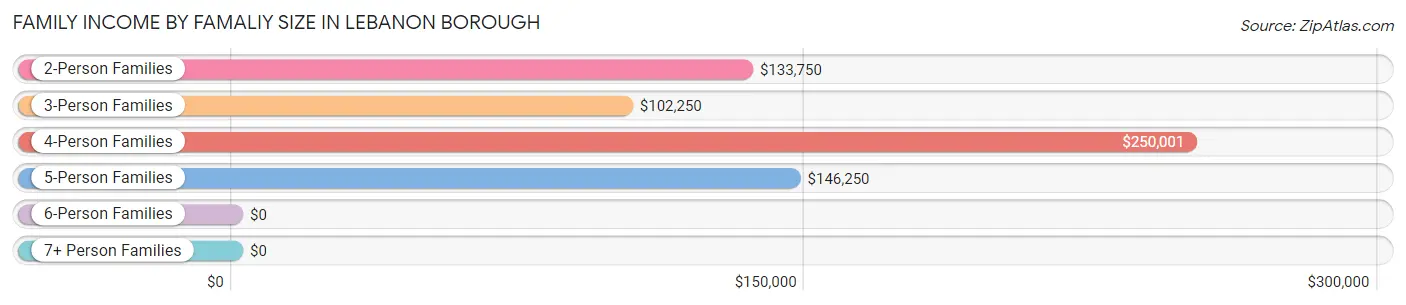
Family Income by Famaliy Size in Lebanon borough
4-person families (166 | 35.4%) account for the highest median family income in Lebanon borough with $250,001 per family, while 2-person families (179 | 38.2%) have the highest median income of $66,875 per family member.
| Income Bracket | # Families | Median Income |
| 2-Person Families | 179 (38.2%) | $133,750 |
| 3-Person Families | 112 (23.9%) | $102,250 |
| 4-Person Families | 166 (35.4%) | $250,001 |
| 5-Person Families | 9 (1.9%) | $146,250 |
| 6-Person Families | 0 (0.0%) | $0 |
| 7+ Person Families | 3 (0.6%) | $0 |
| Total | 469 (100.0%) | $160,469 |
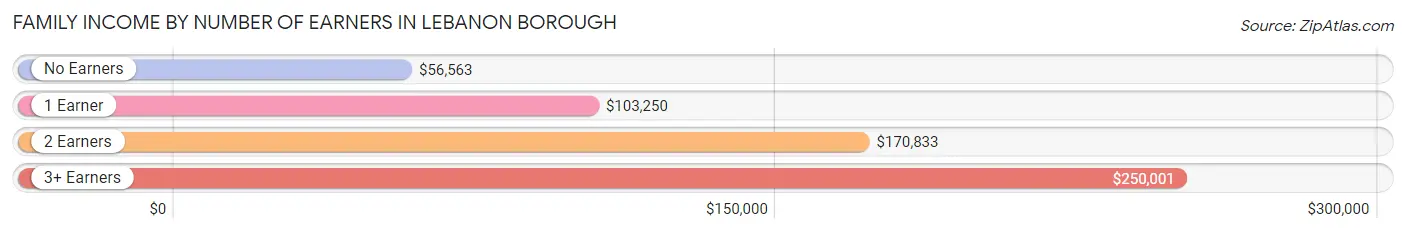
Family Income by Number of Earners in Lebanon borough
The median family income in Lebanon borough is $160,469, with families comprising 3+ earners (132) having the highest median family income of $250,001, while families with no earners (34) have the lowest median family income of $56,563, accounting for 28.1% and 7.2% of families, respectively.
| Number of Earners | # Families | Median Income |
| No Earners | 34 (7.2%) | $56,563 |
| 1 Earner | 135 (28.8%) | $103,250 |
| 2 Earners | 168 (35.8%) | $170,833 |
| 3+ Earners | 132 (28.1%) | $250,001 |
| Total | 469 (100.0%) | $160,469 |
Household Income in Lebanon borough
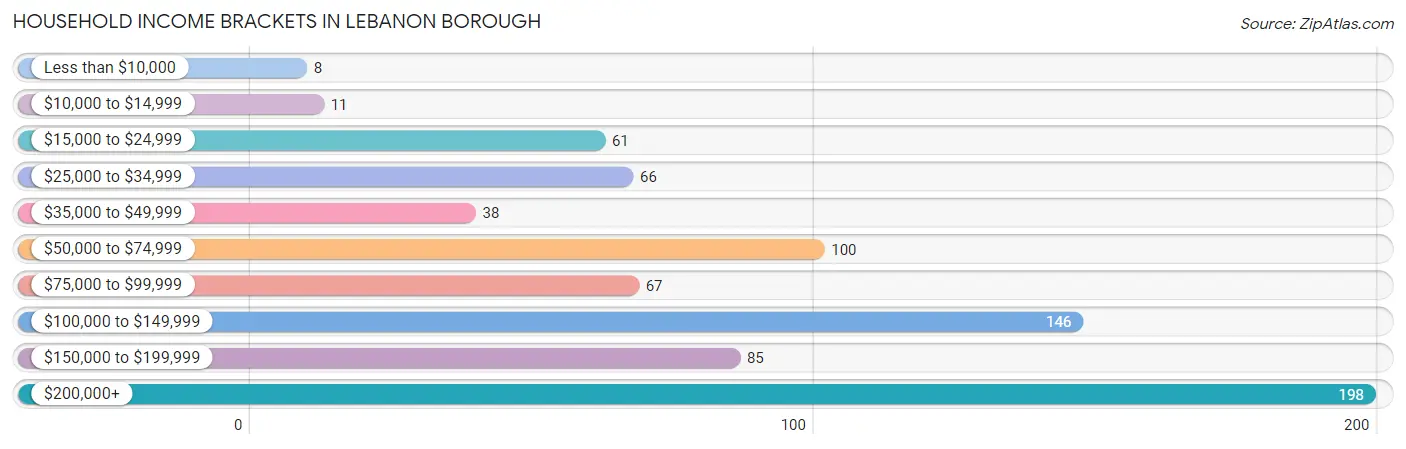
Household Income Brackets in Lebanon borough
With 198 households falling in the category, the $200,000+ income range is the most frequent in Lebanon borough, accounting for 25.4% of all households. In contrast, only 8 households (1.0%) fall into the less than $10,000 income bracket, making it the least populous group.
| Income Bracket | # Households | % Households |
| Less than $10,000 | 8 | 1.0% |
| $10,000 to $14,999 | 11 | 1.4% |
| $15,000 to $24,999 | 61 | 7.8% |
| $25,000 to $34,999 | 66 | 8.5% |
| $35,000 to $49,999 | 38 | 4.9% |
| $50,000 to $74,999 | 100 | 12.8% |
| $75,000 to $99,999 | 67 | 8.6% |
| $100,000 to $149,999 | 146 | 18.7% |
| $150,000 to $199,999 | 85 | 10.9% |
| $200,000+ | 198 | 25.4% |
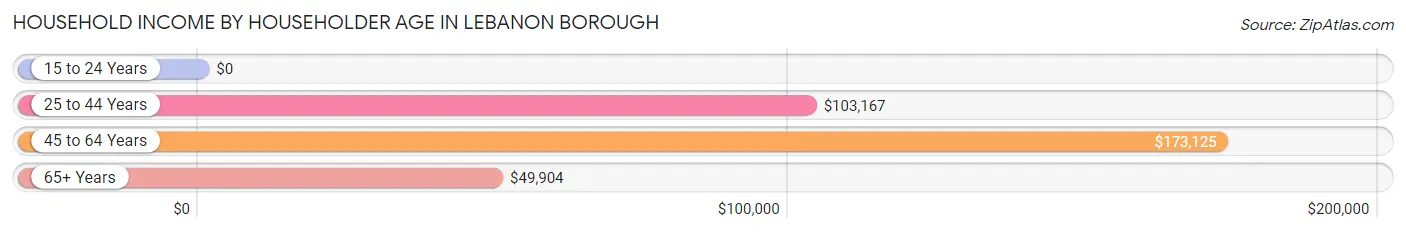
Household Income by Householder Age in Lebanon borough
The median household income in Lebanon borough is $106,389, with the highest median household income of $173,125 found in the 45 to 64 years age bracket for the primary householder. A total of 353 households (45.3%) fall into this category.
| Income Bracket | # Households | Median Income |
| 15 to 24 Years | 0 (0.0%) | $0 |
| 25 to 44 Years | 212 (27.2%) | $103,167 |
| 45 to 64 Years | 353 (45.3%) | $173,125 |
| 65+ Years | 215 (27.6%) | $49,904 |
| Total | 780 (100.0%) | $106,389 |
Poverty in Lebanon borough
Income Below Poverty by Sex and Age in Lebanon borough
With 4.3% poverty level for males and 3.4% for females among the residents of Lebanon borough, 16 and 17 year old males and 75 year old and over females are the most vulnerable to poverty, with 3 males (9.4%) and 10 females (13.2%) in their respective age groups living below the poverty level.
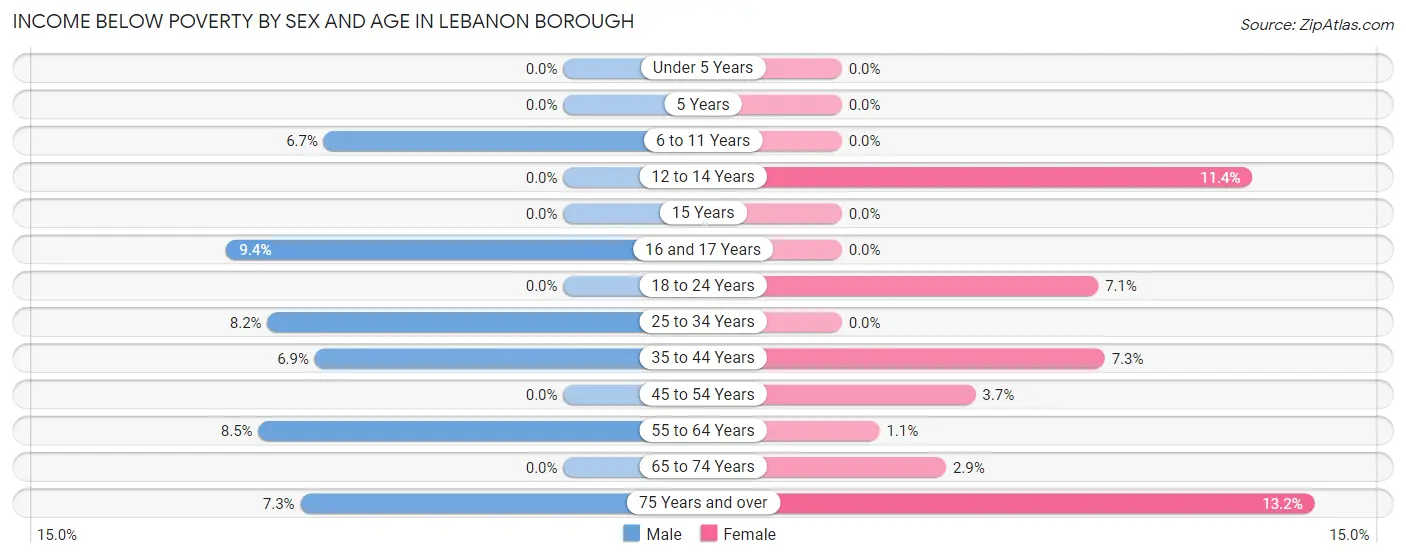
| Age Bracket | Male | Female |
| Under 5 Years | 0 (0.0%) | 0 (0.0%) |
| 5 Years | 0 (0.0%) | 0 (0.0%) |
| 6 to 11 Years | 2 (6.7%) | 0 (0.0%) |
| 12 to 14 Years | 0 (0.0%) | 4 (11.4%) |
| 15 Years | 0 (0.0%) | 0 (0.0%) |
| 16 and 17 Years | 3 (9.4%) | 0 (0.0%) |
| 18 to 24 Years | 0 (0.0%) | 4 (7.1%) |
| 25 to 34 Years | 7 (8.2%) | 0 (0.0%) |
| 35 to 44 Years | 9 (6.9%) | 6 (7.3%) |
| 45 to 54 Years | 0 (0.0%) | 8 (3.7%) |
| 55 to 64 Years | 9 (8.5%) | 1 (1.1%) |
| 65 to 74 Years | 0 (0.0%) | 4 (2.9%) |
| 75 Years and over | 3 (7.3%) | 10 (13.2%) |
| Total | 33 (4.3%) | 37 (3.4%) |
Income Above Poverty by Sex and Age in Lebanon borough
According to the poverty statistics in Lebanon borough, males aged under 5 years and females aged under 5 years are the age groups that are most secure financially, with 100.0% of males and 100.0% of females in these age groups living above the poverty line.
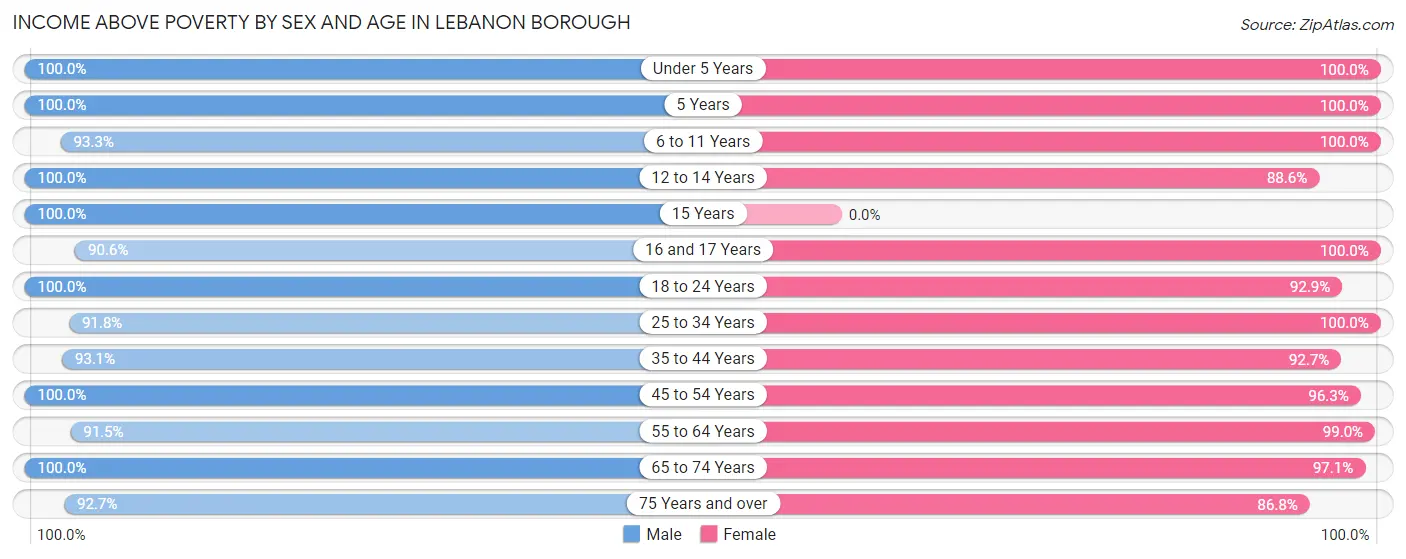
| Age Bracket | Male | Female |
| Under 5 Years | 37 (100.0%) | 109 (100.0%) |
| 5 Years | 6 (100.0%) | 4 (100.0%) |
| 6 to 11 Years | 28 (93.3%) | 42 (100.0%) |
| 12 to 14 Years | 14 (100.0%) | 31 (88.6%) |
| 15 Years | 5 (100.0%) | 0 (0.0%) |
| 16 and 17 Years | 29 (90.6%) | 9 (100.0%) |
| 18 to 24 Years | 69 (100.0%) | 52 (92.9%) |
| 25 to 34 Years | 78 (91.8%) | 234 (100.0%) |
| 35 to 44 Years | 121 (93.1%) | 76 (92.7%) |
| 45 to 54 Years | 155 (100.0%) | 207 (96.3%) |
| 55 to 64 Years | 97 (91.5%) | 94 (99.0%) |
| 65 to 74 Years | 58 (100.0%) | 134 (97.1%) |
| 75 Years and over | 38 (92.7%) | 66 (86.8%) |
| Total | 735 (95.7%) | 1,058 (96.6%) |
Income Below Poverty Among Married-Couple Families in Lebanon borough
The poverty statistics for married-couple families in Lebanon borough show that 1.6% or 6 of the total 379 families live below the poverty line. Families with 1 or 2 children have the highest poverty rate of 2.2%, comprising of 3 families. On the other hand, families with 3 or 4 children have the lowest poverty rate of 0.0%, which includes 0 families.
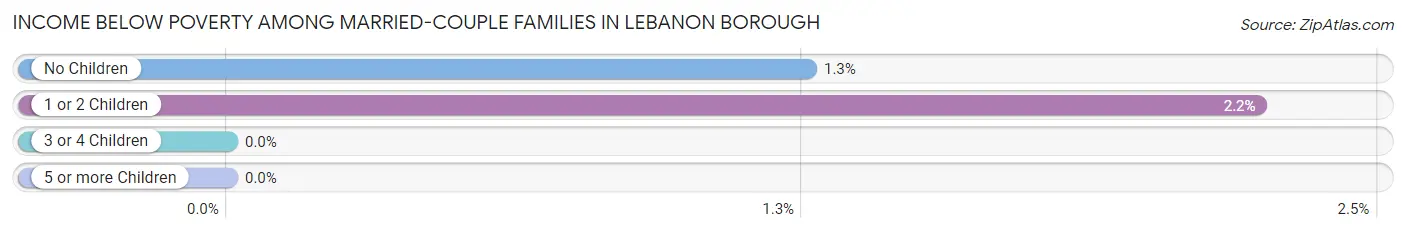
| Children | Above Poverty | Below Poverty |
| No Children | 236 (98.7%) | 3 (1.3%) |
| 1 or 2 Children | 131 (97.8%) | 3 (2.2%) |
| 3 or 4 Children | 6 (100.0%) | 0 (0.0%) |
| 5 or more Children | 0 (0.0%) | 0 (0.0%) |
| Total | 373 (98.4%) | 6 (1.6%) |
Income Below Poverty Among Single-Parent Households in Lebanon borough
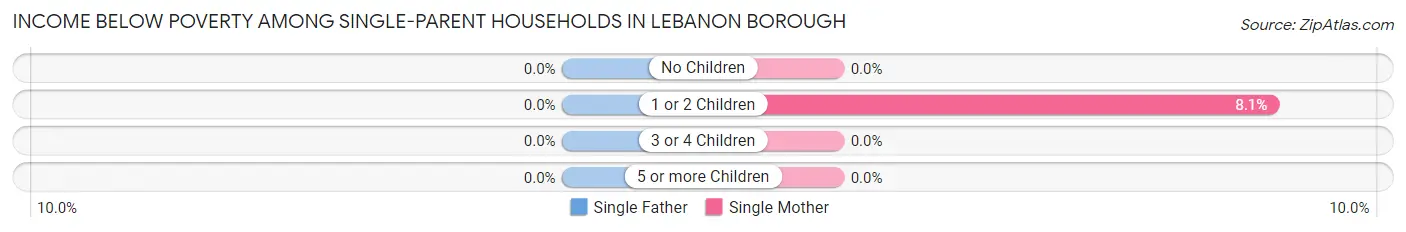
| Children | Single Father | Single Mother |
| No Children | 0 (0.0%) | 0 (0.0%) |
| 1 or 2 Children | 0 (0.0%) | 3 (8.1%) |
| 3 or 4 Children | 0 (0.0%) | 0 (0.0%) |
| 5 or more Children | 0 (0.0%) | 0 (0.0%) |
| Total | 0 (0.0%) | 3 (6.2%) |
Income Below Poverty Among Married-Couple vs Single-Parent Households in Lebanon borough
The poverty data for Lebanon borough shows that 6 of the married-couple family households (1.6%) and 3 of the single-parent households (3.3%) are living below the poverty level. Within the married-couple family households, those with 1 or 2 children have the highest poverty rate, with 3 households (2.2%) falling below the poverty line. Among the single-parent households, those with 1 or 2 children have the highest poverty rate, with 3 household (4.7%) living below poverty.
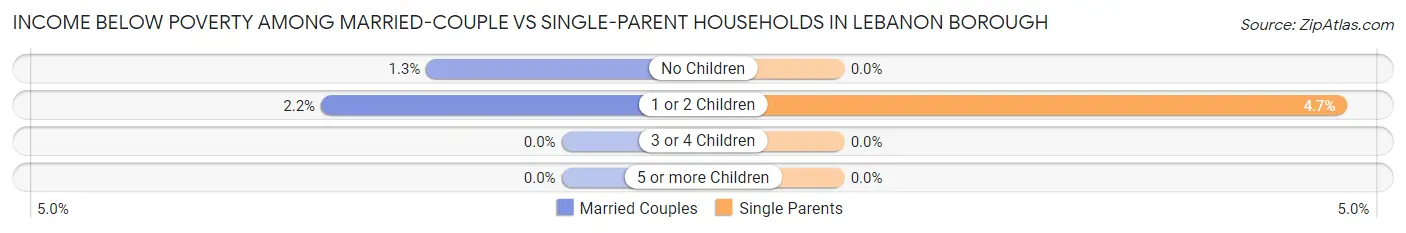
| Children | Married-Couple Families | Single-Parent Households |
| No Children | 3 (1.3%) | 0 (0.0%) |
| 1 or 2 Children | 3 (2.2%) | 3 (4.7%) |
| 3 or 4 Children | 0 (0.0%) | 0 (0.0%) |
| 5 or more Children | 0 (0.0%) | 0 (0.0%) |
| Total | 6 (1.6%) | 3 (3.3%) |
Race in Lebanon borough
The most populous races in Lebanon borough are White / Caucasian (1,722 | 92.4%), Hispanic or Latino (137 | 7.3%), and Asian (100 | 5.4%).
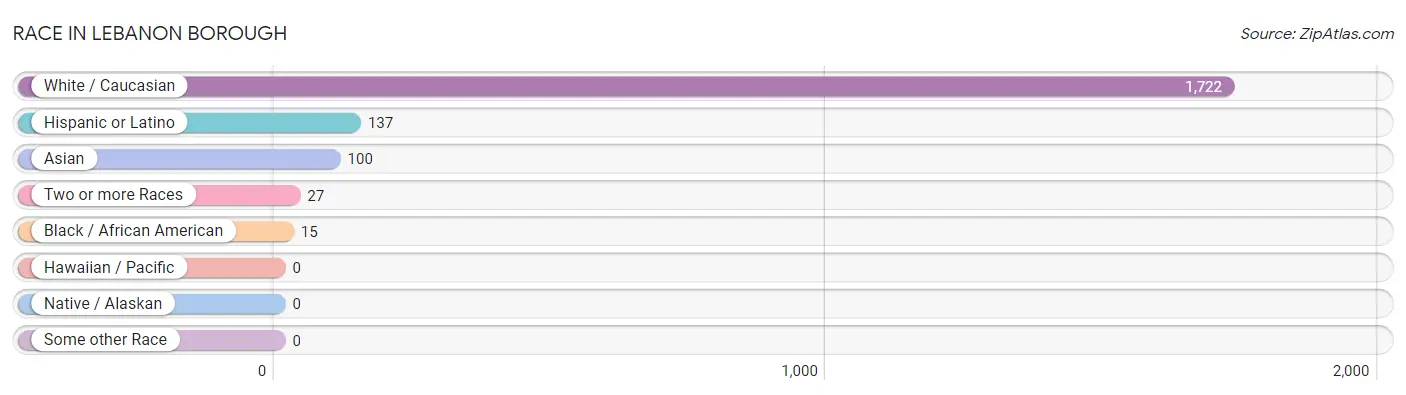
| Race | # Population | % Population |
| Asian | 100 | 5.4% |
| Black / African American | 15 | 0.8% |
| Hawaiian / Pacific | 0 | 0.0% |
| Hispanic or Latino | 137 | 7.3% |
| Native / Alaskan | 0 | 0.0% |
| White / Caucasian | 1,722 | 92.4% |
| Two or more Races | 27 | 1.5% |
| Some other Race | 0 | 0.0% |
| Total | 1,864 | 100.0% |
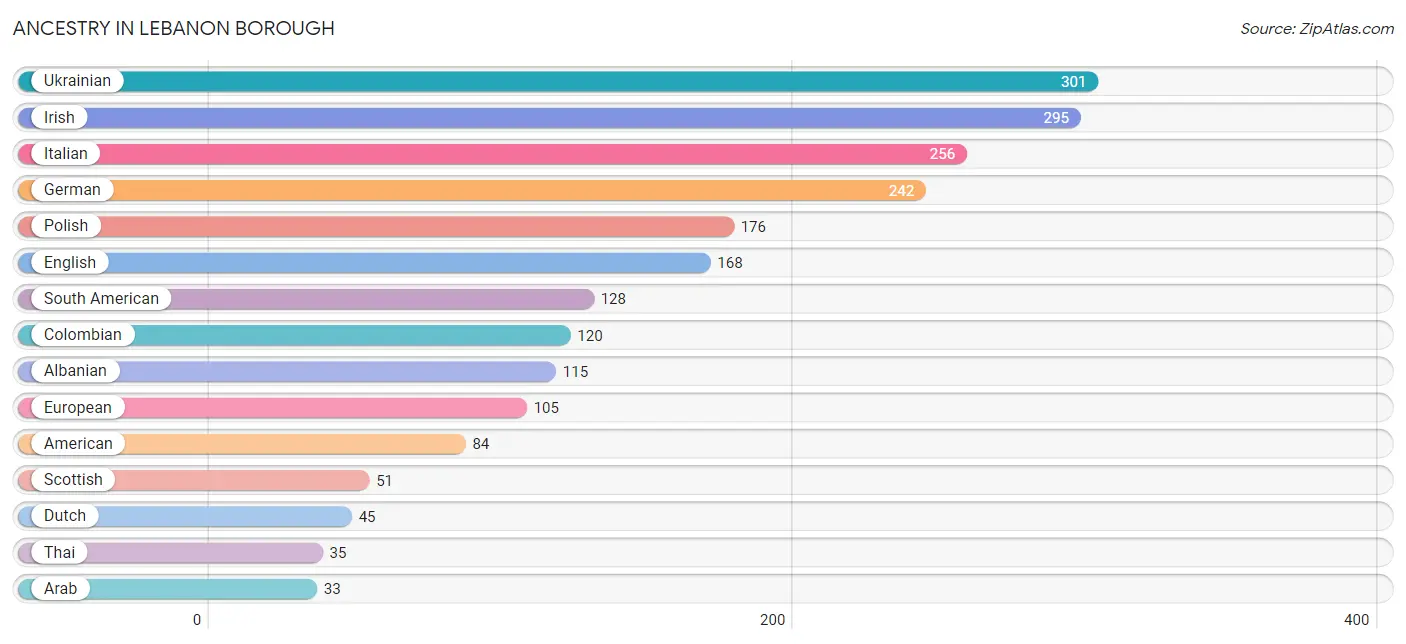
Ancestry in Lebanon borough
The most populous ancestries reported in Lebanon borough are Ukrainian (301 | 16.2%), Irish (295 | 15.8%), Italian (256 | 13.7%), German (242 | 13.0%), and Polish (176 | 9.4%), together accounting for 68.1% of all Lebanon borough residents.
| Ancestry | # Population | % Population |
| African | 1 | 0.1% |
| Albanian | 115 | 6.2% |
| American | 84 | 4.5% |
| Arab | 33 | 1.8% |
| Armenian | 27 | 1.5% |
| Austrian | 6 | 0.3% |
| Belgian | 5 | 0.3% |
| Brazilian | 5 | 0.3% |
| British | 16 | 0.9% |
| Burmese | 3 | 0.2% |
| Cherokee | 7 | 0.4% |
| Colombian | 120 | 6.4% |
| Croatian | 3 | 0.2% |
| Cuban | 5 | 0.3% |
| Danish | 3 | 0.2% |
| Dutch | 45 | 2.4% |
| Eastern European | 6 | 0.3% |
| Ecuadorian | 8 | 0.4% |
| Egyptian | 5 | 0.3% |
| English | 168 | 9.0% |
| Estonian | 3 | 0.2% |
| European | 105 | 5.6% |
| Filipino | 11 | 0.6% |
| French | 8 | 0.4% |
| French Canadian | 4 | 0.2% |
| German | 242 | 13.0% |
| Haitian | 3 | 0.2% |
| Hungarian | 17 | 0.9% |
| Icelander | 3 | 0.2% |
| Indian (Asian) | 11 | 0.6% |
| Iranian | 2 | 0.1% |
| Irish | 295 | 15.8% |
| Italian | 256 | 13.7% |
| Korean | 25 | 1.3% |
| Lebanese | 27 | 1.5% |
| Lithuanian | 8 | 0.4% |
| Moroccan | 1 | 0.1% |
| Norwegian | 6 | 0.3% |
| Pennsylvania German | 4 | 0.2% |
| Polish | 176 | 9.4% |
| Portuguese | 30 | 1.6% |
| Russian | 13 | 0.7% |
| Scandinavian | 4 | 0.2% |
| Scotch-Irish | 13 | 0.7% |
| Scottish | 51 | 2.7% |
| Slavic | 3 | 0.2% |
| Slovak | 15 | 0.8% |
| South American | 128 | 6.9% |
| Spanish | 4 | 0.2% |
| Sri Lankan | 1 | 0.1% |
| Subsaharan African | 4 | 0.2% |
| Swedish | 28 | 1.5% |
| Swiss | 3 | 0.2% |
| Thai | 35 | 1.9% |
| Ukrainian | 301 | 16.2% |
| Welsh | 9 | 0.5% |
| Yugoslavian | 3 | 0.2% | View All 57 Rows |
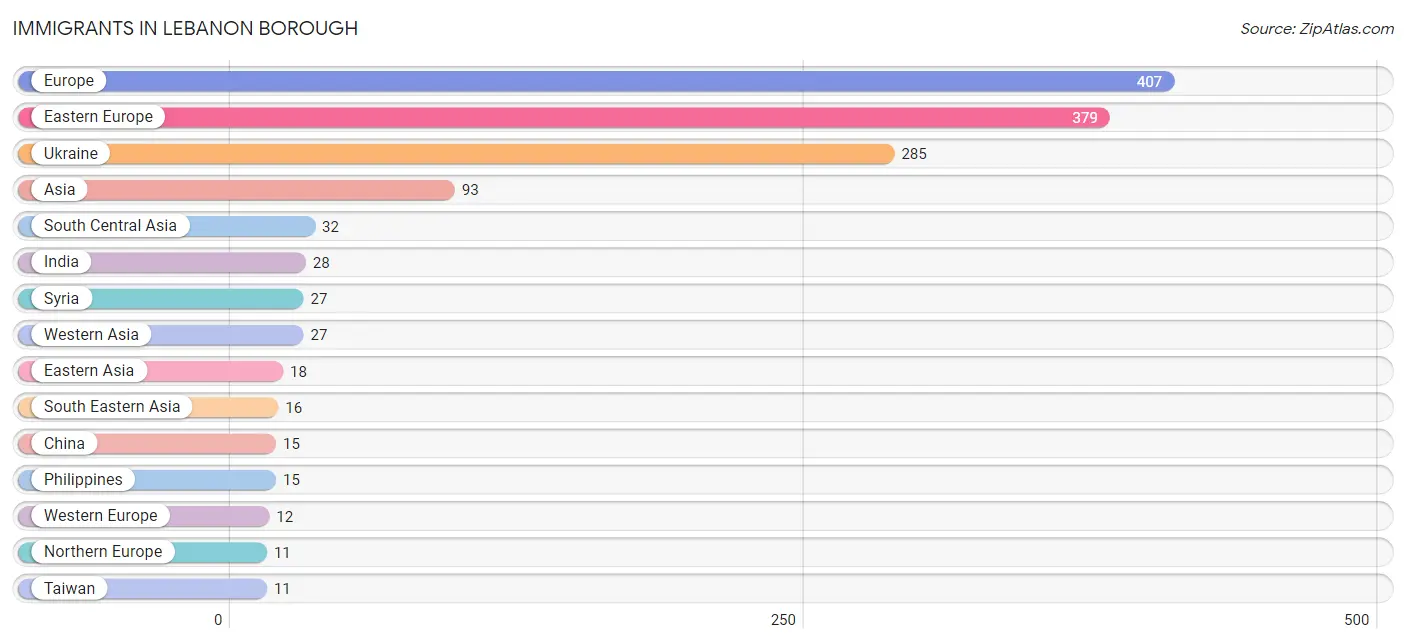
Immigrants in Lebanon borough
The most numerous immigrant groups reported in Lebanon borough came from Europe (407 | 21.8%), Eastern Europe (379 | 20.3%), Ukraine (285 | 15.3%), Asia (93 | 5.0%), and South Central Asia (32 | 1.7%), together accounting for 64.2% of all Lebanon borough residents.
| Immigration Origin | # Population | % Population |
| Africa | 8 | 0.4% |
| Asia | 93 | 5.0% |
| Bangladesh | 4 | 0.2% |
| China | 15 | 0.8% |
| Denmark | 3 | 0.2% |
| Eastern Asia | 18 | 1.0% |
| Eastern Europe | 379 | 20.3% |
| Ecuador | 8 | 0.4% |
| Egypt | 5 | 0.3% |
| England | 3 | 0.2% |
| Europe | 407 | 21.8% |
| Germany | 3 | 0.2% |
| Hungary | 3 | 0.2% |
| India | 28 | 1.5% |
| Korea | 3 | 0.2% |
| Latin America | 8 | 0.4% |
| Middle Africa | 3 | 0.2% |
| Netherlands | 9 | 0.5% |
| Northern Africa | 5 | 0.3% |
| Northern Europe | 11 | 0.6% |
| Philippines | 15 | 0.8% |
| Portugal | 5 | 0.3% |
| South America | 8 | 0.4% |
| South Central Asia | 32 | 1.7% |
| South Eastern Asia | 16 | 0.9% |
| Southern Europe | 5 | 0.3% |
| Syria | 27 | 1.5% |
| Taiwan | 11 | 0.6% |
| Ukraine | 285 | 15.3% |
| Vietnam | 1 | 0.1% |
| Western Asia | 27 | 1.5% |
| Western Europe | 12 | 0.6% | View All 32 Rows |
Sex and Age in Lebanon borough
Sex and Age in Lebanon borough
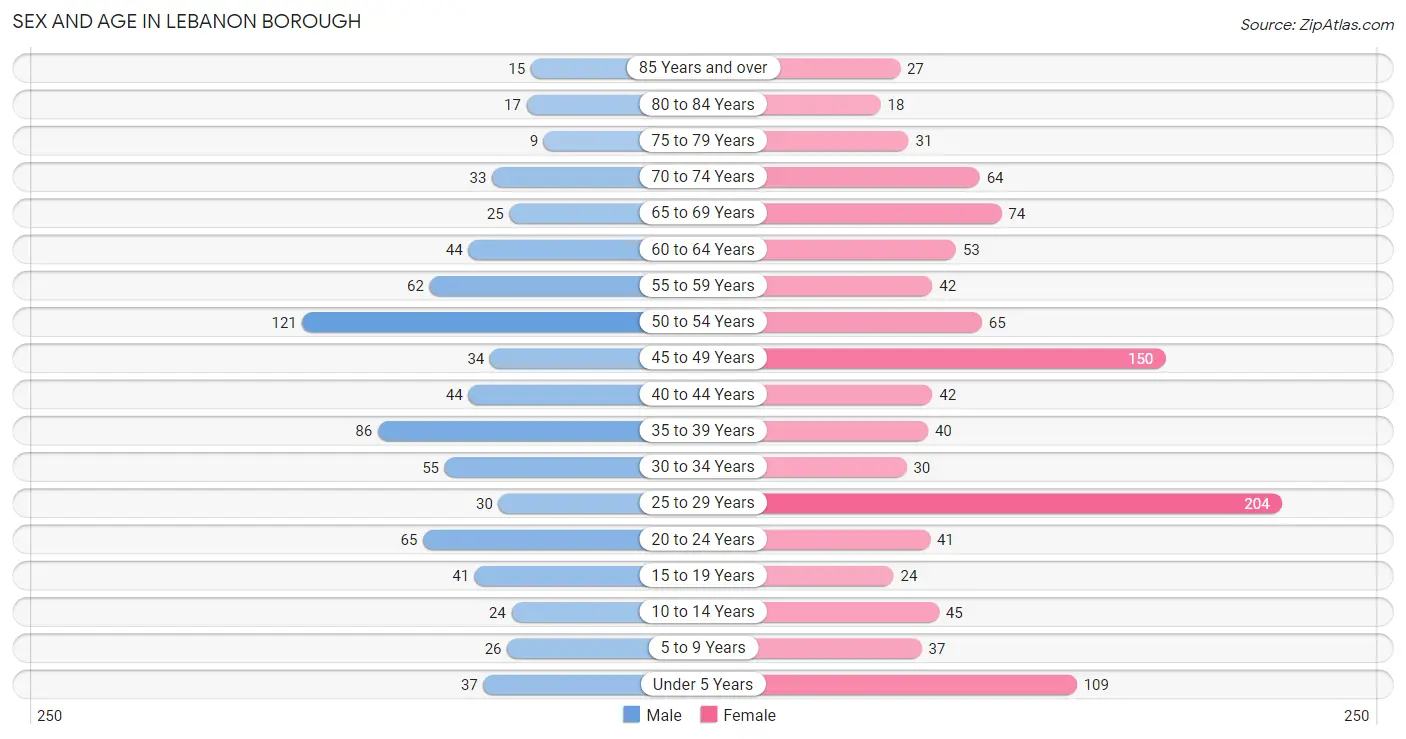
The most populous age groups in Lebanon borough are 50 to 54 Years (121 | 15.8%) for men and 25 to 29 Years (204 | 18.6%) for women.
| Age Bracket | Male | Female |
| Under 5 Years | 37 (4.8%) | 109 (10.0%) |
| 5 to 9 Years | 26 (3.4%) | 37 (3.4%) |
| 10 to 14 Years | 24 (3.1%) | 45 (4.1%) |
| 15 to 19 Years | 41 (5.3%) | 24 (2.2%) |
| 20 to 24 Years | 65 (8.5%) | 41 (3.7%) |
| 25 to 29 Years | 30 (3.9%) | 204 (18.6%) |
| 30 to 34 Years | 55 (7.2%) | 30 (2.7%) |
| 35 to 39 Years | 86 (11.2%) | 40 (3.6%) |
| 40 to 44 Years | 44 (5.7%) | 42 (3.8%) |
| 45 to 49 Years | 34 (4.4%) | 150 (13.7%) |
| 50 to 54 Years | 121 (15.8%) | 65 (5.9%) |
| 55 to 59 Years | 62 (8.1%) | 42 (3.8%) |
| 60 to 64 Years | 44 (5.7%) | 53 (4.8%) |
| 65 to 69 Years | 25 (3.3%) | 74 (6.8%) |
| 70 to 74 Years | 33 (4.3%) | 64 (5.8%) |
| 75 to 79 Years | 9 (1.2%) | 31 (2.8%) |
| 80 to 84 Years | 17 (2.2%) | 18 (1.6%) |
| 85 Years and over | 15 (1.9%) | 27 (2.5%) |
| Total | 768 (100.0%) | 1,096 (100.0%) |
Families and Households in Lebanon borough
Median Family Size in Lebanon borough
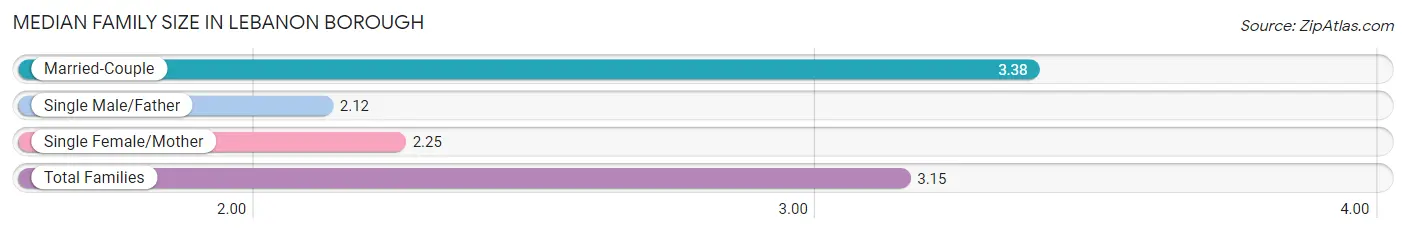
The median family size in Lebanon borough is 3.15 persons per family, with married-couple families (379 | 80.8%) accounting for the largest median family size of 3.38 persons per family. On the other hand, single male/father families (42 | 9.0%) represent the smallest median family size with 2.12 persons per family.
| Family Type | # Families | Family Size |
| Married-Couple | 379 (80.8%) | 3.38 |
| Single Male/Father | 42 (9.0%) | 2.12 |
| Single Female/Mother | 48 (10.2%) | 2.25 |
| Total Families | 469 (100.0%) | 3.15 |
Median Household Size in Lebanon borough
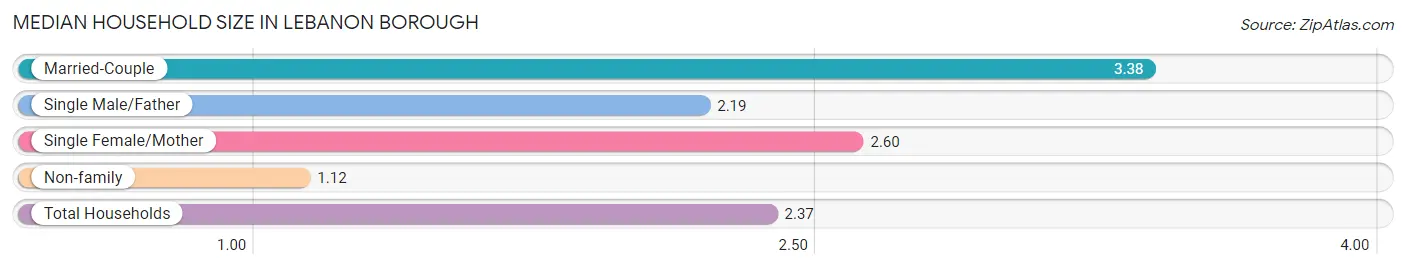
The median household size in Lebanon borough is 2.37 persons per household, with married-couple households (379 | 48.6%) accounting for the largest median household size of 3.38 persons per household. non-family households (311 | 39.9%) represent the smallest median household size with 1.12 persons per household.
| Household Type | # Households | Household Size |
| Married-Couple | 379 (48.6%) | 3.38 |
| Single Male/Father | 42 (5.4%) | 2.19 |
| Single Female/Mother | 48 (6.1%) | 2.60 |
| Non-family | 311 (39.9%) | 1.12 |
| Total Households | 780 (100.0%) | 2.37 |
Household Size by Marriage Status in Lebanon borough
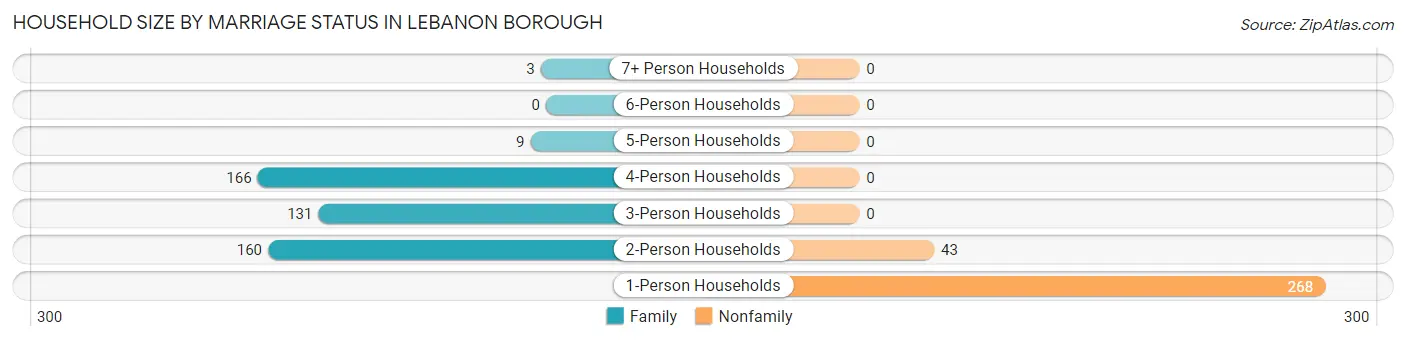
Out of a total of 780 households in Lebanon borough, 469 (60.1%) are family households, while 311 (39.9%) are nonfamily households. The most numerous type of family households are 4-person households, comprising 166, and the most common type of nonfamily households are 1-person households, comprising 268.
| Household Size | Family Households | Nonfamily Households |
| 1-Person Households | - | 268 (34.4%) |
| 2-Person Households | 160 (20.5%) | 43 (5.5%) |
| 3-Person Households | 131 (16.8%) | 0 (0.0%) |
| 4-Person Households | 166 (21.3%) | 0 (0.0%) |
| 5-Person Households | 9 (1.1%) | 0 (0.0%) |
| 6-Person Households | 0 (0.0%) | 0 (0.0%) |
| 7+ Person Households | 3 (0.4%) | 0 (0.0%) |
| Total | 469 (60.1%) | 311 (39.9%) |
Female Fertility in Lebanon borough
Fertility by Age in Lebanon borough
Average fertility rate in Lebanon borough is 107.0 births per 1,000 women. Women in the age bracket of 20 to 34 years have the highest fertility rate with 185.0 births per 1,000 women. Women in the age bracket of 20 to 34 years acount for 87.9% of all women with births.
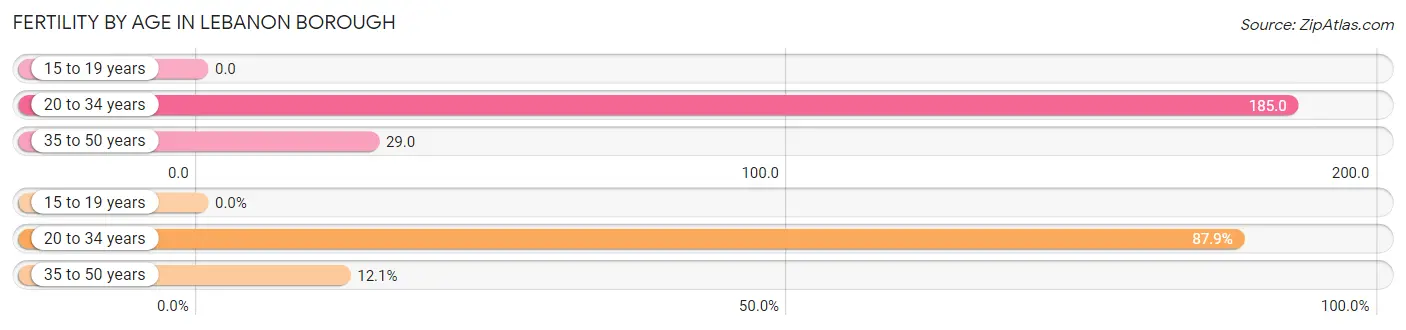
| Age Bracket | Women with Births | Births / 1,000 Women |
| 15 to 19 years | 0 (0.0%) | 0.0 |
| 20 to 34 years | 51 (87.9%) | 185.0 |
| 35 to 50 years | 7 (12.1%) | 29.0 |
| Total | 58 (100.0%) | 107.0 |
Fertility by Age by Marriage Status in Lebanon borough
94.8% of women with births (58) in Lebanon borough are married. The highest percentage of unmarried women with births falls into 20 to 34 years age bracket with 5.9% of them unmarried at the time of birth, while the lowest percentage of unmarried women with births belong to 35 to 50 years age bracket with 0.0% of them unmarried.
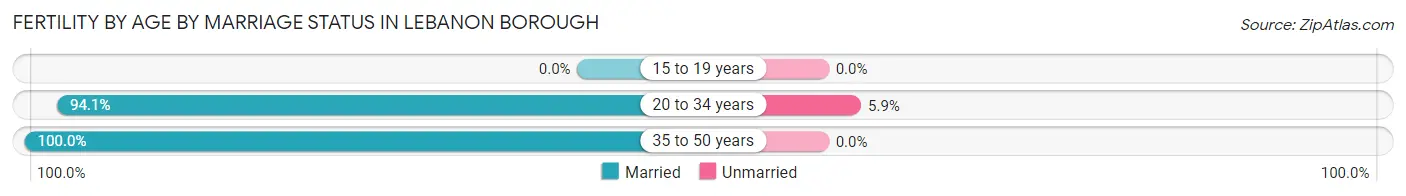
| Age Bracket | Married | Unmarried |
| 15 to 19 years | 0 (0.0%) | 0 (0.0%) |
| 20 to 34 years | 48 (94.1%) | 3 (5.9%) |
| 35 to 50 years | 7 (100.0%) | 0 (0.0%) |
| Total | 55 (94.8%) | 3 (5.2%) |
Fertility by Education in Lebanon borough
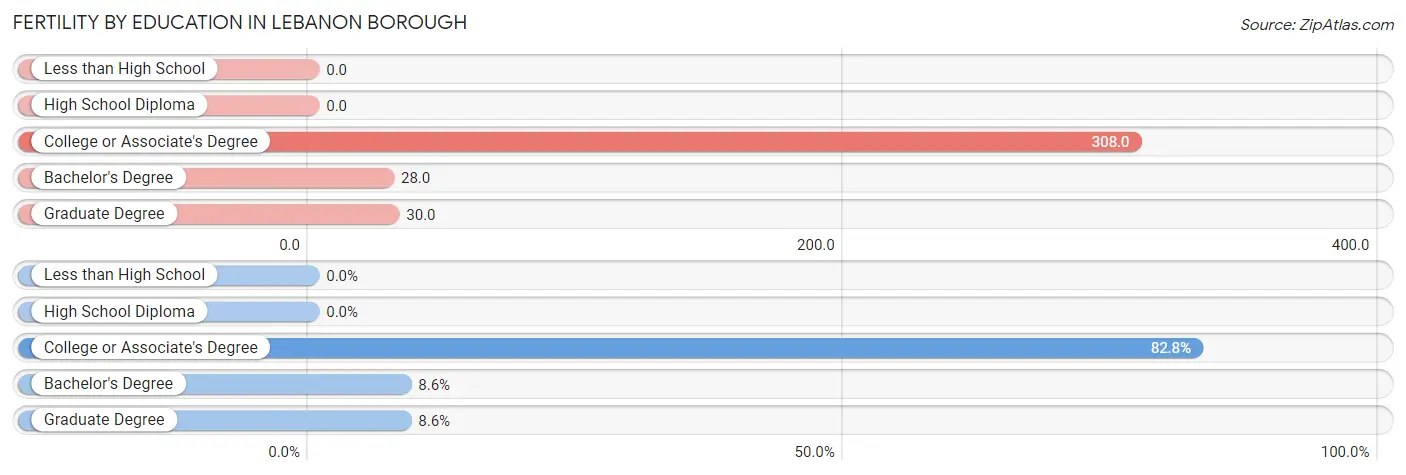
| Educational Attainment | Women with Births | Births / 1,000 Women |
| Less than High School | 0 (0.0%) | 0.0 |
| High School Diploma | 0 (0.0%) | 0.0 |
| College or Associate's Degree | 48 (82.8%) | 308.0 |
| Bachelor's Degree | 5 (8.6%) | 28.0 |
| Graduate Degree | 5 (8.6%) | 30.0 |
| Total | 58 (100.0%) | 107.0 |
Fertility by Education by Marriage Status in Lebanon borough
5.2% of women with births in Lebanon borough are unmarried. Women with the educational attainment of college or associate's degree are most likely to be married with 100.0% of them married at childbirth, while women with the educational attainment of bachelor's degree are least likely to be married with 60.0% of them unmarried at childbirth.
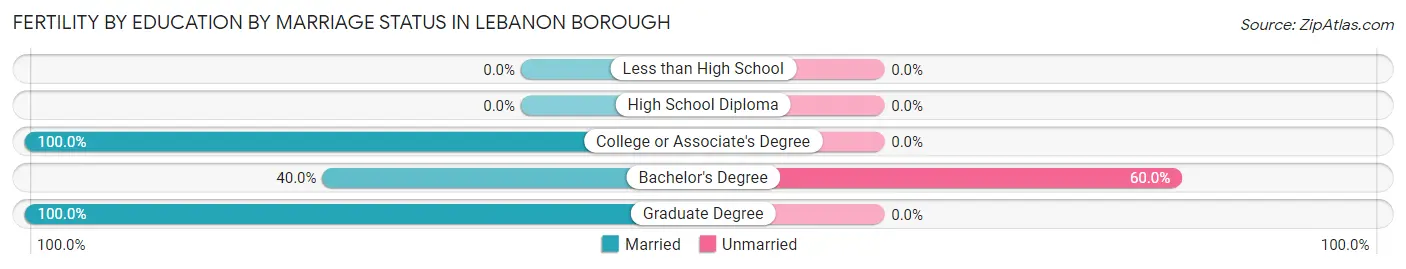
| Educational Attainment | Married | Unmarried |
| Less than High School | 0 (0.0%) | 0 (0.0%) |
| High School Diploma | 0 (0.0%) | 0 (0.0%) |
| College or Associate's Degree | 48 (100.0%) | 0 (0.0%) |
| Bachelor's Degree | 2 (40.0%) | 3 (60.0%) |
| Graduate Degree | 5 (100.0%) | 0 (0.0%) |
| Total | 55 (94.8%) | 3 (5.2%) |
Employment Characteristics in Lebanon borough
Employment by Class of Employer in Lebanon borough
Among the 1,085 employed individuals in Lebanon borough, private company employees (797 | 73.5%), self-employed (not incorporated) (109 | 10.1%), and local government employees (68 | 6.3%) make up the most common classes of employment.
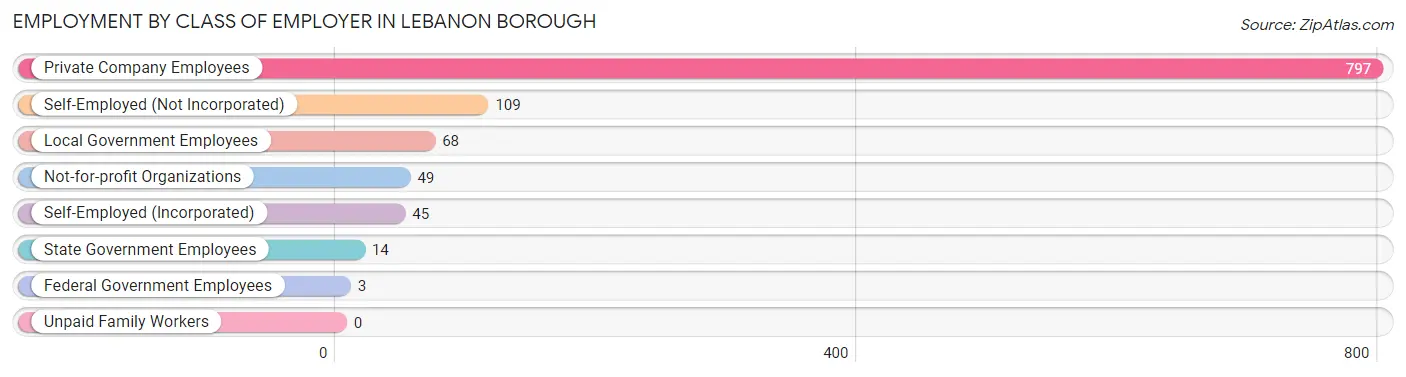
| Employer Class | # Employees | % Employees |
| Private Company Employees | 797 | 73.5% |
| Self-Employed (Incorporated) | 45 | 4.2% |
| Self-Employed (Not Incorporated) | 109 | 10.1% |
| Not-for-profit Organizations | 49 | 4.5% |
| Local Government Employees | 68 | 6.3% |
| State Government Employees | 14 | 1.3% |
| Federal Government Employees | 3 | 0.3% |
| Unpaid Family Workers | 0 | 0.0% |
| Total | 1,085 | 100.0% |
Employment Status by Age in Lebanon borough
According to the labor force statistics for Lebanon borough, out of the total population over 16 years of age (1,581), 71.4% or 1,129 individuals are in the labor force, with 2.8% or 32 of them unemployed. The age group with the highest labor force participation rate is 30 to 34 years, with 96.5% or 82 individuals in the labor force. Within the labor force, the 55 to 59 years age range has the highest percentage of unemployed individuals, with 15.1% or 14 of them being unemployed.
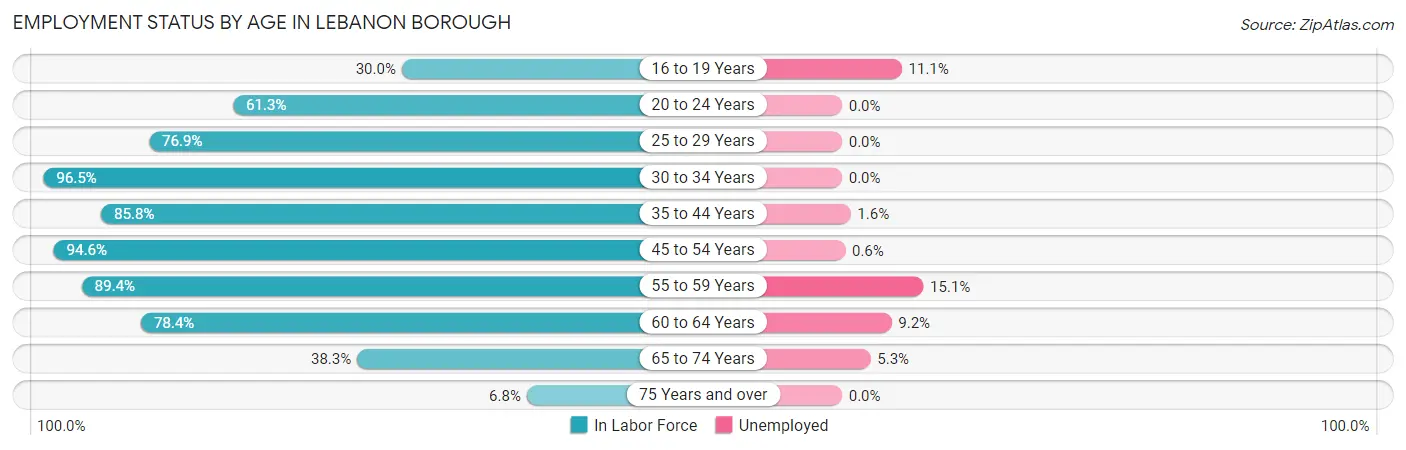
| Age Bracket | In Labor Force | Unemployed |
| 16 to 19 Years | 18 (30.0%) | 2 (11.1%) |
| 20 to 24 Years | 65 (61.3%) | 0 (0.0%) |
| 25 to 29 Years | 180 (76.9%) | 0 (0.0%) |
| 30 to 34 Years | 82 (96.5%) | 0 (0.0%) |
| 35 to 44 Years | 182 (85.8%) | 3 (1.6%) |
| 45 to 54 Years | 350 (94.6%) | 2 (0.6%) |
| 55 to 59 Years | 93 (89.4%) | 14 (15.1%) |
| 60 to 64 Years | 76 (78.4%) | 7 (9.2%) |
| 65 to 74 Years | 75 (38.3%) | 4 (5.3%) |
| 75 Years and over | 8 (6.8%) | 0 (0.0%) |
| Total | 1,129 (71.4%) | 32 (2.8%) |
Employment Status by Educational Attainment in Lebanon borough
According to labor force statistics for Lebanon borough, 87.4% of individuals (963) out of the total population between 25 and 64 years of age (1,102) are in the labor force, with 2.7% or 26 of them being unemployed. The group with the highest labor force participation rate are those with the educational attainment of bachelor's degree or higher, with 94.1% or 624 individuals in the labor force. Within the labor force, individuals with college / associate degree education have the highest percentage of unemployment, with 3.3% or 6 of them being unemployed.
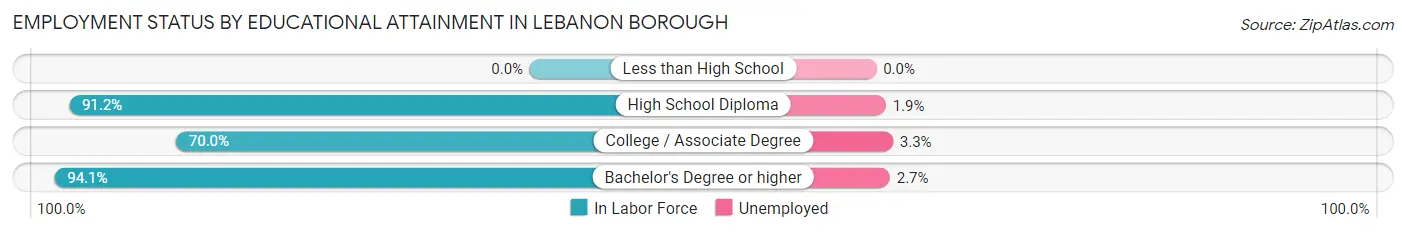
| Educational Attainment | In Labor Force | Unemployed |
| Less than High School | 0 (0.0%) | 0 (0.0%) |
| High School Diploma | 155 (91.2%) | 3 (1.9%) |
| College / Associate Degree | 184 (70.0%) | 9 (3.3%) |
| Bachelor's Degree or higher | 624 (94.1%) | 18 (2.7%) |
| Total | 963 (87.4%) | 30 (2.7%) |
Employment Occupations by Sex in Lebanon borough
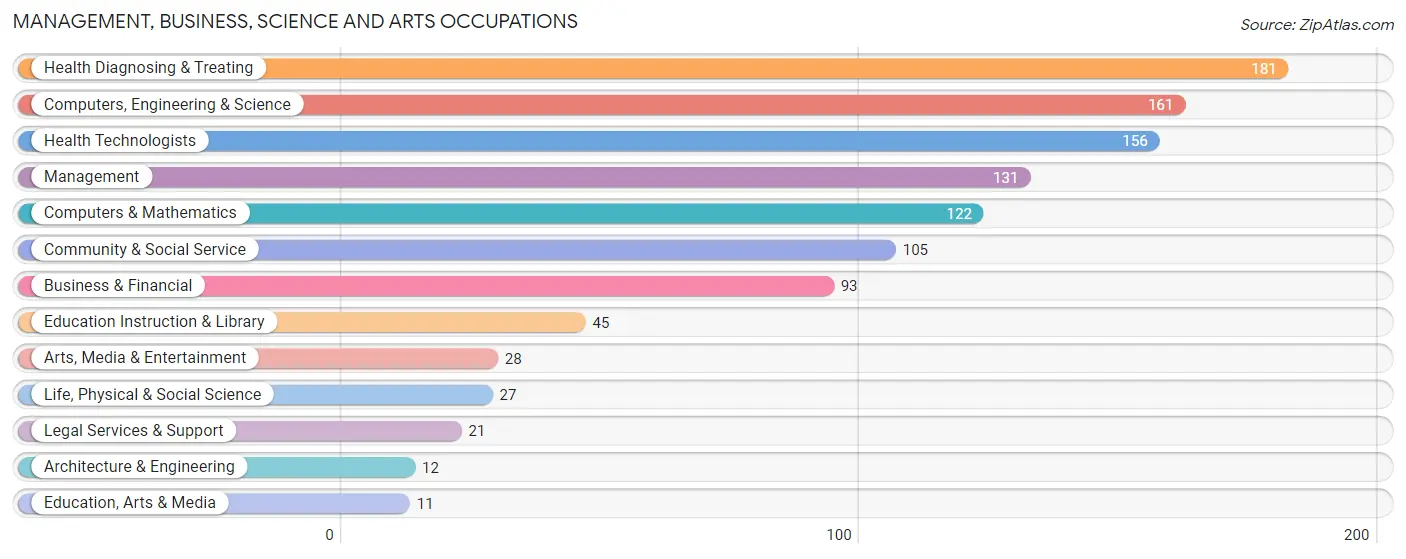
Management, Business, Science and Arts Occupations
The most common Management, Business, Science and Arts occupations in Lebanon borough are Health Diagnosing & Treating (181 | 16.5%), Computers, Engineering & Science (161 | 14.7%), Health Technologists (156 | 14.2%), Management (131 | 11.9%), and Computers & Mathematics (122 | 11.1%).
Management, Business, Science and Arts Occupations by Sex
Within the Management, Business, Science and Arts occupations in Lebanon borough, the most male-oriented occupations are Architecture & Engineering (100.0%), Management (88.5%), and Business & Financial (54.8%), while the most female-oriented occupations are Legal Services & Support (90.5%), Health Diagnosing & Treating (88.9%), and Health Technologists (88.5%).
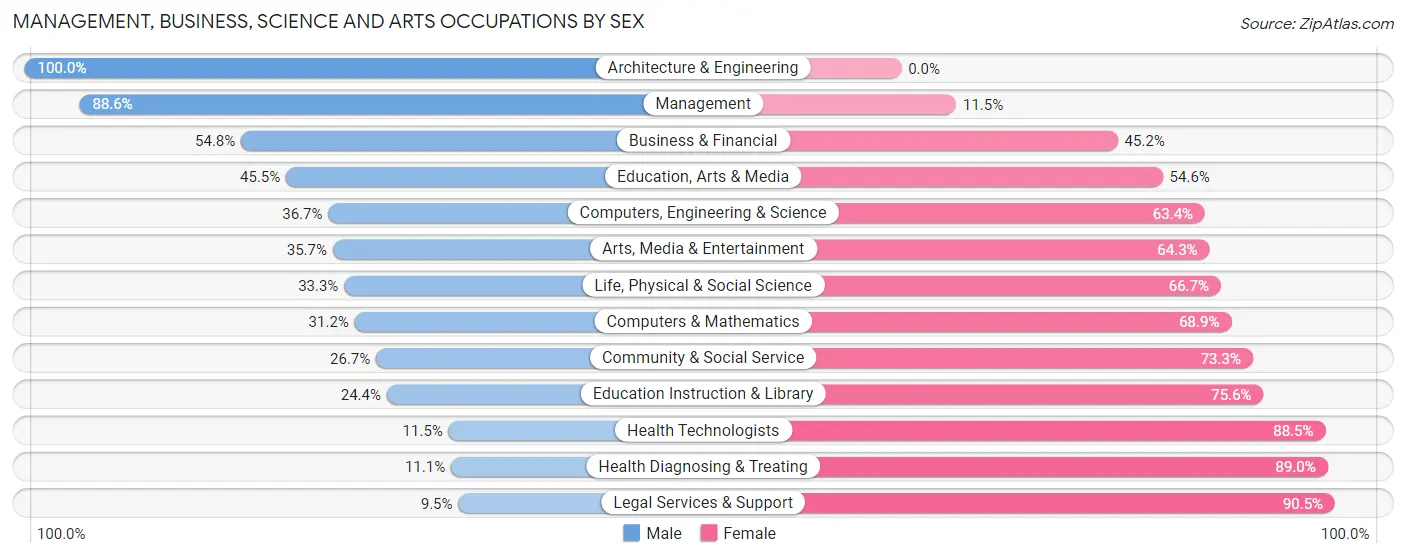
| Occupation | Male | Female |
| Management | 116 (88.5%) | 15 (11.5%) |
| Business & Financial | 51 (54.8%) | 42 (45.2%) |
| Computers, Engineering & Science | 59 (36.6%) | 102 (63.3%) |
| Computers & Mathematics | 38 (31.1%) | 84 (68.9%) |
| Architecture & Engineering | 12 (100.0%) | 0 (0.0%) |
| Life, Physical & Social Science | 9 (33.3%) | 18 (66.7%) |
| Community & Social Service | 28 (26.7%) | 77 (73.3%) |
| Education, Arts & Media | 5 (45.5%) | 6 (54.5%) |
| Legal Services & Support | 2 (9.5%) | 19 (90.5%) |
| Education Instruction & Library | 11 (24.4%) | 34 (75.6%) |
| Arts, Media & Entertainment | 10 (35.7%) | 18 (64.3%) |
| Health Diagnosing & Treating | 20 (11.1%) | 161 (88.9%) |
| Health Technologists | 18 (11.5%) | 138 (88.5%) |
| Total (Category) | 274 (40.8%) | 397 (59.2%) |
| Total (Overall) | 523 (47.7%) | 574 (52.3%) |
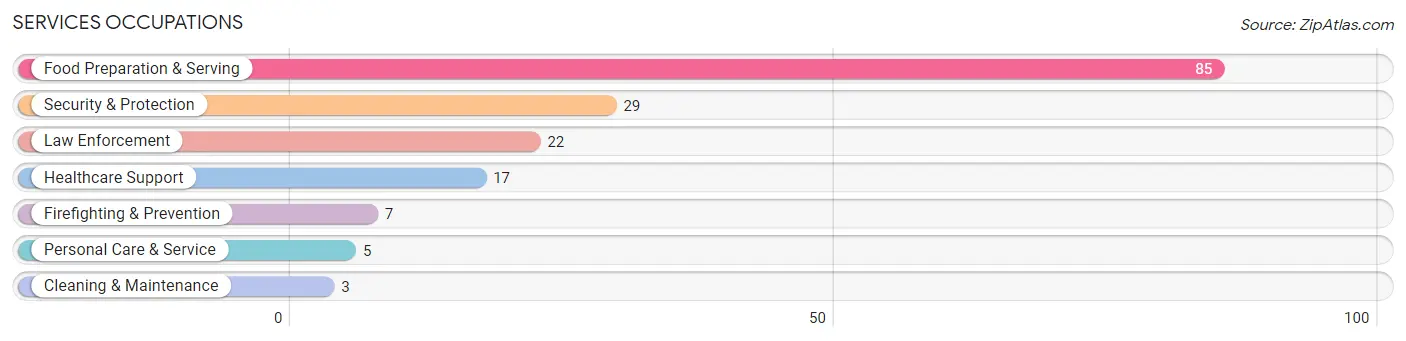
Services Occupations
The most common Services occupations in Lebanon borough are Food Preparation & Serving (85 | 7.7%), Security & Protection (29 | 2.6%), Law Enforcement (22 | 2.0%), Healthcare Support (17 | 1.5%), and Firefighting & Prevention (7 | 0.6%).
Services Occupations by Sex
Within the Services occupations in Lebanon borough, the most male-oriented occupations are Law Enforcement (100.0%), Cleaning & Maintenance (100.0%), and Security & Protection (86.2%), while the most female-oriented occupations are Healthcare Support (100.0%), Personal Care & Service (100.0%), and Firefighting & Prevention (57.1%).
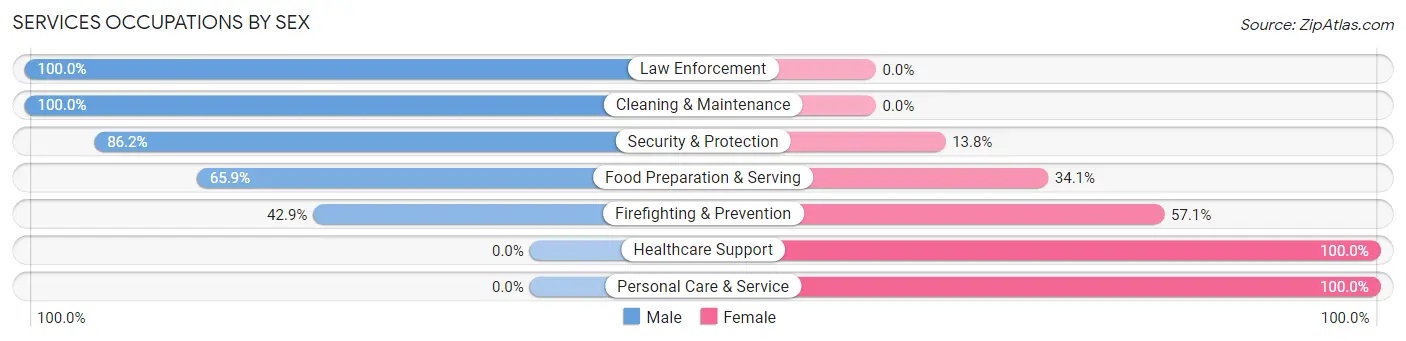
| Occupation | Male | Female |
| Healthcare Support | 0 (0.0%) | 17 (100.0%) |
| Security & Protection | 25 (86.2%) | 4 (13.8%) |
| Firefighting & Prevention | 3 (42.9%) | 4 (57.1%) |
| Law Enforcement | 22 (100.0%) | 0 (0.0%) |
| Food Preparation & Serving | 56 (65.9%) | 29 (34.1%) |
| Cleaning & Maintenance | 3 (100.0%) | 0 (0.0%) |
| Personal Care & Service | 0 (0.0%) | 5 (100.0%) |
| Total (Category) | 84 (60.4%) | 55 (39.6%) |
| Total (Overall) | 523 (47.7%) | 574 (52.3%) |
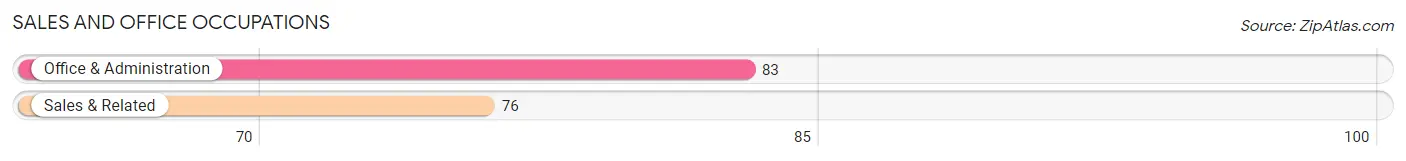
Sales and Office Occupations
The most common Sales and Office occupations in Lebanon borough are Office & Administration (83 | 7.6%), and Sales & Related (76 | 6.9%).
Sales and Office Occupations by Sex
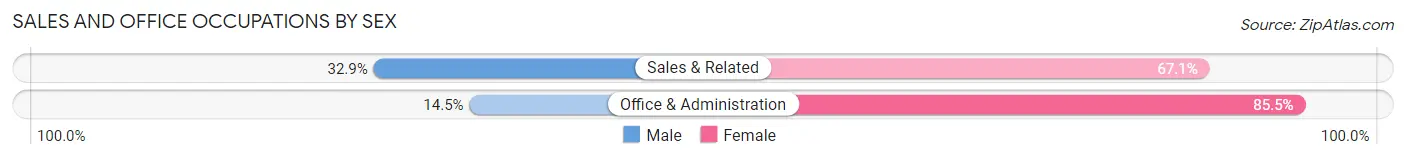
| Occupation | Male | Female |
| Sales & Related | 25 (32.9%) | 51 (67.1%) |
| Office & Administration | 12 (14.5%) | 71 (85.5%) |
| Total (Category) | 37 (23.3%) | 122 (76.7%) |
| Total (Overall) | 523 (47.7%) | 574 (52.3%) |
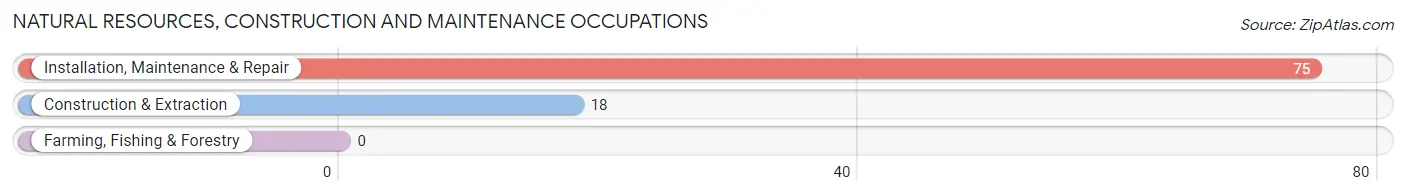
Natural Resources, Construction and Maintenance Occupations
The most common Natural Resources, Construction and Maintenance occupations in Lebanon borough are Installation, Maintenance & Repair (75 | 6.8%), and Construction & Extraction (18 | 1.6%).
Natural Resources, Construction and Maintenance Occupations by Sex
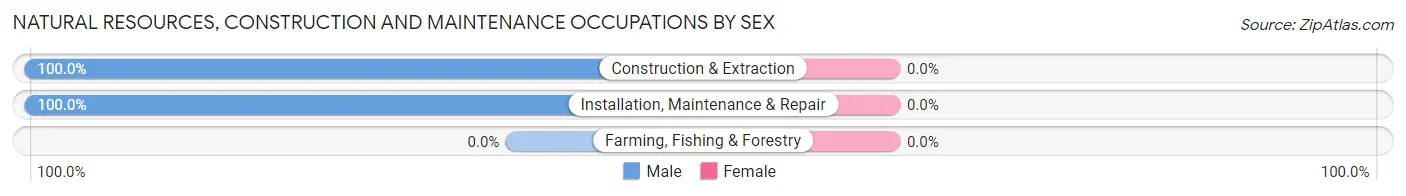
| Occupation | Male | Female |
| Farming, Fishing & Forestry | 0 (0.0%) | 0 (0.0%) |
| Construction & Extraction | 18 (100.0%) | 0 (0.0%) |
| Installation, Maintenance & Repair | 75 (100.0%) | 0 (0.0%) |
| Total (Category) | 93 (100.0%) | 0 (0.0%) |
| Total (Overall) | 523 (47.7%) | 574 (52.3%) |
Production, Transportation and Moving Occupations
The most common Production, Transportation and Moving occupations in Lebanon borough are Transportation (19 | 1.7%), Production (14 | 1.3%), and Material Moving (2 | 0.2%).
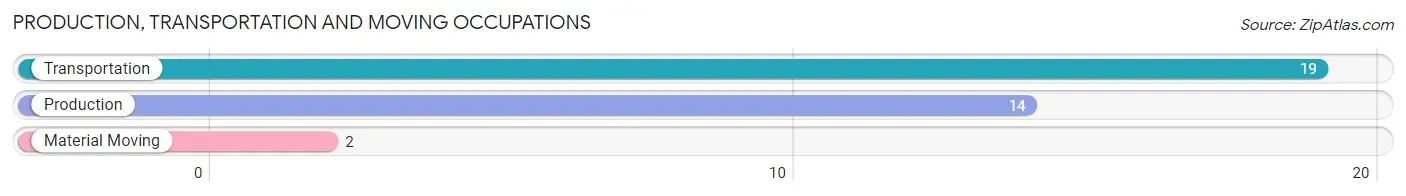
Production, Transportation and Moving Occupations by Sex
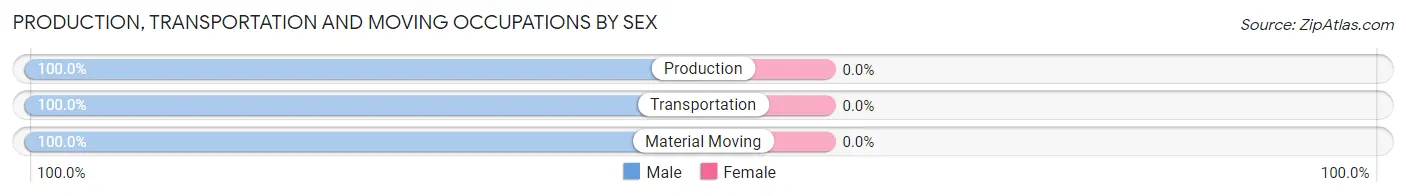
| Occupation | Male | Female |
| Production | 14 (100.0%) | 0 (0.0%) |
| Transportation | 19 (100.0%) | 0 (0.0%) |
| Material Moving | 2 (100.0%) | 0 (0.0%) |
| Total (Category) | 35 (100.0%) | 0 (0.0%) |
| Total (Overall) | 523 (47.7%) | 574 (52.3%) |
Employment Industries by Sex in Lebanon borough
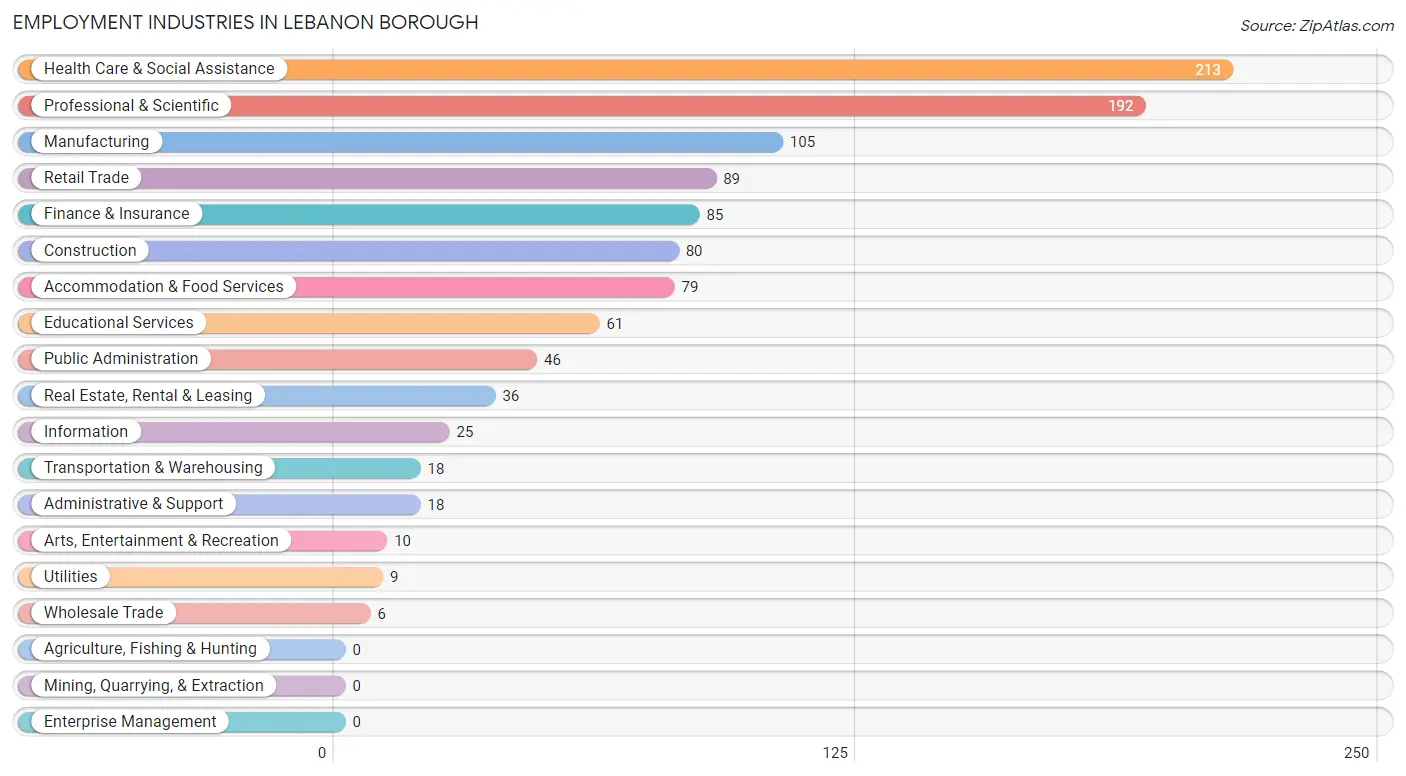
Employment Industries in Lebanon borough
The major employment industries in Lebanon borough include Health Care & Social Assistance (213 | 19.4%), Professional & Scientific (192 | 17.5%), Manufacturing (105 | 9.6%), Retail Trade (89 | 8.1%), and Finance & Insurance (85 | 7.7%).
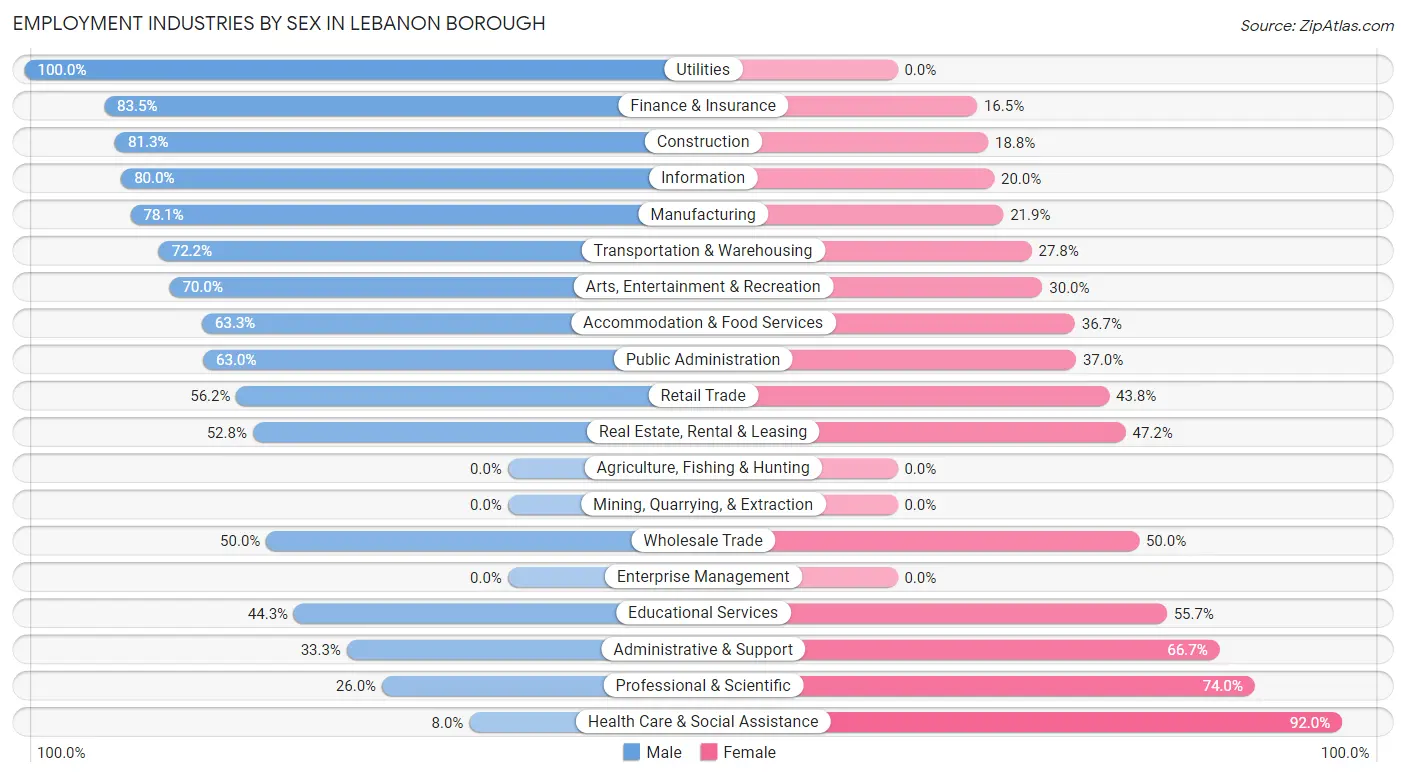
Employment Industries by Sex in Lebanon borough
The Lebanon borough industries that see more men than women are Utilities (100.0%), Finance & Insurance (83.5%), and Construction (81.2%), whereas the industries that tend to have a higher number of women are Health Care & Social Assistance (92.0%), Professional & Scientific (74.0%), and Administrative & Support (66.7%).
| Industry | Male | Female |
| Agriculture, Fishing & Hunting | 0 (0.0%) | 0 (0.0%) |
| Mining, Quarrying, & Extraction | 0 (0.0%) | 0 (0.0%) |
| Construction | 65 (81.2%) | 15 (18.8%) |
| Manufacturing | 82 (78.1%) | 23 (21.9%) |
| Wholesale Trade | 3 (50.0%) | 3 (50.0%) |
| Retail Trade | 50 (56.2%) | 39 (43.8%) |
| Transportation & Warehousing | 13 (72.2%) | 5 (27.8%) |
| Utilities | 9 (100.0%) | 0 (0.0%) |
| Information | 20 (80.0%) | 5 (20.0%) |
| Finance & Insurance | 71 (83.5%) | 14 (16.5%) |
| Real Estate, Rental & Leasing | 19 (52.8%) | 17 (47.2%) |
| Professional & Scientific | 50 (26.0%) | 142 (74.0%) |
| Enterprise Management | 0 (0.0%) | 0 (0.0%) |
| Administrative & Support | 6 (33.3%) | 12 (66.7%) |
| Educational Services | 27 (44.3%) | 34 (55.7%) |
| Health Care & Social Assistance | 17 (8.0%) | 196 (92.0%) |
| Arts, Entertainment & Recreation | 7 (70.0%) | 3 (30.0%) |
| Accommodation & Food Services | 50 (63.3%) | 29 (36.7%) |
| Public Administration | 29 (63.0%) | 17 (37.0%) |
| Total | 523 (47.7%) | 574 (52.3%) |
Education in Lebanon borough
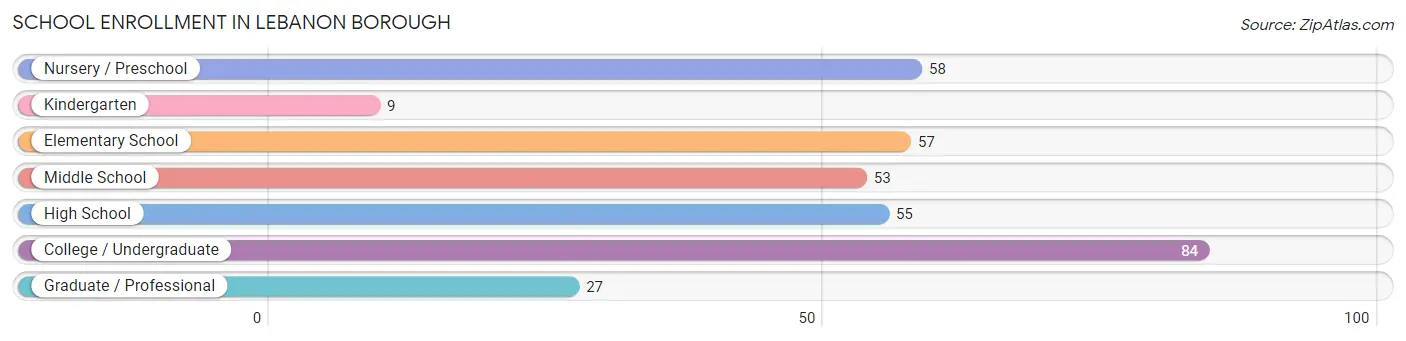
School Enrollment in Lebanon borough
The most common levels of schooling among the 343 students in Lebanon borough are college / undergraduate (84 | 24.5%), nursery / preschool (58 | 16.9%), and elementary school (57 | 16.6%).
| School Level | # Students | % Students |
| Nursery / Preschool | 58 | 16.9% |
| Kindergarten | 9 | 2.6% |
| Elementary School | 57 | 16.6% |
| Middle School | 53 | 15.4% |
| High School | 55 | 16.0% |
| College / Undergraduate | 84 | 24.5% |
| Graduate / Professional | 27 | 7.9% |
| Total | 343 | 100.0% |
School Enrollment by Age by Funding Source in Lebanon borough
Out of a total of 343 students who are enrolled in schools in Lebanon borough, 84 (24.5%) attend a private institution, while the remaining 259 (75.5%) are enrolled in public schools. The age group of 3 to 4 year olds has the highest likelihood of being enrolled in private schools, with 39 (67.2% in the age bracket) enrolled. Conversely, the age group of 5 to 9 year old has the lowest likelihood of being enrolled in a private school, with 50 (94.3% in the age bracket) attending a public institution.
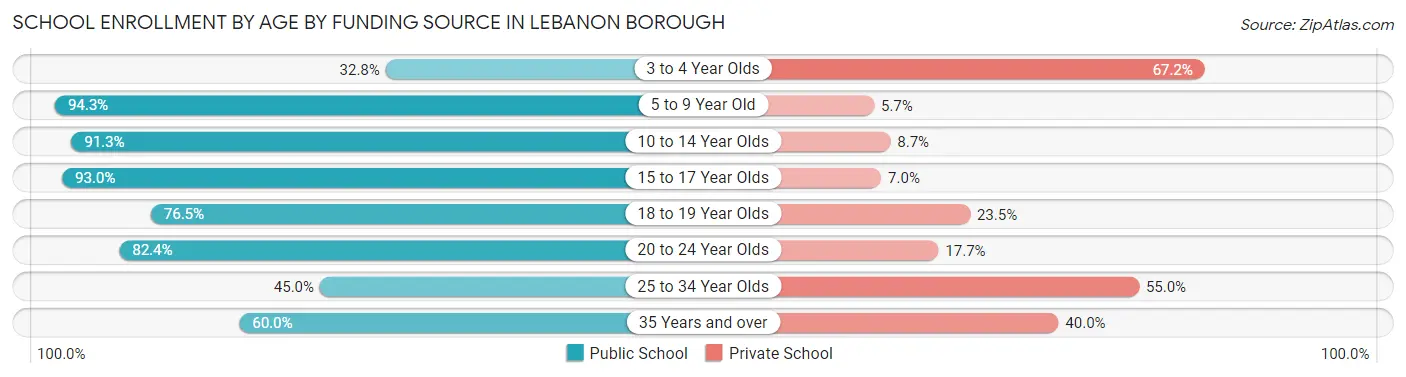
| Age Bracket | Public School | Private School |
| 3 to 4 Year Olds | 19 (32.8%) | 39 (67.2%) |
| 5 to 9 Year Old | 50 (94.3%) | 3 (5.7%) |
| 10 to 14 Year Olds | 63 (91.3%) | 6 (8.7%) |
| 15 to 17 Year Olds | 40 (93.0%) | 3 (7.0%) |
| 18 to 19 Year Olds | 13 (76.5%) | 4 (23.5%) |
| 20 to 24 Year Olds | 56 (82.4%) | 12 (17.6%) |
| 25 to 34 Year Olds | 9 (45.0%) | 11 (55.0%) |
| 35 Years and over | 9 (60.0%) | 6 (40.0%) |
| Total | 259 (75.5%) | 84 (24.5%) |
Educational Attainment by Field of Study in Lebanon borough
Science & technology (179 | 19.0%), business (154 | 16.4%), social sciences (136 | 14.4%), literature & languages (106 | 11.3%), and engineering (92 | 9.8%) are the most common fields of study among 941 individuals in Lebanon borough who have obtained a bachelor's degree or higher.
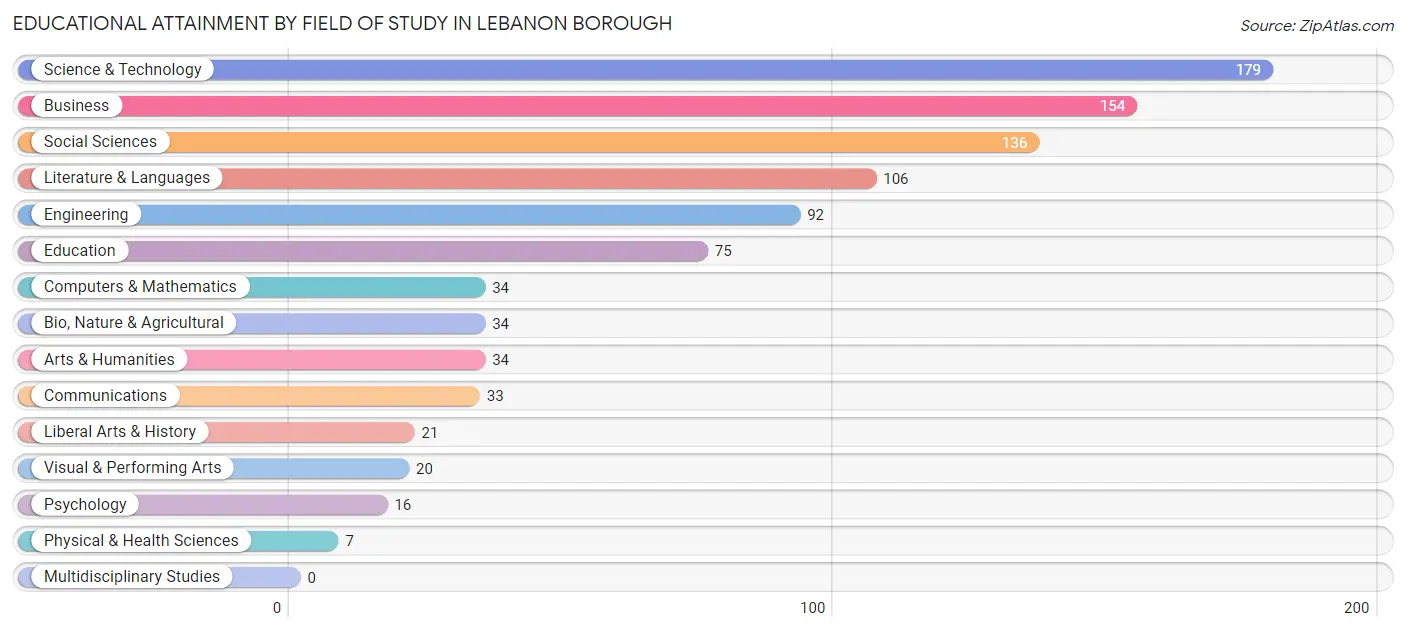
| Field of Study | # Graduates | % Graduates |
| Computers & Mathematics | 34 | 3.6% |
| Bio, Nature & Agricultural | 34 | 3.6% |
| Physical & Health Sciences | 7 | 0.7% |
| Psychology | 16 | 1.7% |
| Social Sciences | 136 | 14.4% |
| Engineering | 92 | 9.8% |
| Multidisciplinary Studies | 0 | 0.0% |
| Science & Technology | 179 | 19.0% |
| Business | 154 | 16.4% |
| Education | 75 | 8.0% |
| Literature & Languages | 106 | 11.3% |
| Liberal Arts & History | 21 | 2.2% |
| Visual & Performing Arts | 20 | 2.1% |
| Communications | 33 | 3.5% |
| Arts & Humanities | 34 | 3.6% |
| Total | 941 | 100.0% |
Transportation & Commute in Lebanon borough
Vehicle Availability by Sex in Lebanon borough
The most prevalent vehicle ownership categories in Lebanon borough are males with 2 vehicles (223, accounting for 43.5%) and females with 2 vehicles (173, making up 39.3%).
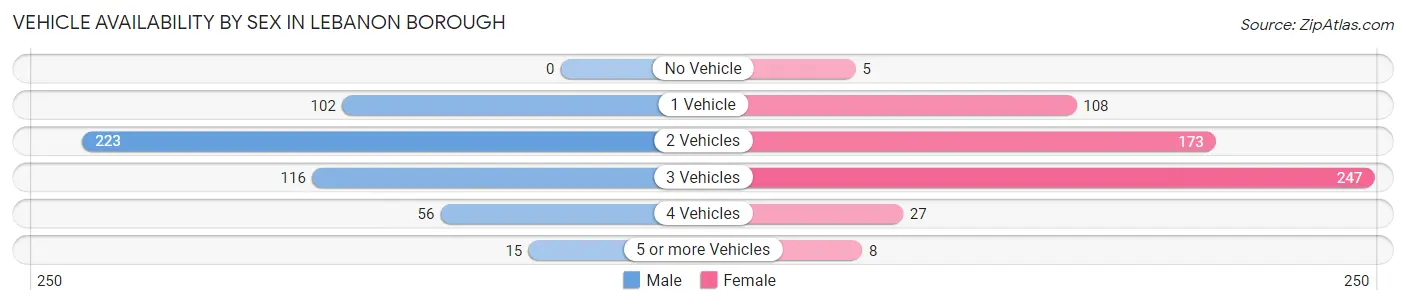
| Vehicles Available | Male | Female |
| No Vehicle | 0 (0.0%) | 5 (0.9%) |
| 1 Vehicle | 102 (19.9%) | 108 (19.0%) |
| 2 Vehicles | 223 (43.5%) | 173 (30.5%) |
| 3 Vehicles | 116 (22.7%) | 247 (43.5%) |
| 4 Vehicles | 56 (10.9%) | 27 (4.8%) |
| 5 or more Vehicles | 15 (2.9%) | 8 (1.4%) |
| Total | 512 (100.0%) | 568 (100.0%) |
Commute Time in Lebanon borough
The most frequently occuring commute durations in Lebanon borough are 45 to 59 minutes (208 commuters, 25.9%), 30 to 34 minutes (93 commuters, 11.6%), and 20 to 24 minutes (87 commuters, 10.8%).
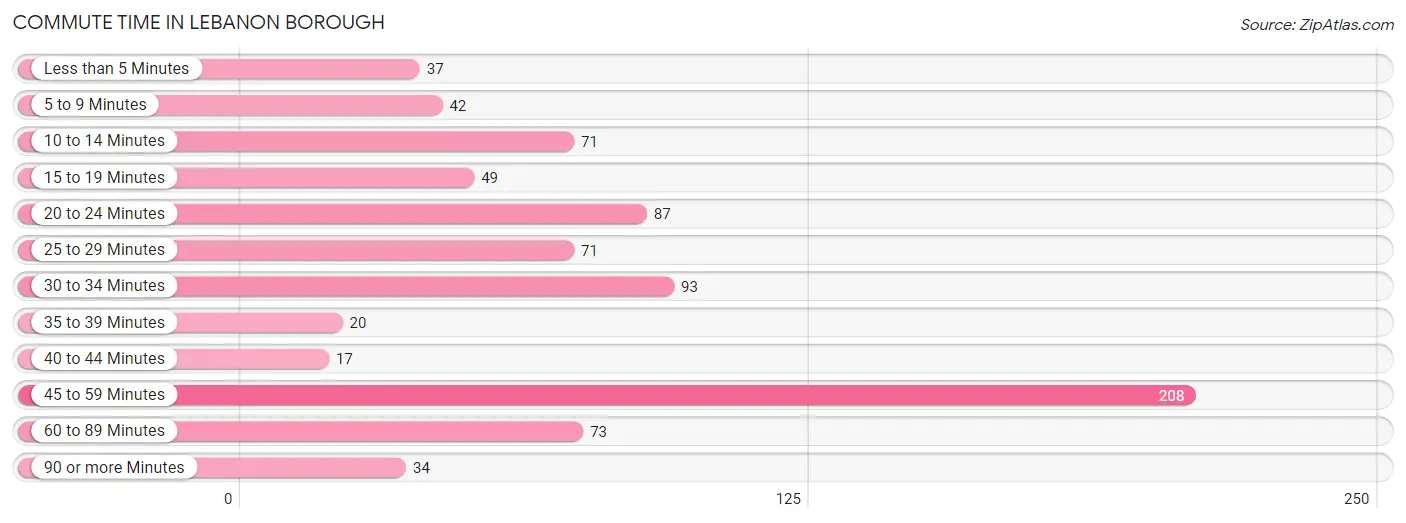
| Commute Time | # Commuters | % Commuters |
| Less than 5 Minutes | 37 | 4.6% |
| 5 to 9 Minutes | 42 | 5.2% |
| 10 to 14 Minutes | 71 | 8.8% |
| 15 to 19 Minutes | 49 | 6.1% |
| 20 to 24 Minutes | 87 | 10.8% |
| 25 to 29 Minutes | 71 | 8.8% |
| 30 to 34 Minutes | 93 | 11.6% |
| 35 to 39 Minutes | 20 | 2.5% |
| 40 to 44 Minutes | 17 | 2.1% |
| 45 to 59 Minutes | 208 | 25.9% |
| 60 to 89 Minutes | 73 | 9.1% |
| 90 or more Minutes | 34 | 4.2% |
Commute Time by Sex in Lebanon borough
The most common commute times in Lebanon borough are 60 to 89 minutes (58 commuters, 14.5%) for males and 45 to 59 minutes (152 commuters, 37.8%) for females.
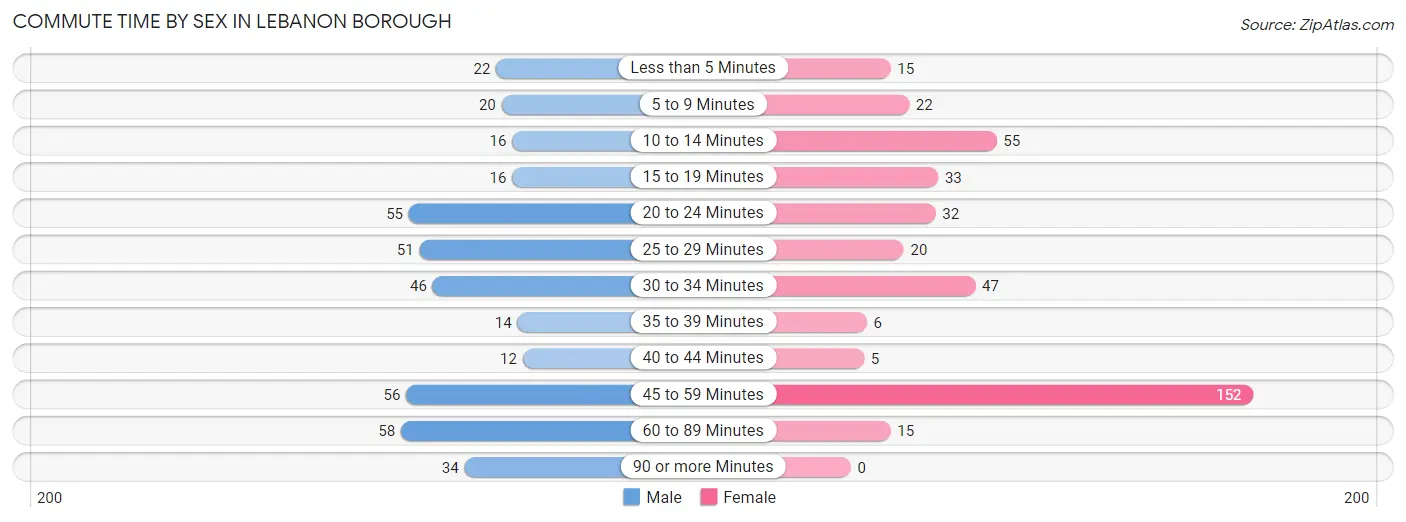
| Commute Time | Male | Female |
| Less than 5 Minutes | 22 (5.5%) | 15 (3.7%) |
| 5 to 9 Minutes | 20 (5.0%) | 22 (5.5%) |
| 10 to 14 Minutes | 16 (4.0%) | 55 (13.7%) |
| 15 to 19 Minutes | 16 (4.0%) | 33 (8.2%) |
| 20 to 24 Minutes | 55 (13.8%) | 32 (8.0%) |
| 25 to 29 Minutes | 51 (12.8%) | 20 (5.0%) |
| 30 to 34 Minutes | 46 (11.5%) | 47 (11.7%) |
| 35 to 39 Minutes | 14 (3.5%) | 6 (1.5%) |
| 40 to 44 Minutes | 12 (3.0%) | 5 (1.2%) |
| 45 to 59 Minutes | 56 (14.0%) | 152 (37.8%) |
| 60 to 89 Minutes | 58 (14.5%) | 15 (3.7%) |
| 90 or more Minutes | 34 (8.5%) | 0 (0.0%) |
Time of Departure to Work by Sex in Lebanon borough
The most frequent times of departure to work in Lebanon borough are 6:00 AM to 6:29 AM (55, 13.8%) for males and 11:00 AM to 11:59 AM (120, 29.8%) for females.
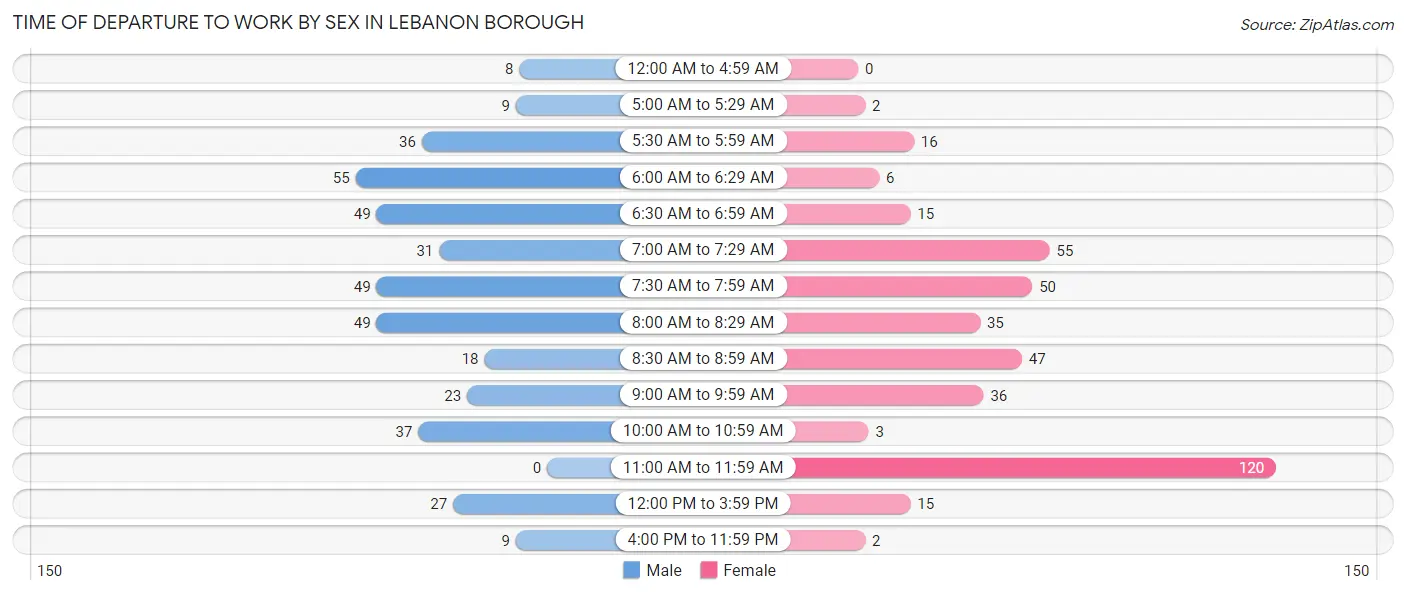
| Time of Departure | Male | Female |
| 12:00 AM to 4:59 AM | 8 (2.0%) | 0 (0.0%) |
| 5:00 AM to 5:29 AM | 9 (2.2%) | 2 (0.5%) |
| 5:30 AM to 5:59 AM | 36 (9.0%) | 16 (4.0%) |
| 6:00 AM to 6:29 AM | 55 (13.8%) | 6 (1.5%) |
| 6:30 AM to 6:59 AM | 49 (12.2%) | 15 (3.7%) |
| 7:00 AM to 7:29 AM | 31 (7.7%) | 55 (13.7%) |
| 7:30 AM to 7:59 AM | 49 (12.2%) | 50 (12.4%) |
| 8:00 AM to 8:29 AM | 49 (12.2%) | 35 (8.7%) |
| 8:30 AM to 8:59 AM | 18 (4.5%) | 47 (11.7%) |
| 9:00 AM to 9:59 AM | 23 (5.8%) | 36 (9.0%) |
| 10:00 AM to 10:59 AM | 37 (9.2%) | 3 (0.7%) |
| 11:00 AM to 11:59 AM | 0 (0.0%) | 120 (29.8%) |
| 12:00 PM to 3:59 PM | 27 (6.8%) | 15 (3.7%) |
| 4:00 PM to 11:59 PM | 9 (2.2%) | 2 (0.5%) |
| Total | 400 (100.0%) | 402 (100.0%) |
Housing Occupancy in Lebanon borough
Occupancy by Ownership in Lebanon borough
Of the total 780 dwellings in Lebanon borough, owner-occupied units account for 435 (55.8%), while renter-occupied units make up 345 (44.2%).
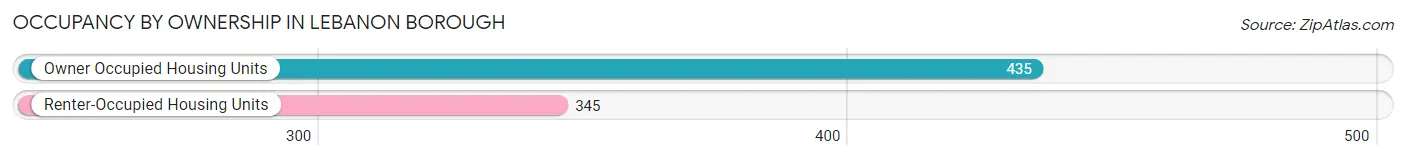
| Occupancy | # Housing Units | % Housing Units |
| Owner Occupied Housing Units | 435 | 55.8% |
| Renter-Occupied Housing Units | 345 | 44.2% |
| Total Occupied Housing Units | 780 | 100.0% |
Occupancy by Household Size in Lebanon borough
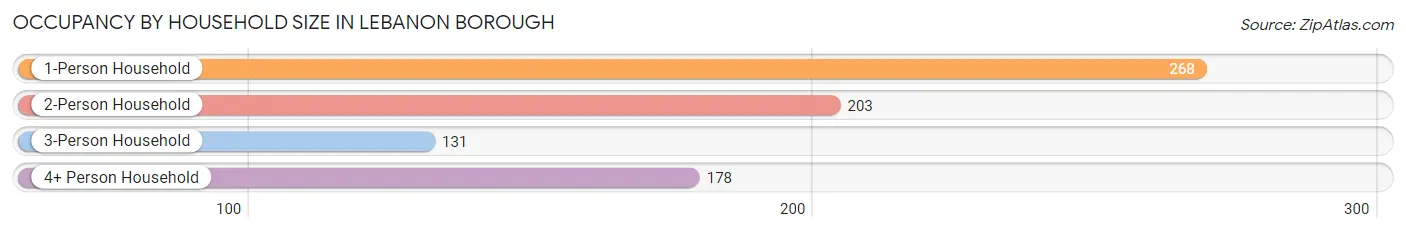
| Household Size | # Housing Units | % Housing Units |
| 1-Person Household | 268 | 34.4% |
| 2-Person Household | 203 | 26.0% |
| 3-Person Household | 131 | 16.8% |
| 4+ Person Household | 178 | 22.8% |
| Total Housing Units | 780 | 100.0% |
Occupancy by Ownership by Household Size in Lebanon borough
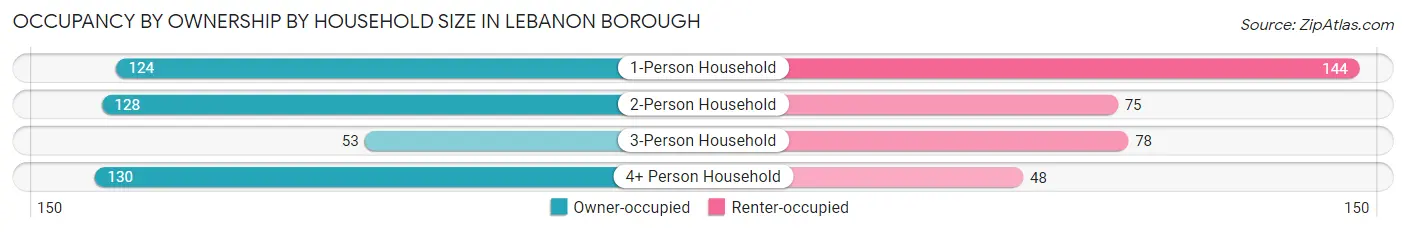
| Household Size | Owner-occupied | Renter-occupied |
| 1-Person Household | 124 (46.3%) | 144 (53.7%) |
| 2-Person Household | 128 (63.0%) | 75 (36.9%) |
| 3-Person Household | 53 (40.5%) | 78 (59.5%) |
| 4+ Person Household | 130 (73.0%) | 48 (27.0%) |
| Total Housing Units | 435 (55.8%) | 345 (44.2%) |
Occupancy by Educational Attainment in Lebanon borough
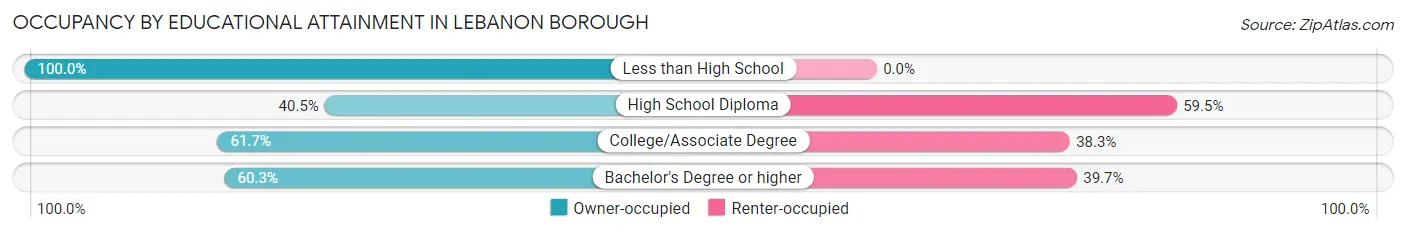
| Household Size | Owner-occupied | Renter-occupied |
| Less than High School | 2 (100.0%) | 0 (0.0%) |
| High School Diploma | 79 (40.5%) | 116 (59.5%) |
| College/Associate Degree | 100 (61.7%) | 62 (38.3%) |
| Bachelor's Degree or higher | 254 (60.3%) | 167 (39.7%) |
Occupancy by Age of Householder in Lebanon borough
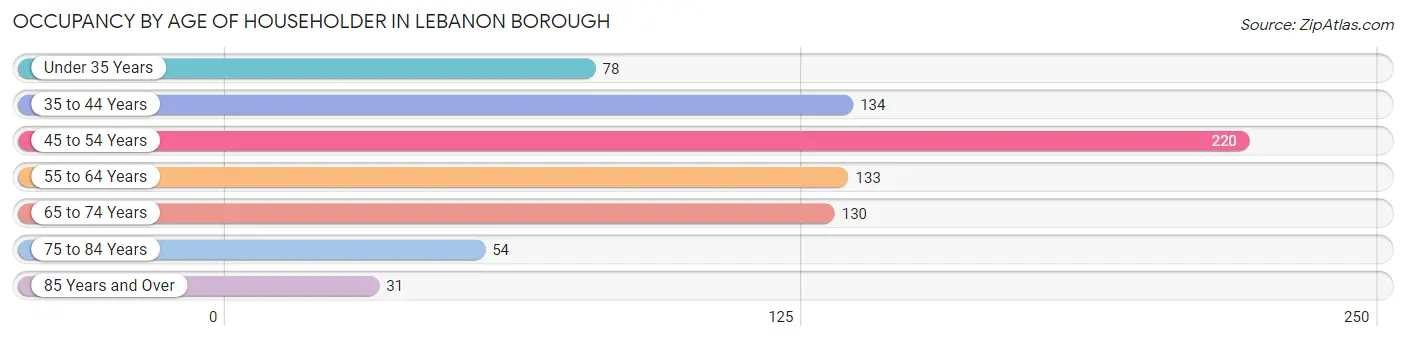
| Age Bracket | # Households | % Households |
| Under 35 Years | 78 | 10.0% |
| 35 to 44 Years | 134 | 17.2% |
| 45 to 54 Years | 220 | 28.2% |
| 55 to 64 Years | 133 | 17.1% |
| 65 to 74 Years | 130 | 16.7% |
| 75 to 84 Years | 54 | 6.9% |
| 85 Years and Over | 31 | 4.0% |
| Total | 780 | 100.0% |
Housing Finances in Lebanon borough
Median Income by Occupancy in Lebanon borough
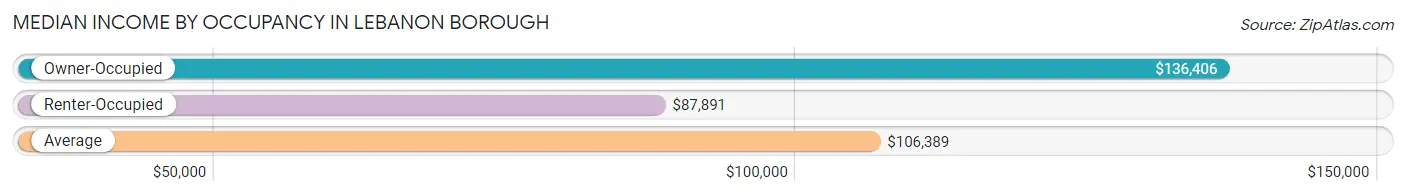
| Occupancy Type | # Households | Median Income |
| Owner-Occupied | 435 (55.8%) | $136,406 |
| Renter-Occupied | 345 (44.2%) | $87,891 |
| Average | 780 (100.0%) | $106,389 |
Occupancy by Householder Income Bracket in Lebanon borough
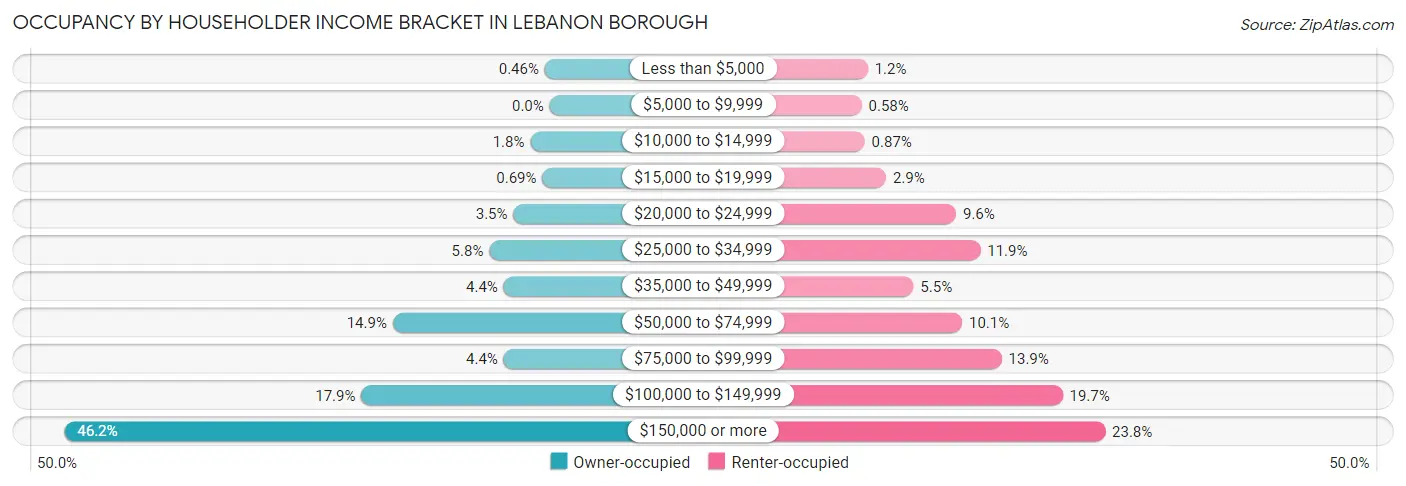
| Income Bracket | Owner-occupied | Renter-occupied |
| Less than $5,000 | 2 (0.5%) | 4 (1.2%) |
| $5,000 to $9,999 | 0 (0.0%) | 2 (0.6%) |
| $10,000 to $14,999 | 8 (1.8%) | 3 (0.9%) |
| $15,000 to $19,999 | 3 (0.7%) | 10 (2.9%) |
| $20,000 to $24,999 | 15 (3.5%) | 33 (9.6%) |
| $25,000 to $34,999 | 25 (5.8%) | 41 (11.9%) |
| $35,000 to $49,999 | 19 (4.4%) | 19 (5.5%) |
| $50,000 to $74,999 | 65 (14.9%) | 35 (10.1%) |
| $75,000 to $99,999 | 19 (4.4%) | 48 (13.9%) |
| $100,000 to $149,999 | 78 (17.9%) | 68 (19.7%) |
| $150,000 or more | 201 (46.2%) | 82 (23.8%) |
| Total | 435 (100.0%) | 345 (100.0%) |
Monthly Housing Cost Tiers in Lebanon borough
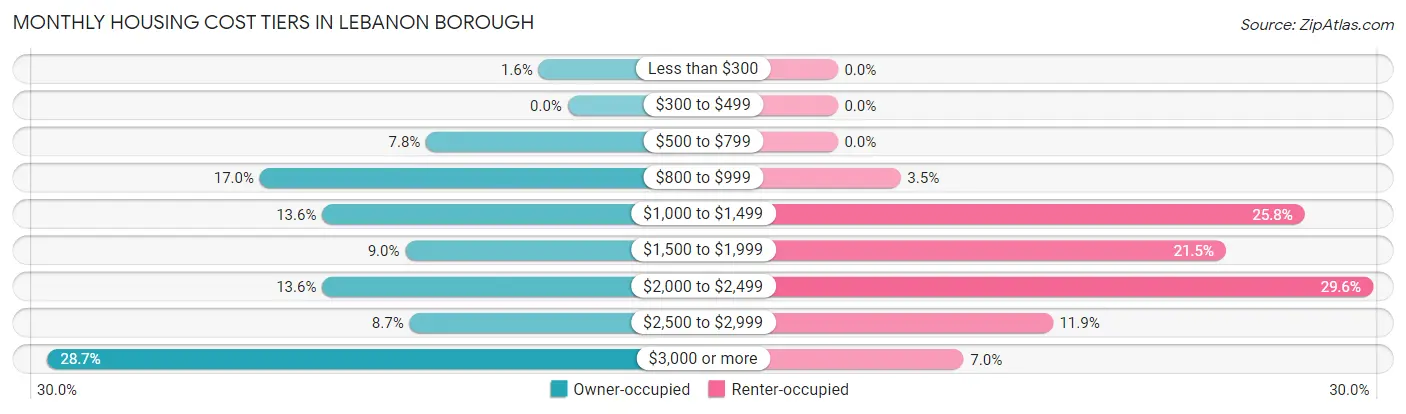
| Monthly Cost | Owner-occupied | Renter-occupied |
| Less than $300 | 7 (1.6%) | 0 (0.0%) |
| $300 to $499 | 0 (0.0%) | 0 (0.0%) |
| $500 to $799 | 34 (7.8%) | 0 (0.0%) |
| $800 to $999 | 74 (17.0%) | 12 (3.5%) |
| $1,000 to $1,499 | 59 (13.6%) | 89 (25.8%) |
| $1,500 to $1,999 | 39 (9.0%) | 74 (21.4%) |
| $2,000 to $2,499 | 59 (13.6%) | 102 (29.6%) |
| $2,500 to $2,999 | 38 (8.7%) | 41 (11.9%) |
| $3,000 or more | 125 (28.7%) | 24 (7.0%) |
| Total | 435 (100.0%) | 345 (100.0%) |
Physical Housing Characteristics in Lebanon borough
Housing Structures in Lebanon borough
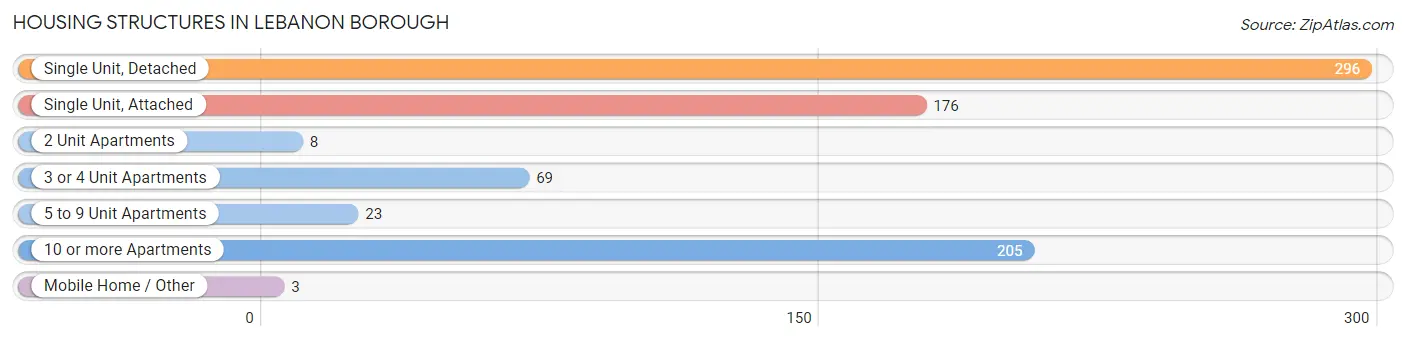
| Structure Type | # Housing Units | % Housing Units |
| Single Unit, Detached | 296 | 38.0% |
| Single Unit, Attached | 176 | 22.6% |
| 2 Unit Apartments | 8 | 1.0% |
| 3 or 4 Unit Apartments | 69 | 8.8% |
| 5 to 9 Unit Apartments | 23 | 2.9% |
| 10 or more Apartments | 205 | 26.3% |
| Mobile Home / Other | 3 | 0.4% |
| Total | 780 | 100.0% |
Housing Structures by Occupancy in Lebanon borough
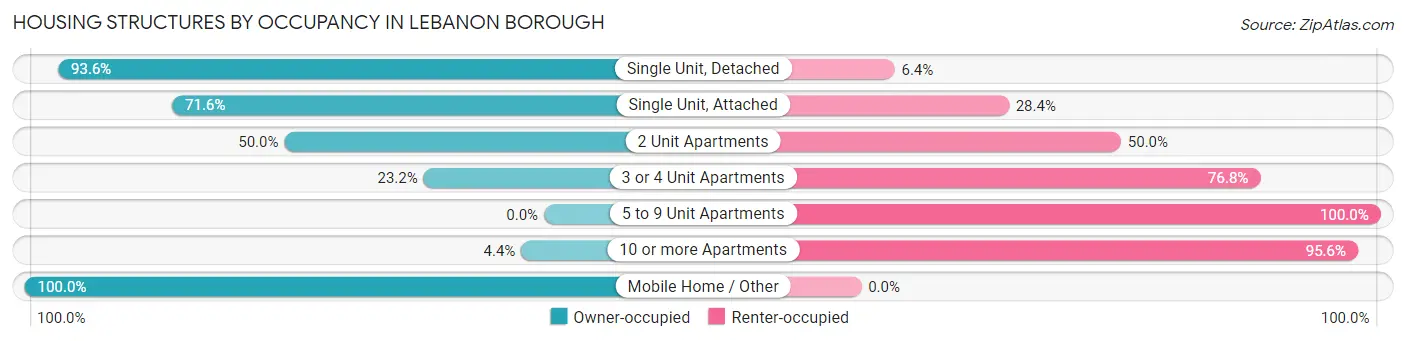
| Structure Type | Owner-occupied | Renter-occupied |
| Single Unit, Detached | 277 (93.6%) | 19 (6.4%) |
| Single Unit, Attached | 126 (71.6%) | 50 (28.4%) |
| 2 Unit Apartments | 4 (50.0%) | 4 (50.0%) |
| 3 or 4 Unit Apartments | 16 (23.2%) | 53 (76.8%) |
| 5 to 9 Unit Apartments | 0 (0.0%) | 23 (100.0%) |
| 10 or more Apartments | 9 (4.4%) | 196 (95.6%) |
| Mobile Home / Other | 3 (100.0%) | 0 (0.0%) |
| Total | 435 (55.8%) | 345 (44.2%) |
Housing Structures by Number of Rooms in Lebanon borough
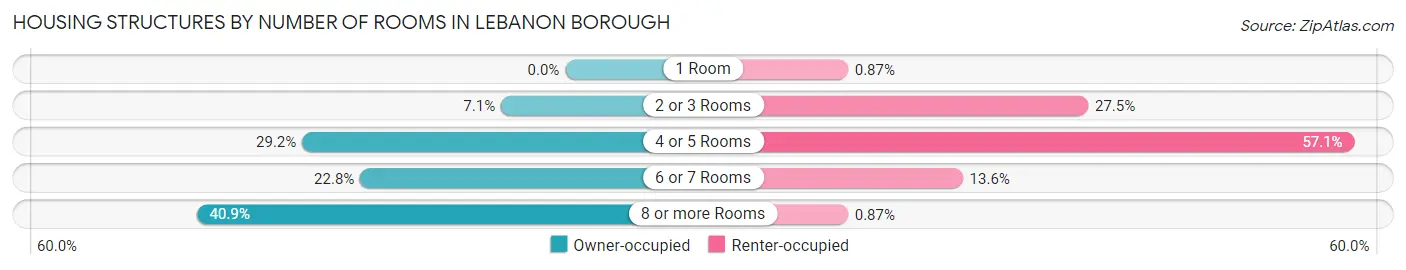
| Number of Rooms | Owner-occupied | Renter-occupied |
| 1 Room | 0 (0.0%) | 3 (0.9%) |
| 2 or 3 Rooms | 31 (7.1%) | 95 (27.5%) |
| 4 or 5 Rooms | 127 (29.2%) | 197 (57.1%) |
| 6 or 7 Rooms | 99 (22.8%) | 47 (13.6%) |
| 8 or more Rooms | 178 (40.9%) | 3 (0.9%) |
| Total | 435 (100.0%) | 345 (100.0%) |
Housing Structure by Heating Type in Lebanon borough
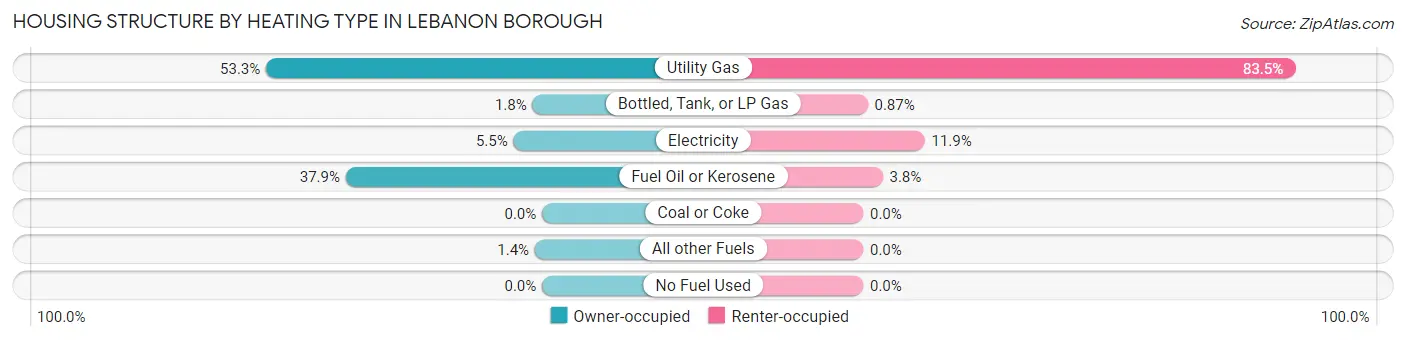
| Heating Type | Owner-occupied | Renter-occupied |
| Utility Gas | 232 (53.3%) | 288 (83.5%) |
| Bottled, Tank, or LP Gas | 8 (1.8%) | 3 (0.9%) |
| Electricity | 24 (5.5%) | 41 (11.9%) |
| Fuel Oil or Kerosene | 165 (37.9%) | 13 (3.8%) |
| Coal or Coke | 0 (0.0%) | 0 (0.0%) |
| All other Fuels | 6 (1.4%) | 0 (0.0%) |
| No Fuel Used | 0 (0.0%) | 0 (0.0%) |
| Total | 435 (100.0%) | 345 (100.0%) |
Household Vehicle Usage in Lebanon borough
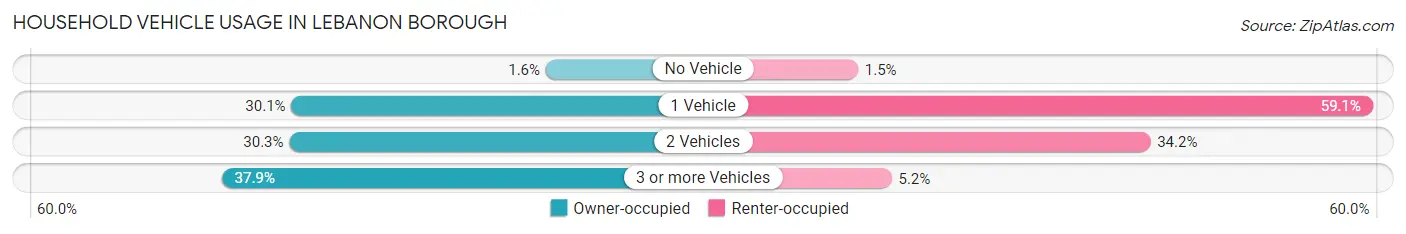
| Vehicles per Household | Owner-occupied | Renter-occupied |
| No Vehicle | 7 (1.6%) | 5 (1.5%) |
| 1 Vehicle | 131 (30.1%) | 204 (59.1%) |
| 2 Vehicles | 132 (30.3%) | 118 (34.2%) |
| 3 or more Vehicles | 165 (37.9%) | 18 (5.2%) |
| Total | 435 (100.0%) | 345 (100.0%) |
Real Estate & Mortgages in Lebanon borough
Real Estate and Mortgage Overview in Lebanon borough
| Characteristic | Without Mortgage | With Mortgage |
| Housing Units | 146 | 289 |
| Median Property Value | $346,900 | $403,100 |
| Median Household Income | $87,500 | $151 |
| Monthly Housing Costs | $949 | $125 |
| Real Estate Taxes | $7,111 | $0 |
Property Value by Mortgage Status in Lebanon borough
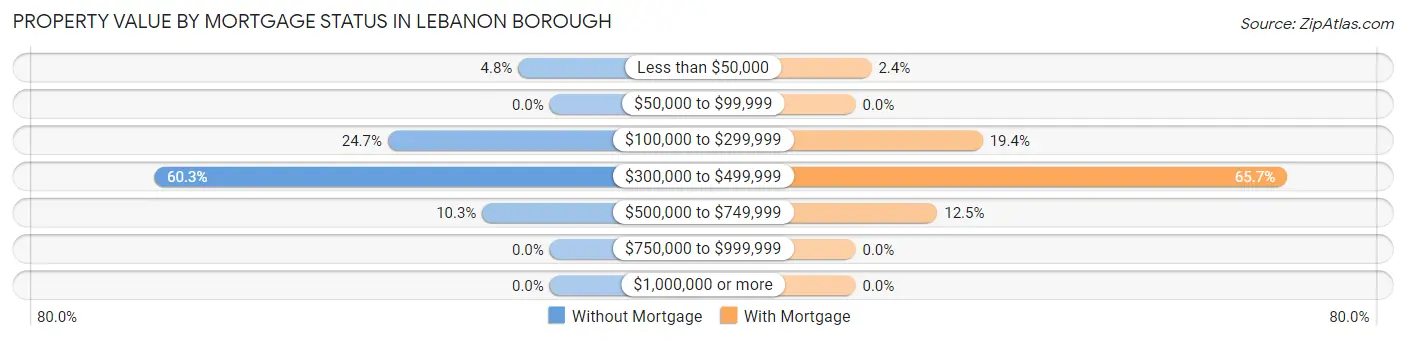
| Property Value | Without Mortgage | With Mortgage |
| Less than $50,000 | 7 (4.8%) | 7 (2.4%) |
| $50,000 to $99,999 | 0 (0.0%) | 0 (0.0%) |
| $100,000 to $299,999 | 36 (24.7%) | 56 (19.4%) |
| $300,000 to $499,999 | 88 (60.3%) | 190 (65.7%) |
| $500,000 to $749,999 | 15 (10.3%) | 36 (12.5%) |
| $750,000 to $999,999 | 0 (0.0%) | 0 (0.0%) |
| $1,000,000 or more | 0 (0.0%) | 0 (0.0%) |
| Total | 146 (100.0%) | 289 (100.0%) |
Household Income by Mortgage Status in Lebanon borough
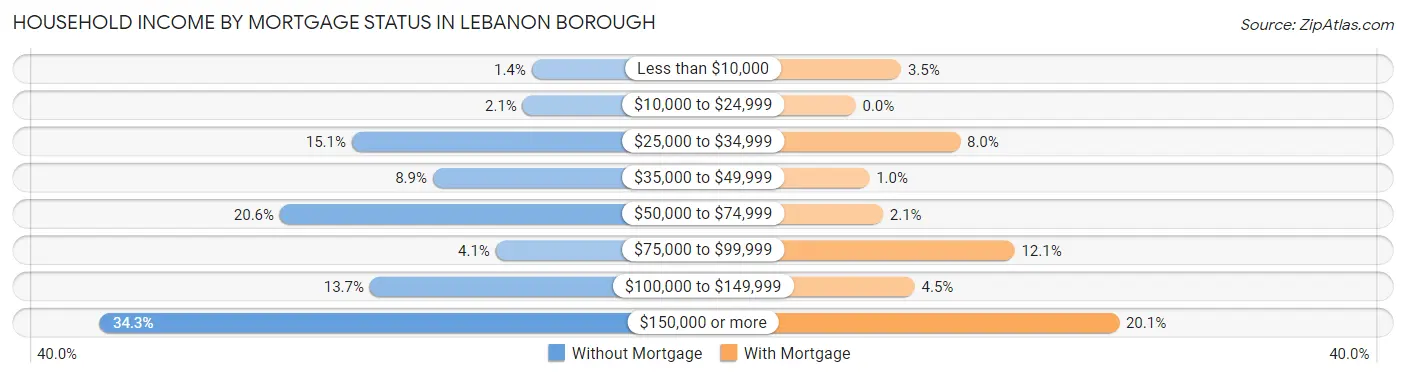
| Household Income | Without Mortgage | With Mortgage |
| Less than $10,000 | 2 (1.4%) | 10 (3.5%) |
| $10,000 to $24,999 | 3 (2.1%) | 0 (0.0%) |
| $25,000 to $34,999 | 22 (15.1%) | 23 (8.0%) |
| $35,000 to $49,999 | 13 (8.9%) | 3 (1.0%) |
| $50,000 to $74,999 | 30 (20.5%) | 6 (2.1%) |
| $75,000 to $99,999 | 6 (4.1%) | 35 (12.1%) |
| $100,000 to $149,999 | 20 (13.7%) | 13 (4.5%) |
| $150,000 or more | 50 (34.3%) | 58 (20.1%) |
| Total | 146 (100.0%) | 289 (100.0%) |
Property Value to Household Income Ratio in Lebanon borough
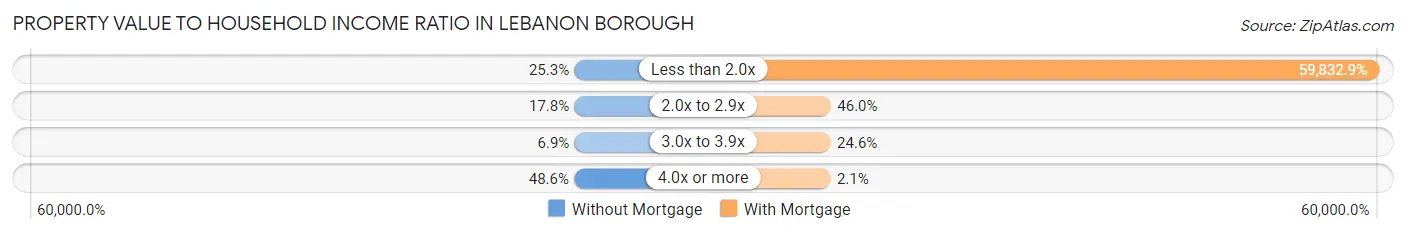
| Value-to-Income Ratio | Without Mortgage | With Mortgage |
| Less than 2.0x | 37 (25.3%) | 172,917 (59,832.9%) |
| 2.0x to 2.9x | 26 (17.8%) | 133 (46.0%) |
| 3.0x to 3.9x | 10 (6.9%) | 71 (24.6%) |
| 4.0x or more | 71 (48.6%) | 6 (2.1%) |
| Total | 146 (100.0%) | 289 (100.0%) |
Real Estate Taxes by Mortgage Status in Lebanon borough
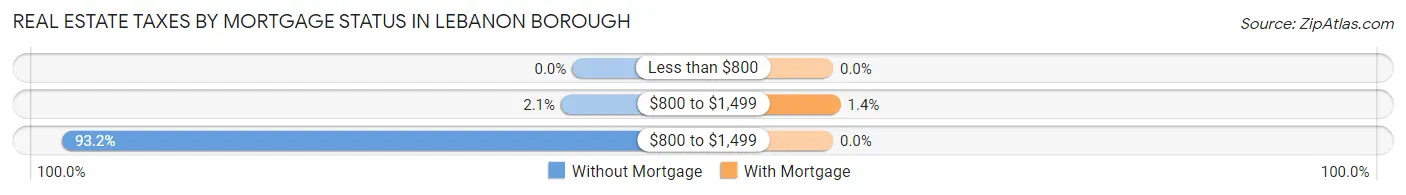
| Property Taxes | Without Mortgage | With Mortgage |
| Less than $800 | 0 (0.0%) | 0 (0.0%) |
| $800 to $1,499 | 3 (2.1%) | 4 (1.4%) |
| $800 to $1,499 | 136 (93.1%) | 0 (0.0%) |
| Total | 146 (100.0%) | 289 (100.0%) |
Health & Disability in Lebanon borough
Health Insurance Coverage by Age in Lebanon borough
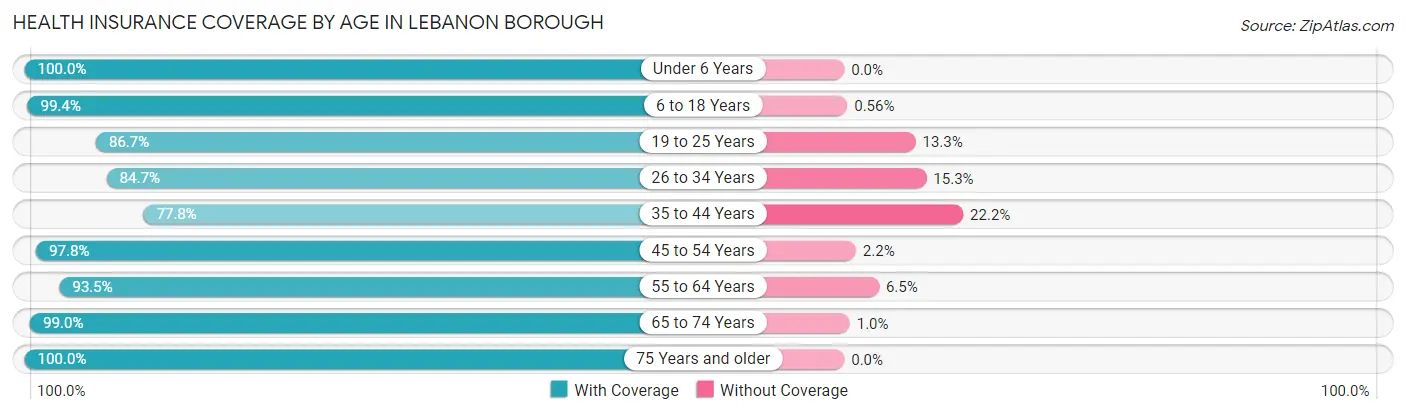
| Age Bracket | With Coverage | Without Coverage |
| Under 6 Years | 156 (100.0%) | 0 (0.0%) |
| 6 to 18 Years | 176 (99.4%) | 1 (0.6%) |
| 19 to 25 Years | 111 (86.7%) | 17 (13.3%) |
| 26 to 34 Years | 260 (84.7%) | 47 (15.3%) |
| 35 to 44 Years | 165 (77.8%) | 47 (22.2%) |
| 45 to 54 Years | 362 (97.8%) | 8 (2.2%) |
| 55 to 64 Years | 188 (93.5%) | 13 (6.5%) |
| 65 to 74 Years | 194 (99.0%) | 2 (1.0%) |
| 75 Years and older | 117 (100.0%) | 0 (0.0%) |
| Total | 1,729 (92.8%) | 135 (7.2%) |
Health Insurance Coverage by Citizenship Status in Lebanon borough
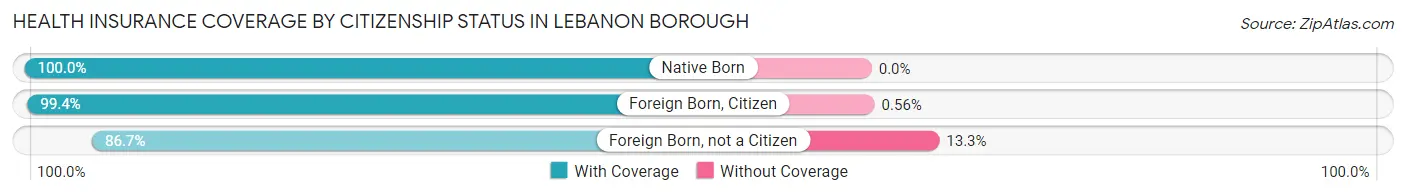
| Citizenship Status | With Coverage | Without Coverage |
| Native Born | 156 (100.0%) | 0 (0.0%) |
| Foreign Born, Citizen | 176 (99.4%) | 1 (0.6%) |
| Foreign Born, not a Citizen | 111 (86.7%) | 17 (13.3%) |
Health Insurance Coverage by Household Income in Lebanon borough
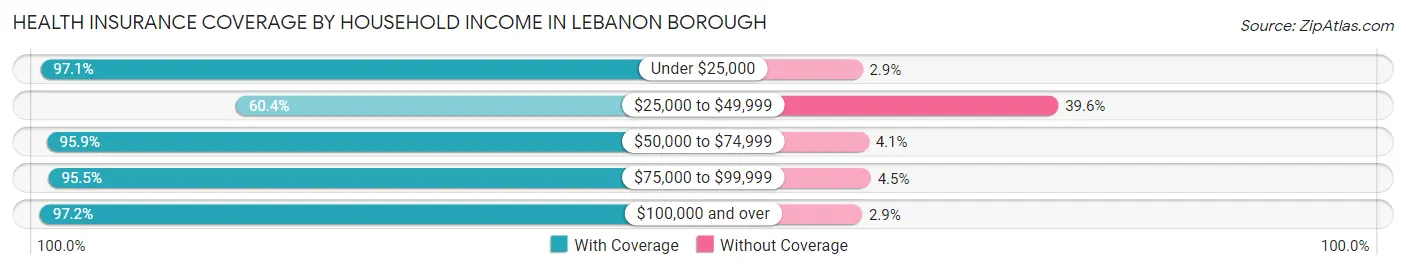
| Household Income | With Coverage | Without Coverage |
| Under $25,000 | 99 (97.1%) | 3 (2.9%) |
| $25,000 to $49,999 | 125 (60.4%) | 82 (39.6%) |
| $50,000 to $74,999 | 140 (95.9%) | 6 (4.1%) |
| $75,000 to $99,999 | 192 (95.5%) | 9 (4.5%) |
| $100,000 and over | 1,157 (97.2%) | 34 (2.9%) |
Public vs Private Health Insurance Coverage by Age in Lebanon borough
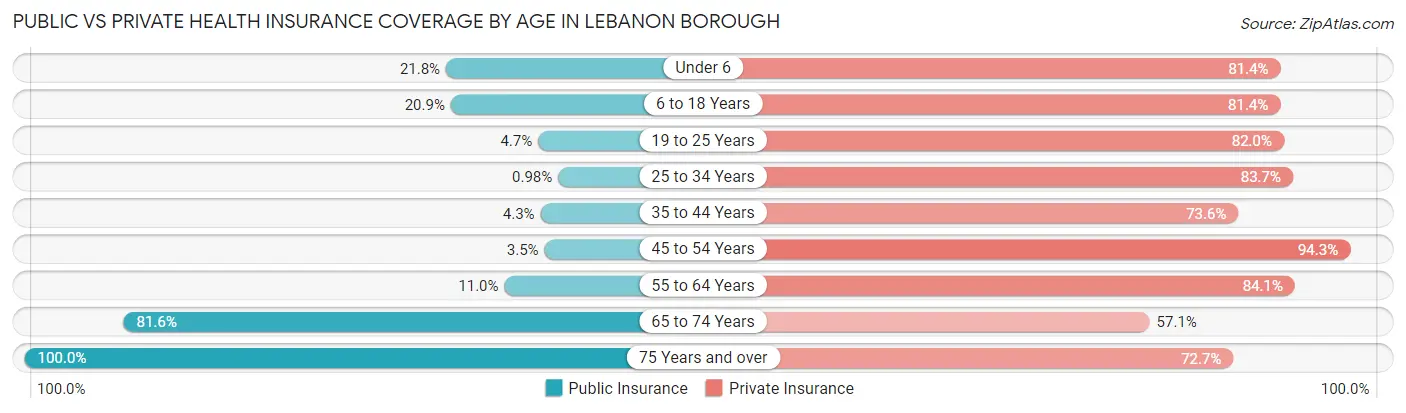
| Age Bracket | Public Insurance | Private Insurance |
| Under 6 | 34 (21.8%) | 127 (81.4%) |
| 6 to 18 Years | 37 (20.9%) | 144 (81.4%) |
| 19 to 25 Years | 6 (4.7%) | 105 (82.0%) |
| 25 to 34 Years | 3 (1.0%) | 257 (83.7%) |
| 35 to 44 Years | 9 (4.3%) | 156 (73.6%) |
| 45 to 54 Years | 13 (3.5%) | 349 (94.3%) |
| 55 to 64 Years | 22 (11.0%) | 169 (84.1%) |
| 65 to 74 Years | 160 (81.6%) | 112 (57.1%) |
| 75 Years and over | 117 (100.0%) | 85 (72.7%) |
| Total | 401 (21.5%) | 1,504 (80.7%) |
Disability Status by Sex by Age in Lebanon borough
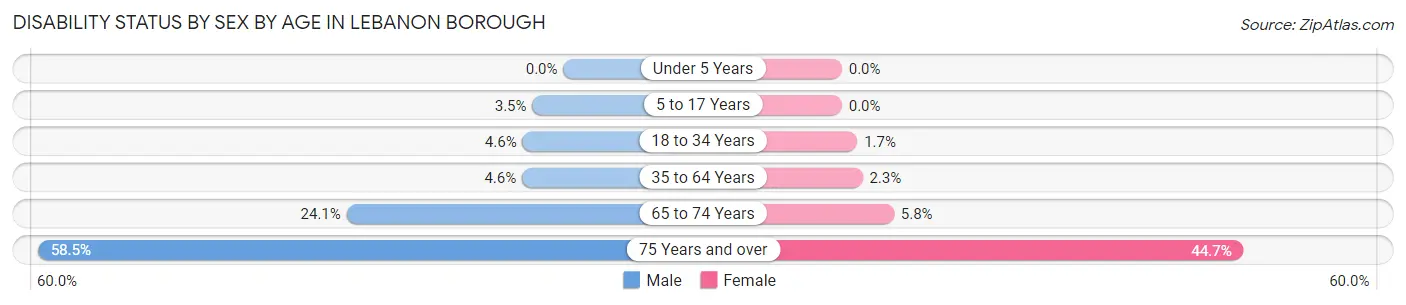
| Age Bracket | Male | Female |
| Under 5 Years | 0 (0.0%) | 0 (0.0%) |
| 5 to 17 Years | 3 (3.5%) | 0 (0.0%) |
| 18 to 34 Years | 7 (4.5%) | 5 (1.7%) |
| 35 to 64 Years | 18 (4.6%) | 9 (2.3%) |
| 65 to 74 Years | 14 (24.1%) | 8 (5.8%) |
| 75 Years and over | 24 (58.5%) | 34 (44.7%) |
Disability Class by Sex by Age in Lebanon borough
Disability Class: Hearing Difficulty
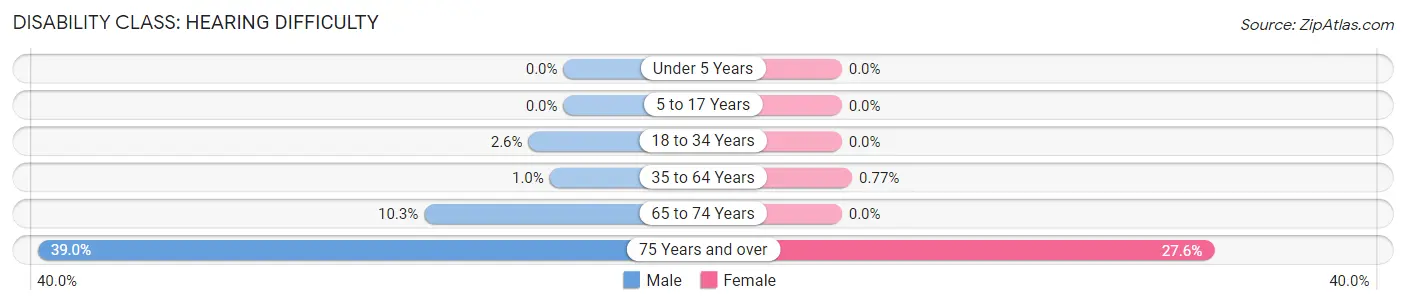
| Age Bracket | Male | Female |
| Under 5 Years | 0 (0.0%) | 0 (0.0%) |
| 5 to 17 Years | 0 (0.0%) | 0 (0.0%) |
| 18 to 34 Years | 4 (2.6%) | 0 (0.0%) |
| 35 to 64 Years | 4 (1.0%) | 3 (0.8%) |
| 65 to 74 Years | 6 (10.3%) | 0 (0.0%) |
| 75 Years and over | 16 (39.0%) | 21 (27.6%) |
Disability Class: Vision Difficulty
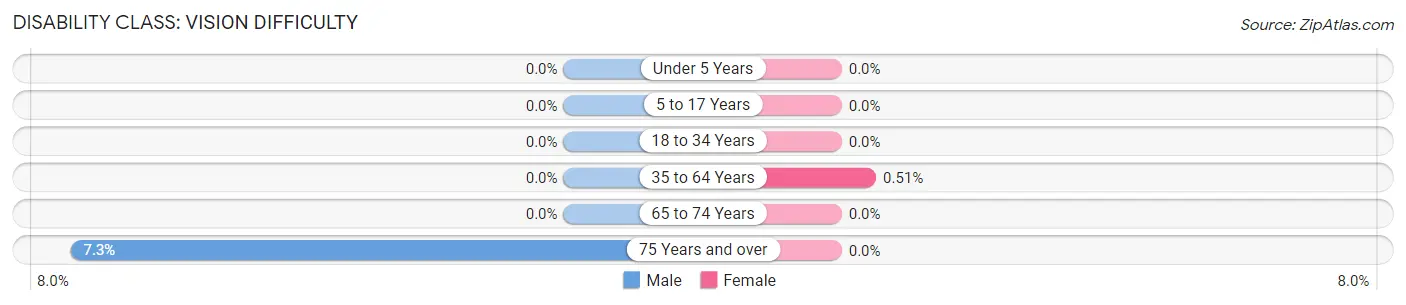
| Age Bracket | Male | Female |
| Under 5 Years | 0 (0.0%) | 0 (0.0%) |
| 5 to 17 Years | 0 (0.0%) | 0 (0.0%) |
| 18 to 34 Years | 0 (0.0%) | 0 (0.0%) |
| 35 to 64 Years | 0 (0.0%) | 2 (0.5%) |
| 65 to 74 Years | 0 (0.0%) | 0 (0.0%) |
| 75 Years and over | 3 (7.3%) | 0 (0.0%) |
Disability Class: Cognitive Difficulty
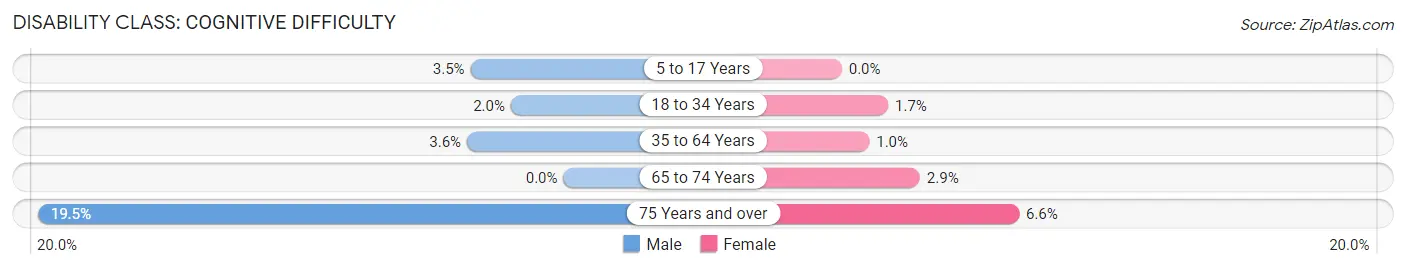
| Age Bracket | Male | Female |
| 5 to 17 Years | 3 (3.5%) | 0 (0.0%) |
| 18 to 34 Years | 3 (1.9%) | 5 (1.7%) |
| 35 to 64 Years | 14 (3.6%) | 4 (1.0%) |
| 65 to 74 Years | 0 (0.0%) | 4 (2.9%) |
| 75 Years and over | 8 (19.5%) | 5 (6.6%) |
Disability Class: Ambulatory Difficulty
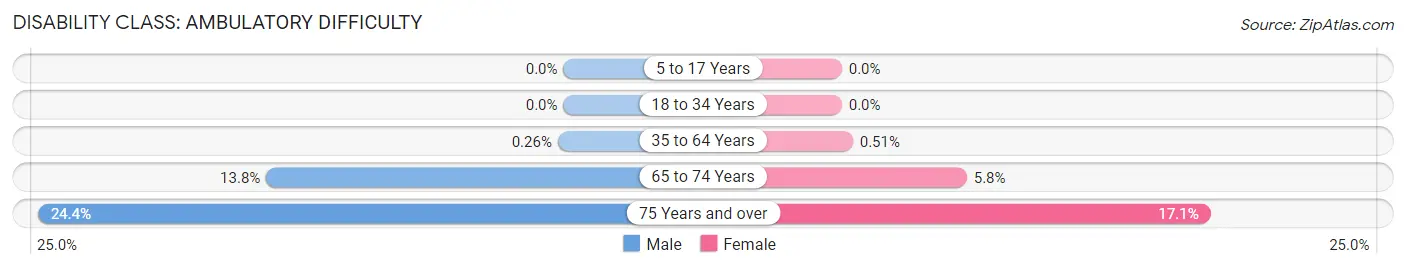
| Age Bracket | Male | Female |
| 5 to 17 Years | 0 (0.0%) | 0 (0.0%) |
| 18 to 34 Years | 0 (0.0%) | 0 (0.0%) |
| 35 to 64 Years | 1 (0.3%) | 2 (0.5%) |
| 65 to 74 Years | 8 (13.8%) | 8 (5.8%) |
| 75 Years and over | 10 (24.4%) | 13 (17.1%) |
Disability Class: Self-Care Difficulty
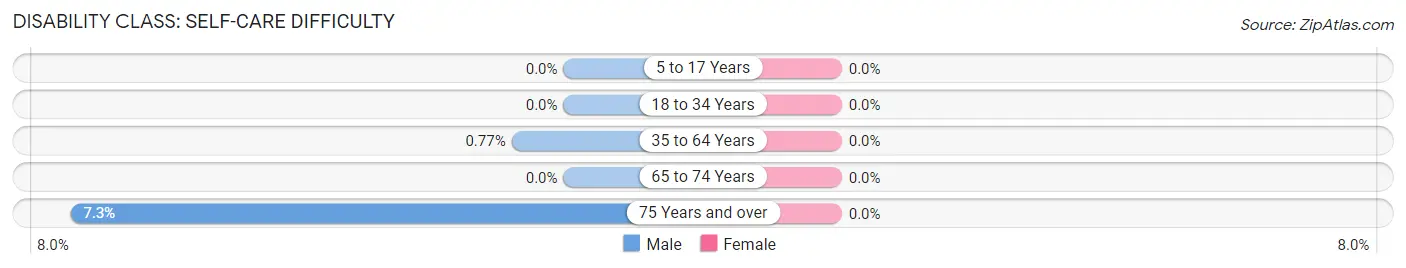
| Age Bracket | Male | Female |
| 5 to 17 Years | 0 (0.0%) | 0 (0.0%) |
| 18 to 34 Years | 0 (0.0%) | 0 (0.0%) |
| 35 to 64 Years | 3 (0.8%) | 0 (0.0%) |
| 65 to 74 Years | 0 (0.0%) | 0 (0.0%) |
| 75 Years and over | 3 (7.3%) | 0 (0.0%) |
Technology Access in Lebanon borough
Computing Device Access in Lebanon borough
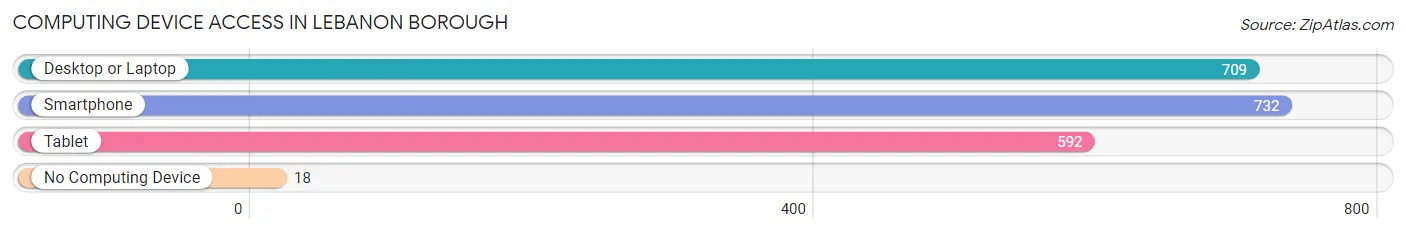
| Device Type | # Households | % Households |
| Desktop or Laptop | 709 | 90.9% |
| Smartphone | 732 | 93.9% |
| Tablet | 592 | 75.9% |
| No Computing Device | 18 | 2.3% |
| Total | 780 | 100.0% |
Internet Access in Lebanon borough
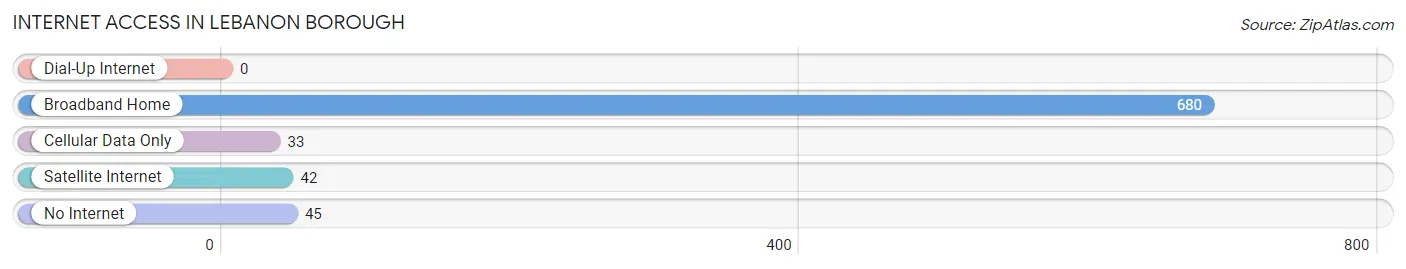
| Internet Type | # Households | % Households |
| Dial-Up Internet | 0 | 0.0% |
| Broadband Home | 680 | 87.2% |
| Cellular Data Only | 33 | 4.2% |
| Satellite Internet | 42 | 5.4% |
| No Internet | 45 | 5.8% |
| Total | 780 | 100.0% |
Lebanon borough Summary
Lebanon Borough is a small borough located in Hunterdon County, New Jersey. It is situated in the northwest corner of the county, and is bordered by Clinton Township to the north, Franklin Township to the east, and Tewksbury Township to the south and west. The borough is home to a population of approximately 1,400 people, and covers an area of 1.2 square miles.
History
Lebanon Borough was originally part of the larger Lebanon Township, which was established in 1731. The borough was incorporated in 1895, and was named after the biblical city of Lebanon. The area was originally inhabited by the Lenape Native Americans, and was later settled by Dutch and English colonists in the late 17th century. The area was primarily agricultural, and the main crops grown were wheat, corn, and potatoes.
In the 19th century, the area began to develop into a small industrial center, with several mills and factories being built. The most notable of these was the Lebanon Iron Works, which was established in 1845 and produced a variety of products, including nails, horseshoes, and farm implements. The iron works was the largest employer in the area, and provided jobs for many of the local residents.
Geography
Lebanon Borough is located in the northwest corner of Hunterdon County, and is bordered by Clinton Township to the north, Franklin Township to the east, and Tewksbury Township to the south and west. The borough is situated on the banks of the South Branch of the Raritan River, and is surrounded by rolling hills and farmland. The borough is located approximately 40 miles west of New York City, and is easily accessible via Interstate 78 and Route 22.
Economy
Lebanon Borough is a primarily residential community, and the majority of the local economy is based on small businesses and services. The borough is home to several small retail stores, restaurants, and professional services. The Lebanon Iron Works, which was established in 1845, is still in operation today and produces a variety of products, including nails, horseshoes, and farm implements. The borough is also home to several small manufacturing companies, including a plastics factory and a printing company.
Demographics
As of the 2010 census, the population of Lebanon Borough was 1,400, with a population density of 1,150 people per square mile. The median household income was $76,250, and the median family income was $87,500. The median age was 43.7 years, and the population was evenly split between males and females. The racial makeup of the borough was 94.3% White, 2.3% Hispanic or Latino, 1.3% Asian, and 1.1% African American.
Conclusion
Lebanon Borough is a small borough located in Hunterdon County, New Jersey. It is situated in the northwest corner of the county, and is bordered by Clinton Township to the north, Franklin Township to the east, and Tewksbury Township to the south and west. The borough is home to a population of approximately 1,400 people, and covers an area of 1.2 square miles. The local economy is based on small businesses and services, and the borough is home to several small retail stores, restaurants, and professional services. The population of Lebanon Borough is primarily White, with a median household income of $76,250 and a median family income of $87,500.
Common Questions
What is Per Capita Income in Lebanon borough?
Per Capita income in Lebanon borough is $63,113.
What is the Median Family Income in Lebanon borough?
Median Family Income in Lebanon borough is $160,469.
What is the Median Household income in Lebanon borough?
Median Household Income in Lebanon borough is $106,389.
What is Income or Wage Gap in Lebanon borough?
Income or Wage Gap in Lebanon borough is 42.4%.
Women in Lebanon borough earn 57.6 cents for every dollar earned by a man.
What is Inequality or Gini Index in Lebanon borough?
Inequality or Gini Index in Lebanon borough is 0.45.
What is the Total Population of Lebanon borough?
Total Population of Lebanon borough is 1,864.
What is the Total Male Population of Lebanon borough?
Total Male Population of Lebanon borough is 768.
What is the Total Female Population of Lebanon borough?
Total Female Population of Lebanon borough is 1,096.
What is the Ratio of Males per 100 Females in Lebanon borough?
There are 70.07 Males per 100 Females in Lebanon borough.
What is the Ratio of Females per 100 Males in Lebanon borough?
There are 142.71 Females per 100 Males in Lebanon borough.
What is the Median Population Age in Lebanon borough?
Median Population Age in Lebanon borough is 41.3 Years.
What is the Average Family Size in Lebanon borough
Average Family Size in Lebanon borough is 3.1 People.
What is the Average Household Size in Lebanon borough
Average Household Size in Lebanon borough is 2.4 People.
How Large is the Labor Force in Lebanon borough?
There are 1,129 People in the Labor Forcein in Lebanon borough.
What is the Percentage of People in the Labor Force in Lebanon borough?
71.4% of People are in the Labor Force in Lebanon borough.
What is the Unemployment Rate in Lebanon borough?
Unemployment Rate in Lebanon borough is 2.8%.