Zip Codes with the Highest Percentage of Population Employed in Food Preparation & Serving in Millstone Township, NJ
RELATED REPORTS & OPTIONS
Food Preparation & Serving
Millstone Township
Compare Zip Codes
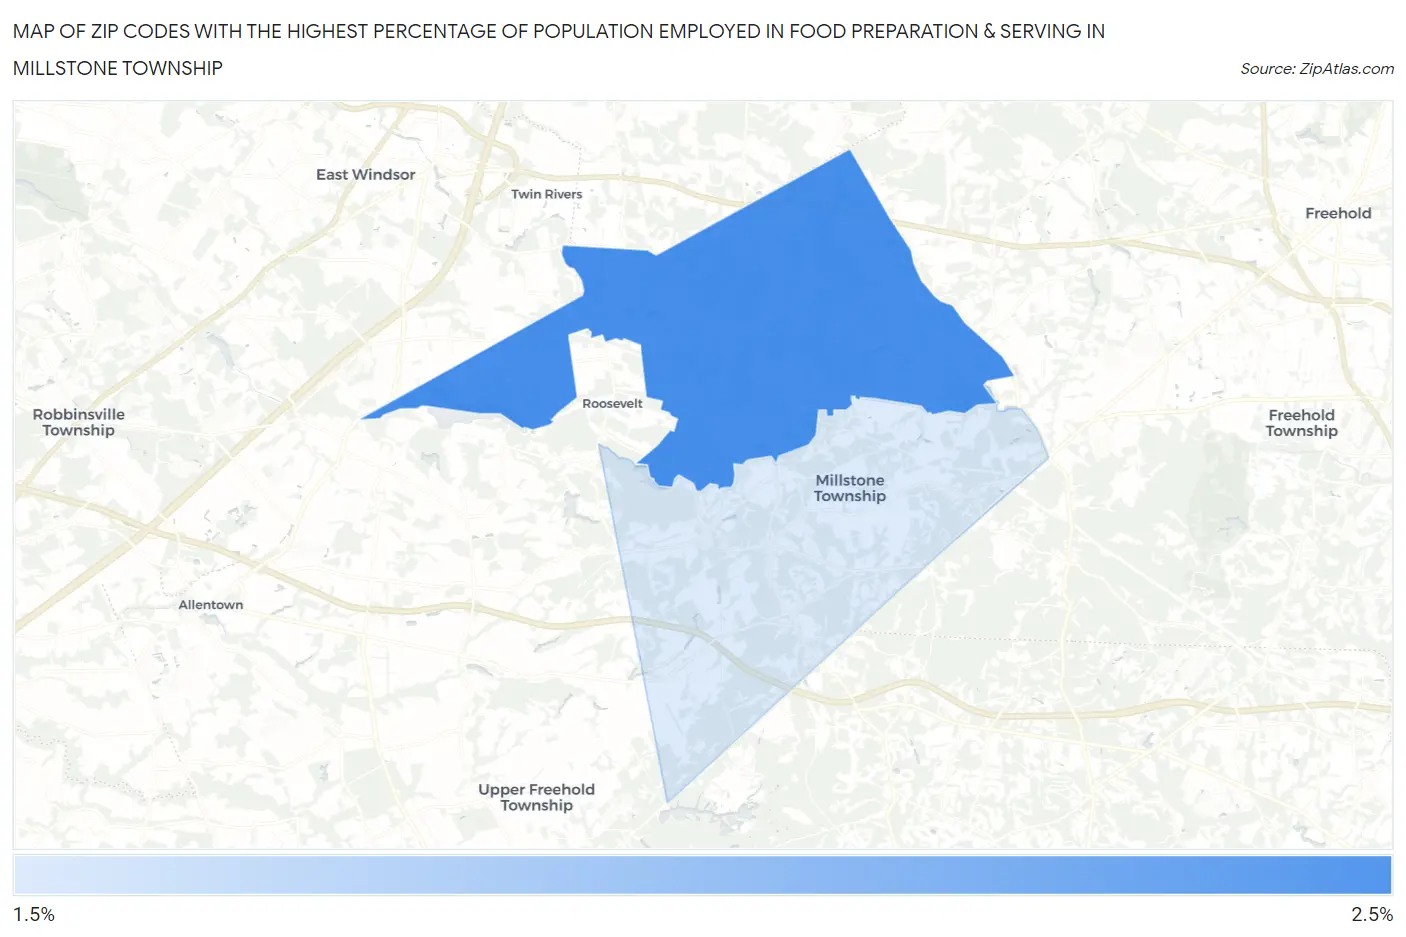
Map of Zip Codes with the Highest Percentage of Population Employed in Food Preparation & Serving in Millstone Township
1.9%
2.3%
Zip Codes with the Highest Percentage of Population Employed in Food Preparation & Serving in Millstone Township, NJ
| Zip Code | % Employed | vs State | vs National | |
| 1. | 08535 | 2.3% | 4.0%(-1.70)#418 | 5.3%(-3.03)#23,922 |
| 2. | 08510 | 1.9% | 4.0%(-2.11)#458 | 5.3%(-3.43)#25,127 |
1
Common Questions
What are the Top Zip Codes with the Highest Percentage of Population Employed in Food Preparation & Serving in Millstone Township, NJ?
Top Zip Codes with the Highest Percentage of Population Employed in Food Preparation & Serving in Millstone Township, NJ are:
What zip code has the Highest Percentage of Population Employed in Food Preparation & Serving in Millstone Township, NJ?
08535 has the Highest Percentage of Population Employed in Food Preparation & Serving in Millstone Township, NJ with 2.3%.
What is the Percentage of Population Employed in Food Preparation & Serving in New Jersey?
Percentage of Population Employed in Food Preparation & Serving in New Jersey is 4.0%.
What is the Percentage of Population Employed in Food Preparation & Serving in the United States?
Percentage of Population Employed in Food Preparation & Serving in the United States is 5.3%.