Zip Codes with the Highest Percentage of Population Employed in Food Preparation & Serving in Absecon, NJ
RELATED REPORTS & OPTIONS
Food Preparation & Serving
Absecon
Compare Zip Codes
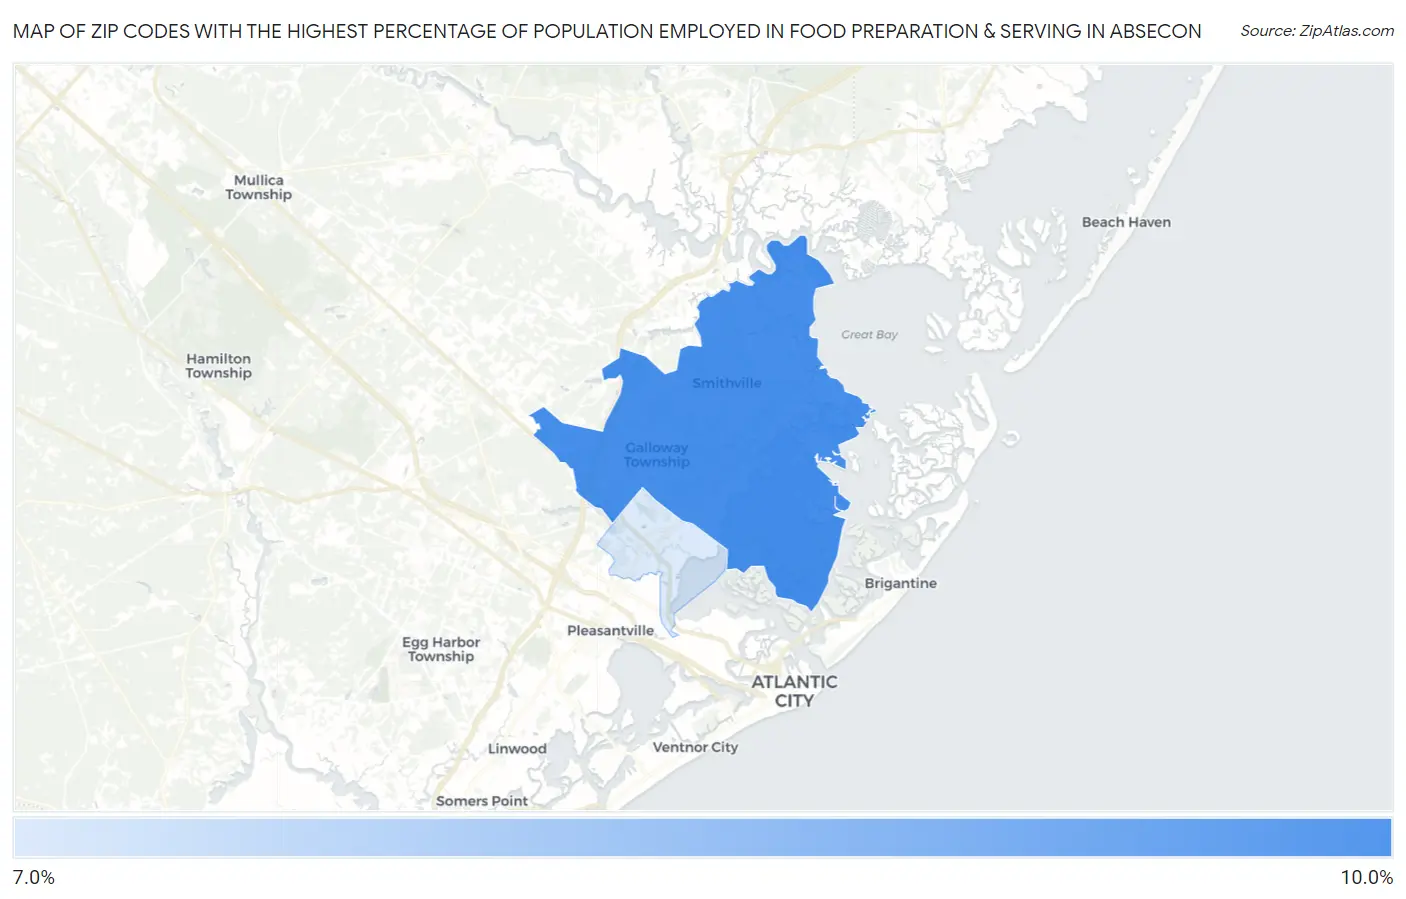
Map of Zip Codes with the Highest Percentage of Population Employed in Food Preparation & Serving in Absecon
7.6%
9.9%
Zip Codes with the Highest Percentage of Population Employed in Food Preparation & Serving in Absecon, NJ
| Zip Code | % Employed | vs State | vs National | |
| 1. | 08205 | 9.9% | 4.0%(+5.92)#20 | 5.3%(+4.60)#2,721 |
| 2. | 08201 | 7.6% | 4.0%(+3.63)#44 | 5.3%(+2.31)#5,388 |
1
Common Questions
What are the Top Zip Codes with the Highest Percentage of Population Employed in Food Preparation & Serving in Absecon, NJ?
Top Zip Codes with the Highest Percentage of Population Employed in Food Preparation & Serving in Absecon, NJ are:
What zip code has the Highest Percentage of Population Employed in Food Preparation & Serving in Absecon, NJ?
08205 has the Highest Percentage of Population Employed in Food Preparation & Serving in Absecon, NJ with 9.9%.
What is the Percentage of Population Employed in Food Preparation & Serving in Absecon, NJ?
Percentage of Population Employed in Food Preparation & Serving in Absecon is 7.1%.
What is the Percentage of Population Employed in Food Preparation & Serving in New Jersey?
Percentage of Population Employed in Food Preparation & Serving in New Jersey is 4.0%.
What is the Percentage of Population Employed in Food Preparation & Serving in the United States?
Percentage of Population Employed in Food Preparation & Serving in the United States is 5.3%.