Wanamassa, NJ Map & Demographics
Wanamassa Map
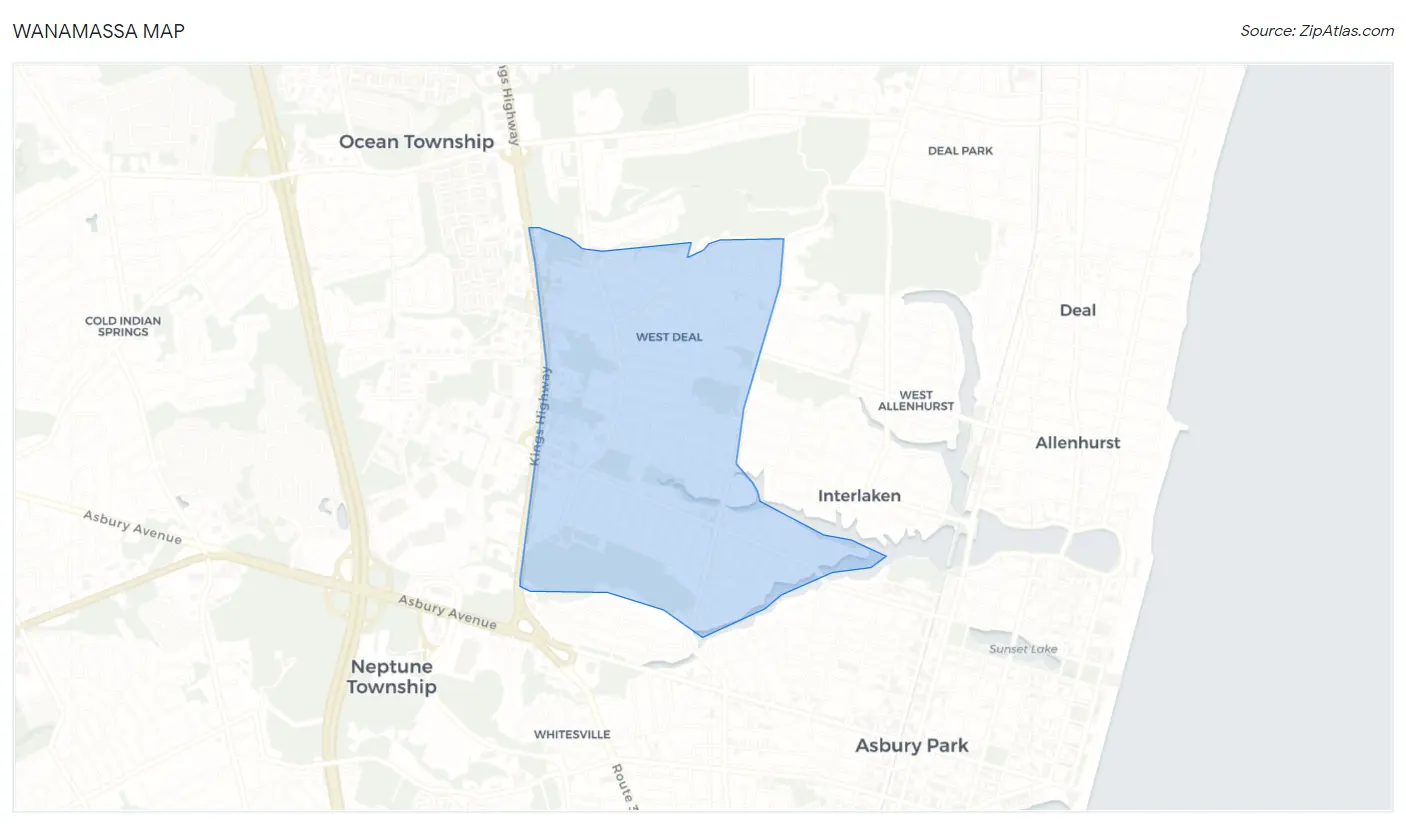
Wanamassa Overview
$57,992
PER CAPITA INCOME
$164,490
AVG FAMILY INCOME
$162,954
AVG HOUSEHOLD INCOME
43.6%
WAGE / INCOME GAP [ % ]
56.4¢/ $1
WAGE / INCOME GAP [ $ ]
0.33
INEQUALITY / GINI INDEX
4,344
TOTAL POPULATION
2,153
MALE POPULATION
2,191
FEMALE POPULATION
98.27
MALES / 100 FEMALES
101.76
FEMALES / 100 MALES
44.0
MEDIAN AGE
3.3
AVG FAMILY SIZE
2.8
AVG HOUSEHOLD SIZE
2,552
LABOR FORCE [ PEOPLE ]
73.5%
PERCENT IN LABOR FORCE
1.9%
UNEMPLOYMENT RATE
Income in Wanamassa
Income Overview in Wanamassa
Per Capita Income in Wanamassa is $57,992, while median incomes of families and households are $164,490 and $162,954 respectively.
| Characteristic | Number | Measure |
| Per Capita Income | 4,344 | $57,992 |
| Median Family Income | 1,134 | $164,490 |
| Mean Family Income | 1,134 | $182,700 |
| Median Household Income | 1,536 | $162,954 |
| Mean Household Income | 1,536 | $162,572 |
| Income Deficit | 1,134 | $0 |
| Wage / Income Gap (%) | 4,344 | 43.60% |
| Wage / Income Gap ($) | 4,344 | 56.40¢ per $1 |
| Gini / Inequality Index | 4,344 | 0.33 |
Earnings by Sex in Wanamassa
Average Earnings in Wanamassa are $66,840, $78,750 for men and $44,415 for women, a difference of 43.6%.
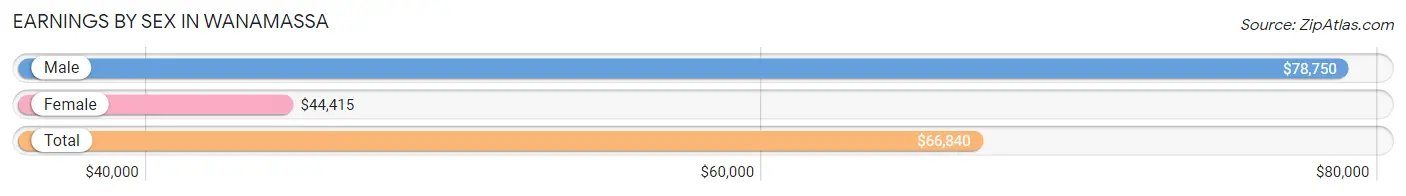
| Sex | Number | Average Earnings |
| Male | 1,374 (51.8%) | $78,750 |
| Female | 1,280 (48.2%) | $44,415 |
| Total | 2,654 (100.0%) | $66,840 |
Earnings by Sex by Income Bracket in Wanamassa
The most common earnings brackets in Wanamassa are $100,000+ for men (457 | 33.3%) and $100,000+ for women (293 | 22.9%).
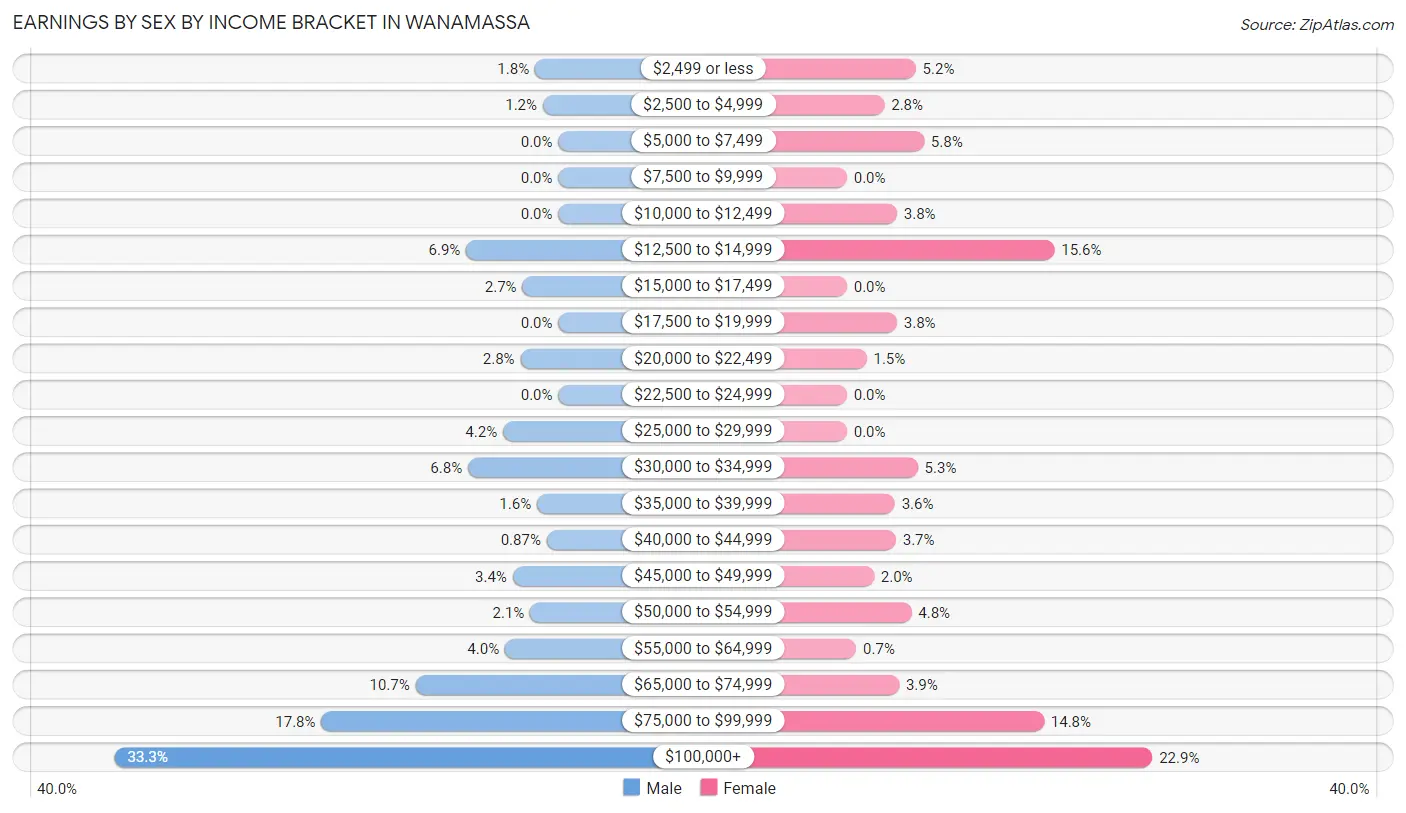
| Income | Male | Female |
| $2,499 or less | 24 (1.8%) | 66 (5.2%) |
| $2,500 to $4,999 | 16 (1.2%) | 36 (2.8%) |
| $5,000 to $7,499 | 0 (0.0%) | 74 (5.8%) |
| $7,500 to $9,999 | 0 (0.0%) | 0 (0.0%) |
| $10,000 to $12,499 | 0 (0.0%) | 48 (3.7%) |
| $12,500 to $14,999 | 95 (6.9%) | 199 (15.5%) |
| $15,000 to $17,499 | 37 (2.7%) | 0 (0.0%) |
| $17,500 to $19,999 | 0 (0.0%) | 48 (3.7%) |
| $20,000 to $22,499 | 39 (2.8%) | 19 (1.5%) |
| $22,500 to $24,999 | 0 (0.0%) | 0 (0.0%) |
| $25,000 to $29,999 | 57 (4.2%) | 0 (0.0%) |
| $30,000 to $34,999 | 93 (6.8%) | 68 (5.3%) |
| $35,000 to $39,999 | 22 (1.6%) | 46 (3.6%) |
| $40,000 to $44,999 | 12 (0.9%) | 47 (3.7%) |
| $45,000 to $49,999 | 47 (3.4%) | 26 (2.0%) |
| $50,000 to $54,999 | 29 (2.1%) | 62 (4.8%) |
| $55,000 to $64,999 | 55 (4.0%) | 9 (0.7%) |
| $65,000 to $74,999 | 147 (10.7%) | 50 (3.9%) |
| $75,000 to $99,999 | 244 (17.8%) | 189 (14.8%) |
| $100,000+ | 457 (33.3%) | 293 (22.9%) |
| Total | 1,374 (100.0%) | 1,280 (100.0%) |
Earnings by Sex by Educational Attainment in Wanamassa
Average earnings in Wanamassa are $83,837 for men and $52,742 for women, a difference of 37.1%. Men with an educational attainment of bachelor's degree enjoy the highest average annual earnings of $147,627, while those with college or associate's degree education earn the least with $73,578. Women with an educational attainment of graduate degree earn the most with the average annual earnings of $86,481, while those with college or associate's degree education have the smallest earnings of $31,500.
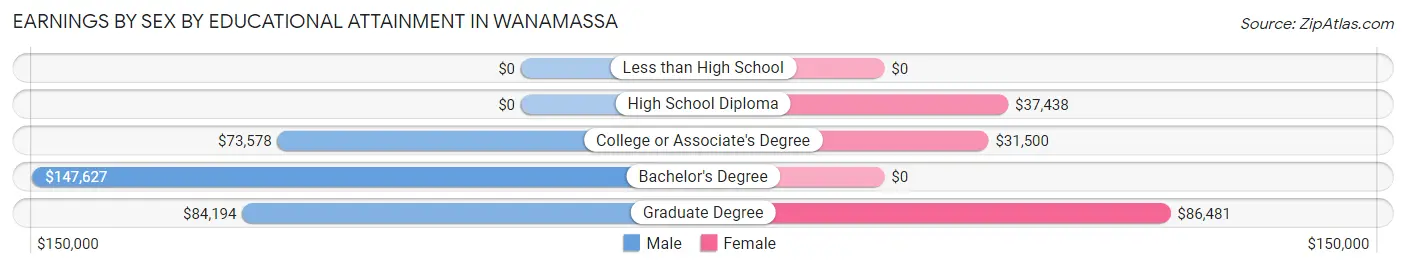
| Educational Attainment | Male Income | Female Income |
| Less than High School | - | - |
| High School Diploma | - | - |
| College or Associate's Degree | $73,578 | $31,500 |
| Bachelor's Degree | $147,627 | $0 |
| Graduate Degree | $84,194 | $86,481 |
| Total | $83,837 | $52,742 |
Family Income in Wanamassa
Family Income Brackets in Wanamassa
According to the Wanamassa family income data, there are 471 families falling into the $150,000 to $199,999 income range, which is the most common income bracket and makes up 41.5% of all families.
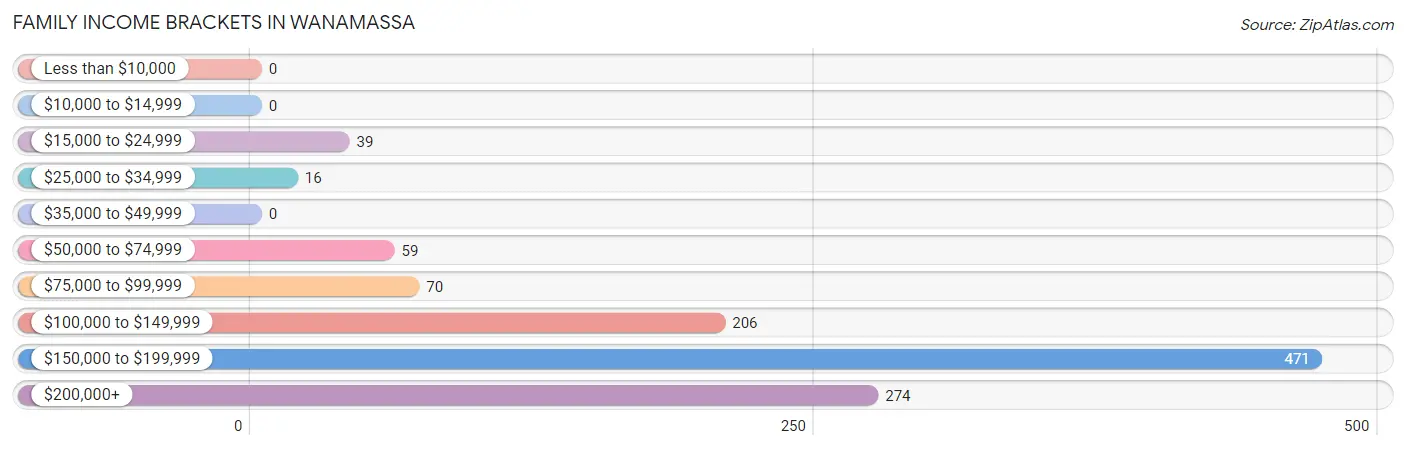
| Income Bracket | # Families | % Families |
| Less than $10,000 | 0 | 0.0% |
| $10,000 to $14,999 | 0 | 0.0% |
| $15,000 to $24,999 | 39 | 3.4% |
| $25,000 to $34,999 | 16 | 1.4% |
| $35,000 to $49,999 | 0 | 0.0% |
| $50,000 to $74,999 | 59 | 5.2% |
| $75,000 to $99,999 | 70 | 6.2% |
| $100,000 to $149,999 | 206 | 18.2% |
| $150,000 to $199,999 | 471 | 41.5% |
| $200,000+ | 274 | 24.2% |
Family Income by Famaliy Size in Wanamassa
5-person families (102 | 9.0%) account for the highest median family income in Wanamassa with $167,763 per family, while 2-person families (366 | 32.3%) have the highest median income of $73,522 per family member.
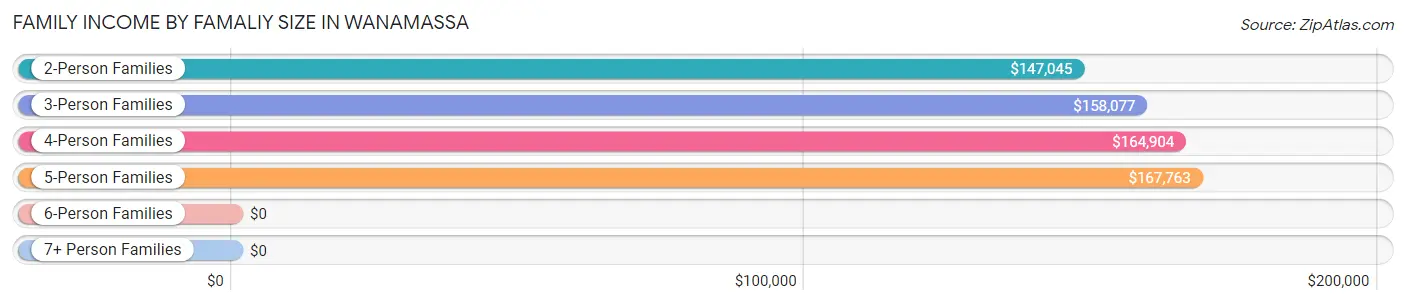
| Income Bracket | # Families | Median Income |
| 2-Person Families | 366 (32.3%) | $147,045 |
| 3-Person Families | 224 (19.8%) | $158,077 |
| 4-Person Families | 396 (34.9%) | $164,904 |
| 5-Person Families | 102 (9.0%) | $167,763 |
| 6-Person Families | 46 (4.1%) | $0 |
| 7+ Person Families | 0 (0.0%) | $0 |
| Total | 1,134 (100.0%) | $164,490 |
Family Income by Number of Earners in Wanamassa
The median family income in Wanamassa is $164,490, with families comprising 3+ earners (186) having the highest median family income of $172,115, while families with 1 earner (136) have the lowest median family income of $91,364, accounting for 16.4% and 12.0% of families, respectively.
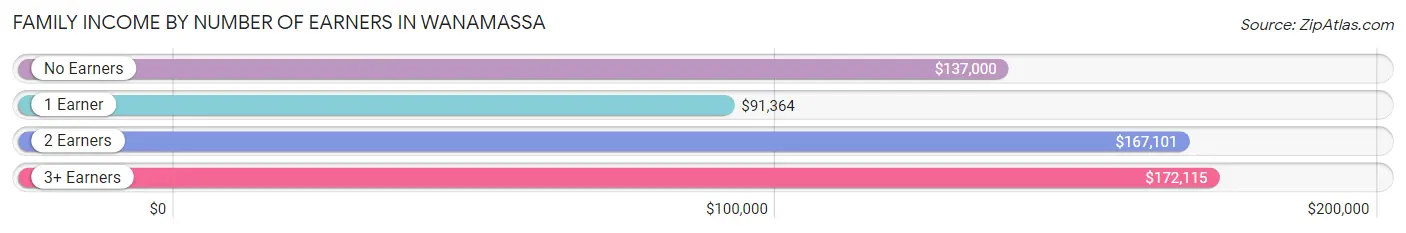
| Number of Earners | # Families | Median Income |
| No Earners | 102 (9.0%) | $137,000 |
| 1 Earner | 136 (12.0%) | $91,364 |
| 2 Earners | 710 (62.6%) | $167,101 |
| 3+ Earners | 186 (16.4%) | $172,115 |
| Total | 1,134 (100.0%) | $164,490 |
Household Income in Wanamassa
Household Income Brackets in Wanamassa
With 531 households falling in the category, the $150,000 to $199,999 income range is the most frequent in Wanamassa, accounting for 34.6% of all households. In contrast, only 15 households (1.0%) fall into the $10,000 to $14,999 income bracket, making it the least populous group.
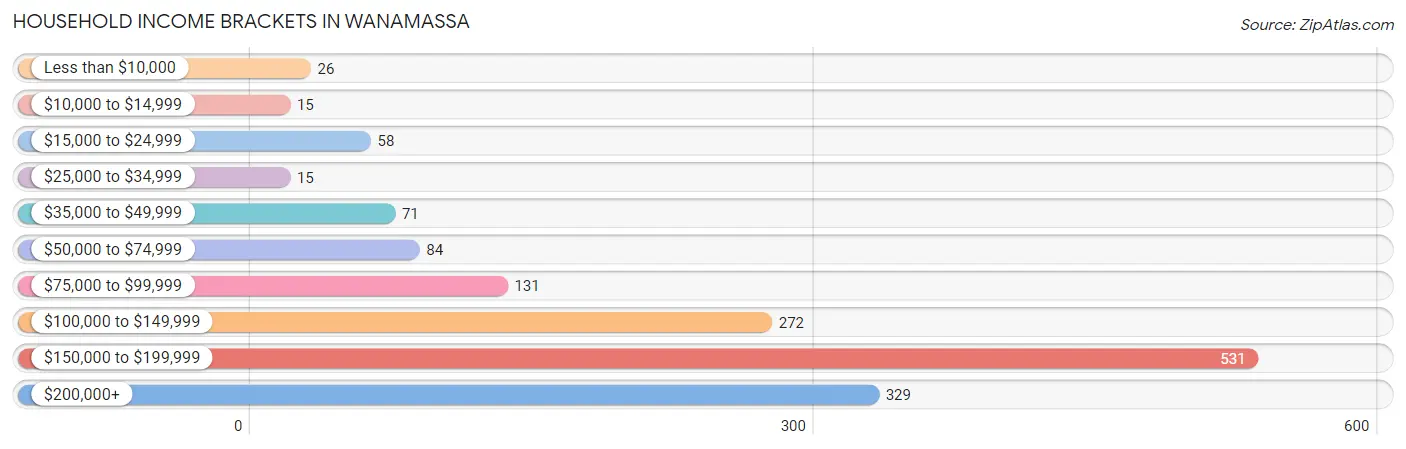
| Income Bracket | # Households | % Households |
| Less than $10,000 | 26 | 1.7% |
| $10,000 to $14,999 | 15 | 1.0% |
| $15,000 to $24,999 | 58 | 3.8% |
| $25,000 to $34,999 | 15 | 1.0% |
| $35,000 to $49,999 | 71 | 4.6% |
| $50,000 to $74,999 | 84 | 5.5% |
| $75,000 to $99,999 | 131 | 8.5% |
| $100,000 to $149,999 | 272 | 17.7% |
| $150,000 to $199,999 | 531 | 34.6% |
| $200,000+ | 329 | 21.4% |
Household Income by Householder Age in Wanamassa
The median household income in Wanamassa is $162,954, with the highest median household income of $167,120 found in the 25 to 44 years age bracket for the primary householder. A total of 405 households (26.4%) fall into this category. Meanwhile, the 15 to 24 years age bracket for the primary householder has the lowest median household income of $0, with 26 households (1.7%) in this group.
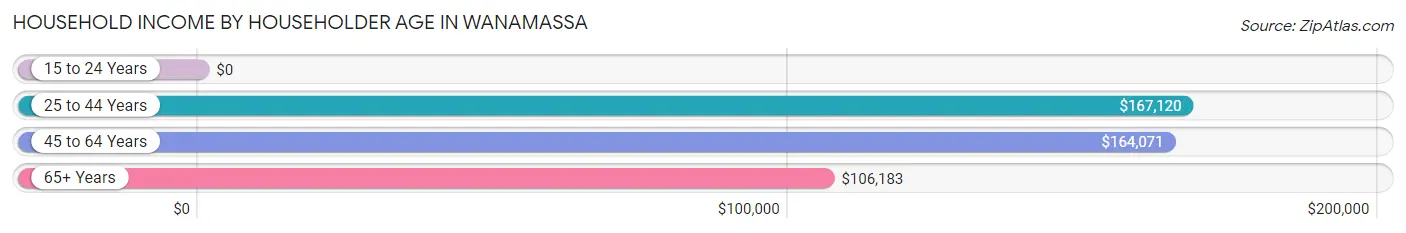
| Income Bracket | # Households | Median Income |
| 15 to 24 Years | 26 (1.7%) | $0 |
| 25 to 44 Years | 405 (26.4%) | $167,120 |
| 45 to 64 Years | 684 (44.5%) | $164,071 |
| 65+ Years | 421 (27.4%) | $106,183 |
| Total | 1,536 (100.0%) | $162,954 |
Poverty in Wanamassa
Income Below Poverty by Sex and Age in Wanamassa
With 3.0% poverty level for males and 6.6% for females among the residents of Wanamassa, 65 to 74 year old males and 12 to 14 year old females are the most vulnerable to poverty, with 35 males (22.6%) and 7 females (100.0%) in their respective age groups living below the poverty level.
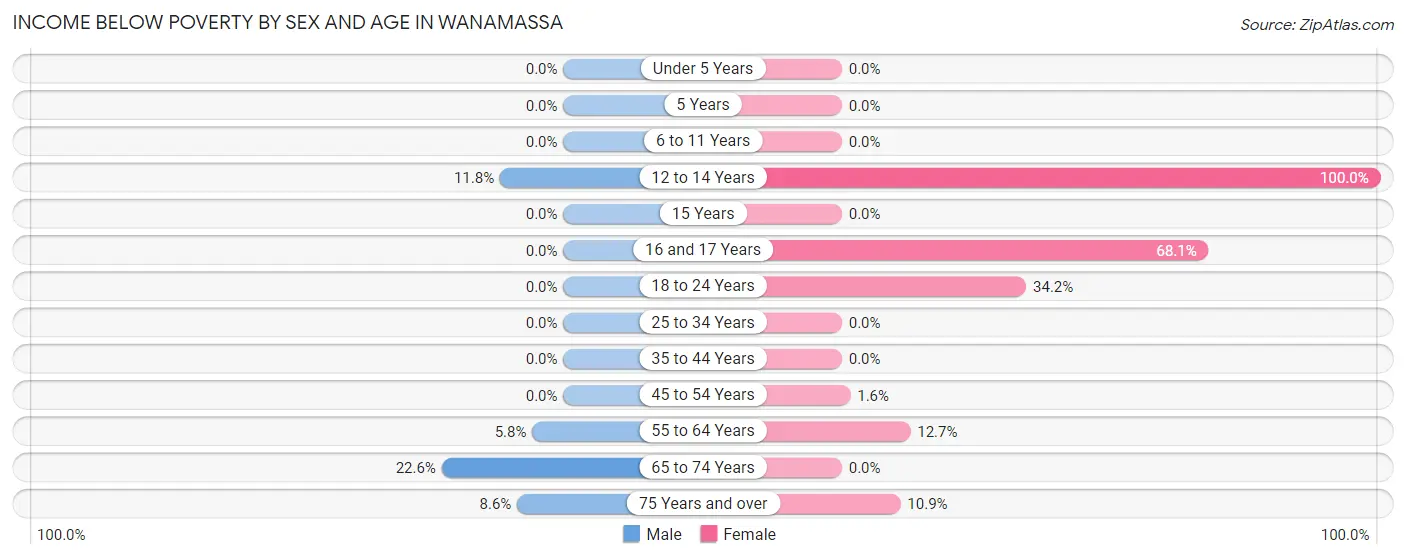
| Age Bracket | Male | Female |
| Under 5 Years | 0 (0.0%) | 0 (0.0%) |
| 5 Years | 0 (0.0%) | 0 (0.0%) |
| 6 to 11 Years | 0 (0.0%) | 0 (0.0%) |
| 12 to 14 Years | 8 (11.8%) | 7 (100.0%) |
| 15 Years | 0 (0.0%) | 0 (0.0%) |
| 16 and 17 Years | 0 (0.0%) | 32 (68.1%) |
| 18 to 24 Years | 0 (0.0%) | 26 (34.2%) |
| 25 to 34 Years | 0 (0.0%) | 0 (0.0%) |
| 35 to 44 Years | 0 (0.0%) | 0 (0.0%) |
| 45 to 54 Years | 0 (0.0%) | 8 (1.6%) |
| 55 to 64 Years | 16 (5.8%) | 45 (12.7%) |
| 65 to 74 Years | 35 (22.6%) | 0 (0.0%) |
| 75 Years and over | 6 (8.6%) | 26 (10.9%) |
| Total | 65 (3.0%) | 144 (6.6%) |
Income Above Poverty by Sex and Age in Wanamassa
According to the poverty statistics in Wanamassa, males aged under 5 years and females aged under 5 years are the age groups that are most secure financially, with 100.0% of males and 100.0% of females in these age groups living above the poverty line.
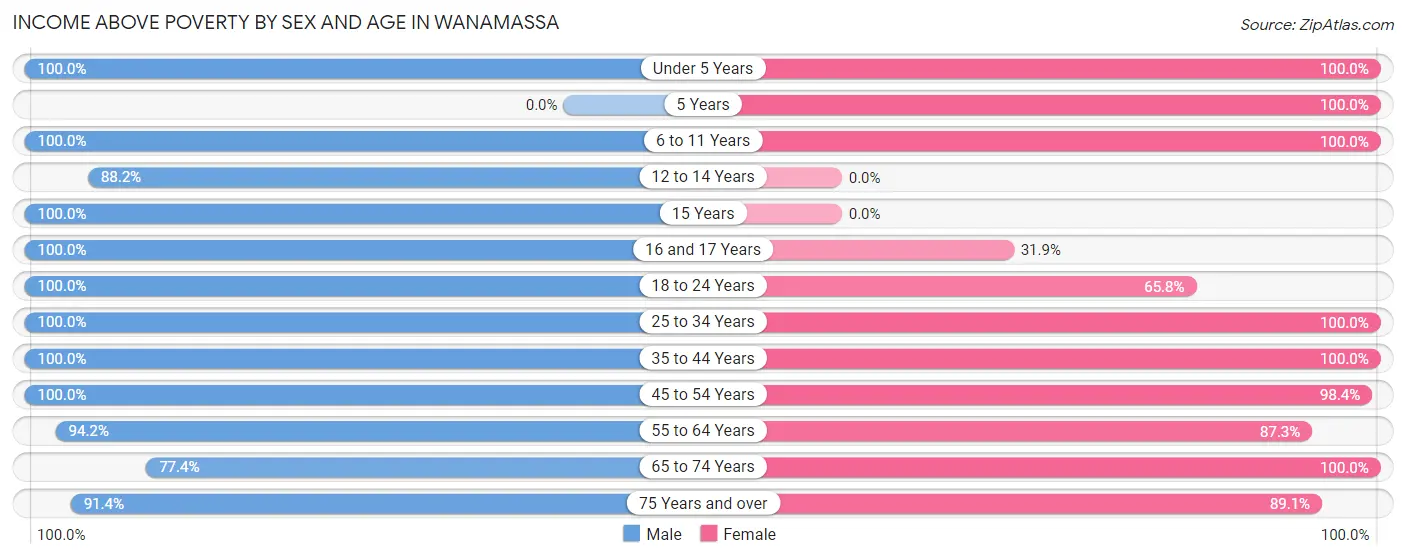
| Age Bracket | Male | Female |
| Under 5 Years | 67 (100.0%) | 133 (100.0%) |
| 5 Years | 0 (0.0%) | 39 (100.0%) |
| 6 to 11 Years | 199 (100.0%) | 216 (100.0%) |
| 12 to 14 Years | 60 (88.2%) | 0 (0.0%) |
| 15 Years | 143 (100.0%) | 0 (0.0%) |
| 16 and 17 Years | 46 (100.0%) | 15 (31.9%) |
| 18 to 24 Years | 172 (100.0%) | 50 (65.8%) |
| 25 to 34 Years | 240 (100.0%) | 257 (100.0%) |
| 35 to 44 Years | 354 (100.0%) | 158 (100.0%) |
| 45 to 54 Years | 361 (100.0%) | 501 (98.4%) |
| 55 to 64 Years | 262 (94.2%) | 309 (87.3%) |
| 65 to 74 Years | 120 (77.4%) | 156 (100.0%) |
| 75 Years and over | 64 (91.4%) | 213 (89.1%) |
| Total | 2,088 (97.0%) | 2,047 (93.4%) |
Income Below Poverty Among Married-Couple Families in Wanamassa
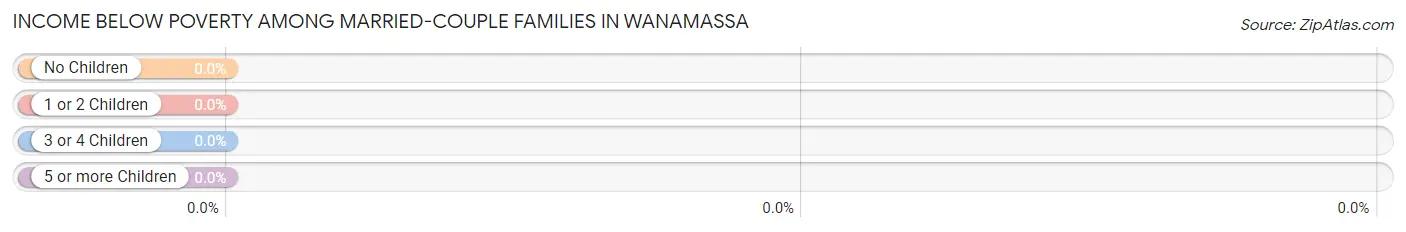
| Children | Above Poverty | Below Poverty |
| No Children | 431 (100.0%) | 0 (0.0%) |
| 1 or 2 Children | 523 (100.0%) | 0 (0.0%) |
| 3 or 4 Children | 25 (100.0%) | 0 (0.0%) |
| 5 or more Children | 0 (0.0%) | 0 (0.0%) |
| Total | 979 (100.0%) | 0 (0.0%) |
Income Below Poverty Among Single-Parent Households in Wanamassa
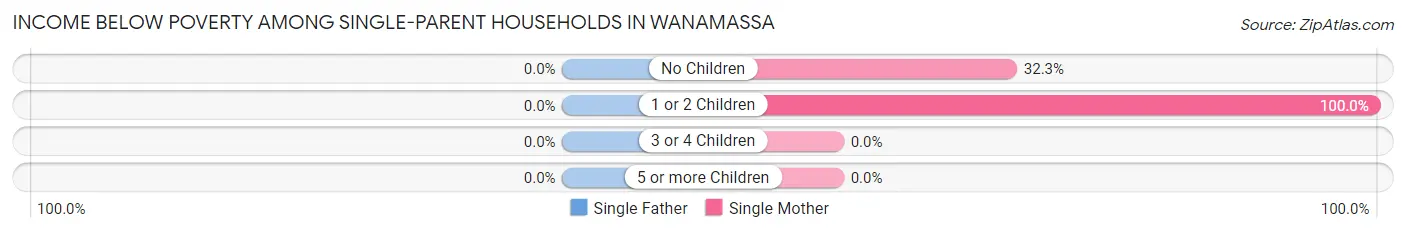
| Children | Single Father | Single Mother |
| No Children | 0 (0.0%) | 30 (32.3%) |
| 1 or 2 Children | 0 (0.0%) | 8 (100.0%) |
| 3 or 4 Children | 0 (0.0%) | 0 (0.0%) |
| 5 or more Children | 0 (0.0%) | 0 (0.0%) |
| Total | 0 (0.0%) | 38 (37.6%) |
Income Below Poverty Among Married-Couple vs Single-Parent Households in Wanamassa
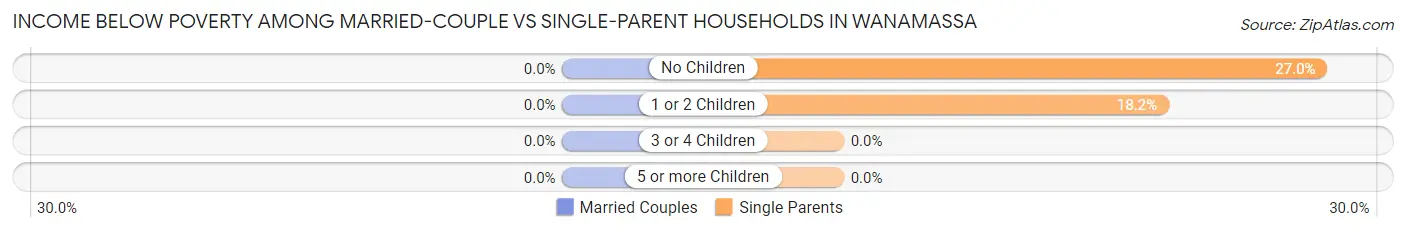
| Children | Married-Couple Families | Single-Parent Households |
| No Children | 0 (0.0%) | 30 (27.0%) |
| 1 or 2 Children | 0 (0.0%) | 8 (18.2%) |
| 3 or 4 Children | 0 (0.0%) | 0 (0.0%) |
| 5 or more Children | 0 (0.0%) | 0 (0.0%) |
| Total | 0 (0.0%) | 38 (24.5%) |
Race in Wanamassa
The most populous races in Wanamassa are White / Caucasian (4,152 | 95.6%), Asian (126 | 2.9%), and Hispanic or Latino (109 | 2.5%).
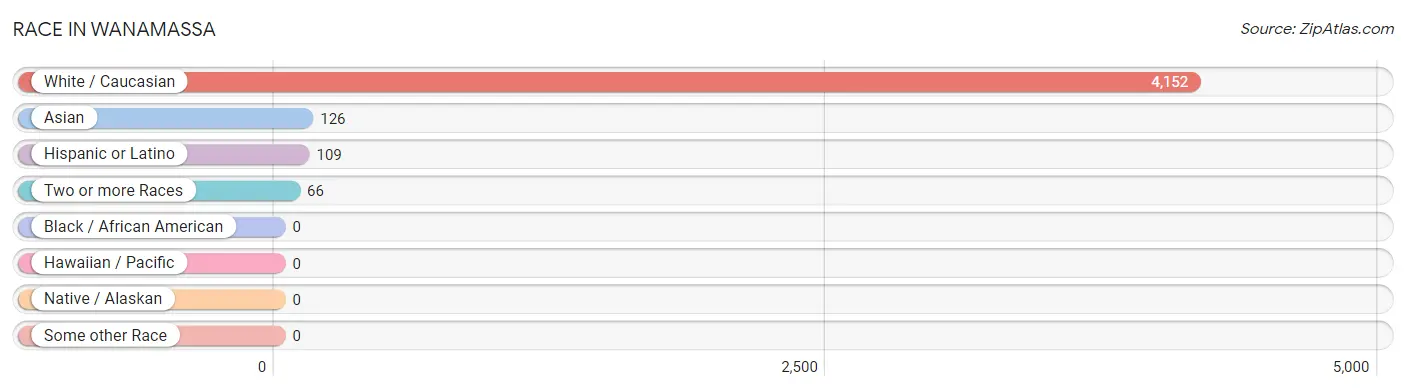
| Race | # Population | % Population |
| Asian | 126 | 2.9% |
| Black / African American | 0 | 0.0% |
| Hawaiian / Pacific | 0 | 0.0% |
| Hispanic or Latino | 109 | 2.5% |
| Native / Alaskan | 0 | 0.0% |
| White / Caucasian | 4,152 | 95.6% |
| Two or more Races | 66 | 1.5% |
| Some other Race | 0 | 0.0% |
| Total | 4,344 | 100.0% |
Ancestry in Wanamassa
The most populous ancestries reported in Wanamassa are Italian (1,570 | 36.1%), Irish (1,359 | 31.3%), German (596 | 13.7%), English (470 | 10.8%), and European (201 | 4.6%), together accounting for 96.6% of all Wanamassa residents.
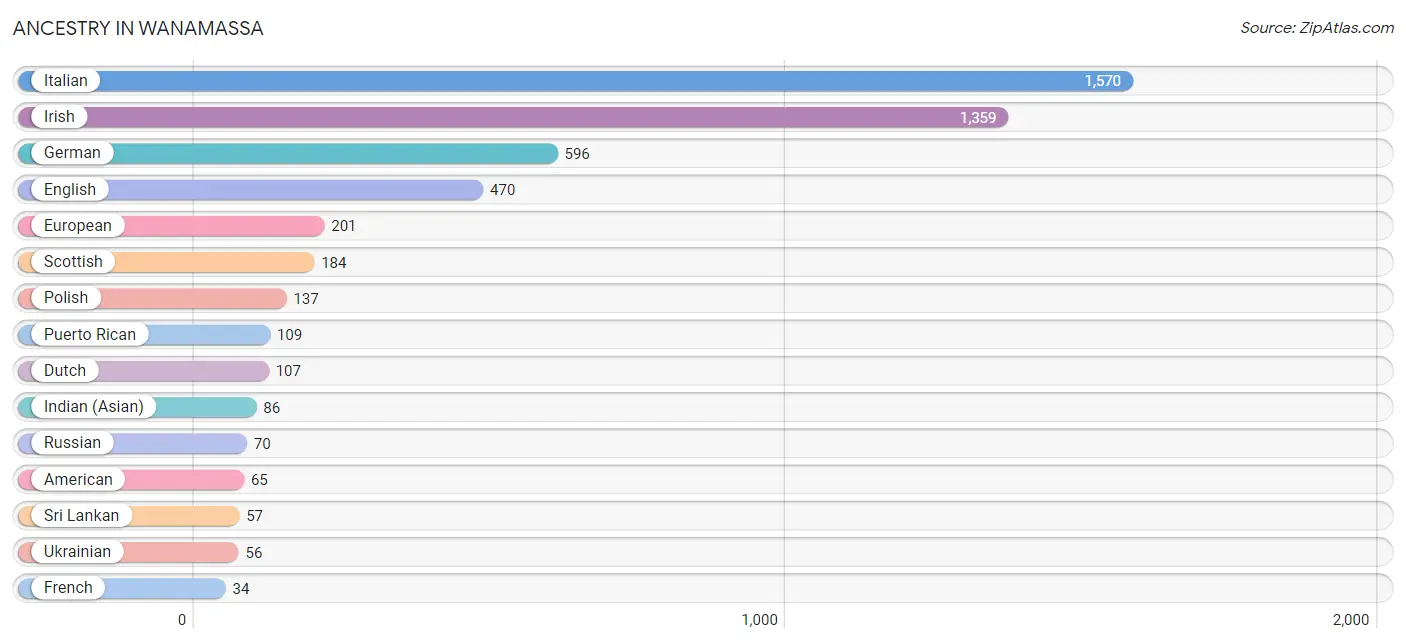
| Ancestry | # Population | % Population |
| American | 65 | 1.5% |
| British | 19 | 0.4% |
| Czech | 24 | 0.5% |
| Dutch | 107 | 2.5% |
| Eastern European | 31 | 0.7% |
| English | 470 | 10.8% |
| European | 201 | 4.6% |
| French | 34 | 0.8% |
| German | 596 | 13.7% |
| Greek | 22 | 0.5% |
| Hungarian | 8 | 0.2% |
| Indian (Asian) | 86 | 2.0% |
| Iranian | 31 | 0.7% |
| Irish | 1,359 | 31.3% |
| Italian | 1,570 | 36.1% |
| Latvian | 4 | 0.1% |
| Polish | 137 | 3.2% |
| Puerto Rican | 109 | 2.5% |
| Russian | 70 | 1.6% |
| Scottish | 184 | 4.2% |
| Slovak | 33 | 0.8% |
| Sri Lankan | 57 | 1.3% |
| Swiss | 5 | 0.1% |
| Ukrainian | 56 | 1.3% | View All 24 Rows |
Immigrants in Wanamassa
The most numerous immigrant groups reported in Wanamassa came from Asia (102 | 2.4%), Europe (51 | 1.2%), Northern Europe (51 | 1.2%), South Eastern Asia (51 | 1.2%), and England (45 | 1.0%), together accounting for 6.9% of all Wanamassa residents.
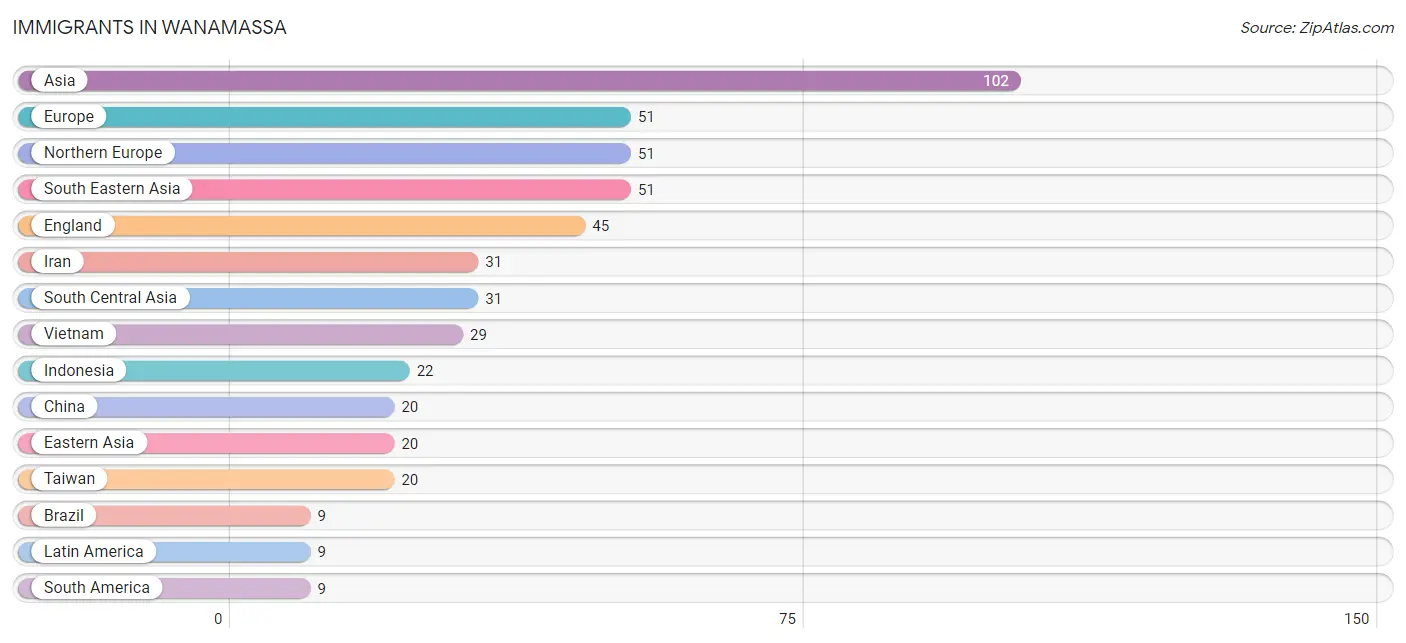
| Immigration Origin | # Population | % Population |
| Africa | 6 | 0.1% |
| Asia | 102 | 2.4% |
| Brazil | 9 | 0.2% |
| China | 20 | 0.5% |
| Eastern Africa | 6 | 0.1% |
| Eastern Asia | 20 | 0.5% |
| England | 45 | 1.0% |
| Eritrea | 6 | 0.1% |
| Europe | 51 | 1.2% |
| Indonesia | 22 | 0.5% |
| Iran | 31 | 0.7% |
| Latin America | 9 | 0.2% |
| Northern Europe | 51 | 1.2% |
| Scotland | 6 | 0.1% |
| South America | 9 | 0.2% |
| South Central Asia | 31 | 0.7% |
| South Eastern Asia | 51 | 1.2% |
| Taiwan | 20 | 0.5% |
| Vietnam | 29 | 0.7% | View All 19 Rows |
Sex and Age in Wanamassa
Sex and Age in Wanamassa
The most populous age groups in Wanamassa are 45 to 49 Years (250 | 11.6%) for men and 45 to 49 Years (317 | 14.5%) for women.
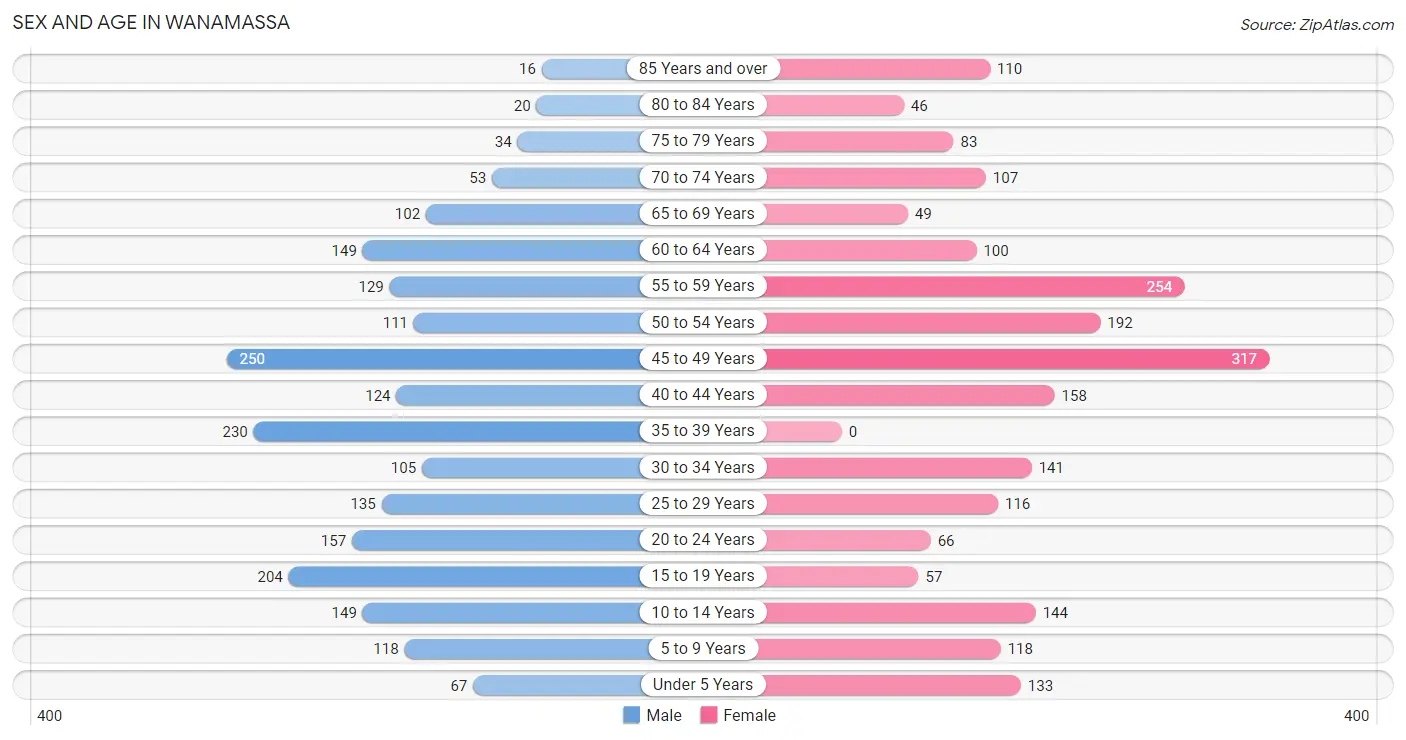
| Age Bracket | Male | Female |
| Under 5 Years | 67 (3.1%) | 133 (6.1%) |
| 5 to 9 Years | 118 (5.5%) | 118 (5.4%) |
| 10 to 14 Years | 149 (6.9%) | 144 (6.6%) |
| 15 to 19 Years | 204 (9.5%) | 57 (2.6%) |
| 20 to 24 Years | 157 (7.3%) | 66 (3.0%) |
| 25 to 29 Years | 135 (6.3%) | 116 (5.3%) |
| 30 to 34 Years | 105 (4.9%) | 141 (6.4%) |
| 35 to 39 Years | 230 (10.7%) | 0 (0.0%) |
| 40 to 44 Years | 124 (5.8%) | 158 (7.2%) |
| 45 to 49 Years | 250 (11.6%) | 317 (14.5%) |
| 50 to 54 Years | 111 (5.2%) | 192 (8.8%) |
| 55 to 59 Years | 129 (6.0%) | 254 (11.6%) |
| 60 to 64 Years | 149 (6.9%) | 100 (4.6%) |
| 65 to 69 Years | 102 (4.7%) | 49 (2.2%) |
| 70 to 74 Years | 53 (2.5%) | 107 (4.9%) |
| 75 to 79 Years | 34 (1.6%) | 83 (3.8%) |
| 80 to 84 Years | 20 (0.9%) | 46 (2.1%) |
| 85 Years and over | 16 (0.7%) | 110 (5.0%) |
| Total | 2,153 (100.0%) | 2,191 (100.0%) |
Families and Households in Wanamassa
Median Family Size in Wanamassa
The median family size in Wanamassa is 3.34 persons per family, with single female/mother families (101 | 8.9%) accounting for the largest median family size of 4.16 persons per family. On the other hand, single male/father families (54 | 4.8%) represent the smallest median family size with 2.65 persons per family.
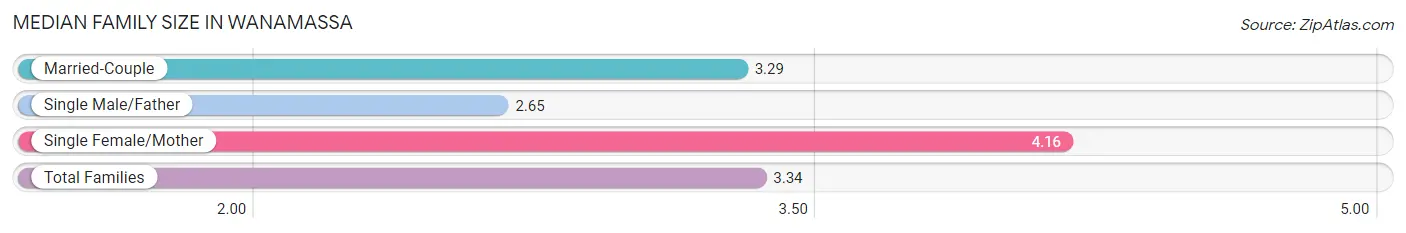
| Family Type | # Families | Family Size |
| Married-Couple | 979 (86.3%) | 3.29 |
| Single Male/Father | 54 (4.8%) | 2.65 |
| Single Female/Mother | 101 (8.9%) | 4.16 |
| Total Families | 1,134 (100.0%) | 3.34 |
Median Household Size in Wanamassa
The median household size in Wanamassa is 2.83 persons per household, with single female/mother households (101 | 6.6%) accounting for the largest median household size of 4.16 persons per household. non-family households (402 | 26.2%) represent the smallest median household size with 1.33 persons per household.
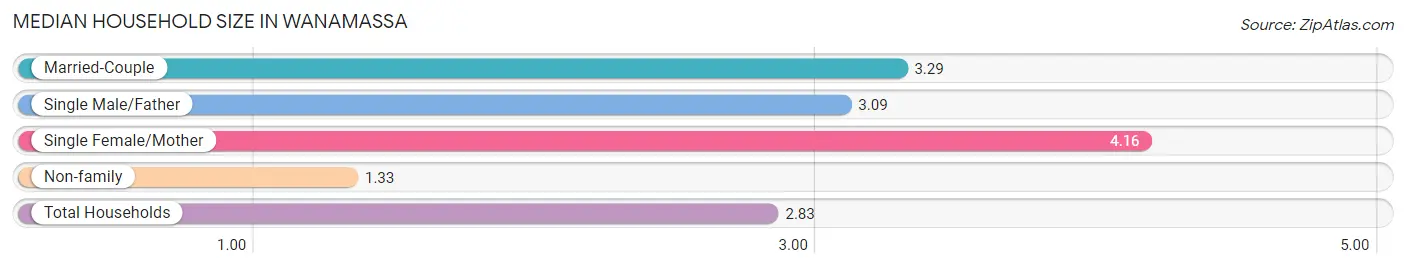
| Household Type | # Households | Household Size |
| Married-Couple | 979 (63.7%) | 3.29 |
| Single Male/Father | 54 (3.5%) | 3.09 |
| Single Female/Mother | 101 (6.6%) | 4.16 |
| Non-family | 402 (26.2%) | 1.33 |
| Total Households | 1,536 (100.0%) | 2.83 |
Household Size by Marriage Status in Wanamassa
Out of a total of 1,536 households in Wanamassa, 1,134 (73.8%) are family households, while 402 (26.2%) are nonfamily households. The most numerous type of family households are 4-person households, comprising 420, and the most common type of nonfamily households are 1-person households, comprising 320.
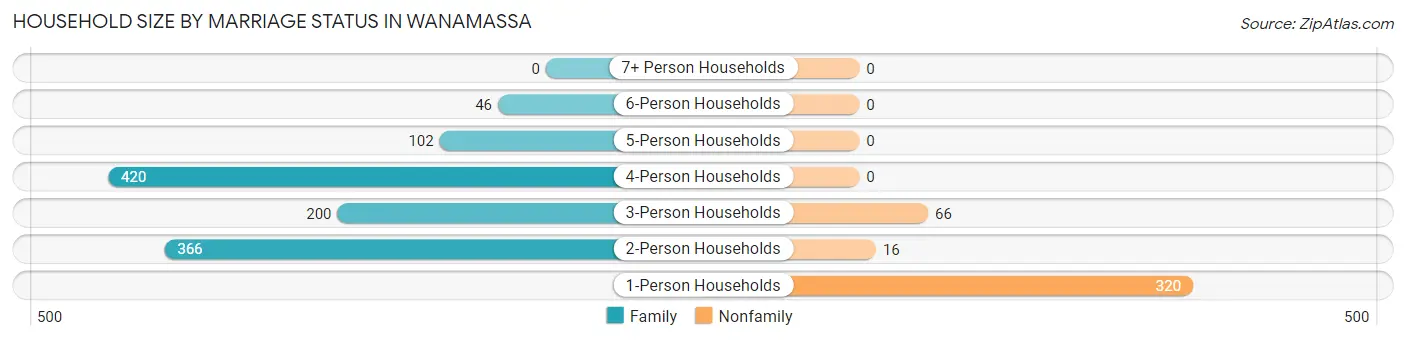
| Household Size | Family Households | Nonfamily Households |
| 1-Person Households | - | 320 (20.8%) |
| 2-Person Households | 366 (23.8%) | 16 (1.0%) |
| 3-Person Households | 200 (13.0%) | 66 (4.3%) |
| 4-Person Households | 420 (27.3%) | 0 (0.0%) |
| 5-Person Households | 102 (6.6%) | 0 (0.0%) |
| 6-Person Households | 46 (3.0%) | 0 (0.0%) |
| 7+ Person Households | 0 (0.0%) | 0 (0.0%) |
| Total | 1,134 (73.8%) | 402 (26.2%) |
Female Fertility in Wanamassa
Fertility by Age in Wanamassa
Average fertility rate in Wanamassa is 142.0 births per 1,000 women. Women in the age bracket of 20 to 34 years have the highest fertility rate with 173.0 births per 1,000 women. Women in the age bracket of 35 to 50 years acount for 55.2% of all women with births.
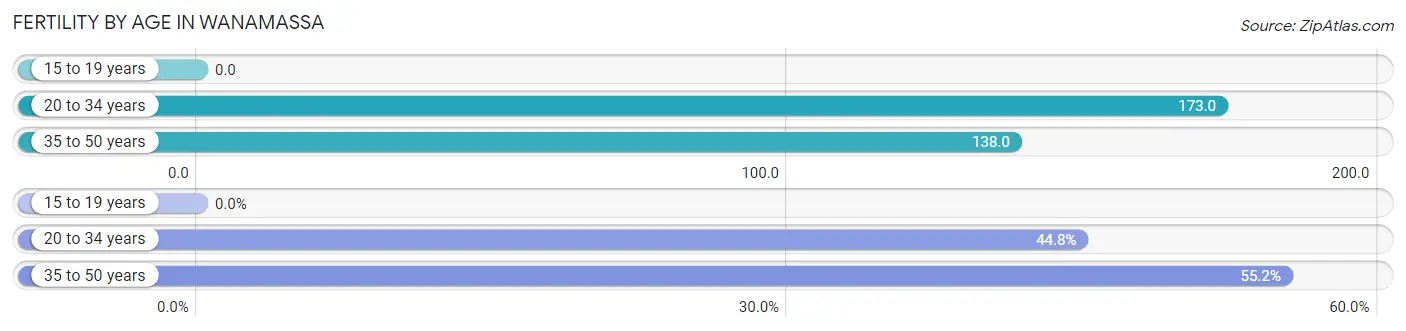
| Age Bracket | Women with Births | Births / 1,000 Women |
| 15 to 19 years | 0 (0.0%) | 0.0 |
| 20 to 34 years | 56 (44.8%) | 173.0 |
| 35 to 50 years | 69 (55.2%) | 138.0 |
| Total | 125 (100.0%) | 142.0 |
Fertility by Age by Marriage Status in Wanamassa
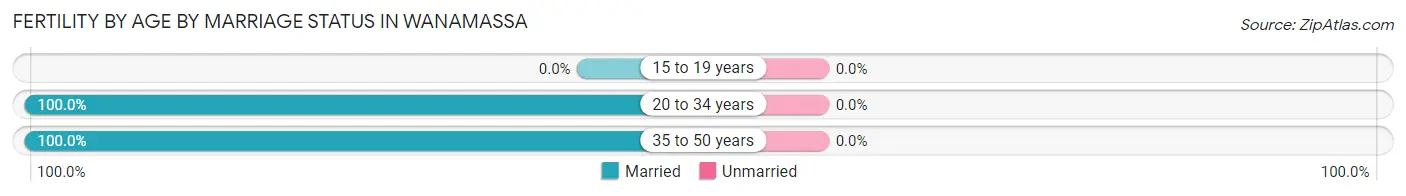
| Age Bracket | Married | Unmarried |
| 15 to 19 years | 0 (0.0%) | 0 (0.0%) |
| 20 to 34 years | 56 (100.0%) | 0 (0.0%) |
| 35 to 50 years | 69 (100.0%) | 0 (0.0%) |
| Total | 125 (100.0%) | 0 (0.0%) |
Fertility by Education in Wanamassa
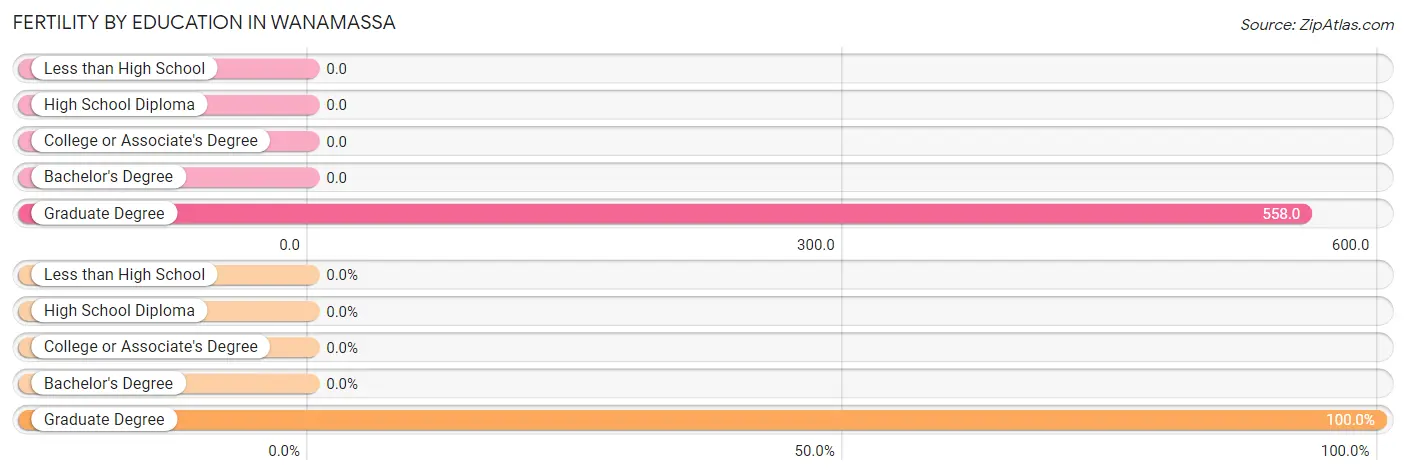
| Educational Attainment | Women with Births | Births / 1,000 Women |
| Less than High School | 0 (0.0%) | 0.0 |
| High School Diploma | 0 (0.0%) | 0.0 |
| College or Associate's Degree | 0 (0.0%) | 0.0 |
| Bachelor's Degree | 0 (0.0%) | 0.0 |
| Graduate Degree | 125 (100.0%) | 558.0 |
| Total | 125 (100.0%) | 142.0 |
Fertility by Education by Marriage Status in Wanamassa
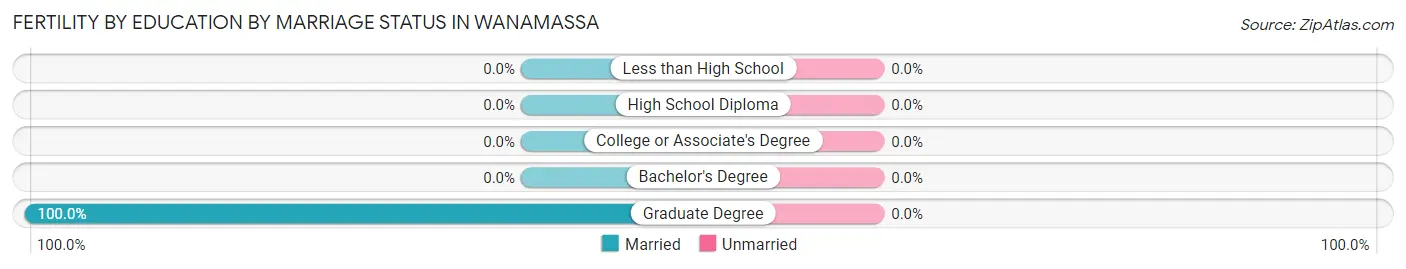
| Educational Attainment | Married | Unmarried |
| Less than High School | 0 (0.0%) | 0 (0.0%) |
| High School Diploma | 0 (0.0%) | 0 (0.0%) |
| College or Associate's Degree | 0 (0.0%) | 0 (0.0%) |
| Bachelor's Degree | 0 (0.0%) | 0 (0.0%) |
| Graduate Degree | 125 (100.0%) | 0 (0.0%) |
| Total | 125 (100.0%) | 0 (0.0%) |
Employment Characteristics in Wanamassa
Employment by Class of Employer in Wanamassa
Among the 2,317 employed individuals in Wanamassa, private company employees (1,542 | 66.5%), local government employees (360 | 15.5%), and not-for-profit organizations (160 | 6.9%) make up the most common classes of employment.
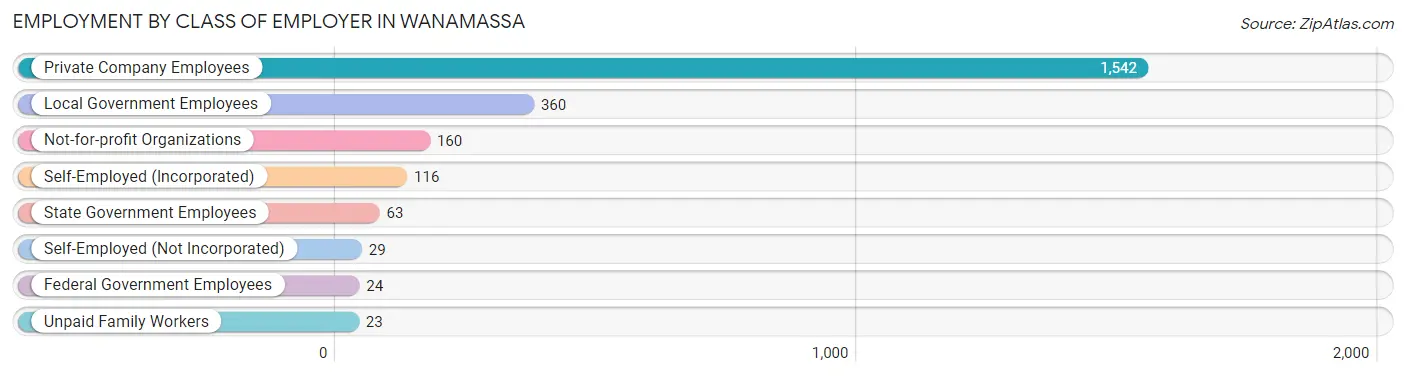
| Employer Class | # Employees | % Employees |
| Private Company Employees | 1,542 | 66.5% |
| Self-Employed (Incorporated) | 116 | 5.0% |
| Self-Employed (Not Incorporated) | 29 | 1.3% |
| Not-for-profit Organizations | 160 | 6.9% |
| Local Government Employees | 360 | 15.5% |
| State Government Employees | 63 | 2.7% |
| Federal Government Employees | 24 | 1.0% |
| Unpaid Family Workers | 23 | 1.0% |
| Total | 2,317 | 100.0% |
Employment Status by Age in Wanamassa
According to the labor force statistics for Wanamassa, out of the total population over 16 years of age (3,472), 73.5% or 2,552 individuals are in the labor force, with 1.9% or 48 of them unemployed. The age group with the highest labor force participation rate is 35 to 44 years, with 100.0% or 512 individuals in the labor force. Within the labor force, the 60 to 64 years age range has the highest percentage of unemployed individuals, with 18.5% or 33 of them being unemployed.
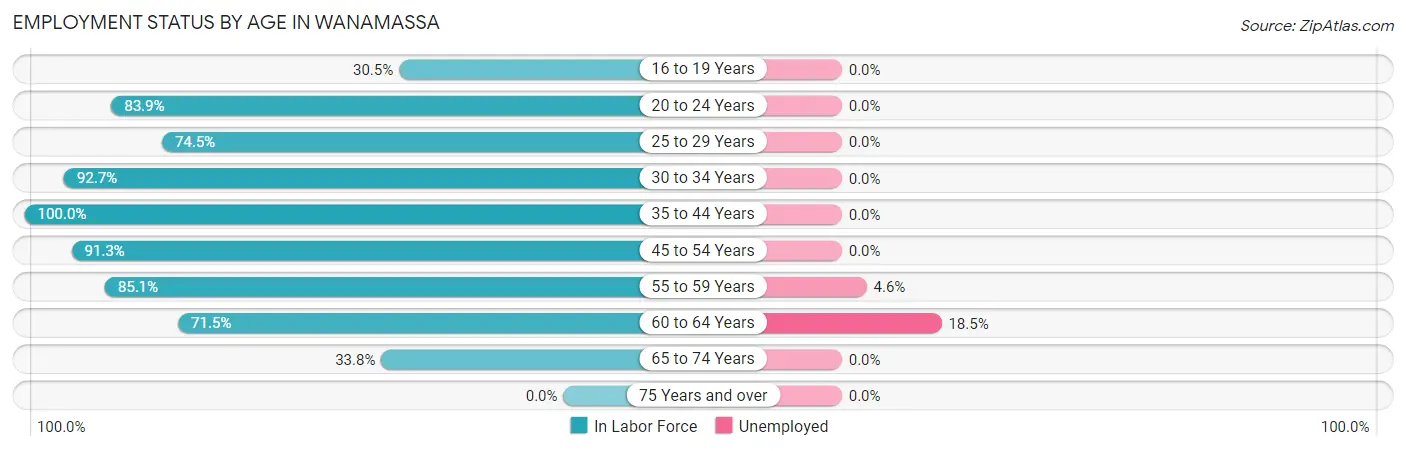
| Age Bracket | In Labor Force | Unemployed |
| 16 to 19 Years | 36 (30.5%) | 0 (0.0%) |
| 20 to 24 Years | 187 (83.9%) | 0 (0.0%) |
| 25 to 29 Years | 187 (74.5%) | 0 (0.0%) |
| 30 to 34 Years | 228 (92.7%) | 0 (0.0%) |
| 35 to 44 Years | 512 (100.0%) | 0 (0.0%) |
| 45 to 54 Years | 794 (91.3%) | 0 (0.0%) |
| 55 to 59 Years | 326 (85.1%) | 15 (4.6%) |
| 60 to 64 Years | 178 (71.5%) | 33 (18.5%) |
| 65 to 74 Years | 105 (33.8%) | 0 (0.0%) |
| 75 Years and over | 0 (0.0%) | 0 (0.0%) |
| Total | 2,552 (73.5%) | 48 (1.9%) |
Employment Status by Educational Attainment in Wanamassa
According to labor force statistics for Wanamassa, 88.6% of individuals (2,225) out of the total population between 25 and 64 years of age (2,511) are in the labor force, with 2.2% or 49 of them being unemployed. The group with the highest labor force participation rate are those with the educational attainment of college / associate degree, with 97.9% or 464 individuals in the labor force. Within the labor force, individuals with college / associate degree education have the highest percentage of unemployment, with 7.1% or 33 of them being unemployed.
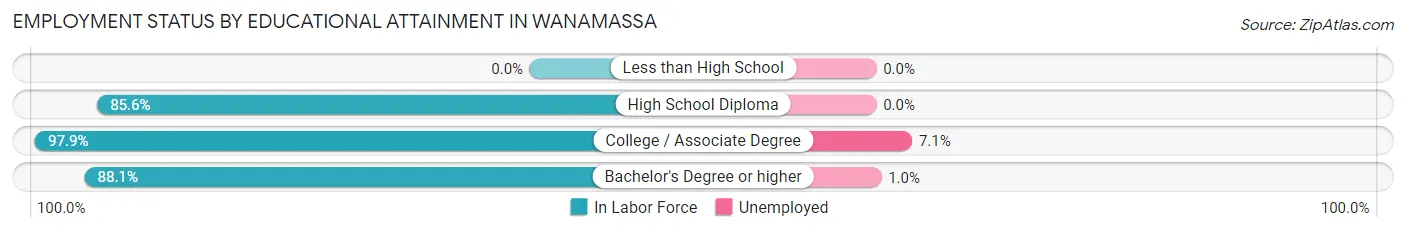
| Educational Attainment | In Labor Force | Unemployed |
| Less than High School | 0 (0.0%) | 0 (0.0%) |
| High School Diploma | 255 (85.6%) | 0 (0.0%) |
| College / Associate Degree | 464 (97.9%) | 34 (7.1%) |
| Bachelor's Degree or higher | 1,507 (88.1%) | 17 (1.0%) |
| Total | 2,225 (88.6%) | 55 (2.2%) |
Employment Occupations by Sex in Wanamassa
Management, Business, Science and Arts Occupations
The most common Management, Business, Science and Arts occupations in Wanamassa are Community & Social Service (542 | 21.6%), Management (449 | 17.9%), Education Instruction & Library (320 | 12.8%), Business & Financial (164 | 6.6%), and Computers, Engineering & Science (156 | 6.2%).
Management, Business, Science and Arts Occupations by Sex
Within the Management, Business, Science and Arts occupations in Wanamassa, the most male-oriented occupations are Life, Physical & Social Science (100.0%), Business & Financial (78.7%), and Computers & Mathematics (67.4%), while the most female-oriented occupations are Legal Services & Support (73.5%), Education Instruction & Library (60.0%), and Community & Social Service (57.0%).
| Occupation | Male | Female |
| Management | 285 (63.5%) | 164 (36.5%) |
| Business & Financial | 129 (78.7%) | 35 (21.3%) |
| Computers, Engineering & Science | 99 (63.5%) | 57 (36.5%) |
| Computers & Mathematics | 58 (67.4%) | 28 (32.6%) |
| Architecture & Engineering | 31 (51.7%) | 29 (48.3%) |
| Life, Physical & Social Science | 10 (100.0%) | 0 (0.0%) |
| Community & Social Service | 233 (43.0%) | 309 (57.0%) |
| Education, Arts & Media | 0 (0.0%) | 0 (0.0%) |
| Legal Services & Support | 22 (26.5%) | 61 (73.5%) |
| Education Instruction & Library | 128 (40.0%) | 192 (60.0%) |
| Arts, Media & Entertainment | 83 (59.7%) | 56 (40.3%) |
| Health Diagnosing & Treating | 28 (47.5%) | 31 (52.5%) |
| Health Technologists | 28 (47.5%) | 31 (52.5%) |
| Total (Category) | 774 (56.5%) | 596 (43.5%) |
| Total (Overall) | 1,306 (52.1%) | 1,199 (47.9%) |
Services Occupations
The most common Services occupations in Wanamassa are Food Preparation & Serving (191 | 7.6%), Security & Protection (50 | 2.0%), Cleaning & Maintenance (39 | 1.6%), Law Enforcement (33 | 1.3%), and Healthcare Support (22 | 0.9%).
Services Occupations by Sex
Within the Services occupations in Wanamassa, the most male-oriented occupations are Security & Protection (100.0%), Firefighting & Prevention (100.0%), and Law Enforcement (100.0%), while the most female-oriented occupations are Healthcare Support (100.0%), Personal Care & Service (100.0%), and Food Preparation & Serving (68.6%).
| Occupation | Male | Female |
| Healthcare Support | 0 (0.0%) | 22 (100.0%) |
| Security & Protection | 50 (100.0%) | 0 (0.0%) |
| Firefighting & Prevention | 17 (100.0%) | 0 (0.0%) |
| Law Enforcement | 33 (100.0%) | 0 (0.0%) |
| Food Preparation & Serving | 60 (31.4%) | 131 (68.6%) |
| Cleaning & Maintenance | 39 (100.0%) | 0 (0.0%) |
| Personal Care & Service | 0 (0.0%) | 15 (100.0%) |
| Total (Category) | 149 (47.0%) | 168 (53.0%) |
| Total (Overall) | 1,306 (52.1%) | 1,199 (47.9%) |
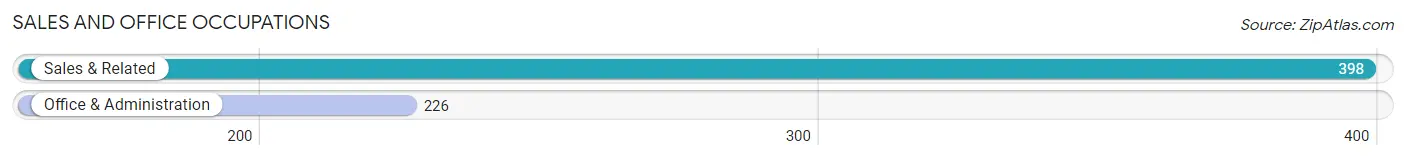
Sales and Office Occupations
The most common Sales and Office occupations in Wanamassa are Sales & Related (398 | 15.9%), and Office & Administration (226 | 9.0%).
Sales and Office Occupations by Sex
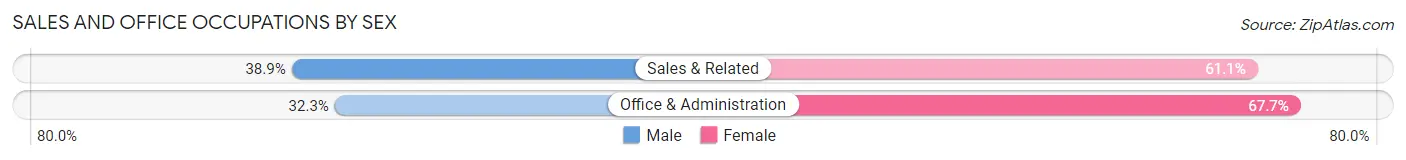
| Occupation | Male | Female |
| Sales & Related | 155 (38.9%) | 243 (61.1%) |
| Office & Administration | 73 (32.3%) | 153 (67.7%) |
| Total (Category) | 228 (36.5%) | 396 (63.5%) |
| Total (Overall) | 1,306 (52.1%) | 1,199 (47.9%) |
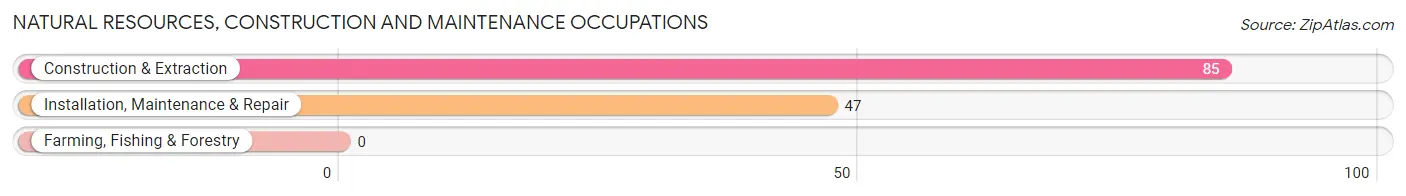
Natural Resources, Construction and Maintenance Occupations
The most common Natural Resources, Construction and Maintenance occupations in Wanamassa are Construction & Extraction (85 | 3.4%), and Installation, Maintenance & Repair (47 | 1.9%).
Natural Resources, Construction and Maintenance Occupations by Sex
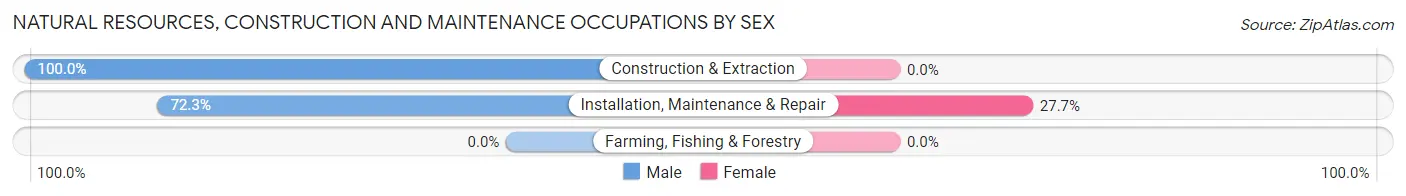
| Occupation | Male | Female |
| Farming, Fishing & Forestry | 0 (0.0%) | 0 (0.0%) |
| Construction & Extraction | 85 (100.0%) | 0 (0.0%) |
| Installation, Maintenance & Repair | 34 (72.3%) | 13 (27.7%) |
| Total (Category) | 119 (90.1%) | 13 (9.9%) |
| Total (Overall) | 1,306 (52.1%) | 1,199 (47.9%) |
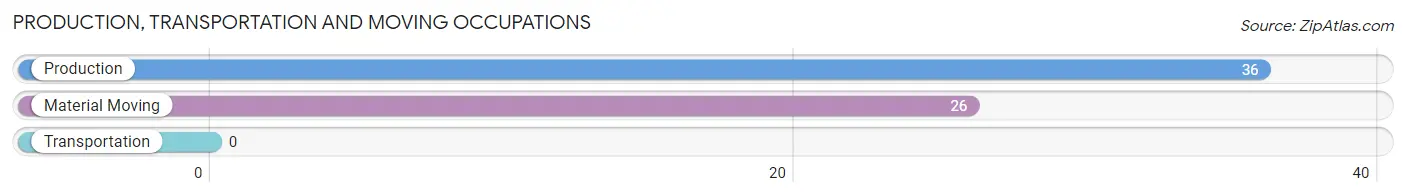
Production, Transportation and Moving Occupations
The most common Production, Transportation and Moving occupations in Wanamassa are Production (36 | 1.4%), and Material Moving (26 | 1.0%).
Production, Transportation and Moving Occupations by Sex
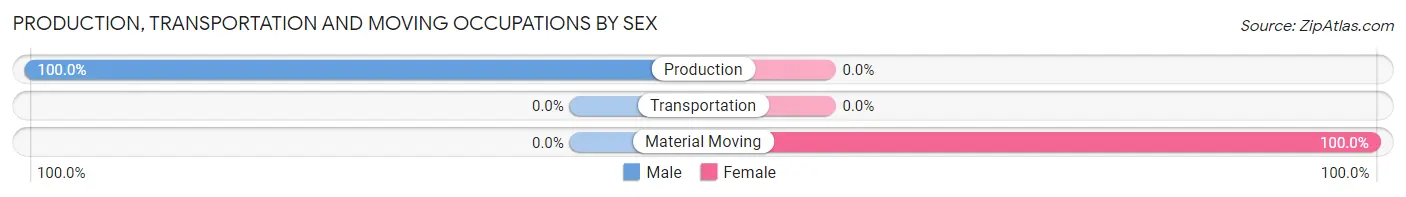
| Occupation | Male | Female |
| Production | 36 (100.0%) | 0 (0.0%) |
| Transportation | 0 (0.0%) | 0 (0.0%) |
| Material Moving | 0 (0.0%) | 26 (100.0%) |
| Total (Category) | 36 (58.1%) | 26 (41.9%) |
| Total (Overall) | 1,306 (52.1%) | 1,199 (47.9%) |
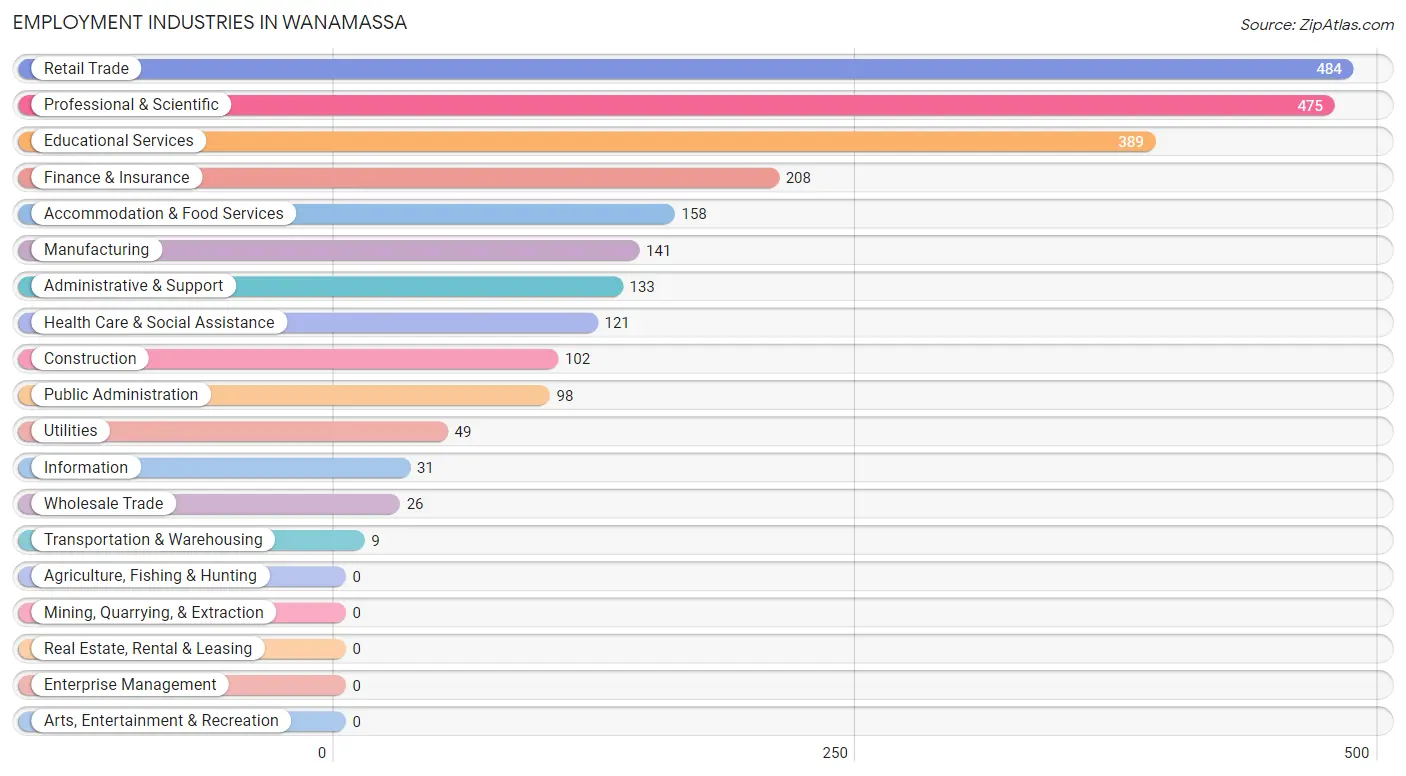
Employment Industries by Sex in Wanamassa
Employment Industries in Wanamassa
The major employment industries in Wanamassa include Retail Trade (484 | 19.3%), Professional & Scientific (475 | 19.0%), Educational Services (389 | 15.5%), Finance & Insurance (208 | 8.3%), and Accommodation & Food Services (158 | 6.3%).
Employment Industries by Sex in Wanamassa
The Wanamassa industries that see more men than women are Construction (100.0%), Wholesale Trade (100.0%), and Finance & Insurance (76.4%), whereas the industries that tend to have a higher number of women are Transportation & Warehousing (100.0%), Health Care & Social Assistance (76.9%), and Retail Trade (73.8%).
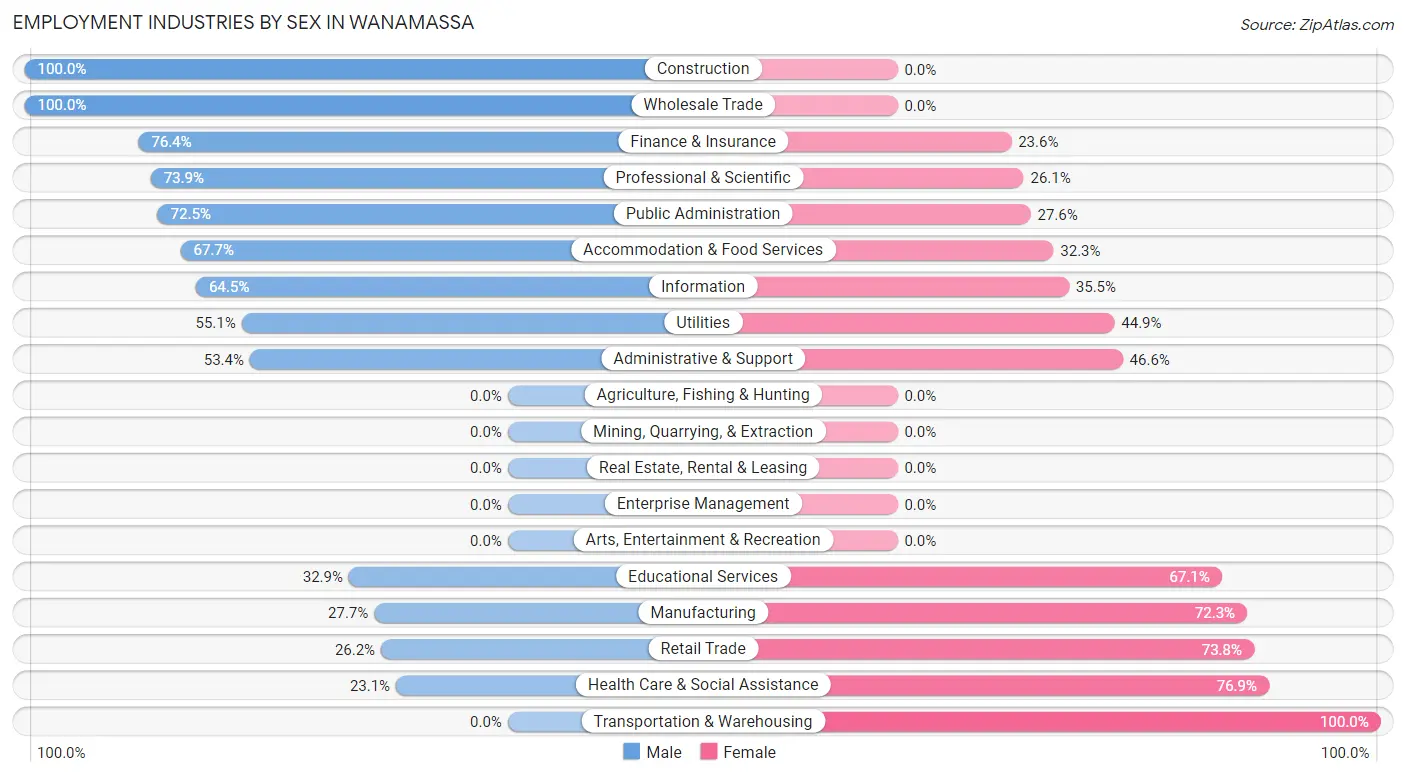
| Industry | Male | Female |
| Agriculture, Fishing & Hunting | 0 (0.0%) | 0 (0.0%) |
| Mining, Quarrying, & Extraction | 0 (0.0%) | 0 (0.0%) |
| Construction | 102 (100.0%) | 0 (0.0%) |
| Manufacturing | 39 (27.7%) | 102 (72.3%) |
| Wholesale Trade | 26 (100.0%) | 0 (0.0%) |
| Retail Trade | 127 (26.2%) | 357 (73.8%) |
| Transportation & Warehousing | 0 (0.0%) | 9 (100.0%) |
| Utilities | 27 (55.1%) | 22 (44.9%) |
| Information | 20 (64.5%) | 11 (35.5%) |
| Finance & Insurance | 159 (76.4%) | 49 (23.6%) |
| Real Estate, Rental & Leasing | 0 (0.0%) | 0 (0.0%) |
| Professional & Scientific | 351 (73.9%) | 124 (26.1%) |
| Enterprise Management | 0 (0.0%) | 0 (0.0%) |
| Administrative & Support | 71 (53.4%) | 62 (46.6%) |
| Educational Services | 128 (32.9%) | 261 (67.1%) |
| Health Care & Social Assistance | 28 (23.1%) | 93 (76.9%) |
| Arts, Entertainment & Recreation | 0 (0.0%) | 0 (0.0%) |
| Accommodation & Food Services | 107 (67.7%) | 51 (32.3%) |
| Public Administration | 71 (72.5%) | 27 (27.6%) |
| Total | 1,306 (52.1%) | 1,199 (47.9%) |
Education in Wanamassa
School Enrollment in Wanamassa
The most common levels of schooling among the 1,020 students in Wanamassa are high school (262 | 25.7%), middle school (251 | 24.6%), and elementary school (187 | 18.3%).
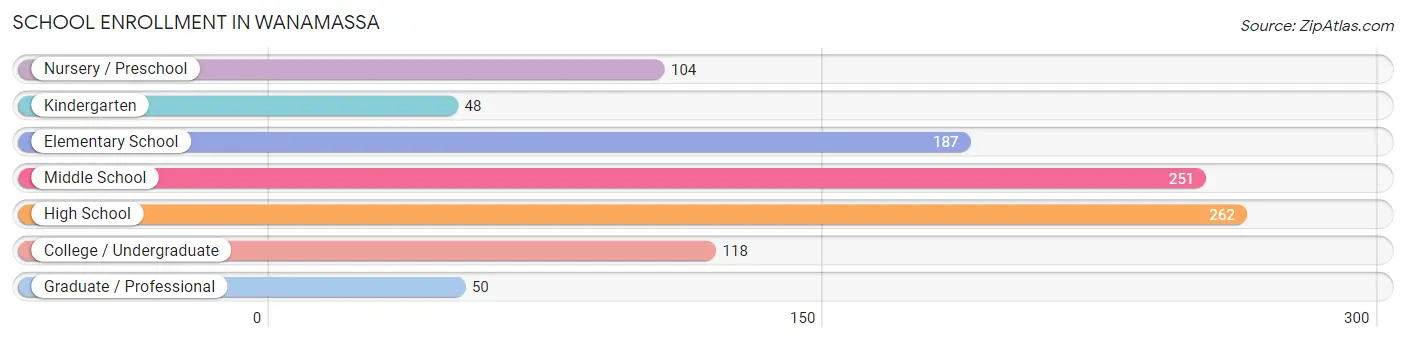
| School Level | # Students | % Students |
| Nursery / Preschool | 104 | 10.2% |
| Kindergarten | 48 | 4.7% |
| Elementary School | 187 | 18.3% |
| Middle School | 251 | 24.6% |
| High School | 262 | 25.7% |
| College / Undergraduate | 118 | 11.6% |
| Graduate / Professional | 50 | 4.9% |
| Total | 1,020 | 100.0% |
School Enrollment by Age by Funding Source in Wanamassa
Out of a total of 1,020 students who are enrolled in schools in Wanamassa, 119 (11.7%) attend a private institution, while the remaining 901 (88.3%) are enrolled in public schools. The age group of 20 to 24 year olds has the highest likelihood of being enrolled in private schools, with 10 (100.0% in the age bracket) enrolled. Conversely, the age group of 5 to 9 year old has the lowest likelihood of being enrolled in a private school, with 236 (100.0% in the age bracket) attending a public institution.
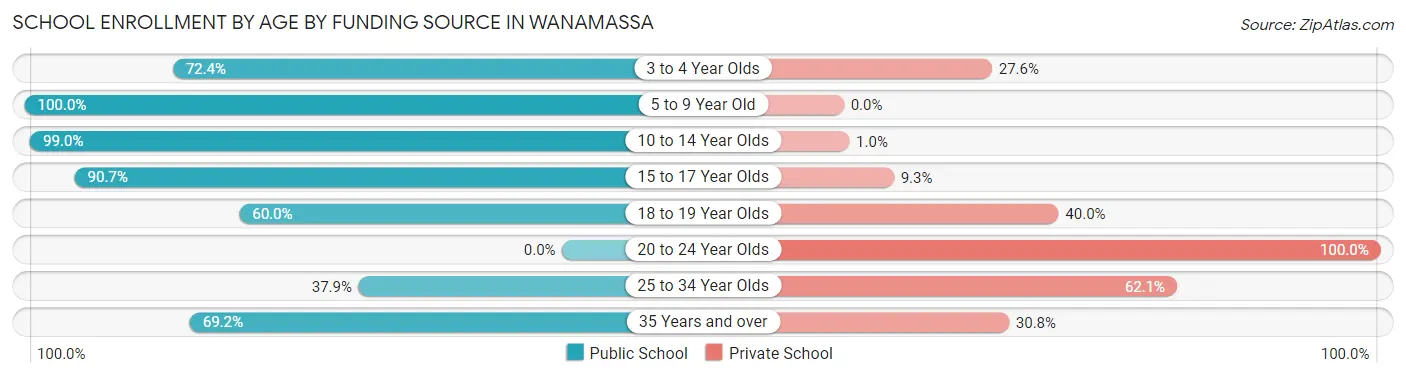
| Age Bracket | Public School | Private School |
| 3 to 4 Year Olds | 63 (72.4%) | 24 (27.6%) |
| 5 to 9 Year Old | 236 (100.0%) | 0 (0.0%) |
| 10 to 14 Year Olds | 290 (99.0%) | 3 (1.0%) |
| 15 to 17 Year Olds | 214 (90.7%) | 22 (9.3%) |
| 18 to 19 Year Olds | 15 (60.0%) | 10 (40.0%) |
| 20 to 24 Year Olds | 0 (0.0%) | 10 (100.0%) |
| 25 to 34 Year Olds | 11 (37.9%) | 18 (62.1%) |
| 35 Years and over | 72 (69.2%) | 32 (30.8%) |
| Total | 901 (88.3%) | 119 (11.7%) |
Educational Attainment by Field of Study in Wanamassa
Education (360 | 17.7%), social sciences (343 | 16.9%), business (293 | 14.4%), liberal arts & history (157 | 7.7%), and engineering (139 | 6.8%) are the most common fields of study among 2,032 individuals in Wanamassa who have obtained a bachelor's degree or higher.
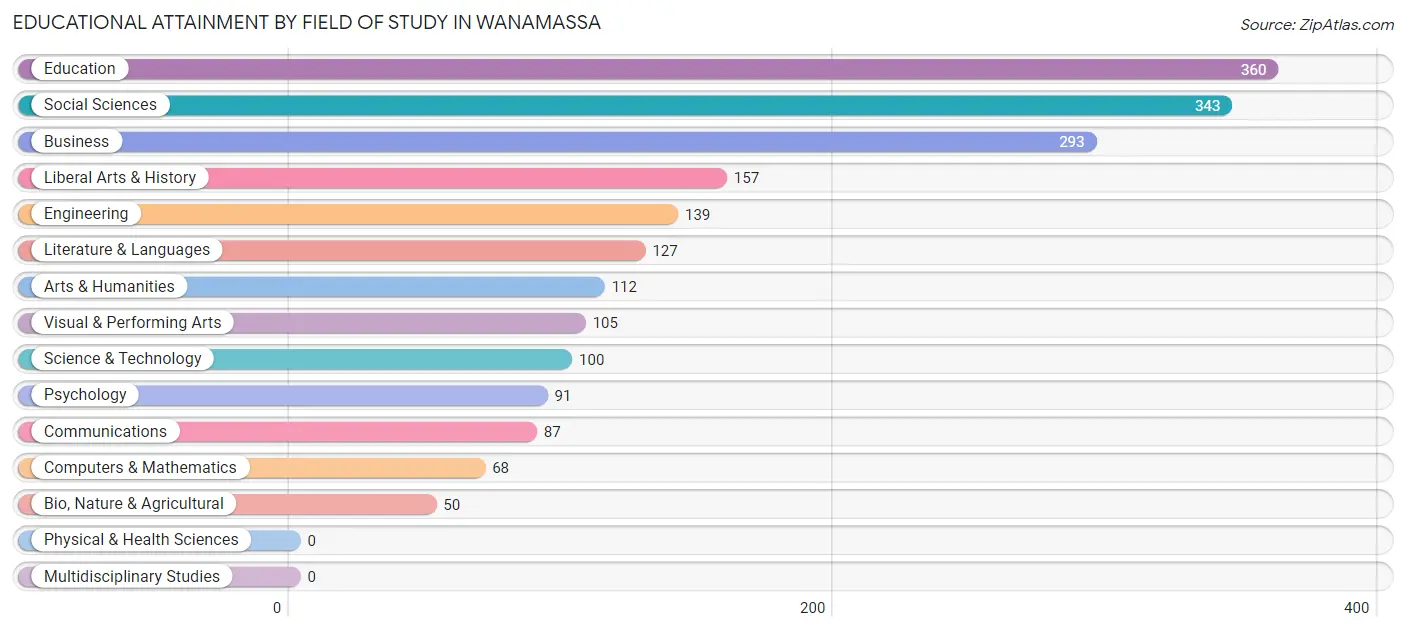
| Field of Study | # Graduates | % Graduates |
| Computers & Mathematics | 68 | 3.4% |
| Bio, Nature & Agricultural | 50 | 2.5% |
| Physical & Health Sciences | 0 | 0.0% |
| Psychology | 91 | 4.5% |
| Social Sciences | 343 | 16.9% |
| Engineering | 139 | 6.8% |
| Multidisciplinary Studies | 0 | 0.0% |
| Science & Technology | 100 | 4.9% |
| Business | 293 | 14.4% |
| Education | 360 | 17.7% |
| Literature & Languages | 127 | 6.2% |
| Liberal Arts & History | 157 | 7.7% |
| Visual & Performing Arts | 105 | 5.2% |
| Communications | 87 | 4.3% |
| Arts & Humanities | 112 | 5.5% |
| Total | 2,032 | 100.0% |
Transportation & Commute in Wanamassa
Vehicle Availability by Sex in Wanamassa
The most prevalent vehicle ownership categories in Wanamassa are males with 2 vehicles (737, accounting for 56.4%) and females with 2 vehicles (601, making up 72.9%).
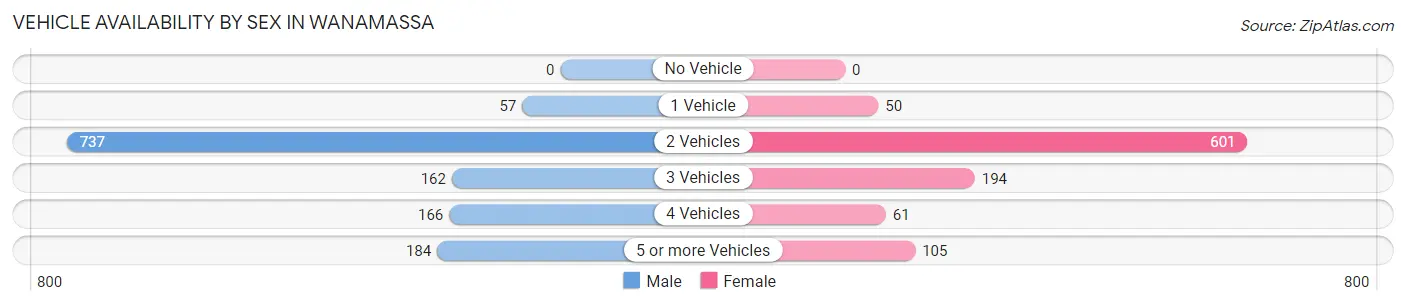
| Vehicles Available | Male | Female |
| No Vehicle | 0 (0.0%) | 0 (0.0%) |
| 1 Vehicle | 57 (4.4%) | 50 (5.0%) |
| 2 Vehicles | 737 (56.4%) | 601 (59.5%) |
| 3 Vehicles | 162 (12.4%) | 194 (19.2%) |
| 4 Vehicles | 166 (12.7%) | 61 (6.0%) |
| 5 or more Vehicles | 184 (14.1%) | 105 (10.4%) |
| Total | 1,306 (100.0%) | 1,011 (100.0%) |
Commute Time in Wanamassa
The most frequently occuring commute durations in Wanamassa are 15 to 19 minutes (576 commuters, 32.1%), 10 to 14 minutes (203 commuters, 11.3%), and 5 to 9 minutes (164 commuters, 9.1%).
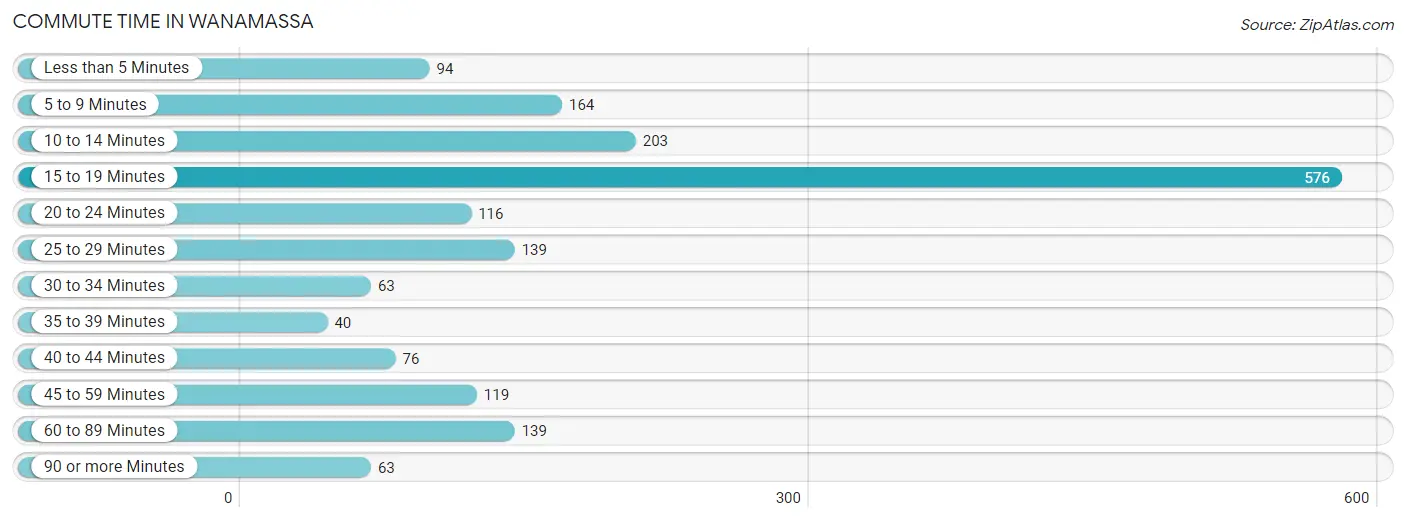
| Commute Time | # Commuters | % Commuters |
| Less than 5 Minutes | 94 | 5.2% |
| 5 to 9 Minutes | 164 | 9.1% |
| 10 to 14 Minutes | 203 | 11.3% |
| 15 to 19 Minutes | 576 | 32.1% |
| 20 to 24 Minutes | 116 | 6.5% |
| 25 to 29 Minutes | 139 | 7.8% |
| 30 to 34 Minutes | 63 | 3.5% |
| 35 to 39 Minutes | 40 | 2.2% |
| 40 to 44 Minutes | 76 | 4.2% |
| 45 to 59 Minutes | 119 | 6.6% |
| 60 to 89 Minutes | 139 | 7.8% |
| 90 or more Minutes | 63 | 3.5% |
Commute Time by Sex in Wanamassa
The most common commute times in Wanamassa are 15 to 19 minutes (321 commuters, 34.4%) for males and 15 to 19 minutes (255 commuters, 29.7%) for females.
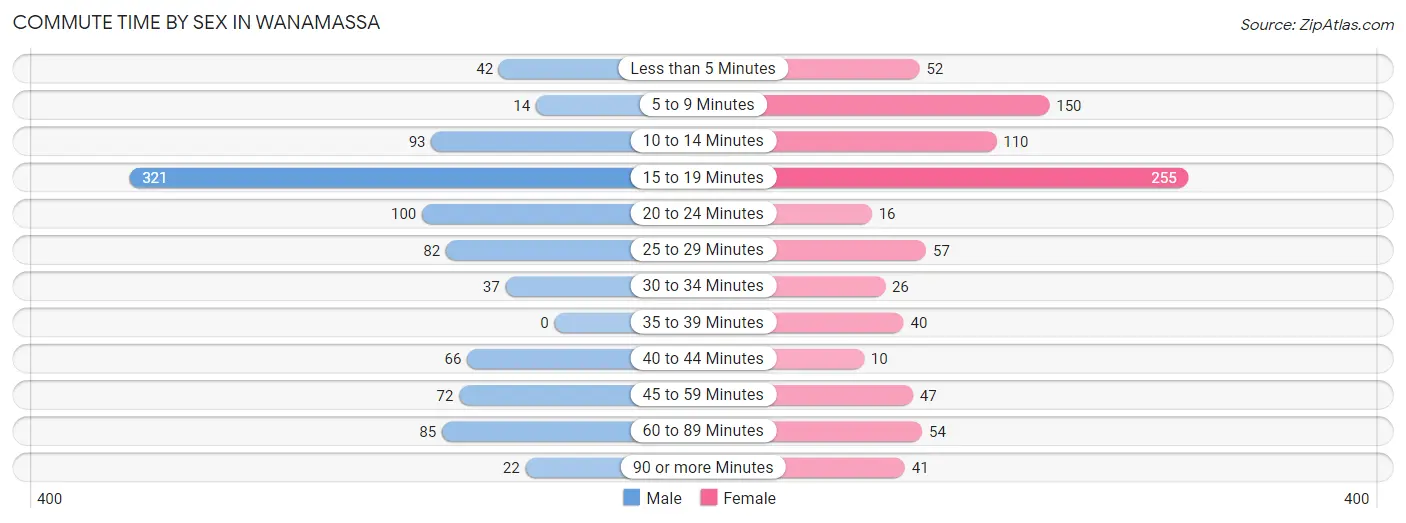
| Commute Time | Male | Female |
| Less than 5 Minutes | 42 (4.5%) | 52 (6.1%) |
| 5 to 9 Minutes | 14 (1.5%) | 150 (17.5%) |
| 10 to 14 Minutes | 93 (10.0%) | 110 (12.8%) |
| 15 to 19 Minutes | 321 (34.4%) | 255 (29.7%) |
| 20 to 24 Minutes | 100 (10.7%) | 16 (1.9%) |
| 25 to 29 Minutes | 82 (8.8%) | 57 (6.6%) |
| 30 to 34 Minutes | 37 (4.0%) | 26 (3.0%) |
| 35 to 39 Minutes | 0 (0.0%) | 40 (4.7%) |
| 40 to 44 Minutes | 66 (7.1%) | 10 (1.2%) |
| 45 to 59 Minutes | 72 (7.7%) | 47 (5.5%) |
| 60 to 89 Minutes | 85 (9.1%) | 54 (6.3%) |
| 90 or more Minutes | 22 (2.4%) | 41 (4.8%) |
Time of Departure to Work by Sex in Wanamassa
The most frequent times of departure to work in Wanamassa are 8:00 AM to 8:29 AM (298, 31.9%) for males and 8:30 AM to 8:59 AM (205, 23.9%) for females.
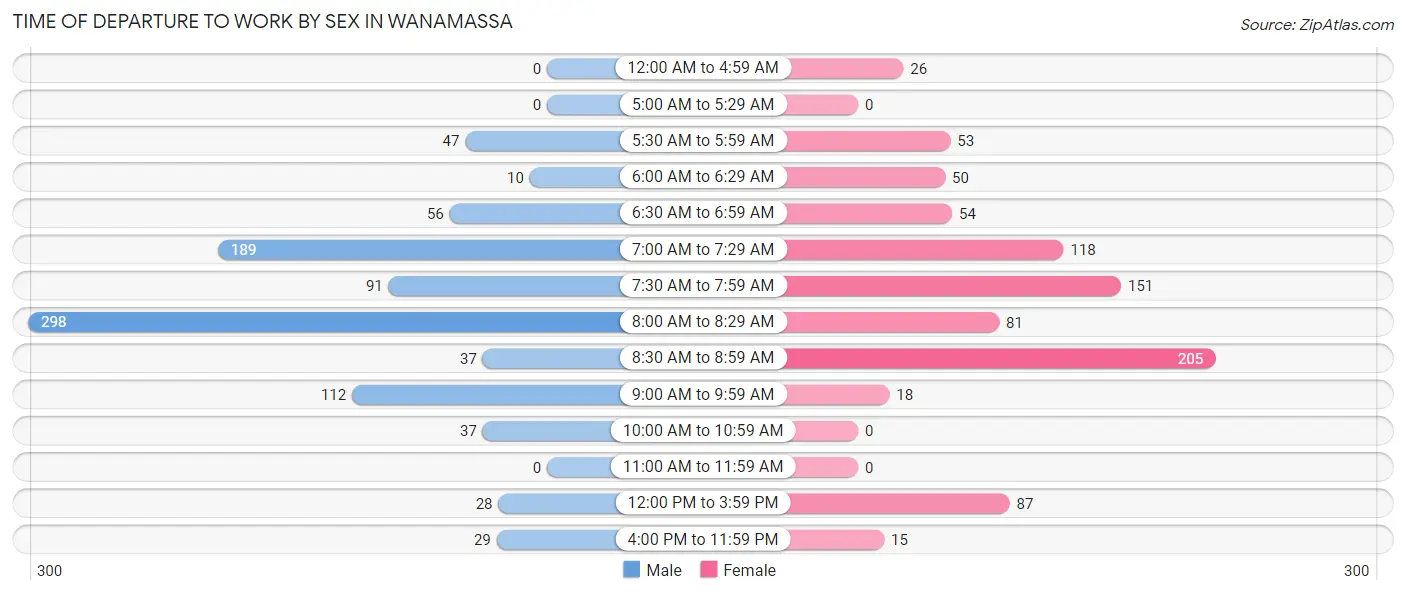
| Time of Departure | Male | Female |
| 12:00 AM to 4:59 AM | 0 (0.0%) | 26 (3.0%) |
| 5:00 AM to 5:29 AM | 0 (0.0%) | 0 (0.0%) |
| 5:30 AM to 5:59 AM | 47 (5.0%) | 53 (6.2%) |
| 6:00 AM to 6:29 AM | 10 (1.1%) | 50 (5.8%) |
| 6:30 AM to 6:59 AM | 56 (6.0%) | 54 (6.3%) |
| 7:00 AM to 7:29 AM | 189 (20.2%) | 118 (13.8%) |
| 7:30 AM to 7:59 AM | 91 (9.7%) | 151 (17.6%) |
| 8:00 AM to 8:29 AM | 298 (31.9%) | 81 (9.4%) |
| 8:30 AM to 8:59 AM | 37 (4.0%) | 205 (23.9%) |
| 9:00 AM to 9:59 AM | 112 (12.0%) | 18 (2.1%) |
| 10:00 AM to 10:59 AM | 37 (4.0%) | 0 (0.0%) |
| 11:00 AM to 11:59 AM | 0 (0.0%) | 0 (0.0%) |
| 12:00 PM to 3:59 PM | 28 (3.0%) | 87 (10.1%) |
| 4:00 PM to 11:59 PM | 29 (3.1%) | 15 (1.8%) |
| Total | 934 (100.0%) | 858 (100.0%) |
Housing Occupancy in Wanamassa
Occupancy by Ownership in Wanamassa
Of the total 1,536 dwellings in Wanamassa, owner-occupied units account for 1,417 (92.2%), while renter-occupied units make up 119 (7.7%).
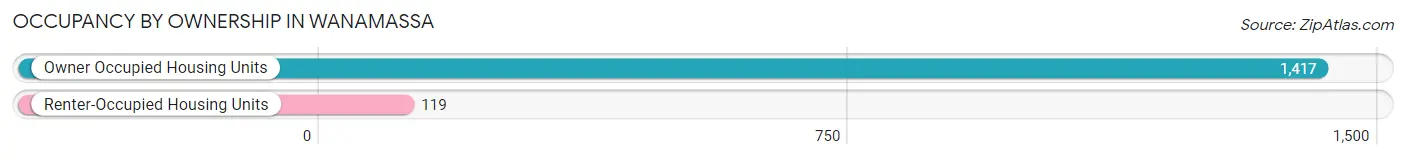
| Occupancy | # Housing Units | % Housing Units |
| Owner Occupied Housing Units | 1,417 | 92.2% |
| Renter-Occupied Housing Units | 119 | 7.7% |
| Total Occupied Housing Units | 1,536 | 100.0% |
Occupancy by Household Size in Wanamassa
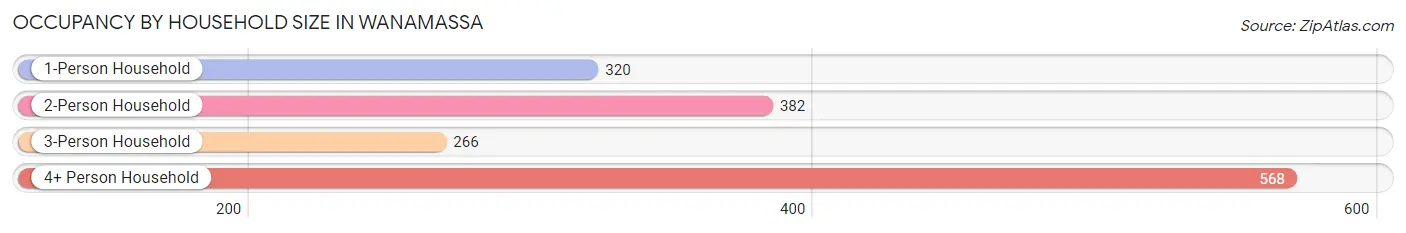
| Household Size | # Housing Units | % Housing Units |
| 1-Person Household | 320 | 20.8% |
| 2-Person Household | 382 | 24.9% |
| 3-Person Household | 266 | 17.3% |
| 4+ Person Household | 568 | 37.0% |
| Total Housing Units | 1,536 | 100.0% |
Occupancy by Ownership by Household Size in Wanamassa
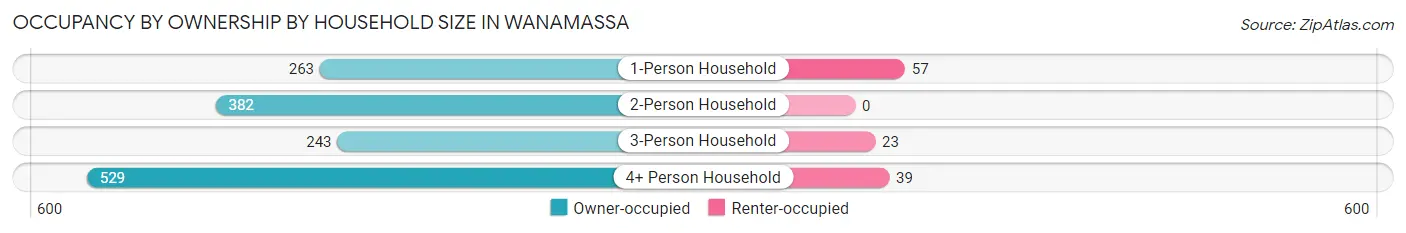
| Household Size | Owner-occupied | Renter-occupied |
| 1-Person Household | 263 (82.2%) | 57 (17.8%) |
| 2-Person Household | 382 (100.0%) | 0 (0.0%) |
| 3-Person Household | 243 (91.3%) | 23 (8.6%) |
| 4+ Person Household | 529 (93.1%) | 39 (6.9%) |
| Total Housing Units | 1,417 (92.2%) | 119 (7.7%) |
Occupancy by Educational Attainment in Wanamassa
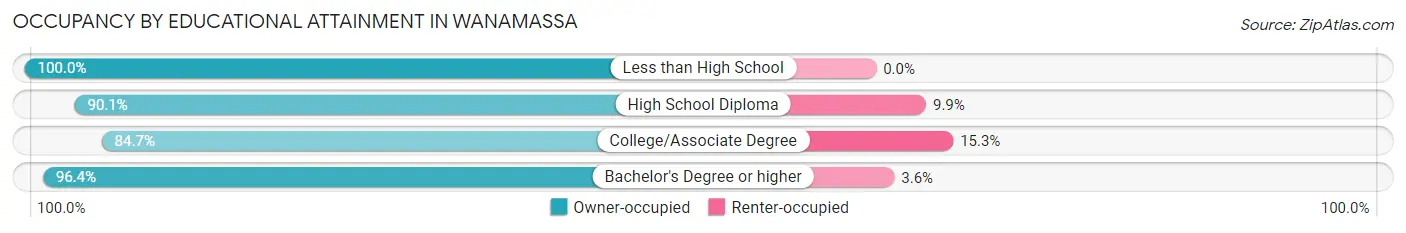
| Household Size | Owner-occupied | Renter-occupied |
| Less than High School | 9 (100.0%) | 0 (0.0%) |
| High School Diploma | 237 (90.1%) | 26 (9.9%) |
| College/Associate Degree | 344 (84.7%) | 62 (15.3%) |
| Bachelor's Degree or higher | 827 (96.4%) | 31 (3.6%) |
Occupancy by Age of Householder in Wanamassa
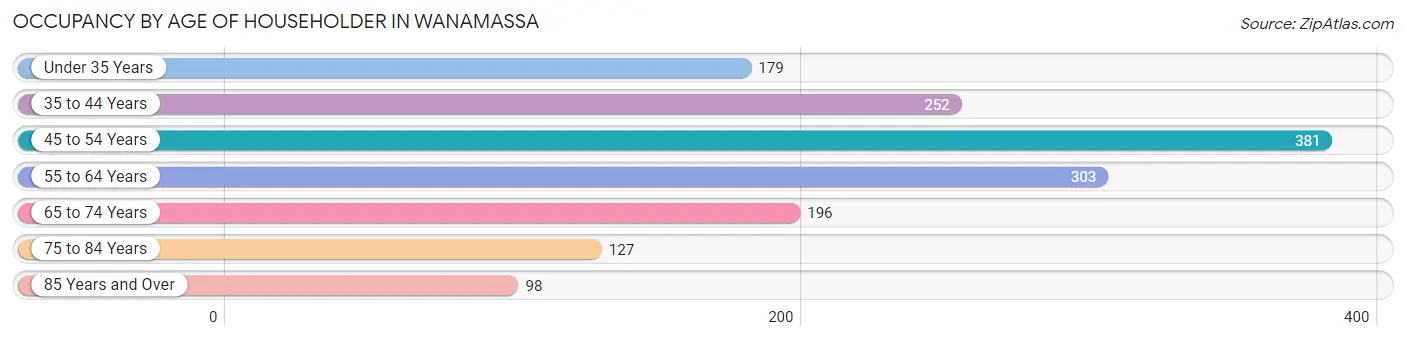
| Age Bracket | # Households | % Households |
| Under 35 Years | 179 | 11.7% |
| 35 to 44 Years | 252 | 16.4% |
| 45 to 54 Years | 381 | 24.8% |
| 55 to 64 Years | 303 | 19.7% |
| 65 to 74 Years | 196 | 12.8% |
| 75 to 84 Years | 127 | 8.3% |
| 85 Years and Over | 98 | 6.4% |
| Total | 1,536 | 100.0% |
Housing Finances in Wanamassa
Median Income by Occupancy in Wanamassa
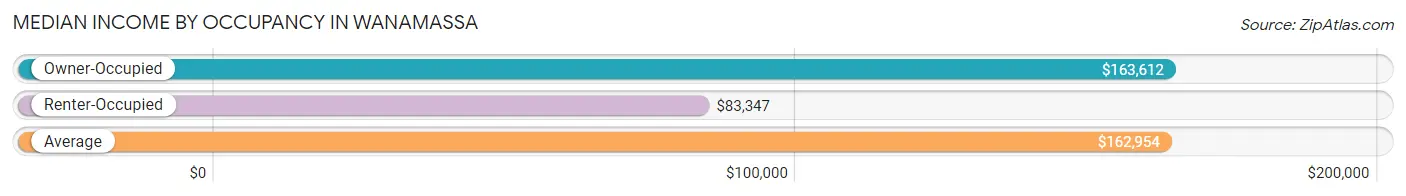
| Occupancy Type | # Households | Median Income |
| Owner-Occupied | 1,417 (92.2%) | $163,612 |
| Renter-Occupied | 119 (7.7%) | $83,347 |
| Average | 1,536 (100.0%) | $162,954 |
Occupancy by Householder Income Bracket in Wanamassa
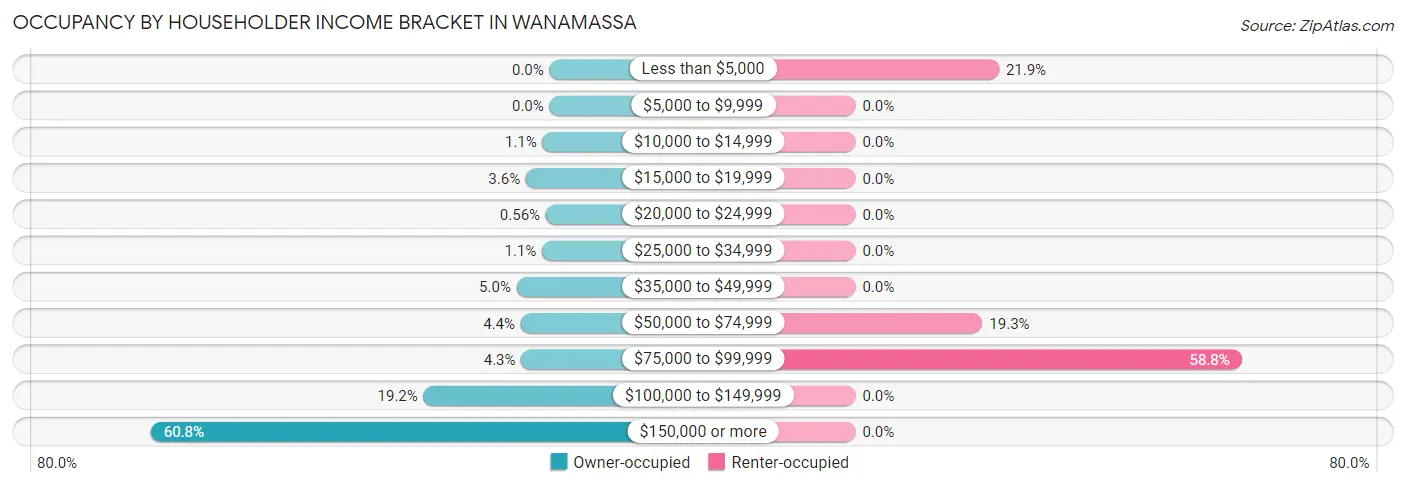
| Income Bracket | Owner-occupied | Renter-occupied |
| Less than $5,000 | 0 (0.0%) | 26 (21.8%) |
| $5,000 to $9,999 | 0 (0.0%) | 0 (0.0%) |
| $10,000 to $14,999 | 15 (1.1%) | 0 (0.0%) |
| $15,000 to $19,999 | 51 (3.6%) | 0 (0.0%) |
| $20,000 to $24,999 | 8 (0.6%) | 0 (0.0%) |
| $25,000 to $34,999 | 16 (1.1%) | 0 (0.0%) |
| $35,000 to $49,999 | 71 (5.0%) | 0 (0.0%) |
| $50,000 to $74,999 | 62 (4.4%) | 23 (19.3%) |
| $75,000 to $99,999 | 61 (4.3%) | 70 (58.8%) |
| $100,000 to $149,999 | 272 (19.2%) | 0 (0.0%) |
| $150,000 or more | 861 (60.8%) | 0 (0.0%) |
| Total | 1,417 (100.0%) | 119 (100.0%) |
Monthly Housing Cost Tiers in Wanamassa
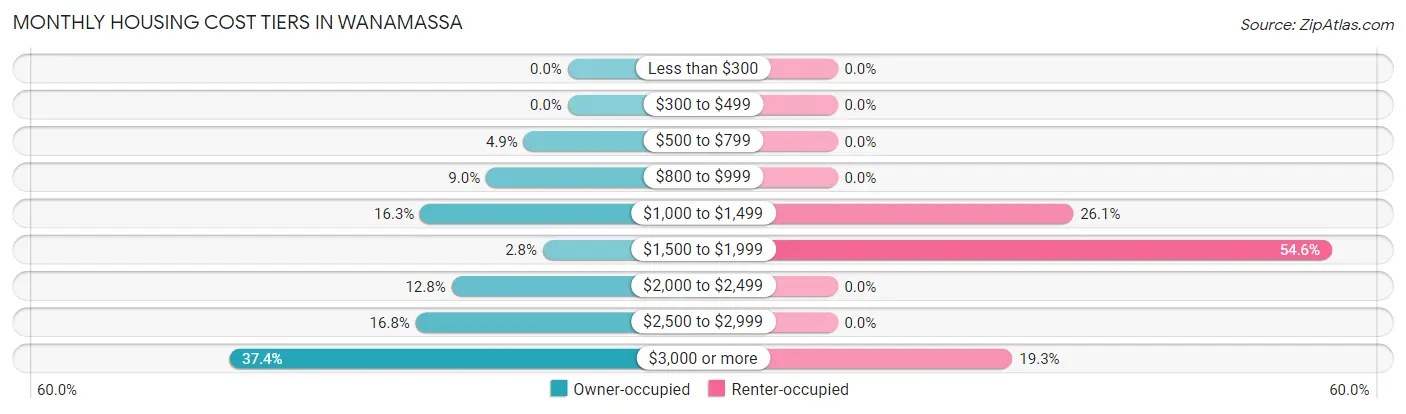
| Monthly Cost | Owner-occupied | Renter-occupied |
| Less than $300 | 0 (0.0%) | 0 (0.0%) |
| $300 to $499 | 0 (0.0%) | 0 (0.0%) |
| $500 to $799 | 69 (4.9%) | 0 (0.0%) |
| $800 to $999 | 128 (9.0%) | 0 (0.0%) |
| $1,000 to $1,499 | 231 (16.3%) | 31 (26.1%) |
| $1,500 to $1,999 | 39 (2.8%) | 65 (54.6%) |
| $2,000 to $2,499 | 182 (12.8%) | 0 (0.0%) |
| $2,500 to $2,999 | 238 (16.8%) | 0 (0.0%) |
| $3,000 or more | 530 (37.4%) | 23 (19.3%) |
| Total | 1,417 (100.0%) | 119 (100.0%) |
Physical Housing Characteristics in Wanamassa
Housing Structures in Wanamassa
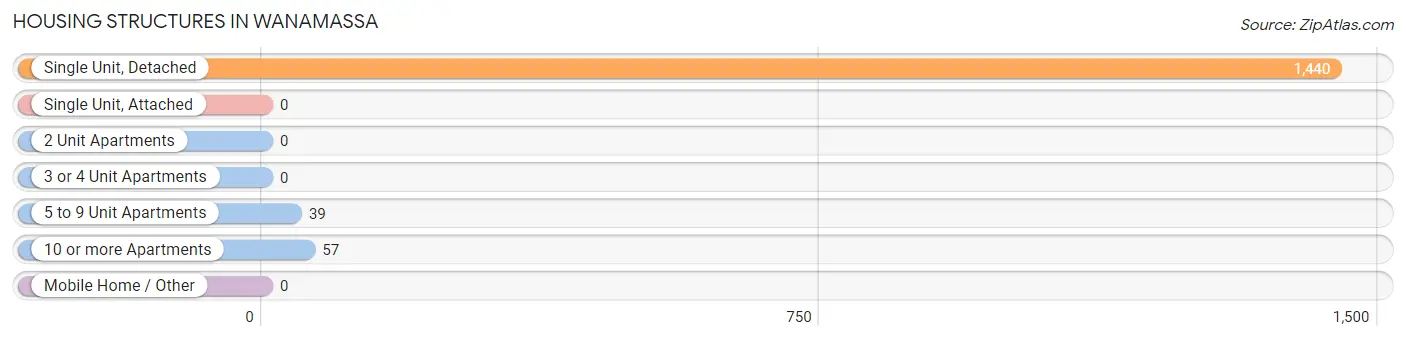
| Structure Type | # Housing Units | % Housing Units |
| Single Unit, Detached | 1,440 | 93.8% |
| Single Unit, Attached | 0 | 0.0% |
| 2 Unit Apartments | 0 | 0.0% |
| 3 or 4 Unit Apartments | 0 | 0.0% |
| 5 to 9 Unit Apartments | 39 | 2.5% |
| 10 or more Apartments | 57 | 3.7% |
| Mobile Home / Other | 0 | 0.0% |
| Total | 1,536 | 100.0% |
Housing Structures by Occupancy in Wanamassa
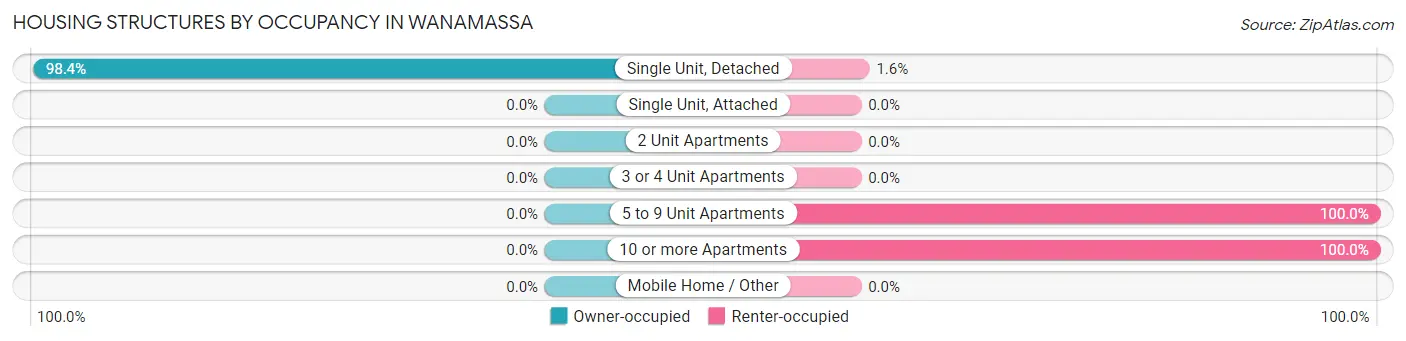
| Structure Type | Owner-occupied | Renter-occupied |
| Single Unit, Detached | 1,417 (98.4%) | 23 (1.6%) |
| Single Unit, Attached | 0 (0.0%) | 0 (0.0%) |
| 2 Unit Apartments | 0 (0.0%) | 0 (0.0%) |
| 3 or 4 Unit Apartments | 0 (0.0%) | 0 (0.0%) |
| 5 to 9 Unit Apartments | 0 (0.0%) | 39 (100.0%) |
| 10 or more Apartments | 0 (0.0%) | 57 (100.0%) |
| Mobile Home / Other | 0 (0.0%) | 0 (0.0%) |
| Total | 1,417 (92.2%) | 119 (7.7%) |
Housing Structures by Number of Rooms in Wanamassa
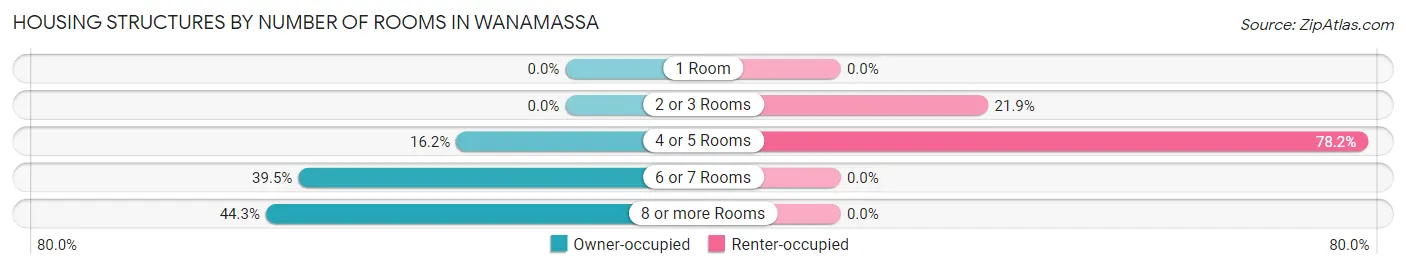
| Number of Rooms | Owner-occupied | Renter-occupied |
| 1 Room | 0 (0.0%) | 0 (0.0%) |
| 2 or 3 Rooms | 0 (0.0%) | 26 (21.8%) |
| 4 or 5 Rooms | 229 (16.2%) | 93 (78.1%) |
| 6 or 7 Rooms | 560 (39.5%) | 0 (0.0%) |
| 8 or more Rooms | 628 (44.3%) | 0 (0.0%) |
| Total | 1,417 (100.0%) | 119 (100.0%) |
Housing Structure by Heating Type in Wanamassa
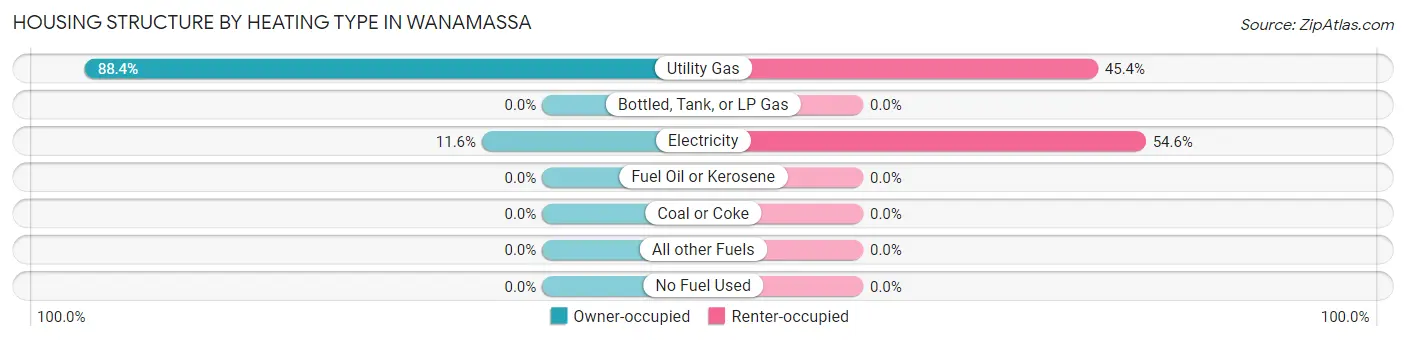
| Heating Type | Owner-occupied | Renter-occupied |
| Utility Gas | 1,252 (88.4%) | 54 (45.4%) |
| Bottled, Tank, or LP Gas | 0 (0.0%) | 0 (0.0%) |
| Electricity | 165 (11.6%) | 65 (54.6%) |
| Fuel Oil or Kerosene | 0 (0.0%) | 0 (0.0%) |
| Coal or Coke | 0 (0.0%) | 0 (0.0%) |
| All other Fuels | 0 (0.0%) | 0 (0.0%) |
| No Fuel Used | 0 (0.0%) | 0 (0.0%) |
| Total | 1,417 (100.0%) | 119 (100.0%) |
Household Vehicle Usage in Wanamassa
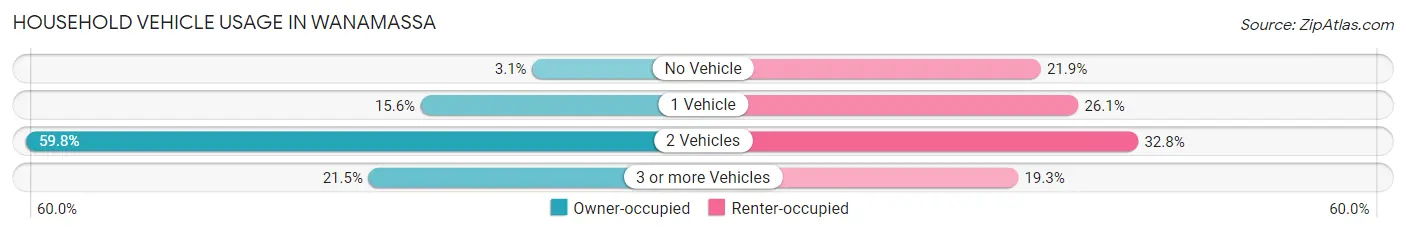
| Vehicles per Household | Owner-occupied | Renter-occupied |
| No Vehicle | 44 (3.1%) | 26 (21.8%) |
| 1 Vehicle | 221 (15.6%) | 31 (26.1%) |
| 2 Vehicles | 848 (59.8%) | 39 (32.8%) |
| 3 or more Vehicles | 304 (21.4%) | 23 (19.3%) |
| Total | 1,417 (100.0%) | 119 (100.0%) |
Real Estate & Mortgages in Wanamassa
Real Estate and Mortgage Overview in Wanamassa
| Characteristic | Without Mortgage | With Mortgage |
| Housing Units | 418 | 999 |
| Median Property Value | $404,100 | $457,900 |
| Median Household Income | $107,321 | $744 |
| Monthly Housing Costs | $1,080 | $508 |
| Real Estate Taxes | $8,357 | $15 |
Property Value by Mortgage Status in Wanamassa
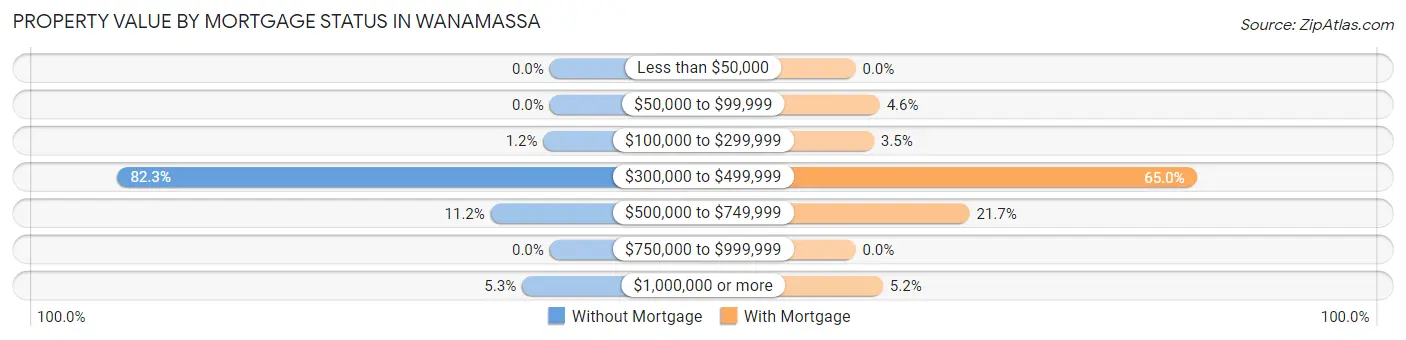
| Property Value | Without Mortgage | With Mortgage |
| Less than $50,000 | 0 (0.0%) | 0 (0.0%) |
| $50,000 to $99,999 | 0 (0.0%) | 46 (4.6%) |
| $100,000 to $299,999 | 5 (1.2%) | 35 (3.5%) |
| $300,000 to $499,999 | 344 (82.3%) | 649 (65.0%) |
| $500,000 to $749,999 | 47 (11.2%) | 217 (21.7%) |
| $750,000 to $999,999 | 0 (0.0%) | 0 (0.0%) |
| $1,000,000 or more | 22 (5.3%) | 52 (5.2%) |
| Total | 418 (100.0%) | 999 (100.0%) |
Household Income by Mortgage Status in Wanamassa
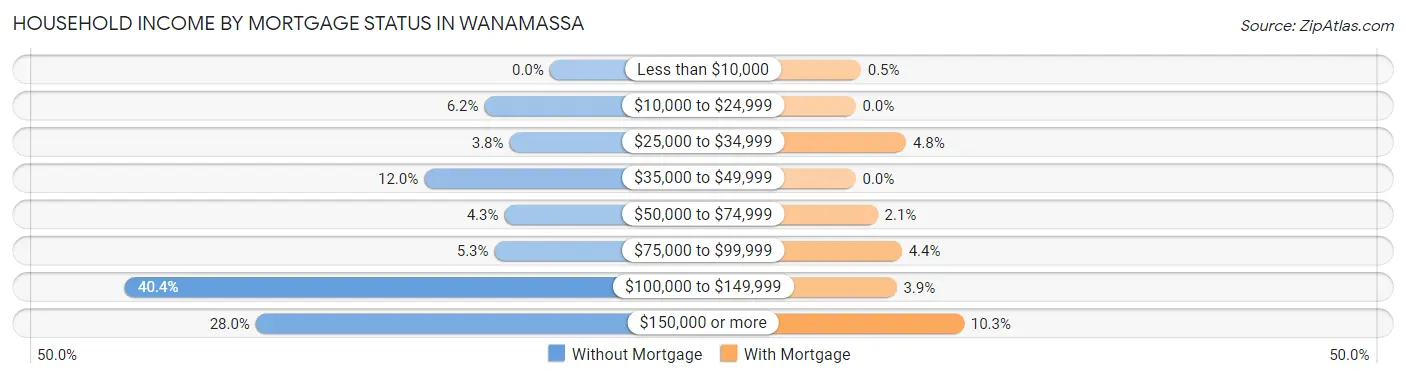
| Household Income | Without Mortgage | With Mortgage |
| Less than $10,000 | 0 (0.0%) | 5 (0.5%) |
| $10,000 to $24,999 | 26 (6.2%) | 0 (0.0%) |
| $25,000 to $34,999 | 16 (3.8%) | 48 (4.8%) |
| $35,000 to $49,999 | 50 (12.0%) | 0 (0.0%) |
| $50,000 to $74,999 | 18 (4.3%) | 21 (2.1%) |
| $75,000 to $99,999 | 22 (5.3%) | 44 (4.4%) |
| $100,000 to $149,999 | 169 (40.4%) | 39 (3.9%) |
| $150,000 or more | 117 (28.0%) | 103 (10.3%) |
| Total | 418 (100.0%) | 999 (100.0%) |
Property Value to Household Income Ratio in Wanamassa
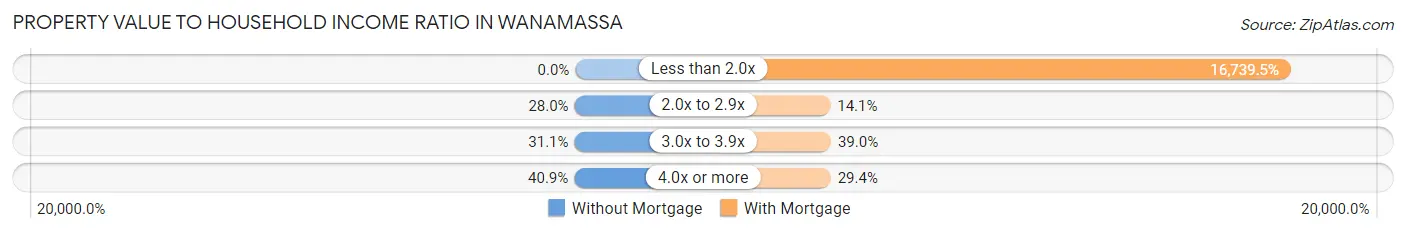
| Value-to-Income Ratio | Without Mortgage | With Mortgage |
| Less than 2.0x | 0 (0.0%) | 167,228 (16,739.5%) |
| 2.0x to 2.9x | 117 (28.0%) | 141 (14.1%) |
| 3.0x to 3.9x | 130 (31.1%) | 390 (39.0%) |
| 4.0x or more | 171 (40.9%) | 294 (29.4%) |
| Total | 418 (100.0%) | 999 (100.0%) |
Real Estate Taxes by Mortgage Status in Wanamassa
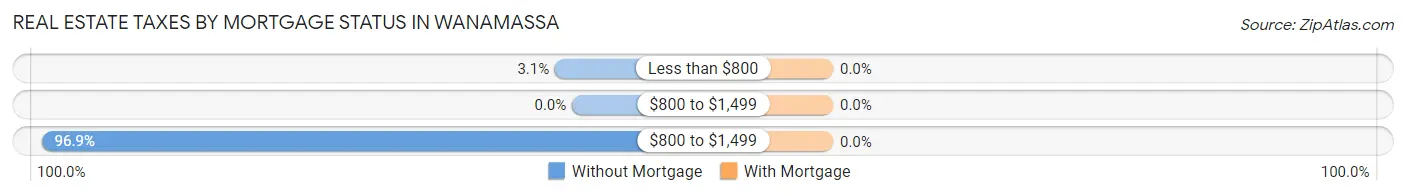
| Property Taxes | Without Mortgage | With Mortgage |
| Less than $800 | 13 (3.1%) | 0 (0.0%) |
| $800 to $1,499 | 0 (0.0%) | 0 (0.0%) |
| $800 to $1,499 | 405 (96.9%) | 0 (0.0%) |
| Total | 418 (100.0%) | 999 (100.0%) |
Health & Disability in Wanamassa
Health Insurance Coverage by Age in Wanamassa
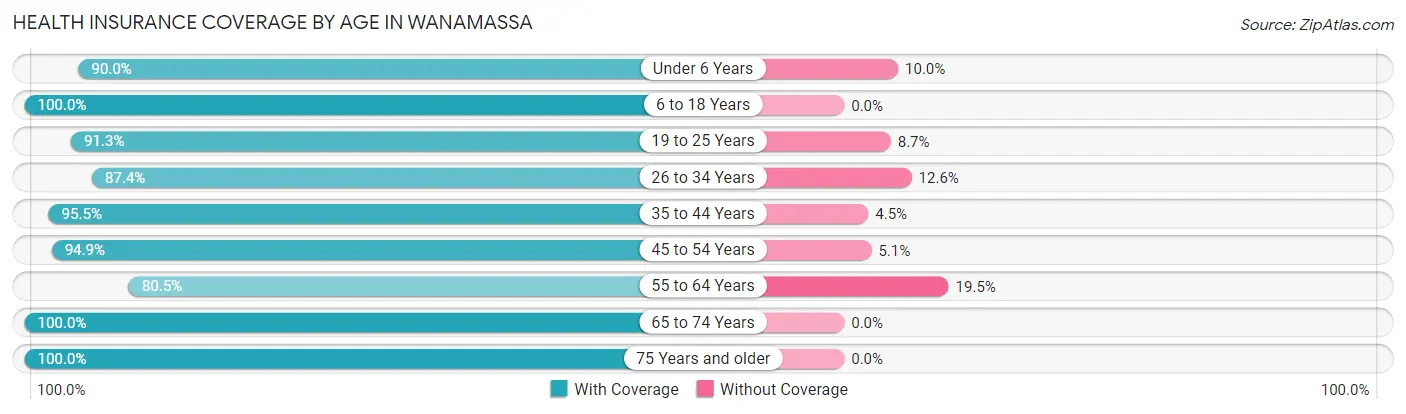
| Age Bracket | With Coverage | Without Coverage |
| Under 6 Years | 215 (90.0%) | 24 (10.0%) |
| 6 to 18 Years | 726 (100.0%) | 0 (0.0%) |
| 19 to 25 Years | 295 (91.3%) | 28 (8.7%) |
| 26 to 34 Years | 369 (87.4%) | 53 (12.6%) |
| 35 to 44 Years | 489 (95.5%) | 23 (4.5%) |
| 45 to 54 Years | 826 (94.9%) | 44 (5.1%) |
| 55 to 64 Years | 509 (80.5%) | 123 (19.5%) |
| 65 to 74 Years | 311 (100.0%) | 0 (0.0%) |
| 75 Years and older | 309 (100.0%) | 0 (0.0%) |
| Total | 4,049 (93.2%) | 295 (6.8%) |
Health Insurance Coverage by Citizenship Status in Wanamassa
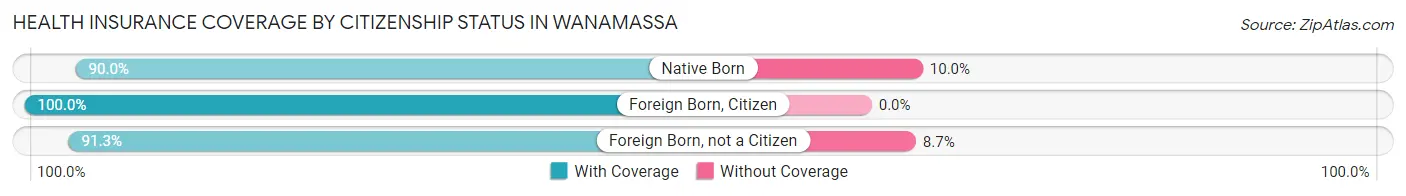
| Citizenship Status | With Coverage | Without Coverage |
| Native Born | 215 (90.0%) | 24 (10.0%) |
| Foreign Born, Citizen | 726 (100.0%) | 0 (0.0%) |
| Foreign Born, not a Citizen | 295 (91.3%) | 28 (8.7%) |
Health Insurance Coverage by Household Income in Wanamassa
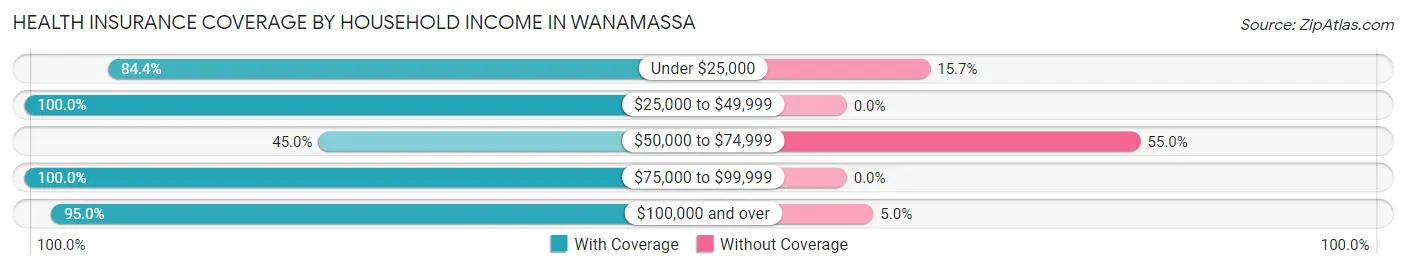
| Household Income | With Coverage | Without Coverage |
| Under $25,000 | 124 (84.4%) | 23 (15.7%) |
| $25,000 to $49,999 | 103 (100.0%) | 0 (0.0%) |
| $50,000 to $74,999 | 76 (45.0%) | 93 (55.0%) |
| $75,000 to $99,999 | 337 (100.0%) | 0 (0.0%) |
| $100,000 and over | 3,407 (95.0%) | 179 (5.0%) |
Public vs Private Health Insurance Coverage by Age in Wanamassa
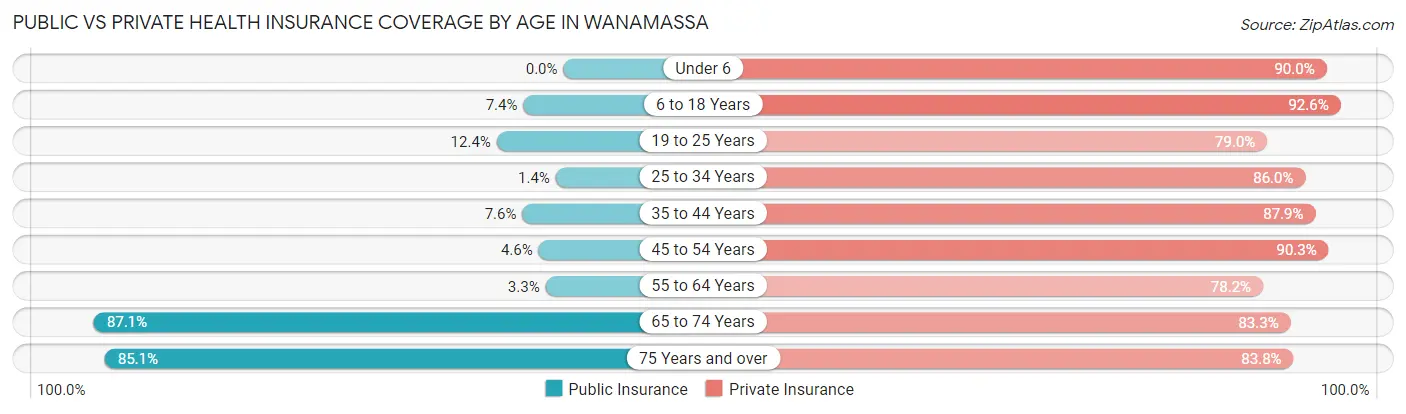
| Age Bracket | Public Insurance | Private Insurance |
| Under 6 | 0 (0.0%) | 215 (90.0%) |
| 6 to 18 Years | 54 (7.4%) | 672 (92.6%) |
| 19 to 25 Years | 40 (12.4%) | 255 (78.9%) |
| 25 to 34 Years | 6 (1.4%) | 363 (86.0%) |
| 35 to 44 Years | 39 (7.6%) | 450 (87.9%) |
| 45 to 54 Years | 40 (4.6%) | 786 (90.3%) |
| 55 to 64 Years | 21 (3.3%) | 494 (78.2%) |
| 65 to 74 Years | 271 (87.1%) | 259 (83.3%) |
| 75 Years and over | 263 (85.1%) | 259 (83.8%) |
| Total | 734 (16.9%) | 3,753 (86.4%) |
Disability Status by Sex by Age in Wanamassa
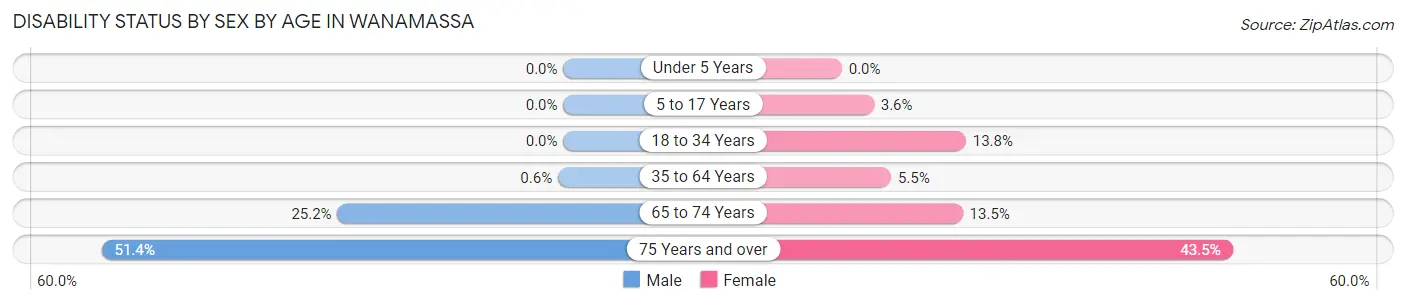
| Age Bracket | Male | Female |
| Under 5 Years | 0 (0.0%) | 0 (0.0%) |
| 5 to 17 Years | 0 (0.0%) | 11 (3.6%) |
| 18 to 34 Years | 0 (0.0%) | 46 (13.8%) |
| 35 to 64 Years | 6 (0.6%) | 56 (5.5%) |
| 65 to 74 Years | 39 (25.2%) | 21 (13.5%) |
| 75 Years and over | 36 (51.4%) | 104 (43.5%) |
Disability Class by Sex by Age in Wanamassa
Disability Class: Hearing Difficulty
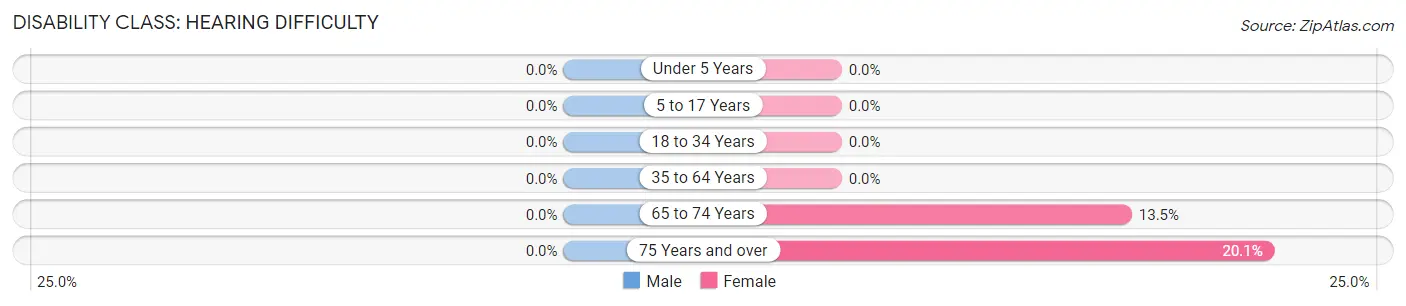
| Age Bracket | Male | Female |
| Under 5 Years | 0 (0.0%) | 0 (0.0%) |
| 5 to 17 Years | 0 (0.0%) | 0 (0.0%) |
| 18 to 34 Years | 0 (0.0%) | 0 (0.0%) |
| 35 to 64 Years | 0 (0.0%) | 0 (0.0%) |
| 65 to 74 Years | 0 (0.0%) | 21 (13.5%) |
| 75 Years and over | 0 (0.0%) | 48 (20.1%) |
Disability Class: Vision Difficulty
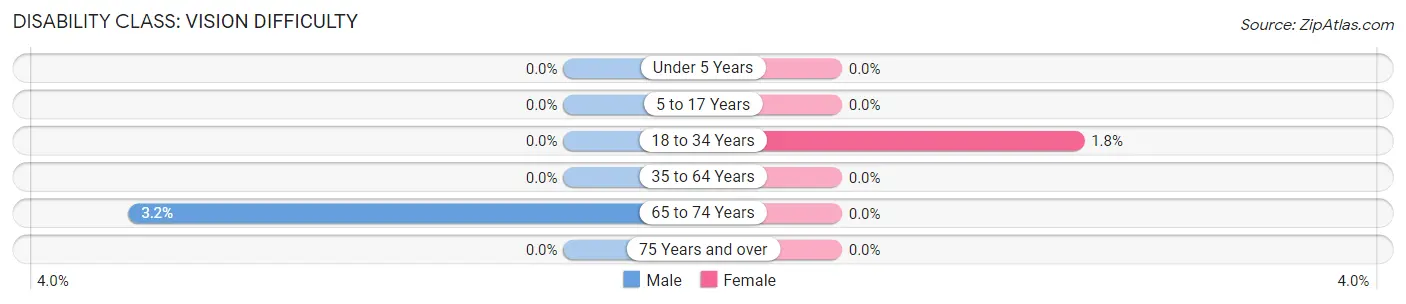
| Age Bracket | Male | Female |
| Under 5 Years | 0 (0.0%) | 0 (0.0%) |
| 5 to 17 Years | 0 (0.0%) | 0 (0.0%) |
| 18 to 34 Years | 0 (0.0%) | 6 (1.8%) |
| 35 to 64 Years | 0 (0.0%) | 0 (0.0%) |
| 65 to 74 Years | 5 (3.2%) | 0 (0.0%) |
| 75 Years and over | 0 (0.0%) | 0 (0.0%) |
Disability Class: Cognitive Difficulty
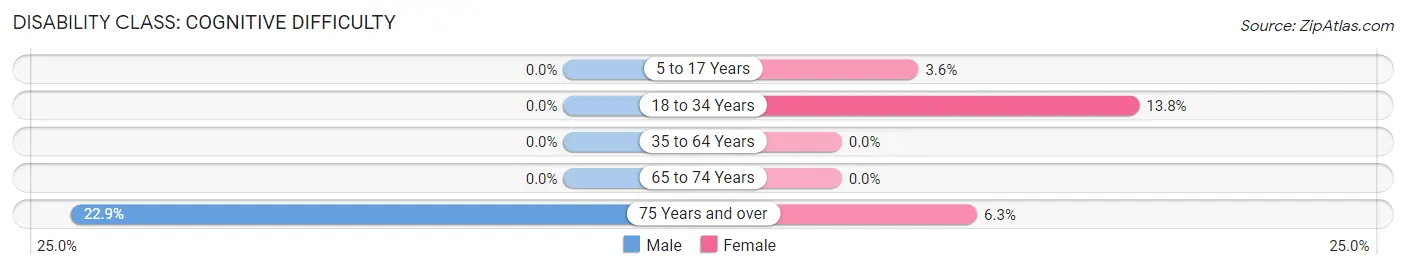
| Age Bracket | Male | Female |
| 5 to 17 Years | 0 (0.0%) | 11 (3.6%) |
| 18 to 34 Years | 0 (0.0%) | 46 (13.8%) |
| 35 to 64 Years | 0 (0.0%) | 0 (0.0%) |
| 65 to 74 Years | 0 (0.0%) | 0 (0.0%) |
| 75 Years and over | 16 (22.9%) | 15 (6.3%) |
Disability Class: Ambulatory Difficulty
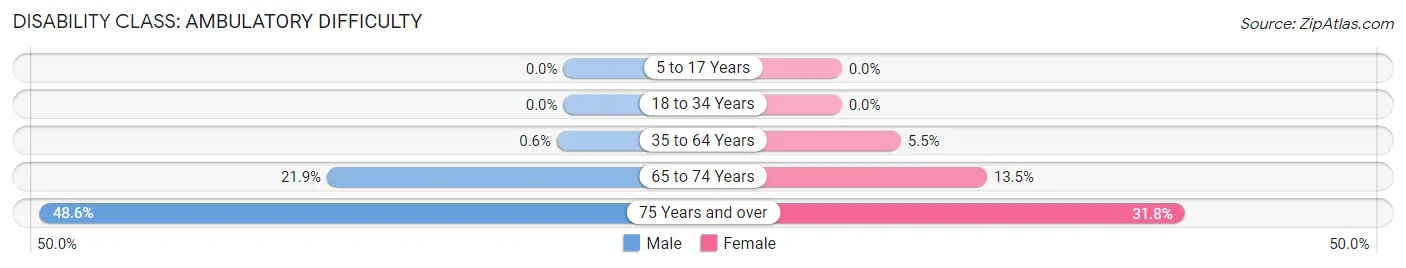
| Age Bracket | Male | Female |
| 5 to 17 Years | 0 (0.0%) | 0 (0.0%) |
| 18 to 34 Years | 0 (0.0%) | 0 (0.0%) |
| 35 to 64 Years | 6 (0.6%) | 56 (5.5%) |
| 65 to 74 Years | 34 (21.9%) | 21 (13.5%) |
| 75 Years and over | 34 (48.6%) | 76 (31.8%) |
Disability Class: Self-Care Difficulty
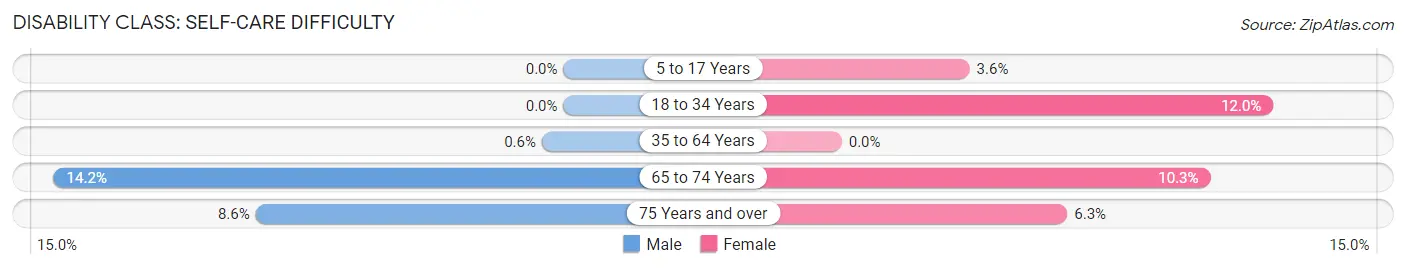
| Age Bracket | Male | Female |
| 5 to 17 Years | 0 (0.0%) | 11 (3.6%) |
| 18 to 34 Years | 0 (0.0%) | 40 (12.0%) |
| 35 to 64 Years | 6 (0.6%) | 0 (0.0%) |
| 65 to 74 Years | 22 (14.2%) | 16 (10.3%) |
| 75 Years and over | 6 (8.6%) | 15 (6.3%) |
Technology Access in Wanamassa
Computing Device Access in Wanamassa
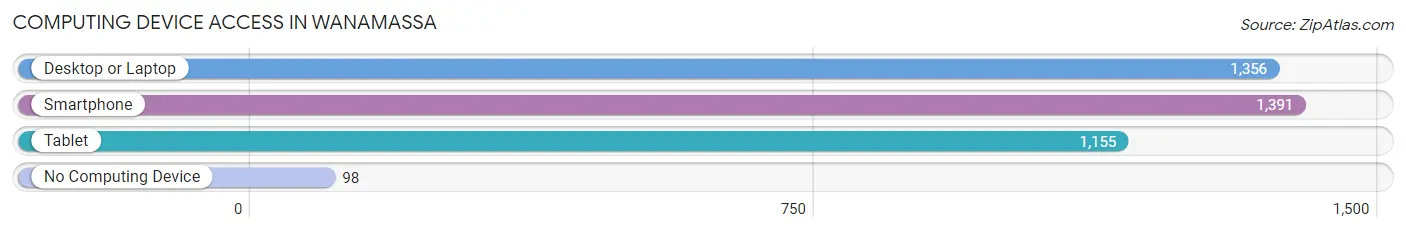
| Device Type | # Households | % Households |
| Desktop or Laptop | 1,356 | 88.3% |
| Smartphone | 1,391 | 90.6% |
| Tablet | 1,155 | 75.2% |
| No Computing Device | 98 | 6.4% |
| Total | 1,536 | 100.0% |
Internet Access in Wanamassa
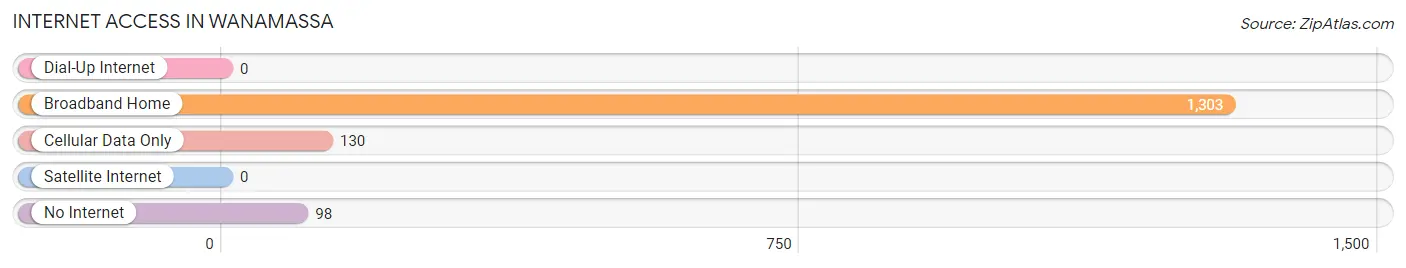
| Internet Type | # Households | % Households |
| Dial-Up Internet | 0 | 0.0% |
| Broadband Home | 1,303 | 84.8% |
| Cellular Data Only | 130 | 8.5% |
| Satellite Internet | 0 | 0.0% |
| No Internet | 98 | 6.4% |
| Total | 1,536 | 100.0% |
Wanamassa Summary
Introduction
Wanamassa is a small unincorporated community located in Ocean Township, Monmouth County, New Jersey. It is situated on the northern edge of the Jersey Shore, approximately 10 miles south of Asbury Park and 25 miles east of Trenton. The community is bordered by the towns of Ocean Township, Neptune Township, and Wall Township. The population of Wanamassa was estimated to be 4,845 in 2019.
History
The area now known as Wanamassa was originally inhabited by the Lenape Native Americans. The first European settlers arrived in the area in the late 17th century. The area was originally known as "Wanamassa Neck" and was part of Shrewsbury Township. In 1849, the area was split off from Shrewsbury Township and became part of Ocean Township.
The name "Wanamassa" is derived from the Lenape word "wanamassa" which means "place of good land". The area was originally a farming community and was known for its cranberry bogs. In the late 19th century, the area began to develop as a summer resort community. The area was home to several large hotels and resorts, including the Wanamassa Hotel, which was built in 1887 and was one of the largest hotels in the area.
Geography
Wanamassa is located at 40°10'25"N 74°04'17"W (40.173611, -74.071389). It is situated on the northern edge of the Jersey Shore, approximately 10 miles south of Asbury Park and 25 miles east of Trenton. The community is bordered by the towns of Ocean Township, Neptune Township, and Wall Township.
The area is mostly flat and is located on the coastal plain. The soil is mostly sandy and loamy. The area is located in a temperate climate zone and has an average annual temperature of 54°F. The average annual precipitation is 45 inches.
Economy
The economy of Wanamassa is largely based on tourism and retail. The area is home to several small businesses, including restaurants, bars, and shops. The area is also home to several large retail stores, including Walmart, Target, and Home Depot.
The area is also home to several large employers, including Monmouth Medical Center, Jersey Shore University Medical Center, and Monmouth University. The area is also home to several large corporations, including Verizon, AT&T, and Johnson & Johnson.
Demographics
The population of Wanamassa was estimated to be 4,845 in 2019. The population is largely white (90.2%) and the median age is 43. The median household income is $77,945 and the median home value is $346,400. The area is largely suburban and the majority of residents (77.3%) own their homes.
Conclusion
Wanamassa is a small unincorporated community located in Ocean Township, Monmouth County, New Jersey. It is situated on the northern edge of the Jersey Shore, approximately 10 miles south of Asbury Park and 25 miles east of Trenton. The population of Wanamassa was estimated to be 4,845 in 2019. The economy of Wanamassa is largely based on tourism and retail. The population is largely white (90.2%) and the median age is 43. The median household income is $77,945 and the median home value is $346,400. The area is largely suburban and the majority of residents (77.3%) own their homes.
Common Questions
What is Per Capita Income in Wanamassa?
Per Capita income in Wanamassa is $57,992.
What is the Median Family Income in Wanamassa?
Median Family Income in Wanamassa is $164,490.
What is the Median Household income in Wanamassa?
Median Household Income in Wanamassa is $162,954.
What is Income or Wage Gap in Wanamassa?
Income or Wage Gap in Wanamassa is 43.6%.
Women in Wanamassa earn 56.4 cents for every dollar earned by a man.
What is Inequality or Gini Index in Wanamassa?
Inequality or Gini Index in Wanamassa is 0.33.
What is the Total Population of Wanamassa?
Total Population of Wanamassa is 4,344.
What is the Total Male Population of Wanamassa?
Total Male Population of Wanamassa is 2,153.
What is the Total Female Population of Wanamassa?
Total Female Population of Wanamassa is 2,191.
What is the Ratio of Males per 100 Females in Wanamassa?
There are 98.27 Males per 100 Females in Wanamassa.
What is the Ratio of Females per 100 Males in Wanamassa?
There are 101.76 Females per 100 Males in Wanamassa.
What is the Median Population Age in Wanamassa?
Median Population Age in Wanamassa is 44.0 Years.
What is the Average Family Size in Wanamassa
Average Family Size in Wanamassa is 3.3 People.
What is the Average Household Size in Wanamassa
Average Household Size in Wanamassa is 2.8 People.
How Large is the Labor Force in Wanamassa?
There are 2,552 People in the Labor Forcein in Wanamassa.
What is the Percentage of People in the Labor Force in Wanamassa?
73.5% of People are in the Labor Force in Wanamassa.
What is the Unemployment Rate in Wanamassa?
Unemployment Rate in Wanamassa is 1.9%.