Point Pleasant Beach borough, NJ Map & Demographics
Point Pleasant Beach borough Overview
$71,222
PER CAPITA INCOME
$139,074
AVG FAMILY INCOME
$119,647
AVG HOUSEHOLD INCOME
28.4%
WAGE / INCOME GAP [ % ]
71.6¢/ $1
WAGE / INCOME GAP [ $ ]
0.48
INEQUALITY / GINI INDEX
4,786
TOTAL POPULATION
2,505
MALE POPULATION
2,281
FEMALE POPULATION
109.82
MALES / 100 FEMALES
91.06
FEMALES / 100 MALES
47.9
MEDIAN AGE
2.8
AVG FAMILY SIZE
2.5
AVG HOUSEHOLD SIZE
2,789
LABOR FORCE [ PEOPLE ]
65.2%
PERCENT IN LABOR FORCE
8.5%
UNEMPLOYMENT RATE
Income in Point Pleasant Beach borough
Income Overview in Point Pleasant Beach borough
Per Capita Income in Point Pleasant Beach borough is $71,222, while median incomes of families and households are $139,074 and $119,647 respectively.
| Characteristic | Number | Measure |
| Per Capita Income | 4,786 | $71,222 |
| Median Family Income | 1,246 | $139,074 |
| Mean Family Income | 1,246 | $206,354 |
| Median Household Income | 1,903 | $119,647 |
| Mean Household Income | 1,903 | $176,240 |
| Income Deficit | 1,246 | $0 |
| Wage / Income Gap (%) | 4,786 | 28.44% |
| Wage / Income Gap ($) | 4,786 | 71.56¢ per $1 |
| Gini / Inequality Index | 4,786 | 0.48 |
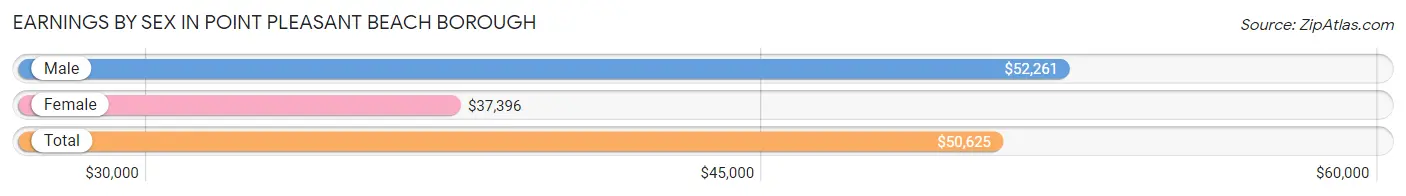
Earnings by Sex in Point Pleasant Beach borough
Average Earnings in Point Pleasant Beach borough are $50,625, $52,261 for men and $37,396 for women, a difference of 28.4%.
| Sex | Number | Average Earnings |
| Male | 1,591 (55.9%) | $52,261 |
| Female | 1,254 (44.1%) | $37,396 |
| Total | 2,845 (100.0%) | $50,625 |
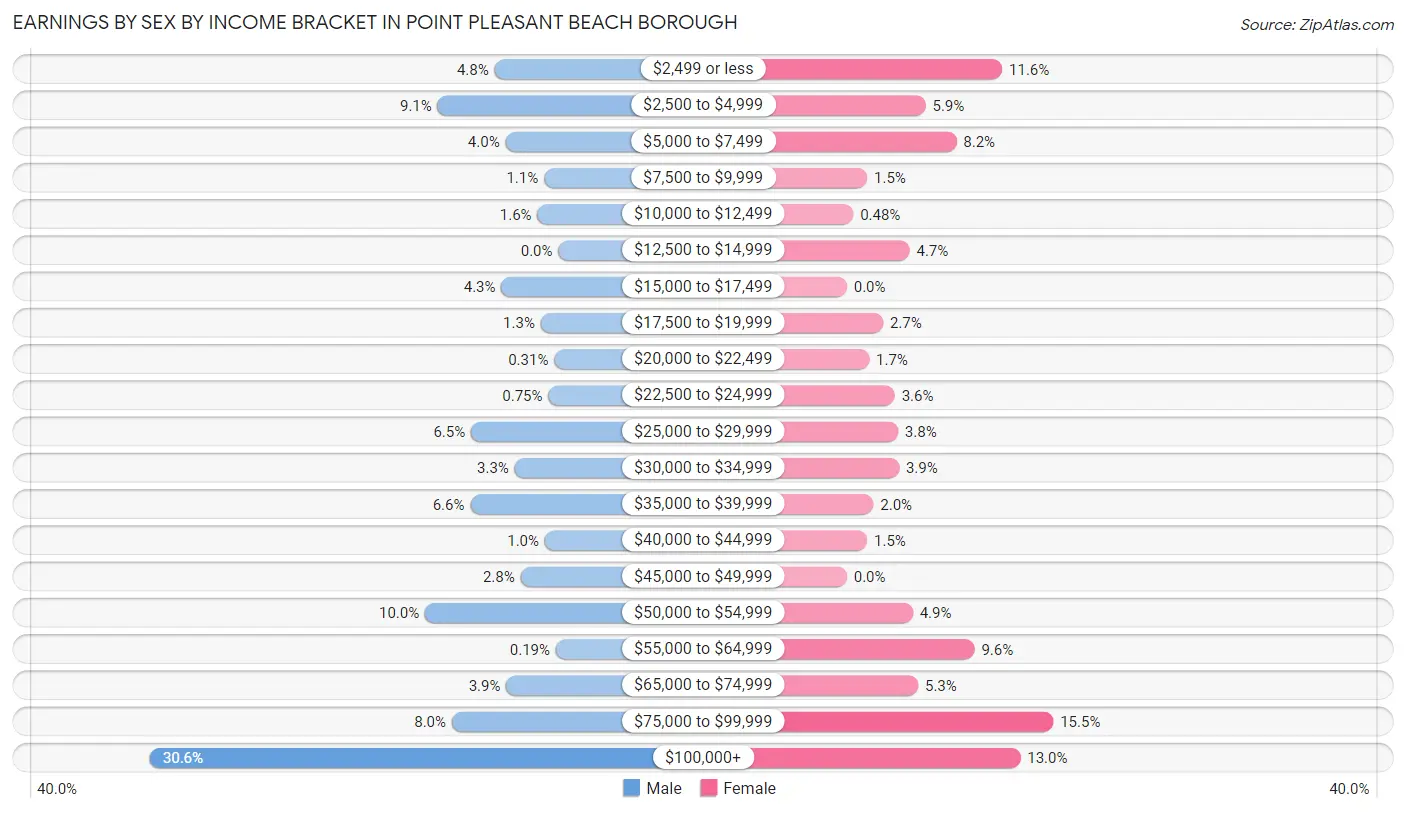
Earnings by Sex by Income Bracket in Point Pleasant Beach borough
The most common earnings brackets in Point Pleasant Beach borough are $100,000+ for men (487 | 30.6%) and $75,000 to $99,999 for women (194 | 15.5%).
| Income | Male | Female |
| $2,499 or less | 76 (4.8%) | 146 (11.6%) |
| $2,500 to $4,999 | 144 (9.0%) | 74 (5.9%) |
| $5,000 to $7,499 | 63 (4.0%) | 103 (8.2%) |
| $7,500 to $9,999 | 17 (1.1%) | 19 (1.5%) |
| $10,000 to $12,499 | 25 (1.6%) | 6 (0.5%) |
| $12,500 to $14,999 | 0 (0.0%) | 59 (4.7%) |
| $15,000 to $17,499 | 68 (4.3%) | 0 (0.0%) |
| $17,500 to $19,999 | 21 (1.3%) | 34 (2.7%) |
| $20,000 to $22,499 | 5 (0.3%) | 21 (1.7%) |
| $22,500 to $24,999 | 12 (0.7%) | 45 (3.6%) |
| $25,000 to $29,999 | 104 (6.5%) | 48 (3.8%) |
| $30,000 to $34,999 | 52 (3.3%) | 49 (3.9%) |
| $35,000 to $39,999 | 105 (6.6%) | 25 (2.0%) |
| $40,000 to $44,999 | 16 (1.0%) | 19 (1.5%) |
| $45,000 to $49,999 | 45 (2.8%) | 0 (0.0%) |
| $50,000 to $54,999 | 159 (10.0%) | 62 (4.9%) |
| $55,000 to $64,999 | 3 (0.2%) | 120 (9.6%) |
| $65,000 to $74,999 | 62 (3.9%) | 67 (5.3%) |
| $75,000 to $99,999 | 127 (8.0%) | 194 (15.5%) |
| $100,000+ | 487 (30.6%) | 163 (13.0%) |
| Total | 1,591 (100.0%) | 1,254 (100.0%) |
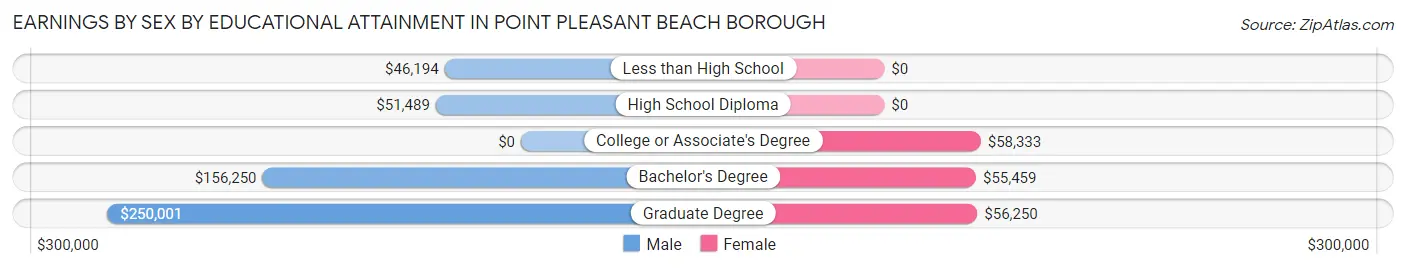
Earnings by Sex by Educational Attainment in Point Pleasant Beach borough
Average earnings in Point Pleasant Beach borough are $83,986 for men and $55,541 for women, a difference of 33.9%. Men with an educational attainment of graduate degree enjoy the highest average annual earnings of $250,001, while those with less than high school education earn the least with $46,194. Women with an educational attainment of college or associate's degree earn the most with the average annual earnings of $58,333, while those with bachelor's degree education have the smallest earnings of $55,459.
| Educational Attainment | Male Income | Female Income |
| Less than High School | $46,194 | $0 |
| High School Diploma | $51,489 | $0 |
| College or Associate's Degree | - | - |
| Bachelor's Degree | $156,250 | $55,459 |
| Graduate Degree | $250,001 | $56,250 |
| Total | $83,986 | $55,541 |
Family Income in Point Pleasant Beach borough
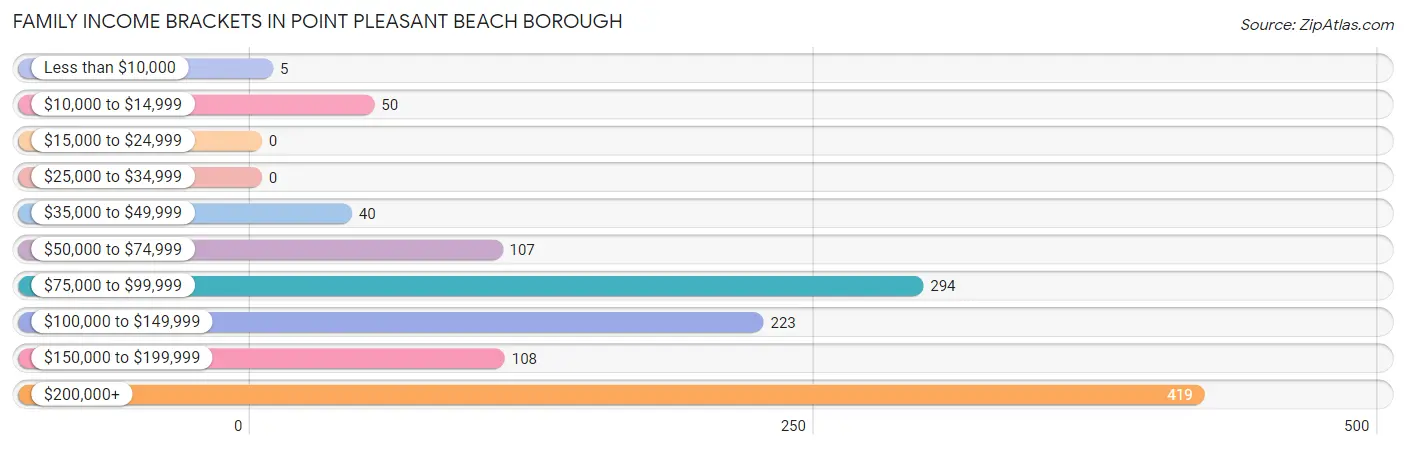
Family Income Brackets in Point Pleasant Beach borough
According to the Point Pleasant Beach borough family income data, there are 419 families falling into the $200,000+ income range, which is the most common income bracket and makes up 33.6% of all families.
| Income Bracket | # Families | % Families |
| Less than $10,000 | 5 | 0.4% |
| $10,000 to $14,999 | 50 | 4.0% |
| $15,000 to $24,999 | 0 | 0.0% |
| $25,000 to $34,999 | 0 | 0.0% |
| $35,000 to $49,999 | 40 | 3.2% |
| $50,000 to $74,999 | 107 | 8.6% |
| $75,000 to $99,999 | 294 | 23.6% |
| $100,000 to $149,999 | 223 | 17.9% |
| $150,000 to $199,999 | 108 | 8.7% |
| $200,000+ | 419 | 33.6% |
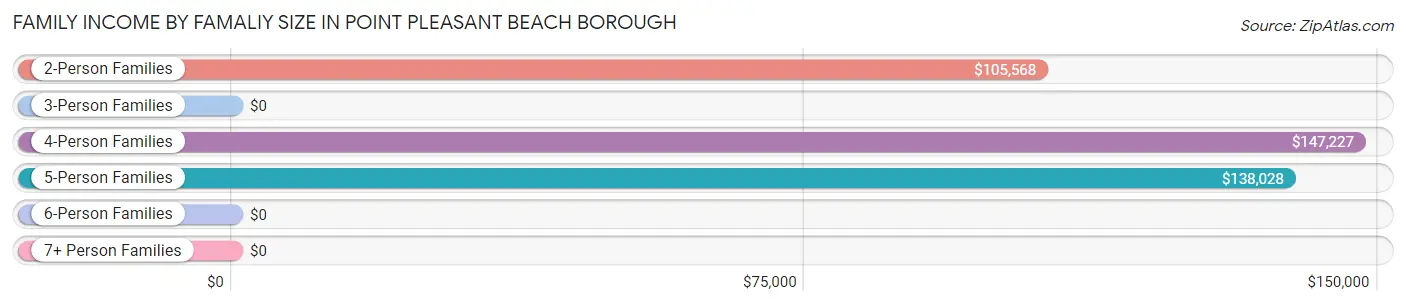
Family Income by Famaliy Size in Point Pleasant Beach borough
4-person families (202 | 16.2%) account for the highest median family income in Point Pleasant Beach borough with $147,227 per family, while 2-person families (645 | 51.8%) have the highest median income of $52,784 per family member.
| Income Bracket | # Families | Median Income |
| 2-Person Families | 645 (51.8%) | $105,568 |
| 3-Person Families | 314 (25.2%) | $0 |
| 4-Person Families | 202 (16.2%) | $147,227 |
| 5-Person Families | 75 (6.0%) | $138,028 |
| 6-Person Families | 10 (0.8%) | $0 |
| 7+ Person Families | 0 (0.0%) | $0 |
| Total | 1,246 (100.0%) | $139,074 |
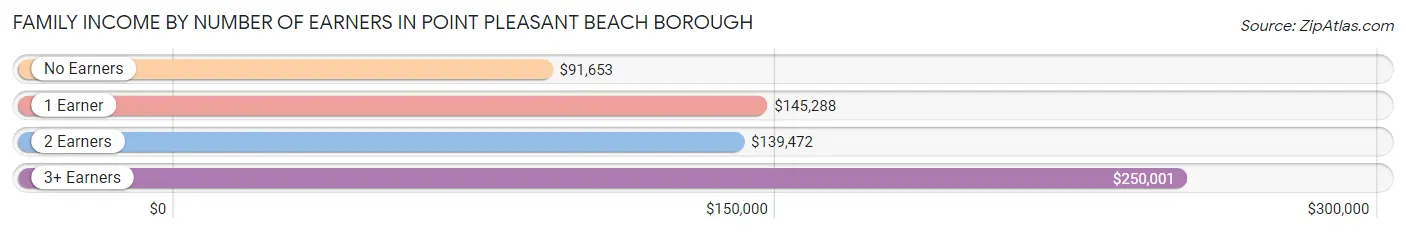
Family Income by Number of Earners in Point Pleasant Beach borough
The median family income in Point Pleasant Beach borough is $139,074, with families comprising 3+ earners (200) having the highest median family income of $250,001, while families with no earners (304) have the lowest median family income of $91,653, accounting for 16.1% and 24.4% of families, respectively.
| Number of Earners | # Families | Median Income |
| No Earners | 304 (24.4%) | $91,653 |
| 1 Earner | 309 (24.8%) | $145,288 |
| 2 Earners | 433 (34.7%) | $139,472 |
| 3+ Earners | 200 (16.1%) | $250,001 |
| Total | 1,246 (100.0%) | $139,074 |
Household Income in Point Pleasant Beach borough
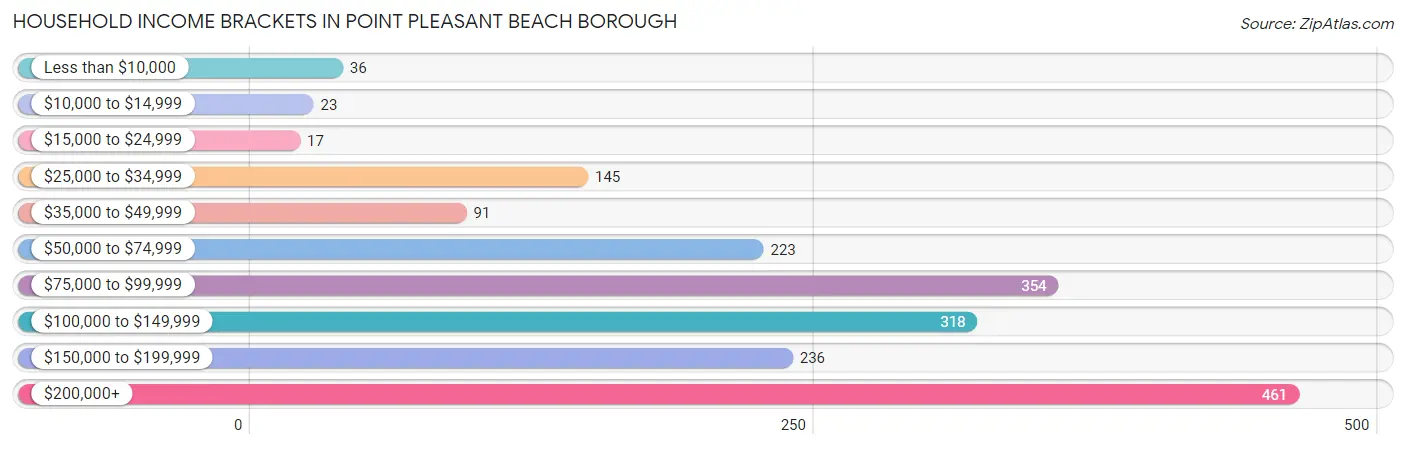
Household Income Brackets in Point Pleasant Beach borough
With 461 households falling in the category, the $200,000+ income range is the most frequent in Point Pleasant Beach borough, accounting for 24.2% of all households. In contrast, only 17 households (0.9%) fall into the $15,000 to $24,999 income bracket, making it the least populous group.
| Income Bracket | # Households | % Households |
| Less than $10,000 | 36 | 1.9% |
| $10,000 to $14,999 | 23 | 1.2% |
| $15,000 to $24,999 | 17 | 0.9% |
| $25,000 to $34,999 | 145 | 7.6% |
| $35,000 to $49,999 | 91 | 4.8% |
| $50,000 to $74,999 | 223 | 11.7% |
| $75,000 to $99,999 | 354 | 18.6% |
| $100,000 to $149,999 | 318 | 16.7% |
| $150,000 to $199,999 | 236 | 12.4% |
| $200,000+ | 461 | 24.2% |
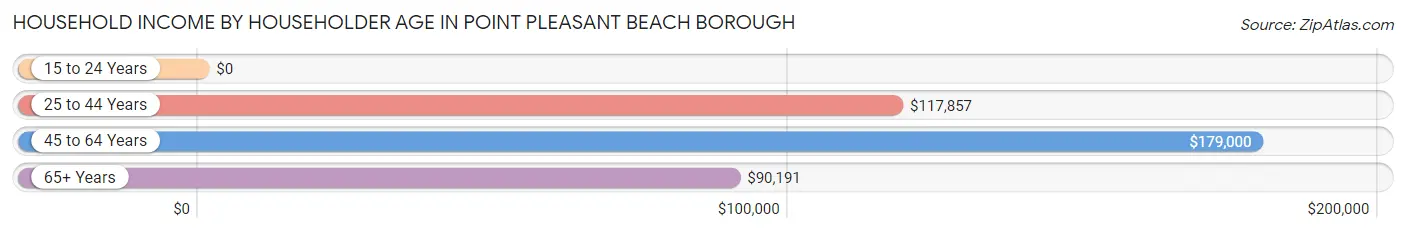
Household Income by Householder Age in Point Pleasant Beach borough
The median household income in Point Pleasant Beach borough is $119,647, with the highest median household income of $179,000 found in the 45 to 64 years age bracket for the primary householder. A total of 744 households (39.1%) fall into this category. Meanwhile, the 15 to 24 years age bracket for the primary householder has the lowest median household income of $0, with 109 households (5.7%) in this group.
| Income Bracket | # Households | Median Income |
| 15 to 24 Years | 109 (5.7%) | $0 |
| 25 to 44 Years | 340 (17.9%) | $117,857 |
| 45 to 64 Years | 744 (39.1%) | $179,000 |
| 65+ Years | 710 (37.3%) | $90,191 |
| Total | 1,903 (100.0%) | $119,647 |
Poverty in Point Pleasant Beach borough
Income Below Poverty by Sex and Age in Point Pleasant Beach borough
With 7.4% poverty level for males and 15.9% for females among the residents of Point Pleasant Beach borough, 18 to 24 year old males and 18 to 24 year old females are the most vulnerable to poverty, with 102 males (29.1%) and 193 females (66.3%) in their respective age groups living below the poverty level.
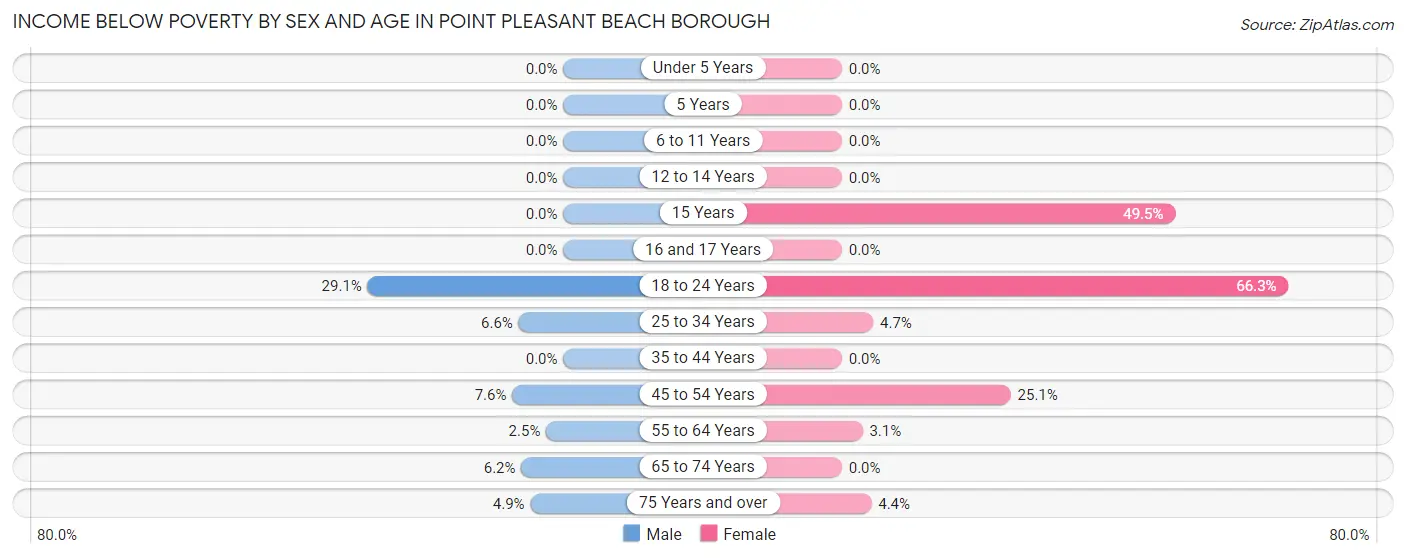
| Age Bracket | Male | Female |
| Under 5 Years | 0 (0.0%) | 0 (0.0%) |
| 5 Years | 0 (0.0%) | 0 (0.0%) |
| 6 to 11 Years | 0 (0.0%) | 0 (0.0%) |
| 12 to 14 Years | 0 (0.0%) | 0 (0.0%) |
| 15 Years | 0 (0.0%) | 52 (49.5%) |
| 16 and 17 Years | 0 (0.0%) | 0 (0.0%) |
| 18 to 24 Years | 102 (29.1%) | 193 (66.3%) |
| 25 to 34 Years | 12 (6.6%) | 8 (4.6%) |
| 35 to 44 Years | 0 (0.0%) | 0 (0.0%) |
| 45 to 54 Years | 30 (7.6%) | 85 (25.1%) |
| 55 to 64 Years | 10 (2.5%) | 11 (3.1%) |
| 65 to 74 Years | 18 (6.2%) | 0 (0.0%) |
| 75 Years and over | 13 (4.9%) | 13 (4.4%) |
| Total | 185 (7.4%) | 362 (15.9%) |
Income Above Poverty by Sex and Age in Point Pleasant Beach borough
According to the poverty statistics in Point Pleasant Beach borough, males aged under 5 years and females aged under 5 years are the age groups that are most secure financially, with 100.0% of males and 100.0% of females in these age groups living above the poverty line.
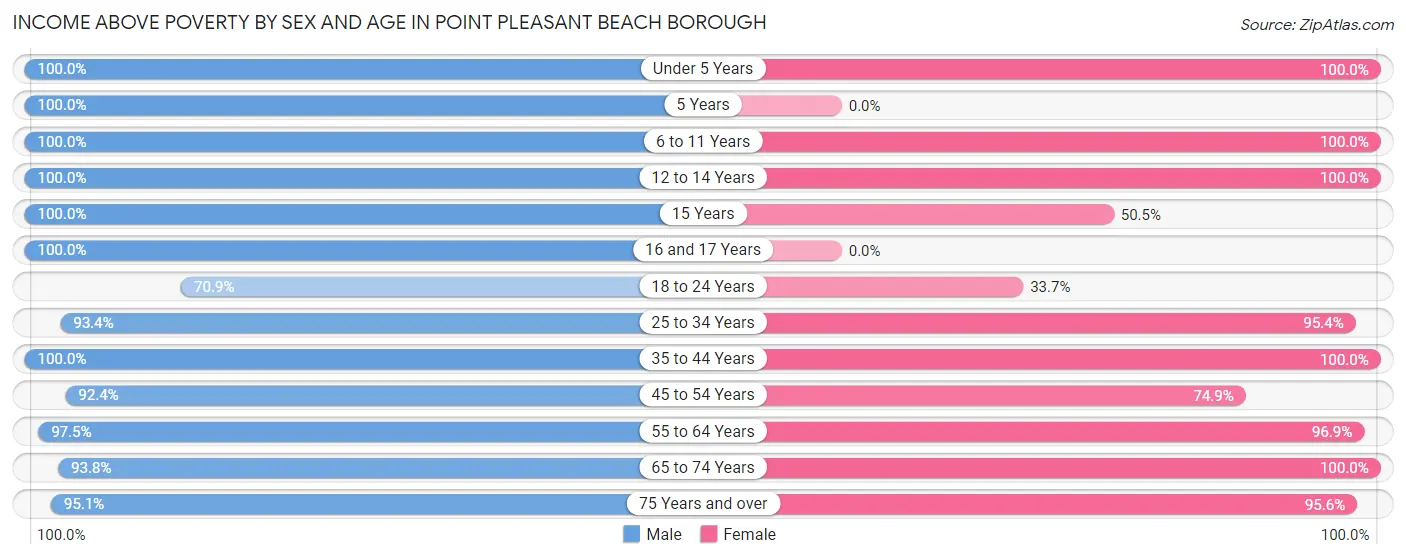
| Age Bracket | Male | Female |
| Under 5 Years | 41 (100.0%) | 64 (100.0%) |
| 5 Years | 7 (100.0%) | 0 (0.0%) |
| 6 to 11 Years | 64 (100.0%) | 79 (100.0%) |
| 12 to 14 Years | 71 (100.0%) | 55 (100.0%) |
| 15 Years | 23 (100.0%) | 53 (50.5%) |
| 16 and 17 Years | 154 (100.0%) | 0 (0.0%) |
| 18 to 24 Years | 249 (70.9%) | 98 (33.7%) |
| 25 to 34 Years | 169 (93.4%) | 164 (95.4%) |
| 35 to 44 Years | 261 (100.0%) | 236 (100.0%) |
| 45 to 54 Years | 366 (92.4%) | 254 (74.9%) |
| 55 to 64 Years | 384 (97.5%) | 347 (96.9%) |
| 65 to 74 Years | 271 (93.8%) | 282 (100.0%) |
| 75 Years and over | 253 (95.1%) | 284 (95.6%) |
| Total | 2,313 (92.6%) | 1,916 (84.1%) |
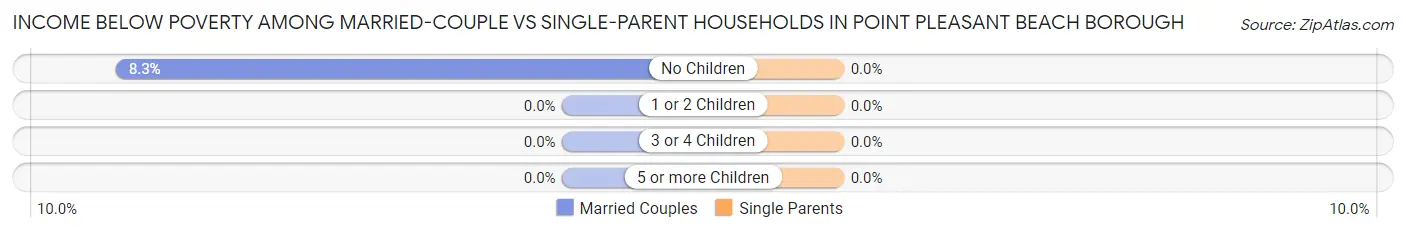
Income Below Poverty Among Married-Couple Families in Point Pleasant Beach borough
The poverty statistics for married-couple families in Point Pleasant Beach borough show that 5.6% or 55 of the total 986 families live below the poverty line. Families with no children have the highest poverty rate of 8.3%, comprising of 55 families. On the other hand, families with 1 or 2 children have the lowest poverty rate of 0.0%, which includes 0 families.
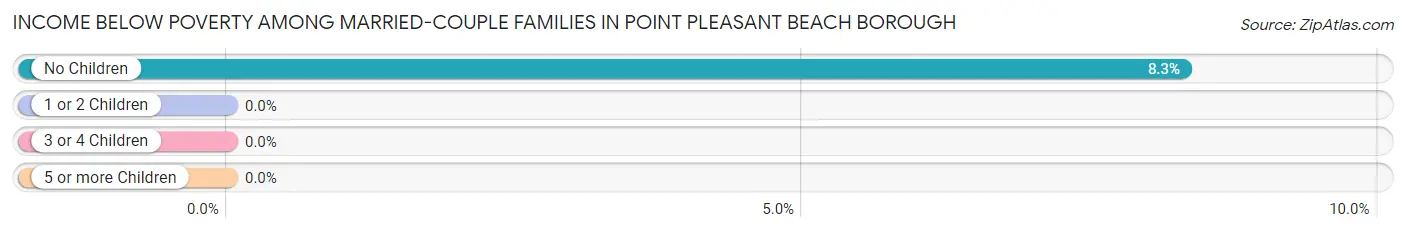
| Children | Above Poverty | Below Poverty |
| No Children | 608 (91.7%) | 55 (8.3%) |
| 1 or 2 Children | 287 (100.0%) | 0 (0.0%) |
| 3 or 4 Children | 36 (100.0%) | 0 (0.0%) |
| 5 or more Children | 0 (0.0%) | 0 (0.0%) |
| Total | 931 (94.4%) | 55 (5.6%) |
Income Below Poverty Among Single-Parent Households in Point Pleasant Beach borough
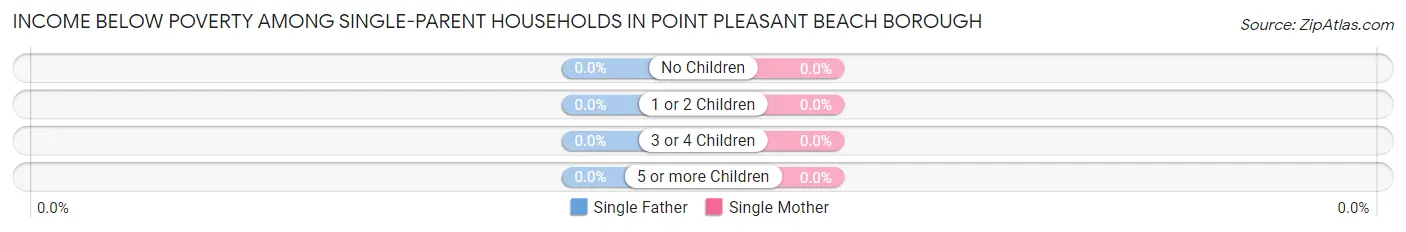
| Children | Single Father | Single Mother |
| No Children | 0 (0.0%) | 0 (0.0%) |
| 1 or 2 Children | 0 (0.0%) | 0 (0.0%) |
| 3 or 4 Children | 0 (0.0%) | 0 (0.0%) |
| 5 or more Children | 0 (0.0%) | 0 (0.0%) |
| Total | 0 (0.0%) | 0 (0.0%) |
Income Below Poverty Among Married-Couple vs Single-Parent Households in Point Pleasant Beach borough
| Children | Married-Couple Families | Single-Parent Households |
| No Children | 55 (8.3%) | 0 (0.0%) |
| 1 or 2 Children | 0 (0.0%) | 0 (0.0%) |
| 3 or 4 Children | 0 (0.0%) | 0 (0.0%) |
| 5 or more Children | 0 (0.0%) | 0 (0.0%) |
| Total | 55 (5.6%) | 0 (0.0%) |
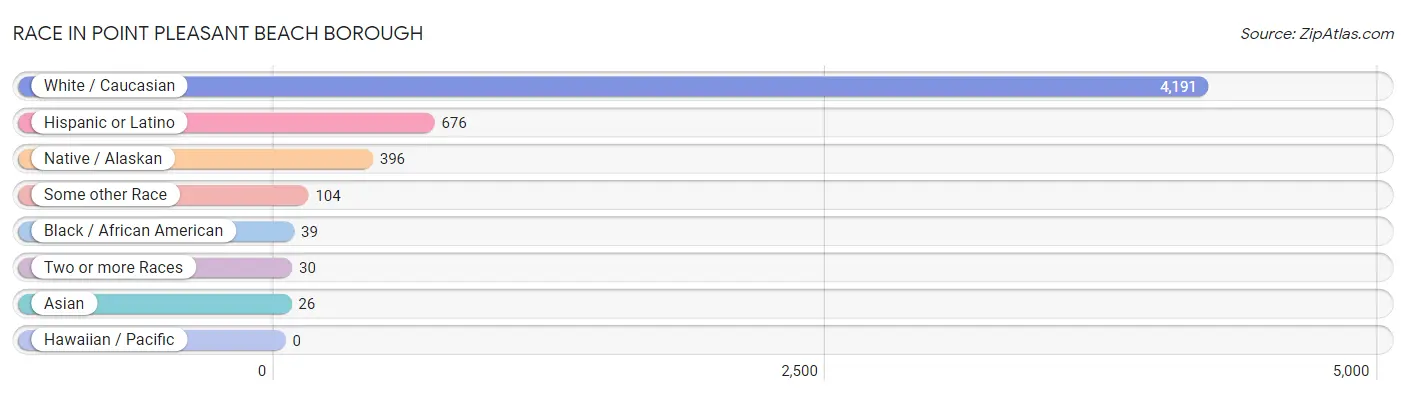
Race in Point Pleasant Beach borough
The most populous races in Point Pleasant Beach borough are White / Caucasian (4,191 | 87.6%), Hispanic or Latino (676 | 14.1%), and Native / Alaskan (396 | 8.3%).
| Race | # Population | % Population |
| Asian | 26 | 0.5% |
| Black / African American | 39 | 0.8% |
| Hawaiian / Pacific | 0 | 0.0% |
| Hispanic or Latino | 676 | 14.1% |
| Native / Alaskan | 396 | 8.3% |
| White / Caucasian | 4,191 | 87.6% |
| Two or more Races | 30 | 0.6% |
| Some other Race | 104 | 2.2% |
| Total | 4,786 | 100.0% |
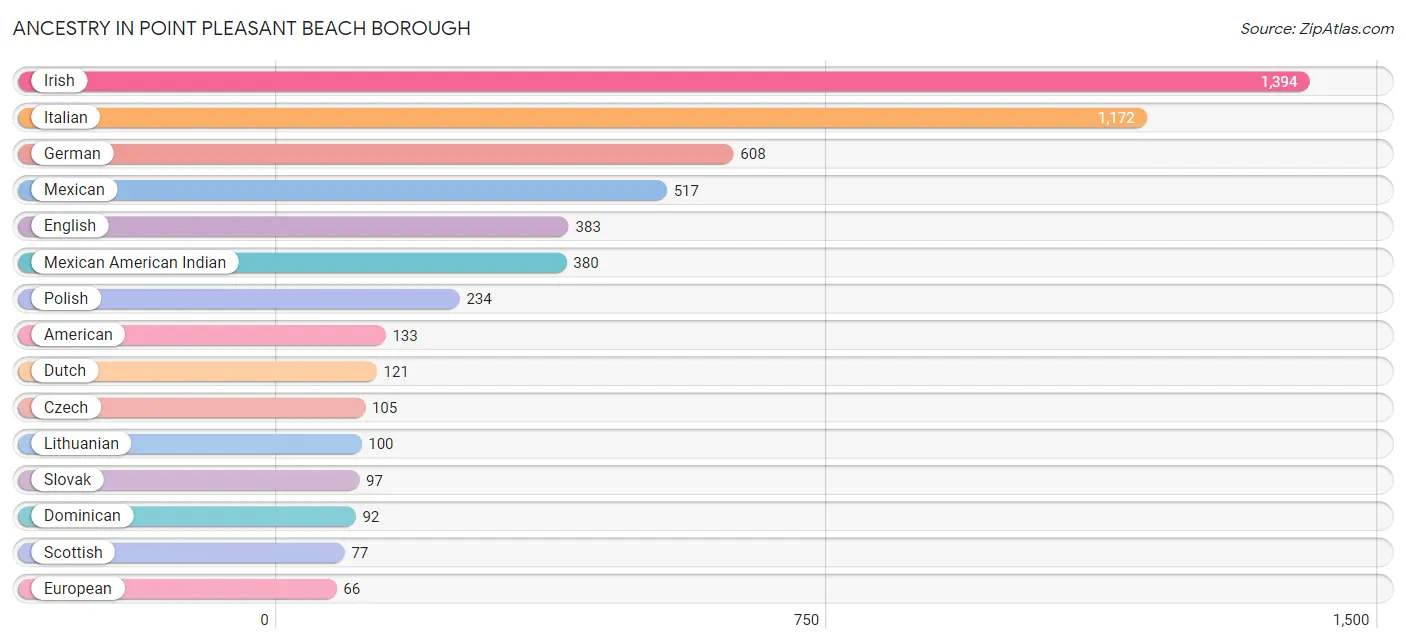
Ancestry in Point Pleasant Beach borough
The most populous ancestries reported in Point Pleasant Beach borough are Irish (1,394 | 29.1%), Italian (1,172 | 24.5%), German (608 | 12.7%), Mexican (517 | 10.8%), and English (383 | 8.0%), together accounting for 85.1% of all Point Pleasant Beach borough residents.
| Ancestry | # Population | % Population |
| American | 133 | 2.8% |
| Arab | 15 | 0.3% |
| Austrian | 61 | 1.3% |
| British | 44 | 0.9% |
| Canadian | 42 | 0.9% |
| Cherokee | 16 | 0.3% |
| Colombian | 8 | 0.2% |
| Czech | 105 | 2.2% |
| Dominican | 92 | 1.9% |
| Dutch | 121 | 2.5% |
| Eastern European | 4 | 0.1% |
| English | 383 | 8.0% |
| European | 66 | 1.4% |
| French | 2 | 0.0% |
| French Canadian | 36 | 0.7% |
| German | 608 | 12.7% |
| Hungarian | 47 | 1.0% |
| Irish | 1,394 | 29.1% |
| Israeli | 4 | 0.1% |
| Italian | 1,172 | 24.5% |
| Korean | 6 | 0.1% |
| Lithuanian | 100 | 2.1% |
| Mexican | 517 | 10.8% |
| Mexican American Indian | 380 | 7.9% |
| Norwegian | 11 | 0.2% |
| Polish | 234 | 4.9% |
| Puerto Rican | 46 | 1.0% |
| Russian | 27 | 0.6% |
| Scotch-Irish | 17 | 0.4% |
| Scottish | 77 | 1.6% |
| Slovak | 97 | 2.0% |
| South American | 8 | 0.2% |
| Swedish | 26 | 0.5% |
| Swiss | 59 | 1.2% |
| Thai | 20 | 0.4% |
| Ukrainian | 16 | 0.3% |
| Yugoslavian | 1 | 0.0% | View All 37 Rows |
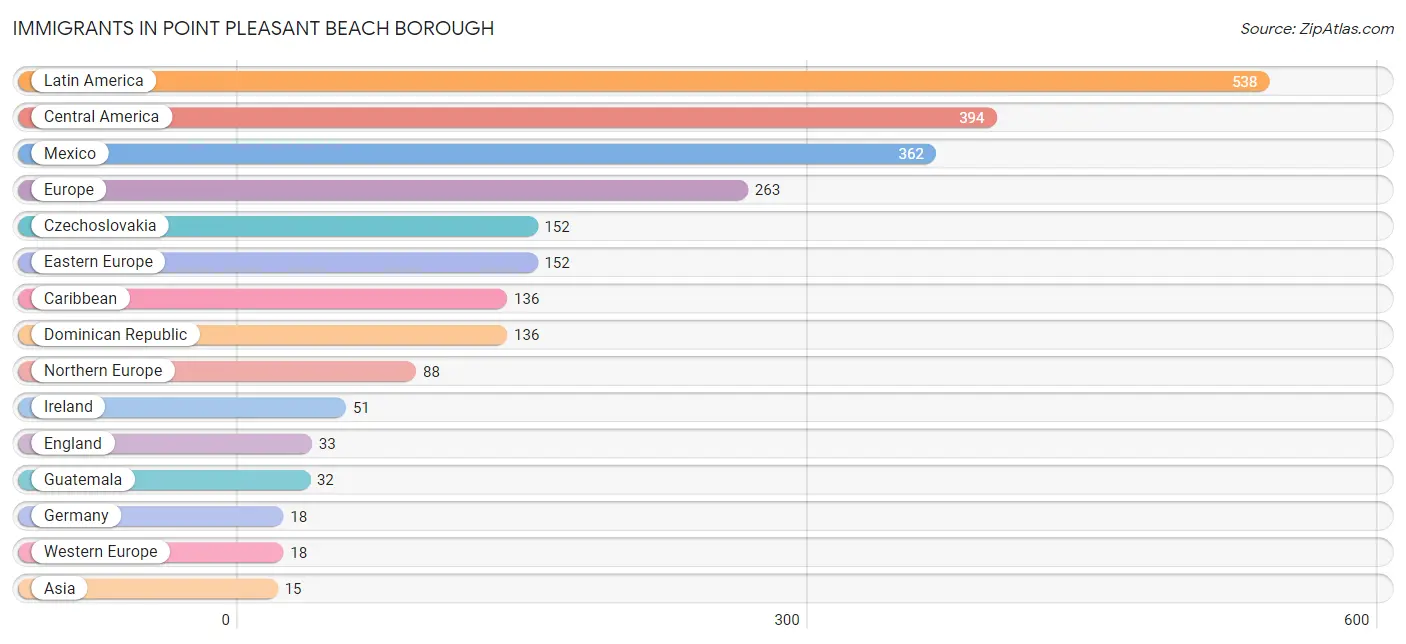
Immigrants in Point Pleasant Beach borough
The most numerous immigrant groups reported in Point Pleasant Beach borough came from Latin America (538 | 11.2%), Central America (394 | 8.2%), Mexico (362 | 7.6%), Europe (263 | 5.5%), and Czechoslovakia (152 | 3.2%), together accounting for 35.7% of all Point Pleasant Beach borough residents.
| Immigration Origin | # Population | % Population |
| Africa | 4 | 0.1% |
| Asia | 15 | 0.3% |
| Caribbean | 136 | 2.8% |
| Central America | 394 | 8.2% |
| Colombia | 7 | 0.2% |
| Czechoslovakia | 152 | 3.2% |
| Dominican Republic | 136 | 2.8% |
| Eastern Europe | 152 | 3.2% |
| England | 33 | 0.7% |
| Europe | 263 | 5.5% |
| Germany | 18 | 0.4% |
| Guatemala | 32 | 0.7% |
| Guyana | 1 | 0.0% |
| India | 9 | 0.2% |
| Ireland | 51 | 1.1% |
| Italy | 5 | 0.1% |
| Latin America | 538 | 11.2% |
| Mexico | 362 | 7.6% |
| Northern Europe | 88 | 1.8% |
| Philippines | 6 | 0.1% |
| South Africa | 4 | 0.1% |
| South America | 8 | 0.2% |
| South Central Asia | 9 | 0.2% |
| South Eastern Asia | 6 | 0.1% |
| Southern Europe | 5 | 0.1% |
| Western Europe | 18 | 0.4% | View All 26 Rows |
Sex and Age in Point Pleasant Beach borough
Sex and Age in Point Pleasant Beach borough
The most populous age groups in Point Pleasant Beach borough are 20 to 24 Years (291 | 11.6%) for men and 20 to 24 Years (277 | 12.1%) for women.
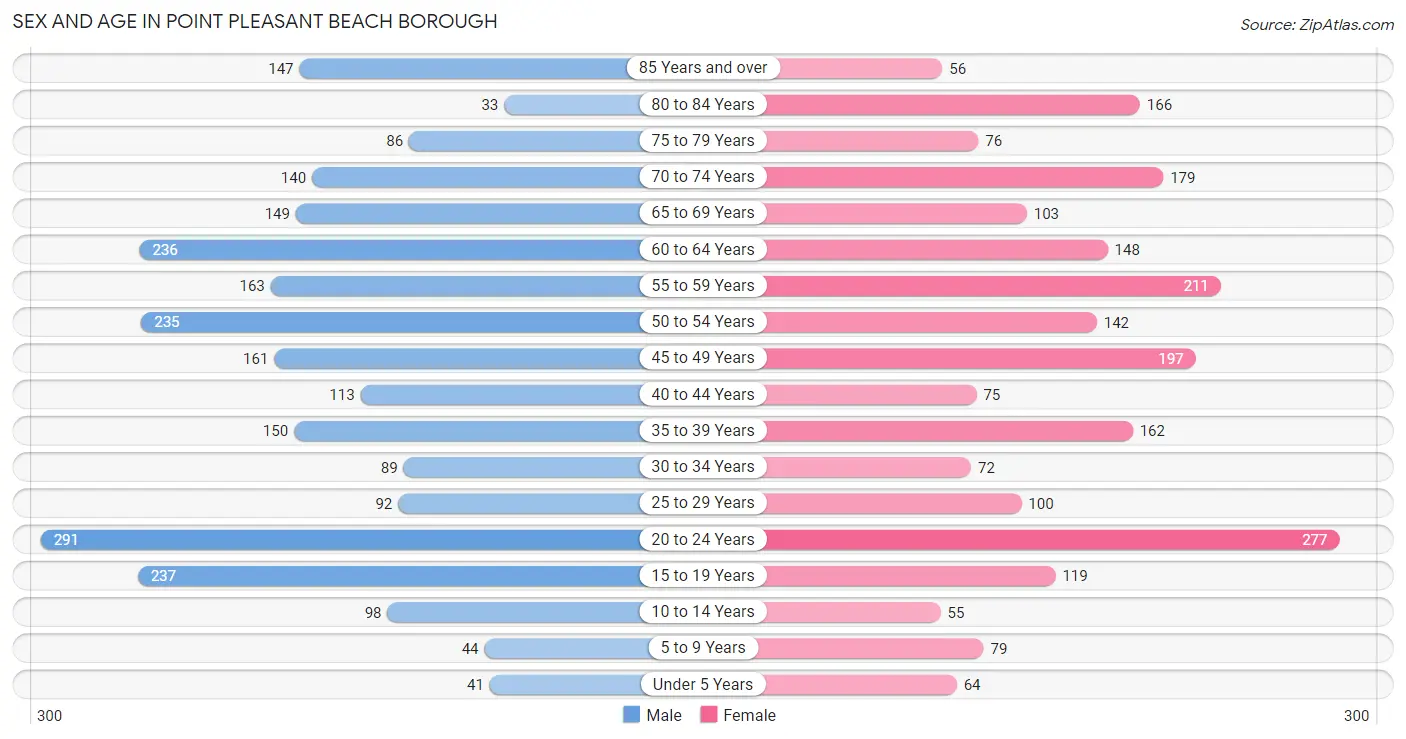
| Age Bracket | Male | Female |
| Under 5 Years | 41 (1.6%) | 64 (2.8%) |
| 5 to 9 Years | 44 (1.8%) | 79 (3.5%) |
| 10 to 14 Years | 98 (3.9%) | 55 (2.4%) |
| 15 to 19 Years | 237 (9.5%) | 119 (5.2%) |
| 20 to 24 Years | 291 (11.6%) | 277 (12.1%) |
| 25 to 29 Years | 92 (3.7%) | 100 (4.4%) |
| 30 to 34 Years | 89 (3.5%) | 72 (3.2%) |
| 35 to 39 Years | 150 (6.0%) | 162 (7.1%) |
| 40 to 44 Years | 113 (4.5%) | 75 (3.3%) |
| 45 to 49 Years | 161 (6.4%) | 197 (8.6%) |
| 50 to 54 Years | 235 (9.4%) | 142 (6.2%) |
| 55 to 59 Years | 163 (6.5%) | 211 (9.2%) |
| 60 to 64 Years | 236 (9.4%) | 148 (6.5%) |
| 65 to 69 Years | 149 (5.9%) | 103 (4.5%) |
| 70 to 74 Years | 140 (5.6%) | 179 (7.9%) |
| 75 to 79 Years | 86 (3.4%) | 76 (3.3%) |
| 80 to 84 Years | 33 (1.3%) | 166 (7.3%) |
| 85 Years and over | 147 (5.9%) | 56 (2.5%) |
| Total | 2,505 (100.0%) | 2,281 (100.0%) |
Families and Households in Point Pleasant Beach borough
Median Family Size in Point Pleasant Beach borough
The median family size in Point Pleasant Beach borough is 2.77 persons per family, with married-couple families (986 | 79.1%) accounting for the largest median family size of 2.86 persons per family. On the other hand, single male/father families (103 | 8.3%) represent the smallest median family size with 2.06 persons per family.
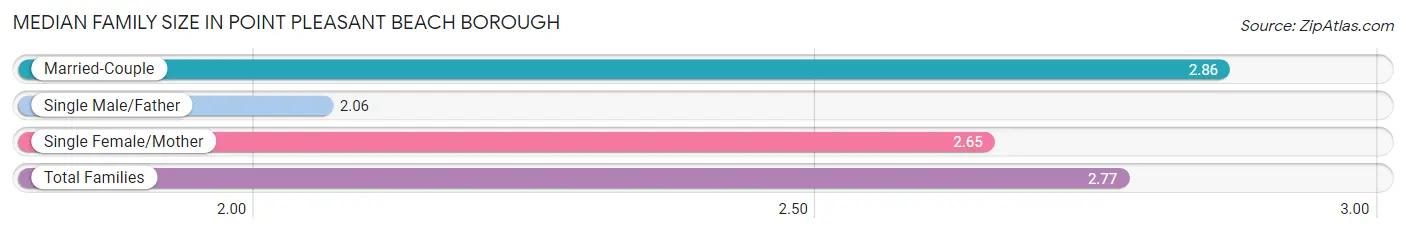
| Family Type | # Families | Family Size |
| Married-Couple | 986 (79.1%) | 2.86 |
| Single Male/Father | 103 (8.3%) | 2.06 |
| Single Female/Mother | 157 (12.6%) | 2.65 |
| Total Families | 1,246 (100.0%) | 2.77 |
Median Household Size in Point Pleasant Beach borough
The median household size in Point Pleasant Beach borough is 2.47 persons per household, with married-couple households (986 | 51.8%) accounting for the largest median household size of 3.07 persons per household. non-family households (657 | 34.5%) represent the smallest median household size with 1.43 persons per household.
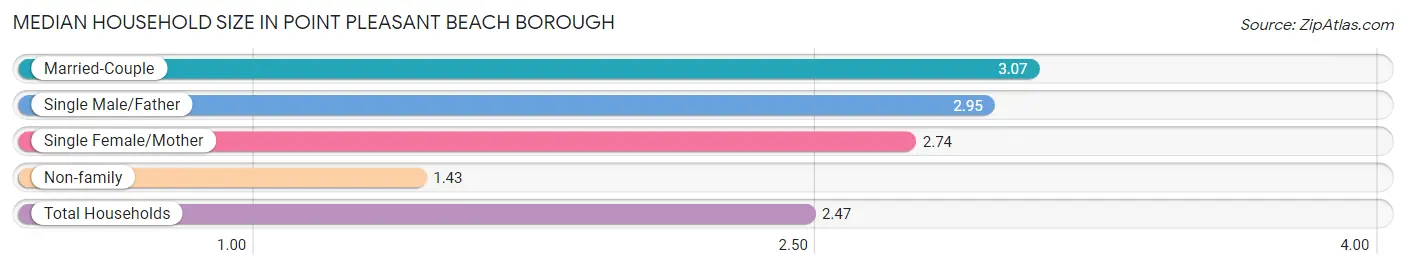
| Household Type | # Households | Household Size |
| Married-Couple | 986 (51.8%) | 3.07 |
| Single Male/Father | 103 (5.4%) | 2.95 |
| Single Female/Mother | 157 (8.3%) | 2.74 |
| Non-family | 657 (34.5%) | 1.43 |
| Total Households | 1,903 (100.0%) | 2.47 |
Household Size by Marriage Status in Point Pleasant Beach borough
Out of a total of 1,903 households in Point Pleasant Beach borough, 1,246 (65.5%) are family households, while 657 (34.5%) are nonfamily households. The most numerous type of family households are 2-person households, comprising 528, and the most common type of nonfamily households are 1-person households, comprising 458.
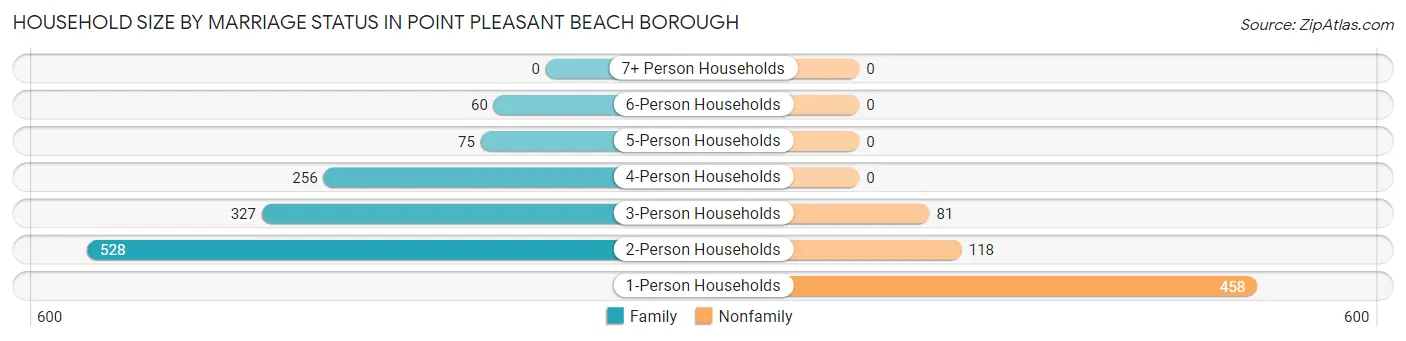
| Household Size | Family Households | Nonfamily Households |
| 1-Person Households | - | 458 (24.1%) |
| 2-Person Households | 528 (27.8%) | 118 (6.2%) |
| 3-Person Households | 327 (17.2%) | 81 (4.3%) |
| 4-Person Households | 256 (13.5%) | 0 (0.0%) |
| 5-Person Households | 75 (3.9%) | 0 (0.0%) |
| 6-Person Households | 60 (3.2%) | 0 (0.0%) |
| 7+ Person Households | 0 (0.0%) | 0 (0.0%) |
| Total | 1,246 (65.5%) | 657 (34.5%) |
Female Fertility in Point Pleasant Beach borough
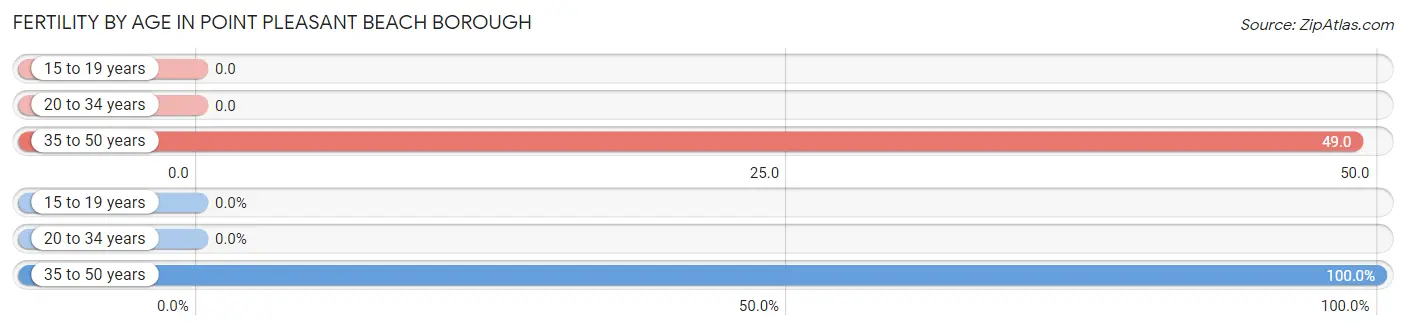
Fertility by Age in Point Pleasant Beach borough
Average fertility rate in Point Pleasant Beach borough is 22.0 births per 1,000 women. Women in the age bracket of 35 to 50 years have the highest fertility rate with 49.0 births per 1,000 women. Women in the age bracket of 35 to 50 years acount for 100.0% of all women with births.
| Age Bracket | Women with Births | Births / 1,000 Women |
| 15 to 19 years | 0 (0.0%) | 0.0 |
| 20 to 34 years | 0 (0.0%) | 0.0 |
| 35 to 50 years | 23 (100.0%) | 49.0 |
| Total | 23 (100.0%) | 22.0 |
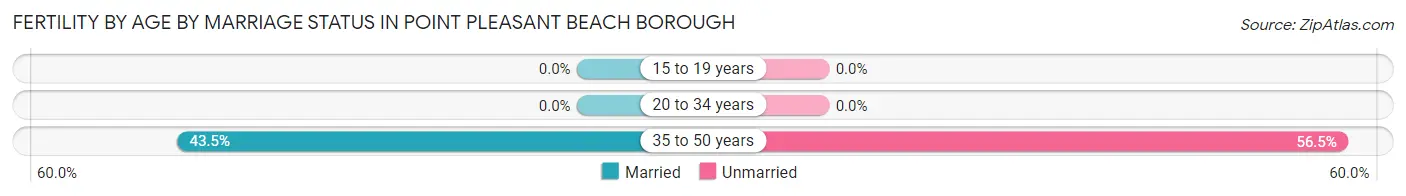
Fertility by Age by Marriage Status in Point Pleasant Beach borough
43.5% of women with births (23) in Point Pleasant Beach borough are married. The highest percentage of unmarried women with births falls into 35 to 50 years age bracket with 56.5% of them unmarried at the time of birth, while the lowest percentage of unmarried women with births belong to 35 to 50 years age bracket with 56.5% of them unmarried.
| Age Bracket | Married | Unmarried |
| 15 to 19 years | 0 (0.0%) | 0 (0.0%) |
| 20 to 34 years | 0 (0.0%) | 0 (0.0%) |
| 35 to 50 years | 10 (43.5%) | 13 (56.5%) |
| Total | 10 (43.5%) | 13 (56.5%) |
Fertility by Education in Point Pleasant Beach borough
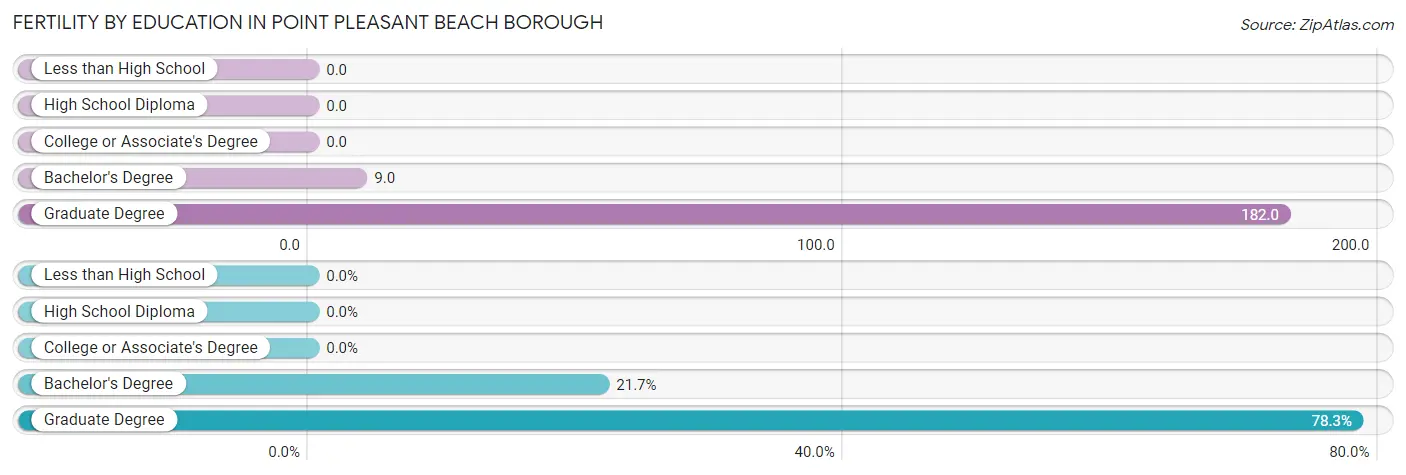
| Educational Attainment | Women with Births | Births / 1,000 Women |
| Less than High School | 0 (0.0%) | 0.0 |
| High School Diploma | 0 (0.0%) | 0.0 |
| College or Associate's Degree | 0 (0.0%) | 0.0 |
| Bachelor's Degree | 5 (21.7%) | 9.0 |
| Graduate Degree | 18 (78.3%) | 182.0 |
| Total | 23 (100.0%) | 22.0 |
Fertility by Education by Marriage Status in Point Pleasant Beach borough
56.5% of women with births in Point Pleasant Beach borough are unmarried. Women with the educational attainment of bachelor's degree are most likely to be married with 100.0% of them married at childbirth, while women with the educational attainment of graduate degree are least likely to be married with 72.2% of them unmarried at childbirth.
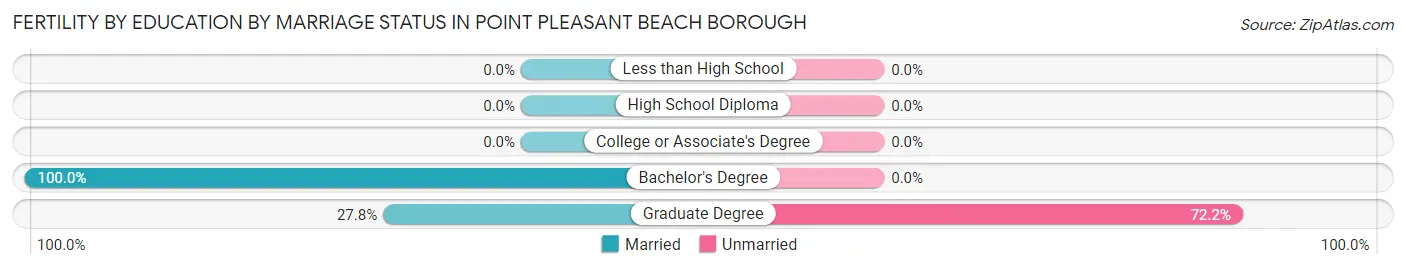
| Educational Attainment | Married | Unmarried |
| Less than High School | 0 (0.0%) | 0 (0.0%) |
| High School Diploma | 0 (0.0%) | 0 (0.0%) |
| College or Associate's Degree | 0 (0.0%) | 0 (0.0%) |
| Bachelor's Degree | 5 (100.0%) | 0 (0.0%) |
| Graduate Degree | 5 (27.8%) | 13 (72.2%) |
| Total | 10 (43.5%) | 13 (56.5%) |
Employment Characteristics in Point Pleasant Beach borough
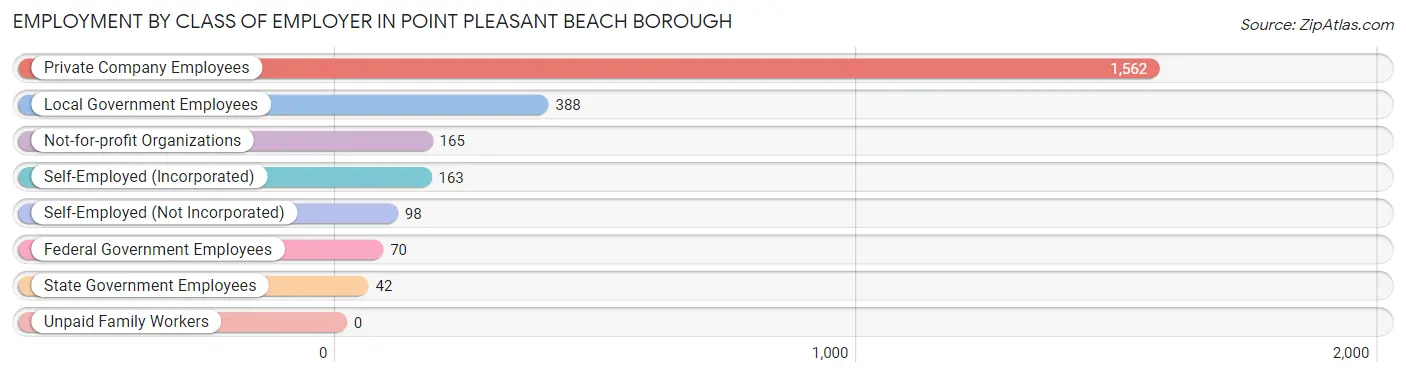
Employment by Class of Employer in Point Pleasant Beach borough
Among the 2,488 employed individuals in Point Pleasant Beach borough, private company employees (1,562 | 62.8%), local government employees (388 | 15.6%), and not-for-profit organizations (165 | 6.6%) make up the most common classes of employment.
| Employer Class | # Employees | % Employees |
| Private Company Employees | 1,562 | 62.8% |
| Self-Employed (Incorporated) | 163 | 6.6% |
| Self-Employed (Not Incorporated) | 98 | 3.9% |
| Not-for-profit Organizations | 165 | 6.6% |
| Local Government Employees | 388 | 15.6% |
| State Government Employees | 42 | 1.7% |
| Federal Government Employees | 70 | 2.8% |
| Unpaid Family Workers | 0 | 0.0% |
| Total | 2,488 | 100.0% |
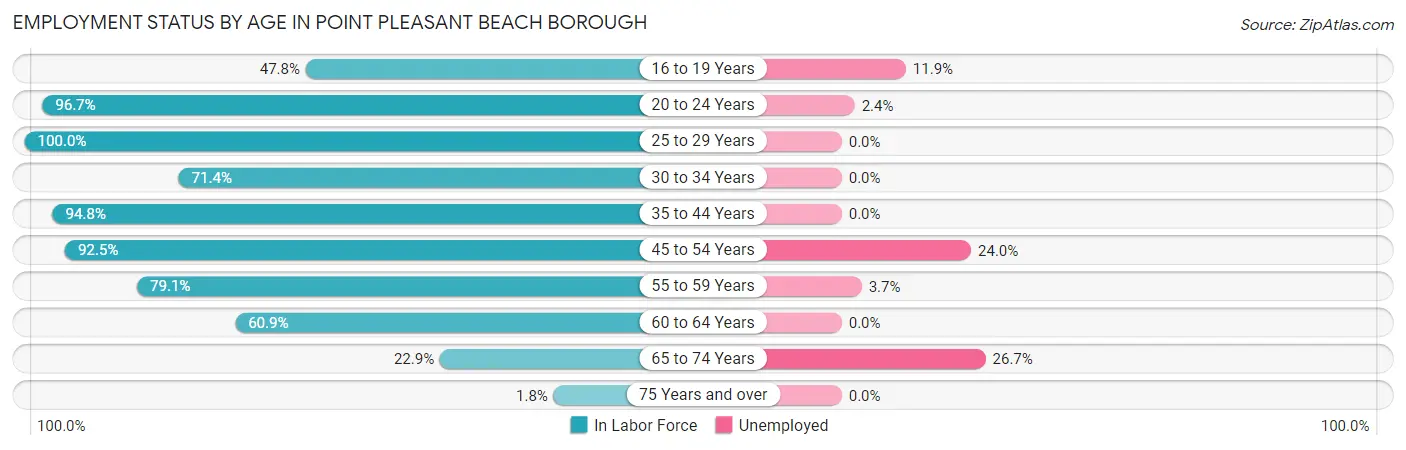
Employment Status by Age in Point Pleasant Beach borough
According to the labor force statistics for Point Pleasant Beach borough, out of the total population over 16 years of age (4,277), 65.2% or 2,789 individuals are in the labor force, with 8.5% or 237 of them unemployed. The age group with the highest labor force participation rate is 25 to 29 years, with 100.0% or 192 individuals in the labor force. Within the labor force, the 65 to 74 years age range has the highest percentage of unemployed individuals, with 26.7% or 35 of them being unemployed.
| Age Bracket | In Labor Force | Unemployed |
| 16 to 19 Years | 109 (47.8%) | 13 (11.9%) |
| 20 to 24 Years | 549 (96.7%) | 13 (2.4%) |
| 25 to 29 Years | 192 (100.0%) | 0 (0.0%) |
| 30 to 34 Years | 115 (71.4%) | 0 (0.0%) |
| 35 to 44 Years | 474 (94.8%) | 0 (0.0%) |
| 45 to 54 Years | 680 (92.5%) | 163 (24.0%) |
| 55 to 59 Years | 296 (79.1%) | 11 (3.7%) |
| 60 to 64 Years | 234 (60.9%) | 0 (0.0%) |
| 65 to 74 Years | 131 (22.9%) | 35 (26.7%) |
| 75 Years and over | 10 (1.8%) | 0 (0.0%) |
| Total | 2,789 (65.2%) | 237 (8.5%) |
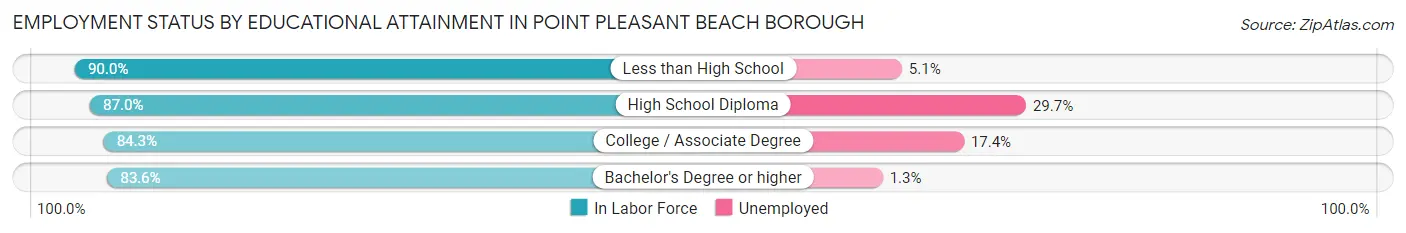
Employment Status by Educational Attainment in Point Pleasant Beach borough
According to labor force statistics for Point Pleasant Beach borough, 84.9% of individuals (1,992) out of the total population between 25 and 64 years of age (2,346) are in the labor force, with 8.7% or 173 of them being unemployed. The group with the highest labor force participation rate are those with the educational attainment of less than high school, with 90.0% or 217 individuals in the labor force. Within the labor force, individuals with high school diploma education have the highest percentage of unemployment, with 29.7% or 88 of them being unemployed.
| Educational Attainment | In Labor Force | Unemployed |
| Less than High School | 217 (90.0%) | 12 (5.1%) |
| High School Diploma | 295 (87.0%) | 101 (29.7%) |
| College / Associate Degree | 350 (84.3%) | 72 (17.4%) |
| Bachelor's Degree or higher | 1,129 (83.6%) | 18 (1.3%) |
| Total | 1,992 (84.9%) | 204 (8.7%) |
Employment Occupations by Sex in Point Pleasant Beach borough
Management, Business, Science and Arts Occupations
The most common Management, Business, Science and Arts occupations in Point Pleasant Beach borough are Management (386 | 15.5%), Community & Social Service (281 | 11.3%), Education Instruction & Library (219 | 8.8%), Health Diagnosing & Treating (216 | 8.6%), and Computers, Engineering & Science (162 | 6.5%).
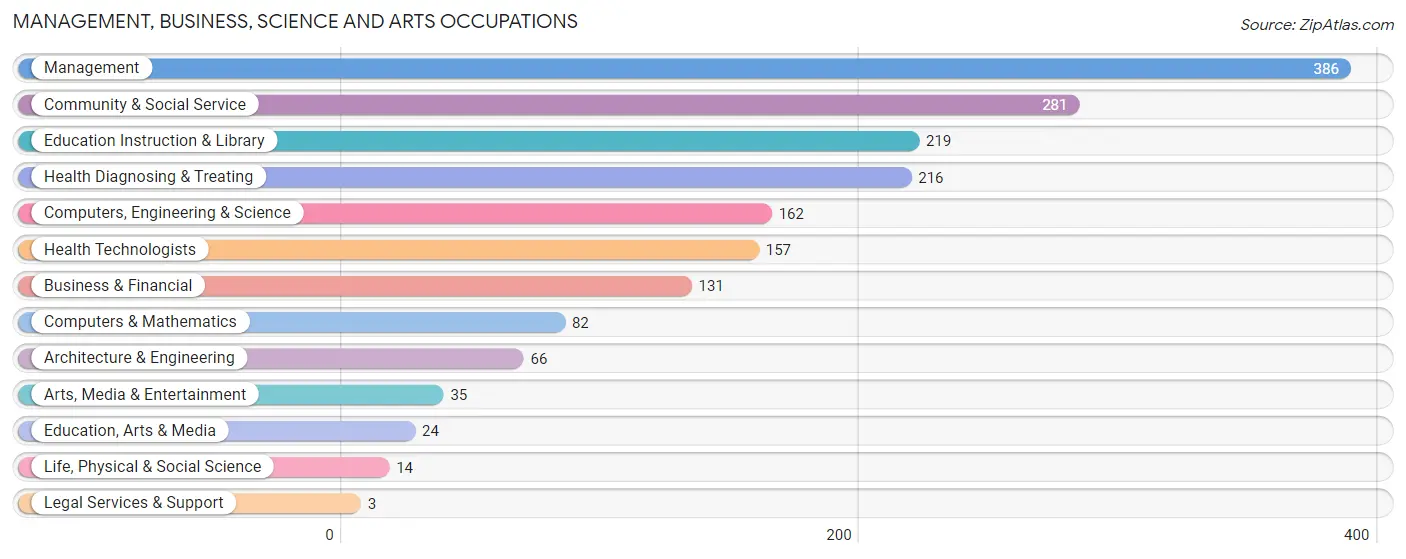
Management, Business, Science and Arts Occupations by Sex
Within the Management, Business, Science and Arts occupations in Point Pleasant Beach borough, the most male-oriented occupations are Computers & Mathematics (100.0%), Life, Physical & Social Science (100.0%), and Legal Services & Support (100.0%), while the most female-oriented occupations are Education, Arts & Media (100.0%), Education Instruction & Library (99.1%), and Health Technologists (95.5%).
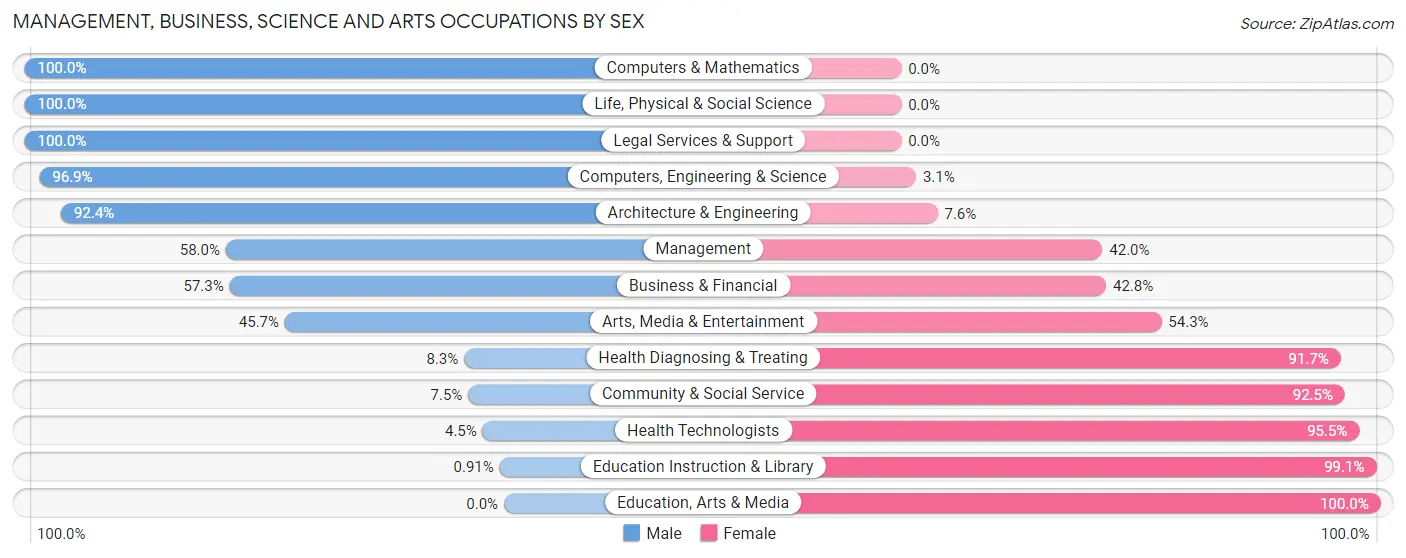
| Occupation | Male | Female |
| Management | 224 (58.0%) | 162 (42.0%) |
| Business & Financial | 75 (57.3%) | 56 (42.7%) |
| Computers, Engineering & Science | 157 (96.9%) | 5 (3.1%) |
| Computers & Mathematics | 82 (100.0%) | 0 (0.0%) |
| Architecture & Engineering | 61 (92.4%) | 5 (7.6%) |
| Life, Physical & Social Science | 14 (100.0%) | 0 (0.0%) |
| Community & Social Service | 21 (7.5%) | 260 (92.5%) |
| Education, Arts & Media | 0 (0.0%) | 24 (100.0%) |
| Legal Services & Support | 3 (100.0%) | 0 (0.0%) |
| Education Instruction & Library | 2 (0.9%) | 217 (99.1%) |
| Arts, Media & Entertainment | 16 (45.7%) | 19 (54.3%) |
| Health Diagnosing & Treating | 18 (8.3%) | 198 (91.7%) |
| Health Technologists | 7 (4.5%) | 150 (95.5%) |
| Total (Category) | 495 (42.1%) | 681 (57.9%) |
| Total (Overall) | 1,339 (53.6%) | 1,157 (46.4%) |
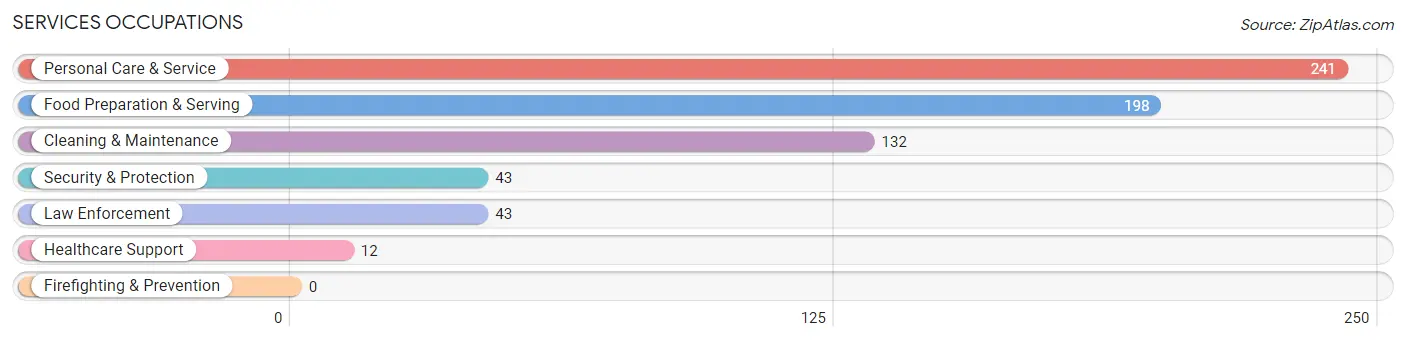
Services Occupations
The most common Services occupations in Point Pleasant Beach borough are Personal Care & Service (241 | 9.7%), Food Preparation & Serving (198 | 7.9%), Cleaning & Maintenance (132 | 5.3%), Security & Protection (43 | 1.7%), and Law Enforcement (43 | 1.7%).
Services Occupations by Sex
Within the Services occupations in Point Pleasant Beach borough, the most male-oriented occupations are Security & Protection (100.0%), Law Enforcement (100.0%), and Cleaning & Maintenance (100.0%), while the most female-oriented occupations are Healthcare Support (100.0%), Personal Care & Service (76.3%), and Food Preparation & Serving (16.2%).
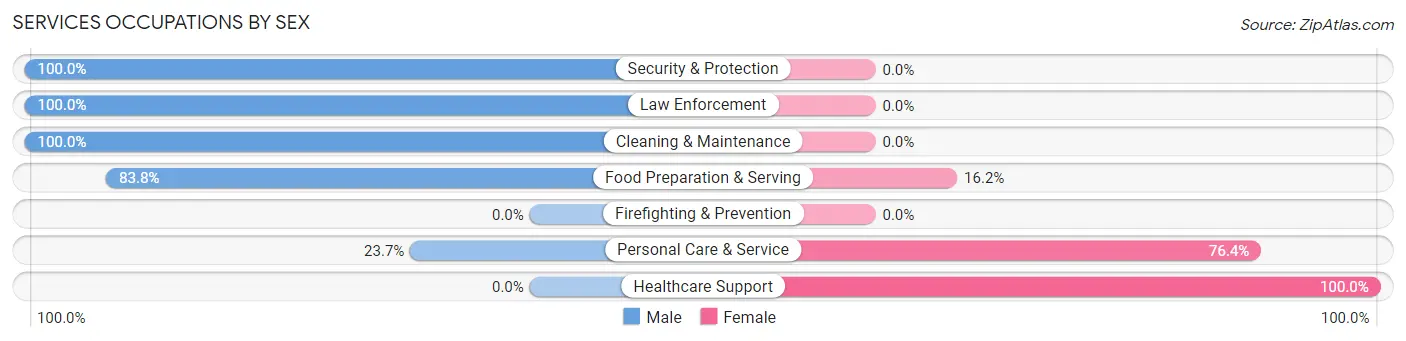
| Occupation | Male | Female |
| Healthcare Support | 0 (0.0%) | 12 (100.0%) |
| Security & Protection | 43 (100.0%) | 0 (0.0%) |
| Firefighting & Prevention | 0 (0.0%) | 0 (0.0%) |
| Law Enforcement | 43 (100.0%) | 0 (0.0%) |
| Food Preparation & Serving | 166 (83.8%) | 32 (16.2%) |
| Cleaning & Maintenance | 132 (100.0%) | 0 (0.0%) |
| Personal Care & Service | 57 (23.6%) | 184 (76.3%) |
| Total (Category) | 398 (63.6%) | 228 (36.4%) |
| Total (Overall) | 1,339 (53.6%) | 1,157 (46.4%) |
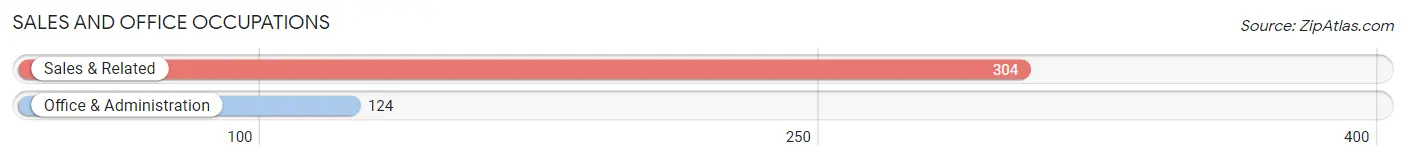
Sales and Office Occupations
The most common Sales and Office occupations in Point Pleasant Beach borough are Sales & Related (304 | 12.2%), and Office & Administration (124 | 5.0%).
Sales and Office Occupations by Sex
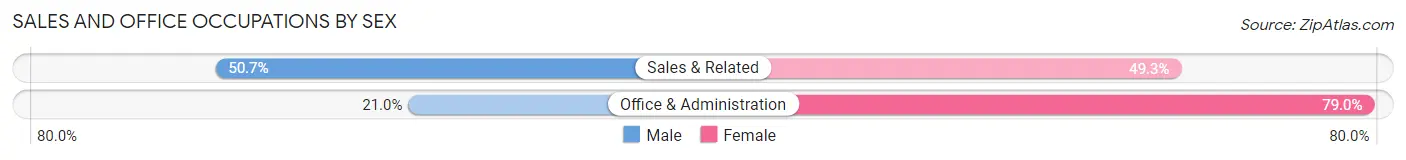
| Occupation | Male | Female |
| Sales & Related | 154 (50.7%) | 150 (49.3%) |
| Office & Administration | 26 (21.0%) | 98 (79.0%) |
| Total (Category) | 180 (42.1%) | 248 (57.9%) |
| Total (Overall) | 1,339 (53.6%) | 1,157 (46.4%) |
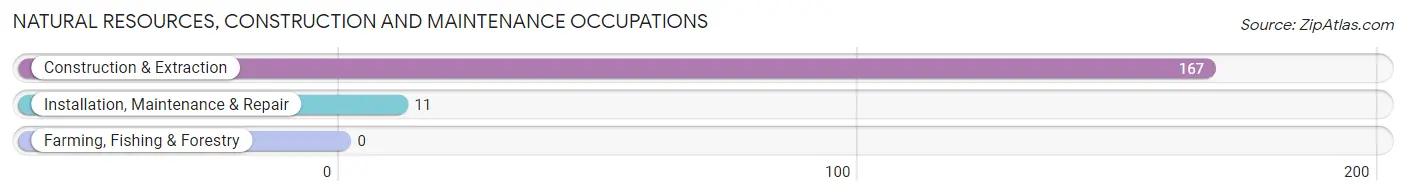
Natural Resources, Construction and Maintenance Occupations
The most common Natural Resources, Construction and Maintenance occupations in Point Pleasant Beach borough are Construction & Extraction (167 | 6.7%), and Installation, Maintenance & Repair (11 | 0.4%).
Natural Resources, Construction and Maintenance Occupations by Sex
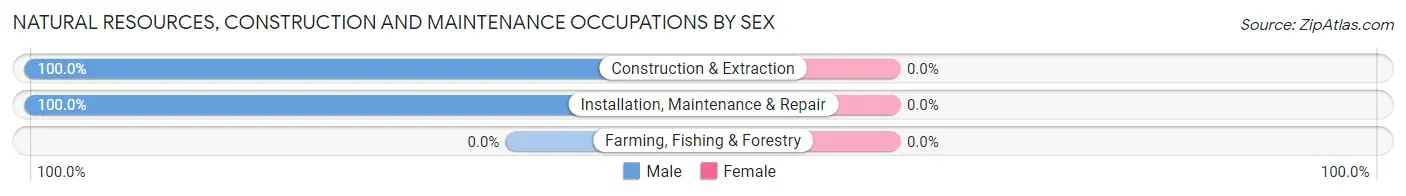
| Occupation | Male | Female |
| Farming, Fishing & Forestry | 0 (0.0%) | 0 (0.0%) |
| Construction & Extraction | 167 (100.0%) | 0 (0.0%) |
| Installation, Maintenance & Repair | 11 (100.0%) | 0 (0.0%) |
| Total (Category) | 178 (100.0%) | 0 (0.0%) |
| Total (Overall) | 1,339 (53.6%) | 1,157 (46.4%) |
Production, Transportation and Moving Occupations
The most common Production, Transportation and Moving occupations in Point Pleasant Beach borough are Transportation (55 | 2.2%), Production (24 | 1.0%), and Material Moving (9 | 0.4%).
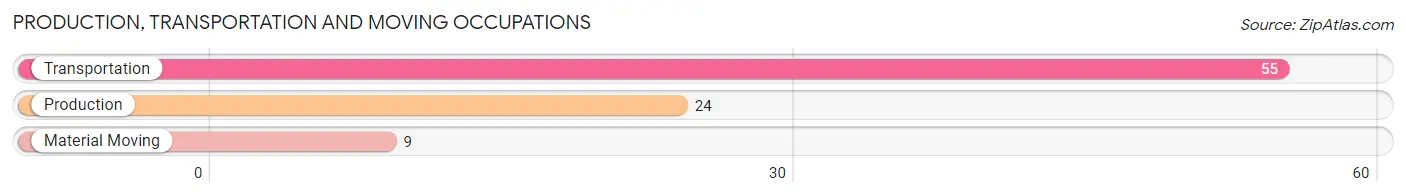
Production, Transportation and Moving Occupations by Sex
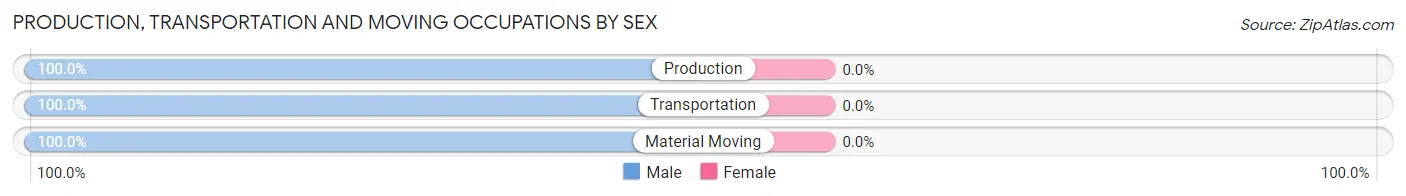
| Occupation | Male | Female |
| Production | 24 (100.0%) | 0 (0.0%) |
| Transportation | 55 (100.0%) | 0 (0.0%) |
| Material Moving | 9 (100.0%) | 0 (0.0%) |
| Total (Category) | 88 (100.0%) | 0 (0.0%) |
| Total (Overall) | 1,339 (53.6%) | 1,157 (46.4%) |
Employment Industries by Sex in Point Pleasant Beach borough
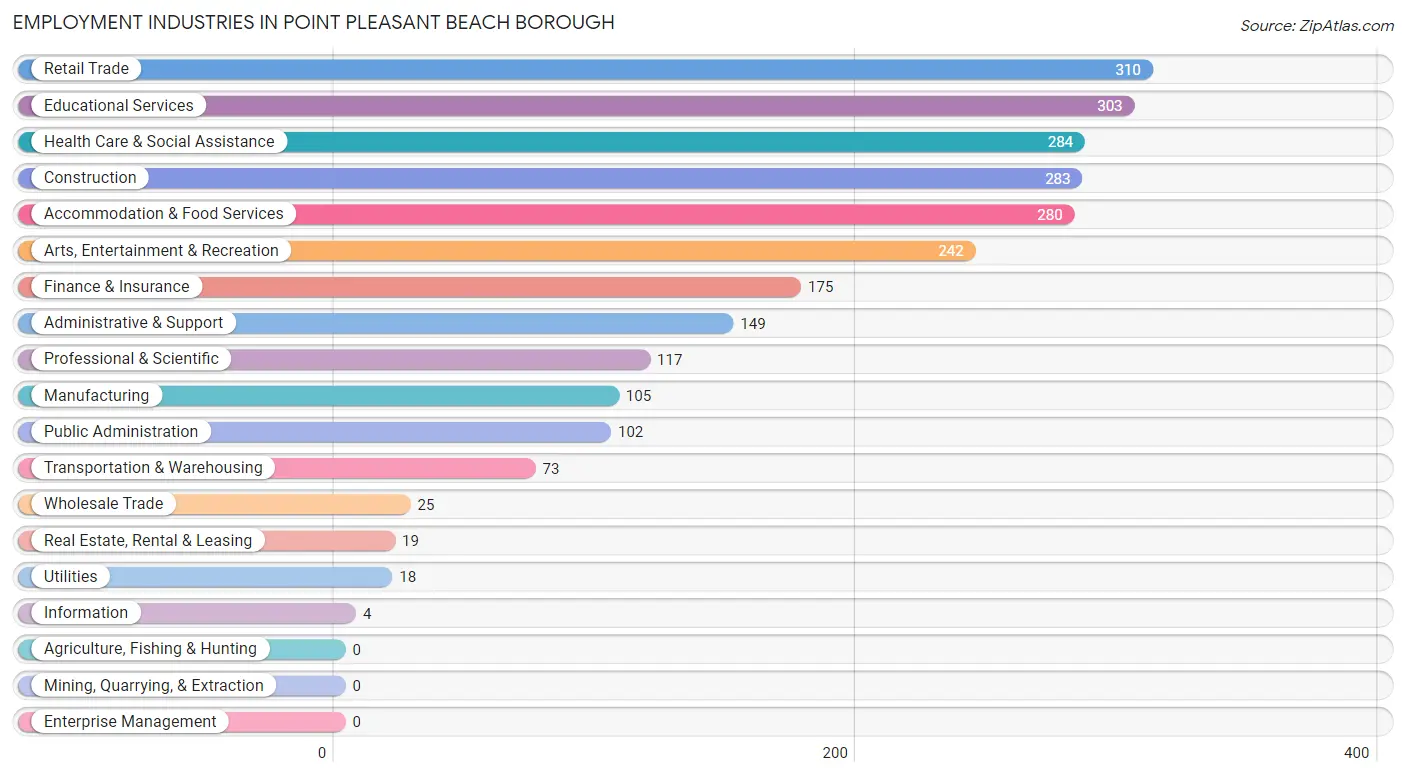
Employment Industries in Point Pleasant Beach borough
The major employment industries in Point Pleasant Beach borough include Retail Trade (310 | 12.4%), Educational Services (303 | 12.1%), Health Care & Social Assistance (284 | 11.4%), Construction (283 | 11.3%), and Accommodation & Food Services (280 | 11.2%).
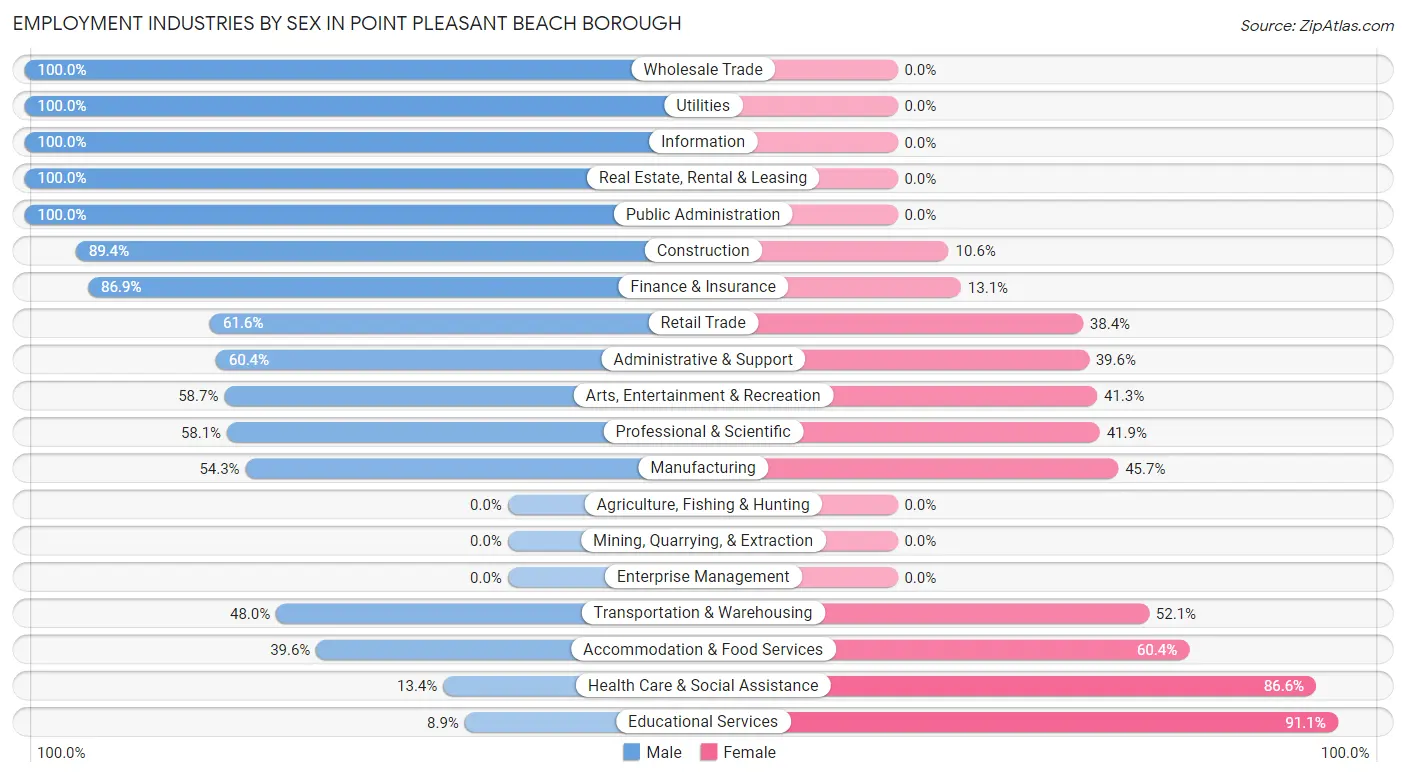
Employment Industries by Sex in Point Pleasant Beach borough
The Point Pleasant Beach borough industries that see more men than women are Wholesale Trade (100.0%), Utilities (100.0%), and Information (100.0%), whereas the industries that tend to have a higher number of women are Educational Services (91.1%), Health Care & Social Assistance (86.6%), and Accommodation & Food Services (60.4%).
| Industry | Male | Female |
| Agriculture, Fishing & Hunting | 0 (0.0%) | 0 (0.0%) |
| Mining, Quarrying, & Extraction | 0 (0.0%) | 0 (0.0%) |
| Construction | 253 (89.4%) | 30 (10.6%) |
| Manufacturing | 57 (54.3%) | 48 (45.7%) |
| Wholesale Trade | 25 (100.0%) | 0 (0.0%) |
| Retail Trade | 191 (61.6%) | 119 (38.4%) |
| Transportation & Warehousing | 35 (47.9%) | 38 (52.0%) |
| Utilities | 18 (100.0%) | 0 (0.0%) |
| Information | 4 (100.0%) | 0 (0.0%) |
| Finance & Insurance | 152 (86.9%) | 23 (13.1%) |
| Real Estate, Rental & Leasing | 19 (100.0%) | 0 (0.0%) |
| Professional & Scientific | 68 (58.1%) | 49 (41.9%) |
| Enterprise Management | 0 (0.0%) | 0 (0.0%) |
| Administrative & Support | 90 (60.4%) | 59 (39.6%) |
| Educational Services | 27 (8.9%) | 276 (91.1%) |
| Health Care & Social Assistance | 38 (13.4%) | 246 (86.6%) |
| Arts, Entertainment & Recreation | 142 (58.7%) | 100 (41.3%) |
| Accommodation & Food Services | 111 (39.6%) | 169 (60.4%) |
| Public Administration | 102 (100.0%) | 0 (0.0%) |
| Total | 1,339 (53.6%) | 1,157 (46.4%) |
Education in Point Pleasant Beach borough
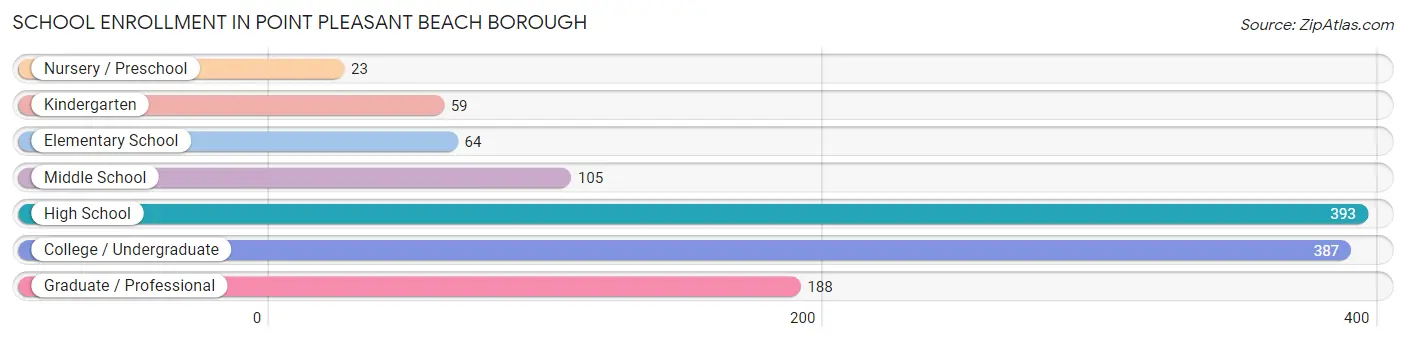
School Enrollment in Point Pleasant Beach borough
The most common levels of schooling among the 1,219 students in Point Pleasant Beach borough are high school (393 | 32.2%), college / undergraduate (387 | 31.8%), and graduate / professional (188 | 15.4%).
| School Level | # Students | % Students |
| Nursery / Preschool | 23 | 1.9% |
| Kindergarten | 59 | 4.8% |
| Elementary School | 64 | 5.2% |
| Middle School | 105 | 8.6% |
| High School | 393 | 32.2% |
| College / Undergraduate | 387 | 31.8% |
| Graduate / Professional | 188 | 15.4% |
| Total | 1,219 | 100.0% |
School Enrollment by Age by Funding Source in Point Pleasant Beach borough
Out of a total of 1,219 students who are enrolled in schools in Point Pleasant Beach borough, 366 (30.0%) attend a private institution, while the remaining 853 (70.0%) are enrolled in public schools. The age group of 25 to 34 year olds has the highest likelihood of being enrolled in private schools, with 68 (94.4% in the age bracket) enrolled. Conversely, the age group of 10 to 14 year olds has the lowest likelihood of being enrolled in a private school, with 153 (100.0% in the age bracket) attending a public institution.
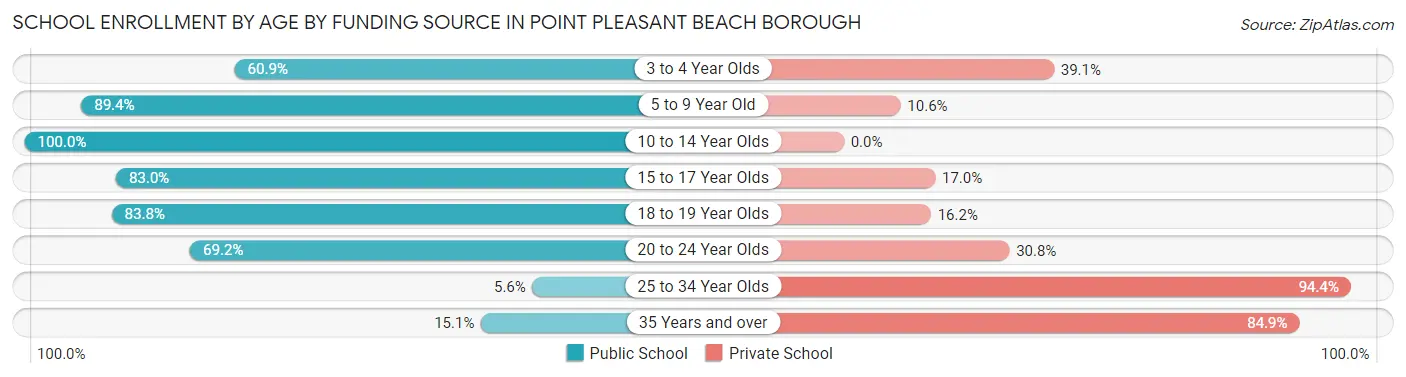
| Age Bracket | Public School | Private School |
| 3 to 4 Year Olds | 14 (60.9%) | 9 (39.1%) |
| 5 to 9 Year Old | 110 (89.4%) | 13 (10.6%) |
| 10 to 14 Year Olds | 153 (100.0%) | 0 (0.0%) |
| 15 to 17 Year Olds | 234 (83.0%) | 48 (17.0%) |
| 18 to 19 Year Olds | 62 (83.8%) | 12 (16.2%) |
| 20 to 24 Year Olds | 258 (69.2%) | 115 (30.8%) |
| 25 to 34 Year Olds | 4 (5.6%) | 68 (94.4%) |
| 35 Years and over | 18 (15.1%) | 101 (84.9%) |
| Total | 853 (70.0%) | 366 (30.0%) |
Educational Attainment by Field of Study in Point Pleasant Beach borough
Education (498 | 20.6%), business (460 | 19.1%), arts & humanities (257 | 10.6%), science & technology (242 | 10.0%), and social sciences (205 | 8.5%) are the most common fields of study among 2,414 individuals in Point Pleasant Beach borough who have obtained a bachelor's degree or higher.
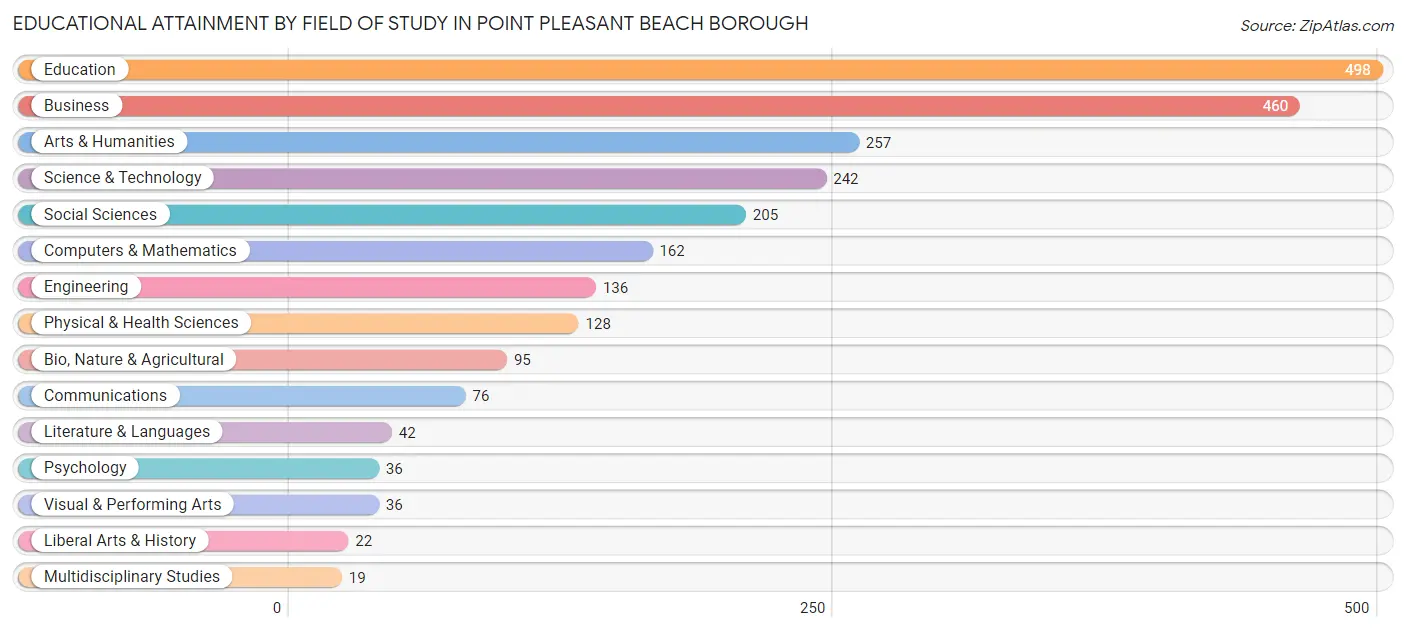
| Field of Study | # Graduates | % Graduates |
| Computers & Mathematics | 162 | 6.7% |
| Bio, Nature & Agricultural | 95 | 3.9% |
| Physical & Health Sciences | 128 | 5.3% |
| Psychology | 36 | 1.5% |
| Social Sciences | 205 | 8.5% |
| Engineering | 136 | 5.6% |
| Multidisciplinary Studies | 19 | 0.8% |
| Science & Technology | 242 | 10.0% |
| Business | 460 | 19.1% |
| Education | 498 | 20.6% |
| Literature & Languages | 42 | 1.7% |
| Liberal Arts & History | 22 | 0.9% |
| Visual & Performing Arts | 36 | 1.5% |
| Communications | 76 | 3.2% |
| Arts & Humanities | 257 | 10.6% |
| Total | 2,414 | 100.0% |
Transportation & Commute in Point Pleasant Beach borough
Vehicle Availability by Sex in Point Pleasant Beach borough
The most prevalent vehicle ownership categories in Point Pleasant Beach borough are males with 2 vehicles (521, accounting for 37.5%) and females with 2 vehicles (292, making up 47.4%).
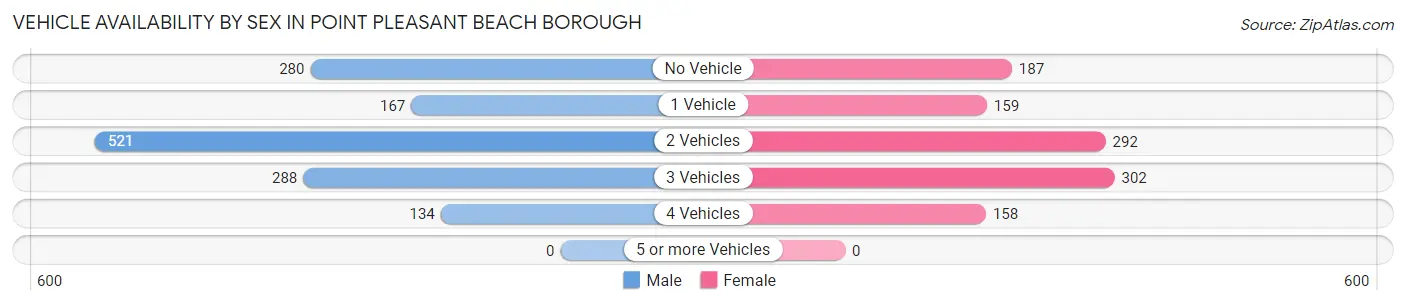
| Vehicles Available | Male | Female |
| No Vehicle | 280 (20.1%) | 187 (17.0%) |
| 1 Vehicle | 167 (12.0%) | 159 (14.5%) |
| 2 Vehicles | 521 (37.5%) | 292 (26.6%) |
| 3 Vehicles | 288 (20.7%) | 302 (27.5%) |
| 4 Vehicles | 134 (9.6%) | 158 (14.4%) |
| 5 or more Vehicles | 0 (0.0%) | 0 (0.0%) |
| Total | 1,390 (100.0%) | 1,098 (100.0%) |
Commute Time in Point Pleasant Beach borough
The most frequently occuring commute durations in Point Pleasant Beach borough are 30 to 34 minutes (411 commuters, 18.5%), 5 to 9 minutes (402 commuters, 18.1%), and 60 to 89 minutes (248 commuters, 11.1%).
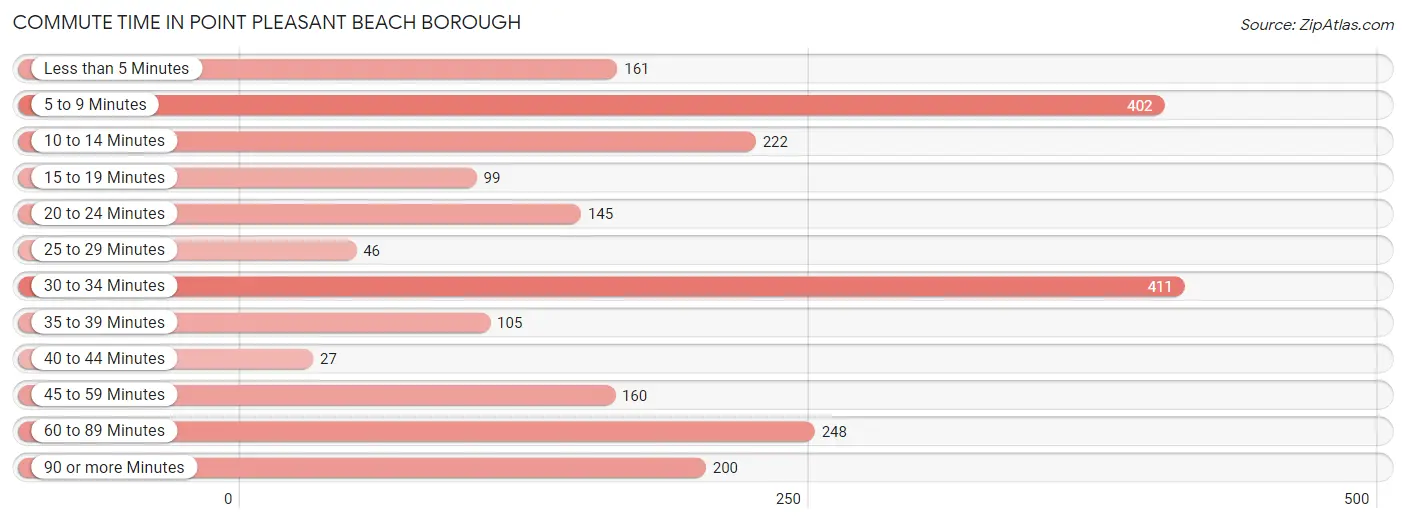
| Commute Time | # Commuters | % Commuters |
| Less than 5 Minutes | 161 | 7.2% |
| 5 to 9 Minutes | 402 | 18.1% |
| 10 to 14 Minutes | 222 | 10.0% |
| 15 to 19 Minutes | 99 | 4.4% |
| 20 to 24 Minutes | 145 | 6.5% |
| 25 to 29 Minutes | 46 | 2.1% |
| 30 to 34 Minutes | 411 | 18.5% |
| 35 to 39 Minutes | 105 | 4.7% |
| 40 to 44 Minutes | 27 | 1.2% |
| 45 to 59 Minutes | 160 | 7.2% |
| 60 to 89 Minutes | 248 | 11.1% |
| 90 or more Minutes | 200 | 9.0% |
Commute Time by Sex in Point Pleasant Beach borough
The most common commute times in Point Pleasant Beach borough are 5 to 9 minutes (276 commuters, 21.1%) for males and 30 to 34 minutes (228 commuters, 24.9%) for females.
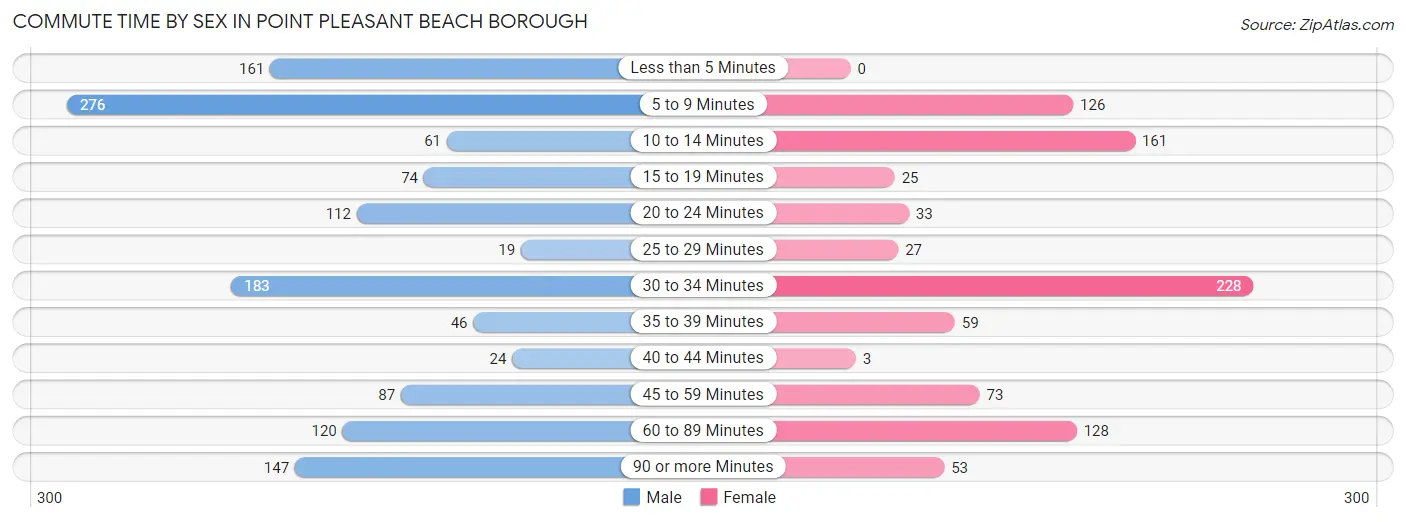
| Commute Time | Male | Female |
| Less than 5 Minutes | 161 (12.3%) | 0 (0.0%) |
| 5 to 9 Minutes | 276 (21.1%) | 126 (13.8%) |
| 10 to 14 Minutes | 61 (4.7%) | 161 (17.6%) |
| 15 to 19 Minutes | 74 (5.7%) | 25 (2.7%) |
| 20 to 24 Minutes | 112 (8.6%) | 33 (3.6%) |
| 25 to 29 Minutes | 19 (1.5%) | 27 (2.9%) |
| 30 to 34 Minutes | 183 (14.0%) | 228 (24.9%) |
| 35 to 39 Minutes | 46 (3.5%) | 59 (6.4%) |
| 40 to 44 Minutes | 24 (1.8%) | 3 (0.3%) |
| 45 to 59 Minutes | 87 (6.6%) | 73 (8.0%) |
| 60 to 89 Minutes | 120 (9.2%) | 128 (14.0%) |
| 90 or more Minutes | 147 (11.2%) | 53 (5.8%) |
Time of Departure to Work by Sex in Point Pleasant Beach borough
The most frequent times of departure to work in Point Pleasant Beach borough are 6:30 AM to 6:59 AM (226, 17.2%) for males and 7:00 AM to 7:29 AM (216, 23.6%) for females.
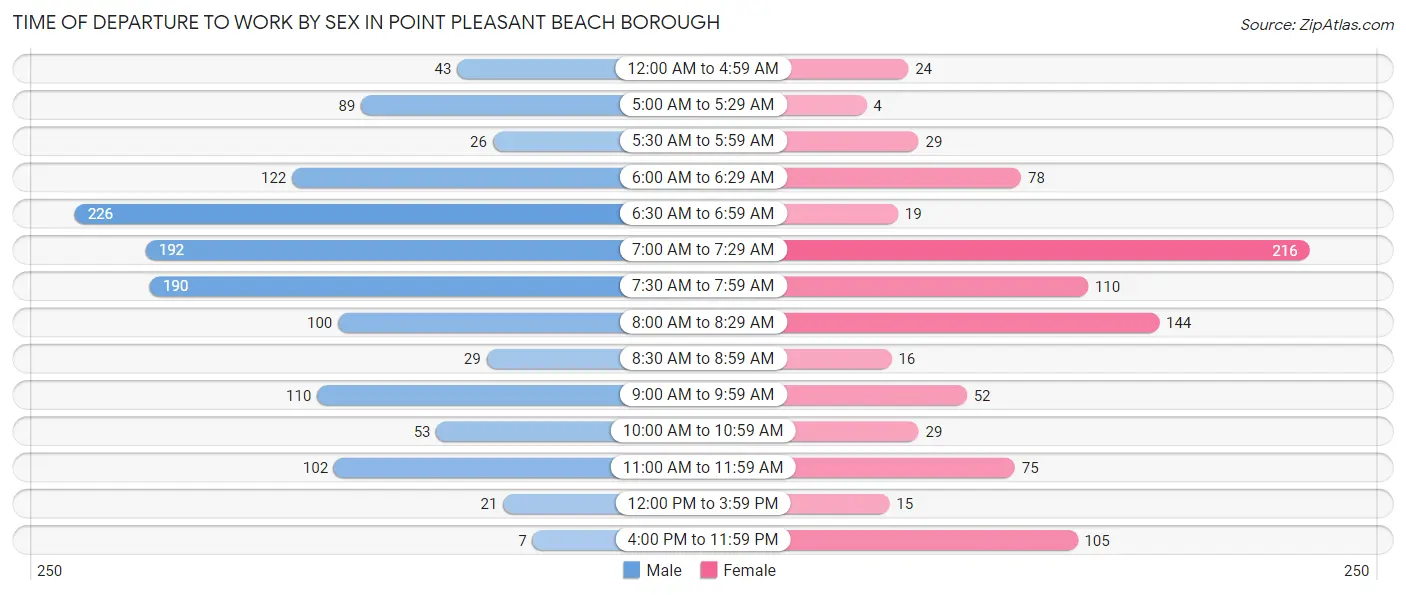
| Time of Departure | Male | Female |
| 12:00 AM to 4:59 AM | 43 (3.3%) | 24 (2.6%) |
| 5:00 AM to 5:29 AM | 89 (6.8%) | 4 (0.4%) |
| 5:30 AM to 5:59 AM | 26 (2.0%) | 29 (3.2%) |
| 6:00 AM to 6:29 AM | 122 (9.3%) | 78 (8.5%) |
| 6:30 AM to 6:59 AM | 226 (17.2%) | 19 (2.1%) |
| 7:00 AM to 7:29 AM | 192 (14.7%) | 216 (23.6%) |
| 7:30 AM to 7:59 AM | 190 (14.5%) | 110 (12.0%) |
| 8:00 AM to 8:29 AM | 100 (7.6%) | 144 (15.7%) |
| 8:30 AM to 8:59 AM | 29 (2.2%) | 16 (1.8%) |
| 9:00 AM to 9:59 AM | 110 (8.4%) | 52 (5.7%) |
| 10:00 AM to 10:59 AM | 53 (4.1%) | 29 (3.2%) |
| 11:00 AM to 11:59 AM | 102 (7.8%) | 75 (8.2%) |
| 12:00 PM to 3:59 PM | 21 (1.6%) | 15 (1.6%) |
| 4:00 PM to 11:59 PM | 7 (0.5%) | 105 (11.5%) |
| Total | 1,310 (100.0%) | 916 (100.0%) |
Housing Occupancy in Point Pleasant Beach borough
Occupancy by Ownership in Point Pleasant Beach borough
Of the total 1,903 dwellings in Point Pleasant Beach borough, owner-occupied units account for 1,322 (69.5%), while renter-occupied units make up 581 (30.5%).
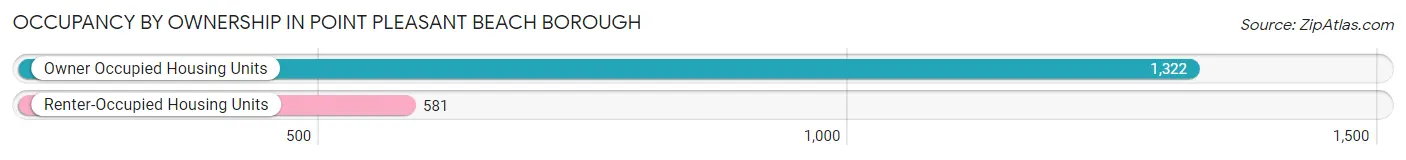
| Occupancy | # Housing Units | % Housing Units |
| Owner Occupied Housing Units | 1,322 | 69.5% |
| Renter-Occupied Housing Units | 581 | 30.5% |
| Total Occupied Housing Units | 1,903 | 100.0% |
Occupancy by Household Size in Point Pleasant Beach borough
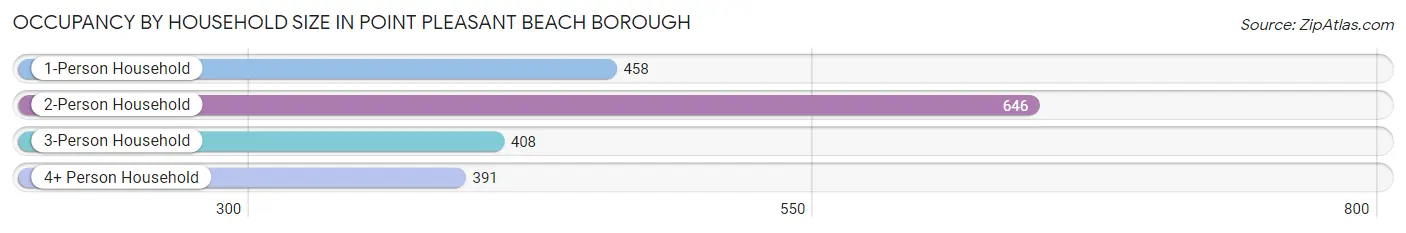
| Household Size | # Housing Units | % Housing Units |
| 1-Person Household | 458 | 24.1% |
| 2-Person Household | 646 | 34.0% |
| 3-Person Household | 408 | 21.4% |
| 4+ Person Household | 391 | 20.5% |
| Total Housing Units | 1,903 | 100.0% |
Occupancy by Ownership by Household Size in Point Pleasant Beach borough
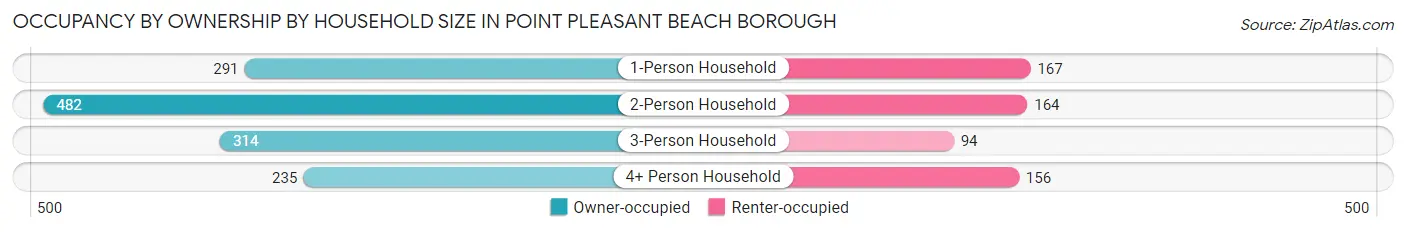
| Household Size | Owner-occupied | Renter-occupied |
| 1-Person Household | 291 (63.5%) | 167 (36.5%) |
| 2-Person Household | 482 (74.6%) | 164 (25.4%) |
| 3-Person Household | 314 (77.0%) | 94 (23.0%) |
| 4+ Person Household | 235 (60.1%) | 156 (39.9%) |
| Total Housing Units | 1,322 (69.5%) | 581 (30.5%) |
Occupancy by Educational Attainment in Point Pleasant Beach borough
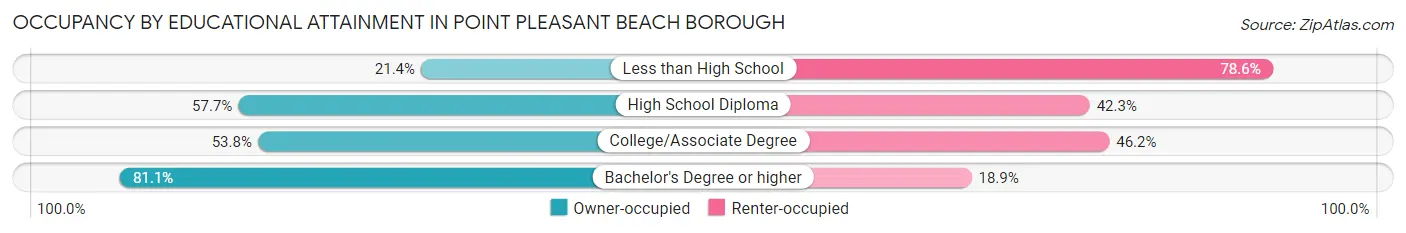
| Household Size | Owner-occupied | Renter-occupied |
| Less than High School | 27 (21.4%) | 99 (78.6%) |
| High School Diploma | 128 (57.7%) | 94 (42.3%) |
| College/Associate Degree | 185 (53.8%) | 159 (46.2%) |
| Bachelor's Degree or higher | 982 (81.1%) | 229 (18.9%) |
Occupancy by Age of Householder in Point Pleasant Beach borough
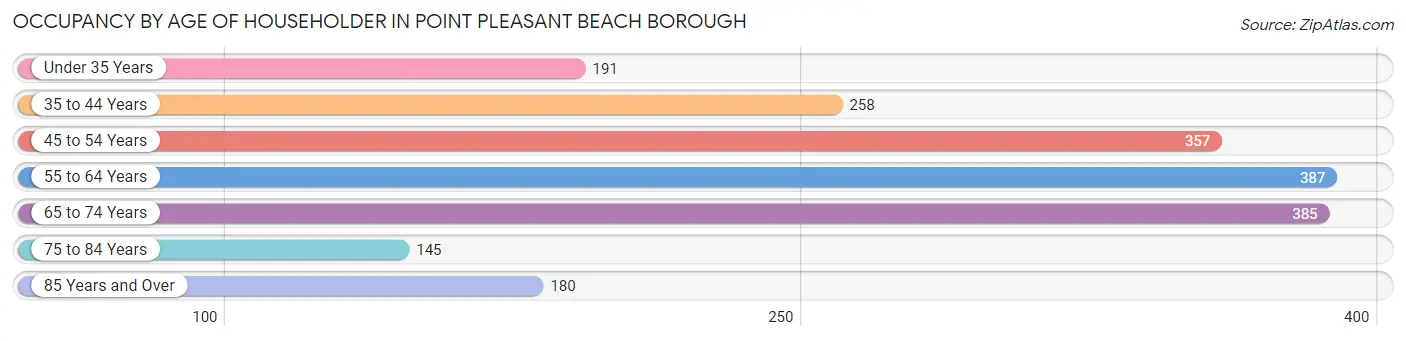
| Age Bracket | # Households | % Households |
| Under 35 Years | 191 | 10.0% |
| 35 to 44 Years | 258 | 13.6% |
| 45 to 54 Years | 357 | 18.8% |
| 55 to 64 Years | 387 | 20.3% |
| 65 to 74 Years | 385 | 20.2% |
| 75 to 84 Years | 145 | 7.6% |
| 85 Years and Over | 180 | 9.5% |
| Total | 1,903 | 100.0% |
Housing Finances in Point Pleasant Beach borough
Median Income by Occupancy in Point Pleasant Beach borough
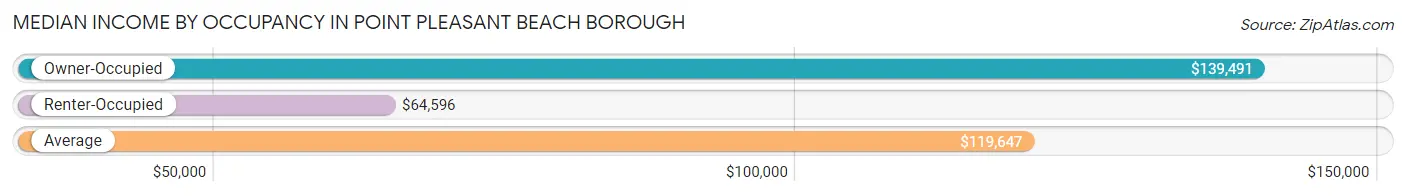
| Occupancy Type | # Households | Median Income |
| Owner-Occupied | 1,322 (69.5%) | $139,491 |
| Renter-Occupied | 581 (30.5%) | $64,596 |
| Average | 1,903 (100.0%) | $119,647 |
Occupancy by Householder Income Bracket in Point Pleasant Beach borough
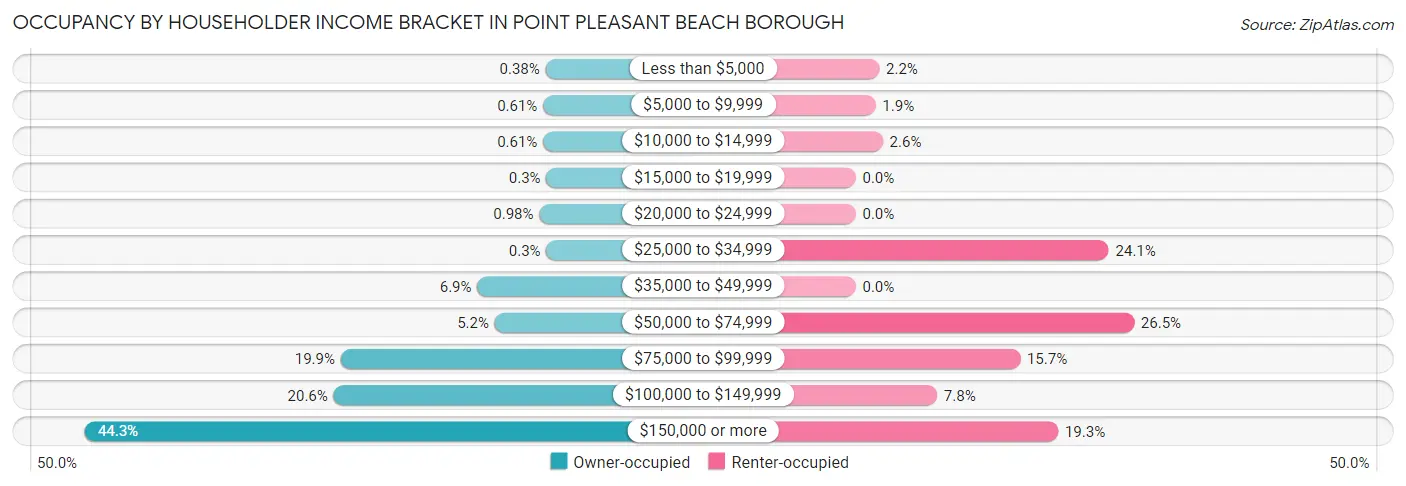
| Income Bracket | Owner-occupied | Renter-occupied |
| Less than $5,000 | 5 (0.4%) | 13 (2.2%) |
| $5,000 to $9,999 | 8 (0.6%) | 11 (1.9%) |
| $10,000 to $14,999 | 8 (0.6%) | 15 (2.6%) |
| $15,000 to $19,999 | 4 (0.3%) | 0 (0.0%) |
| $20,000 to $24,999 | 13 (1.0%) | 0 (0.0%) |
| $25,000 to $34,999 | 4 (0.3%) | 140 (24.1%) |
| $35,000 to $49,999 | 91 (6.9%) | 0 (0.0%) |
| $50,000 to $74,999 | 69 (5.2%) | 154 (26.5%) |
| $75,000 to $99,999 | 263 (19.9%) | 91 (15.7%) |
| $100,000 to $149,999 | 272 (20.6%) | 45 (7.7%) |
| $150,000 or more | 585 (44.3%) | 112 (19.3%) |
| Total | 1,322 (100.0%) | 581 (100.0%) |
Monthly Housing Cost Tiers in Point Pleasant Beach borough
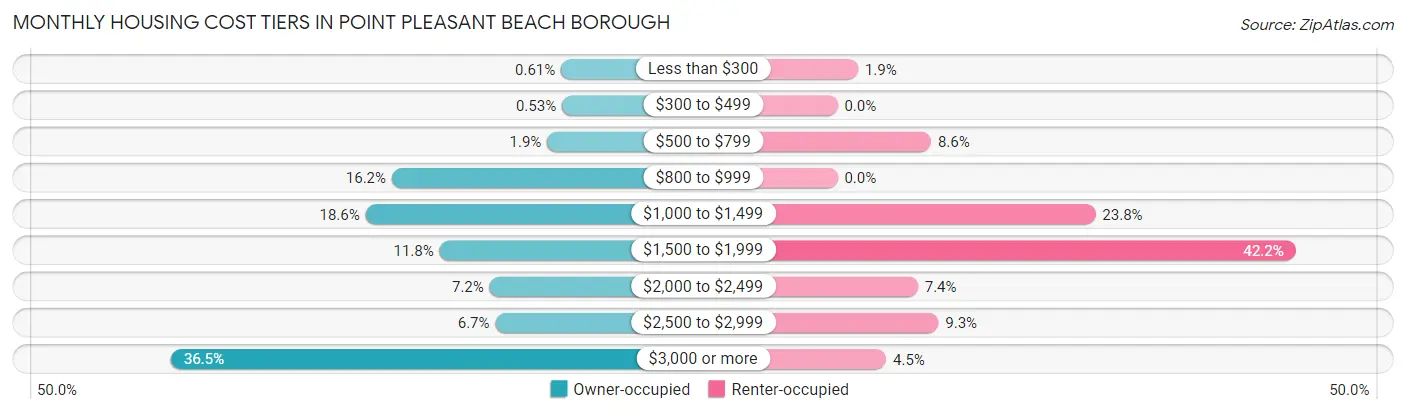
| Monthly Cost | Owner-occupied | Renter-occupied |
| Less than $300 | 8 (0.6%) | 11 (1.9%) |
| $300 to $499 | 7 (0.5%) | 0 (0.0%) |
| $500 to $799 | 25 (1.9%) | 50 (8.6%) |
| $800 to $999 | 214 (16.2%) | 0 (0.0%) |
| $1,000 to $1,499 | 246 (18.6%) | 138 (23.7%) |
| $1,500 to $1,999 | 156 (11.8%) | 245 (42.2%) |
| $2,000 to $2,499 | 95 (7.2%) | 43 (7.4%) |
| $2,500 to $2,999 | 88 (6.7%) | 54 (9.3%) |
| $3,000 or more | 483 (36.5%) | 26 (4.5%) |
| Total | 1,322 (100.0%) | 581 (100.0%) |
Physical Housing Characteristics in Point Pleasant Beach borough
Housing Structures in Point Pleasant Beach borough
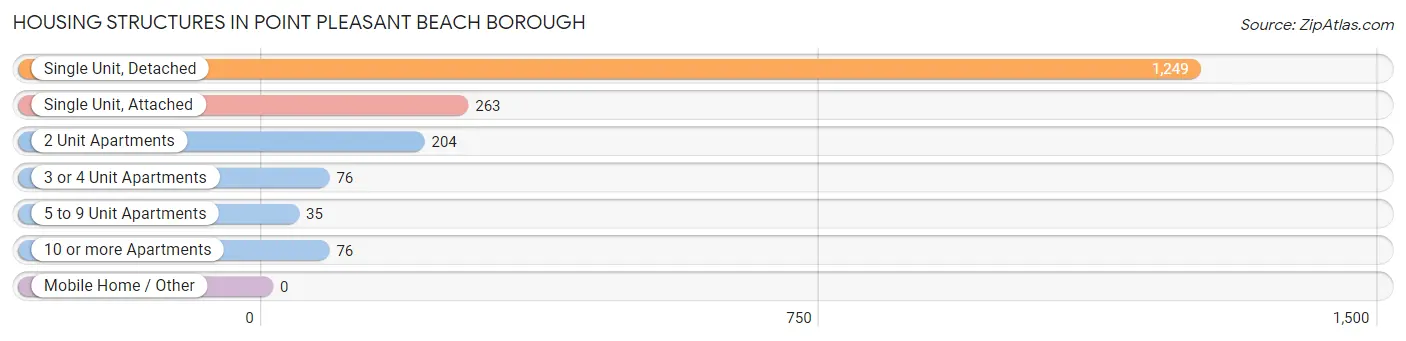
| Structure Type | # Housing Units | % Housing Units |
| Single Unit, Detached | 1,249 | 65.6% |
| Single Unit, Attached | 263 | 13.8% |
| 2 Unit Apartments | 204 | 10.7% |
| 3 or 4 Unit Apartments | 76 | 4.0% |
| 5 to 9 Unit Apartments | 35 | 1.8% |
| 10 or more Apartments | 76 | 4.0% |
| Mobile Home / Other | 0 | 0.0% |
| Total | 1,903 | 100.0% |
Housing Structures by Occupancy in Point Pleasant Beach borough
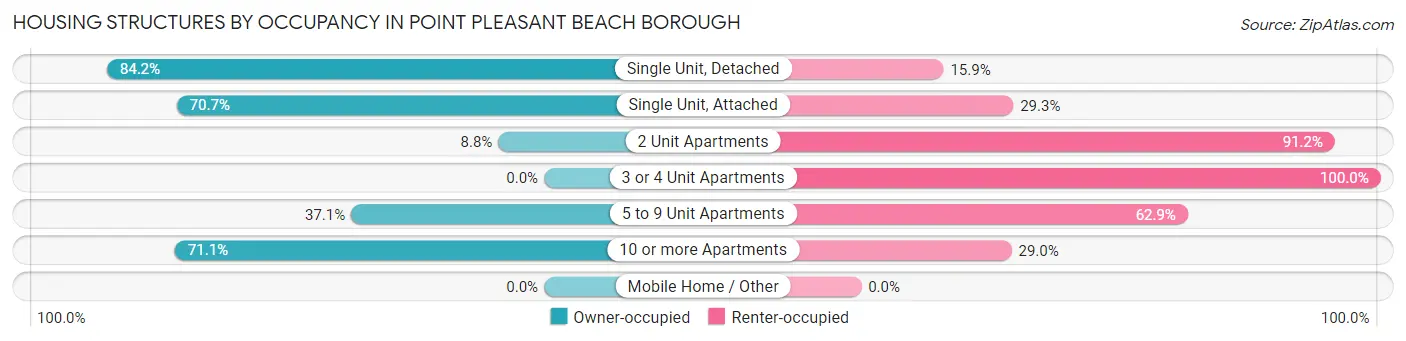
| Structure Type | Owner-occupied | Renter-occupied |
| Single Unit, Detached | 1,051 (84.2%) | 198 (15.9%) |
| Single Unit, Attached | 186 (70.7%) | 77 (29.3%) |
| 2 Unit Apartments | 18 (8.8%) | 186 (91.2%) |
| 3 or 4 Unit Apartments | 0 (0.0%) | 76 (100.0%) |
| 5 to 9 Unit Apartments | 13 (37.1%) | 22 (62.9%) |
| 10 or more Apartments | 54 (71.1%) | 22 (28.9%) |
| Mobile Home / Other | 0 (0.0%) | 0 (0.0%) |
| Total | 1,322 (69.5%) | 581 (30.5%) |
Housing Structures by Number of Rooms in Point Pleasant Beach borough
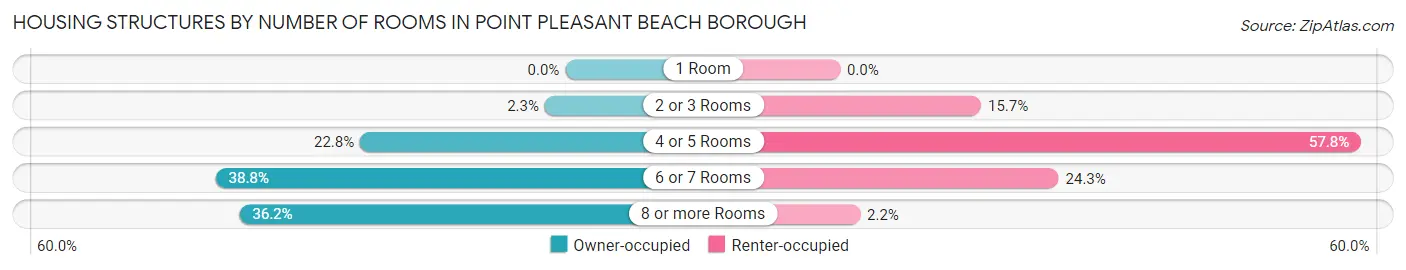
| Number of Rooms | Owner-occupied | Renter-occupied |
| 1 Room | 0 (0.0%) | 0 (0.0%) |
| 2 or 3 Rooms | 30 (2.3%) | 91 (15.7%) |
| 4 or 5 Rooms | 301 (22.8%) | 336 (57.8%) |
| 6 or 7 Rooms | 513 (38.8%) | 141 (24.3%) |
| 8 or more Rooms | 478 (36.2%) | 13 (2.2%) |
| Total | 1,322 (100.0%) | 581 (100.0%) |
Housing Structure by Heating Type in Point Pleasant Beach borough
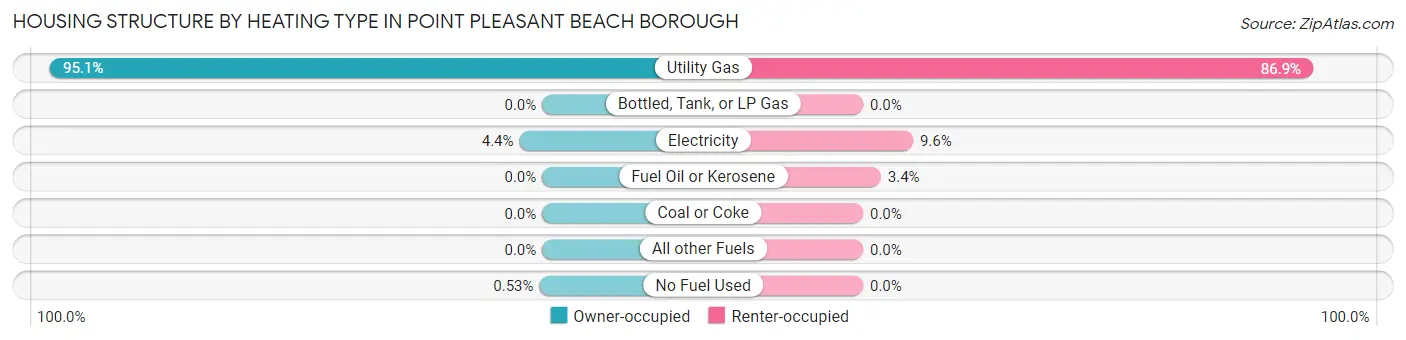
| Heating Type | Owner-occupied | Renter-occupied |
| Utility Gas | 1,257 (95.1%) | 505 (86.9%) |
| Bottled, Tank, or LP Gas | 0 (0.0%) | 0 (0.0%) |
| Electricity | 58 (4.4%) | 56 (9.6%) |
| Fuel Oil or Kerosene | 0 (0.0%) | 20 (3.4%) |
| Coal or Coke | 0 (0.0%) | 0 (0.0%) |
| All other Fuels | 0 (0.0%) | 0 (0.0%) |
| No Fuel Used | 7 (0.5%) | 0 (0.0%) |
| Total | 1,322 (100.0%) | 581 (100.0%) |
Household Vehicle Usage in Point Pleasant Beach borough
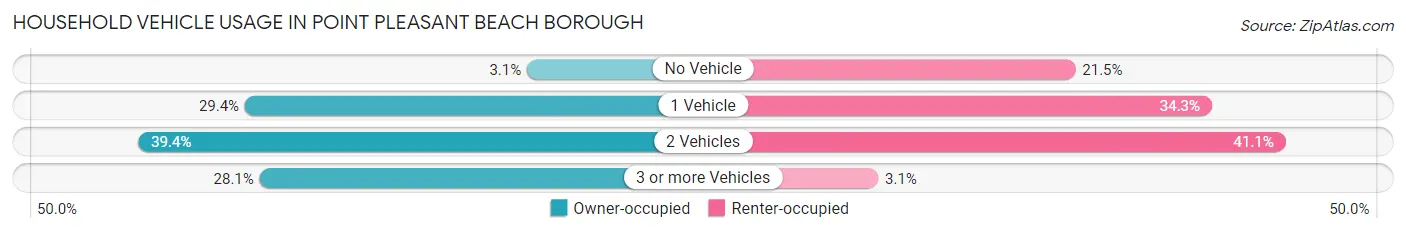
| Vehicles per Household | Owner-occupied | Renter-occupied |
| No Vehicle | 41 (3.1%) | 125 (21.5%) |
| 1 Vehicle | 389 (29.4%) | 199 (34.3%) |
| 2 Vehicles | 521 (39.4%) | 239 (41.1%) |
| 3 or more Vehicles | 371 (28.1%) | 18 (3.1%) |
| Total | 1,322 (100.0%) | 581 (100.0%) |
Real Estate & Mortgages in Point Pleasant Beach borough
Real Estate and Mortgage Overview in Point Pleasant Beach borough
| Characteristic | Without Mortgage | With Mortgage |
| Housing Units | 657 | 665 |
| Median Property Value | $648,100 | $841,800 |
| Median Household Income | $97,891 | $350 |
| Monthly Housing Costs | $1,077 | $456 |
| Real Estate Taxes | $8,461 | $0 |
Property Value by Mortgage Status in Point Pleasant Beach borough
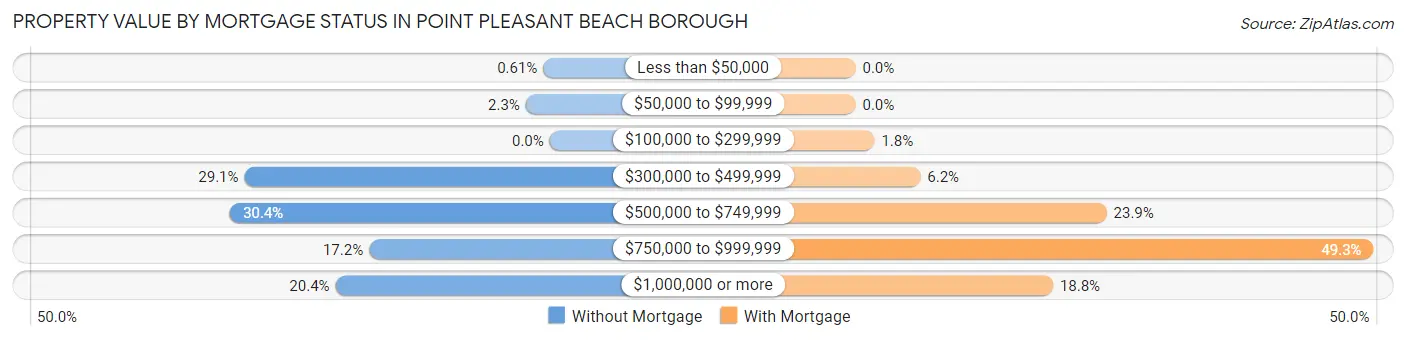
| Property Value | Without Mortgage | With Mortgage |
| Less than $50,000 | 4 (0.6%) | 0 (0.0%) |
| $50,000 to $99,999 | 15 (2.3%) | 0 (0.0%) |
| $100,000 to $299,999 | 0 (0.0%) | 12 (1.8%) |
| $300,000 to $499,999 | 191 (29.1%) | 41 (6.2%) |
| $500,000 to $749,999 | 200 (30.4%) | 159 (23.9%) |
| $750,000 to $999,999 | 113 (17.2%) | 328 (49.3%) |
| $1,000,000 or more | 134 (20.4%) | 125 (18.8%) |
| Total | 657 (100.0%) | 665 (100.0%) |
Household Income by Mortgage Status in Point Pleasant Beach borough
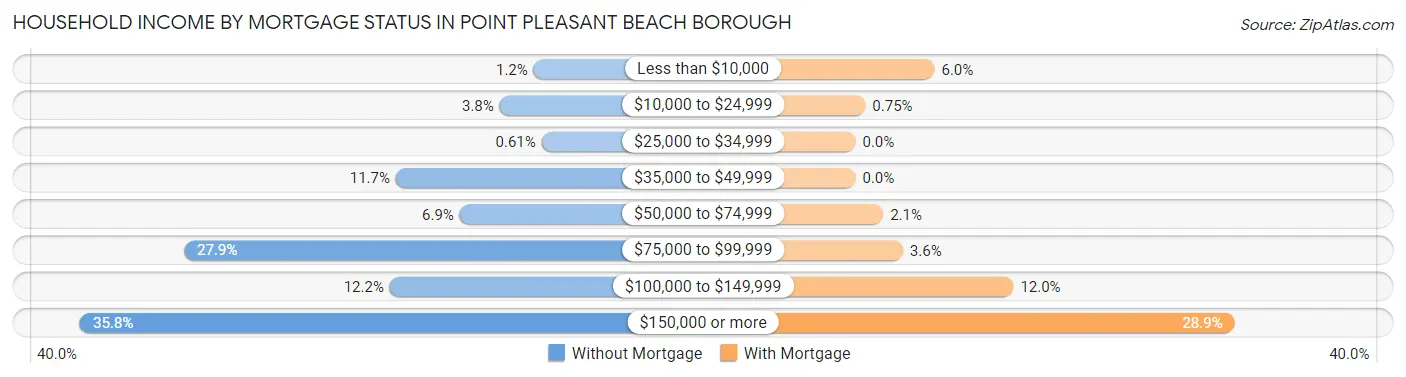
| Household Income | Without Mortgage | With Mortgage |
| Less than $10,000 | 8 (1.2%) | 40 (6.0%) |
| $10,000 to $24,999 | 25 (3.8%) | 5 (0.7%) |
| $25,000 to $34,999 | 4 (0.6%) | 0 (0.0%) |
| $35,000 to $49,999 | 77 (11.7%) | 0 (0.0%) |
| $50,000 to $74,999 | 45 (6.9%) | 14 (2.1%) |
| $75,000 to $99,999 | 183 (27.9%) | 24 (3.6%) |
| $100,000 to $149,999 | 80 (12.2%) | 80 (12.0%) |
| $150,000 or more | 235 (35.8%) | 192 (28.9%) |
| Total | 657 (100.0%) | 665 (100.0%) |
Property Value to Household Income Ratio in Point Pleasant Beach borough
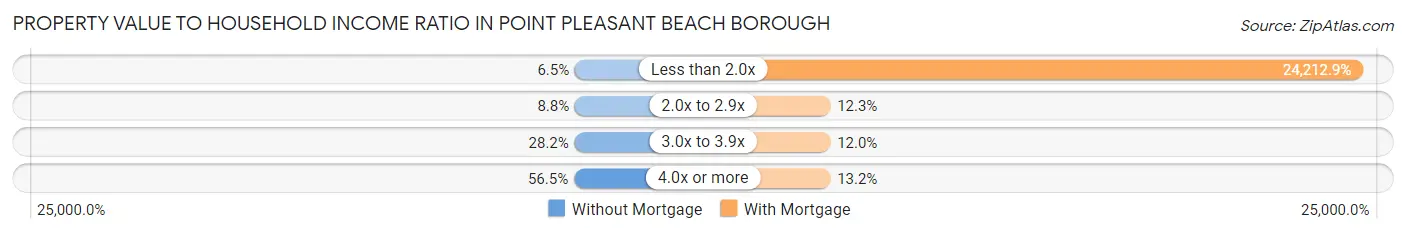
| Value-to-Income Ratio | Without Mortgage | With Mortgage |
| Less than 2.0x | 43 (6.5%) | 161,016 (24,212.9%) |
| 2.0x to 2.9x | 58 (8.8%) | 82 (12.3%) |
| 3.0x to 3.9x | 185 (28.2%) | 80 (12.0%) |
| 4.0x or more | 371 (56.5%) | 88 (13.2%) |
| Total | 657 (100.0%) | 665 (100.0%) |
Real Estate Taxes by Mortgage Status in Point Pleasant Beach borough
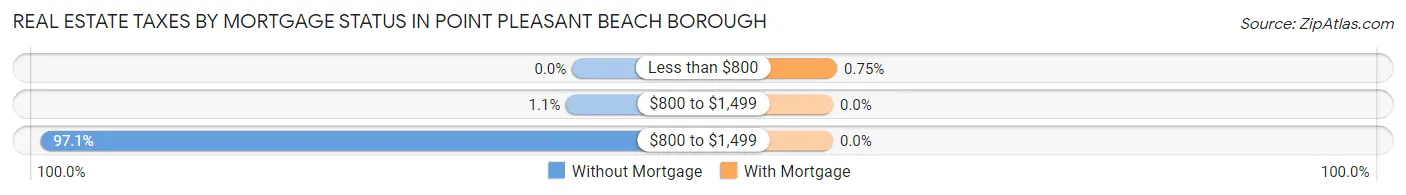
| Property Taxes | Without Mortgage | With Mortgage |
| Less than $800 | 0 (0.0%) | 5 (0.7%) |
| $800 to $1,499 | 7 (1.1%) | 0 (0.0%) |
| $800 to $1,499 | 638 (97.1%) | 0 (0.0%) |
| Total | 657 (100.0%) | 665 (100.0%) |
Health & Disability in Point Pleasant Beach borough
Health Insurance Coverage by Age in Point Pleasant Beach borough
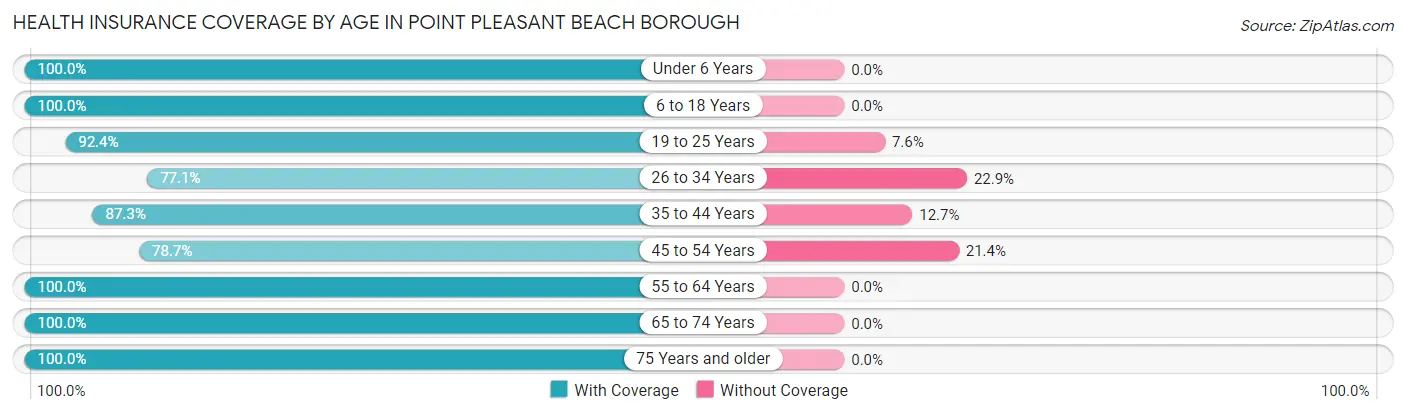
| Age Bracket | With Coverage | Without Coverage |
| Under 6 Years | 112 (100.0%) | 0 (0.0%) |
| 6 to 18 Years | 625 (100.0%) | 0 (0.0%) |
| 19 to 25 Years | 499 (92.4%) | 41 (7.6%) |
| 26 to 34 Years | 253 (77.1%) | 75 (22.9%) |
| 35 to 44 Years | 434 (87.3%) | 63 (12.7%) |
| 45 to 54 Years | 571 (78.6%) | 155 (21.3%) |
| 55 to 64 Years | 752 (100.0%) | 0 (0.0%) |
| 65 to 74 Years | 571 (100.0%) | 0 (0.0%) |
| 75 Years and older | 563 (100.0%) | 0 (0.0%) |
| Total | 4,380 (92.9%) | 334 (7.1%) |
Health Insurance Coverage by Citizenship Status in Point Pleasant Beach borough
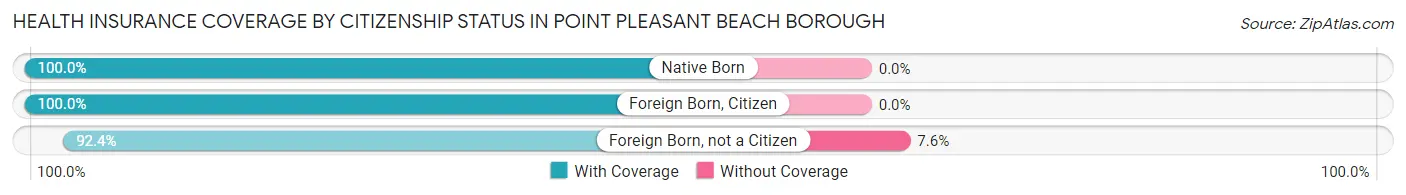
| Citizenship Status | With Coverage | Without Coverage |
| Native Born | 112 (100.0%) | 0 (0.0%) |
| Foreign Born, Citizen | 625 (100.0%) | 0 (0.0%) |
| Foreign Born, not a Citizen | 499 (92.4%) | 41 (7.6%) |
Health Insurance Coverage by Household Income in Point Pleasant Beach borough
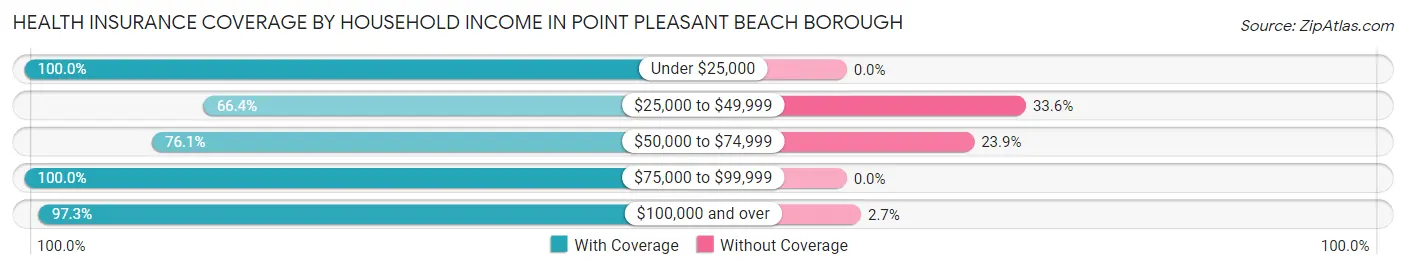
| Household Income | With Coverage | Without Coverage |
| Under $25,000 | 82 (100.0%) | 0 (0.0%) |
| $25,000 to $49,999 | 285 (66.4%) | 144 (33.6%) |
| $50,000 to $74,999 | 341 (76.1%) | 107 (23.9%) |
| $75,000 to $99,999 | 915 (100.0%) | 0 (0.0%) |
| $100,000 and over | 2,693 (97.3%) | 74 (2.7%) |
Public vs Private Health Insurance Coverage by Age in Point Pleasant Beach borough
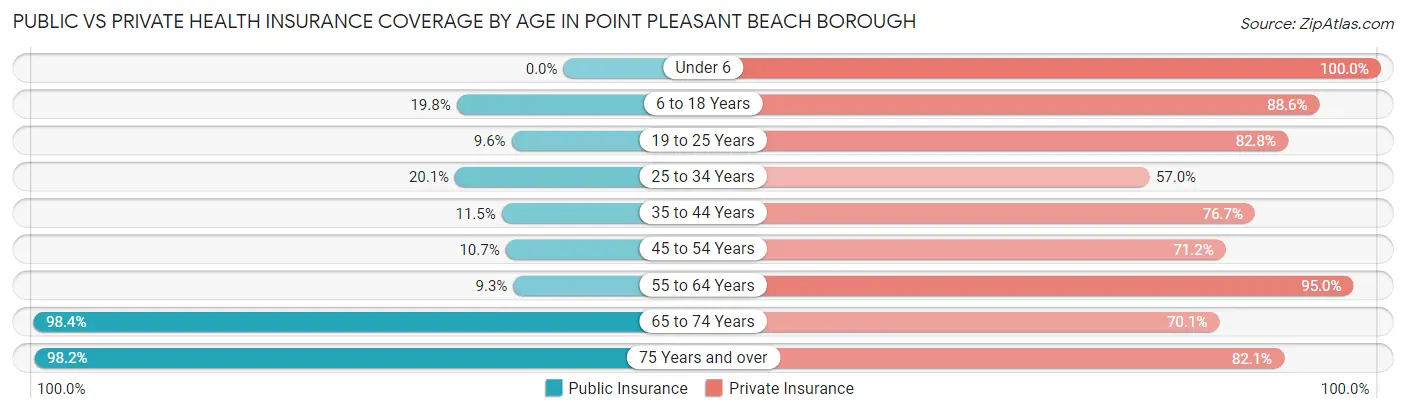
| Age Bracket | Public Insurance | Private Insurance |
| Under 6 | 0 (0.0%) | 112 (100.0%) |
| 6 to 18 Years | 124 (19.8%) | 554 (88.6%) |
| 19 to 25 Years | 52 (9.6%) | 447 (82.8%) |
| 25 to 34 Years | 66 (20.1%) | 187 (57.0%) |
| 35 to 44 Years | 57 (11.5%) | 381 (76.7%) |
| 45 to 54 Years | 78 (10.7%) | 517 (71.2%) |
| 55 to 64 Years | 70 (9.3%) | 714 (95.0%) |
| 65 to 74 Years | 562 (98.4%) | 400 (70.1%) |
| 75 Years and over | 553 (98.2%) | 462 (82.1%) |
| Total | 1,562 (33.1%) | 3,774 (80.1%) |
Disability Status by Sex by Age in Point Pleasant Beach borough
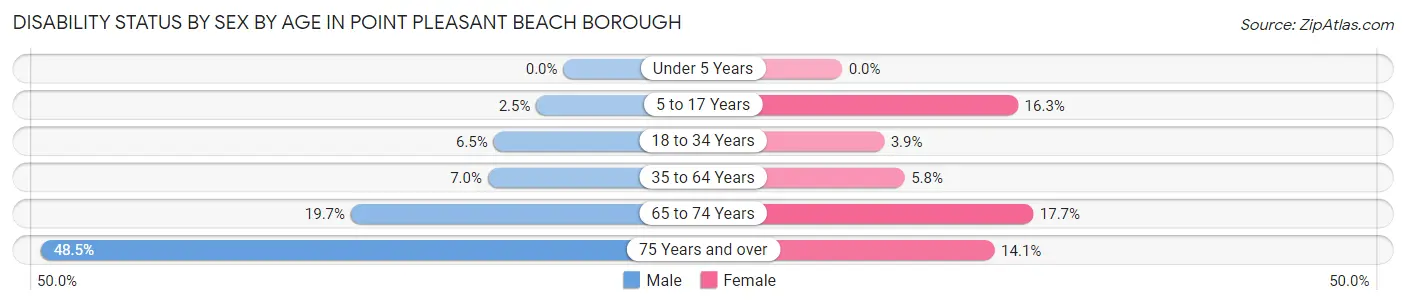
| Age Bracket | Male | Female |
| Under 5 Years | 0 (0.0%) | 0 (0.0%) |
| 5 to 17 Years | 8 (2.5%) | 39 (16.3%) |
| 18 to 34 Years | 31 (6.5%) | 18 (3.9%) |
| 35 to 64 Years | 73 (7.0%) | 54 (5.8%) |
| 65 to 74 Years | 57 (19.7%) | 50 (17.7%) |
| 75 Years and over | 129 (48.5%) | 42 (14.1%) |
Disability Class by Sex by Age in Point Pleasant Beach borough
Disability Class: Hearing Difficulty
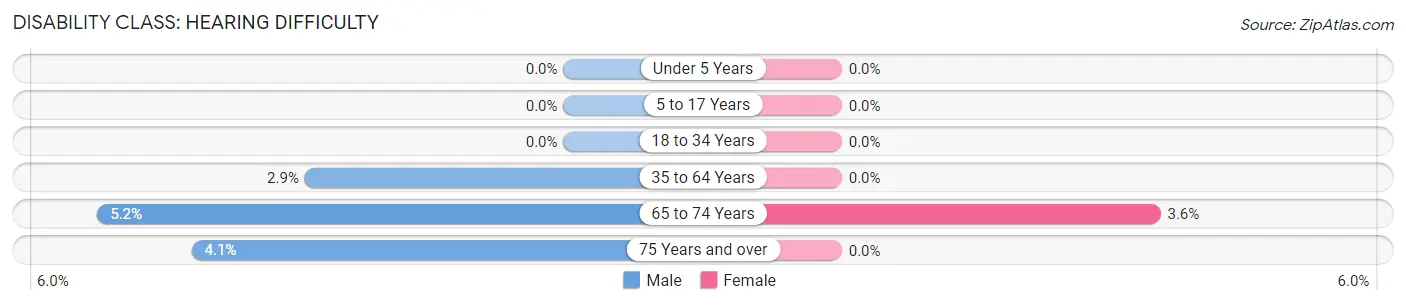
| Age Bracket | Male | Female |
| Under 5 Years | 0 (0.0%) | 0 (0.0%) |
| 5 to 17 Years | 0 (0.0%) | 0 (0.0%) |
| 18 to 34 Years | 0 (0.0%) | 0 (0.0%) |
| 35 to 64 Years | 30 (2.9%) | 0 (0.0%) |
| 65 to 74 Years | 15 (5.2%) | 10 (3.5%) |
| 75 Years and over | 11 (4.1%) | 0 (0.0%) |
Disability Class: Vision Difficulty
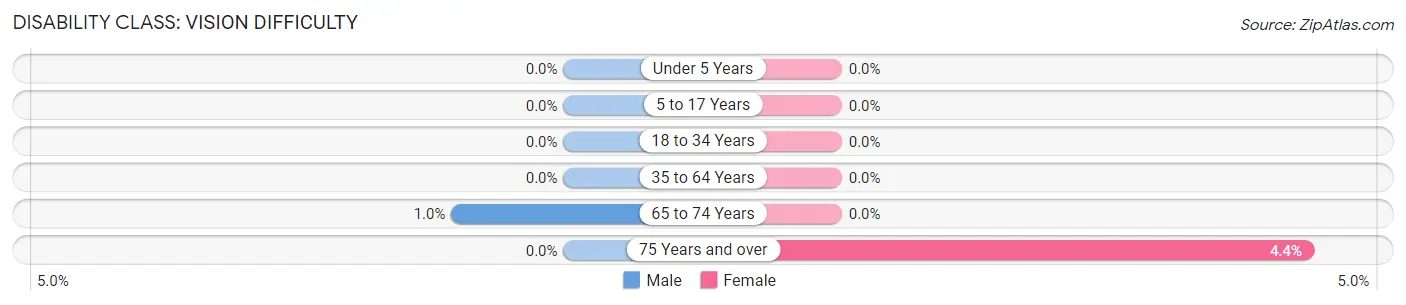
| Age Bracket | Male | Female |
| Under 5 Years | 0 (0.0%) | 0 (0.0%) |
| 5 to 17 Years | 0 (0.0%) | 0 (0.0%) |
| 18 to 34 Years | 0 (0.0%) | 0 (0.0%) |
| 35 to 64 Years | 0 (0.0%) | 0 (0.0%) |
| 65 to 74 Years | 3 (1.0%) | 0 (0.0%) |
| 75 Years and over | 0 (0.0%) | 13 (4.4%) |
Disability Class: Cognitive Difficulty
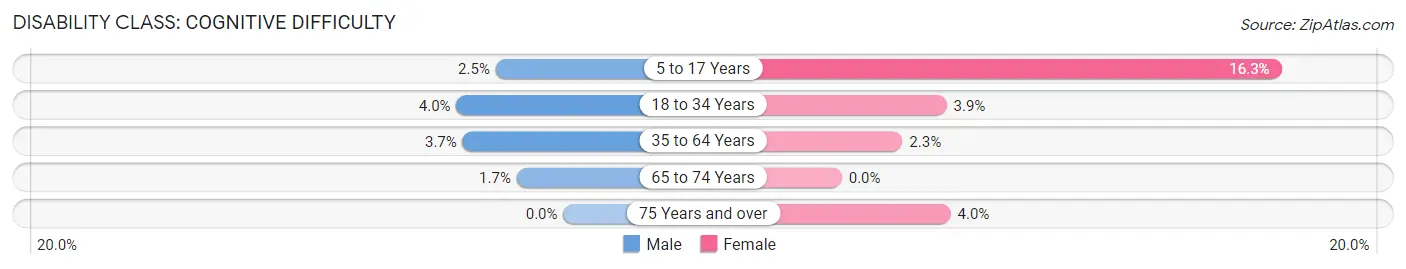
| Age Bracket | Male | Female |
| 5 to 17 Years | 8 (2.5%) | 39 (16.3%) |
| 18 to 34 Years | 19 (4.0%) | 18 (3.9%) |
| 35 to 64 Years | 39 (3.7%) | 21 (2.2%) |
| 65 to 74 Years | 5 (1.7%) | 0 (0.0%) |
| 75 Years and over | 0 (0.0%) | 12 (4.0%) |
Disability Class: Ambulatory Difficulty
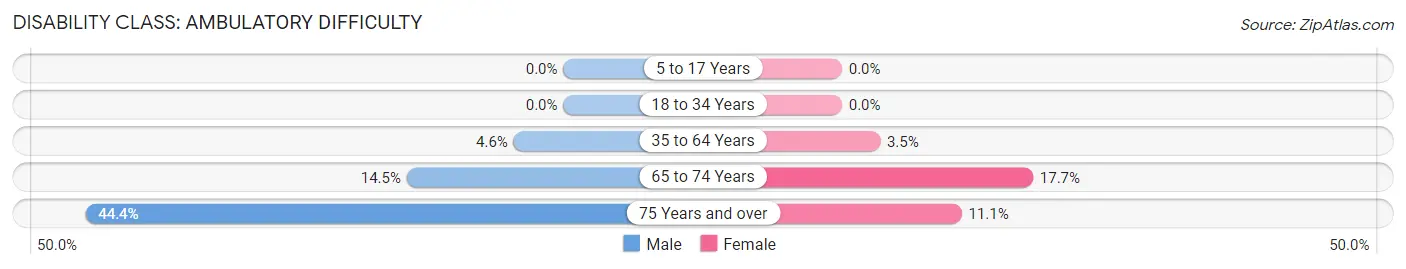
| Age Bracket | Male | Female |
| 5 to 17 Years | 0 (0.0%) | 0 (0.0%) |
| 18 to 34 Years | 0 (0.0%) | 0 (0.0%) |
| 35 to 64 Years | 48 (4.6%) | 33 (3.5%) |
| 65 to 74 Years | 42 (14.5%) | 50 (17.7%) |
| 75 Years and over | 118 (44.4%) | 33 (11.1%) |
Disability Class: Self-Care Difficulty
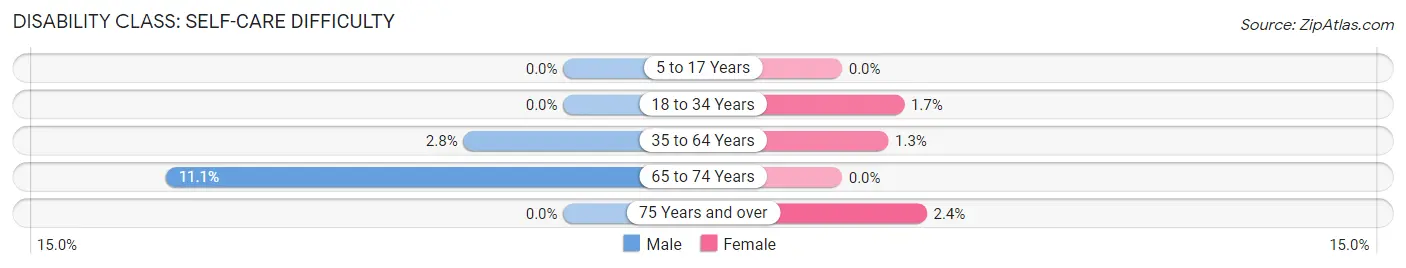
| Age Bracket | Male | Female |
| 5 to 17 Years | 0 (0.0%) | 0 (0.0%) |
| 18 to 34 Years | 0 (0.0%) | 8 (1.7%) |
| 35 to 64 Years | 29 (2.8%) | 12 (1.3%) |
| 65 to 74 Years | 32 (11.1%) | 0 (0.0%) |
| 75 Years and over | 0 (0.0%) | 7 (2.4%) |
Technology Access in Point Pleasant Beach borough
Computing Device Access in Point Pleasant Beach borough
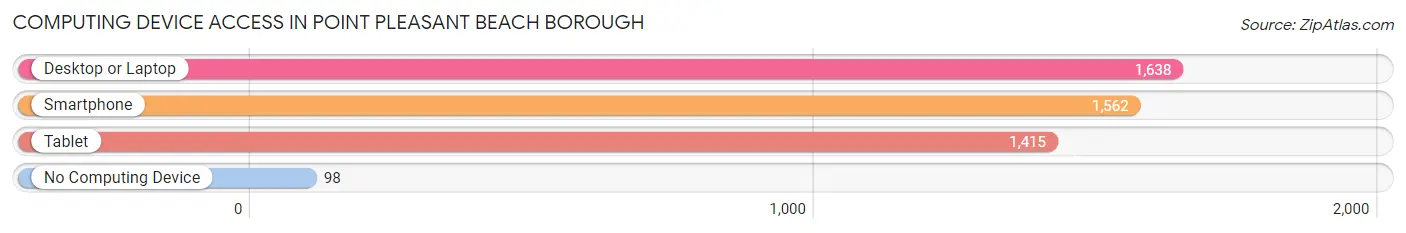
| Device Type | # Households | % Households |
| Desktop or Laptop | 1,638 | 86.1% |
| Smartphone | 1,562 | 82.1% |
| Tablet | 1,415 | 74.4% |
| No Computing Device | 98 | 5.1% |
| Total | 1,903 | 100.0% |
Internet Access in Point Pleasant Beach borough
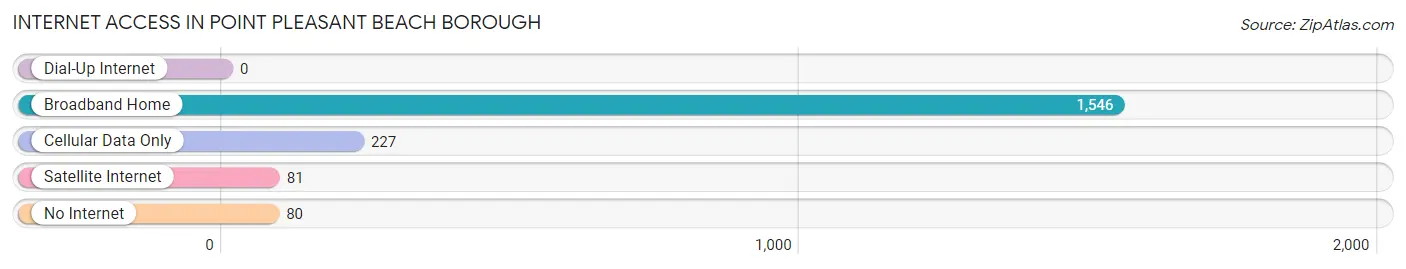
| Internet Type | # Households | % Households |
| Dial-Up Internet | 0 | 0.0% |
| Broadband Home | 1,546 | 81.2% |
| Cellular Data Only | 227 | 11.9% |
| Satellite Internet | 81 | 4.3% |
| No Internet | 80 | 4.2% |
| Total | 1,903 | 100.0% |
Point Pleasant Beach borough Summary
Point Pleasant Beach Borough is a small borough located in Ocean County, New Jersey. It is situated on the Barnegat Peninsula, a barrier island that separates the Atlantic Ocean from Barnegat Bay. The borough is bordered by the towns of Bay Head and Mantoloking to the north, Brick Township to the west, and the Atlantic Ocean to the east. The borough has a total area of 1.9 square miles, all of which is land.
History
The area that is now Point Pleasant Beach was originally inhabited by the Lenape Native Americans. The first European settlers arrived in the area in the late 1600s. The area was originally part of Shrewsbury Township, which was established in 1693. In 1879, the area was incorporated as a borough and named Point Pleasant Beach.
The borough was a popular summer destination for many years, and it was known for its boardwalk and amusement park. The boardwalk was destroyed by a major storm in 1944, but it was rebuilt and remains a popular attraction today. The amusement park closed in 1986, but the area still attracts many visitors each year.
Geography
Point Pleasant Beach is located on the Barnegat Peninsula, a barrier island that separates the Atlantic Ocean from Barnegat Bay. The borough has a total area of 1.9 square miles, all of which is land. The borough is bordered by the towns of Bay Head and Mantoloking to the north, Brick Township to the west, and the Atlantic Ocean to the east.
The borough is located in a humid subtropical climate zone, with hot, humid summers and mild winters. The average temperature in the summer is around 75°F, and the average temperature in the winter is around 40°F. The average annual precipitation is around 45 inches.
Economy
The economy of Point Pleasant Beach is largely based on tourism. The borough is a popular summer destination, and it is known for its boardwalk and beaches. The borough also has a number of restaurants, bars, and shops that cater to tourists.
The borough also has a number of businesses that provide services to the local community. These include medical and dental offices, banks, and other professional services.
Demographics
As of the 2010 census, the borough had a population of 4,665. The racial makeup of the borough was 94.3% White, 1.7% African American, 0.2% Native American, 1.2% Asian, 0.1% Pacific Islander, 1.2% from other races, and 1.3% from two or more races. Hispanic or Latino of any race were 5.2% of the population.
The median household income in the borough was $68,958, and the median family income was $77,917. The per capita income was $35,945. About 4.3% of families and 5.7% of the population were below the poverty line.
Conclusion
Point Pleasant Beach Borough is a small borough located in Ocean County, New Jersey. It is situated on the Barnegat Peninsula, a barrier island that separates the Atlantic Ocean from Barnegat Bay. The borough has a total area of 1.9 square miles, all of which is land. The borough has a long history, and it was originally inhabited by the Lenape Native Americans. The borough is a popular summer destination, and it is known for its boardwalk and beaches. The economy of the borough is largely based on tourism, and it also has a number of businesses that provide services to the local community. As of the 2010 census, the borough had a population of 4,665. The median household income in the borough was $68,958, and the median family income was $77,917.
Common Questions
What is Per Capita Income in Point Pleasant Beach borough?
Per Capita income in Point Pleasant Beach borough is $71,222.
What is the Median Family Income in Point Pleasant Beach borough?
Median Family Income in Point Pleasant Beach borough is $139,074.
What is the Median Household income in Point Pleasant Beach borough?
Median Household Income in Point Pleasant Beach borough is $119,647.
What is Income or Wage Gap in Point Pleasant Beach borough?
Income or Wage Gap in Point Pleasant Beach borough is 28.4%.
Women in Point Pleasant Beach borough earn 71.6 cents for every dollar earned by a man.
What is Inequality or Gini Index in Point Pleasant Beach borough?
Inequality or Gini Index in Point Pleasant Beach borough is 0.48.
What is the Total Population of Point Pleasant Beach borough?
Total Population of Point Pleasant Beach borough is 4,786.
What is the Total Male Population of Point Pleasant Beach borough?
Total Male Population of Point Pleasant Beach borough is 2,505.
What is the Total Female Population of Point Pleasant Beach borough?
Total Female Population of Point Pleasant Beach borough is 2,281.
What is the Ratio of Males per 100 Females in Point Pleasant Beach borough?
There are 109.82 Males per 100 Females in Point Pleasant Beach borough.
What is the Ratio of Females per 100 Males in Point Pleasant Beach borough?
There are 91.06 Females per 100 Males in Point Pleasant Beach borough.
What is the Median Population Age in Point Pleasant Beach borough?
Median Population Age in Point Pleasant Beach borough is 47.9 Years.
What is the Average Family Size in Point Pleasant Beach borough
Average Family Size in Point Pleasant Beach borough is 2.8 People.
What is the Average Household Size in Point Pleasant Beach borough
Average Household Size in Point Pleasant Beach borough is 2.5 People.
How Large is the Labor Force in Point Pleasant Beach borough?
There are 2,789 People in the Labor Forcein in Point Pleasant Beach borough.
What is the Percentage of People in the Labor Force in Point Pleasant Beach borough?
65.2% of People are in the Labor Force in Point Pleasant Beach borough.
What is the Unemployment Rate in Point Pleasant Beach borough?
Unemployment Rate in Point Pleasant Beach borough is 8.5%.