Zip Codes with the Highest Percentage of Population Employed in Food Preparation & Serving in Princeton, NJ
RELATED REPORTS & OPTIONS
Food Preparation & Serving
Princeton
Compare Zip Codes
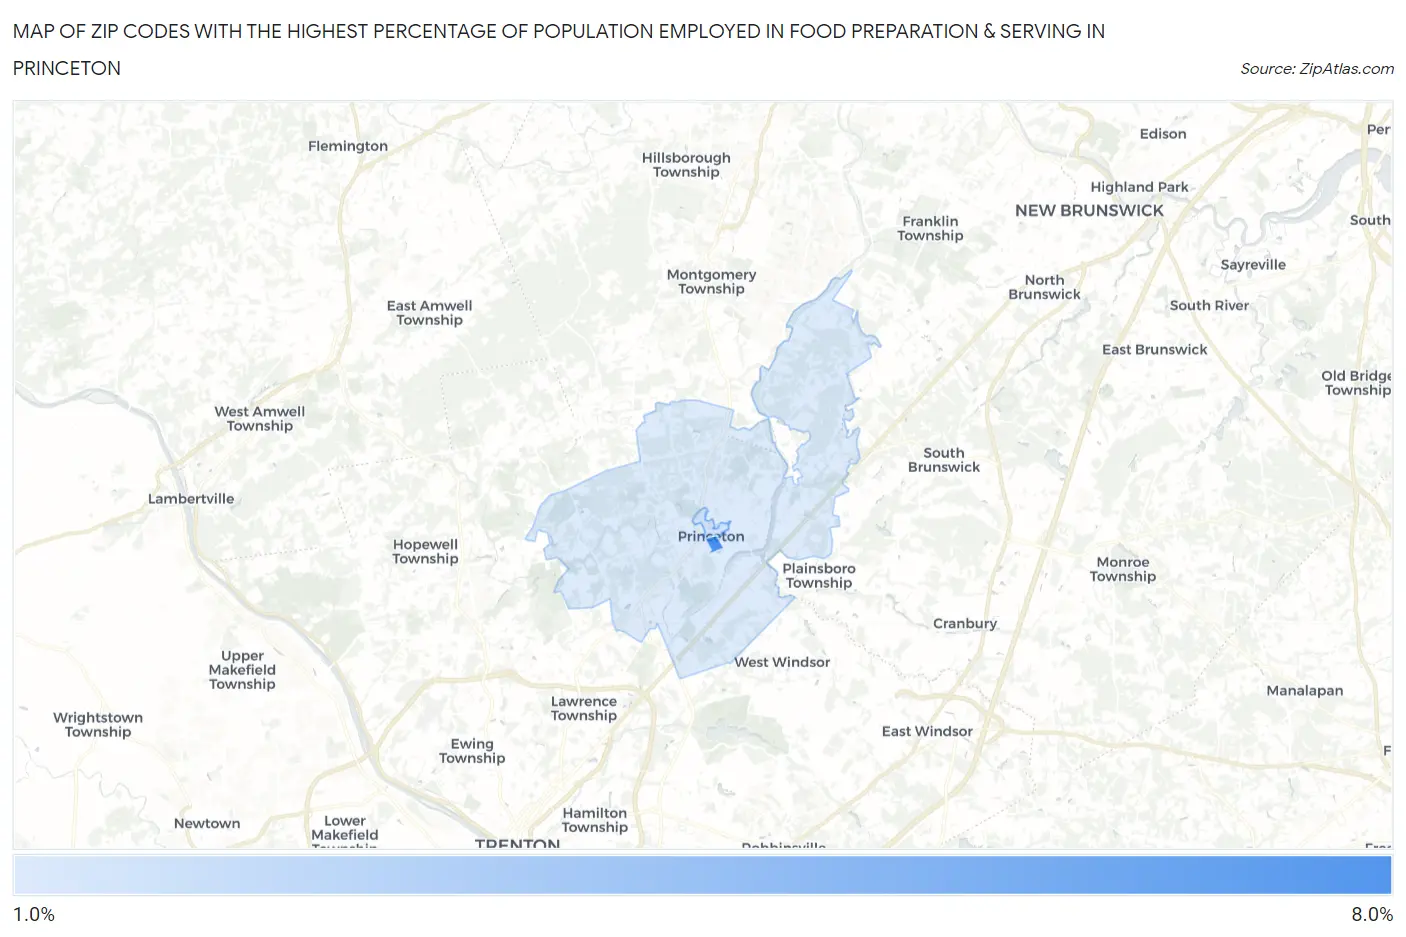
Map of Zip Codes with the Highest Percentage of Population Employed in Food Preparation & Serving in Princeton
1.9%
7.4%
Zip Codes with the Highest Percentage of Population Employed in Food Preparation & Serving in Princeton, NJ
| Zip Code | % Employed | vs State | vs National | |
| 1. | 08544 | 7.4% | 4.0%(+3.49)#48 | 5.3%(+2.16)#5,655 |
| 2. | 08542 | 2.4% | 4.0%(-1.56)#401 | 5.3%(-2.88)#23,451 |
| 3. | 08540 | 1.9% | 4.0%(-2.06)#454 | 5.3%(-3.39)#25,002 |
1
Common Questions
What are the Top Zip Codes with the Highest Percentage of Population Employed in Food Preparation & Serving in Princeton, NJ?
Top Zip Codes with the Highest Percentage of Population Employed in Food Preparation & Serving in Princeton, NJ are:
What zip code has the Highest Percentage of Population Employed in Food Preparation & Serving in Princeton, NJ?
08544 has the Highest Percentage of Population Employed in Food Preparation & Serving in Princeton, NJ with 7.4%.
What is the Percentage of Population Employed in Food Preparation & Serving in Princeton, NJ?
Percentage of Population Employed in Food Preparation & Serving in Princeton is 2.4%.
What is the Percentage of Population Employed in Food Preparation & Serving in New Jersey?
Percentage of Population Employed in Food Preparation & Serving in New Jersey is 4.0%.
What is the Percentage of Population Employed in Food Preparation & Serving in the United States?
Percentage of Population Employed in Food Preparation & Serving in the United States is 5.3%.