Milford borough, NJ Map & Demographics
Milford borough Overview
$45,514
PER CAPITA INCOME
$107,917
AVG FAMILY INCOME
$89,196
AVG HOUSEHOLD INCOME
29.8%
WAGE / INCOME GAP [ % ]
70.2¢/ $1
WAGE / INCOME GAP [ $ ]
0.39
INEQUALITY / GINI INDEX
1,244
TOTAL POPULATION
598
MALE POPULATION
646
FEMALE POPULATION
92.57
MALES / 100 FEMALES
108.03
FEMALES / 100 MALES
48.9
MEDIAN AGE
2.7
AVG FAMILY SIZE
2.4
AVG HOUSEHOLD SIZE
696
LABOR FORCE [ PEOPLE ]
65.0%
PERCENT IN LABOR FORCE
7.3%
UNEMPLOYMENT RATE
Income in Milford borough
Income Overview in Milford borough
Per Capita Income in Milford borough is $45,514, while median incomes of families and households are $107,917 and $89,196 respectively.
| Characteristic | Number | Measure |
| Per Capita Income | 1,244 | $45,514 |
| Median Family Income | 360 | $107,917 |
| Mean Family Income | 360 | $119,186 |
| Median Household Income | 525 | $89,196 |
| Mean Household Income | 525 | $105,959 |
| Income Deficit | 360 | $0 |
| Wage / Income Gap (%) | 1,244 | 29.79% |
| Wage / Income Gap ($) | 1,244 | 70.21¢ per $1 |
| Gini / Inequality Index | 1,244 | 0.39 |
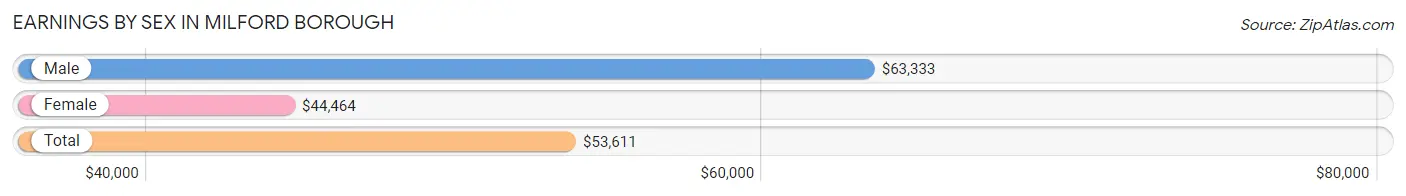
Earnings by Sex in Milford borough
Average Earnings in Milford borough are $53,611, $63,333 for men and $44,464 for women, a difference of 29.8%.
| Sex | Number | Average Earnings |
| Male | 294 (43.5%) | $63,333 |
| Female | 382 (56.5%) | $44,464 |
| Total | 676 (100.0%) | $53,611 |
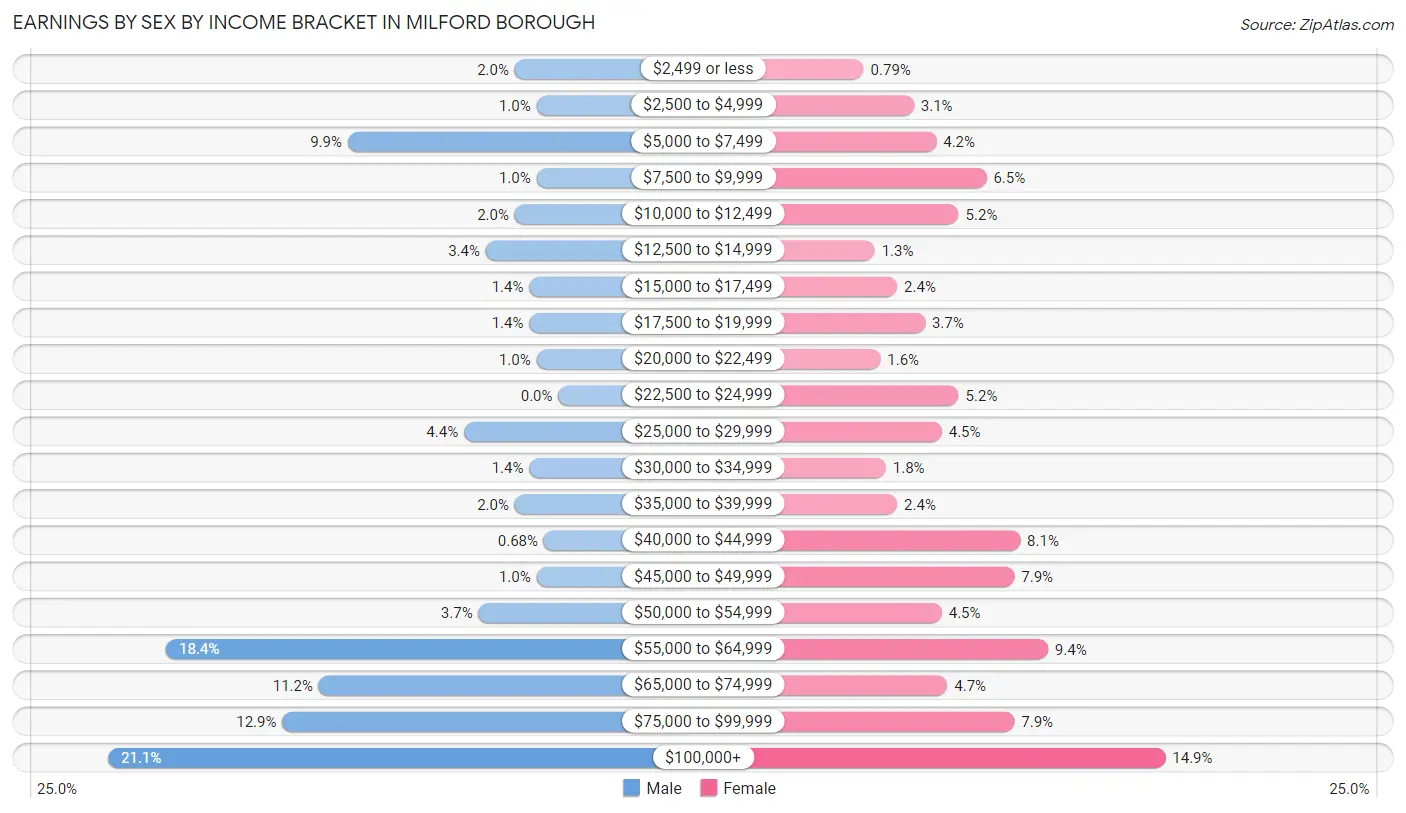
Earnings by Sex by Income Bracket in Milford borough
The most common earnings brackets in Milford borough are $100,000+ for men (62 | 21.1%) and $100,000+ for women (57 | 14.9%).
| Income | Male | Female |
| $2,499 or less | 6 (2.0%) | 3 (0.8%) |
| $2,500 to $4,999 | 3 (1.0%) | 12 (3.1%) |
| $5,000 to $7,499 | 29 (9.9%) | 16 (4.2%) |
| $7,500 to $9,999 | 3 (1.0%) | 25 (6.5%) |
| $10,000 to $12,499 | 6 (2.0%) | 20 (5.2%) |
| $12,500 to $14,999 | 10 (3.4%) | 5 (1.3%) |
| $15,000 to $17,499 | 4 (1.4%) | 9 (2.4%) |
| $17,500 to $19,999 | 4 (1.4%) | 14 (3.7%) |
| $20,000 to $22,499 | 3 (1.0%) | 6 (1.6%) |
| $22,500 to $24,999 | 0 (0.0%) | 20 (5.2%) |
| $25,000 to $29,999 | 13 (4.4%) | 17 (4.4%) |
| $30,000 to $34,999 | 4 (1.4%) | 7 (1.8%) |
| $35,000 to $39,999 | 6 (2.0%) | 9 (2.4%) |
| $40,000 to $44,999 | 2 (0.7%) | 31 (8.1%) |
| $45,000 to $49,999 | 3 (1.0%) | 30 (7.9%) |
| $50,000 to $54,999 | 11 (3.7%) | 17 (4.4%) |
| $55,000 to $64,999 | 54 (18.4%) | 36 (9.4%) |
| $65,000 to $74,999 | 33 (11.2%) | 18 (4.7%) |
| $75,000 to $99,999 | 38 (12.9%) | 30 (7.9%) |
| $100,000+ | 62 (21.1%) | 57 (14.9%) |
| Total | 294 (100.0%) | 382 (100.0%) |
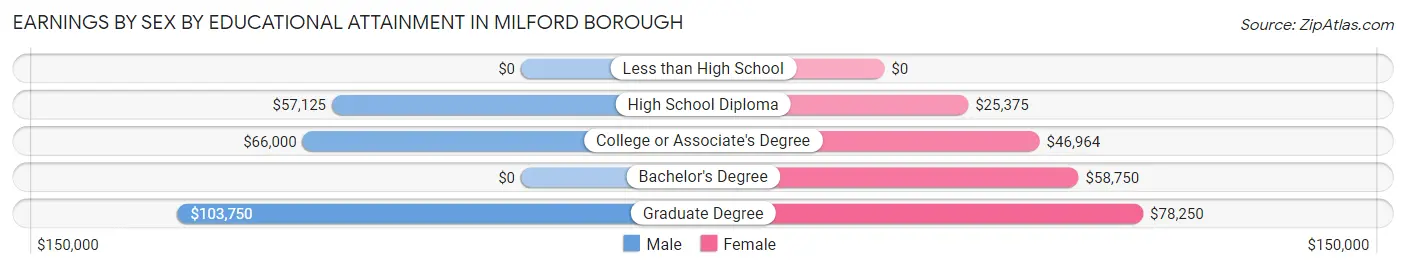
Earnings by Sex by Educational Attainment in Milford borough
Average earnings in Milford borough are $64,881 for men and $47,083 for women, a difference of 27.4%. Men with an educational attainment of graduate degree enjoy the highest average annual earnings of $103,750, while those with high school diploma education earn the least with $57,125. Women with an educational attainment of graduate degree earn the most with the average annual earnings of $78,250, while those with high school diploma education have the smallest earnings of $25,375.
| Educational Attainment | Male Income | Female Income |
| Less than High School | - | - |
| High School Diploma | $57,125 | $25,375 |
| College or Associate's Degree | $66,000 | $46,964 |
| Bachelor's Degree | - | - |
| Graduate Degree | $103,750 | $78,250 |
| Total | $64,881 | $47,083 |
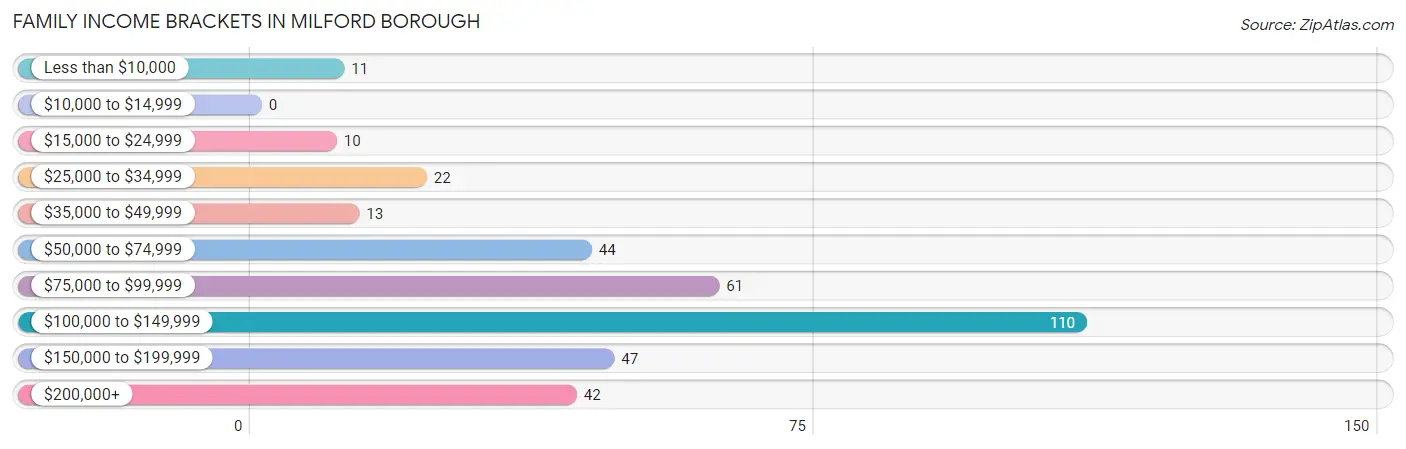
Family Income in Milford borough
Family Income Brackets in Milford borough
According to the Milford borough family income data, there are 110 families falling into the $100,000 to $149,999 income range, which is the most common income bracket and makes up 30.6% of all families.
| Income Bracket | # Families | % Families |
| Less than $10,000 | 11 | 3.1% |
| $10,000 to $14,999 | 0 | 0.0% |
| $15,000 to $24,999 | 10 | 2.8% |
| $25,000 to $34,999 | 22 | 6.1% |
| $35,000 to $49,999 | 13 | 3.6% |
| $50,000 to $74,999 | 44 | 12.2% |
| $75,000 to $99,999 | 61 | 16.9% |
| $100,000 to $149,999 | 110 | 30.6% |
| $150,000 to $199,999 | 47 | 13.1% |
| $200,000+ | 42 | 11.7% |
Family Income by Famaliy Size in Milford borough
5-person families (12 | 3.3%) account for the highest median family income in Milford borough with $181,250 per family, while 2-person families (235 | 65.3%) have the highest median income of $47,938 per family member.
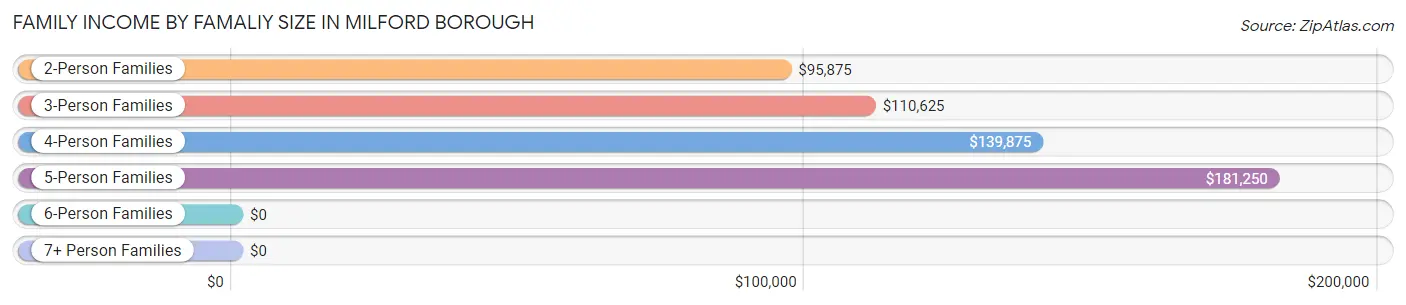
| Income Bracket | # Families | Median Income |
| 2-Person Families | 235 (65.3%) | $95,875 |
| 3-Person Families | 48 (13.3%) | $110,625 |
| 4-Person Families | 57 (15.8%) | $139,875 |
| 5-Person Families | 12 (3.3%) | $181,250 |
| 6-Person Families | 2 (0.6%) | $0 |
| 7+ Person Families | 6 (1.7%) | $0 |
| Total | 360 (100.0%) | $107,917 |
Family Income by Number of Earners in Milford borough
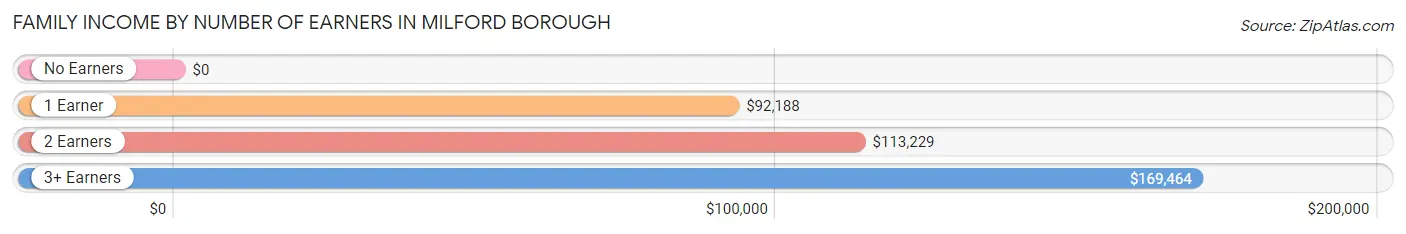
| Number of Earners | # Families | Median Income |
| No Earners | 64 (17.8%) | $0 |
| 1 Earner | 128 (35.6%) | $92,188 |
| 2 Earners | 145 (40.3%) | $113,229 |
| 3+ Earners | 23 (6.4%) | $169,464 |
| Total | 360 (100.0%) | $107,917 |
Household Income in Milford borough
Household Income Brackets in Milford borough
With 125 households falling in the category, the $100,000 to $149,999 income range is the most frequent in Milford borough, accounting for 23.8% of all households. In contrast, only 11 households (2.1%) fall into the less than $10,000 income bracket, making it the least populous group.
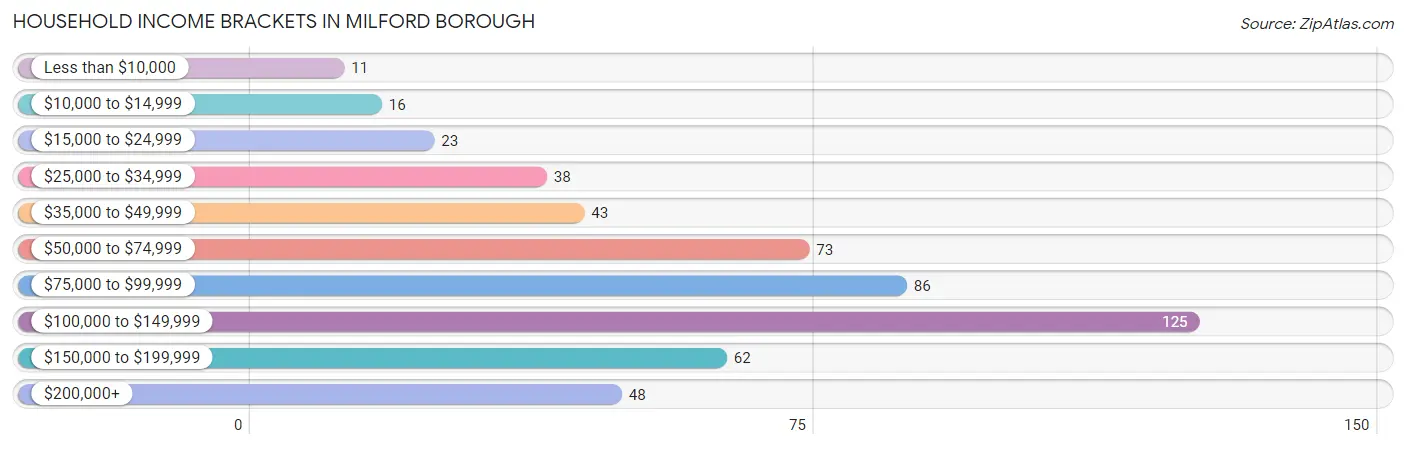
| Income Bracket | # Households | % Households |
| Less than $10,000 | 11 | 2.1% |
| $10,000 to $14,999 | 16 | 3.0% |
| $15,000 to $24,999 | 23 | 4.4% |
| $25,000 to $34,999 | 38 | 7.2% |
| $35,000 to $49,999 | 43 | 8.2% |
| $50,000 to $74,999 | 73 | 13.9% |
| $75,000 to $99,999 | 86 | 16.4% |
| $100,000 to $149,999 | 125 | 23.8% |
| $150,000 to $199,999 | 62 | 11.8% |
| $200,000+ | 48 | 9.1% |
Household Income by Householder Age in Milford borough
The median household income in Milford borough is $89,196, with the highest median household income of $109,242 found in the 45 to 64 years age bracket for the primary householder. A total of 190 households (36.2%) fall into this category. Meanwhile, the 15 to 24 years age bracket for the primary householder has the lowest median household income of $0, with 15 households (2.9%) in this group.
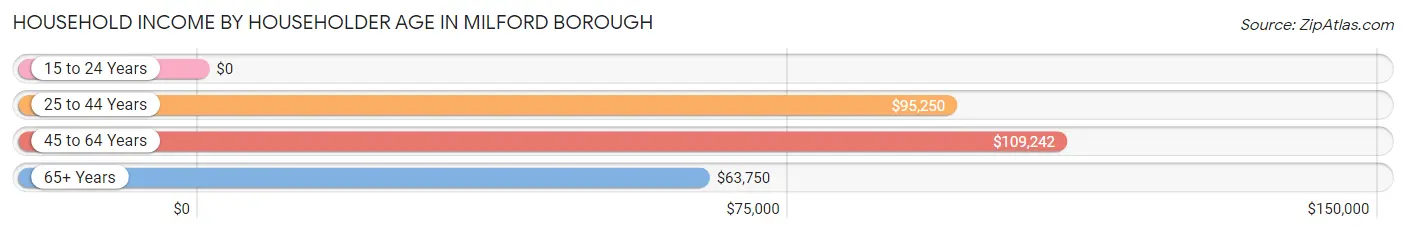
| Income Bracket | # Households | Median Income |
| 15 to 24 Years | 15 (2.9%) | $0 |
| 25 to 44 Years | 144 (27.4%) | $95,250 |
| 45 to 64 Years | 190 (36.2%) | $109,242 |
| 65+ Years | 176 (33.5%) | $63,750 |
| Total | 525 (100.0%) | $89,196 |
Poverty in Milford borough
Income Below Poverty by Sex and Age in Milford borough
With 6.0% poverty level for males and 5.3% for females among the residents of Milford borough, 12 to 14 year old males and 35 to 44 year old females are the most vulnerable to poverty, with 3 males (25.0%) and 16 females (16.8%) in their respective age groups living below the poverty level.
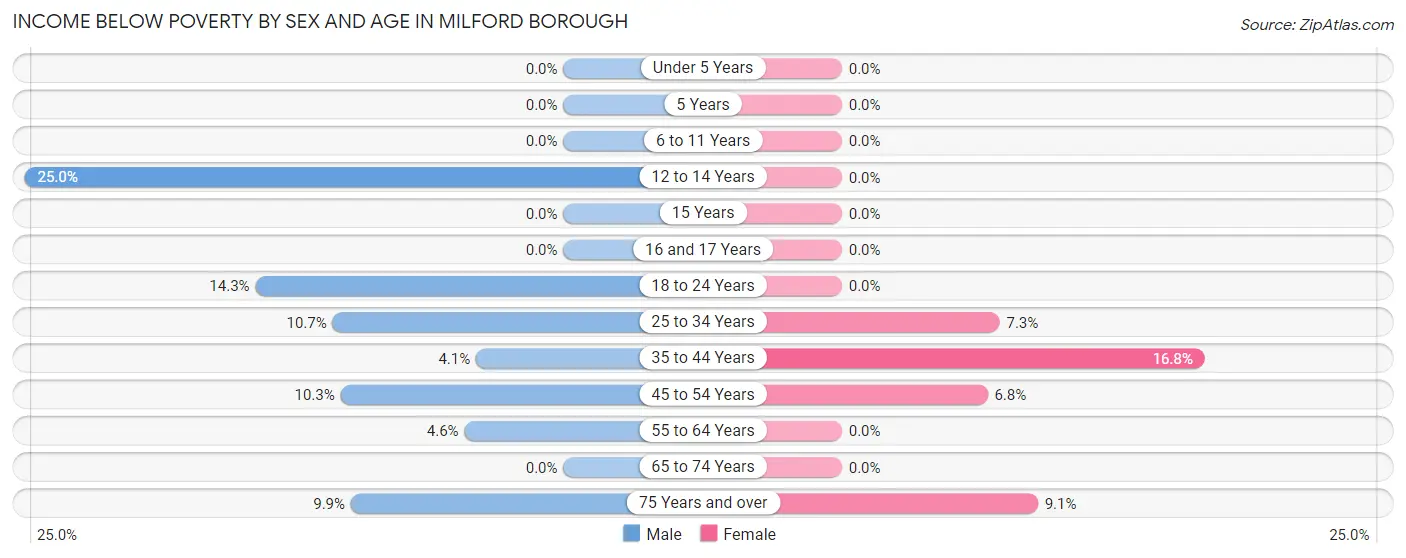
| Age Bracket | Male | Female |
| Under 5 Years | 0 (0.0%) | 0 (0.0%) |
| 5 Years | 0 (0.0%) | 0 (0.0%) |
| 6 to 11 Years | 0 (0.0%) | 0 (0.0%) |
| 12 to 14 Years | 3 (25.0%) | 0 (0.0%) |
| 15 Years | 0 (0.0%) | 0 (0.0%) |
| 16 and 17 Years | 0 (0.0%) | 0 (0.0%) |
| 18 to 24 Years | 6 (14.3%) | 0 (0.0%) |
| 25 to 34 Years | 6 (10.7%) | 6 (7.3%) |
| 35 to 44 Years | 3 (4.1%) | 16 (16.8%) |
| 45 to 54 Years | 6 (10.3%) | 5 (6.8%) |
| 55 to 64 Years | 5 (4.6%) | 0 (0.0%) |
| 65 to 74 Years | 0 (0.0%) | 0 (0.0%) |
| 75 Years and over | 7 (9.9%) | 7 (9.1%) |
| Total | 36 (6.0%) | 34 (5.3%) |
Income Above Poverty by Sex and Age in Milford borough
According to the poverty statistics in Milford borough, males aged under 5 years and females aged under 5 years are the age groups that are most secure financially, with 100.0% of males and 100.0% of females in these age groups living above the poverty line.
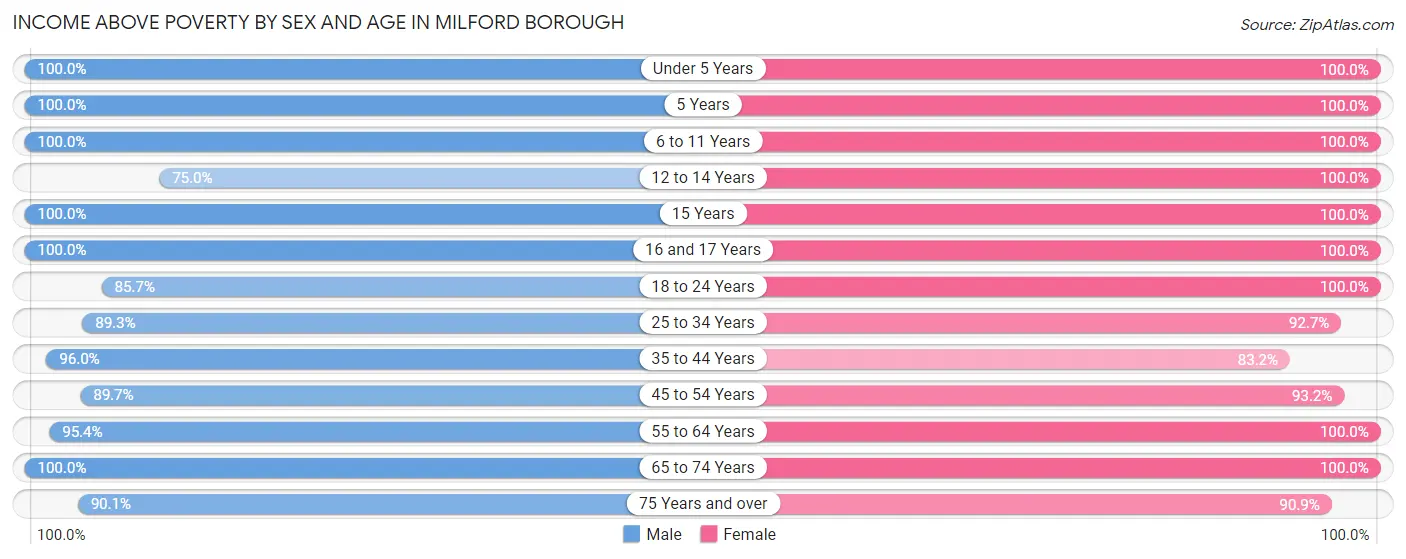
| Age Bracket | Male | Female |
| Under 5 Years | 45 (100.0%) | 21 (100.0%) |
| 5 Years | 16 (100.0%) | 10 (100.0%) |
| 6 to 11 Years | 17 (100.0%) | 34 (100.0%) |
| 12 to 14 Years | 9 (75.0%) | 5 (100.0%) |
| 15 Years | 8 (100.0%) | 5 (100.0%) |
| 16 and 17 Years | 6 (100.0%) | 9 (100.0%) |
| 18 to 24 Years | 36 (85.7%) | 52 (100.0%) |
| 25 to 34 Years | 50 (89.3%) | 76 (92.7%) |
| 35 to 44 Years | 71 (96.0%) | 79 (83.2%) |
| 45 to 54 Years | 52 (89.7%) | 69 (93.2%) |
| 55 to 64 Years | 104 (95.4%) | 91 (100.0%) |
| 65 to 74 Years | 84 (100.0%) | 91 (100.0%) |
| 75 Years and over | 64 (90.1%) | 70 (90.9%) |
| Total | 562 (94.0%) | 612 (94.7%) |
Income Below Poverty Among Married-Couple Families in Milford borough
The poverty statistics for married-couple families in Milford borough show that 2.3% or 7 of the total 309 families live below the poverty line. Families with no children have the highest poverty rate of 3.1%, comprising of 7 families. On the other hand, families with 1 or 2 children have the lowest poverty rate of 0.0%, which includes 0 families.
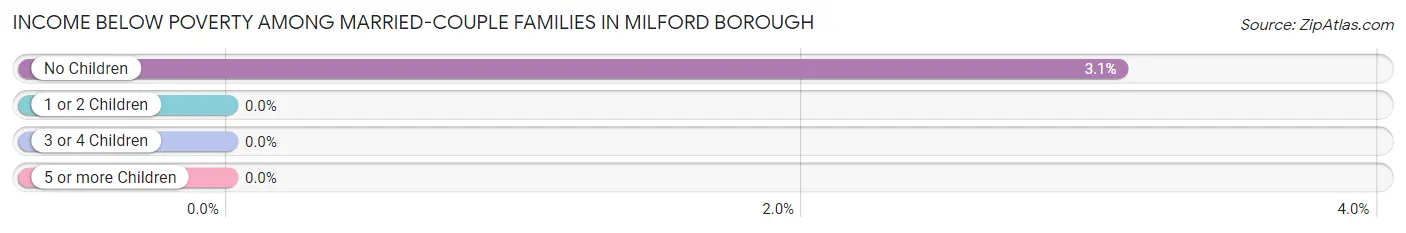
| Children | Above Poverty | Below Poverty |
| No Children | 219 (96.9%) | 7 (3.1%) |
| 1 or 2 Children | 67 (100.0%) | 0 (0.0%) |
| 3 or 4 Children | 10 (100.0%) | 0 (0.0%) |
| 5 or more Children | 6 (100.0%) | 0 (0.0%) |
| Total | 302 (97.7%) | 7 (2.3%) |
Income Below Poverty Among Single-Parent Households in Milford borough
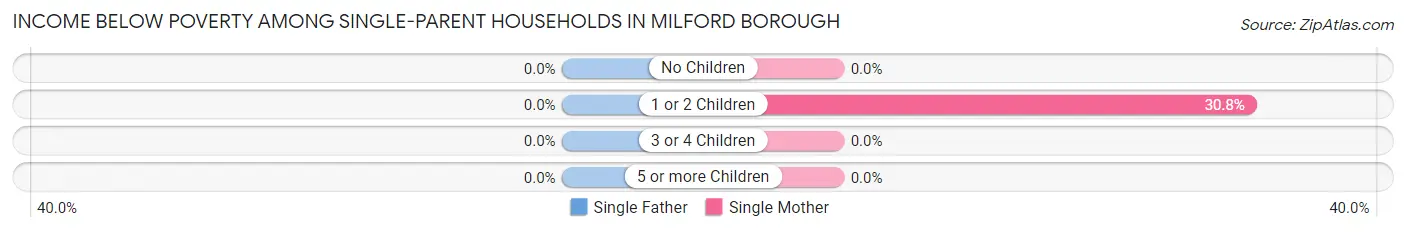
| Children | Single Father | Single Mother |
| No Children | 0 (0.0%) | 0 (0.0%) |
| 1 or 2 Children | 0 (0.0%) | 4 (30.8%) |
| 3 or 4 Children | 0 (0.0%) | 0 (0.0%) |
| 5 or more Children | 0 (0.0%) | 0 (0.0%) |
| Total | 0 (0.0%) | 4 (13.3%) |
Income Below Poverty Among Married-Couple vs Single-Parent Households in Milford borough
The poverty data for Milford borough shows that 7 of the married-couple family households (2.3%) and 4 of the single-parent households (7.8%) are living below the poverty level. Within the married-couple family households, those with no children have the highest poverty rate, with 7 households (3.1%) falling below the poverty line. Among the single-parent households, those with 1 or 2 children have the highest poverty rate, with 4 household (14.3%) living below poverty.
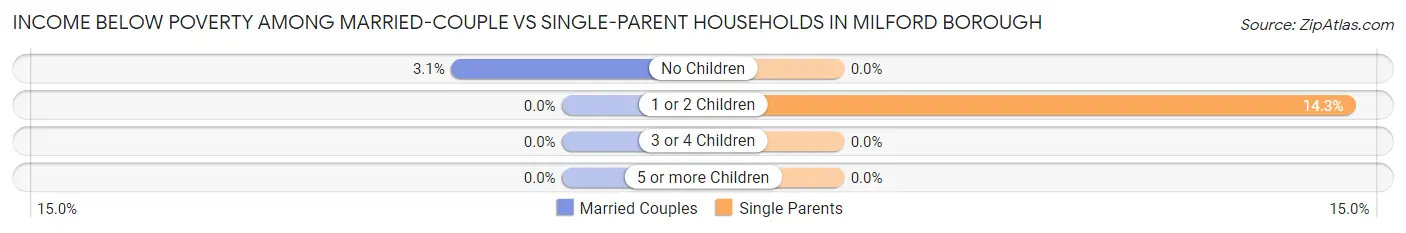
| Children | Married-Couple Families | Single-Parent Households |
| No Children | 7 (3.1%) | 0 (0.0%) |
| 1 or 2 Children | 0 (0.0%) | 4 (14.3%) |
| 3 or 4 Children | 0 (0.0%) | 0 (0.0%) |
| 5 or more Children | 0 (0.0%) | 0 (0.0%) |
| Total | 7 (2.3%) | 4 (7.8%) |
Race in Milford borough
The most populous races in Milford borough are White / Caucasian (1,150 | 92.4%), Hispanic or Latino (64 | 5.1%), and Two or more Races (43 | 3.5%).
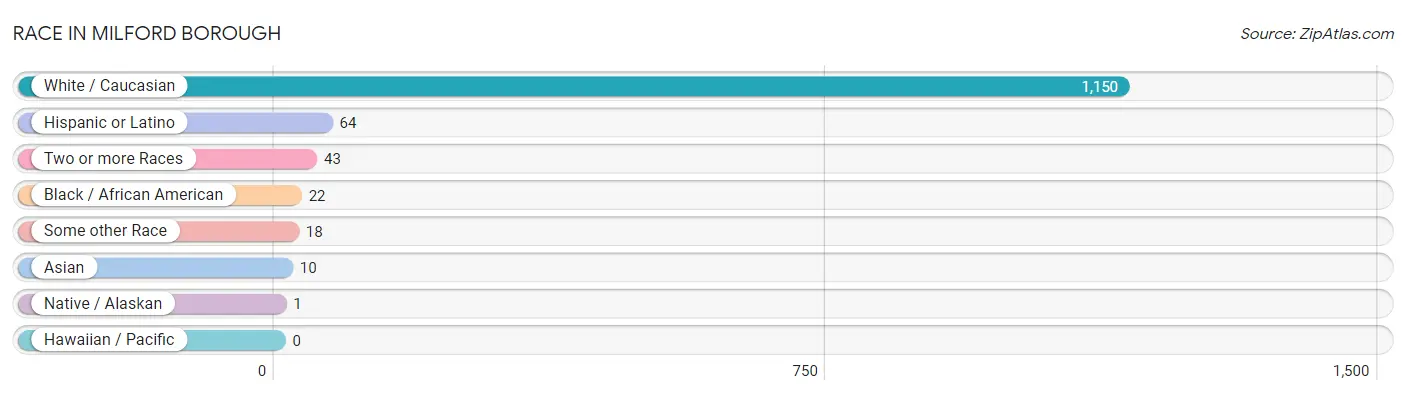
| Race | # Population | % Population |
| Asian | 10 | 0.8% |
| Black / African American | 22 | 1.8% |
| Hawaiian / Pacific | 0 | 0.0% |
| Hispanic or Latino | 64 | 5.1% |
| Native / Alaskan | 1 | 0.1% |
| White / Caucasian | 1,150 | 92.4% |
| Two or more Races | 43 | 3.5% |
| Some other Race | 18 | 1.5% |
| Total | 1,244 | 100.0% |
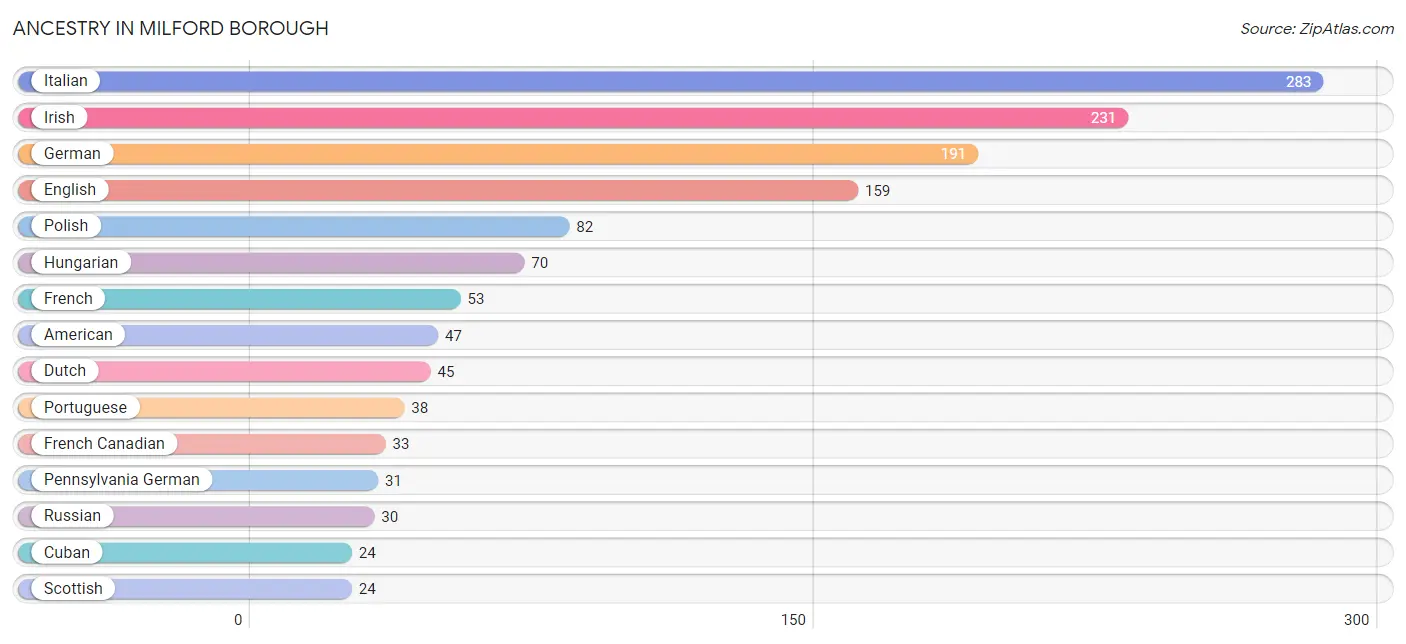
Ancestry in Milford borough
The most populous ancestries reported in Milford borough are Italian (283 | 22.8%), Irish (231 | 18.6%), German (191 | 15.3%), English (159 | 12.8%), and Polish (82 | 6.6%), together accounting for 76.0% of all Milford borough residents.
| Ancestry | # Population | % Population |
| American | 47 | 3.8% |
| Arab | 4 | 0.3% |
| Austrian | 2 | 0.2% |
| Brazilian | 8 | 0.6% |
| British | 13 | 1.1% |
| Central American | 3 | 0.2% |
| Costa Rican | 3 | 0.2% |
| Croatian | 11 | 0.9% |
| Cuban | 24 | 1.9% |
| Czech | 18 | 1.5% |
| Czechoslovakian | 2 | 0.2% |
| Danish | 19 | 1.5% |
| Dominican | 1 | 0.1% |
| Dutch | 45 | 3.6% |
| Eastern European | 18 | 1.5% |
| English | 159 | 12.8% |
| European | 22 | 1.8% |
| French | 53 | 4.3% |
| French Canadian | 33 | 2.6% |
| German | 191 | 15.3% |
| Greek | 5 | 0.4% |
| Hungarian | 70 | 5.6% |
| Indian (Asian) | 4 | 0.3% |
| Irish | 231 | 18.6% |
| Italian | 283 | 22.8% |
| Korean | 9 | 0.7% |
| Lebanese | 4 | 0.3% |
| Lithuanian | 7 | 0.6% |
| Norwegian | 12 | 1.0% |
| Paraguayan | 2 | 0.2% |
| Pennsylvania German | 31 | 2.5% |
| Peruvian | 15 | 1.2% |
| Polish | 82 | 6.6% |
| Portuguese | 38 | 3.0% |
| Puerto Rican | 16 | 1.3% |
| Russian | 30 | 2.4% |
| Scandinavian | 3 | 0.2% |
| Scottish | 24 | 1.9% |
| Slavic | 4 | 0.3% |
| Slovak | 9 | 0.7% |
| South American | 17 | 1.4% |
| Spaniard | 3 | 0.2% |
| Swedish | 6 | 0.5% |
| Swiss | 7 | 0.6% |
| Thai | 9 | 0.7% |
| Ukrainian | 5 | 0.4% |
| Welsh | 3 | 0.2% | View All 47 Rows |
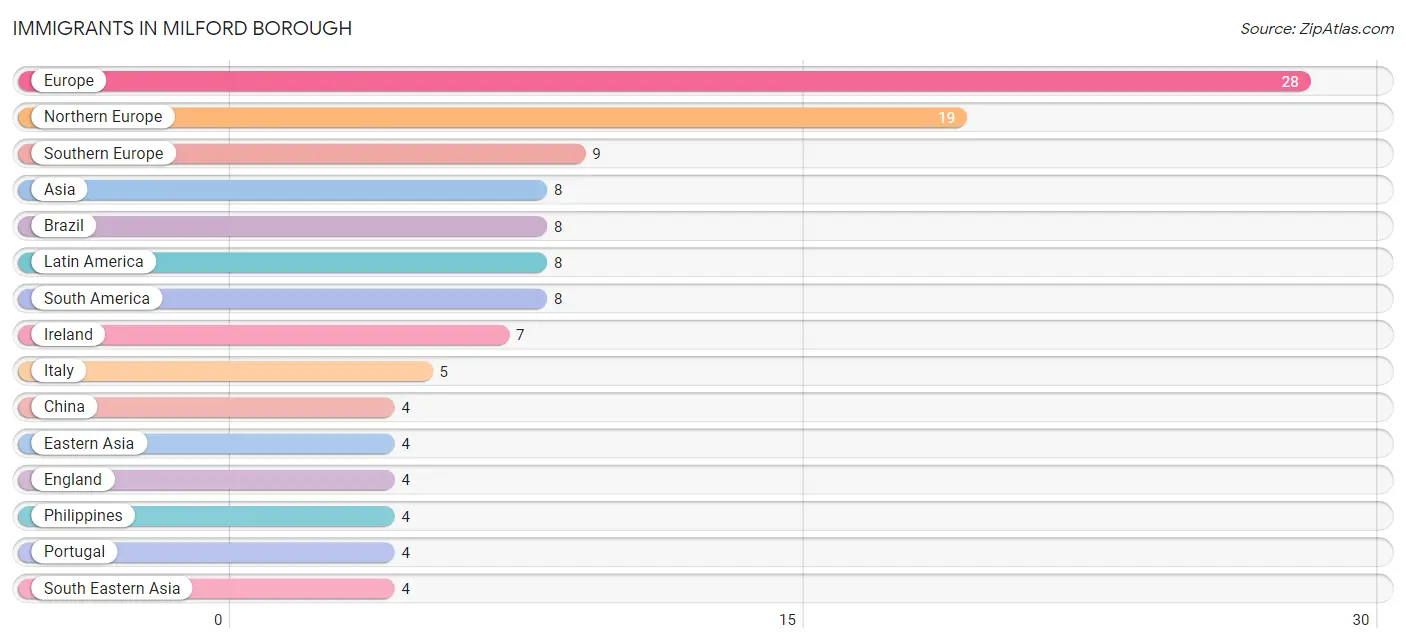
Immigrants in Milford borough
The most numerous immigrant groups reported in Milford borough came from Europe (28 | 2.2%), Northern Europe (19 | 1.5%), Southern Europe (9 | 0.7%), Asia (8 | 0.6%), and Brazil (8 | 0.6%), together accounting for 5.8% of all Milford borough residents.
| Immigration Origin | # Population | % Population |
| Asia | 8 | 0.6% |
| Brazil | 8 | 0.6% |
| China | 4 | 0.3% |
| Eastern Asia | 4 | 0.3% |
| England | 4 | 0.3% |
| Europe | 28 | 2.2% |
| Ireland | 7 | 0.6% |
| Italy | 5 | 0.4% |
| Latin America | 8 | 0.6% |
| Northern Europe | 19 | 1.5% |
| Philippines | 4 | 0.3% |
| Portugal | 4 | 0.3% |
| South America | 8 | 0.6% |
| South Eastern Asia | 4 | 0.3% |
| Southern Europe | 9 | 0.7% | View All 15 Rows |
Sex and Age in Milford borough
Sex and Age in Milford borough
The most populous age groups in Milford borough are 60 to 64 Years (80 | 13.4%) for men and 35 to 39 Years (67 | 10.4%) for women.
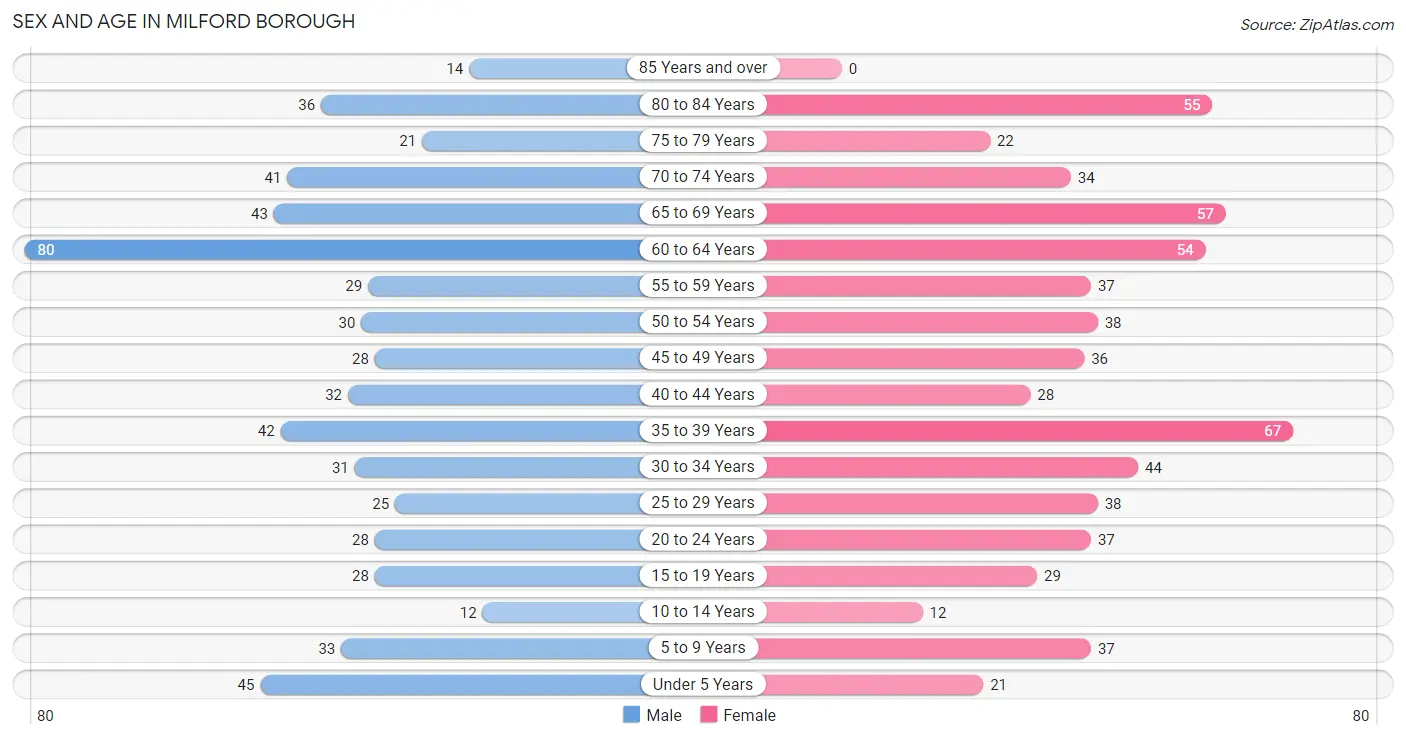
| Age Bracket | Male | Female |
| Under 5 Years | 45 (7.5%) | 21 (3.3%) |
| 5 to 9 Years | 33 (5.5%) | 37 (5.7%) |
| 10 to 14 Years | 12 (2.0%) | 12 (1.9%) |
| 15 to 19 Years | 28 (4.7%) | 29 (4.5%) |
| 20 to 24 Years | 28 (4.7%) | 37 (5.7%) |
| 25 to 29 Years | 25 (4.2%) | 38 (5.9%) |
| 30 to 34 Years | 31 (5.2%) | 44 (6.8%) |
| 35 to 39 Years | 42 (7.0%) | 67 (10.4%) |
| 40 to 44 Years | 32 (5.3%) | 28 (4.3%) |
| 45 to 49 Years | 28 (4.7%) | 36 (5.6%) |
| 50 to 54 Years | 30 (5.0%) | 38 (5.9%) |
| 55 to 59 Years | 29 (4.9%) | 37 (5.7%) |
| 60 to 64 Years | 80 (13.4%) | 54 (8.4%) |
| 65 to 69 Years | 43 (7.2%) | 57 (8.8%) |
| 70 to 74 Years | 41 (6.9%) | 34 (5.3%) |
| 75 to 79 Years | 21 (3.5%) | 22 (3.4%) |
| 80 to 84 Years | 36 (6.0%) | 55 (8.5%) |
| 85 Years and over | 14 (2.3%) | 0 (0.0%) |
| Total | 598 (100.0%) | 646 (100.0%) |
Families and Households in Milford borough
Median Family Size in Milford borough
The median family size in Milford borough is 2.74 persons per family, with married-couple families (309 | 85.8%) accounting for the largest median family size of 2.83 persons per family. On the other hand, single male/father families (21 | 5.8%) represent the smallest median family size with 2.10 persons per family.
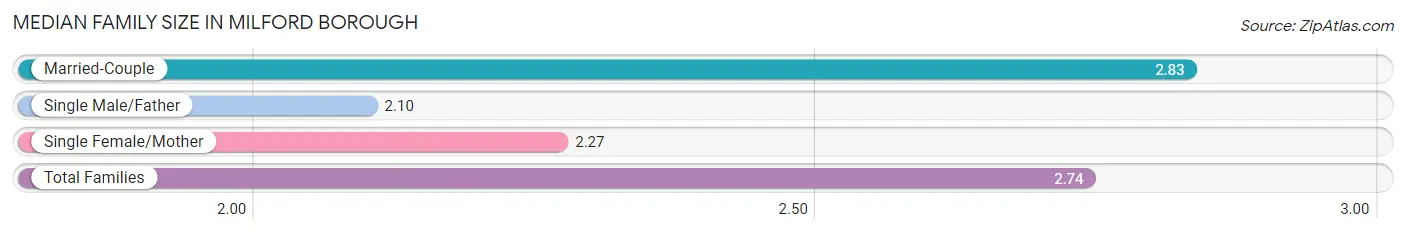
| Family Type | # Families | Family Size |
| Married-Couple | 309 (85.8%) | 2.83 |
| Single Male/Father | 21 (5.8%) | 2.10 |
| Single Female/Mother | 30 (8.3%) | 2.27 |
| Total Families | 360 (100.0%) | 2.74 |
Median Household Size in Milford borough
The median household size in Milford borough is 2.36 persons per household, with single male/father households (21 | 4.0%) accounting for the largest median household size of 2.95 persons per household. non-family households (165 | 31.4%) represent the smallest median household size with 1.22 persons per household.
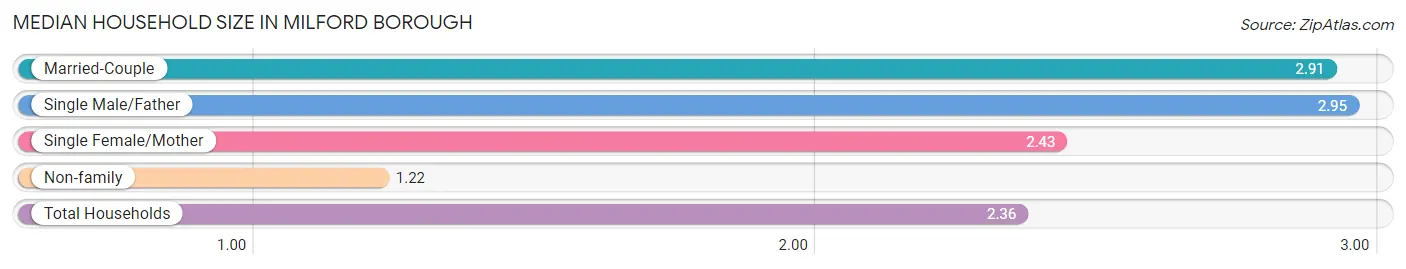
| Household Type | # Households | Household Size |
| Married-Couple | 309 (58.9%) | 2.91 |
| Single Male/Father | 21 (4.0%) | 2.95 |
| Single Female/Mother | 30 (5.7%) | 2.43 |
| Non-family | 165 (31.4%) | 1.22 |
| Total Households | 525 (100.0%) | 2.36 |
Household Size by Marriage Status in Milford borough
Out of a total of 525 households in Milford borough, 360 (68.6%) are family households, while 165 (31.4%) are nonfamily households. The most numerous type of family households are 2-person households, comprising 219, and the most common type of nonfamily households are 1-person households, comprising 119.
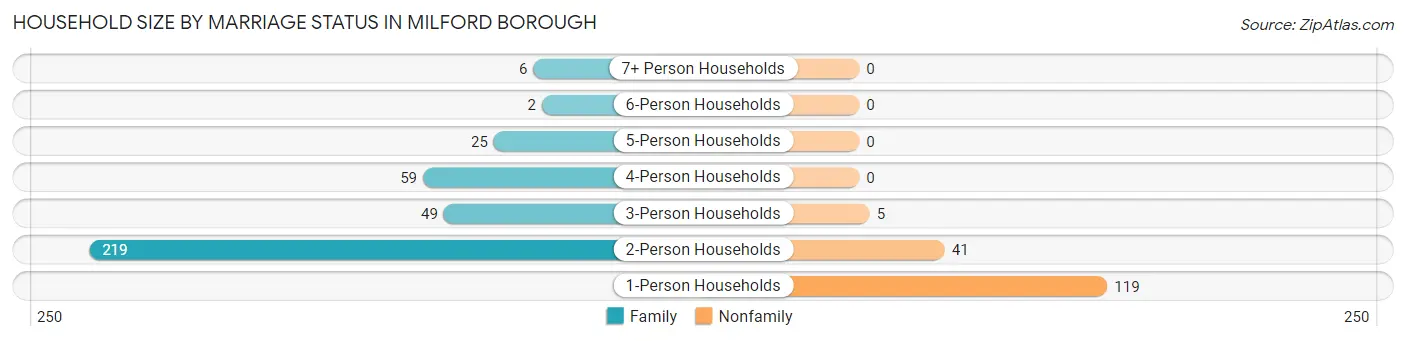
| Household Size | Family Households | Nonfamily Households |
| 1-Person Households | - | 119 (22.7%) |
| 2-Person Households | 219 (41.7%) | 41 (7.8%) |
| 3-Person Households | 49 (9.3%) | 5 (0.9%) |
| 4-Person Households | 59 (11.2%) | 0 (0.0%) |
| 5-Person Households | 25 (4.8%) | 0 (0.0%) |
| 6-Person Households | 2 (0.4%) | 0 (0.0%) |
| 7+ Person Households | 6 (1.1%) | 0 (0.0%) |
| Total | 360 (68.6%) | 165 (31.4%) |
Female Fertility in Milford borough
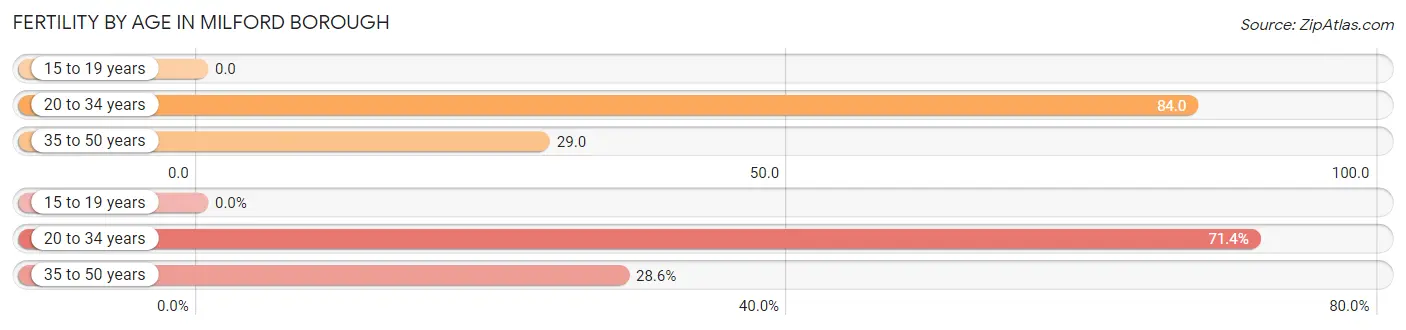
Fertility by Age in Milford borough
Average fertility rate in Milford borough is 49.0 births per 1,000 women. Women in the age bracket of 20 to 34 years have the highest fertility rate with 84.0 births per 1,000 women. Women in the age bracket of 20 to 34 years acount for 71.4% of all women with births.
| Age Bracket | Women with Births | Births / 1,000 Women |
| 15 to 19 years | 0 (0.0%) | 0.0 |
| 20 to 34 years | 10 (71.4%) | 84.0 |
| 35 to 50 years | 4 (28.6%) | 29.0 |
| Total | 14 (100.0%) | 49.0 |
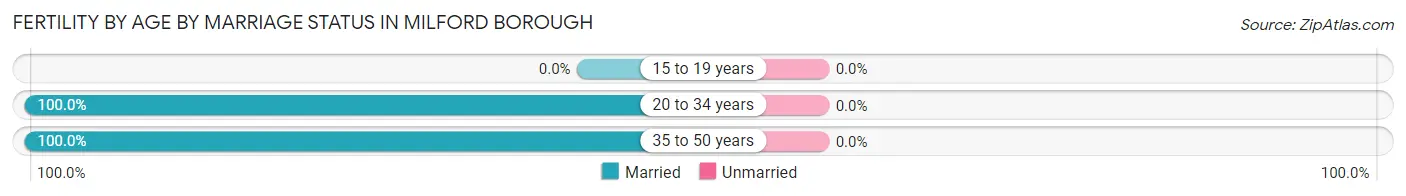
Fertility by Age by Marriage Status in Milford borough
| Age Bracket | Married | Unmarried |
| 15 to 19 years | 0 (0.0%) | 0 (0.0%) |
| 20 to 34 years | 10 (100.0%) | 0 (0.0%) |
| 35 to 50 years | 4 (100.0%) | 0 (0.0%) |
| Total | 14 (100.0%) | 0 (0.0%) |
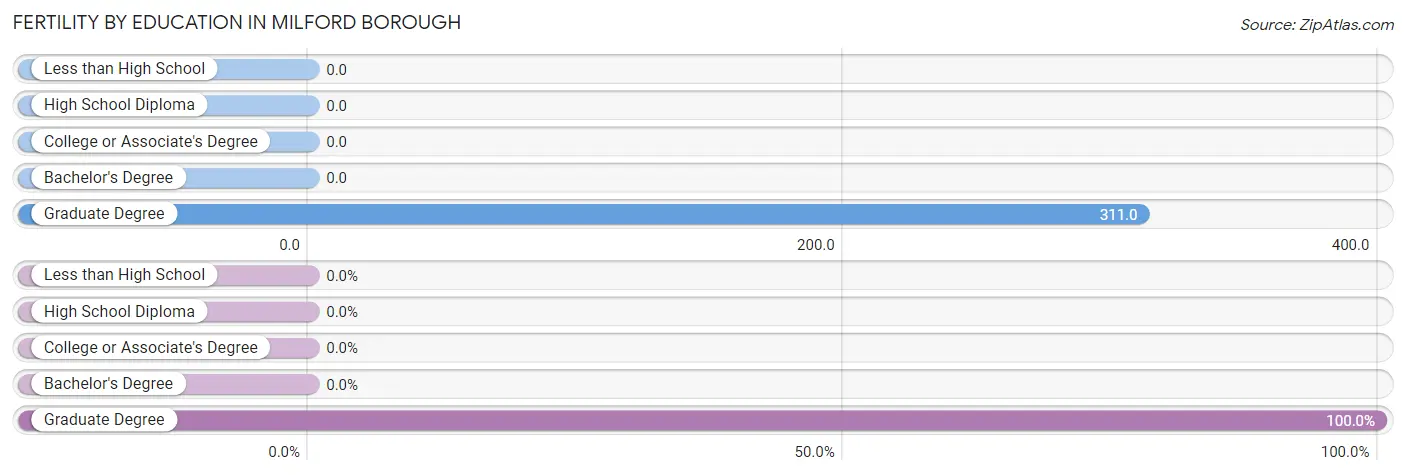
Fertility by Education in Milford borough
| Educational Attainment | Women with Births | Births / 1,000 Women |
| Less than High School | 0 (0.0%) | 0.0 |
| High School Diploma | 0 (0.0%) | 0.0 |
| College or Associate's Degree | 0 (0.0%) | 0.0 |
| Bachelor's Degree | 0 (0.0%) | 0.0 |
| Graduate Degree | 14 (100.0%) | 311.0 |
| Total | 14 (100.0%) | 49.0 |
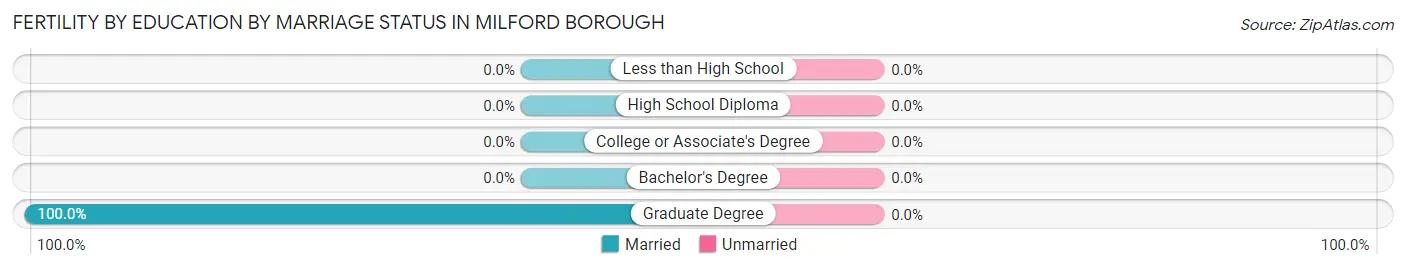
Fertility by Education by Marriage Status in Milford borough
| Educational Attainment | Married | Unmarried |
| Less than High School | 0 (0.0%) | 0 (0.0%) |
| High School Diploma | 0 (0.0%) | 0 (0.0%) |
| College or Associate's Degree | 0 (0.0%) | 0 (0.0%) |
| Bachelor's Degree | 0 (0.0%) | 0 (0.0%) |
| Graduate Degree | 14 (100.0%) | 0 (0.0%) |
| Total | 14 (100.0%) | 0 (0.0%) |
Employment Characteristics in Milford borough
Employment by Class of Employer in Milford borough
Among the 627 employed individuals in Milford borough, private company employees (374 | 59.7%), local government employees (66 | 10.5%), and not-for-profit organizations (60 | 9.6%) make up the most common classes of employment.
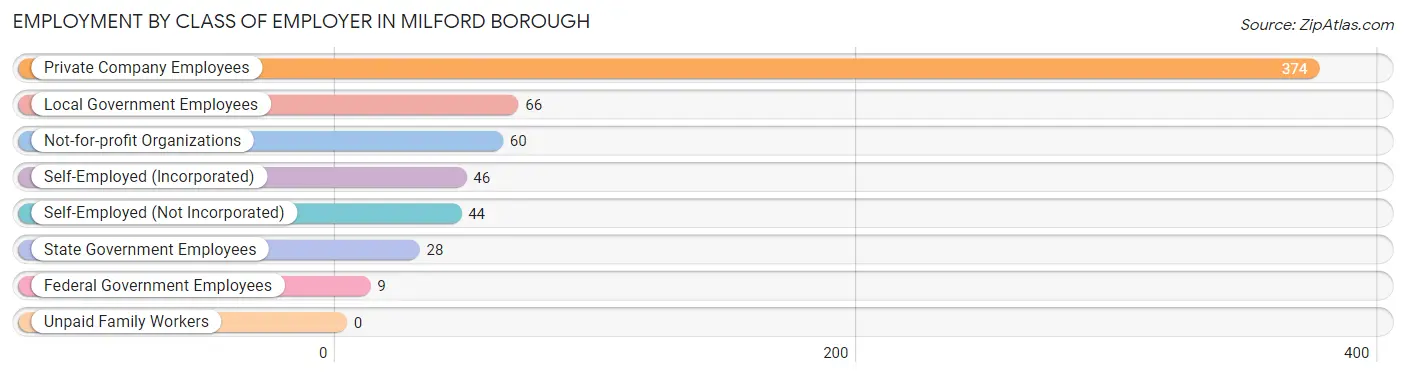
| Employer Class | # Employees | % Employees |
| Private Company Employees | 374 | 59.7% |
| Self-Employed (Incorporated) | 46 | 7.3% |
| Self-Employed (Not Incorporated) | 44 | 7.0% |
| Not-for-profit Organizations | 60 | 9.6% |
| Local Government Employees | 66 | 10.5% |
| State Government Employees | 28 | 4.5% |
| Federal Government Employees | 9 | 1.4% |
| Unpaid Family Workers | 0 | 0.0% |
| Total | 627 | 100.0% |
Employment Status by Age in Milford borough
According to the labor force statistics for Milford borough, out of the total population over 16 years of age (1,071), 65.0% or 696 individuals are in the labor force, with 7.3% or 51 of them unemployed. The age group with the highest labor force participation rate is 25 to 29 years, with 100.0% or 63 individuals in the labor force. Within the labor force, the 45 to 54 years age range has the highest percentage of unemployed individuals, with 17.1% or 20 of them being unemployed.
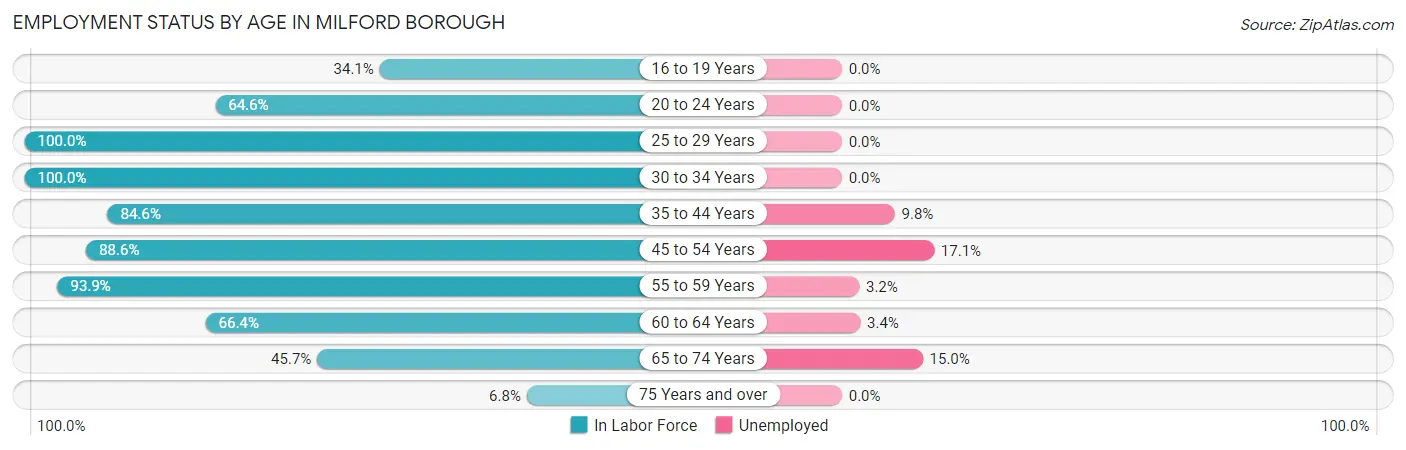
| Age Bracket | In Labor Force | Unemployed |
| 16 to 19 Years | 15 (34.1%) | 0 (0.0%) |
| 20 to 24 Years | 42 (64.6%) | 0 (0.0%) |
| 25 to 29 Years | 63 (100.0%) | 0 (0.0%) |
| 30 to 34 Years | 75 (100.0%) | 0 (0.0%) |
| 35 to 44 Years | 143 (84.6%) | 14 (9.8%) |
| 45 to 54 Years | 117 (88.6%) | 20 (17.1%) |
| 55 to 59 Years | 62 (93.9%) | 2 (3.2%) |
| 60 to 64 Years | 89 (66.4%) | 3 (3.4%) |
| 65 to 74 Years | 80 (45.7%) | 12 (15.0%) |
| 75 Years and over | 10 (6.8%) | 0 (0.0%) |
| Total | 696 (65.0%) | 51 (7.3%) |
Employment Status by Educational Attainment in Milford borough
According to labor force statistics for Milford borough, 85.9% of individuals (549) out of the total population between 25 and 64 years of age (639) are in the labor force, with 7.1% or 39 of them being unemployed. The group with the highest labor force participation rate are those with the educational attainment of college / associate degree, with 92.1% or 174 individuals in the labor force. Within the labor force, individuals with high school diploma education have the highest percentage of unemployment, with 8.5% or 14 of them being unemployed.
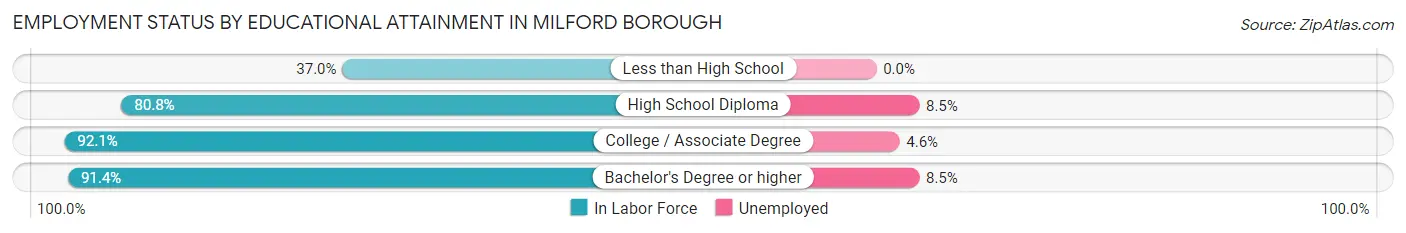
| Educational Attainment | In Labor Force | Unemployed |
| Less than High School | 10 (37.0%) | 0 (0.0%) |
| High School Diploma | 164 (80.8%) | 17 (8.5%) |
| College / Associate Degree | 174 (92.1%) | 9 (4.6%) |
| Bachelor's Degree or higher | 201 (91.4%) | 19 (8.5%) |
| Total | 549 (85.9%) | 45 (7.1%) |
Employment Occupations by Sex in Milford borough
Management, Business, Science and Arts Occupations
The most common Management, Business, Science and Arts occupations in Milford borough are Community & Social Service (98 | 15.2%), Management (87 | 13.5%), Business & Financial (48 | 7.4%), Education Instruction & Library (48 | 7.4%), and Arts, Media & Entertainment (25 | 3.9%).
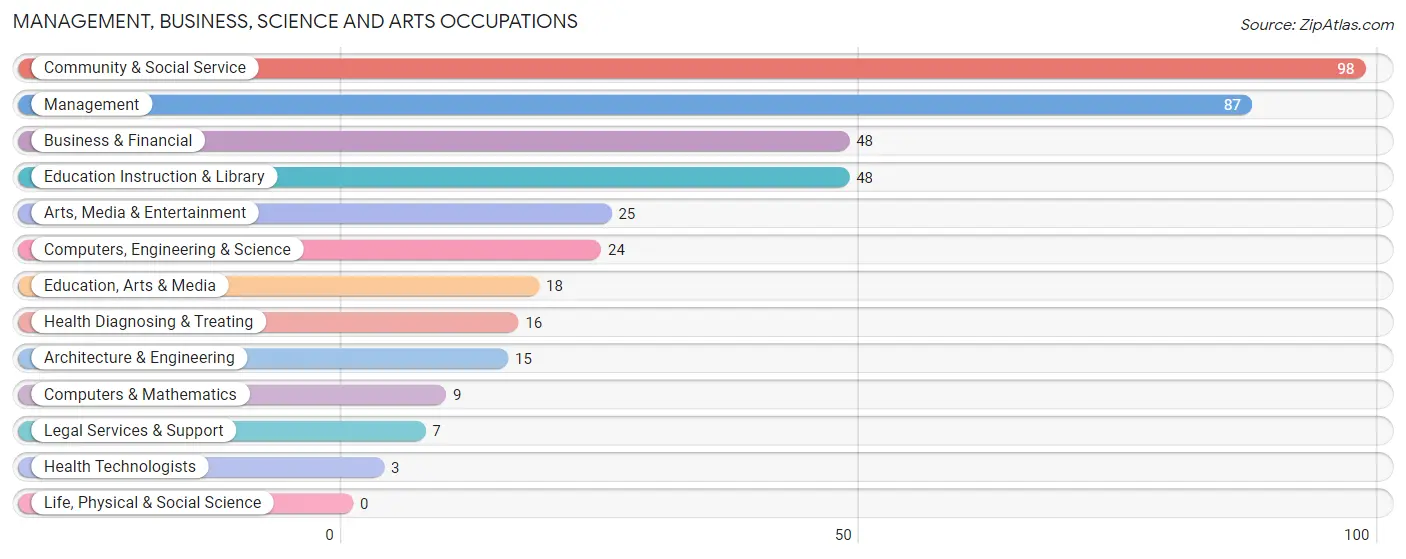
Management, Business, Science and Arts Occupations by Sex
Within the Management, Business, Science and Arts occupations in Milford borough, the most male-oriented occupations are Computers, Engineering & Science (100.0%), Computers & Mathematics (100.0%), and Architecture & Engineering (100.0%), while the most female-oriented occupations are Arts, Media & Entertainment (100.0%), Health Technologists (100.0%), and Community & Social Service (80.6%).
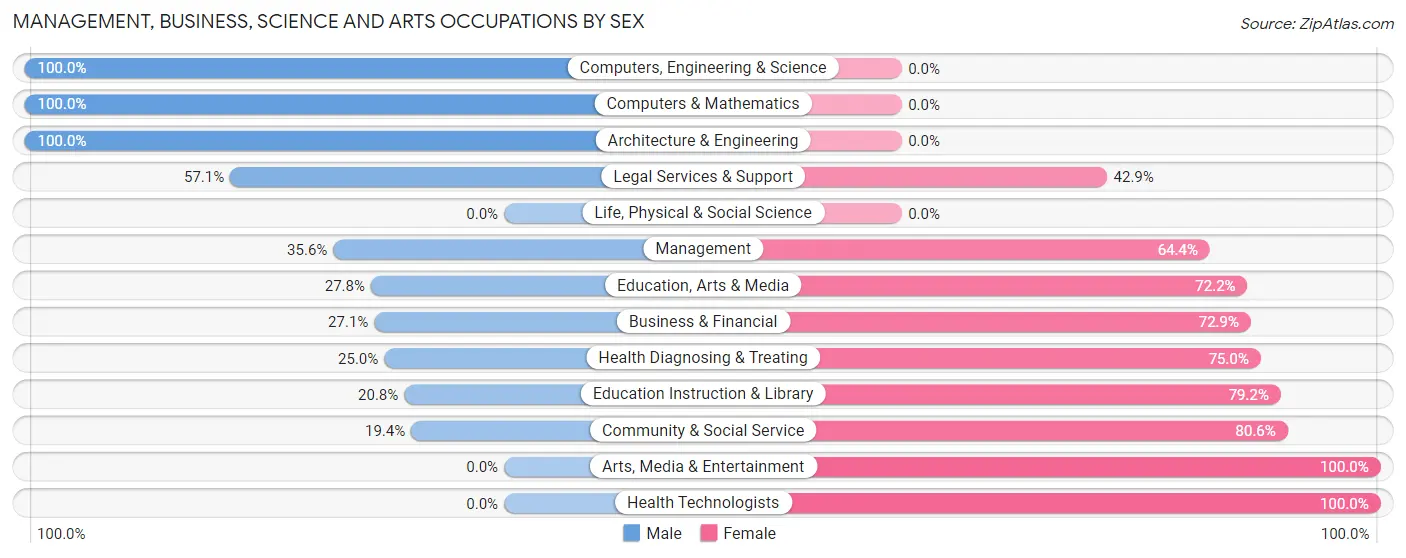
| Occupation | Male | Female |
| Management | 31 (35.6%) | 56 (64.4%) |
| Business & Financial | 13 (27.1%) | 35 (72.9%) |
| Computers, Engineering & Science | 24 (100.0%) | 0 (0.0%) |
| Computers & Mathematics | 9 (100.0%) | 0 (0.0%) |
| Architecture & Engineering | 15 (100.0%) | 0 (0.0%) |
| Life, Physical & Social Science | 0 (0.0%) | 0 (0.0%) |
| Community & Social Service | 19 (19.4%) | 79 (80.6%) |
| Education, Arts & Media | 5 (27.8%) | 13 (72.2%) |
| Legal Services & Support | 4 (57.1%) | 3 (42.9%) |
| Education Instruction & Library | 10 (20.8%) | 38 (79.2%) |
| Arts, Media & Entertainment | 0 (0.0%) | 25 (100.0%) |
| Health Diagnosing & Treating | 4 (25.0%) | 12 (75.0%) |
| Health Technologists | 0 (0.0%) | 3 (100.0%) |
| Total (Category) | 91 (33.3%) | 182 (66.7%) |
| Total (Overall) | 279 (43.3%) | 366 (56.7%) |
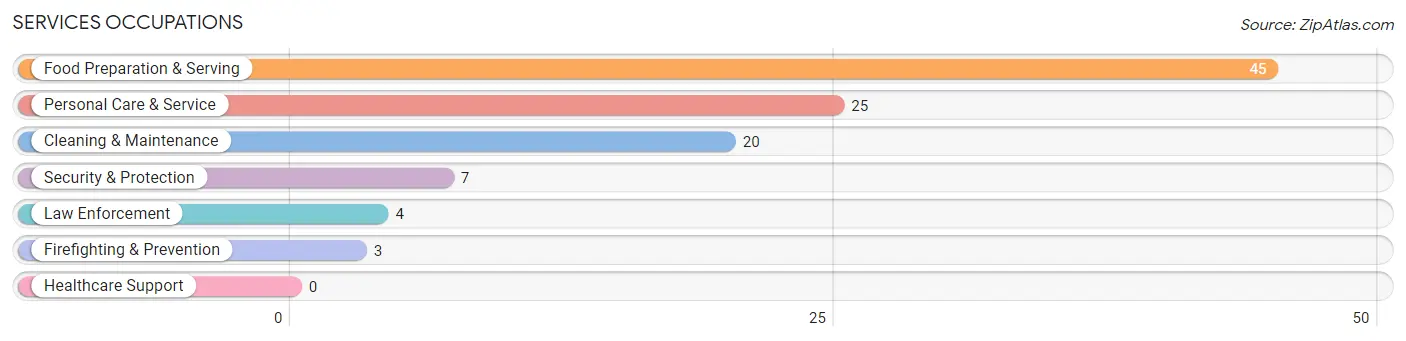
Services Occupations
The most common Services occupations in Milford borough are Food Preparation & Serving (45 | 7.0%), Personal Care & Service (25 | 3.9%), Cleaning & Maintenance (20 | 3.1%), Security & Protection (7 | 1.1%), and Law Enforcement (4 | 0.6%).
Services Occupations by Sex
Within the Services occupations in Milford borough, the most male-oriented occupations are Security & Protection (100.0%), Firefighting & Prevention (100.0%), and Law Enforcement (100.0%), while the most female-oriented occupations are Personal Care & Service (100.0%), Food Preparation & Serving (84.4%), and Cleaning & Maintenance (15.0%).
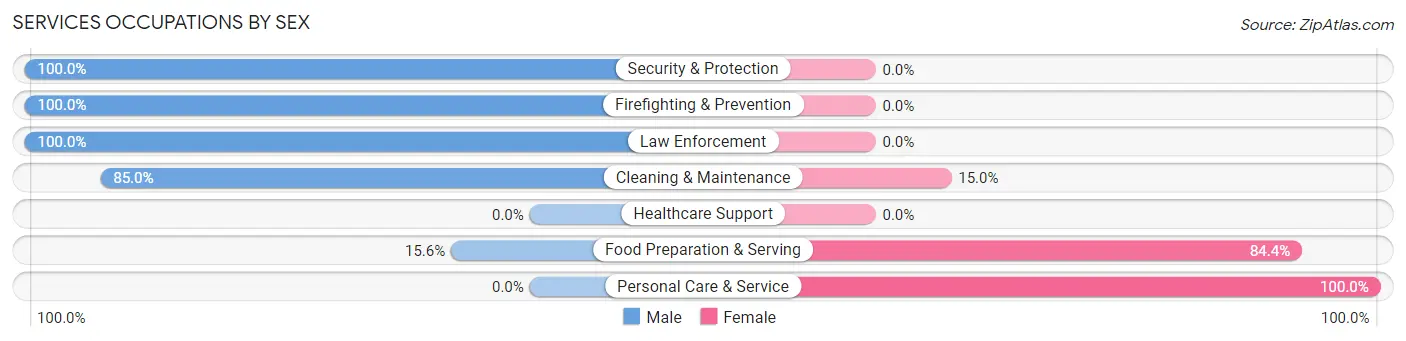
| Occupation | Male | Female |
| Healthcare Support | 0 (0.0%) | 0 (0.0%) |
| Security & Protection | 7 (100.0%) | 0 (0.0%) |
| Firefighting & Prevention | 3 (100.0%) | 0 (0.0%) |
| Law Enforcement | 4 (100.0%) | 0 (0.0%) |
| Food Preparation & Serving | 7 (15.6%) | 38 (84.4%) |
| Cleaning & Maintenance | 17 (85.0%) | 3 (15.0%) |
| Personal Care & Service | 0 (0.0%) | 25 (100.0%) |
| Total (Category) | 31 (32.0%) | 66 (68.0%) |
| Total (Overall) | 279 (43.3%) | 366 (56.7%) |
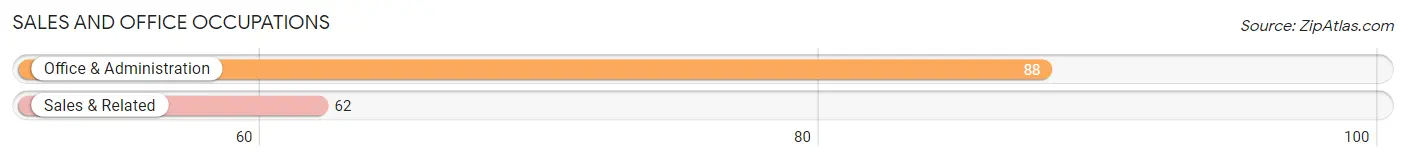
Sales and Office Occupations
The most common Sales and Office occupations in Milford borough are Office & Administration (88 | 13.6%), and Sales & Related (62 | 9.6%).
Sales and Office Occupations by Sex
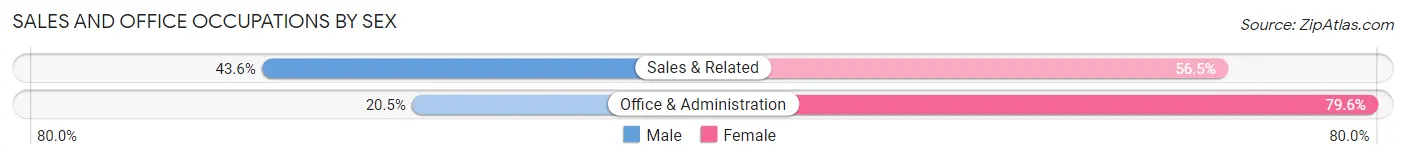
| Occupation | Male | Female |
| Sales & Related | 27 (43.5%) | 35 (56.5%) |
| Office & Administration | 18 (20.4%) | 70 (79.5%) |
| Total (Category) | 45 (30.0%) | 105 (70.0%) |
| Total (Overall) | 279 (43.3%) | 366 (56.7%) |
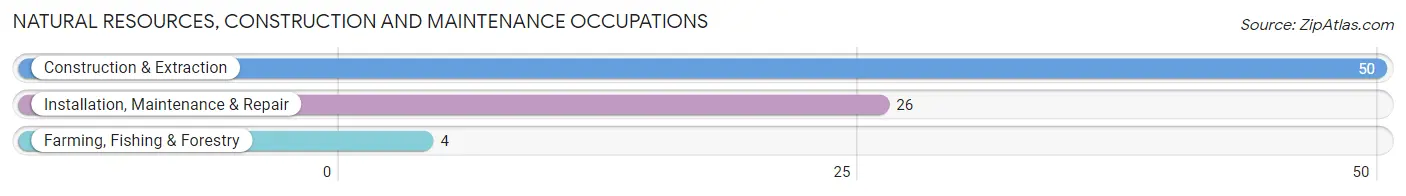
Natural Resources, Construction and Maintenance Occupations
The most common Natural Resources, Construction and Maintenance occupations in Milford borough are Construction & Extraction (50 | 7.7%), Installation, Maintenance & Repair (26 | 4.0%), and Farming, Fishing & Forestry (4 | 0.6%).
Natural Resources, Construction and Maintenance Occupations by Sex
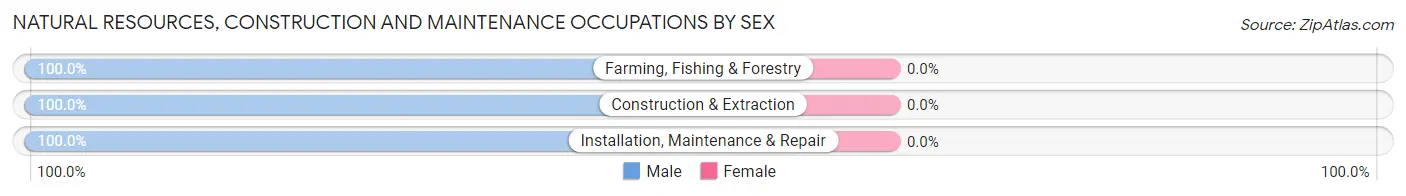
| Occupation | Male | Female |
| Farming, Fishing & Forestry | 4 (100.0%) | 0 (0.0%) |
| Construction & Extraction | 50 (100.0%) | 0 (0.0%) |
| Installation, Maintenance & Repair | 26 (100.0%) | 0 (0.0%) |
| Total (Category) | 80 (100.0%) | 0 (0.0%) |
| Total (Overall) | 279 (43.3%) | 366 (56.7%) |
Production, Transportation and Moving Occupations
The most common Production, Transportation and Moving occupations in Milford borough are Material Moving (21 | 3.3%), Production (13 | 2.0%), and Transportation (11 | 1.7%).
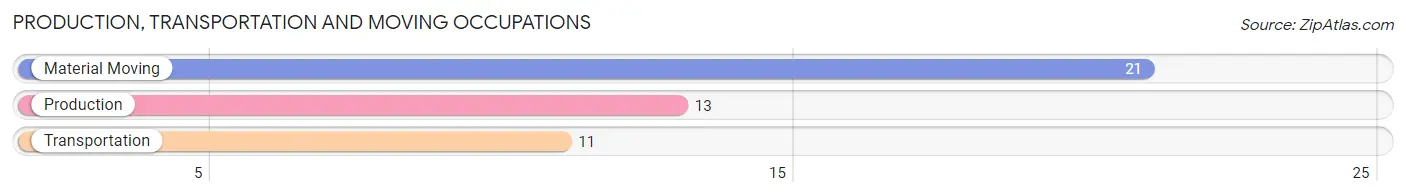
Production, Transportation and Moving Occupations by Sex
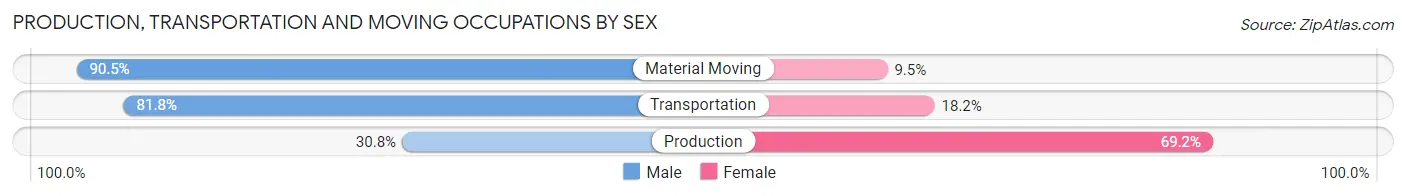
| Occupation | Male | Female |
| Production | 4 (30.8%) | 9 (69.2%) |
| Transportation | 9 (81.8%) | 2 (18.2%) |
| Material Moving | 19 (90.5%) | 2 (9.5%) |
| Total (Category) | 32 (71.1%) | 13 (28.9%) |
| Total (Overall) | 279 (43.3%) | 366 (56.7%) |
Employment Industries by Sex in Milford borough
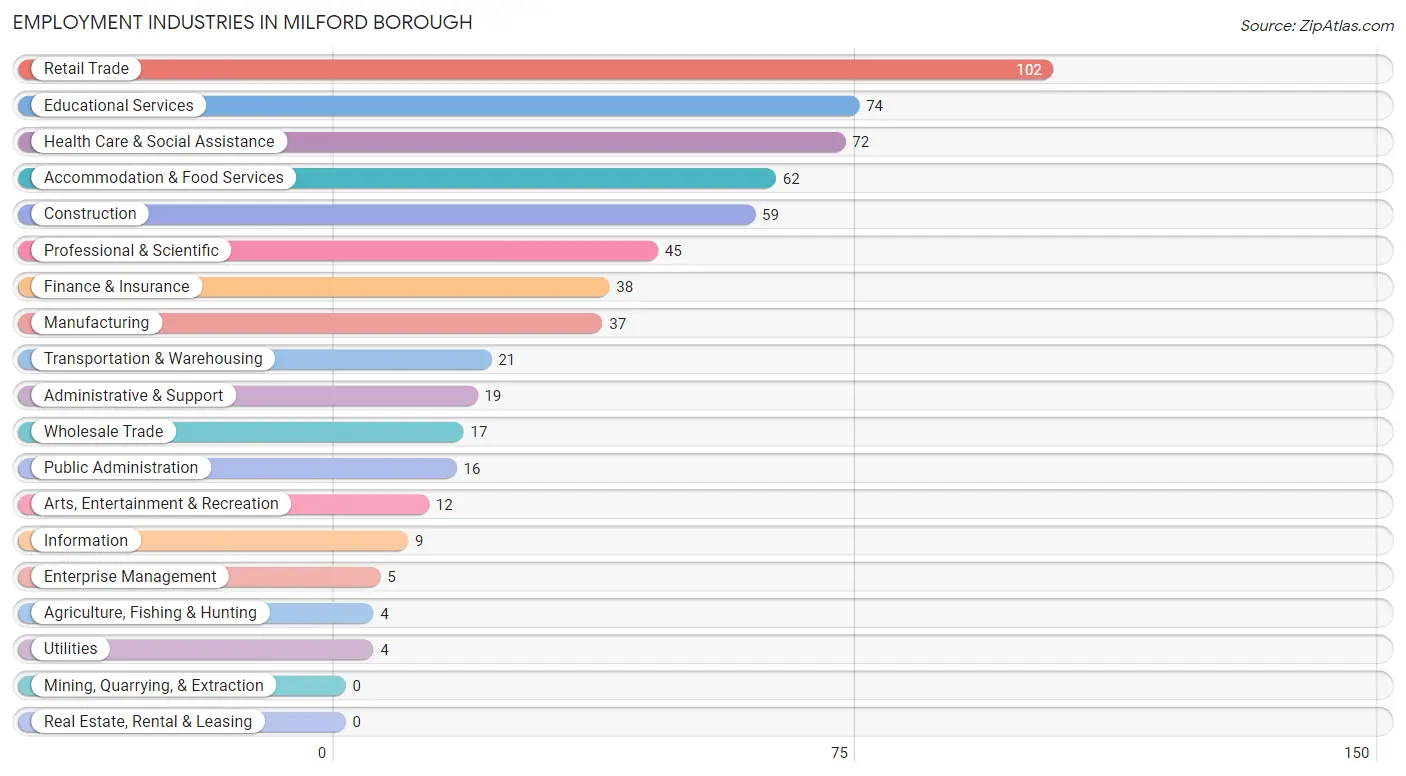
Employment Industries in Milford borough
The major employment industries in Milford borough include Retail Trade (102 | 15.8%), Educational Services (74 | 11.5%), Health Care & Social Assistance (72 | 11.2%), Accommodation & Food Services (62 | 9.6%), and Construction (59 | 9.1%).
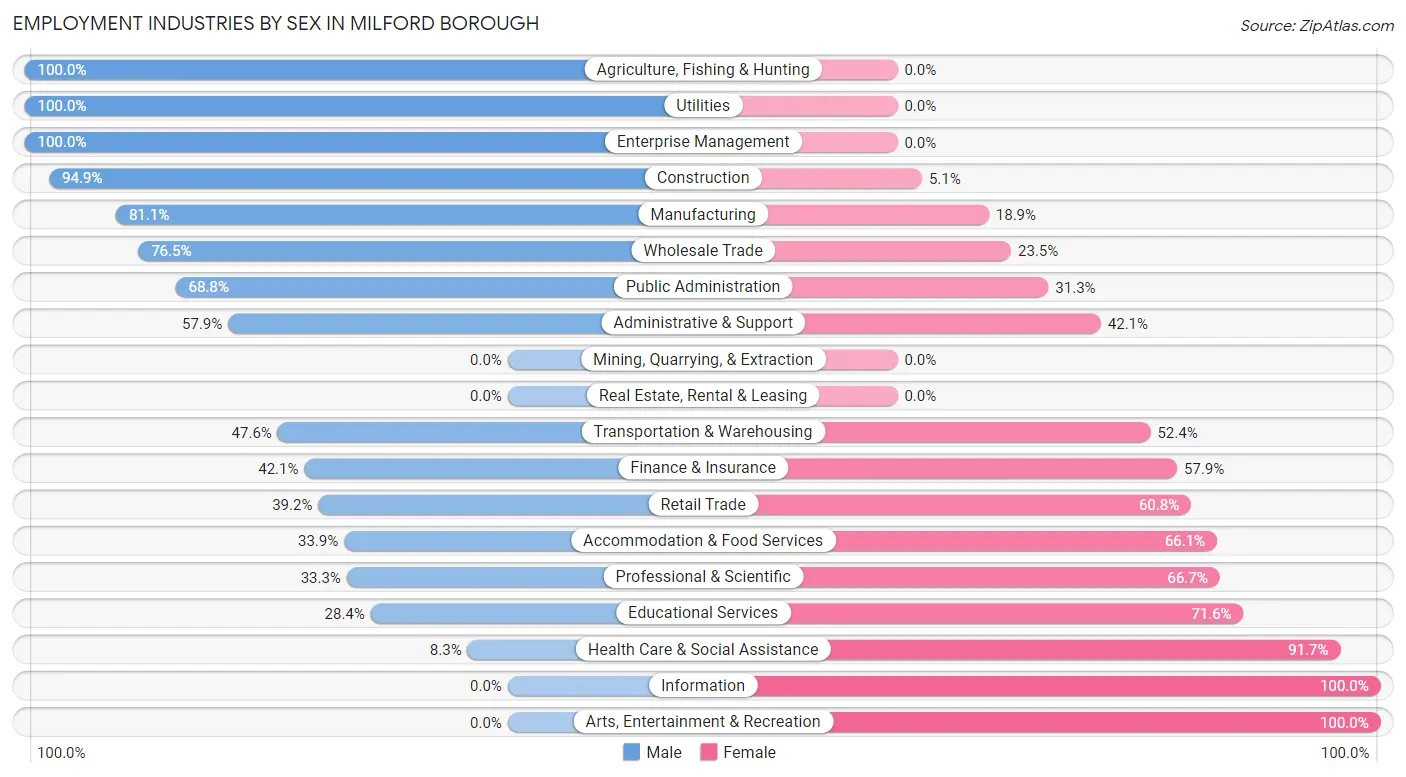
Employment Industries by Sex in Milford borough
The Milford borough industries that see more men than women are Agriculture, Fishing & Hunting (100.0%), Utilities (100.0%), and Enterprise Management (100.0%), whereas the industries that tend to have a higher number of women are Information (100.0%), Arts, Entertainment & Recreation (100.0%), and Health Care & Social Assistance (91.7%).
| Industry | Male | Female |
| Agriculture, Fishing & Hunting | 4 (100.0%) | 0 (0.0%) |
| Mining, Quarrying, & Extraction | 0 (0.0%) | 0 (0.0%) |
| Construction | 56 (94.9%) | 3 (5.1%) |
| Manufacturing | 30 (81.1%) | 7 (18.9%) |
| Wholesale Trade | 13 (76.5%) | 4 (23.5%) |
| Retail Trade | 40 (39.2%) | 62 (60.8%) |
| Transportation & Warehousing | 10 (47.6%) | 11 (52.4%) |
| Utilities | 4 (100.0%) | 0 (0.0%) |
| Information | 0 (0.0%) | 9 (100.0%) |
| Finance & Insurance | 16 (42.1%) | 22 (57.9%) |
| Real Estate, Rental & Leasing | 0 (0.0%) | 0 (0.0%) |
| Professional & Scientific | 15 (33.3%) | 30 (66.7%) |
| Enterprise Management | 5 (100.0%) | 0 (0.0%) |
| Administrative & Support | 11 (57.9%) | 8 (42.1%) |
| Educational Services | 21 (28.4%) | 53 (71.6%) |
| Health Care & Social Assistance | 6 (8.3%) | 66 (91.7%) |
| Arts, Entertainment & Recreation | 0 (0.0%) | 12 (100.0%) |
| Accommodation & Food Services | 21 (33.9%) | 41 (66.1%) |
| Public Administration | 11 (68.8%) | 5 (31.2%) |
| Total | 279 (43.3%) | 366 (56.7%) |
Education in Milford borough
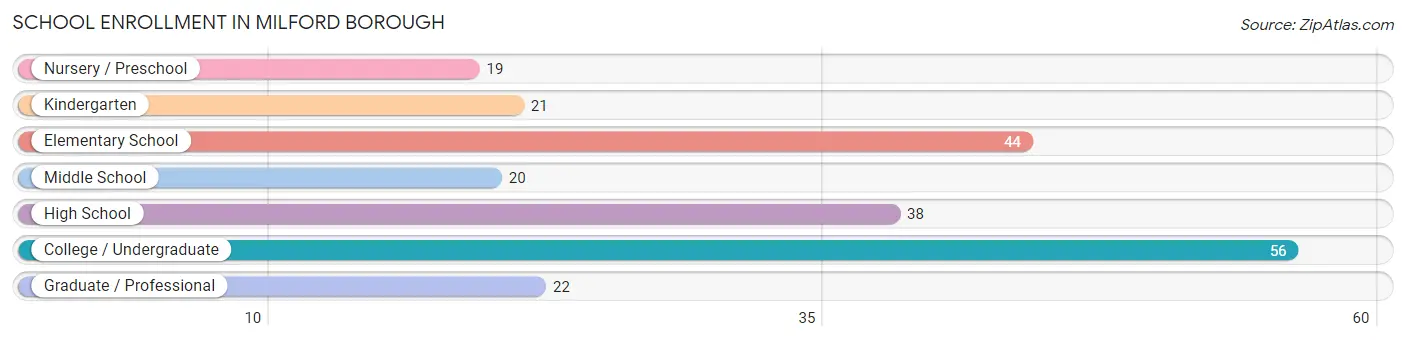
School Enrollment in Milford borough
The most common levels of schooling among the 220 students in Milford borough are college / undergraduate (56 | 25.5%), elementary school (44 | 20.0%), and high school (38 | 17.3%).
| School Level | # Students | % Students |
| Nursery / Preschool | 19 | 8.6% |
| Kindergarten | 21 | 9.6% |
| Elementary School | 44 | 20.0% |
| Middle School | 20 | 9.1% |
| High School | 38 | 17.3% |
| College / Undergraduate | 56 | 25.5% |
| Graduate / Professional | 22 | 10.0% |
| Total | 220 | 100.0% |
School Enrollment by Age by Funding Source in Milford borough
Out of a total of 220 students who are enrolled in schools in Milford borough, 77 (35.0%) attend a private institution, while the remaining 143 (65.0%) are enrolled in public schools. The age group of 20 to 24 year olds has the highest likelihood of being enrolled in private schools, with 32 (82.1% in the age bracket) enrolled. Conversely, the age group of 3 to 4 year olds has the lowest likelihood of being enrolled in a private school, with 14 (100.0% in the age bracket) attending a public institution.
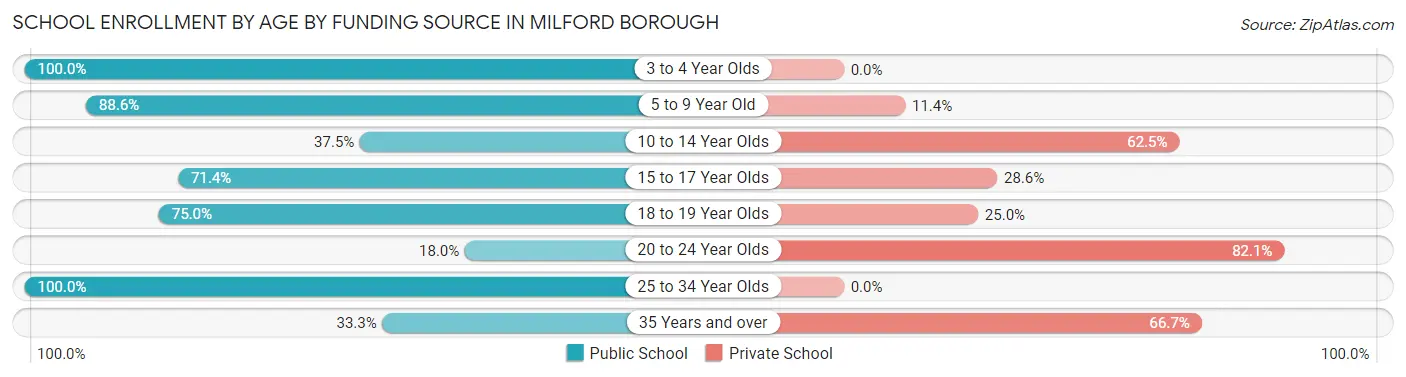
| Age Bracket | Public School | Private School |
| 3 to 4 Year Olds | 14 (100.0%) | 0 (0.0%) |
| 5 to 9 Year Old | 62 (88.6%) | 8 (11.4%) |
| 10 to 14 Year Olds | 9 (37.5%) | 15 (62.5%) |
| 15 to 17 Year Olds | 20 (71.4%) | 8 (28.6%) |
| 18 to 19 Year Olds | 18 (75.0%) | 6 (25.0%) |
| 20 to 24 Year Olds | 7 (17.9%) | 32 (82.1%) |
| 25 to 34 Year Olds | 9 (100.0%) | 0 (0.0%) |
| 35 Years and over | 4 (33.3%) | 8 (66.7%) |
| Total | 143 (65.0%) | 77 (35.0%) |
Educational Attainment by Field of Study in Milford borough
Literature & languages (46 | 13.9%), business (44 | 13.3%), education (40 | 12.1%), social sciences (36 | 10.9%), and arts & humanities (30 | 9.1%) are the most common fields of study among 331 individuals in Milford borough who have obtained a bachelor's degree or higher.
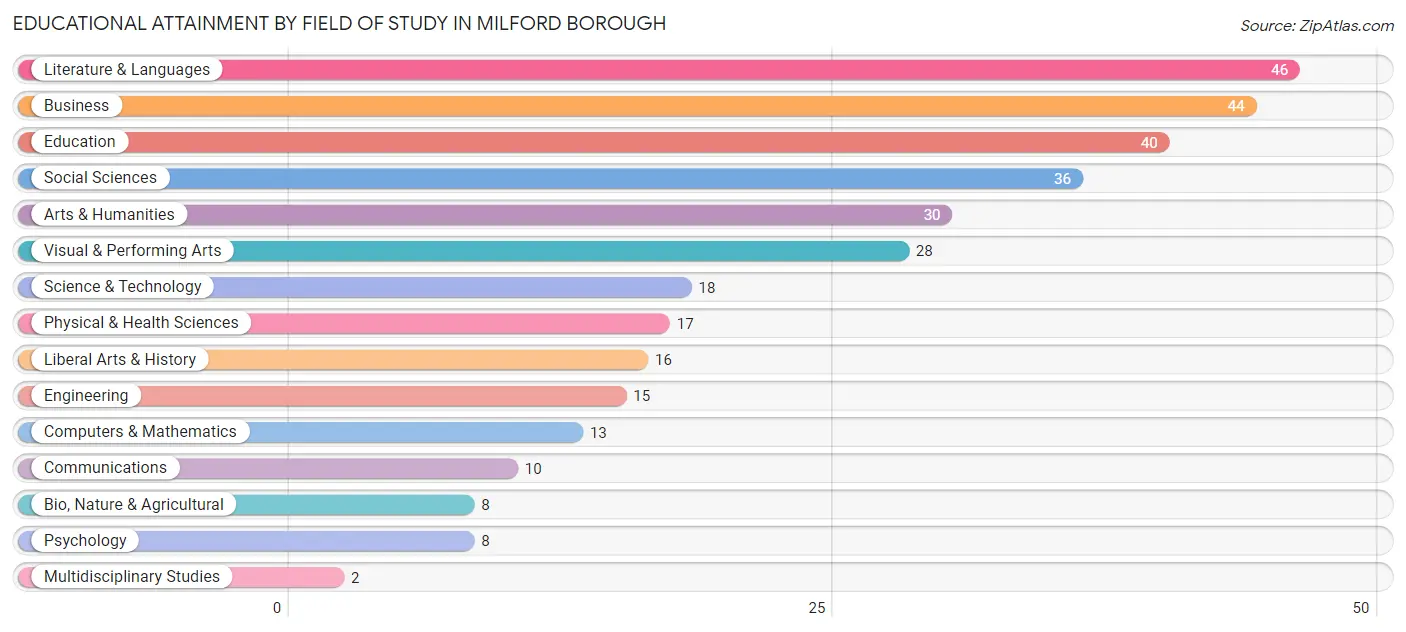
| Field of Study | # Graduates | % Graduates |
| Computers & Mathematics | 13 | 3.9% |
| Bio, Nature & Agricultural | 8 | 2.4% |
| Physical & Health Sciences | 17 | 5.1% |
| Psychology | 8 | 2.4% |
| Social Sciences | 36 | 10.9% |
| Engineering | 15 | 4.5% |
| Multidisciplinary Studies | 2 | 0.6% |
| Science & Technology | 18 | 5.4% |
| Business | 44 | 13.3% |
| Education | 40 | 12.1% |
| Literature & Languages | 46 | 13.9% |
| Liberal Arts & History | 16 | 4.8% |
| Visual & Performing Arts | 28 | 8.5% |
| Communications | 10 | 3.0% |
| Arts & Humanities | 30 | 9.1% |
| Total | 331 | 100.0% |
Transportation & Commute in Milford borough
Vehicle Availability by Sex in Milford borough
The most prevalent vehicle ownership categories in Milford borough are males with 2 vehicles (117, accounting for 43.2%) and females with 2 vehicles (140, making up 32.9%).
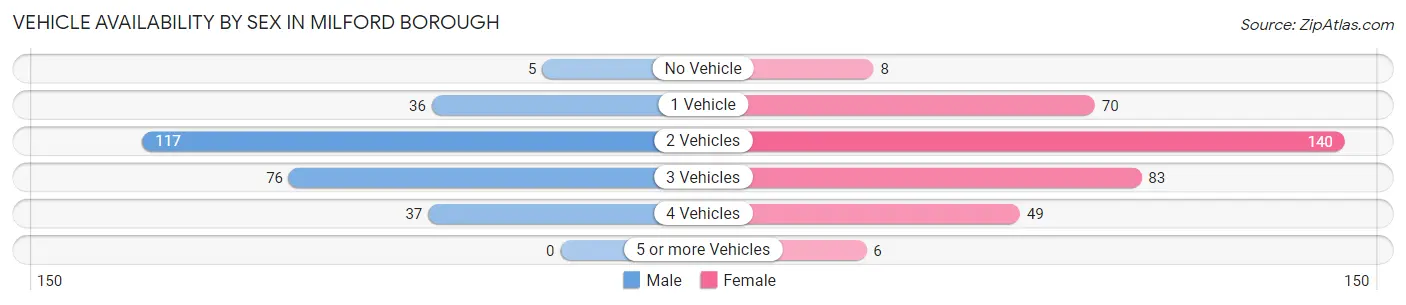
| Vehicles Available | Male | Female |
| No Vehicle | 5 (1.8%) | 8 (2.2%) |
| 1 Vehicle | 36 (13.3%) | 70 (19.7%) |
| 2 Vehicles | 117 (43.2%) | 140 (39.3%) |
| 3 Vehicles | 76 (28.0%) | 83 (23.3%) |
| 4 Vehicles | 37 (13.7%) | 49 (13.8%) |
| 5 or more Vehicles | 0 (0.0%) | 6 (1.7%) |
| Total | 271 (100.0%) | 356 (100.0%) |
Commute Time in Milford borough
The most frequently occuring commute durations in Milford borough are 30 to 34 minutes (113 commuters, 20.5%), 25 to 29 minutes (85 commuters, 15.4%), and 60 to 89 minutes (80 commuters, 14.5%).
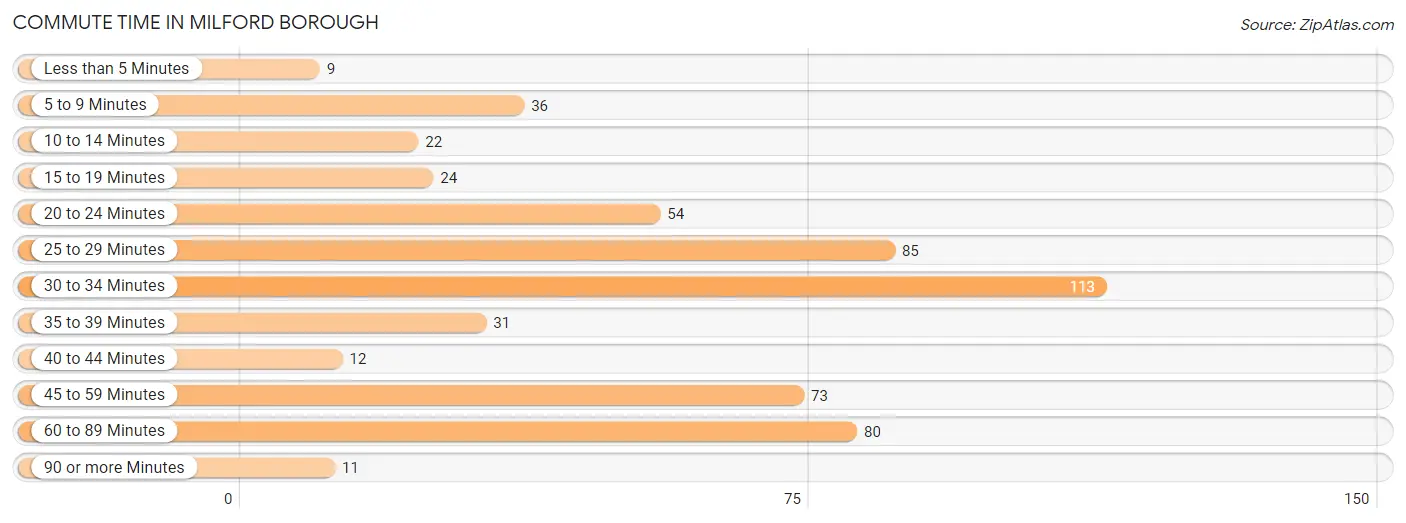
| Commute Time | # Commuters | % Commuters |
| Less than 5 Minutes | 9 | 1.6% |
| 5 to 9 Minutes | 36 | 6.6% |
| 10 to 14 Minutes | 22 | 4.0% |
| 15 to 19 Minutes | 24 | 4.4% |
| 20 to 24 Minutes | 54 | 9.8% |
| 25 to 29 Minutes | 85 | 15.4% |
| 30 to 34 Minutes | 113 | 20.5% |
| 35 to 39 Minutes | 31 | 5.6% |
| 40 to 44 Minutes | 12 | 2.2% |
| 45 to 59 Minutes | 73 | 13.3% |
| 60 to 89 Minutes | 80 | 14.5% |
| 90 or more Minutes | 11 | 2.0% |
Commute Time by Sex in Milford borough
The most common commute times in Milford borough are 60 to 89 minutes (59 commuters, 23.7%) for males and 30 to 34 minutes (65 commuters, 21.6%) for females.
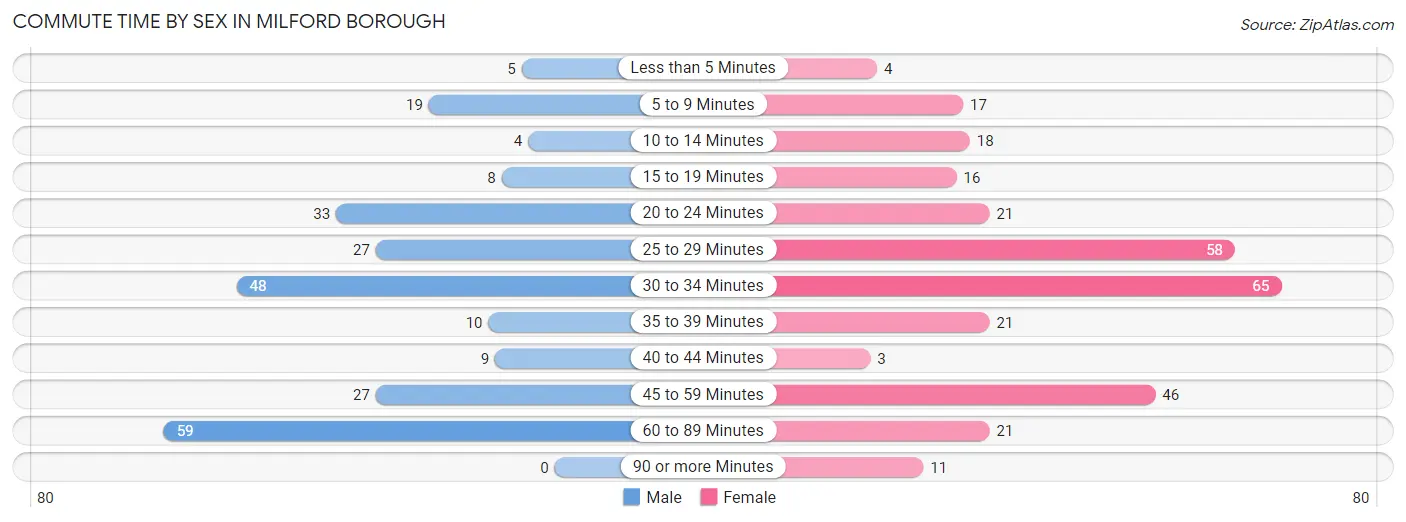
| Commute Time | Male | Female |
| Less than 5 Minutes | 5 (2.0%) | 4 (1.3%) |
| 5 to 9 Minutes | 19 (7.6%) | 17 (5.7%) |
| 10 to 14 Minutes | 4 (1.6%) | 18 (6.0%) |
| 15 to 19 Minutes | 8 (3.2%) | 16 (5.3%) |
| 20 to 24 Minutes | 33 (13.3%) | 21 (7.0%) |
| 25 to 29 Minutes | 27 (10.8%) | 58 (19.3%) |
| 30 to 34 Minutes | 48 (19.3%) | 65 (21.6%) |
| 35 to 39 Minutes | 10 (4.0%) | 21 (7.0%) |
| 40 to 44 Minutes | 9 (3.6%) | 3 (1.0%) |
| 45 to 59 Minutes | 27 (10.8%) | 46 (15.3%) |
| 60 to 89 Minutes | 59 (23.7%) | 21 (7.0%) |
| 90 or more Minutes | 0 (0.0%) | 11 (3.6%) |
Time of Departure to Work by Sex in Milford borough
The most frequent times of departure to work in Milford borough are 7:00 AM to 7:29 AM (34, 13.7%) for males and 5:00 AM to 5:29 AM (53, 17.6%) for females.
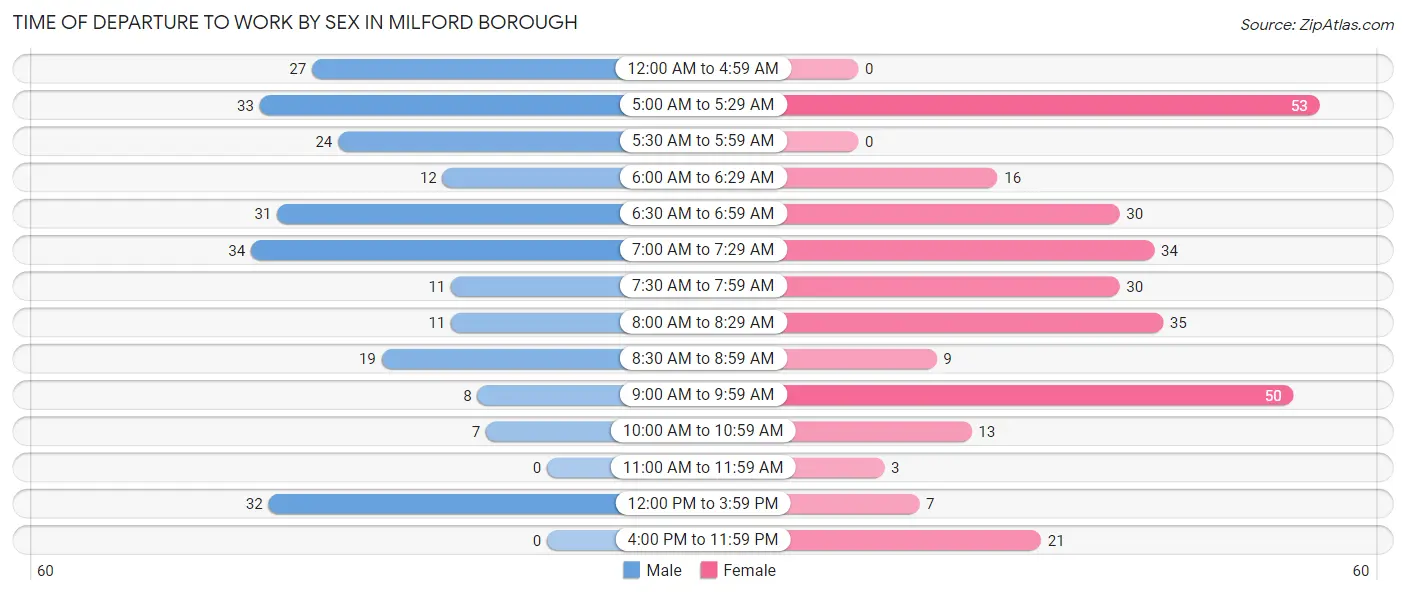
| Time of Departure | Male | Female |
| 12:00 AM to 4:59 AM | 27 (10.8%) | 0 (0.0%) |
| 5:00 AM to 5:29 AM | 33 (13.3%) | 53 (17.6%) |
| 5:30 AM to 5:59 AM | 24 (9.6%) | 0 (0.0%) |
| 6:00 AM to 6:29 AM | 12 (4.8%) | 16 (5.3%) |
| 6:30 AM to 6:59 AM | 31 (12.4%) | 30 (10.0%) |
| 7:00 AM to 7:29 AM | 34 (13.7%) | 34 (11.3%) |
| 7:30 AM to 7:59 AM | 11 (4.4%) | 30 (10.0%) |
| 8:00 AM to 8:29 AM | 11 (4.4%) | 35 (11.6%) |
| 8:30 AM to 8:59 AM | 19 (7.6%) | 9 (3.0%) |
| 9:00 AM to 9:59 AM | 8 (3.2%) | 50 (16.6%) |
| 10:00 AM to 10:59 AM | 7 (2.8%) | 13 (4.3%) |
| 11:00 AM to 11:59 AM | 0 (0.0%) | 3 (1.0%) |
| 12:00 PM to 3:59 PM | 32 (12.9%) | 7 (2.3%) |
| 4:00 PM to 11:59 PM | 0 (0.0%) | 21 (7.0%) |
| Total | 249 (100.0%) | 301 (100.0%) |
Housing Occupancy in Milford borough
Occupancy by Ownership in Milford borough
Of the total 525 dwellings in Milford borough, owner-occupied units account for 413 (78.7%), while renter-occupied units make up 112 (21.3%).
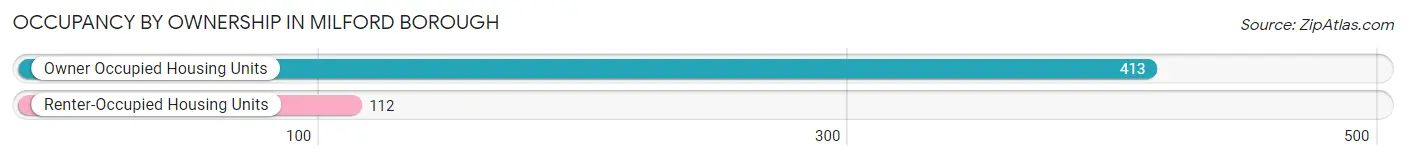
| Occupancy | # Housing Units | % Housing Units |
| Owner Occupied Housing Units | 413 | 78.7% |
| Renter-Occupied Housing Units | 112 | 21.3% |
| Total Occupied Housing Units | 525 | 100.0% |
Occupancy by Household Size in Milford borough
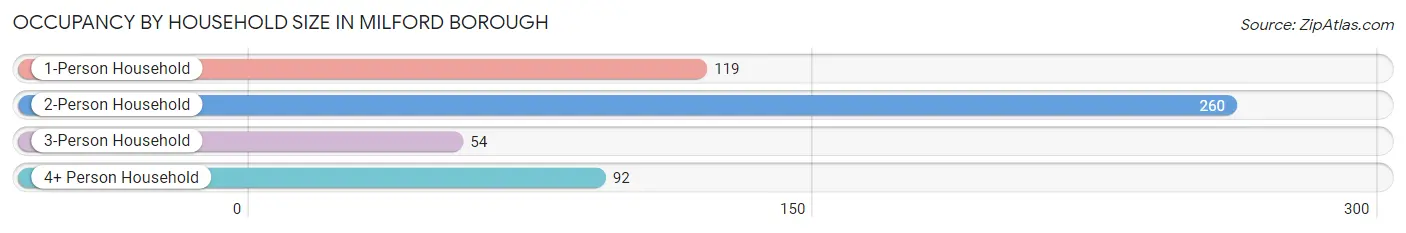
| Household Size | # Housing Units | % Housing Units |
| 1-Person Household | 119 | 22.7% |
| 2-Person Household | 260 | 49.5% |
| 3-Person Household | 54 | 10.3% |
| 4+ Person Household | 92 | 17.5% |
| Total Housing Units | 525 | 100.0% |
Occupancy by Ownership by Household Size in Milford borough
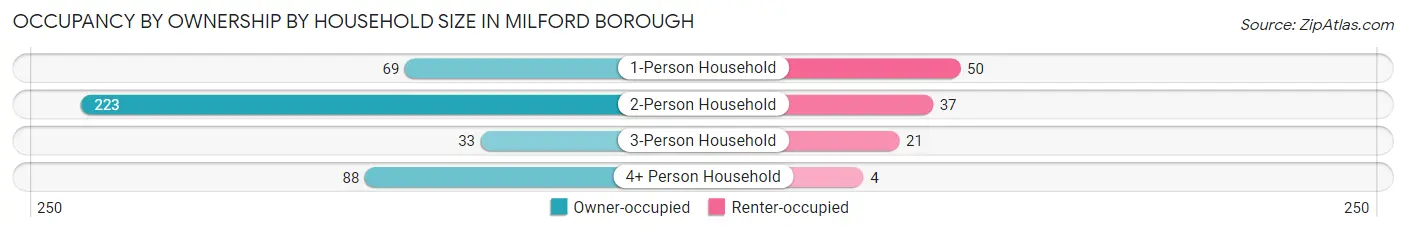
| Household Size | Owner-occupied | Renter-occupied |
| 1-Person Household | 69 (58.0%) | 50 (42.0%) |
| 2-Person Household | 223 (85.8%) | 37 (14.2%) |
| 3-Person Household | 33 (61.1%) | 21 (38.9%) |
| 4+ Person Household | 88 (95.7%) | 4 (4.3%) |
| Total Housing Units | 413 (78.7%) | 112 (21.3%) |
Occupancy by Educational Attainment in Milford borough
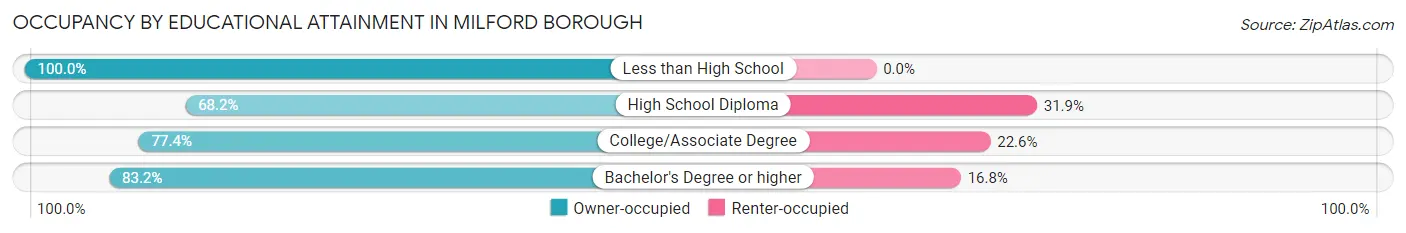
| Household Size | Owner-occupied | Renter-occupied |
| Less than High School | 37 (100.0%) | 0 (0.0%) |
| High School Diploma | 92 (68.1%) | 43 (31.9%) |
| College/Associate Degree | 130 (77.4%) | 38 (22.6%) |
| Bachelor's Degree or higher | 154 (83.2%) | 31 (16.8%) |
Occupancy by Age of Householder in Milford borough
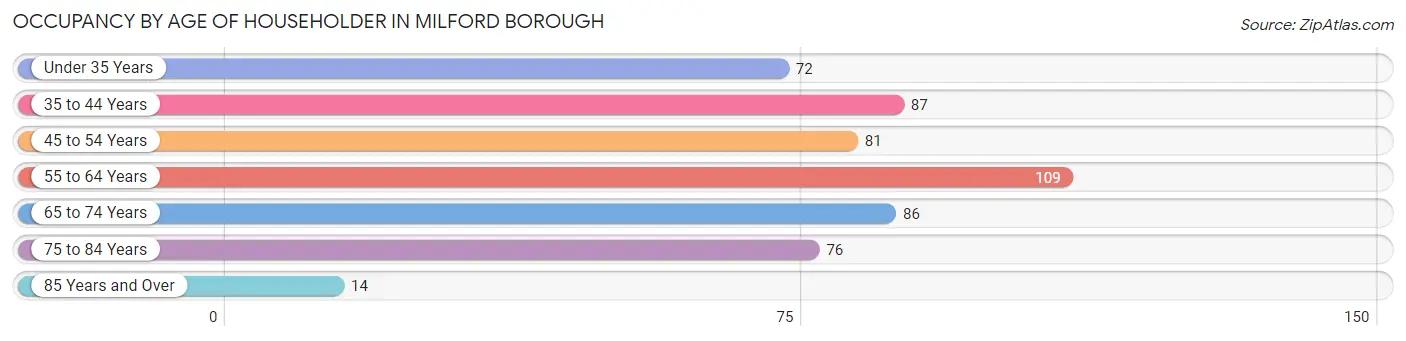
| Age Bracket | # Households | % Households |
| Under 35 Years | 72 | 13.7% |
| 35 to 44 Years | 87 | 16.6% |
| 45 to 54 Years | 81 | 15.4% |
| 55 to 64 Years | 109 | 20.8% |
| 65 to 74 Years | 86 | 16.4% |
| 75 to 84 Years | 76 | 14.5% |
| 85 Years and Over | 14 | 2.7% |
| Total | 525 | 100.0% |
Housing Finances in Milford borough
Median Income by Occupancy in Milford borough
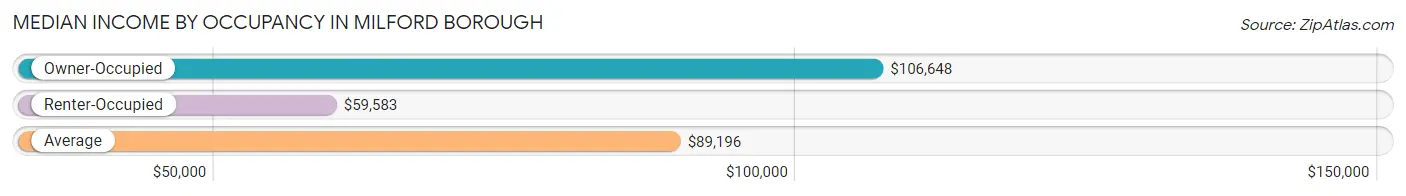
| Occupancy Type | # Households | Median Income |
| Owner-Occupied | 413 (78.7%) | $106,648 |
| Renter-Occupied | 112 (21.3%) | $59,583 |
| Average | 525 (100.0%) | $89,196 |
Occupancy by Householder Income Bracket in Milford borough
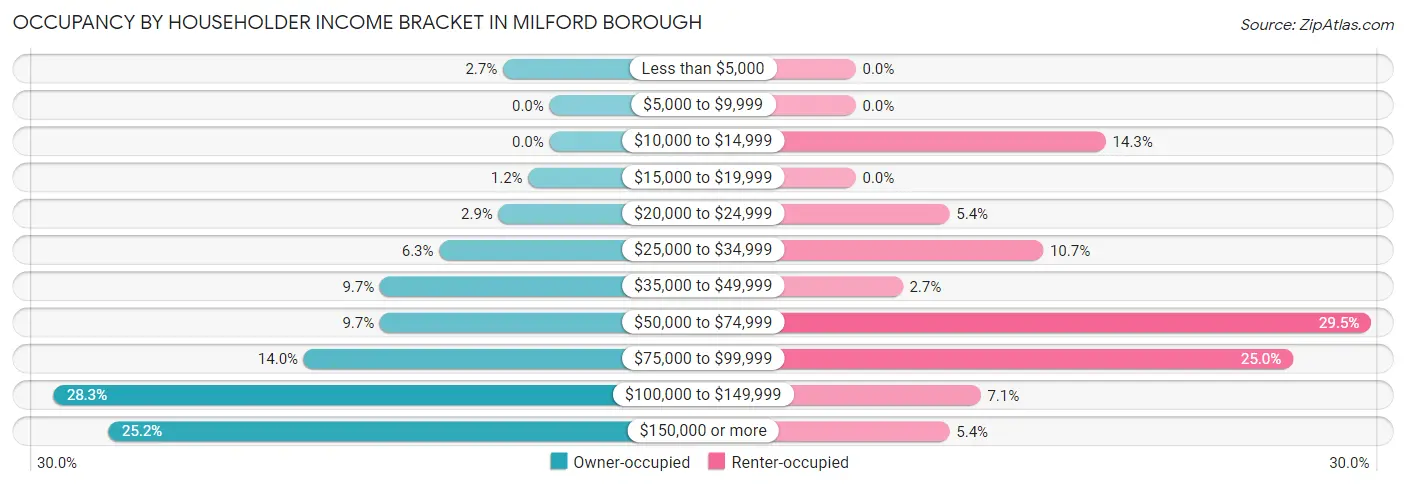
| Income Bracket | Owner-occupied | Renter-occupied |
| Less than $5,000 | 11 (2.7%) | 0 (0.0%) |
| $5,000 to $9,999 | 0 (0.0%) | 0 (0.0%) |
| $10,000 to $14,999 | 0 (0.0%) | 16 (14.3%) |
| $15,000 to $19,999 | 5 (1.2%) | 0 (0.0%) |
| $20,000 to $24,999 | 12 (2.9%) | 6 (5.4%) |
| $25,000 to $34,999 | 26 (6.3%) | 12 (10.7%) |
| $35,000 to $49,999 | 40 (9.7%) | 3 (2.7%) |
| $50,000 to $74,999 | 40 (9.7%) | 33 (29.5%) |
| $75,000 to $99,999 | 58 (14.0%) | 28 (25.0%) |
| $100,000 to $149,999 | 117 (28.3%) | 8 (7.1%) |
| $150,000 or more | 104 (25.2%) | 6 (5.4%) |
| Total | 413 (100.0%) | 112 (100.0%) |
Monthly Housing Cost Tiers in Milford borough
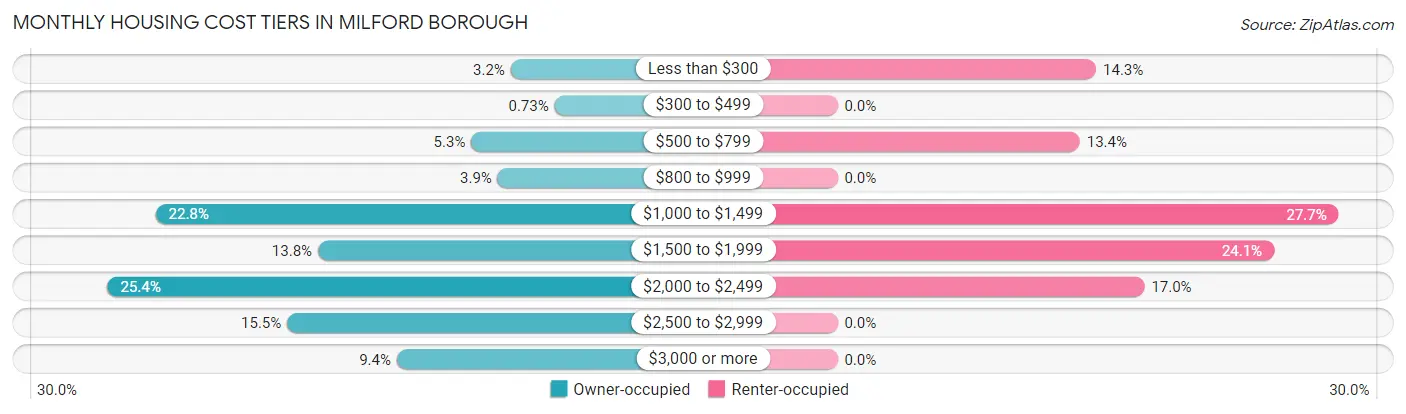
| Monthly Cost | Owner-occupied | Renter-occupied |
| Less than $300 | 13 (3.2%) | 16 (14.3%) |
| $300 to $499 | 3 (0.7%) | 0 (0.0%) |
| $500 to $799 | 22 (5.3%) | 15 (13.4%) |
| $800 to $999 | 16 (3.9%) | 0 (0.0%) |
| $1,000 to $1,499 | 94 (22.8%) | 31 (27.7%) |
| $1,500 to $1,999 | 57 (13.8%) | 27 (24.1%) |
| $2,000 to $2,499 | 105 (25.4%) | 19 (17.0%) |
| $2,500 to $2,999 | 64 (15.5%) | 0 (0.0%) |
| $3,000 or more | 39 (9.4%) | 0 (0.0%) |
| Total | 413 (100.0%) | 112 (100.0%) |
Physical Housing Characteristics in Milford borough
Housing Structures in Milford borough
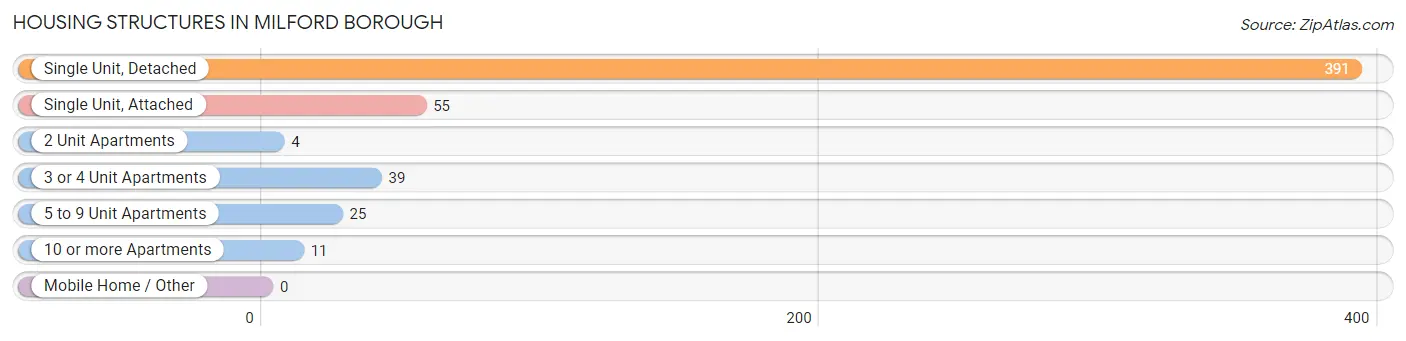
| Structure Type | # Housing Units | % Housing Units |
| Single Unit, Detached | 391 | 74.5% |
| Single Unit, Attached | 55 | 10.5% |
| 2 Unit Apartments | 4 | 0.8% |
| 3 or 4 Unit Apartments | 39 | 7.4% |
| 5 to 9 Unit Apartments | 25 | 4.8% |
| 10 or more Apartments | 11 | 2.1% |
| Mobile Home / Other | 0 | 0.0% |
| Total | 525 | 100.0% |
Housing Structures by Occupancy in Milford borough
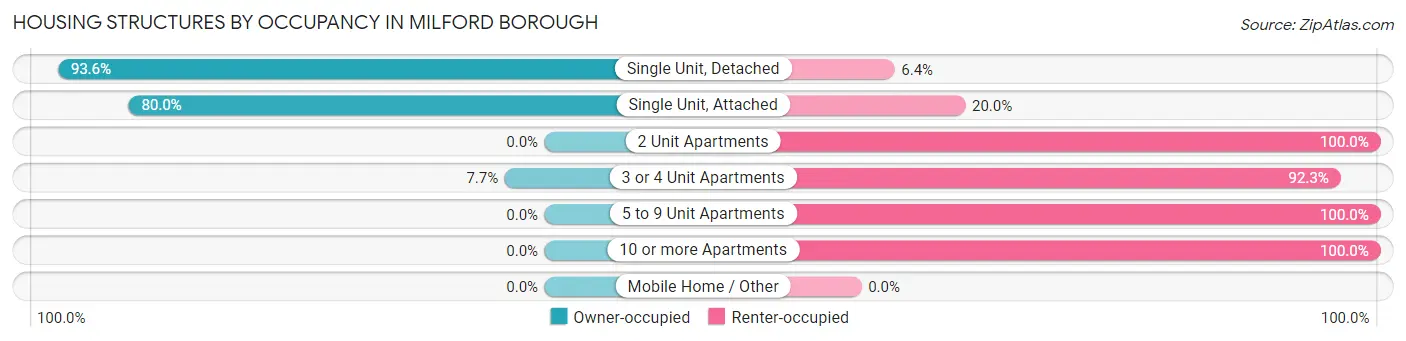
| Structure Type | Owner-occupied | Renter-occupied |
| Single Unit, Detached | 366 (93.6%) | 25 (6.4%) |
| Single Unit, Attached | 44 (80.0%) | 11 (20.0%) |
| 2 Unit Apartments | 0 (0.0%) | 4 (100.0%) |
| 3 or 4 Unit Apartments | 3 (7.7%) | 36 (92.3%) |
| 5 to 9 Unit Apartments | 0 (0.0%) | 25 (100.0%) |
| 10 or more Apartments | 0 (0.0%) | 11 (100.0%) |
| Mobile Home / Other | 0 (0.0%) | 0 (0.0%) |
| Total | 413 (78.7%) | 112 (21.3%) |
Housing Structures by Number of Rooms in Milford borough
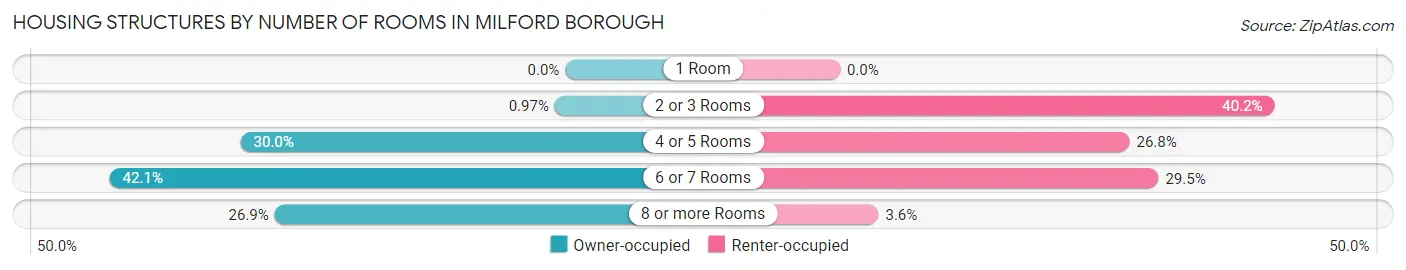
| Number of Rooms | Owner-occupied | Renter-occupied |
| 1 Room | 0 (0.0%) | 0 (0.0%) |
| 2 or 3 Rooms | 4 (1.0%) | 45 (40.2%) |
| 4 or 5 Rooms | 124 (30.0%) | 30 (26.8%) |
| 6 or 7 Rooms | 174 (42.1%) | 33 (29.5%) |
| 8 or more Rooms | 111 (26.9%) | 4 (3.6%) |
| Total | 413 (100.0%) | 112 (100.0%) |
Housing Structure by Heating Type in Milford borough
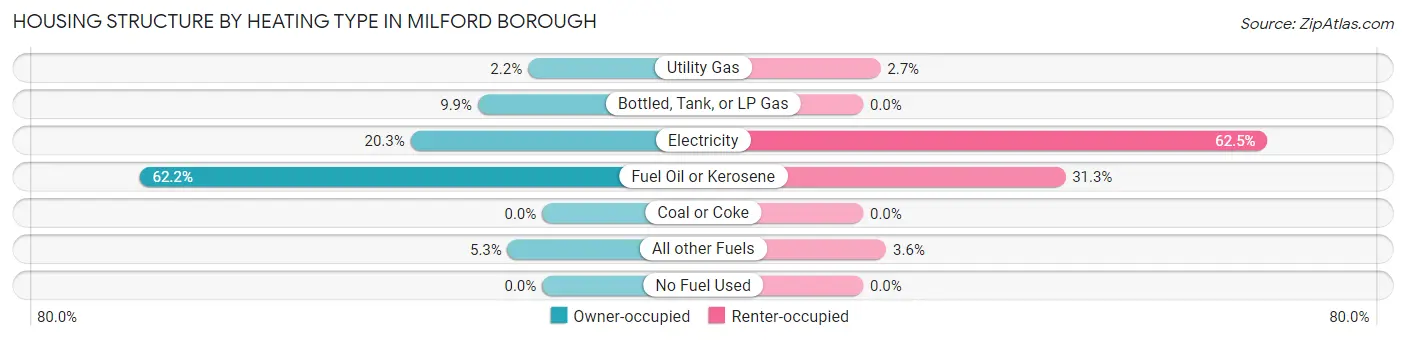
| Heating Type | Owner-occupied | Renter-occupied |
| Utility Gas | 9 (2.2%) | 3 (2.7%) |
| Bottled, Tank, or LP Gas | 41 (9.9%) | 0 (0.0%) |
| Electricity | 84 (20.3%) | 70 (62.5%) |
| Fuel Oil or Kerosene | 257 (62.2%) | 35 (31.2%) |
| Coal or Coke | 0 (0.0%) | 0 (0.0%) |
| All other Fuels | 22 (5.3%) | 4 (3.6%) |
| No Fuel Used | 0 (0.0%) | 0 (0.0%) |
| Total | 413 (100.0%) | 112 (100.0%) |
Household Vehicle Usage in Milford borough
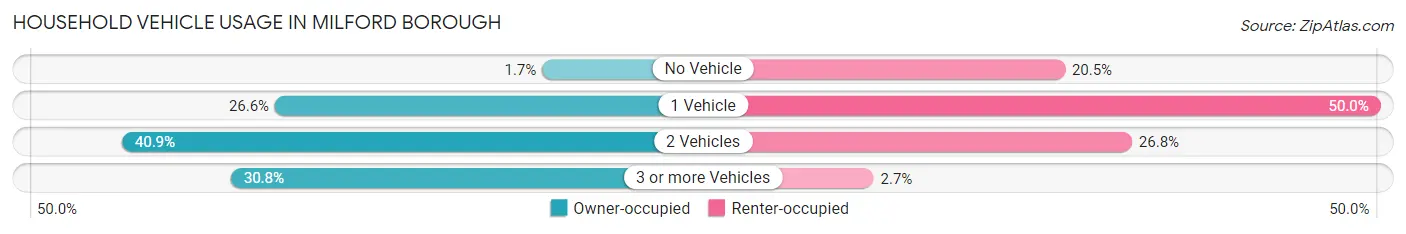
| Vehicles per Household | Owner-occupied | Renter-occupied |
| No Vehicle | 7 (1.7%) | 23 (20.5%) |
| 1 Vehicle | 110 (26.6%) | 56 (50.0%) |
| 2 Vehicles | 169 (40.9%) | 30 (26.8%) |
| 3 or more Vehicles | 127 (30.7%) | 3 (2.7%) |
| Total | 413 (100.0%) | 112 (100.0%) |
Real Estate & Mortgages in Milford borough
Real Estate and Mortgage Overview in Milford borough
| Characteristic | Without Mortgage | With Mortgage |
| Housing Units | 159 | 254 |
| Median Property Value | $242,600 | $297,500 |
| Median Household Income | $86,458 | $74 |
| Monthly Housing Costs | $1,150 | $39 |
| Real Estate Taxes | $9,082 | $5 |
Property Value by Mortgage Status in Milford borough
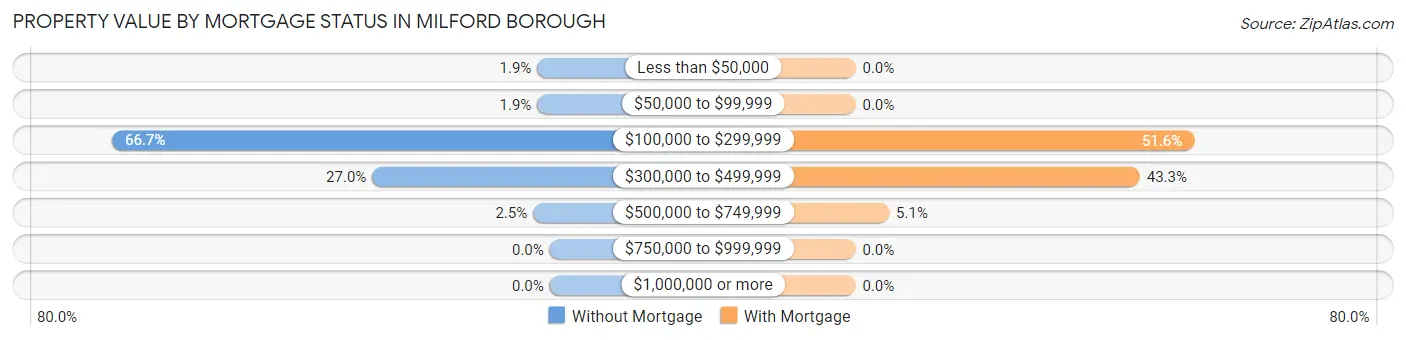
| Property Value | Without Mortgage | With Mortgage |
| Less than $50,000 | 3 (1.9%) | 0 (0.0%) |
| $50,000 to $99,999 | 3 (1.9%) | 0 (0.0%) |
| $100,000 to $299,999 | 106 (66.7%) | 131 (51.6%) |
| $300,000 to $499,999 | 43 (27.0%) | 110 (43.3%) |
| $500,000 to $749,999 | 4 (2.5%) | 13 (5.1%) |
| $750,000 to $999,999 | 0 (0.0%) | 0 (0.0%) |
| $1,000,000 or more | 0 (0.0%) | 0 (0.0%) |
| Total | 159 (100.0%) | 254 (100.0%) |
Household Income by Mortgage Status in Milford borough
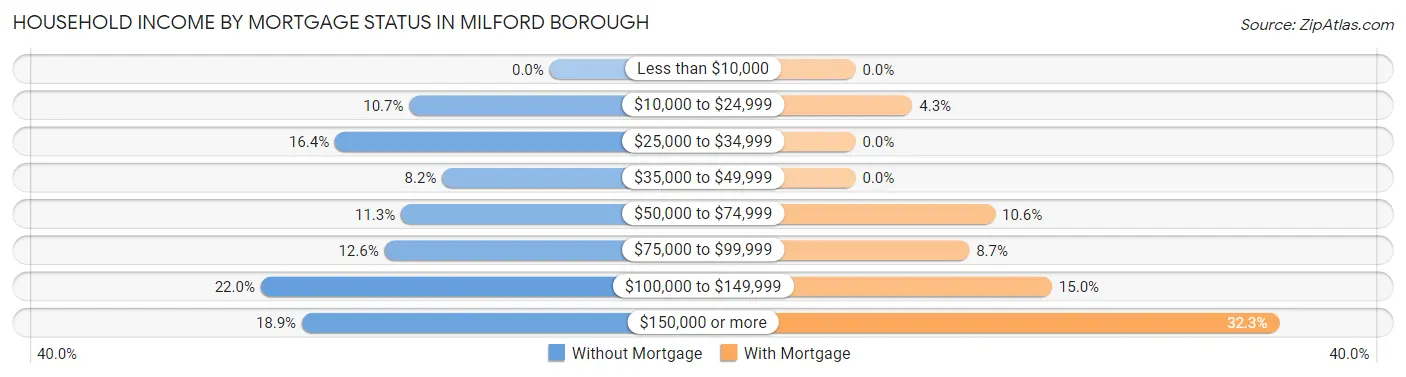
| Household Income | Without Mortgage | With Mortgage |
| Less than $10,000 | 0 (0.0%) | 0 (0.0%) |
| $10,000 to $24,999 | 17 (10.7%) | 11 (4.3%) |
| $25,000 to $34,999 | 26 (16.4%) | 0 (0.0%) |
| $35,000 to $49,999 | 13 (8.2%) | 0 (0.0%) |
| $50,000 to $74,999 | 18 (11.3%) | 27 (10.6%) |
| $75,000 to $99,999 | 20 (12.6%) | 22 (8.7%) |
| $100,000 to $149,999 | 35 (22.0%) | 38 (15.0%) |
| $150,000 or more | 30 (18.9%) | 82 (32.3%) |
| Total | 159 (100.0%) | 254 (100.0%) |
Property Value to Household Income Ratio in Milford borough
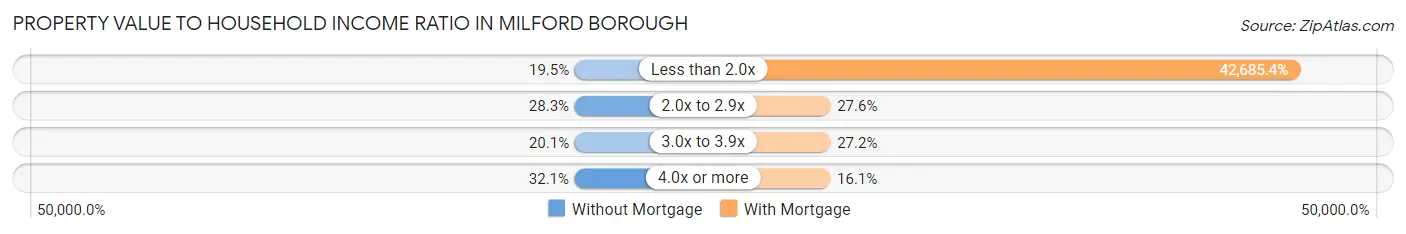
| Value-to-Income Ratio | Without Mortgage | With Mortgage |
| Less than 2.0x | 31 (19.5%) | 108,421 (42,685.4%) |
| 2.0x to 2.9x | 45 (28.3%) | 70 (27.6%) |
| 3.0x to 3.9x | 32 (20.1%) | 69 (27.2%) |
| 4.0x or more | 51 (32.1%) | 41 (16.1%) |
| Total | 159 (100.0%) | 254 (100.0%) |
Real Estate Taxes by Mortgage Status in Milford borough
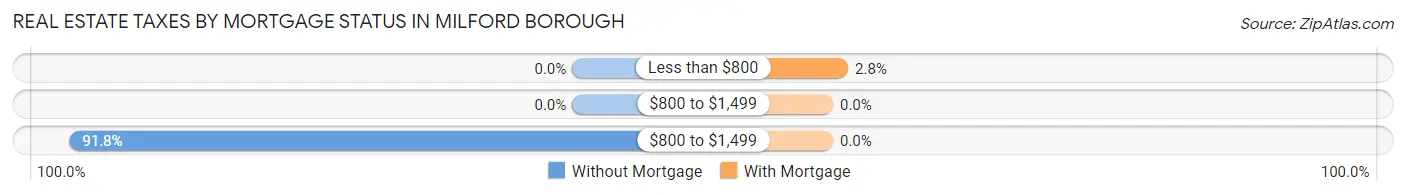
| Property Taxes | Without Mortgage | With Mortgage |
| Less than $800 | 0 (0.0%) | 7 (2.8%) |
| $800 to $1,499 | 0 (0.0%) | 0 (0.0%) |
| $800 to $1,499 | 146 (91.8%) | 0 (0.0%) |
| Total | 159 (100.0%) | 254 (100.0%) |
Health & Disability in Milford borough
Health Insurance Coverage by Age in Milford borough
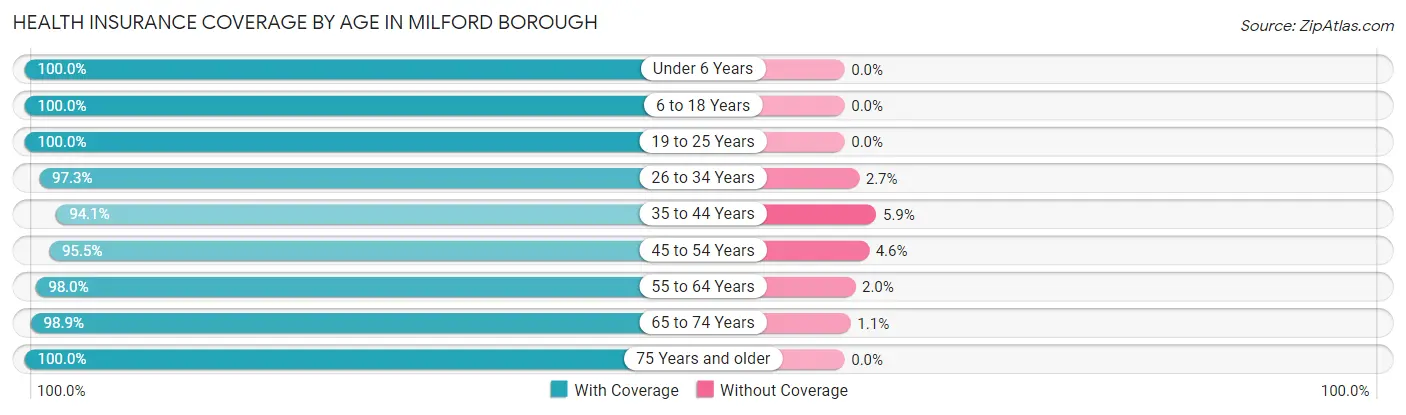
| Age Bracket | With Coverage | Without Coverage |
| Under 6 Years | 92 (100.0%) | 0 (0.0%) |
| 6 to 18 Years | 117 (100.0%) | 0 (0.0%) |
| 19 to 25 Years | 100 (100.0%) | 0 (0.0%) |
| 26 to 34 Years | 108 (97.3%) | 3 (2.7%) |
| 35 to 44 Years | 159 (94.1%) | 10 (5.9%) |
| 45 to 54 Years | 126 (95.5%) | 6 (4.5%) |
| 55 to 64 Years | 196 (98.0%) | 4 (2.0%) |
| 65 to 74 Years | 173 (98.9%) | 2 (1.1%) |
| 75 Years and older | 148 (100.0%) | 0 (0.0%) |
| Total | 1,219 (98.0%) | 25 (2.0%) |
Health Insurance Coverage by Citizenship Status in Milford borough
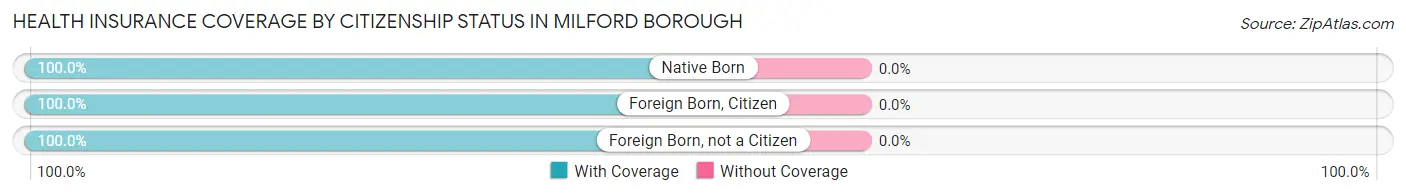
| Citizenship Status | With Coverage | Without Coverage |
| Native Born | 92 (100.0%) | 0 (0.0%) |
| Foreign Born, Citizen | 117 (100.0%) | 0 (0.0%) |
| Foreign Born, not a Citizen | 100 (100.0%) | 0 (0.0%) |
Health Insurance Coverage by Household Income in Milford borough
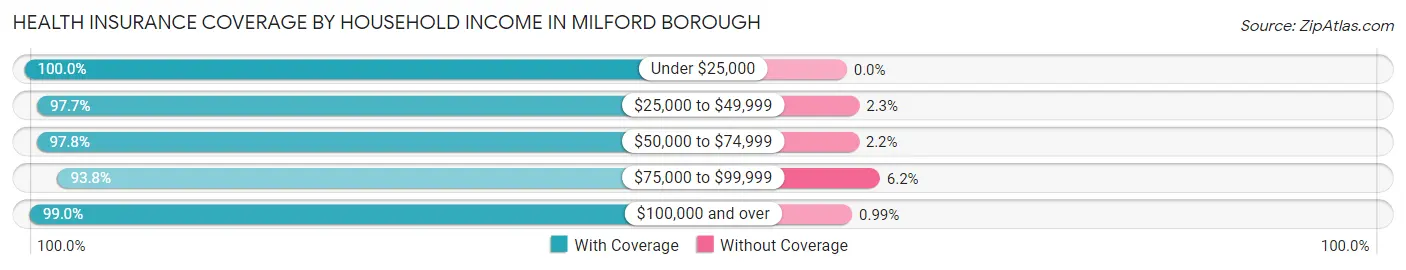
| Household Income | With Coverage | Without Coverage |
| Under $25,000 | 75 (100.0%) | 0 (0.0%) |
| $25,000 to $49,999 | 125 (97.7%) | 3 (2.3%) |
| $50,000 to $74,999 | 131 (97.8%) | 3 (2.2%) |
| $75,000 to $99,999 | 182 (93.8%) | 12 (6.2%) |
| $100,000 and over | 699 (99.0%) | 7 (1.0%) |
Public vs Private Health Insurance Coverage by Age in Milford borough
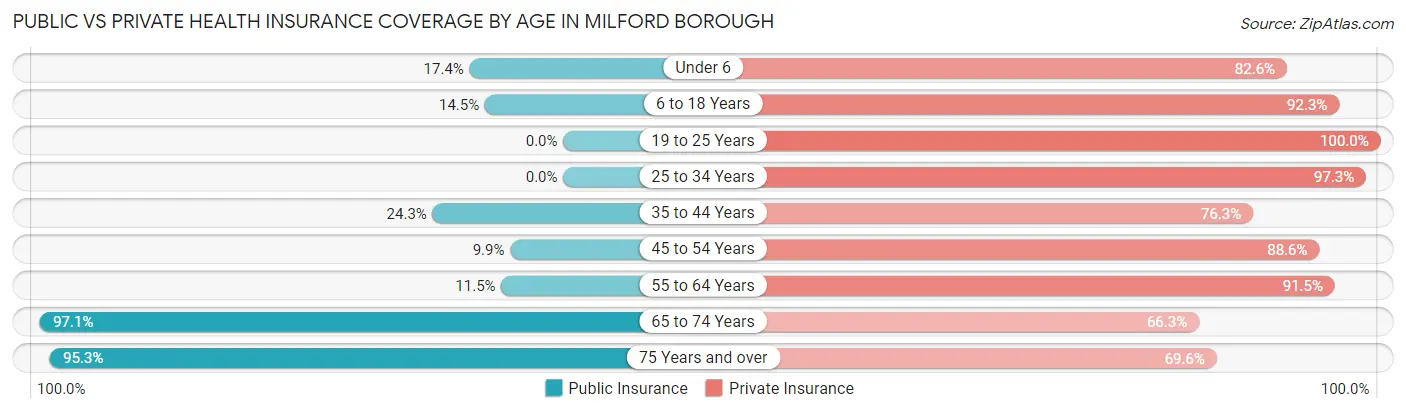
| Age Bracket | Public Insurance | Private Insurance |
| Under 6 | 16 (17.4%) | 76 (82.6%) |
| 6 to 18 Years | 17 (14.5%) | 108 (92.3%) |
| 19 to 25 Years | 0 (0.0%) | 100 (100.0%) |
| 25 to 34 Years | 0 (0.0%) | 108 (97.3%) |
| 35 to 44 Years | 41 (24.3%) | 129 (76.3%) |
| 45 to 54 Years | 13 (9.9%) | 117 (88.6%) |
| 55 to 64 Years | 23 (11.5%) | 183 (91.5%) |
| 65 to 74 Years | 170 (97.1%) | 116 (66.3%) |
| 75 Years and over | 141 (95.3%) | 103 (69.6%) |
| Total | 421 (33.8%) | 1,040 (83.6%) |
Disability Status by Sex by Age in Milford borough
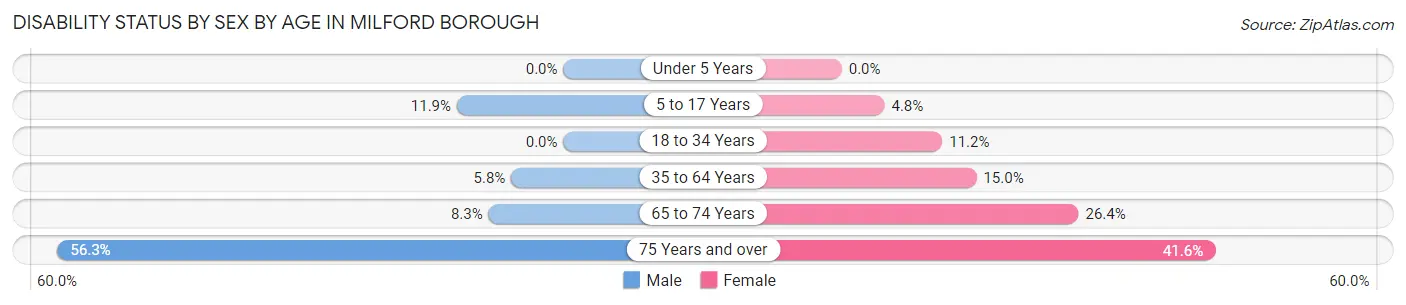
| Age Bracket | Male | Female |
| Under 5 Years | 0 (0.0%) | 0 (0.0%) |
| 5 to 17 Years | 7 (11.9%) | 3 (4.8%) |
| 18 to 34 Years | 0 (0.0%) | 15 (11.2%) |
| 35 to 64 Years | 14 (5.8%) | 39 (15.0%) |
| 65 to 74 Years | 7 (8.3%) | 24 (26.4%) |
| 75 Years and over | 40 (56.3%) | 32 (41.6%) |
Disability Class by Sex by Age in Milford borough
Disability Class: Hearing Difficulty
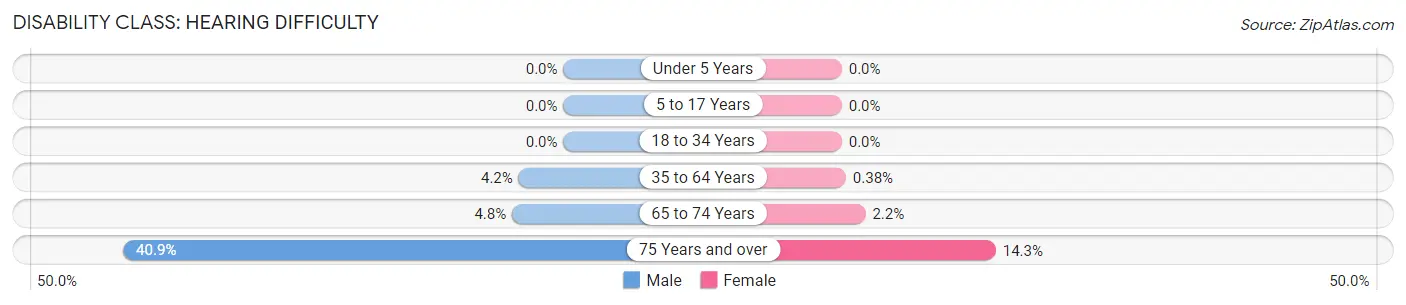
| Age Bracket | Male | Female |
| Under 5 Years | 0 (0.0%) | 0 (0.0%) |
| 5 to 17 Years | 0 (0.0%) | 0 (0.0%) |
| 18 to 34 Years | 0 (0.0%) | 0 (0.0%) |
| 35 to 64 Years | 10 (4.2%) | 1 (0.4%) |
| 65 to 74 Years | 4 (4.8%) | 2 (2.2%) |
| 75 Years and over | 29 (40.8%) | 11 (14.3%) |
Disability Class: Vision Difficulty
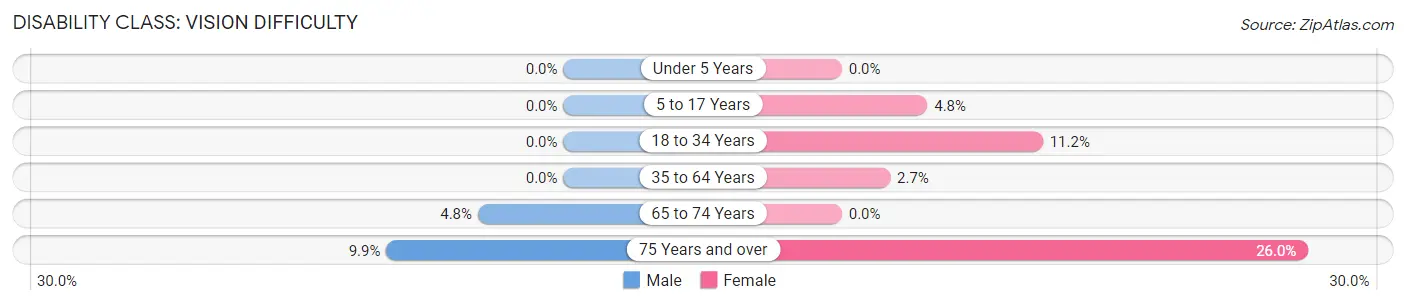
| Age Bracket | Male | Female |
| Under 5 Years | 0 (0.0%) | 0 (0.0%) |
| 5 to 17 Years | 0 (0.0%) | 3 (4.8%) |
| 18 to 34 Years | 0 (0.0%) | 15 (11.2%) |
| 35 to 64 Years | 0 (0.0%) | 7 (2.7%) |
| 65 to 74 Years | 4 (4.8%) | 0 (0.0%) |
| 75 Years and over | 7 (9.9%) | 20 (26.0%) |
Disability Class: Cognitive Difficulty
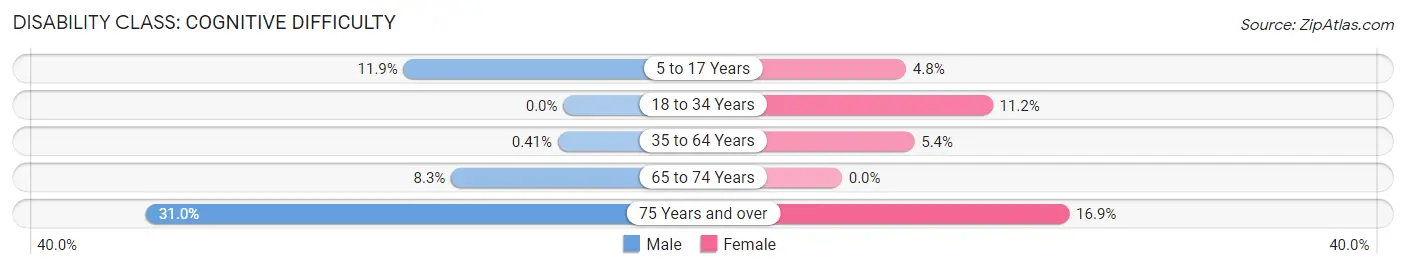
| Age Bracket | Male | Female |
| 5 to 17 Years | 7 (11.9%) | 3 (4.8%) |
| 18 to 34 Years | 0 (0.0%) | 15 (11.2%) |
| 35 to 64 Years | 1 (0.4%) | 14 (5.4%) |
| 65 to 74 Years | 7 (8.3%) | 0 (0.0%) |
| 75 Years and over | 22 (31.0%) | 13 (16.9%) |
Disability Class: Ambulatory Difficulty
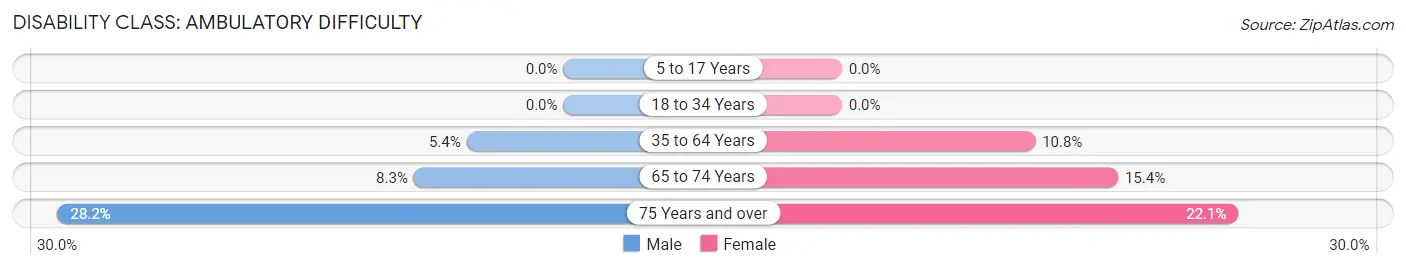
| Age Bracket | Male | Female |
| 5 to 17 Years | 0 (0.0%) | 0 (0.0%) |
| 18 to 34 Years | 0 (0.0%) | 0 (0.0%) |
| 35 to 64 Years | 13 (5.4%) | 28 (10.8%) |
| 65 to 74 Years | 7 (8.3%) | 14 (15.4%) |
| 75 Years and over | 20 (28.2%) | 17 (22.1%) |
Disability Class: Self-Care Difficulty
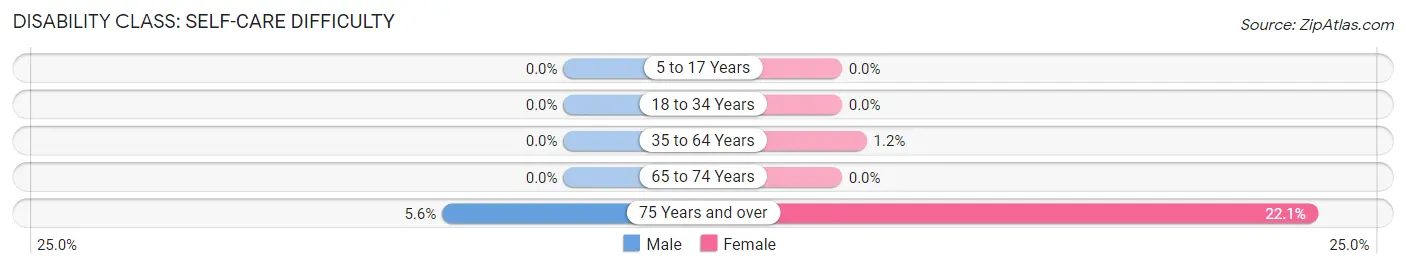
| Age Bracket | Male | Female |
| 5 to 17 Years | 0 (0.0%) | 0 (0.0%) |
| 18 to 34 Years | 0 (0.0%) | 0 (0.0%) |
| 35 to 64 Years | 0 (0.0%) | 3 (1.1%) |
| 65 to 74 Years | 0 (0.0%) | 0 (0.0%) |
| 75 Years and over | 4 (5.6%) | 17 (22.1%) |
Technology Access in Milford borough
Computing Device Access in Milford borough
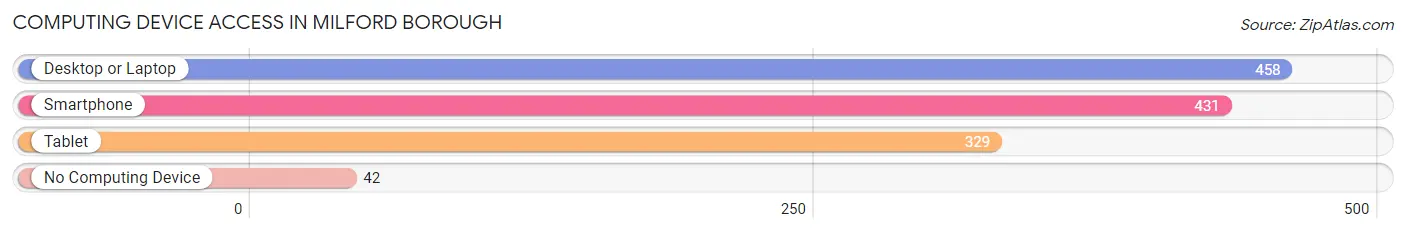
| Device Type | # Households | % Households |
| Desktop or Laptop | 458 | 87.2% |
| Smartphone | 431 | 82.1% |
| Tablet | 329 | 62.7% |
| No Computing Device | 42 | 8.0% |
| Total | 525 | 100.0% |
Internet Access in Milford borough
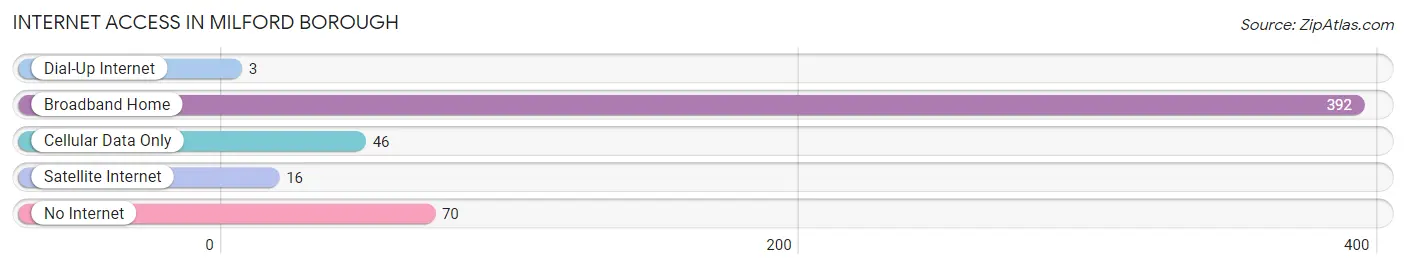
| Internet Type | # Households | % Households |
| Dial-Up Internet | 3 | 0.6% |
| Broadband Home | 392 | 74.7% |
| Cellular Data Only | 46 | 8.8% |
| Satellite Internet | 16 | 3.0% |
| No Internet | 70 | 13.3% |
| Total | 525 | 100.0% |
Milford borough Summary
Milford Borough is a small borough located in Hunterdon County, New Jersey. It is situated on the banks of the Delaware River and is part of the larger Delaware Valley region. The borough has a population of approximately 1,400 people and covers an area of 0.7 square miles.
History
The area that is now Milford Borough was first settled in the late 17th century by Dutch and English settlers. The area was originally part of Amwell Township, which was established in 1708. In 1845, Milford Borough was officially incorporated as a separate municipality.
The borough was named after the nearby Milford Creek, which was named after a mill that was located on the creek. The mill was owned by a man named John Milford, who was one of the first settlers in the area.
The borough was an important stop on the Delaware and Raritan Canal, which was built in the early 19th century. The canal was used to transport goods and passengers between New York City and Philadelphia.
The borough was also an important stop on the Pennsylvania Railroad, which was built in the mid-19th century. The railroad was used to transport goods and passengers between New York City and Philadelphia.
The borough was also home to a number of industries, including a paper mill, a grist mill, a saw mill, and a tannery. These industries provided employment for many of the borough’s residents.
Geography
Milford Borough is located in Hunterdon County, New Jersey. It is situated on the banks of the Delaware River and is part of the larger Delaware Valley region. The borough has a total area of 0.7 square miles, all of which is land.
The borough is bordered by Amwell Township to the north, Delaware Township to the east, and Raritan Township to the south and west. The borough is located approximately 25 miles southwest of Trenton, the state capital, and approximately 50 miles northeast of Philadelphia.
Economy
The economy of Milford Borough is largely based on agriculture and tourism. The borough is home to several farms, which produce a variety of crops, including corn, soybeans, and hay. The borough is also home to several wineries, which produce a variety of wines.
The borough is also home to several small businesses, including restaurants, shops, and galleries. The borough is also home to several bed and breakfasts, which attract tourists from all over the world.
Demographics
As of the 2010 census, the population of Milford Borough was 1,400. The racial makeup of the borough was 94.3% White, 2.3% African American, 0.3% Native American, 0.7% Asian, 0.1% Pacific Islander, and 2.3% from other races. Hispanic or Latino of any race were 4.3% of the population.
The median household income in Milford Borough was $68,750, and the median family income was $76,250. The per capita income in the borough was $30,917. About 4.3% of families and 5.3% of the population were below the poverty line, including 6.3% of those under age 18 and 4.3% of those age 65 or over.
Common Questions
What is Per Capita Income in Milford borough?
Per Capita income in Milford borough is $45,514.
What is the Median Family Income in Milford borough?
Median Family Income in Milford borough is $107,917.
What is the Median Household income in Milford borough?
Median Household Income in Milford borough is $89,196.
What is Income or Wage Gap in Milford borough?
Income or Wage Gap in Milford borough is 29.8%.
Women in Milford borough earn 70.2 cents for every dollar earned by a man.
What is Inequality or Gini Index in Milford borough?
Inequality or Gini Index in Milford borough is 0.39.
What is the Total Population of Milford borough?
Total Population of Milford borough is 1,244.
What is the Total Male Population of Milford borough?
Total Male Population of Milford borough is 598.
What is the Total Female Population of Milford borough?
Total Female Population of Milford borough is 646.
What is the Ratio of Males per 100 Females in Milford borough?
There are 92.57 Males per 100 Females in Milford borough.
What is the Ratio of Females per 100 Males in Milford borough?
There are 108.03 Females per 100 Males in Milford borough.
What is the Median Population Age in Milford borough?
Median Population Age in Milford borough is 48.9 Years.
What is the Average Family Size in Milford borough
Average Family Size in Milford borough is 2.7 People.
What is the Average Household Size in Milford borough
Average Household Size in Milford borough is 2.4 People.
How Large is the Labor Force in Milford borough?
There are 696 People in the Labor Forcein in Milford borough.
What is the Percentage of People in the Labor Force in Milford borough?
65.0% of People are in the Labor Force in Milford borough.
What is the Unemployment Rate in Milford borough?
Unemployment Rate in Milford borough is 7.3%.