Smithville, NJ Map & Demographics
Smithville Map
Smithville Overview
$43,720
PER CAPITA INCOME
$78,445
AVG FAMILY INCOME
$67,453
AVG HOUSEHOLD INCOME
7.7%
WAGE / INCOME GAP [ % ]
92.3¢/ $1
WAGE / INCOME GAP [ $ ]
0.41
INEQUALITY / GINI INDEX
9,135
TOTAL POPULATION
4,225
MALE POPULATION
4,910
FEMALE POPULATION
86.05
MALES / 100 FEMALES
116.21
FEMALES / 100 MALES
48.9
MEDIAN AGE
2.8
AVG FAMILY SIZE
2.0
AVG HOUSEHOLD SIZE
4,768
LABOR FORCE [ PEOPLE ]
58.7%
PERCENT IN LABOR FORCE
4.3%
UNEMPLOYMENT RATE
Smithville Area Codes
Income in Smithville
Income Overview in Smithville
Per Capita Income in Smithville is $43,720, while median incomes of families and households are $78,445 and $67,453 respectively.
| Characteristic | Number | Measure |
| Per Capita Income | 9,135 | $43,720 |
| Median Family Income | 2,335 | $78,445 |
| Mean Family Income | 2,335 | $108,347 |
| Median Household Income | 4,574 | $67,453 |
| Mean Household Income | 4,574 | $86,471 |
| Income Deficit | 2,335 | $0 |
| Wage / Income Gap (%) | 9,135 | 7.66% |
| Wage / Income Gap ($) | 9,135 | 92.34¢ per $1 |
| Gini / Inequality Index | 9,135 | 0.41 |
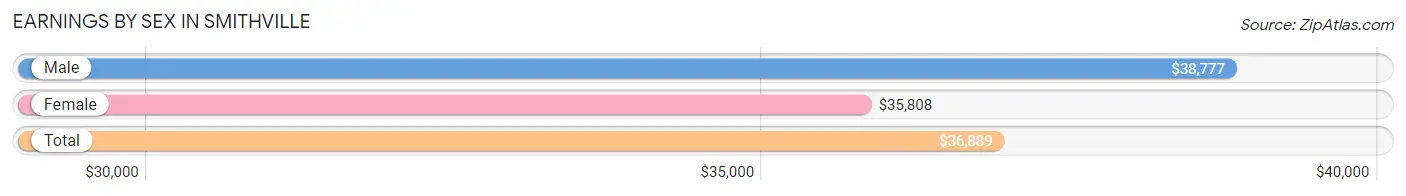
Earnings by Sex in Smithville
Average Earnings in Smithville are $36,889, $38,777 for men and $35,808 for women, a difference of 7.7%.
| Sex | Number | Average Earnings |
| Male | 2,507 (50.1%) | $38,777 |
| Female | 2,499 (49.9%) | $35,808 |
| Total | 5,006 (100.0%) | $36,889 |
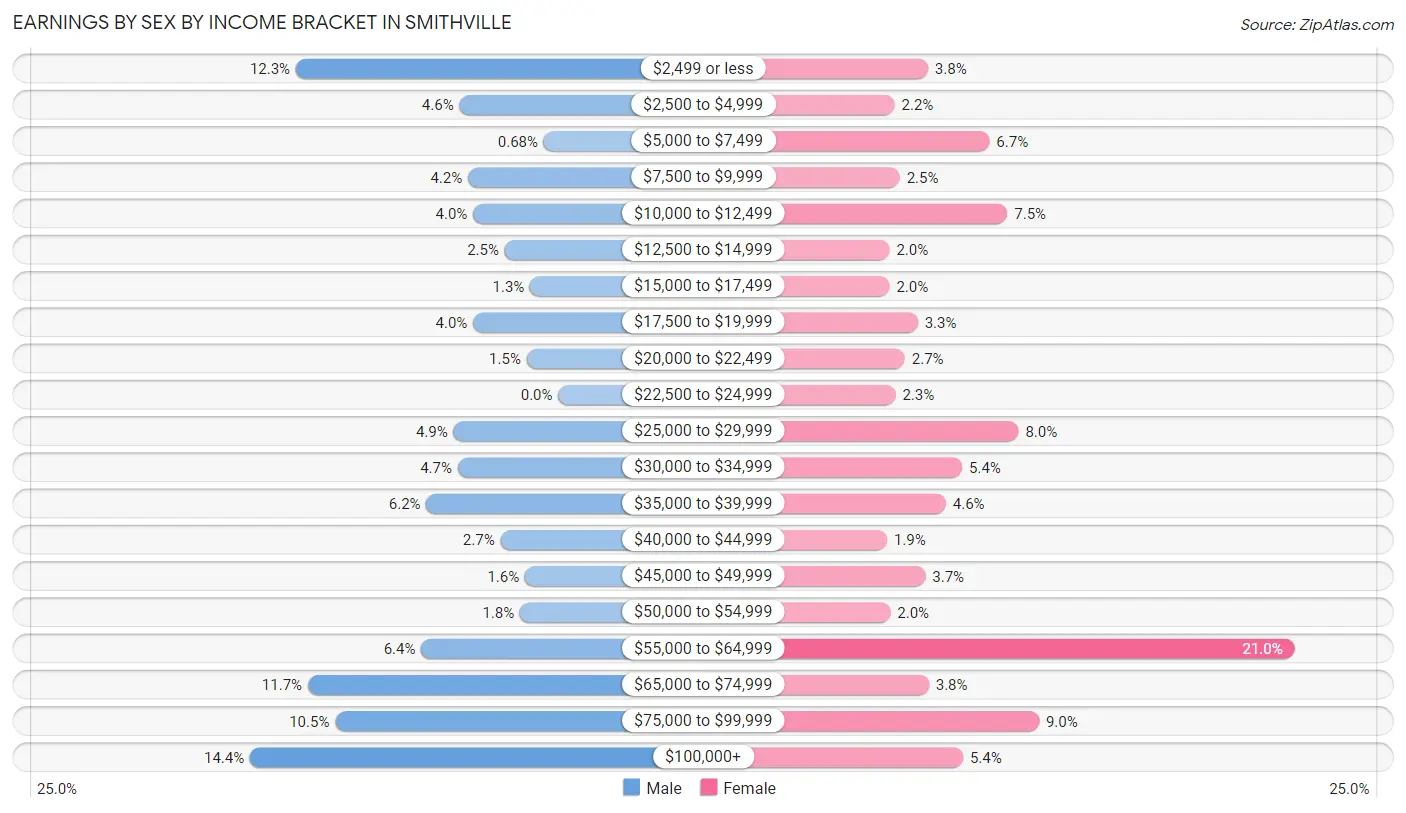
Earnings by Sex by Income Bracket in Smithville
The most common earnings brackets in Smithville are $100,000+ for men (362 | 14.4%) and $55,000 to $64,999 for women (524 | 21.0%).
| Income | Male | Female |
| $2,499 or less | 308 (12.3%) | 95 (3.8%) |
| $2,500 to $4,999 | 116 (4.6%) | 56 (2.2%) |
| $5,000 to $7,499 | 17 (0.7%) | 167 (6.7%) |
| $7,500 to $9,999 | 106 (4.2%) | 62 (2.5%) |
| $10,000 to $12,499 | 100 (4.0%) | 188 (7.5%) |
| $12,500 to $14,999 | 63 (2.5%) | 50 (2.0%) |
| $15,000 to $17,499 | 33 (1.3%) | 50 (2.0%) |
| $17,500 to $19,999 | 100 (4.0%) | 83 (3.3%) |
| $20,000 to $22,499 | 37 (1.5%) | 68 (2.7%) |
| $22,500 to $24,999 | 0 (0.0%) | 57 (2.3%) |
| $25,000 to $29,999 | 123 (4.9%) | 201 (8.0%) |
| $30,000 to $34,999 | 118 (4.7%) | 135 (5.4%) |
| $35,000 to $39,999 | 155 (6.2%) | 116 (4.6%) |
| $40,000 to $44,999 | 68 (2.7%) | 47 (1.9%) |
| $45,000 to $49,999 | 39 (1.6%) | 92 (3.7%) |
| $50,000 to $54,999 | 45 (1.8%) | 51 (2.0%) |
| $55,000 to $64,999 | 161 (6.4%) | 524 (21.0%) |
| $65,000 to $74,999 | 294 (11.7%) | 96 (3.8%) |
| $75,000 to $99,999 | 262 (10.4%) | 225 (9.0%) |
| $100,000+ | 362 (14.4%) | 136 (5.4%) |
| Total | 2,507 (100.0%) | 2,499 (100.0%) |
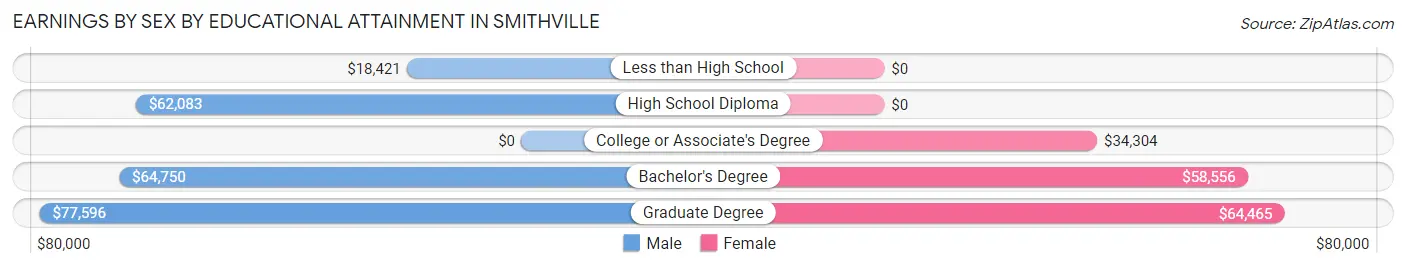
Earnings by Sex by Educational Attainment in Smithville
Average earnings in Smithville are $60,455 for men and $37,371 for women, a difference of 38.2%. Men with an educational attainment of graduate degree enjoy the highest average annual earnings of $77,596, while those with less than high school education earn the least with $18,421. Women with an educational attainment of graduate degree earn the most with the average annual earnings of $64,465, while those with college or associate's degree education have the smallest earnings of $34,304.
| Educational Attainment | Male Income | Female Income |
| Less than High School | $18,421 | $0 |
| High School Diploma | $62,083 | $0 |
| College or Associate's Degree | - | - |
| Bachelor's Degree | $64,750 | $58,556 |
| Graduate Degree | $77,596 | $64,465 |
| Total | $60,455 | $37,371 |
Family Income in Smithville
Family Income Brackets in Smithville
According to the Smithville family income data, there are 710 families falling into the $50,000 to $74,999 income range, which is the most common income bracket and makes up 30.4% of all families. Conversely, the less than $10,000 income bracket is the least frequent group with only 19 families (0.8%) belonging to this category.
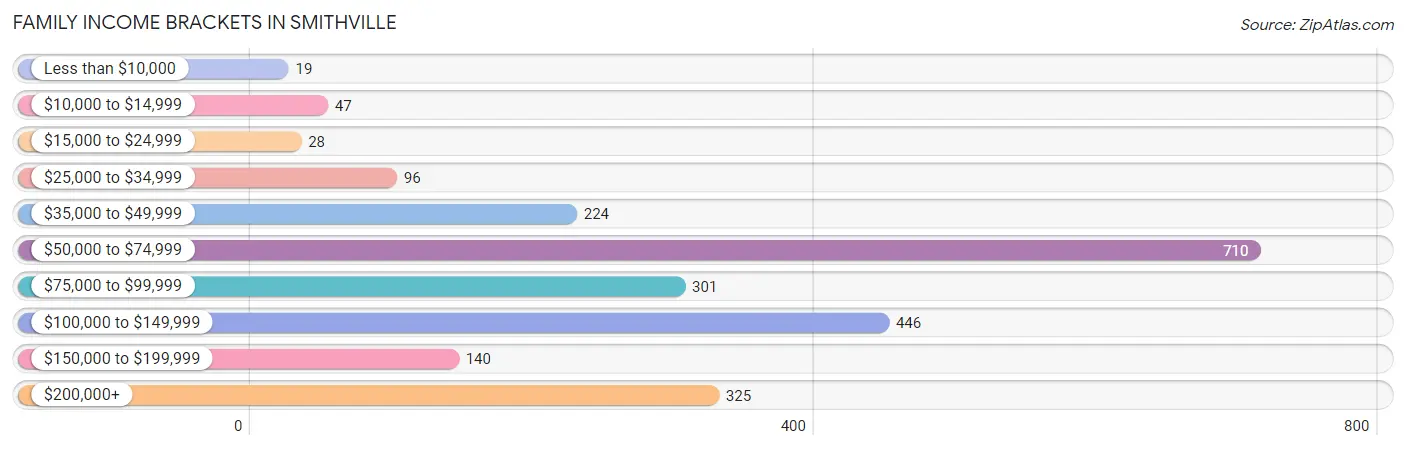
| Income Bracket | # Families | % Families |
| Less than $10,000 | 19 | 0.8% |
| $10,000 to $14,999 | 47 | 2.0% |
| $15,000 to $24,999 | 28 | 1.2% |
| $25,000 to $34,999 | 96 | 4.1% |
| $35,000 to $49,999 | 224 | 9.6% |
| $50,000 to $74,999 | 710 | 30.4% |
| $75,000 to $99,999 | 301 | 12.9% |
| $100,000 to $149,999 | 446 | 19.1% |
| $150,000 to $199,999 | 140 | 6.0% |
| $200,000+ | 325 | 13.9% |
Family Income by Famaliy Size in Smithville
3-person families (584 | 25.0%) account for the highest median family income in Smithville with $125,686 per family, while 3-person families (584 | 25.0%) have the highest median income of $41,895 per family member.
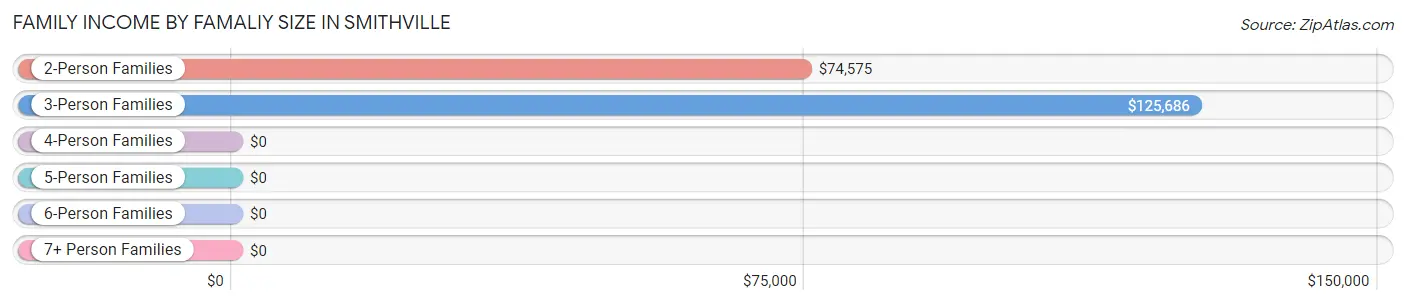
| Income Bracket | # Families | Median Income |
| 2-Person Families | 1,381 (59.1%) | $74,575 |
| 3-Person Families | 584 (25.0%) | $125,686 |
| 4-Person Families | 284 (12.2%) | $0 |
| 5-Person Families | 74 (3.2%) | $0 |
| 6-Person Families | 12 (0.5%) | $0 |
| 7+ Person Families | 0 (0.0%) | $0 |
| Total | 2,335 (100.0%) | $78,445 |
Family Income by Number of Earners in Smithville
The median family income in Smithville is $78,445, with families comprising 3+ earners (208) having the highest median family income of $163,824, while families with 1 earner (615) have the lowest median family income of $63,238, accounting for 8.9% and 26.3% of families, respectively.
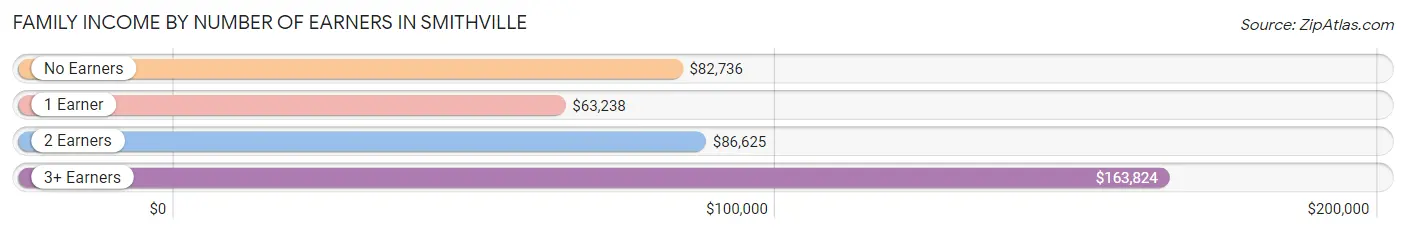
| Number of Earners | # Families | Median Income |
| No Earners | 543 (23.3%) | $82,736 |
| 1 Earner | 615 (26.3%) | $63,238 |
| 2 Earners | 969 (41.5%) | $86,625 |
| 3+ Earners | 208 (8.9%) | $163,824 |
| Total | 2,335 (100.0%) | $78,445 |
Household Income in Smithville
Household Income Brackets in Smithville
With 1,144 households falling in the category, the $50,000 to $74,999 income range is the most frequent in Smithville, accounting for 25.0% of all households. In contrast, only 110 households (2.4%) fall into the less than $10,000 income bracket, making it the least populous group.
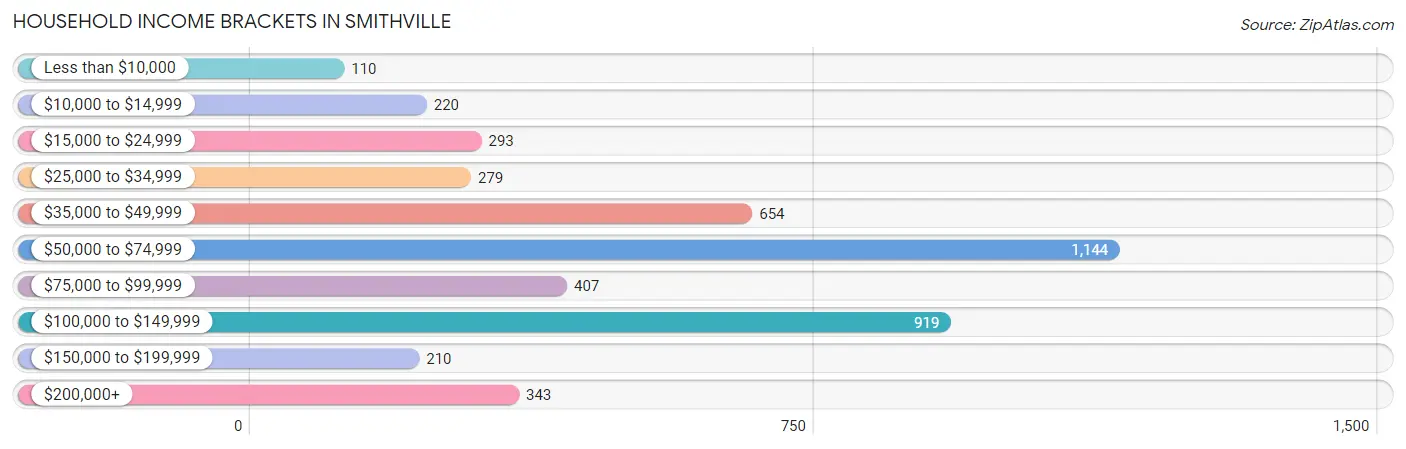
| Income Bracket | # Households | % Households |
| Less than $10,000 | 110 | 2.4% |
| $10,000 to $14,999 | 220 | 4.8% |
| $15,000 to $24,999 | 293 | 6.4% |
| $25,000 to $34,999 | 279 | 6.1% |
| $35,000 to $49,999 | 654 | 14.3% |
| $50,000 to $74,999 | 1,144 | 25.0% |
| $75,000 to $99,999 | 407 | 8.9% |
| $100,000 to $149,999 | 919 | 20.1% |
| $150,000 to $199,999 | 210 | 4.6% |
| $200,000+ | 343 | 7.5% |
Household Income by Householder Age in Smithville
The median household income in Smithville is $67,453, with the highest median household income of $70,093 found in the 45 to 64 years age bracket for the primary householder. A total of 1,674 households (36.6%) fall into this category. Meanwhile, the 15 to 24 years age bracket for the primary householder has the lowest median household income of $0, with 55 households (1.2%) in this group.
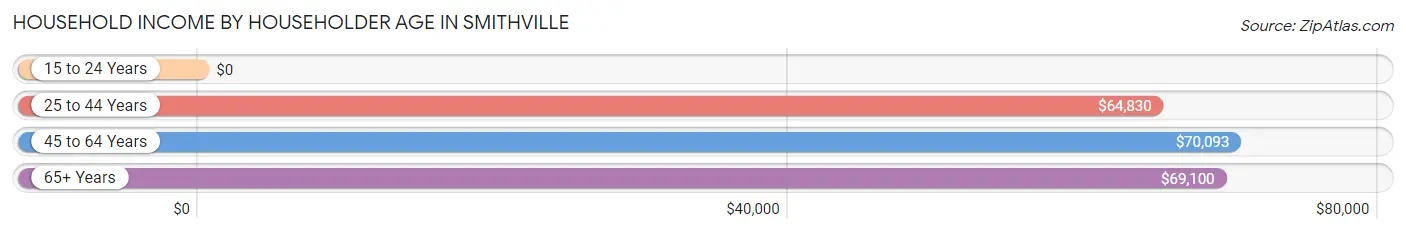
| Income Bracket | # Households | Median Income |
| 15 to 24 Years | 55 (1.2%) | $0 |
| 25 to 44 Years | 1,191 (26.0%) | $64,830 |
| 45 to 64 Years | 1,674 (36.6%) | $70,093 |
| 65+ Years | 1,654 (36.2%) | $69,100 |
| Total | 4,574 (100.0%) | $67,453 |
Poverty in Smithville
Income Below Poverty by Sex and Age in Smithville
With 7.4% poverty level for males and 7.0% for females among the residents of Smithville, 45 to 54 year old males and 18 to 24 year old females are the most vulnerable to poverty, with 120 males (24.2%) and 74 females (36.1%) in their respective age groups living below the poverty level.
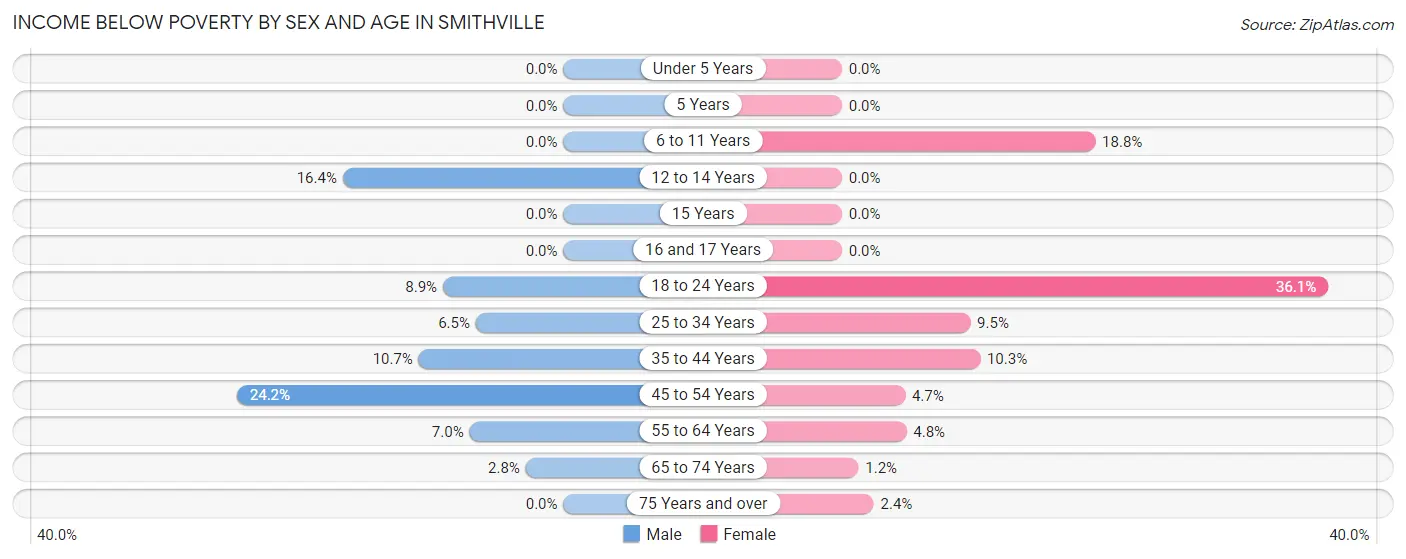
| Age Bracket | Male | Female |
| Under 5 Years | 0 (0.0%) | 0 (0.0%) |
| 5 Years | 0 (0.0%) | 0 (0.0%) |
| 6 to 11 Years | 0 (0.0%) | 57 (18.8%) |
| 12 to 14 Years | 19 (16.4%) | 0 (0.0%) |
| 15 Years | 0 (0.0%) | 0 (0.0%) |
| 16 and 17 Years | 0 (0.0%) | 0 (0.0%) |
| 18 to 24 Years | 32 (8.9%) | 74 (36.1%) |
| 25 to 34 Years | 41 (6.5%) | 88 (9.5%) |
| 35 to 44 Years | 39 (10.7%) | 35 (10.3%) |
| 45 to 54 Years | 120 (24.2%) | 30 (4.7%) |
| 55 to 64 Years | 52 (7.0%) | 30 (4.8%) |
| 65 to 74 Years | 10 (2.8%) | 10 (1.2%) |
| 75 Years and over | 0 (0.0%) | 16 (2.4%) |
| Total | 313 (7.4%) | 340 (7.0%) |
Income Above Poverty by Sex and Age in Smithville
According to the poverty statistics in Smithville, males aged under 5 years and females aged under 5 years are the age groups that are most secure financially, with 100.0% of males and 100.0% of females in these age groups living above the poverty line.
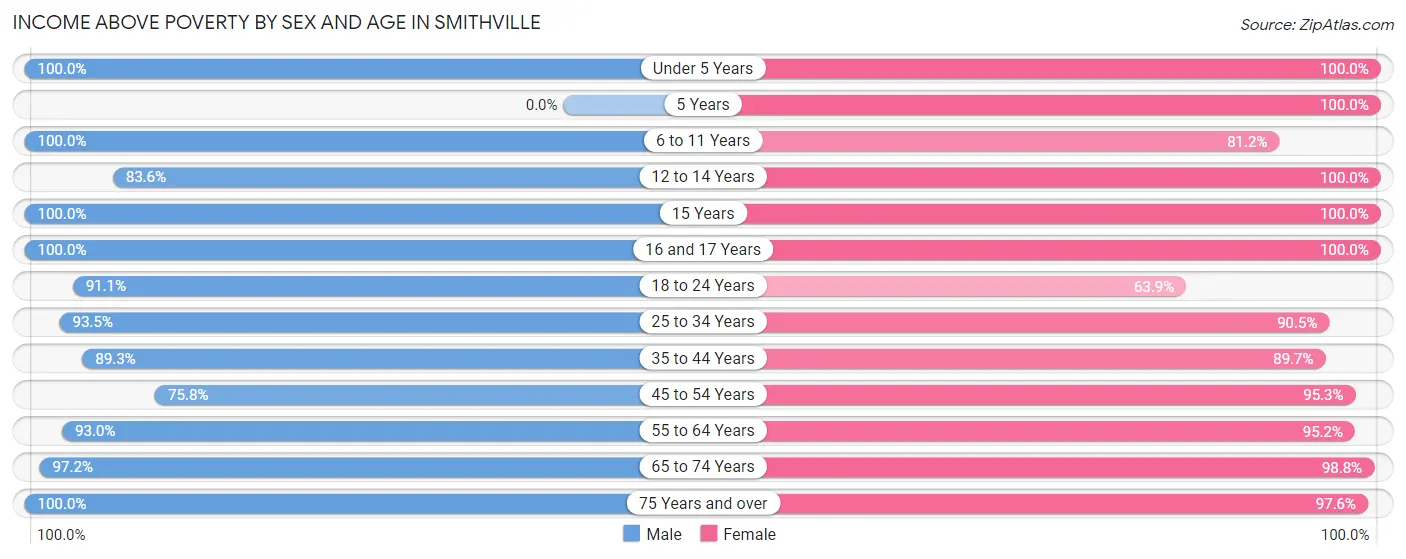
| Age Bracket | Male | Female |
| Under 5 Years | 77 (100.0%) | 89 (100.0%) |
| 5 Years | 0 (0.0%) | 45 (100.0%) |
| 6 to 11 Years | 49 (100.0%) | 246 (81.2%) |
| 12 to 14 Years | 97 (83.6%) | 201 (100.0%) |
| 15 Years | 96 (100.0%) | 14 (100.0%) |
| 16 and 17 Years | 165 (100.0%) | 11 (100.0%) |
| 18 to 24 Years | 326 (91.1%) | 131 (63.9%) |
| 25 to 34 Years | 590 (93.5%) | 835 (90.5%) |
| 35 to 44 Years | 324 (89.3%) | 306 (89.7%) |
| 45 to 54 Years | 375 (75.8%) | 609 (95.3%) |
| 55 to 64 Years | 694 (93.0%) | 596 (95.2%) |
| 65 to 74 Years | 347 (97.2%) | 802 (98.8%) |
| 75 Years and over | 772 (100.0%) | 663 (97.6%) |
| Total | 3,912 (92.6%) | 4,548 (93.0%) |
Income Below Poverty Among Married-Couple Families in Smithville
The poverty statistics for married-couple families in Smithville show that 3.4% or 59 of the total 1,761 families live below the poverty line. Families with 1 or 2 children have the highest poverty rate of 6.0%, comprising of 19 families. On the other hand, families with 3 or 4 children have the lowest poverty rate of 0.0%, which includes 0 families.
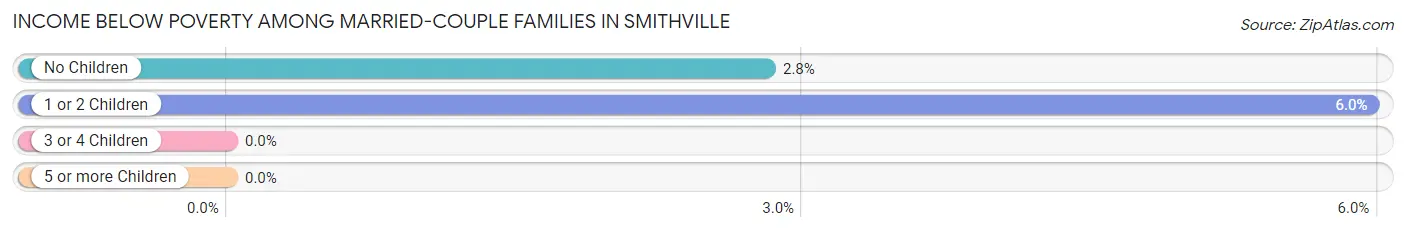
| Children | Above Poverty | Below Poverty |
| No Children | 1,384 (97.2%) | 40 (2.8%) |
| 1 or 2 Children | 300 (94.0%) | 19 (6.0%) |
| 3 or 4 Children | 18 (100.0%) | 0 (0.0%) |
| 5 or more Children | 0 (0.0%) | 0 (0.0%) |
| Total | 1,702 (96.7%) | 59 (3.4%) |
Income Below Poverty Among Single-Parent Households in Smithville
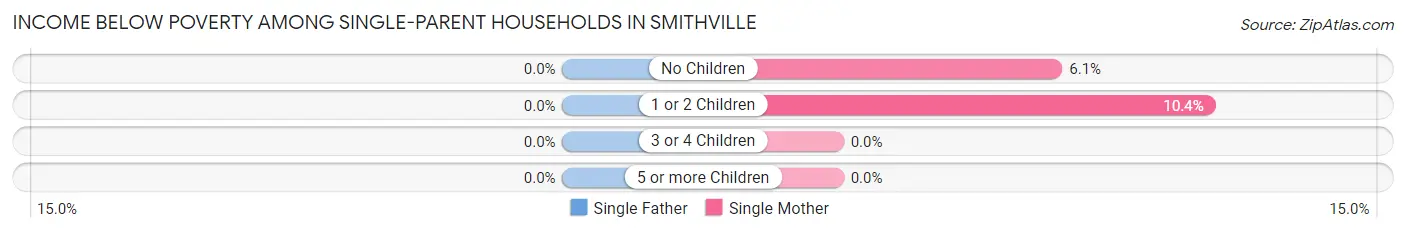
| Children | Single Father | Single Mother |
| No Children | 0 (0.0%) | 19 (6.1%) |
| 1 or 2 Children | 0 (0.0%) | 16 (10.4%) |
| 3 or 4 Children | 0 (0.0%) | 0 (0.0%) |
| 5 or more Children | 0 (0.0%) | 0 (0.0%) |
| Total | 0 (0.0%) | 35 (6.7%) |
Income Below Poverty Among Married-Couple vs Single-Parent Households in Smithville
The poverty data for Smithville shows that 59 of the married-couple family households (3.4%) and 35 of the single-parent households (6.1%) are living below the poverty level. Within the married-couple family households, those with 1 or 2 children have the highest poverty rate, with 19 households (6.0%) falling below the poverty line. Among the single-parent households, those with 1 or 2 children have the highest poverty rate, with 16 household (9.0%) living below poverty.
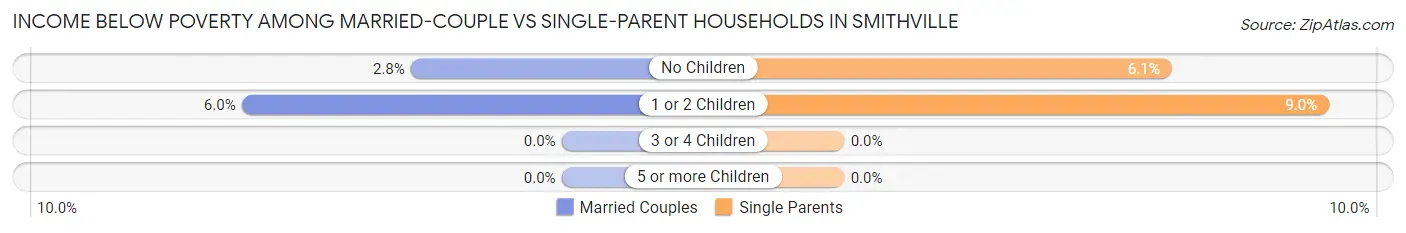
| Children | Married-Couple Families | Single-Parent Households |
| No Children | 40 (2.8%) | 19 (6.1%) |
| 1 or 2 Children | 19 (6.0%) | 16 (9.0%) |
| 3 or 4 Children | 0 (0.0%) | 0 (0.0%) |
| 5 or more Children | 0 (0.0%) | 0 (0.0%) |
| Total | 59 (3.4%) | 35 (6.1%) |
Race in Smithville
The most populous races in Smithville are White / Caucasian (5,828 | 63.8%), Hispanic or Latino (1,221 | 13.4%), and Black / African American (1,217 | 13.3%).
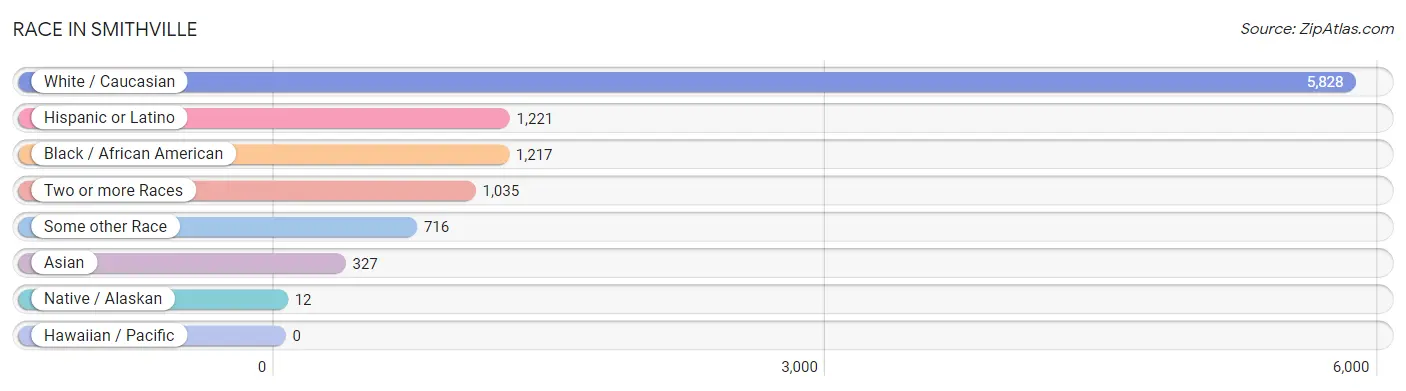
| Race | # Population | % Population |
| Asian | 327 | 3.6% |
| Black / African American | 1,217 | 13.3% |
| Hawaiian / Pacific | 0 | 0.0% |
| Hispanic or Latino | 1,221 | 13.4% |
| Native / Alaskan | 12 | 0.1% |
| White / Caucasian | 5,828 | 63.8% |
| Two or more Races | 1,035 | 11.3% |
| Some other Race | 716 | 7.8% |
| Total | 9,135 | 100.0% |
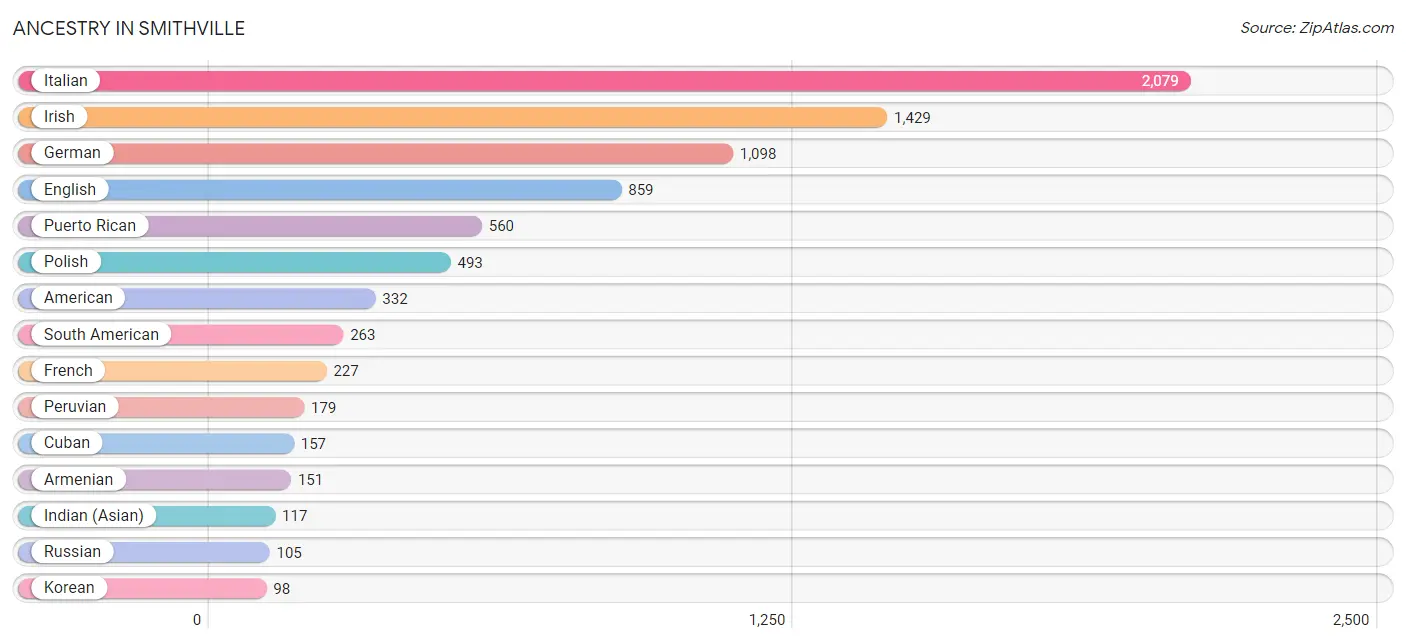
Ancestry in Smithville
The most populous ancestries reported in Smithville are Italian (2,079 | 22.8%), Irish (1,429 | 15.6%), German (1,098 | 12.0%), English (859 | 9.4%), and Puerto Rican (560 | 6.1%), together accounting for 65.9% of all Smithville residents.
| Ancestry | # Population | % Population |
| African | 58 | 0.6% |
| Albanian | 85 | 0.9% |
| American | 332 | 3.6% |
| Arab | 10 | 0.1% |
| Argentinean | 19 | 0.2% |
| Armenian | 151 | 1.7% |
| Austrian | 46 | 0.5% |
| Bhutanese | 17 | 0.2% |
| Blackfeet | 23 | 0.3% |
| British | 80 | 0.9% |
| Cajun | 11 | 0.1% |
| Central American | 22 | 0.2% |
| Cherokee | 12 | 0.1% |
| Colombian | 65 | 0.7% |
| Cuban | 157 | 1.7% |
| Czechoslovakian | 16 | 0.2% |
| Danish | 17 | 0.2% |
| Dominican | 58 | 0.6% |
| Dutch | 50 | 0.5% |
| Eastern European | 42 | 0.5% |
| English | 859 | 9.4% |
| European | 39 | 0.4% |
| French | 227 | 2.5% |
| French Canadian | 62 | 0.7% |
| German | 1,098 | 12.0% |
| Ghanaian | 16 | 0.2% |
| Greek | 85 | 0.9% |
| Guamanian / Chamorro | 5 | 0.1% |
| Honduran | 22 | 0.2% |
| Hungarian | 9 | 0.1% |
| Indian (Asian) | 117 | 1.3% |
| Indonesian | 47 | 0.5% |
| Iranian | 32 | 0.4% |
| Irish | 1,429 | 15.6% |
| Italian | 2,079 | 22.8% |
| Korean | 98 | 1.1% |
| Lithuanian | 45 | 0.5% |
| Mexican | 38 | 0.4% |
| Moroccan | 10 | 0.1% |
| Norwegian | 73 | 0.8% |
| Peruvian | 179 | 2.0% |
| Polish | 493 | 5.4% |
| Portuguese | 62 | 0.7% |
| Puerto Rican | 560 | 6.1% |
| Russian | 105 | 1.1% |
| Scotch-Irish | 96 | 1.1% |
| Scottish | 66 | 0.7% |
| South American | 263 | 2.9% |
| Spaniard | 26 | 0.3% |
| Sri Lankan | 57 | 0.6% |
| Subsaharan African | 74 | 0.8% |
| Swedish | 30 | 0.3% |
| Swiss | 28 | 0.3% |
| Turkish | 17 | 0.2% |
| Ukrainian | 52 | 0.6% |
| Welsh | 43 | 0.5% | View All 56 Rows |
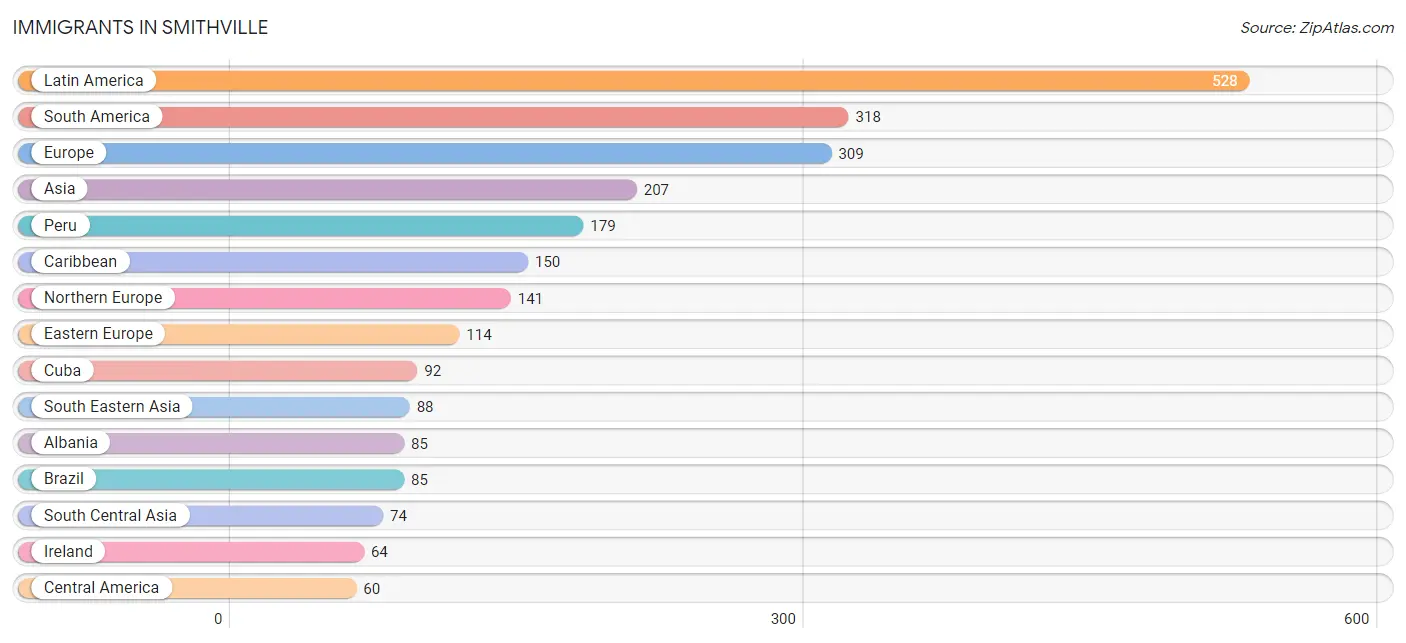
Immigrants in Smithville
The most numerous immigrant groups reported in Smithville came from Latin America (528 | 5.8%), South America (318 | 3.5%), Europe (309 | 3.4%), Asia (207 | 2.3%), and Peru (179 | 2.0%), together accounting for 16.9% of all Smithville residents.
| Immigration Origin | # Population | % Population |
| Africa | 26 | 0.3% |
| Albania | 85 | 0.9% |
| Argentina | 19 | 0.2% |
| Asia | 207 | 2.3% |
| Brazil | 85 | 0.9% |
| Caribbean | 150 | 1.6% |
| Central America | 60 | 0.7% |
| China | 28 | 0.3% |
| Colombia | 35 | 0.4% |
| Cuba | 92 | 1.0% |
| Dominican Republic | 58 | 0.6% |
| Eastern Asia | 28 | 0.3% |
| Eastern Europe | 114 | 1.3% |
| England | 17 | 0.2% |
| Europe | 309 | 3.4% |
| Ghana | 16 | 0.2% |
| Honduras | 22 | 0.2% |
| Iran | 32 | 0.4% |
| Ireland | 64 | 0.7% |
| Italy | 26 | 0.3% |
| Latin America | 528 | 5.8% |
| Mexico | 38 | 0.4% |
| Morocco | 10 | 0.1% |
| Northern Africa | 10 | 0.1% |
| Northern Europe | 141 | 1.5% |
| Pakistan | 42 | 0.5% |
| Peru | 179 | 2.0% |
| Philippines | 41 | 0.4% |
| Poland | 15 | 0.2% |
| South America | 318 | 3.5% |
| South Central Asia | 74 | 0.8% |
| South Eastern Asia | 88 | 1.0% |
| Southern Europe | 26 | 0.3% |
| Taiwan | 28 | 0.3% |
| Turkey | 17 | 0.2% |
| Ukraine | 14 | 0.2% |
| Western Africa | 16 | 0.2% |
| Western Asia | 17 | 0.2% | View All 38 Rows |
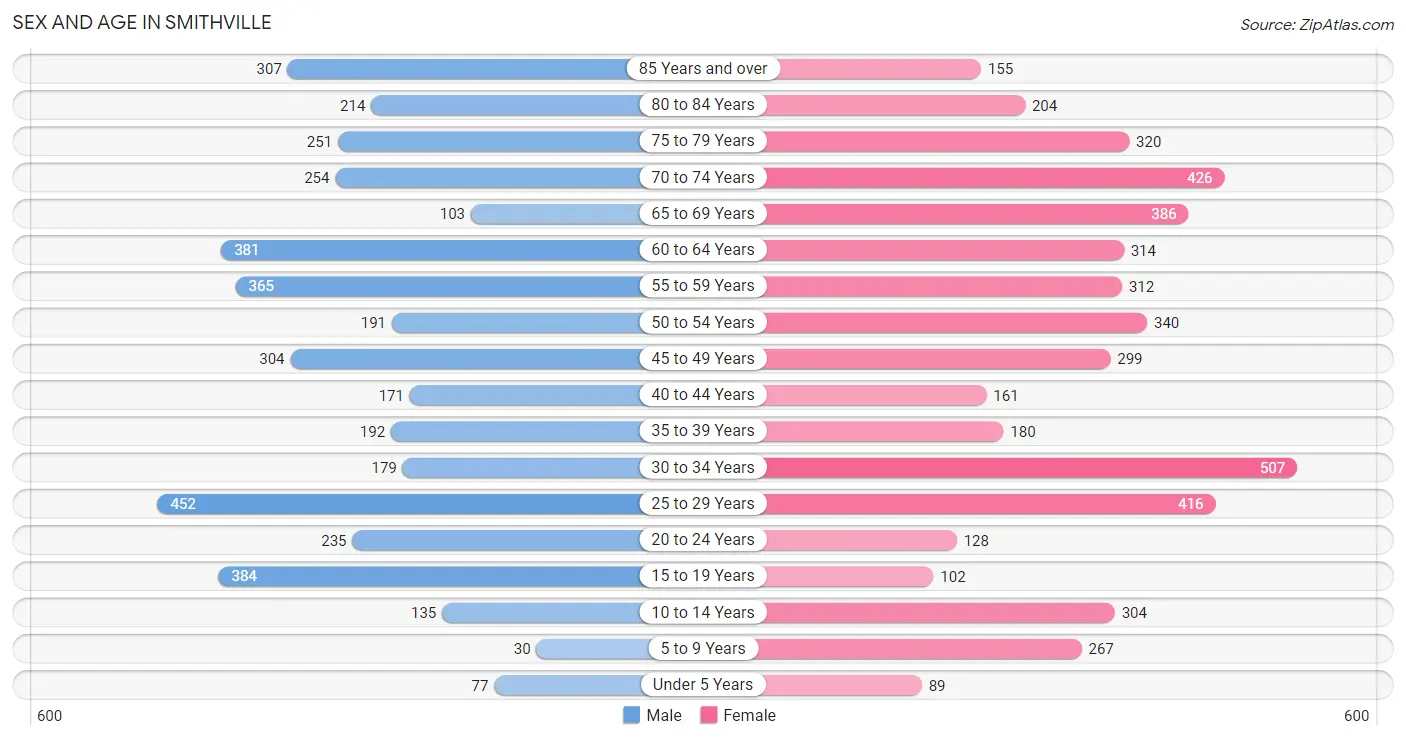
Sex and Age in Smithville
Sex and Age in Smithville
The most populous age groups in Smithville are 25 to 29 Years (452 | 10.7%) for men and 30 to 34 Years (507 | 10.3%) for women.
| Age Bracket | Male | Female |
| Under 5 Years | 77 (1.8%) | 89 (1.8%) |
| 5 to 9 Years | 30 (0.7%) | 267 (5.4%) |
| 10 to 14 Years | 135 (3.2%) | 304 (6.2%) |
| 15 to 19 Years | 384 (9.1%) | 102 (2.1%) |
| 20 to 24 Years | 235 (5.6%) | 128 (2.6%) |
| 25 to 29 Years | 452 (10.7%) | 416 (8.5%) |
| 30 to 34 Years | 179 (4.2%) | 507 (10.3%) |
| 35 to 39 Years | 192 (4.5%) | 180 (3.7%) |
| 40 to 44 Years | 171 (4.1%) | 161 (3.3%) |
| 45 to 49 Years | 304 (7.2%) | 299 (6.1%) |
| 50 to 54 Years | 191 (4.5%) | 340 (6.9%) |
| 55 to 59 Years | 365 (8.6%) | 312 (6.4%) |
| 60 to 64 Years | 381 (9.0%) | 314 (6.4%) |
| 65 to 69 Years | 103 (2.4%) | 386 (7.9%) |
| 70 to 74 Years | 254 (6.0%) | 426 (8.7%) |
| 75 to 79 Years | 251 (5.9%) | 320 (6.5%) |
| 80 to 84 Years | 214 (5.1%) | 204 (4.2%) |
| 85 Years and over | 307 (7.3%) | 155 (3.2%) |
| Total | 4,225 (100.0%) | 4,910 (100.0%) |
Families and Households in Smithville
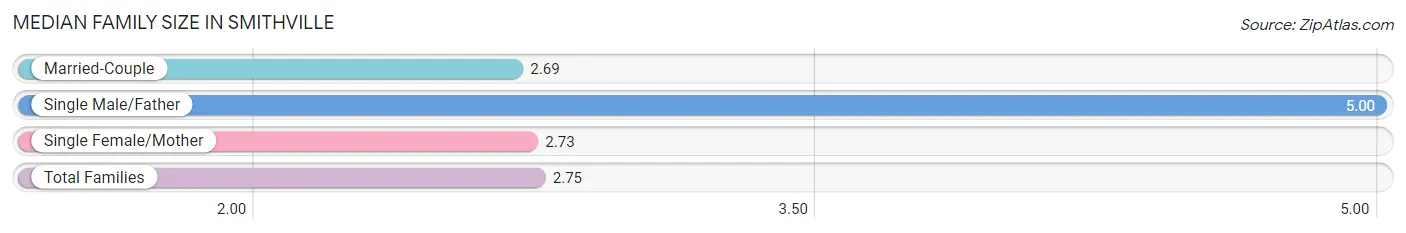
Median Family Size in Smithville
The median family size in Smithville is 2.75 persons per family, with single male/father families (53 | 2.3%) accounting for the largest median family size of 5 persons per family. On the other hand, married-couple families (1,761 | 75.4%) represent the smallest median family size with 2.69 persons per family.
| Family Type | # Families | Family Size |
| Married-Couple | 1,761 (75.4%) | 2.69 |
| Single Male/Father | 53 (2.3%) | 5.00 |
| Single Female/Mother | 521 (22.3%) | 2.73 |
| Total Families | 2,335 (100.0%) | 2.75 |
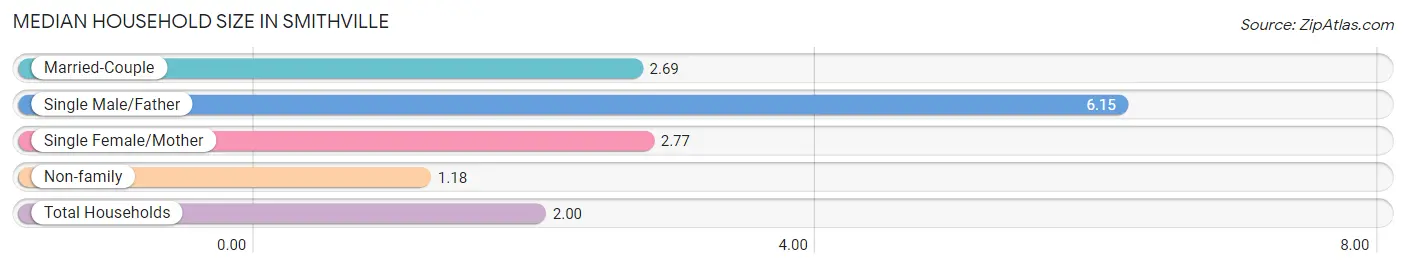
Median Household Size in Smithville
The median household size in Smithville is 2.00 persons per household, with single male/father households (53 | 1.2%) accounting for the largest median household size of 6.15 persons per household. non-family households (2,239 | 48.9%) represent the smallest median household size with 1.18 persons per household.
| Household Type | # Households | Household Size |
| Married-Couple | 1,761 (38.5%) | 2.69 |
| Single Male/Father | 53 (1.2%) | 6.15 |
| Single Female/Mother | 521 (11.4%) | 2.77 |
| Non-family | 2,239 (48.9%) | 1.18 |
| Total Households | 4,574 (100.0%) | 2.00 |
Household Size by Marriage Status in Smithville
Out of a total of 4,574 households in Smithville, 2,335 (51.0%) are family households, while 2,239 (48.9%) are nonfamily households. The most numerous type of family households are 2-person households, comprising 1,342, and the most common type of nonfamily households are 1-person households, comprising 1,843.
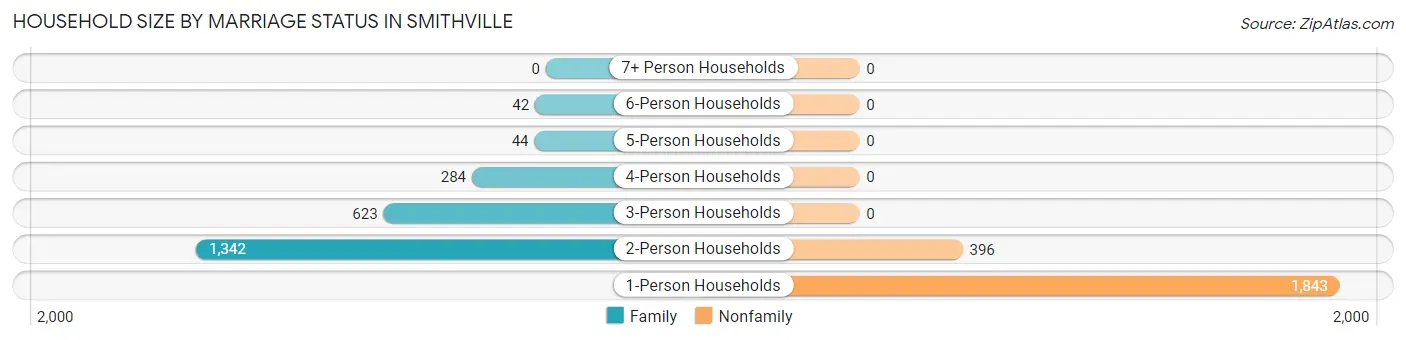
| Household Size | Family Households | Nonfamily Households |
| 1-Person Households | - | 1,843 (40.3%) |
| 2-Person Households | 1,342 (29.3%) | 396 (8.7%) |
| 3-Person Households | 623 (13.6%) | 0 (0.0%) |
| 4-Person Households | 284 (6.2%) | 0 (0.0%) |
| 5-Person Households | 44 (1.0%) | 0 (0.0%) |
| 6-Person Households | 42 (0.9%) | 0 (0.0%) |
| 7+ Person Households | 0 (0.0%) | 0 (0.0%) |
| Total | 2,335 (51.0%) | 2,239 (48.9%) |
Female Fertility in Smithville
Fertility by Age in Smithville
Average fertility rate in Smithville is 11.0 births per 1,000 women. Women in the age bracket of 35 to 50 years have the highest fertility rate with 29.0 births per 1,000 women. Women in the age bracket of 35 to 50 years acount for 100.0% of all women with births.
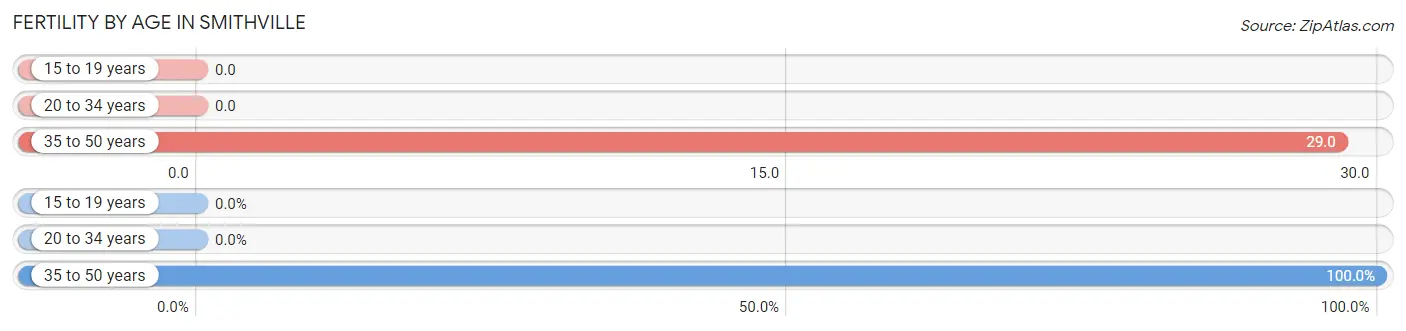
| Age Bracket | Women with Births | Births / 1,000 Women |
| 15 to 19 years | 0 (0.0%) | 0.0 |
| 20 to 34 years | 0 (0.0%) | 0.0 |
| 35 to 50 years | 20 (100.0%) | 29.0 |
| Total | 20 (100.0%) | 11.0 |
Fertility by Age by Marriage Status in Smithville
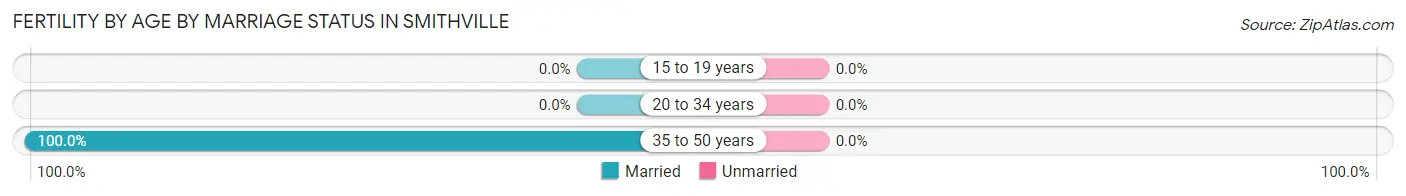
| Age Bracket | Married | Unmarried |
| 15 to 19 years | 0 (0.0%) | 0 (0.0%) |
| 20 to 34 years | 0 (0.0%) | 0 (0.0%) |
| 35 to 50 years | 20 (100.0%) | 0 (0.0%) |
| Total | 20 (100.0%) | 0 (0.0%) |
Fertility by Education in Smithville
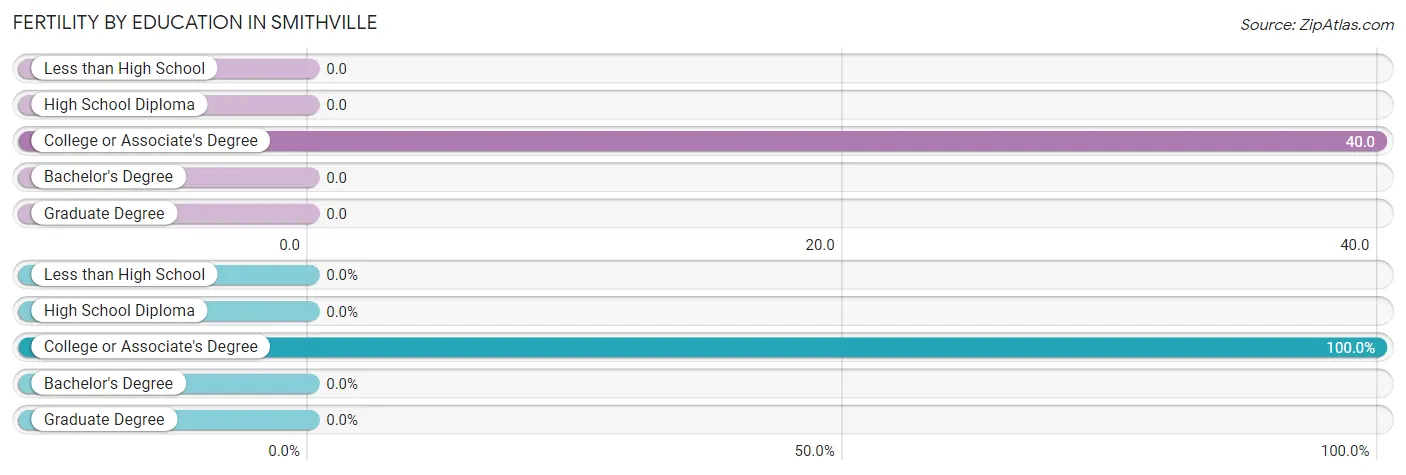
| Educational Attainment | Women with Births | Births / 1,000 Women |
| Less than High School | 0 (0.0%) | 0.0 |
| High School Diploma | 0 (0.0%) | 0.0 |
| College or Associate's Degree | 20 (100.0%) | 40.0 |
| Bachelor's Degree | 0 (0.0%) | 0.0 |
| Graduate Degree | 0 (0.0%) | 0.0 |
| Total | 20 (100.0%) | 11.0 |
Fertility by Education by Marriage Status in Smithville
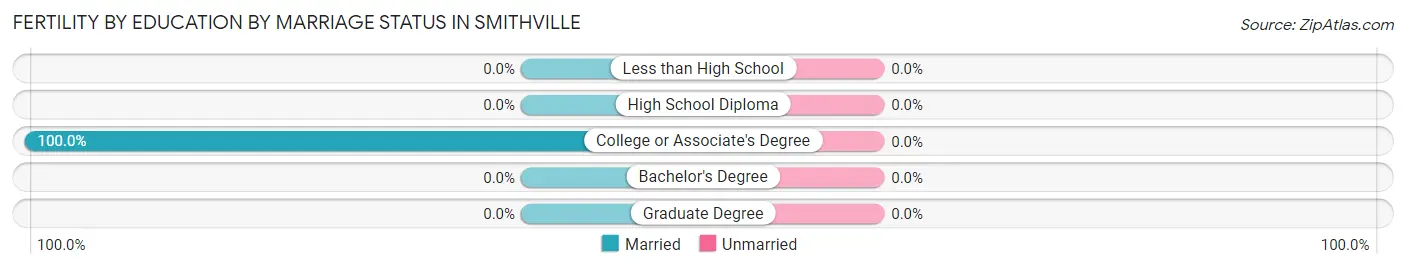
| Educational Attainment | Married | Unmarried |
| Less than High School | 0 (0.0%) | 0 (0.0%) |
| High School Diploma | 0 (0.0%) | 0 (0.0%) |
| College or Associate's Degree | 20 (100.0%) | 0 (0.0%) |
| Bachelor's Degree | 0 (0.0%) | 0 (0.0%) |
| Graduate Degree | 0 (0.0%) | 0 (0.0%) |
| Total | 20 (100.0%) | 0 (0.0%) |
Employment Characteristics in Smithville
Employment by Class of Employer in Smithville
Among the 4,520 employed individuals in Smithville, private company employees (2,822 | 62.4%), state government employees (457 | 10.1%), and self-employed (not incorporated) (394 | 8.7%) make up the most common classes of employment.
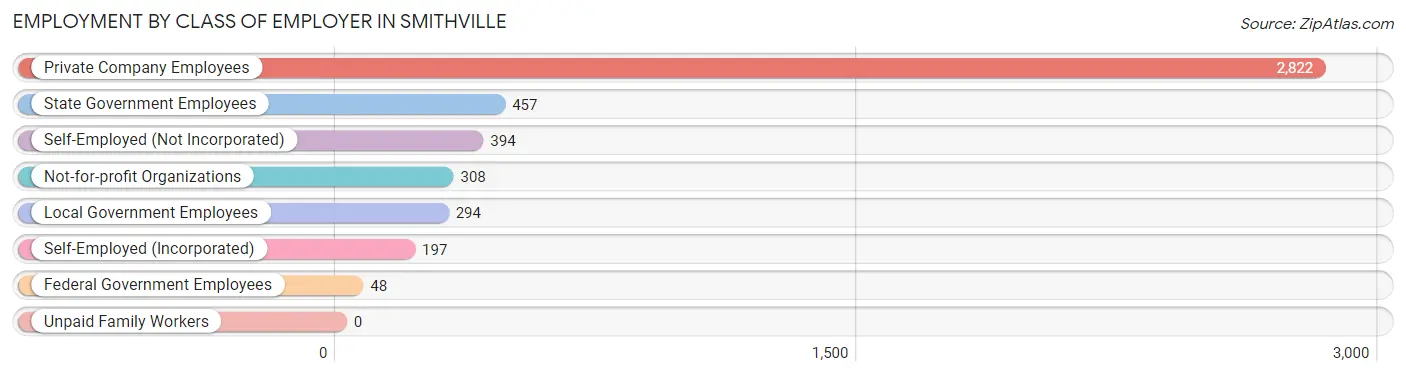
| Employer Class | # Employees | % Employees |
| Private Company Employees | 2,822 | 62.4% |
| Self-Employed (Incorporated) | 197 | 4.4% |
| Self-Employed (Not Incorporated) | 394 | 8.7% |
| Not-for-profit Organizations | 308 | 6.8% |
| Local Government Employees | 294 | 6.5% |
| State Government Employees | 457 | 10.1% |
| Federal Government Employees | 48 | 1.1% |
| Unpaid Family Workers | 0 | 0.0% |
| Total | 4,520 | 100.0% |
Employment Status by Age in Smithville
According to the labor force statistics for Smithville, out of the total population over 16 years of age (8,123), 58.7% or 4,768 individuals are in the labor force, with 4.3% or 205 of them unemployed. The age group with the highest labor force participation rate is 25 to 29 years, with 95.3% or 827 individuals in the labor force. Within the labor force, the 20 to 24 years age range has the highest percentage of unemployed individuals, with 21.6% or 58 of them being unemployed.
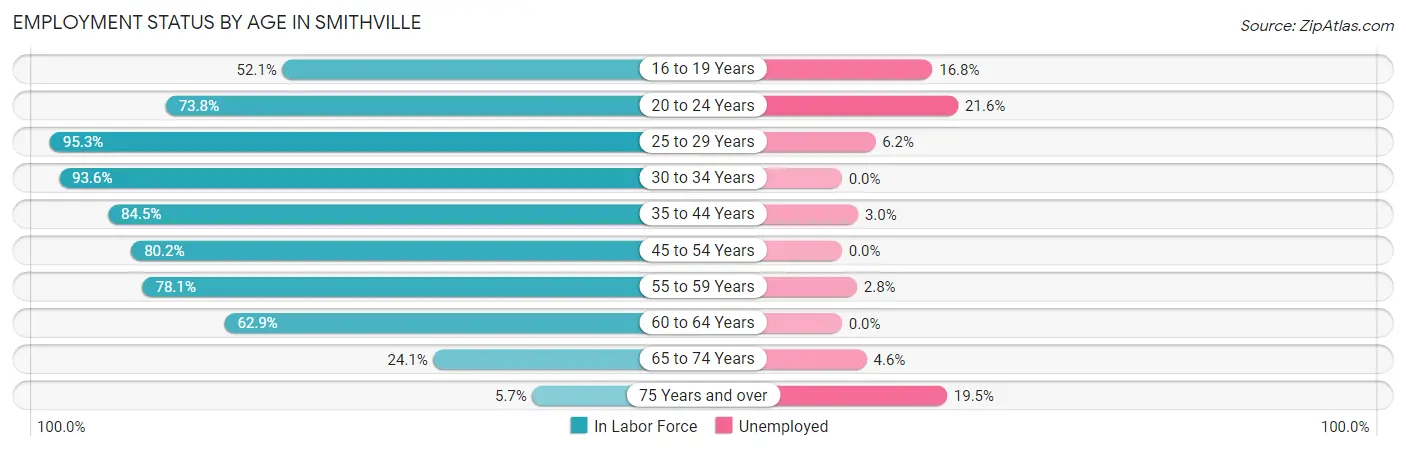
| Age Bracket | In Labor Force | Unemployed |
| 16 to 19 Years | 196 (52.1%) | 33 (16.8%) |
| 20 to 24 Years | 268 (73.8%) | 58 (21.6%) |
| 25 to 29 Years | 827 (95.3%) | 51 (6.2%) |
| 30 to 34 Years | 642 (93.6%) | 0 (0.0%) |
| 35 to 44 Years | 595 (84.5%) | 18 (3.0%) |
| 45 to 54 Years | 909 (80.2%) | 0 (0.0%) |
| 55 to 59 Years | 529 (78.1%) | 15 (2.8%) |
| 60 to 64 Years | 437 (62.9%) | 0 (0.0%) |
| 65 to 74 Years | 282 (24.1%) | 13 (4.6%) |
| 75 Years and over | 83 (5.7%) | 16 (19.5%) |
| Total | 4,768 (58.7%) | 205 (4.3%) |
Employment Status by Educational Attainment in Smithville
According to labor force statistics for Smithville, 82.7% of individuals (3,940) out of the total population between 25 and 64 years of age (4,764) are in the labor force, with 2.1% or 83 of them being unemployed. The group with the highest labor force participation rate are those with the educational attainment of bachelor's degree or higher, with 90.4% or 1,540 individuals in the labor force. Within the labor force, individuals with college / associate degree education have the highest percentage of unemployment, with 4.4% or 51 of them being unemployed.
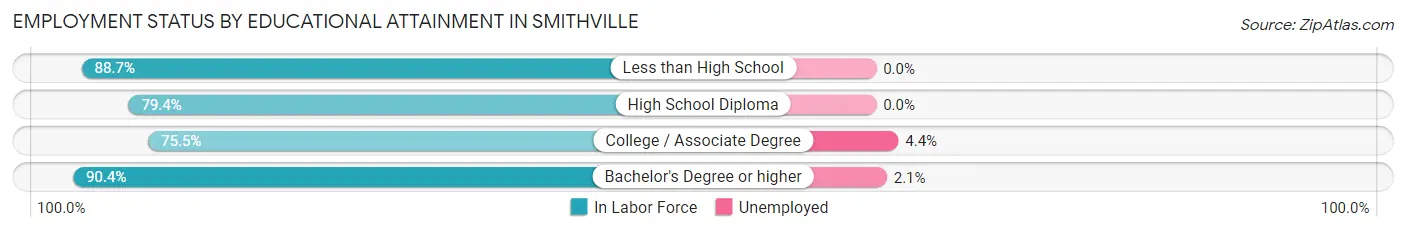
| Educational Attainment | In Labor Force | Unemployed |
| Less than High School | 259 (88.7%) | 0 (0.0%) |
| High School Diploma | 981 (79.4%) | 0 (0.0%) |
| College / Associate Degree | 1,157 (75.5%) | 67 (4.4%) |
| Bachelor's Degree or higher | 1,540 (90.4%) | 36 (2.1%) |
| Total | 3,940 (82.7%) | 100 (2.1%) |
Employment Occupations by Sex in Smithville
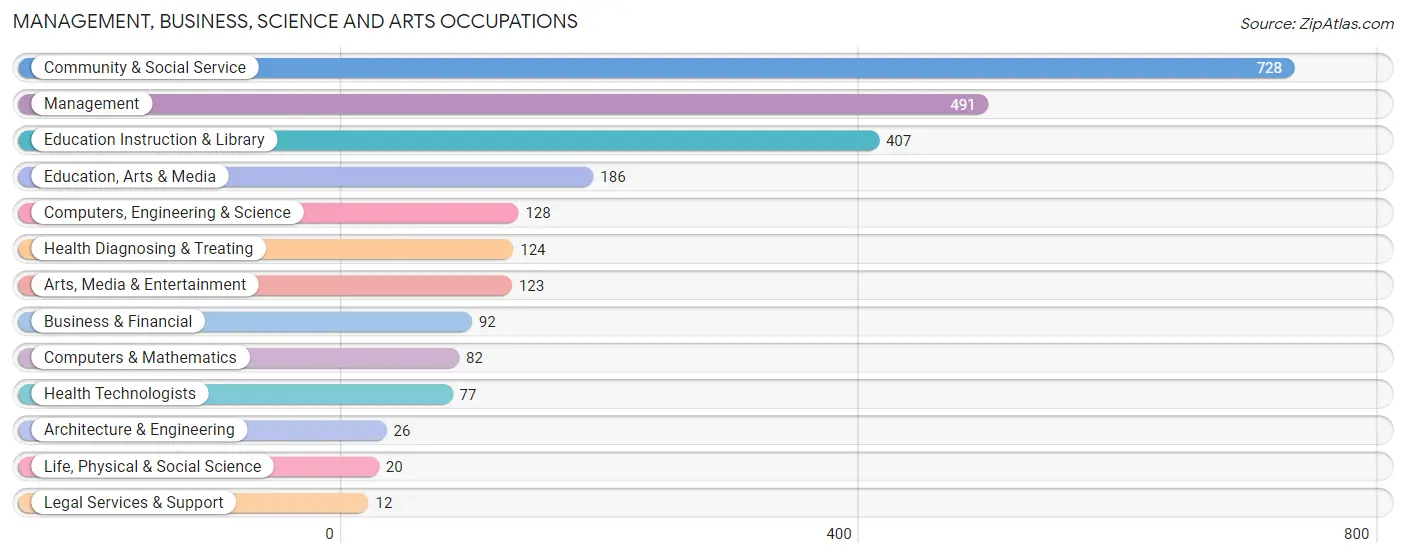
Management, Business, Science and Arts Occupations
The most common Management, Business, Science and Arts occupations in Smithville are Community & Social Service (728 | 16.0%), Management (491 | 10.8%), Education Instruction & Library (407 | 8.9%), Education, Arts & Media (186 | 4.1%), and Computers, Engineering & Science (128 | 2.8%).
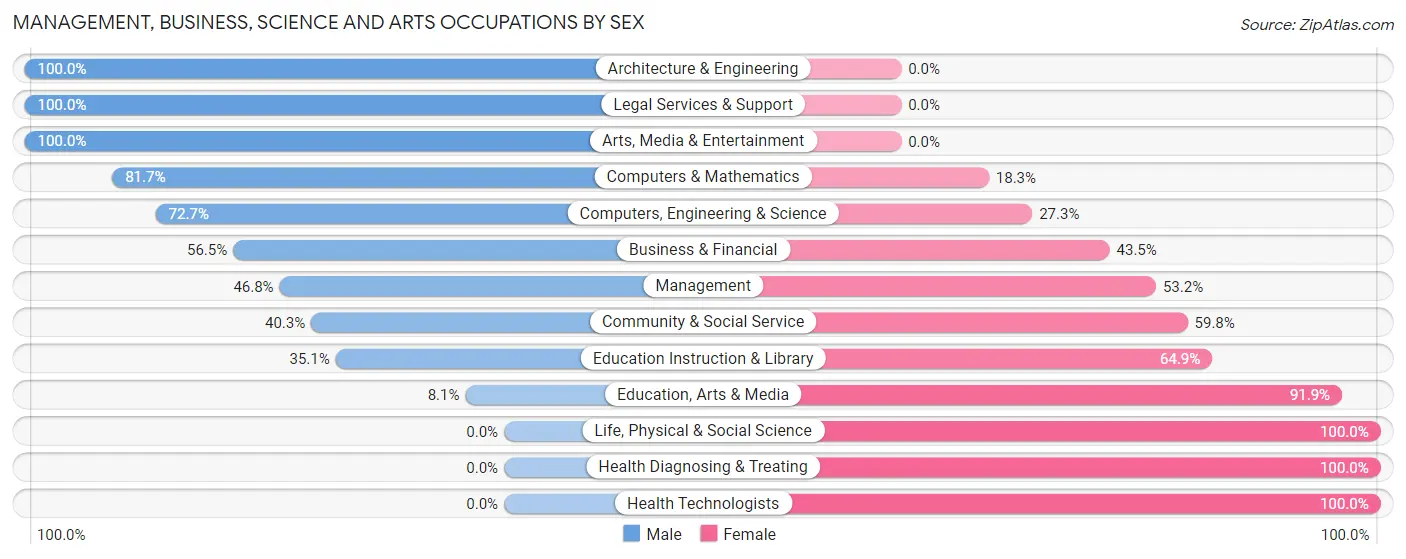
Management, Business, Science and Arts Occupations by Sex
Within the Management, Business, Science and Arts occupations in Smithville, the most male-oriented occupations are Architecture & Engineering (100.0%), Legal Services & Support (100.0%), and Arts, Media & Entertainment (100.0%), while the most female-oriented occupations are Life, Physical & Social Science (100.0%), Health Diagnosing & Treating (100.0%), and Health Technologists (100.0%).
| Occupation | Male | Female |
| Management | 230 (46.8%) | 261 (53.2%) |
| Business & Financial | 52 (56.5%) | 40 (43.5%) |
| Computers, Engineering & Science | 93 (72.7%) | 35 (27.3%) |
| Computers & Mathematics | 67 (81.7%) | 15 (18.3%) |
| Architecture & Engineering | 26 (100.0%) | 0 (0.0%) |
| Life, Physical & Social Science | 0 (0.0%) | 20 (100.0%) |
| Community & Social Service | 293 (40.3%) | 435 (59.8%) |
| Education, Arts & Media | 15 (8.1%) | 171 (91.9%) |
| Legal Services & Support | 12 (100.0%) | 0 (0.0%) |
| Education Instruction & Library | 143 (35.1%) | 264 (64.9%) |
| Arts, Media & Entertainment | 123 (100.0%) | 0 (0.0%) |
| Health Diagnosing & Treating | 0 (0.0%) | 124 (100.0%) |
| Health Technologists | 0 (0.0%) | 77 (100.0%) |
| Total (Category) | 668 (42.7%) | 895 (57.3%) |
| Total (Overall) | 2,312 (50.7%) | 2,251 (49.3%) |
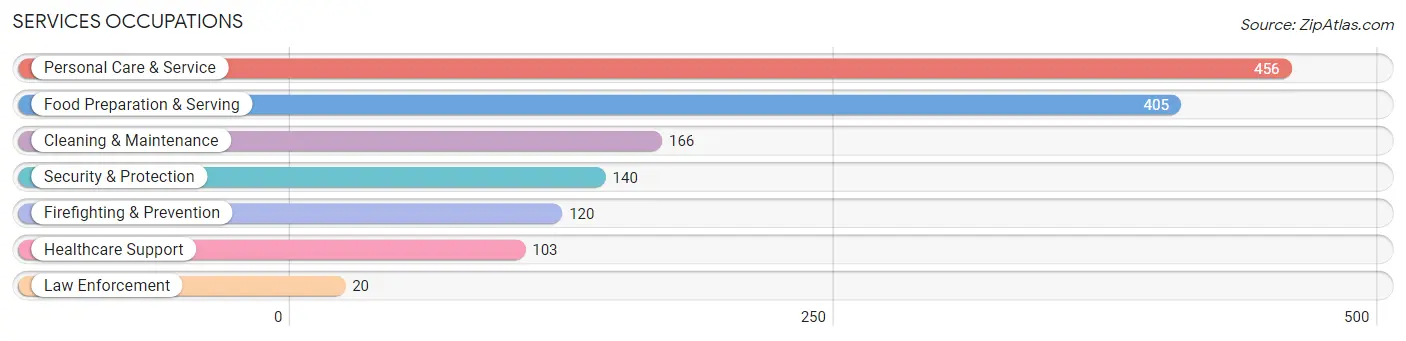
Services Occupations
The most common Services occupations in Smithville are Personal Care & Service (456 | 10.0%), Food Preparation & Serving (405 | 8.9%), Cleaning & Maintenance (166 | 3.6%), Security & Protection (140 | 3.1%), and Firefighting & Prevention (120 | 2.6%).
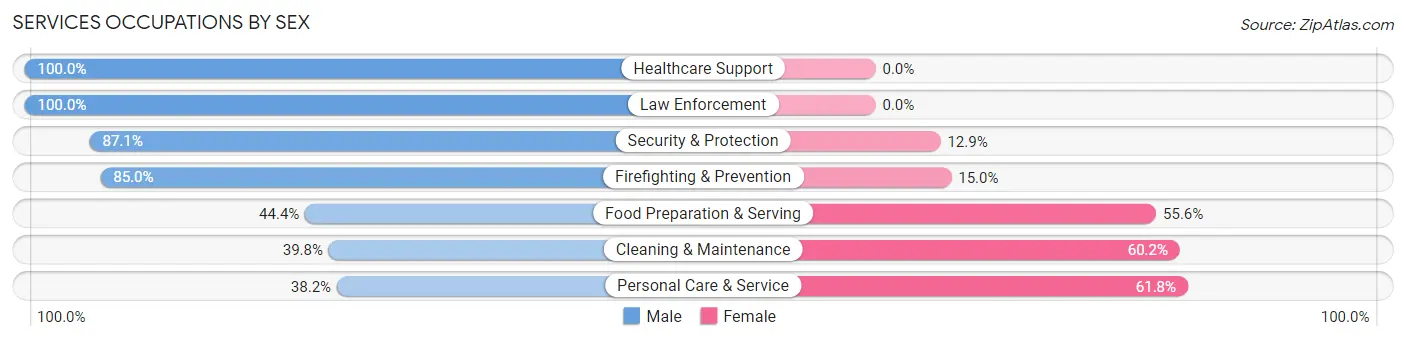
Services Occupations by Sex
Within the Services occupations in Smithville, the most male-oriented occupations are Healthcare Support (100.0%), Law Enforcement (100.0%), and Security & Protection (87.1%), while the most female-oriented occupations are Personal Care & Service (61.8%), Cleaning & Maintenance (60.2%), and Food Preparation & Serving (55.6%).
| Occupation | Male | Female |
| Healthcare Support | 103 (100.0%) | 0 (0.0%) |
| Security & Protection | 122 (87.1%) | 18 (12.9%) |
| Firefighting & Prevention | 102 (85.0%) | 18 (15.0%) |
| Law Enforcement | 20 (100.0%) | 0 (0.0%) |
| Food Preparation & Serving | 180 (44.4%) | 225 (55.6%) |
| Cleaning & Maintenance | 66 (39.8%) | 100 (60.2%) |
| Personal Care & Service | 174 (38.2%) | 282 (61.8%) |
| Total (Category) | 645 (50.8%) | 625 (49.2%) |
| Total (Overall) | 2,312 (50.7%) | 2,251 (49.3%) |
Sales and Office Occupations
The most common Sales and Office occupations in Smithville are Sales & Related (580 | 12.7%), and Office & Administration (379 | 8.3%).
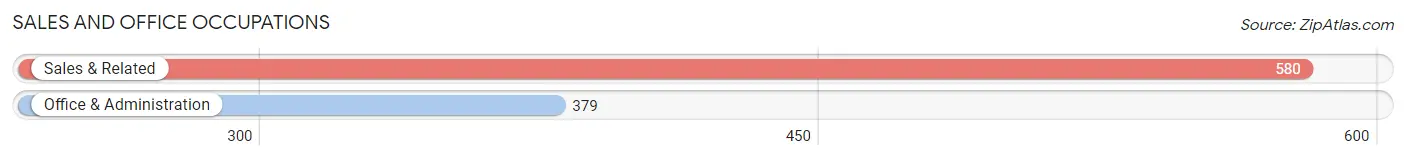
Sales and Office Occupations by Sex
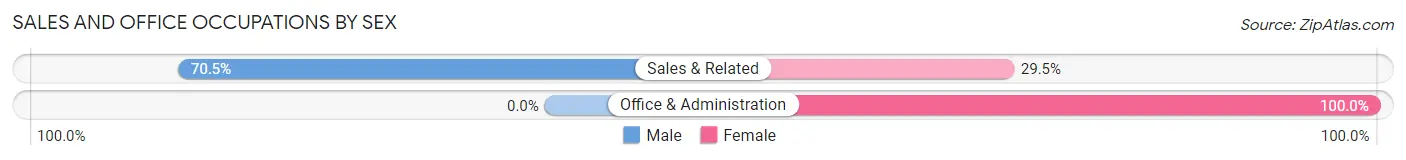
| Occupation | Male | Female |
| Sales & Related | 409 (70.5%) | 171 (29.5%) |
| Office & Administration | 0 (0.0%) | 379 (100.0%) |
| Total (Category) | 409 (42.6%) | 550 (57.4%) |
| Total (Overall) | 2,312 (50.7%) | 2,251 (49.3%) |
Natural Resources, Construction and Maintenance Occupations
The most common Natural Resources, Construction and Maintenance occupations in Smithville are Construction & Extraction (107 | 2.3%), and Installation, Maintenance & Repair (42 | 0.9%).
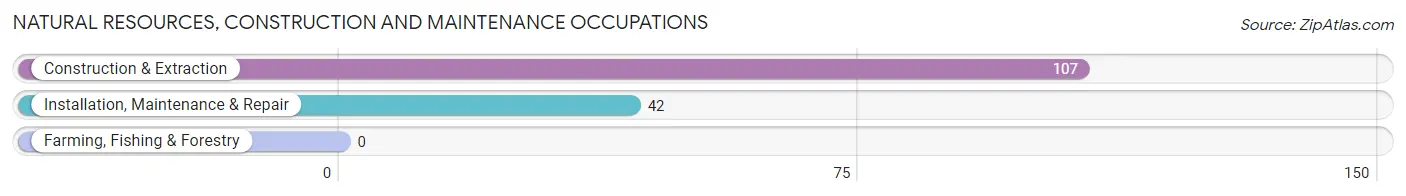
Natural Resources, Construction and Maintenance Occupations by Sex
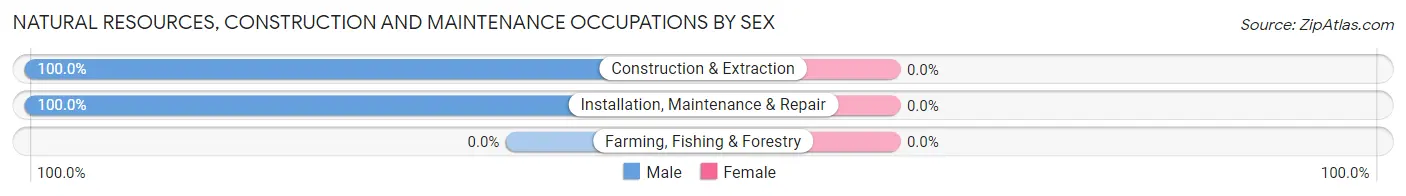
| Occupation | Male | Female |
| Farming, Fishing & Forestry | 0 (0.0%) | 0 (0.0%) |
| Construction & Extraction | 107 (100.0%) | 0 (0.0%) |
| Installation, Maintenance & Repair | 42 (100.0%) | 0 (0.0%) |
| Total (Category) | 149 (100.0%) | 0 (0.0%) |
| Total (Overall) | 2,312 (50.7%) | 2,251 (49.3%) |
Production, Transportation and Moving Occupations
The most common Production, Transportation and Moving occupations in Smithville are Material Moving (301 | 6.6%), Transportation (187 | 4.1%), and Production (134 | 2.9%).
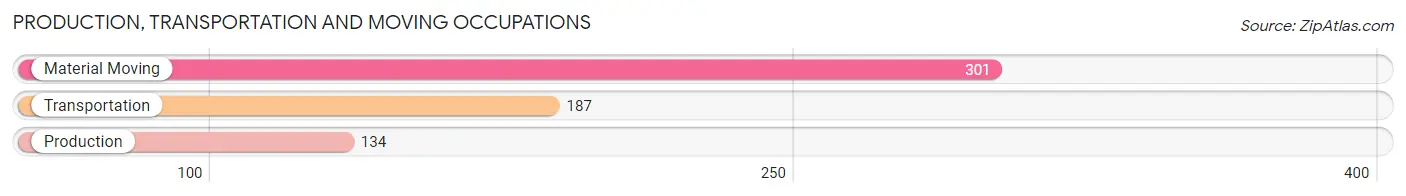
Production, Transportation and Moving Occupations by Sex
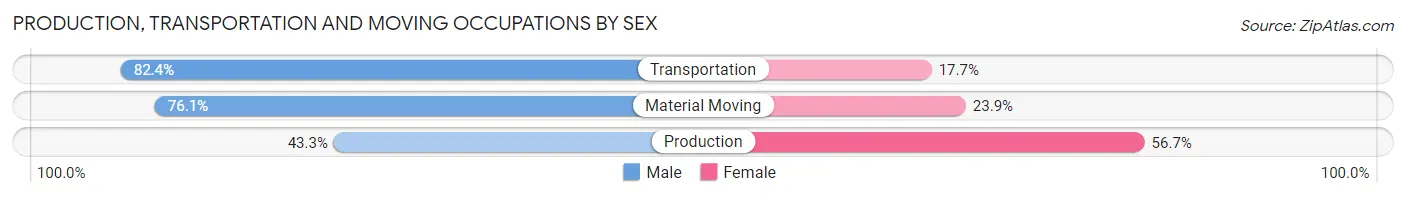
| Occupation | Male | Female |
| Production | 58 (43.3%) | 76 (56.7%) |
| Transportation | 154 (82.4%) | 33 (17.6%) |
| Material Moving | 229 (76.1%) | 72 (23.9%) |
| Total (Category) | 441 (70.9%) | 181 (29.1%) |
| Total (Overall) | 2,312 (50.7%) | 2,251 (49.3%) |
Employment Industries by Sex in Smithville
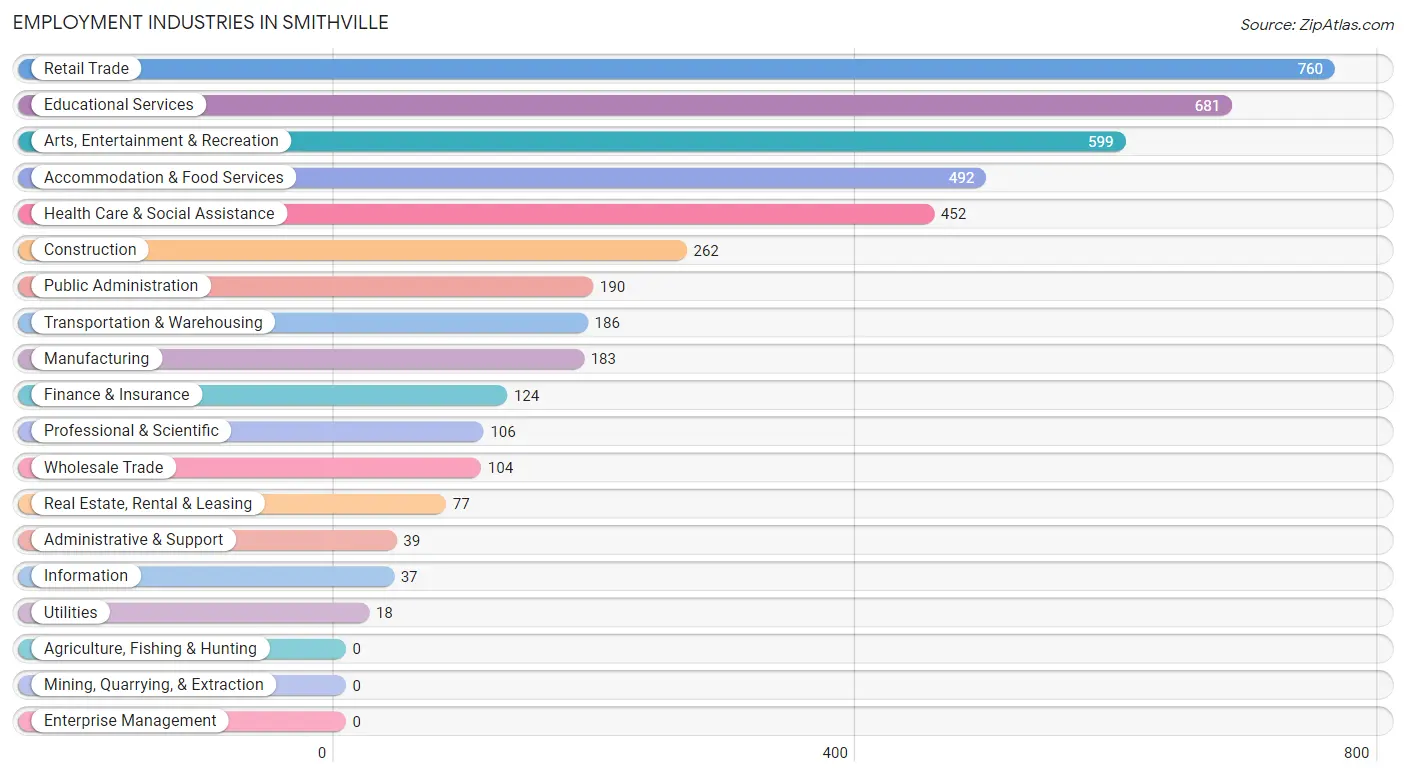
Employment Industries in Smithville
The major employment industries in Smithville include Retail Trade (760 | 16.7%), Educational Services (681 | 14.9%), Arts, Entertainment & Recreation (599 | 13.1%), Accommodation & Food Services (492 | 10.8%), and Health Care & Social Assistance (452 | 9.9%).
Employment Industries by Sex in Smithville
The Smithville industries that see more men than women are Construction (100.0%), Wholesale Trade (100.0%), and Utilities (100.0%), whereas the industries that tend to have a higher number of women are Administrative & Support (100.0%), Finance & Insurance (84.7%), and Educational Services (71.7%).
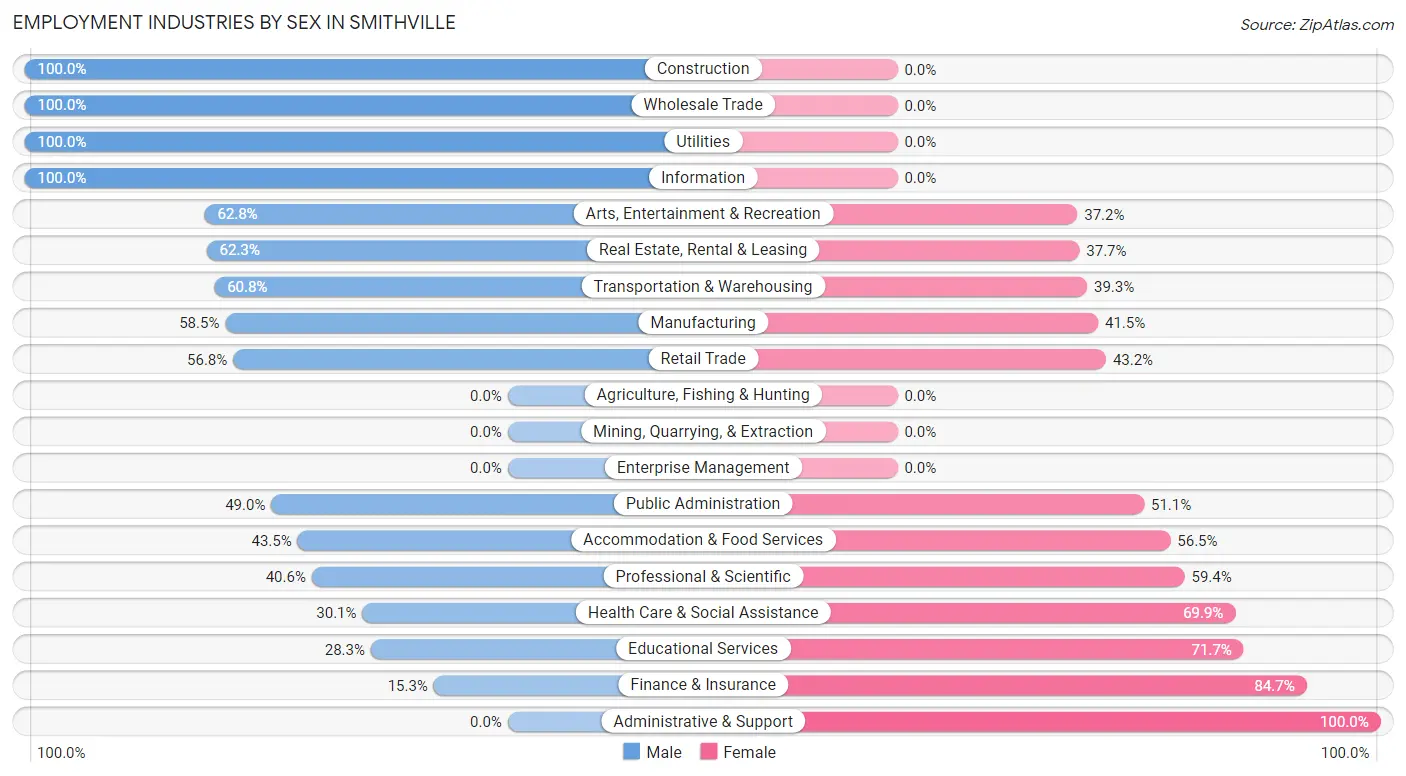
| Industry | Male | Female |
| Agriculture, Fishing & Hunting | 0 (0.0%) | 0 (0.0%) |
| Mining, Quarrying, & Extraction | 0 (0.0%) | 0 (0.0%) |
| Construction | 262 (100.0%) | 0 (0.0%) |
| Manufacturing | 107 (58.5%) | 76 (41.5%) |
| Wholesale Trade | 104 (100.0%) | 0 (0.0%) |
| Retail Trade | 432 (56.8%) | 328 (43.2%) |
| Transportation & Warehousing | 113 (60.8%) | 73 (39.3%) |
| Utilities | 18 (100.0%) | 0 (0.0%) |
| Information | 37 (100.0%) | 0 (0.0%) |
| Finance & Insurance | 19 (15.3%) | 105 (84.7%) |
| Real Estate, Rental & Leasing | 48 (62.3%) | 29 (37.7%) |
| Professional & Scientific | 43 (40.6%) | 63 (59.4%) |
| Enterprise Management | 0 (0.0%) | 0 (0.0%) |
| Administrative & Support | 0 (0.0%) | 39 (100.0%) |
| Educational Services | 193 (28.3%) | 488 (71.7%) |
| Health Care & Social Assistance | 136 (30.1%) | 316 (69.9%) |
| Arts, Entertainment & Recreation | 376 (62.8%) | 223 (37.2%) |
| Accommodation & Food Services | 214 (43.5%) | 278 (56.5%) |
| Public Administration | 93 (48.9%) | 97 (51.0%) |
| Total | 2,312 (50.7%) | 2,251 (49.3%) |
Education in Smithville
School Enrollment in Smithville
The most common levels of schooling among the 1,710 students in Smithville are high school (393 | 23.0%), middle school (369 | 21.6%), and college / undergraduate (354 | 20.7%).
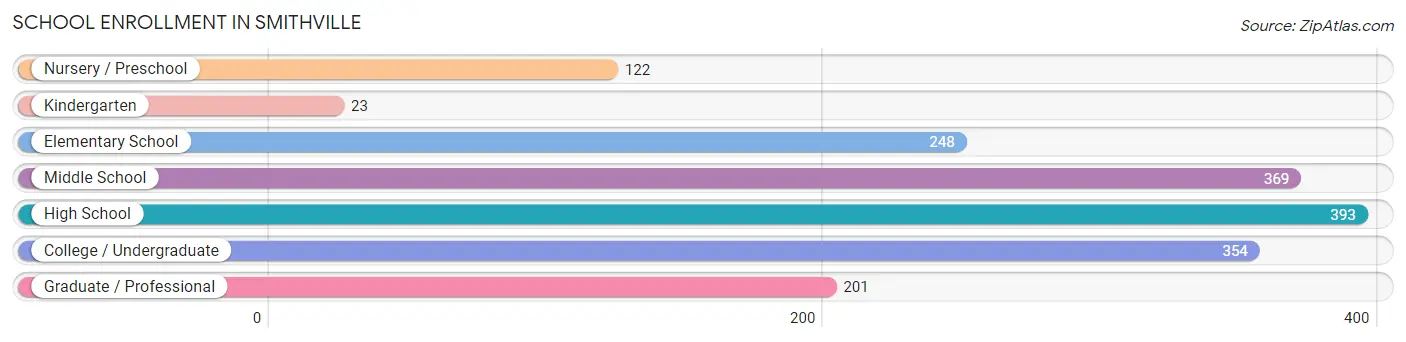
| School Level | # Students | % Students |
| Nursery / Preschool | 122 | 7.1% |
| Kindergarten | 23 | 1.3% |
| Elementary School | 248 | 14.5% |
| Middle School | 369 | 21.6% |
| High School | 393 | 23.0% |
| College / Undergraduate | 354 | 20.7% |
| Graduate / Professional | 201 | 11.7% |
| Total | 1,710 | 100.0% |
School Enrollment by Age by Funding Source in Smithville
Out of a total of 1,710 students who are enrolled in schools in Smithville, 120 (7.0%) attend a private institution, while the remaining 1,590 (93.0%) are enrolled in public schools. The age group of 3 to 4 year olds has the highest likelihood of being enrolled in private schools, with 25 (32.5% in the age bracket) enrolled. Conversely, the age group of 5 to 9 year old has the lowest likelihood of being enrolled in a private school, with 297 (100.0% in the age bracket) attending a public institution.
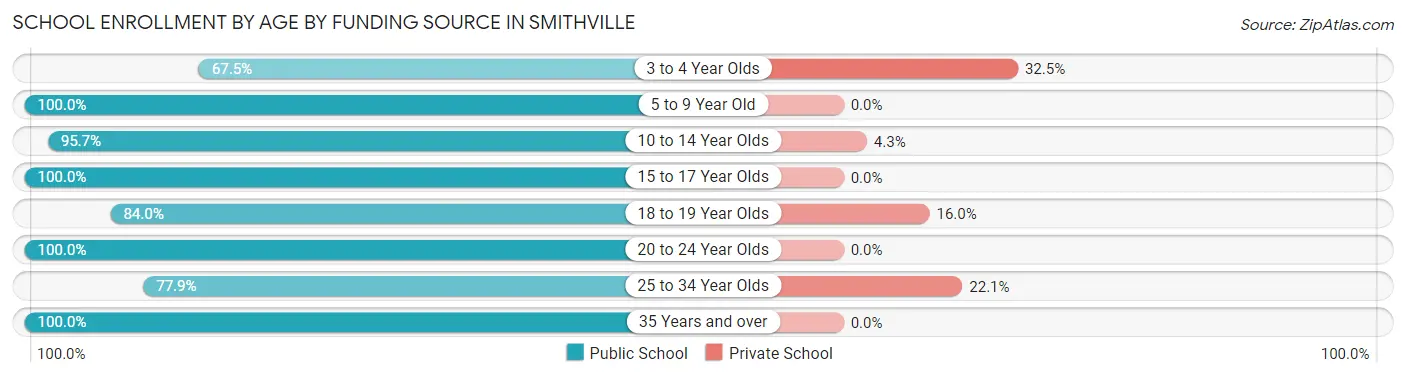
| Age Bracket | Public School | Private School |
| 3 to 4 Year Olds | 52 (67.5%) | 25 (32.5%) |
| 5 to 9 Year Old | 297 (100.0%) | 0 (0.0%) |
| 10 to 14 Year Olds | 420 (95.7%) | 19 (4.3%) |
| 15 to 17 Year Olds | 267 (100.0%) | 0 (0.0%) |
| 18 to 19 Year Olds | 168 (84.0%) | 32 (16.0%) |
| 20 to 24 Year Olds | 144 (100.0%) | 0 (0.0%) |
| 25 to 34 Year Olds | 155 (77.9%) | 44 (22.1%) |
| 35 Years and over | 87 (100.0%) | 0 (0.0%) |
| Total | 1,590 (93.0%) | 120 (7.0%) |
Educational Attainment by Field of Study in Smithville
Business (522 | 19.1%), education (386 | 14.1%), psychology (281 | 10.3%), arts & humanities (280 | 10.3%), and liberal arts & history (267 | 9.8%) are the most common fields of study among 2,729 individuals in Smithville who have obtained a bachelor's degree or higher.
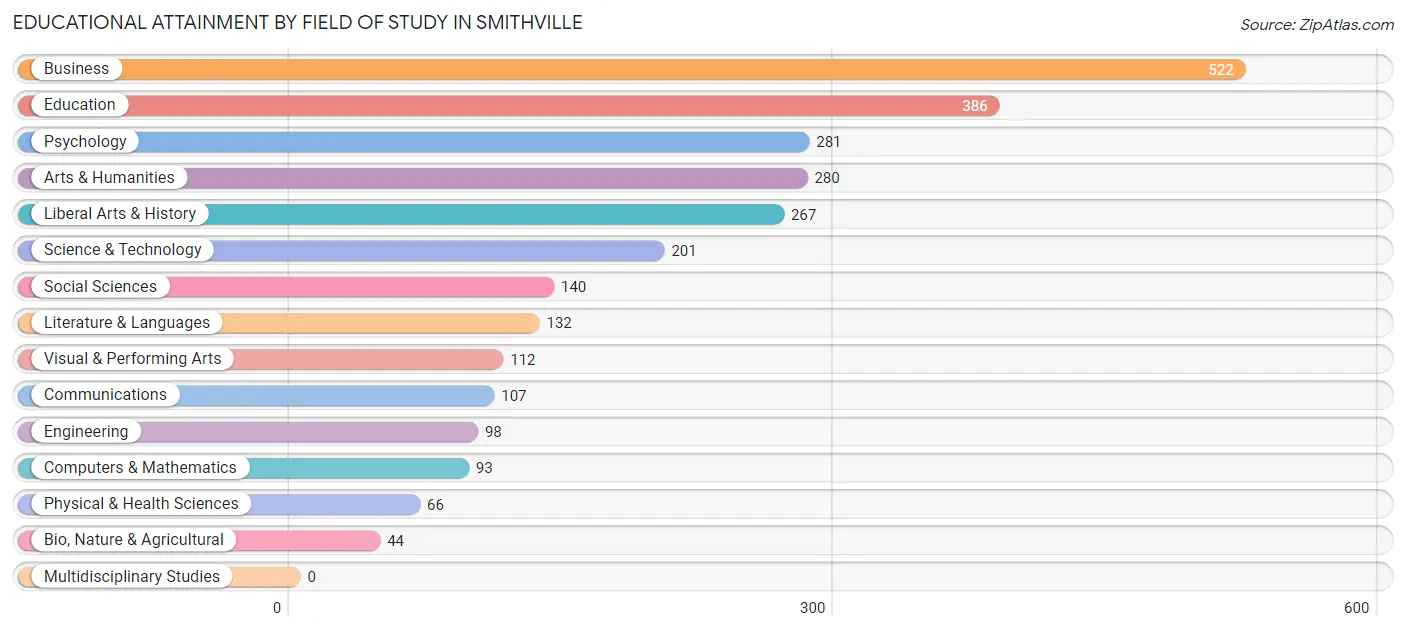
| Field of Study | # Graduates | % Graduates |
| Computers & Mathematics | 93 | 3.4% |
| Bio, Nature & Agricultural | 44 | 1.6% |
| Physical & Health Sciences | 66 | 2.4% |
| Psychology | 281 | 10.3% |
| Social Sciences | 140 | 5.1% |
| Engineering | 98 | 3.6% |
| Multidisciplinary Studies | 0 | 0.0% |
| Science & Technology | 201 | 7.4% |
| Business | 522 | 19.1% |
| Education | 386 | 14.1% |
| Literature & Languages | 132 | 4.8% |
| Liberal Arts & History | 267 | 9.8% |
| Visual & Performing Arts | 112 | 4.1% |
| Communications | 107 | 3.9% |
| Arts & Humanities | 280 | 10.3% |
| Total | 2,729 | 100.0% |
Transportation & Commute in Smithville
Vehicle Availability by Sex in Smithville
The most prevalent vehicle ownership categories in Smithville are males with 2 vehicles (1,304, accounting for 56.4%) and females with 2 vehicles (987, making up 59.1%).
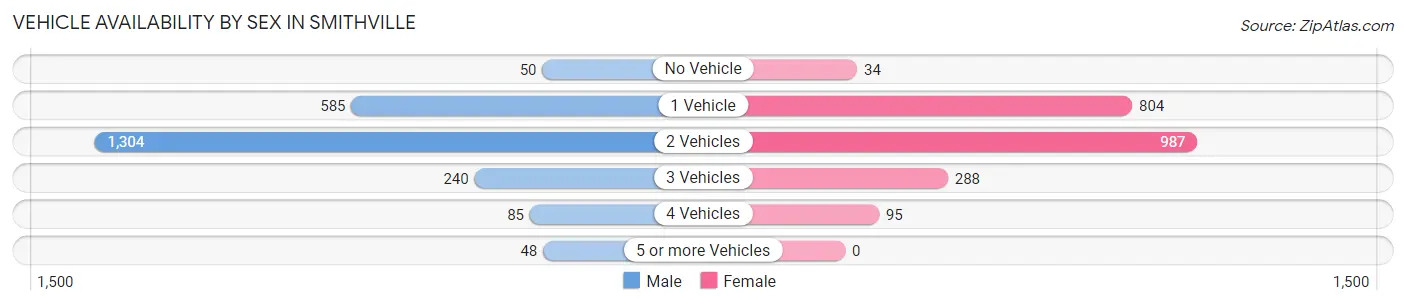
| Vehicles Available | Male | Female |
| No Vehicle | 50 (2.2%) | 34 (1.5%) |
| 1 Vehicle | 585 (25.3%) | 804 (36.4%) |
| 2 Vehicles | 1,304 (56.4%) | 987 (44.7%) |
| 3 Vehicles | 240 (10.4%) | 288 (13.0%) |
| 4 Vehicles | 85 (3.7%) | 95 (4.3%) |
| 5 or more Vehicles | 48 (2.1%) | 0 (0.0%) |
| Total | 2,312 (100.0%) | 2,208 (100.0%) |
Commute Time in Smithville
The most frequently occuring commute durations in Smithville are 20 to 24 minutes (1,032 commuters, 24.4%), 25 to 29 minutes (745 commuters, 17.6%), and 30 to 34 minutes (504 commuters, 11.9%).
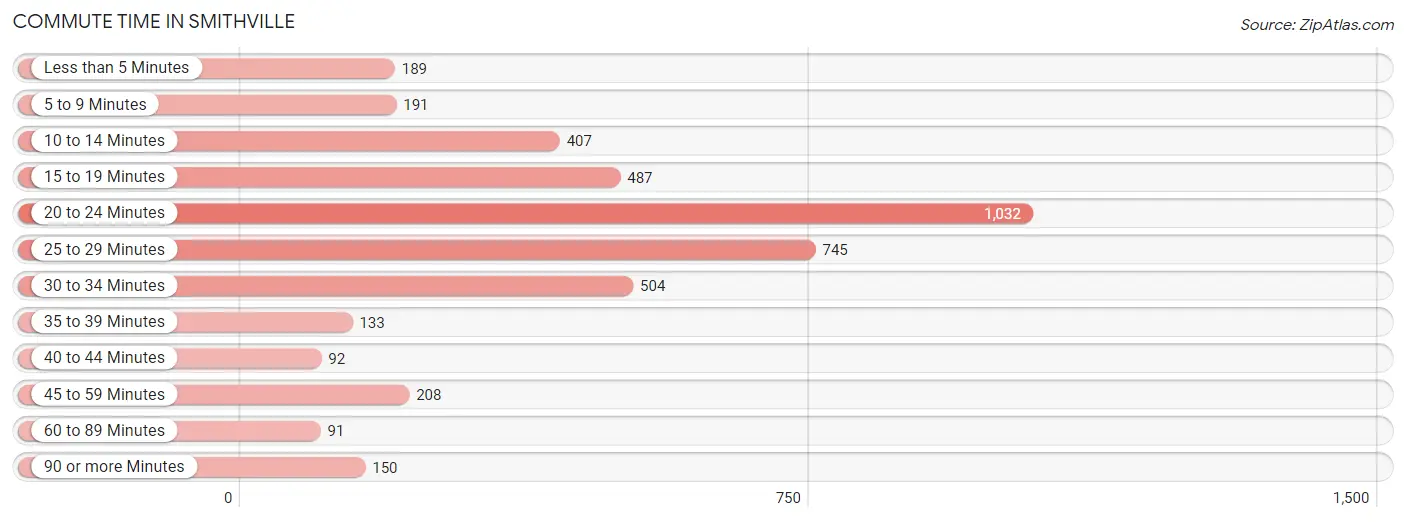
| Commute Time | # Commuters | % Commuters |
| Less than 5 Minutes | 189 | 4.5% |
| 5 to 9 Minutes | 191 | 4.5% |
| 10 to 14 Minutes | 407 | 9.6% |
| 15 to 19 Minutes | 487 | 11.5% |
| 20 to 24 Minutes | 1,032 | 24.4% |
| 25 to 29 Minutes | 745 | 17.6% |
| 30 to 34 Minutes | 504 | 11.9% |
| 35 to 39 Minutes | 133 | 3.1% |
| 40 to 44 Minutes | 92 | 2.2% |
| 45 to 59 Minutes | 208 | 4.9% |
| 60 to 89 Minutes | 91 | 2.1% |
| 90 or more Minutes | 150 | 3.5% |
Commute Time by Sex in Smithville
The most common commute times in Smithville are 20 to 24 minutes (620 commuters, 27.8%) for males and 20 to 24 minutes (412 commuters, 20.6%) for females.
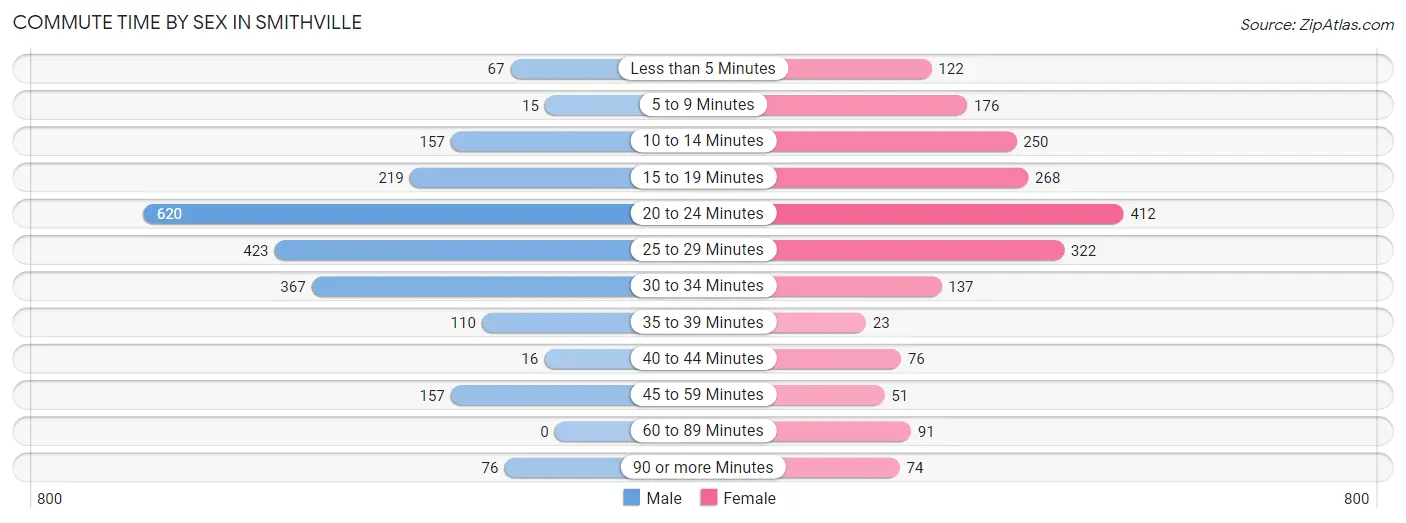
| Commute Time | Male | Female |
| Less than 5 Minutes | 67 (3.0%) | 122 (6.1%) |
| 5 to 9 Minutes | 15 (0.7%) | 176 (8.8%) |
| 10 to 14 Minutes | 157 (7.0%) | 250 (12.5%) |
| 15 to 19 Minutes | 219 (9.8%) | 268 (13.4%) |
| 20 to 24 Minutes | 620 (27.8%) | 412 (20.6%) |
| 25 to 29 Minutes | 423 (19.0%) | 322 (16.1%) |
| 30 to 34 Minutes | 367 (16.5%) | 137 (6.8%) |
| 35 to 39 Minutes | 110 (4.9%) | 23 (1.1%) |
| 40 to 44 Minutes | 16 (0.7%) | 76 (3.8%) |
| 45 to 59 Minutes | 157 (7.0%) | 51 (2.5%) |
| 60 to 89 Minutes | 0 (0.0%) | 91 (4.5%) |
| 90 or more Minutes | 76 (3.4%) | 74 (3.7%) |
Time of Departure to Work by Sex in Smithville
The most frequent times of departure to work in Smithville are 8:00 AM to 8:29 AM (370, 16.6%) for males and 8:00 AM to 8:29 AM (336, 16.8%) for females.
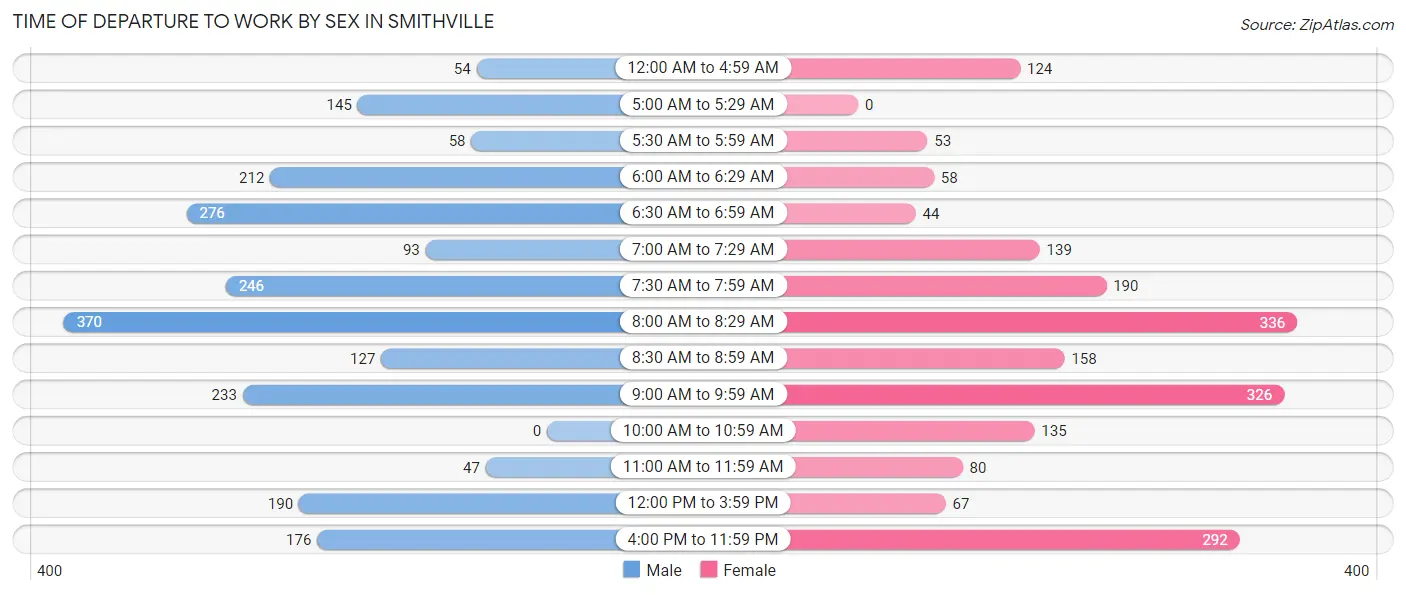
| Time of Departure | Male | Female |
| 12:00 AM to 4:59 AM | 54 (2.4%) | 124 (6.2%) |
| 5:00 AM to 5:29 AM | 145 (6.5%) | 0 (0.0%) |
| 5:30 AM to 5:59 AM | 58 (2.6%) | 53 (2.6%) |
| 6:00 AM to 6:29 AM | 212 (9.5%) | 58 (2.9%) |
| 6:30 AM to 6:59 AM | 276 (12.4%) | 44 (2.2%) |
| 7:00 AM to 7:29 AM | 93 (4.2%) | 139 (6.9%) |
| 7:30 AM to 7:59 AM | 246 (11.1%) | 190 (9.5%) |
| 8:00 AM to 8:29 AM | 370 (16.6%) | 336 (16.8%) |
| 8:30 AM to 8:59 AM | 127 (5.7%) | 158 (7.9%) |
| 9:00 AM to 9:59 AM | 233 (10.5%) | 326 (16.3%) |
| 10:00 AM to 10:59 AM | 0 (0.0%) | 135 (6.7%) |
| 11:00 AM to 11:59 AM | 47 (2.1%) | 80 (4.0%) |
| 12:00 PM to 3:59 PM | 190 (8.5%) | 67 (3.4%) |
| 4:00 PM to 11:59 PM | 176 (7.9%) | 292 (14.6%) |
| Total | 2,227 (100.0%) | 2,002 (100.0%) |
Housing Occupancy in Smithville
Occupancy by Ownership in Smithville
Of the total 4,574 dwellings in Smithville, owner-occupied units account for 3,471 (75.9%), while renter-occupied units make up 1,103 (24.1%).
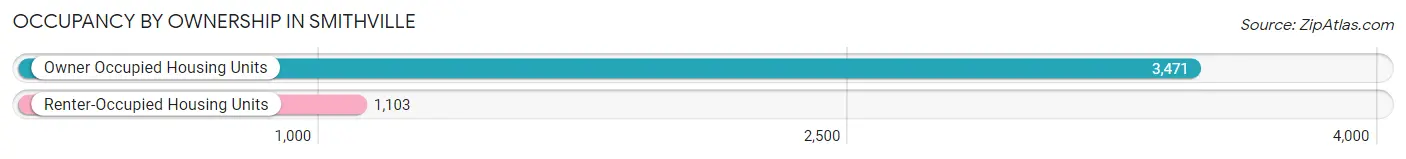
| Occupancy | # Housing Units | % Housing Units |
| Owner Occupied Housing Units | 3,471 | 75.9% |
| Renter-Occupied Housing Units | 1,103 | 24.1% |
| Total Occupied Housing Units | 4,574 | 100.0% |
Occupancy by Household Size in Smithville
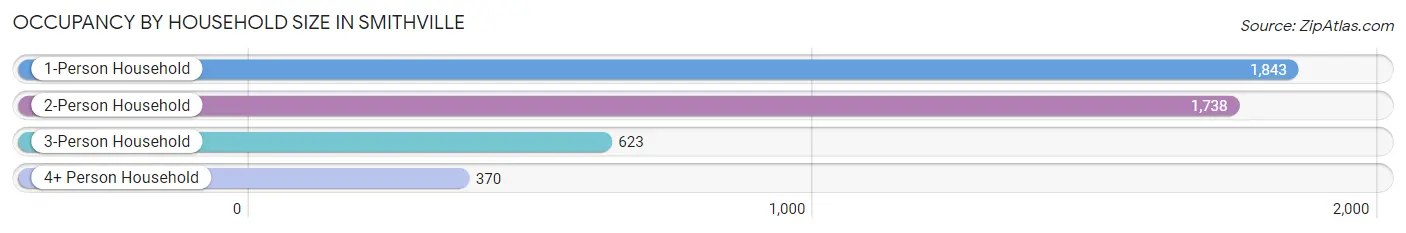
| Household Size | # Housing Units | % Housing Units |
| 1-Person Household | 1,843 | 40.3% |
| 2-Person Household | 1,738 | 38.0% |
| 3-Person Household | 623 | 13.6% |
| 4+ Person Household | 370 | 8.1% |
| Total Housing Units | 4,574 | 100.0% |
Occupancy by Ownership by Household Size in Smithville
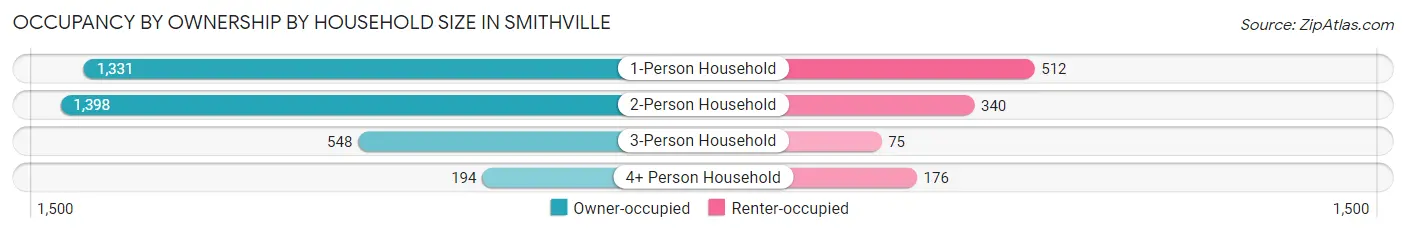
| Household Size | Owner-occupied | Renter-occupied |
| 1-Person Household | 1,331 (72.2%) | 512 (27.8%) |
| 2-Person Household | 1,398 (80.4%) | 340 (19.6%) |
| 3-Person Household | 548 (88.0%) | 75 (12.0%) |
| 4+ Person Household | 194 (52.4%) | 176 (47.6%) |
| Total Housing Units | 3,471 (75.9%) | 1,103 (24.1%) |
Occupancy by Educational Attainment in Smithville
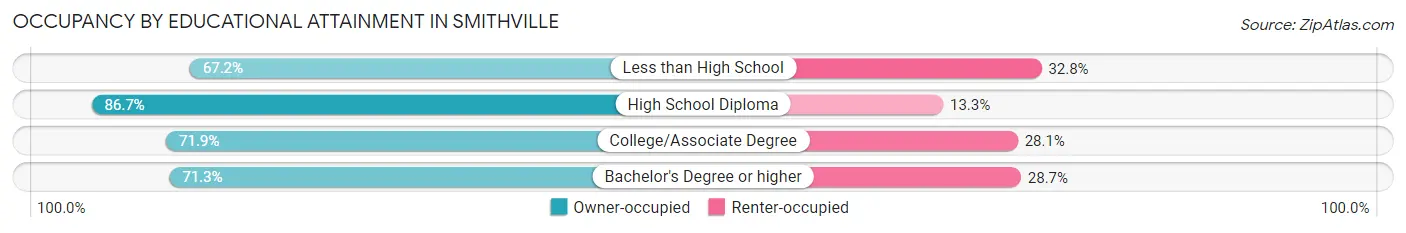
| Household Size | Owner-occupied | Renter-occupied |
| Less than High School | 119 (67.2%) | 58 (32.8%) |
| High School Diploma | 1,164 (86.7%) | 178 (13.3%) |
| College/Associate Degree | 1,087 (71.9%) | 424 (28.1%) |
| Bachelor's Degree or higher | 1,101 (71.3%) | 443 (28.7%) |
Occupancy by Age of Householder in Smithville
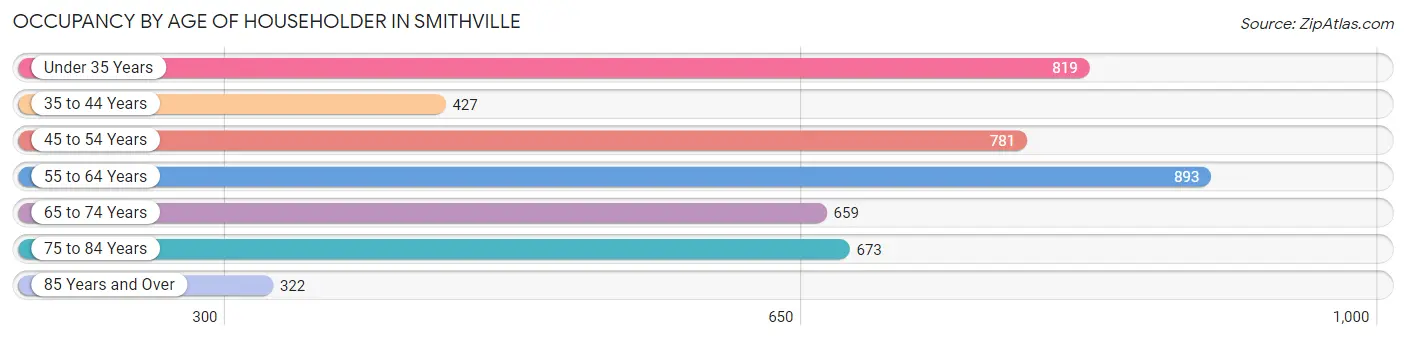
| Age Bracket | # Households | % Households |
| Under 35 Years | 819 | 17.9% |
| 35 to 44 Years | 427 | 9.3% |
| 45 to 54 Years | 781 | 17.1% |
| 55 to 64 Years | 893 | 19.5% |
| 65 to 74 Years | 659 | 14.4% |
| 75 to 84 Years | 673 | 14.7% |
| 85 Years and Over | 322 | 7.0% |
| Total | 4,574 | 100.0% |
Housing Finances in Smithville
Median Income by Occupancy in Smithville
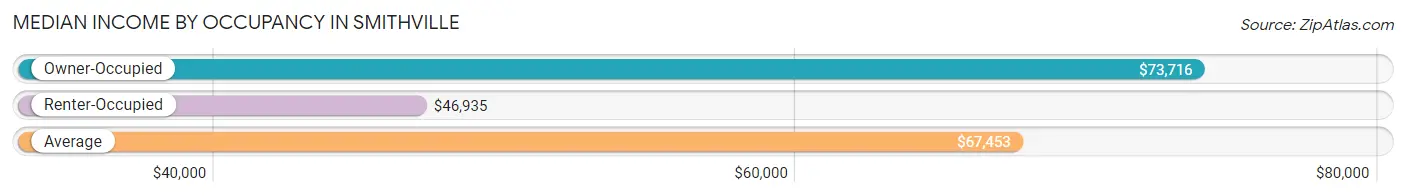
| Occupancy Type | # Households | Median Income |
| Owner-Occupied | 3,471 (75.9%) | $73,716 |
| Renter-Occupied | 1,103 (24.1%) | $46,935 |
| Average | 4,574 (100.0%) | $67,453 |
Occupancy by Householder Income Bracket in Smithville
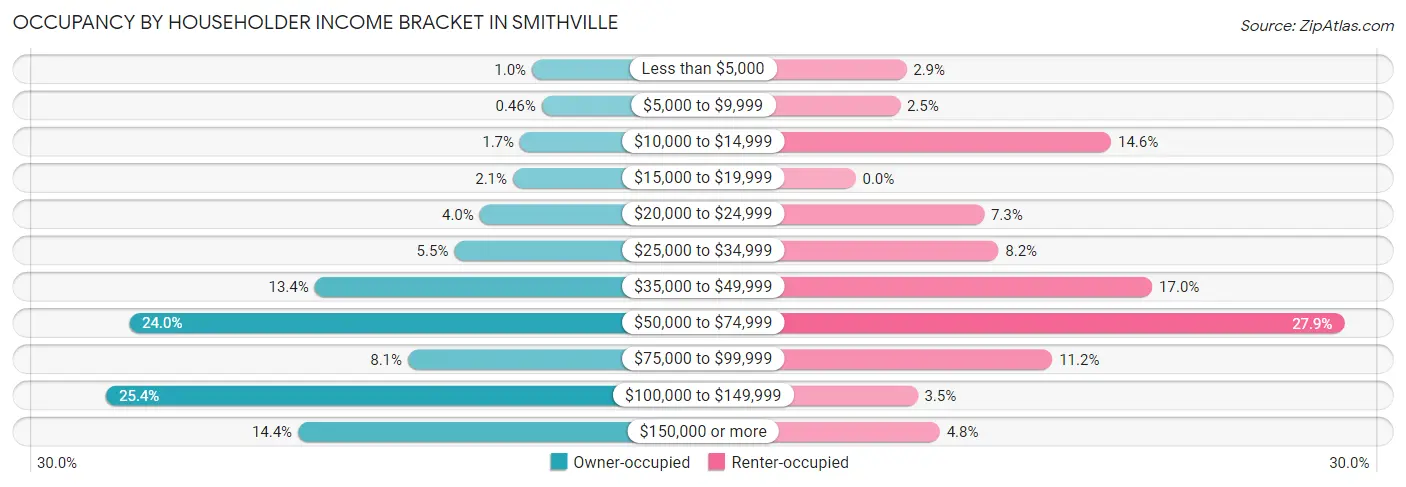
| Income Bracket | Owner-occupied | Renter-occupied |
| Less than $5,000 | 35 (1.0%) | 32 (2.9%) |
| $5,000 to $9,999 | 16 (0.5%) | 28 (2.5%) |
| $10,000 to $14,999 | 59 (1.7%) | 161 (14.6%) |
| $15,000 to $19,999 | 73 (2.1%) | 0 (0.0%) |
| $20,000 to $24,999 | 139 (4.0%) | 81 (7.3%) |
| $25,000 to $34,999 | 189 (5.4%) | 90 (8.2%) |
| $35,000 to $49,999 | 466 (13.4%) | 187 (17.0%) |
| $50,000 to $74,999 | 834 (24.0%) | 308 (27.9%) |
| $75,000 to $99,999 | 281 (8.1%) | 124 (11.2%) |
| $100,000 to $149,999 | 880 (25.4%) | 39 (3.5%) |
| $150,000 or more | 499 (14.4%) | 53 (4.8%) |
| Total | 3,471 (100.0%) | 1,103 (100.0%) |
Monthly Housing Cost Tiers in Smithville
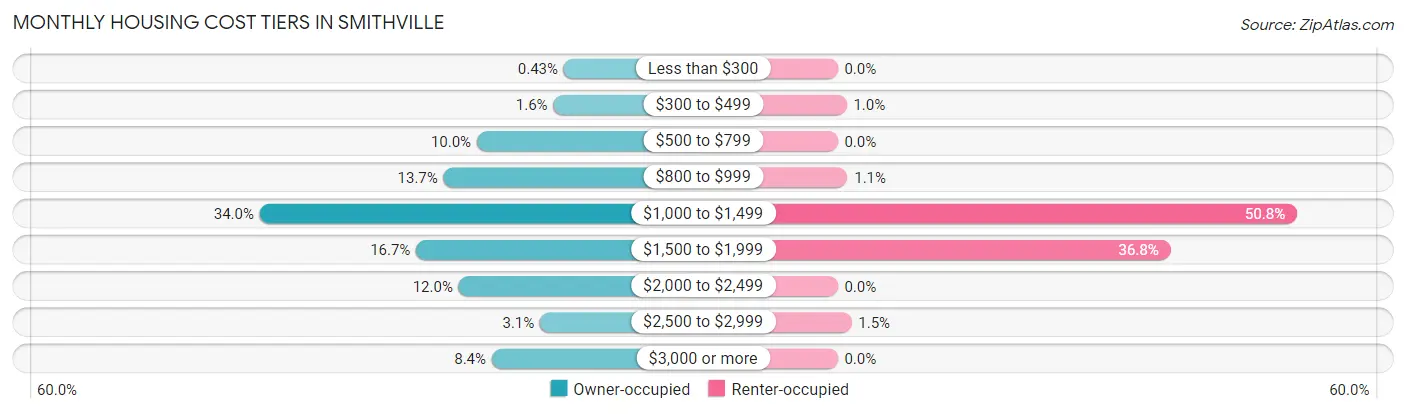
| Monthly Cost | Owner-occupied | Renter-occupied |
| Less than $300 | 15 (0.4%) | 0 (0.0%) |
| $300 to $499 | 55 (1.6%) | 11 (1.0%) |
| $500 to $799 | 348 (10.0%) | 0 (0.0%) |
| $800 to $999 | 476 (13.7%) | 12 (1.1%) |
| $1,000 to $1,499 | 1,181 (34.0%) | 560 (50.8%) |
| $1,500 to $1,999 | 581 (16.7%) | 406 (36.8%) |
| $2,000 to $2,499 | 418 (12.0%) | 0 (0.0%) |
| $2,500 to $2,999 | 106 (3.0%) | 17 (1.5%) |
| $3,000 or more | 291 (8.4%) | 0 (0.0%) |
| Total | 3,471 (100.0%) | 1,103 (100.0%) |
Physical Housing Characteristics in Smithville
Housing Structures in Smithville
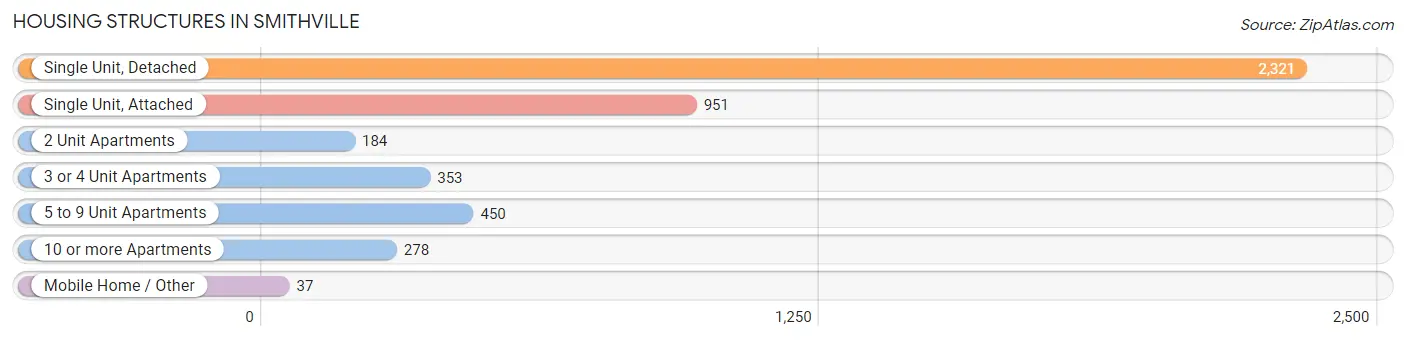
| Structure Type | # Housing Units | % Housing Units |
| Single Unit, Detached | 2,321 | 50.7% |
| Single Unit, Attached | 951 | 20.8% |
| 2 Unit Apartments | 184 | 4.0% |
| 3 or 4 Unit Apartments | 353 | 7.7% |
| 5 to 9 Unit Apartments | 450 | 9.8% |
| 10 or more Apartments | 278 | 6.1% |
| Mobile Home / Other | 37 | 0.8% |
| Total | 4,574 | 100.0% |
Housing Structures by Occupancy in Smithville
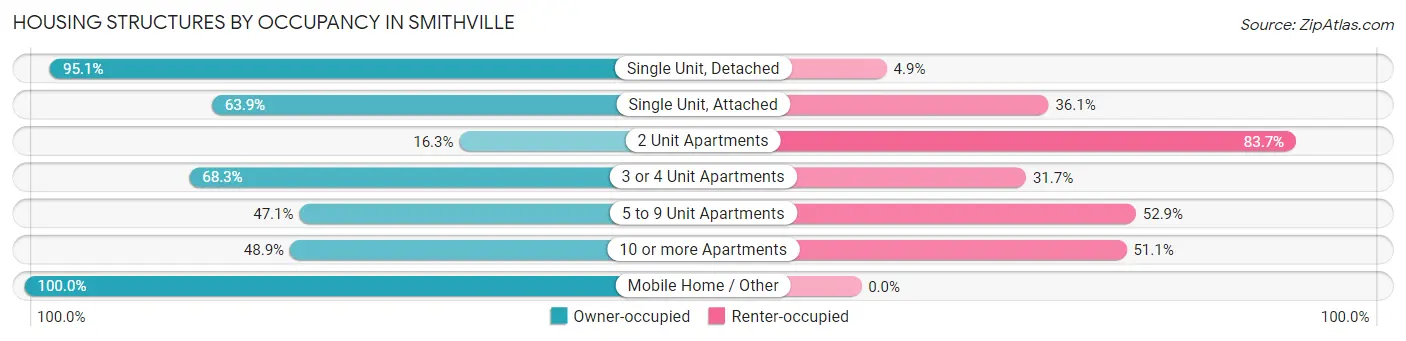
| Structure Type | Owner-occupied | Renter-occupied |
| Single Unit, Detached | 2,207 (95.1%) | 114 (4.9%) |
| Single Unit, Attached | 608 (63.9%) | 343 (36.1%) |
| 2 Unit Apartments | 30 (16.3%) | 154 (83.7%) |
| 3 or 4 Unit Apartments | 241 (68.3%) | 112 (31.7%) |
| 5 to 9 Unit Apartments | 212 (47.1%) | 238 (52.9%) |
| 10 or more Apartments | 136 (48.9%) | 142 (51.1%) |
| Mobile Home / Other | 37 (100.0%) | 0 (0.0%) |
| Total | 3,471 (75.9%) | 1,103 (24.1%) |
Housing Structures by Number of Rooms in Smithville
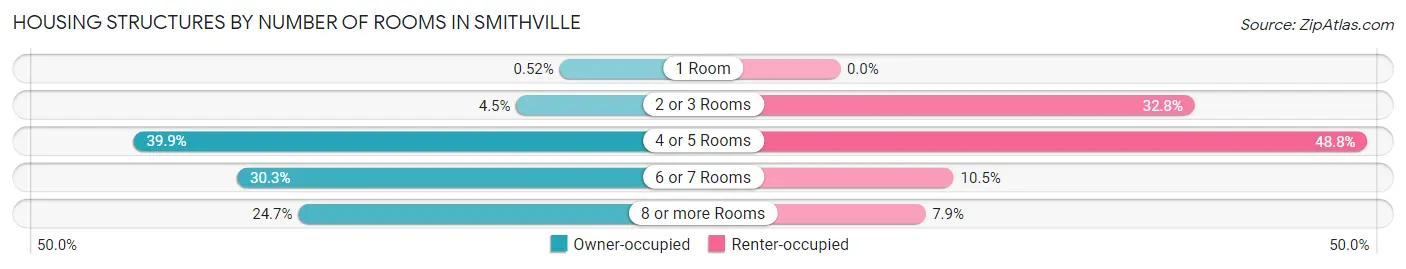
| Number of Rooms | Owner-occupied | Renter-occupied |
| 1 Room | 18 (0.5%) | 0 (0.0%) |
| 2 or 3 Rooms | 157 (4.5%) | 362 (32.8%) |
| 4 or 5 Rooms | 1,386 (39.9%) | 538 (48.8%) |
| 6 or 7 Rooms | 1,053 (30.3%) | 116 (10.5%) |
| 8 or more Rooms | 857 (24.7%) | 87 (7.9%) |
| Total | 3,471 (100.0%) | 1,103 (100.0%) |
Housing Structure by Heating Type in Smithville
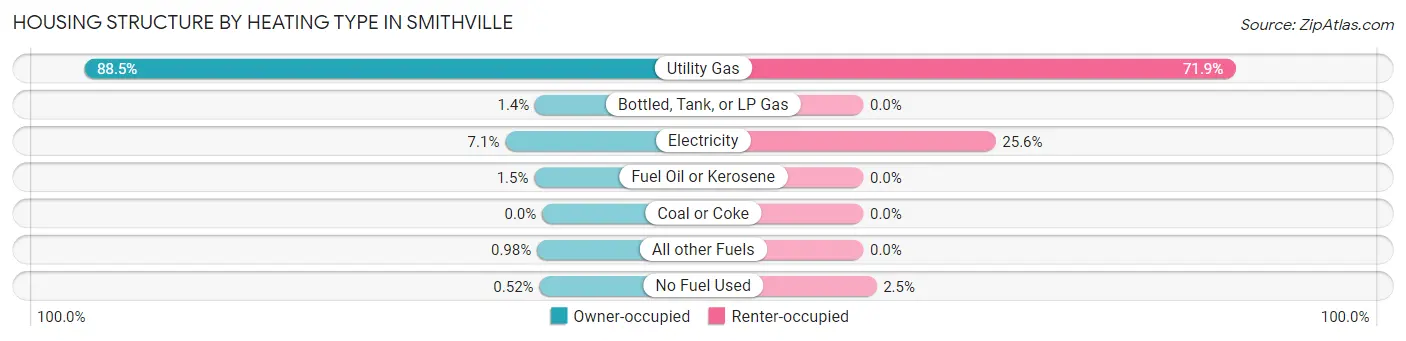
| Heating Type | Owner-occupied | Renter-occupied |
| Utility Gas | 3,073 (88.5%) | 793 (71.9%) |
| Bottled, Tank, or LP Gas | 47 (1.3%) | 0 (0.0%) |
| Electricity | 247 (7.1%) | 282 (25.6%) |
| Fuel Oil or Kerosene | 52 (1.5%) | 0 (0.0%) |
| Coal or Coke | 0 (0.0%) | 0 (0.0%) |
| All other Fuels | 34 (1.0%) | 0 (0.0%) |
| No Fuel Used | 18 (0.5%) | 28 (2.5%) |
| Total | 3,471 (100.0%) | 1,103 (100.0%) |
Household Vehicle Usage in Smithville
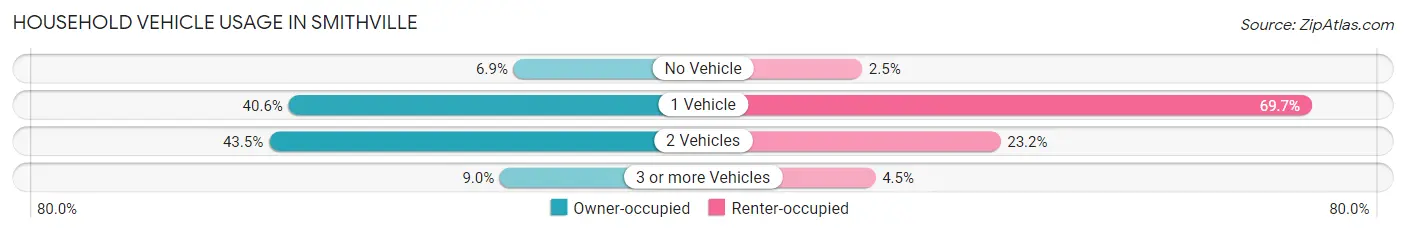
| Vehicles per Household | Owner-occupied | Renter-occupied |
| No Vehicle | 241 (6.9%) | 28 (2.5%) |
| 1 Vehicle | 1,408 (40.6%) | 769 (69.7%) |
| 2 Vehicles | 1,510 (43.5%) | 256 (23.2%) |
| 3 or more Vehicles | 312 (9.0%) | 50 (4.5%) |
| Total | 3,471 (100.0%) | 1,103 (100.0%) |
Real Estate & Mortgages in Smithville
Real Estate and Mortgage Overview in Smithville
| Characteristic | Without Mortgage | With Mortgage |
| Housing Units | 1,311 | 2,160 |
| Median Property Value | $265,300 | $215,000 |
| Median Household Income | $71,272 | $341 |
| Monthly Housing Costs | $911 | $291 |
| Real Estate Taxes | $6,176 | $65 |
Property Value by Mortgage Status in Smithville
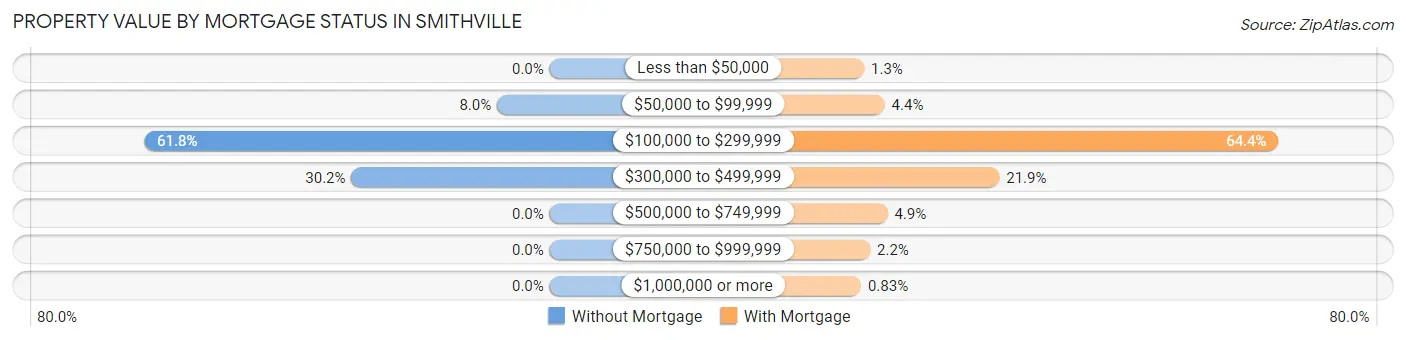
| Property Value | Without Mortgage | With Mortgage |
| Less than $50,000 | 0 (0.0%) | 28 (1.3%) |
| $50,000 to $99,999 | 105 (8.0%) | 96 (4.4%) |
| $100,000 to $299,999 | 810 (61.8%) | 1,392 (64.4%) |
| $300,000 to $499,999 | 396 (30.2%) | 473 (21.9%) |
| $500,000 to $749,999 | 0 (0.0%) | 105 (4.9%) |
| $750,000 to $999,999 | 0 (0.0%) | 48 (2.2%) |
| $1,000,000 or more | 0 (0.0%) | 18 (0.8%) |
| Total | 1,311 (100.0%) | 2,160 (100.0%) |
Household Income by Mortgage Status in Smithville
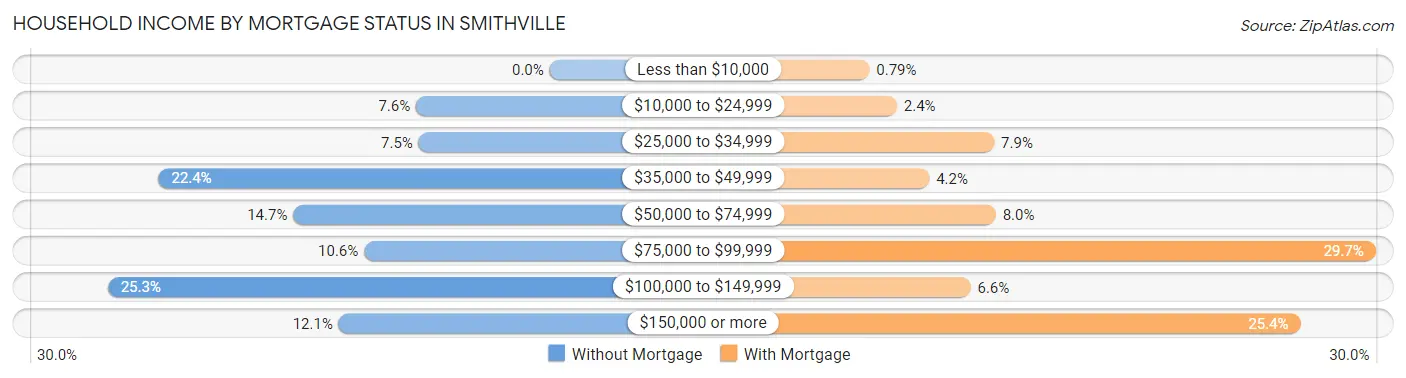
| Household Income | Without Mortgage | With Mortgage |
| Less than $10,000 | 0 (0.0%) | 17 (0.8%) |
| $10,000 to $24,999 | 100 (7.6%) | 51 (2.4%) |
| $25,000 to $34,999 | 98 (7.5%) | 171 (7.9%) |
| $35,000 to $49,999 | 293 (22.4%) | 91 (4.2%) |
| $50,000 to $74,999 | 192 (14.6%) | 173 (8.0%) |
| $75,000 to $99,999 | 139 (10.6%) | 642 (29.7%) |
| $100,000 to $149,999 | 331 (25.3%) | 142 (6.6%) |
| $150,000 or more | 158 (12.0%) | 549 (25.4%) |
| Total | 1,311 (100.0%) | 2,160 (100.0%) |
Property Value to Household Income Ratio in Smithville
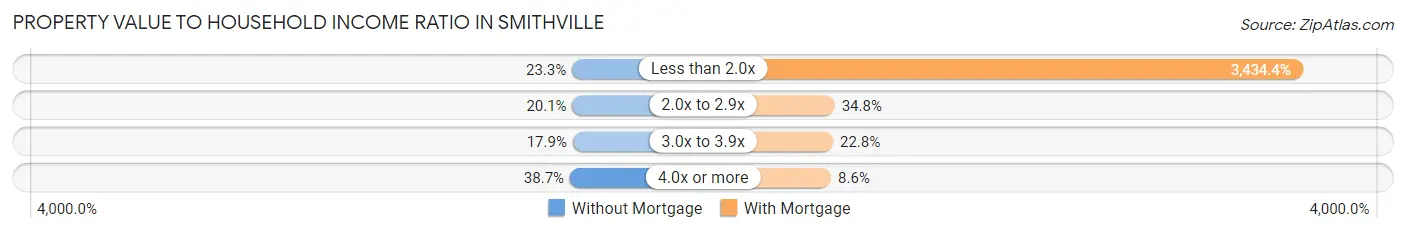
| Value-to-Income Ratio | Without Mortgage | With Mortgage |
| Less than 2.0x | 305 (23.3%) | 74,184 (3,434.4%) |
| 2.0x to 2.9x | 264 (20.1%) | 751 (34.8%) |
| 3.0x to 3.9x | 235 (17.9%) | 492 (22.8%) |
| 4.0x or more | 507 (38.7%) | 185 (8.6%) |
| Total | 1,311 (100.0%) | 2,160 (100.0%) |
Real Estate Taxes by Mortgage Status in Smithville
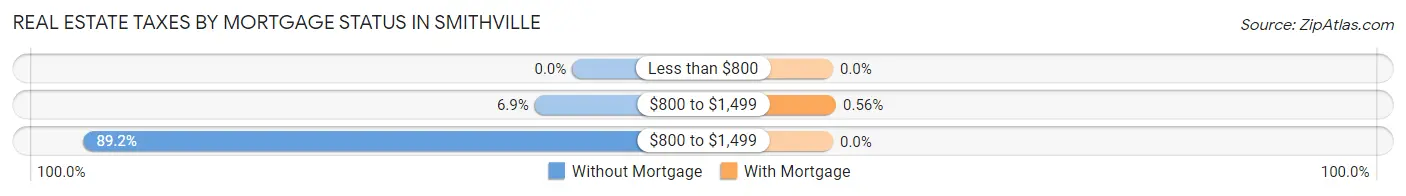
| Property Taxes | Without Mortgage | With Mortgage |
| Less than $800 | 0 (0.0%) | 0 (0.0%) |
| $800 to $1,499 | 90 (6.9%) | 12 (0.6%) |
| $800 to $1,499 | 1,170 (89.2%) | 0 (0.0%) |
| Total | 1,311 (100.0%) | 2,160 (100.0%) |
Health & Disability in Smithville
Health Insurance Coverage by Age in Smithville
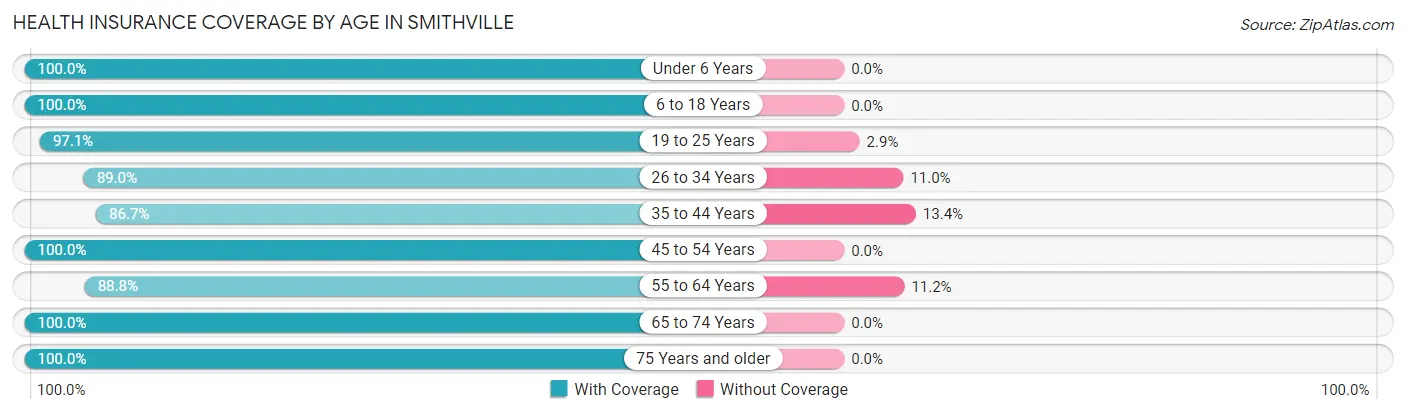
| Age Bracket | With Coverage | Without Coverage |
| Under 6 Years | 211 (100.0%) | 0 (0.0%) |
| 6 to 18 Years | 1,085 (100.0%) | 0 (0.0%) |
| 19 to 25 Years | 507 (97.1%) | 15 (2.9%) |
| 26 to 34 Years | 1,323 (89.0%) | 164 (11.0%) |
| 35 to 44 Years | 610 (86.7%) | 94 (13.4%) |
| 45 to 54 Years | 1,134 (100.0%) | 0 (0.0%) |
| 55 to 64 Years | 1,218 (88.8%) | 154 (11.2%) |
| 65 to 74 Years | 1,169 (100.0%) | 0 (0.0%) |
| 75 Years and older | 1,451 (100.0%) | 0 (0.0%) |
| Total | 8,708 (95.3%) | 427 (4.7%) |
Health Insurance Coverage by Citizenship Status in Smithville
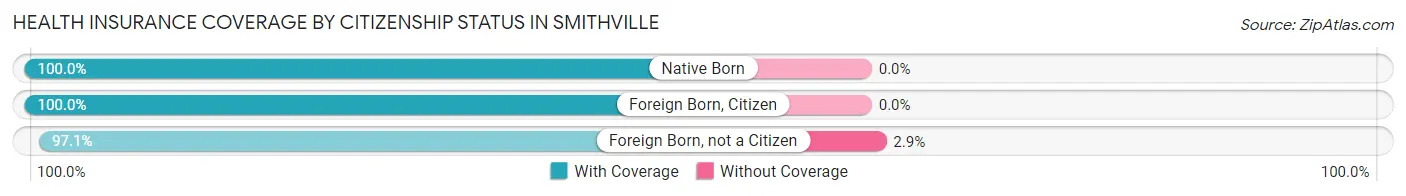
| Citizenship Status | With Coverage | Without Coverage |
| Native Born | 211 (100.0%) | 0 (0.0%) |
| Foreign Born, Citizen | 1,085 (100.0%) | 0 (0.0%) |
| Foreign Born, not a Citizen | 507 (97.1%) | 15 (2.9%) |
Health Insurance Coverage by Household Income in Smithville
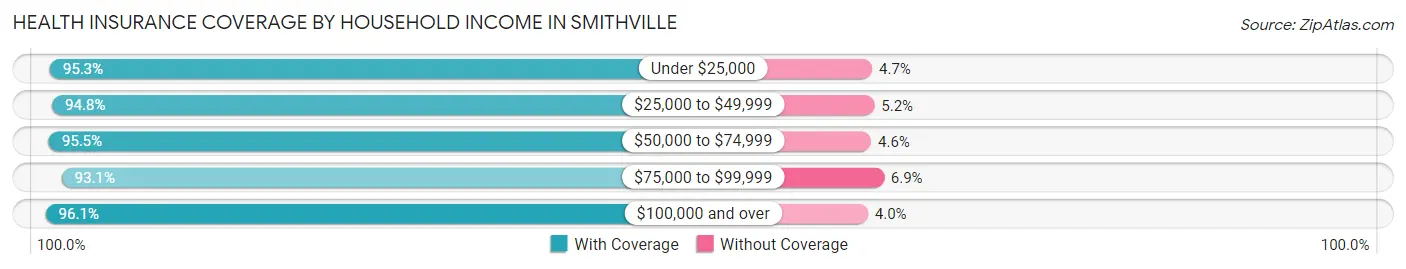
| Household Income | With Coverage | Without Coverage |
| Under $25,000 | 803 (95.3%) | 40 (4.7%) |
| $25,000 to $49,999 | 1,745 (94.8%) | 95 (5.2%) |
| $50,000 to $74,999 | 2,138 (95.5%) | 102 (4.5%) |
| $75,000 to $99,999 | 738 (93.1%) | 55 (6.9%) |
| $100,000 and over | 3,284 (96.1%) | 135 (4.0%) |
Public vs Private Health Insurance Coverage by Age in Smithville
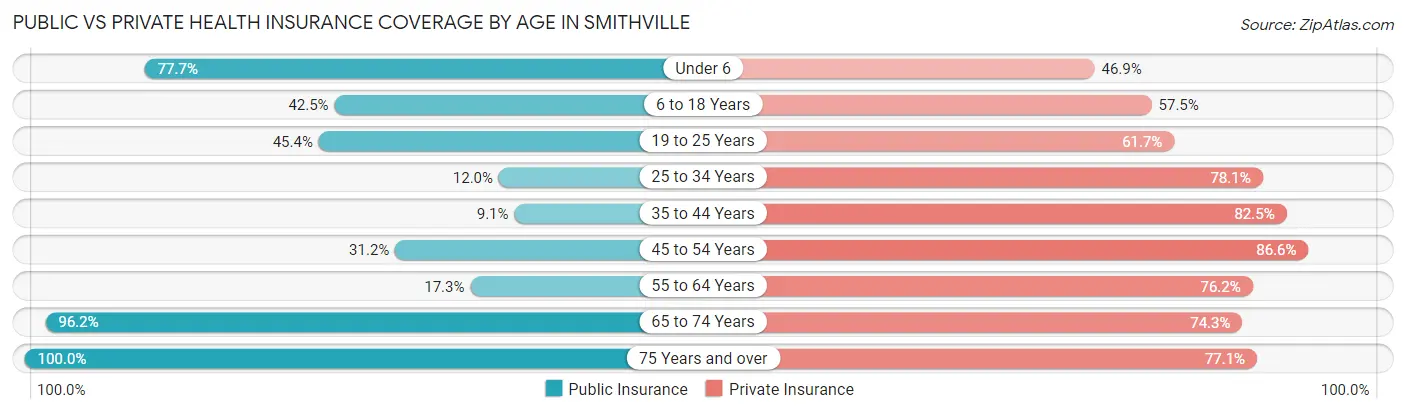
| Age Bracket | Public Insurance | Private Insurance |
| Under 6 | 164 (77.7%) | 99 (46.9%) |
| 6 to 18 Years | 461 (42.5%) | 624 (57.5%) |
| 19 to 25 Years | 237 (45.4%) | 322 (61.7%) |
| 25 to 34 Years | 178 (12.0%) | 1,161 (78.1%) |
| 35 to 44 Years | 64 (9.1%) | 581 (82.5%) |
| 45 to 54 Years | 354 (31.2%) | 982 (86.6%) |
| 55 to 64 Years | 237 (17.3%) | 1,046 (76.2%) |
| 65 to 74 Years | 1,124 (96.2%) | 869 (74.3%) |
| 75 Years and over | 1,451 (100.0%) | 1,118 (77.0%) |
| Total | 4,270 (46.7%) | 6,802 (74.5%) |
Disability Status by Sex by Age in Smithville
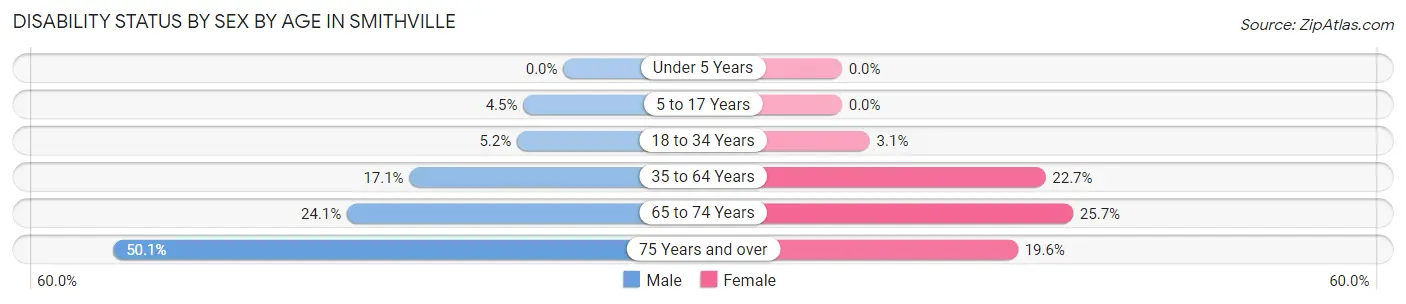
| Age Bracket | Male | Female |
| Under 5 Years | 0 (0.0%) | 0 (0.0%) |
| 5 to 17 Years | 19 (4.5%) | 0 (0.0%) |
| 18 to 34 Years | 51 (5.2%) | 35 (3.1%) |
| 35 to 64 Years | 275 (17.1%) | 364 (22.7%) |
| 65 to 74 Years | 86 (24.1%) | 209 (25.7%) |
| 75 Years and over | 387 (50.1%) | 133 (19.6%) |
Disability Class by Sex by Age in Smithville
Disability Class: Hearing Difficulty
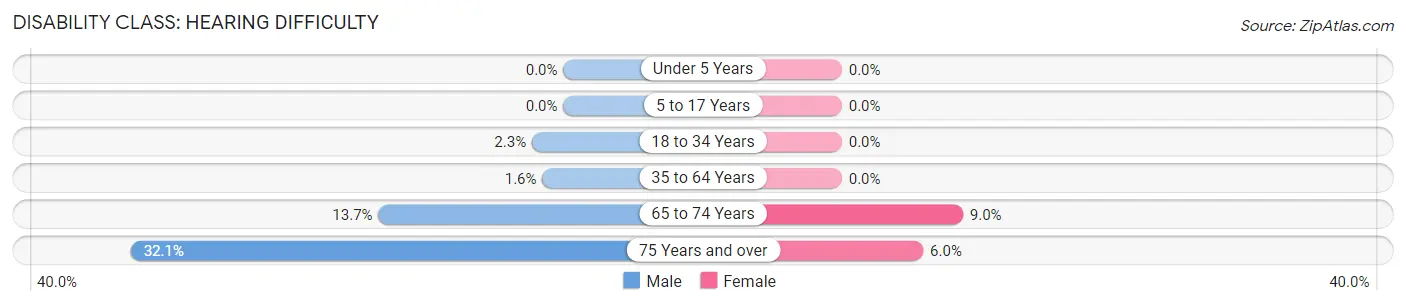
| Age Bracket | Male | Female |
| Under 5 Years | 0 (0.0%) | 0 (0.0%) |
| 5 to 17 Years | 0 (0.0%) | 0 (0.0%) |
| 18 to 34 Years | 23 (2.3%) | 0 (0.0%) |
| 35 to 64 Years | 25 (1.6%) | 0 (0.0%) |
| 65 to 74 Years | 49 (13.7%) | 73 (9.0%) |
| 75 Years and over | 248 (32.1%) | 41 (6.0%) |
Disability Class: Vision Difficulty
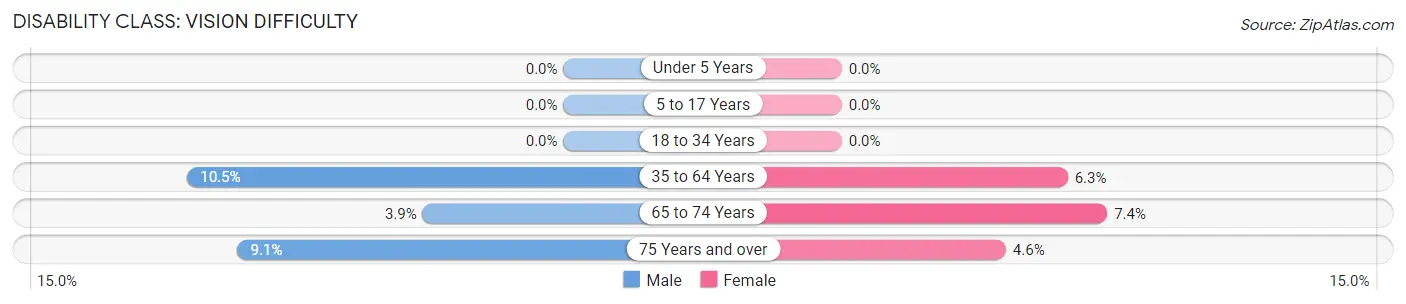
| Age Bracket | Male | Female |
| Under 5 Years | 0 (0.0%) | 0 (0.0%) |
| 5 to 17 Years | 0 (0.0%) | 0 (0.0%) |
| 18 to 34 Years | 0 (0.0%) | 0 (0.0%) |
| 35 to 64 Years | 168 (10.5%) | 101 (6.3%) |
| 65 to 74 Years | 14 (3.9%) | 60 (7.4%) |
| 75 Years and over | 70 (9.1%) | 31 (4.6%) |
Disability Class: Cognitive Difficulty
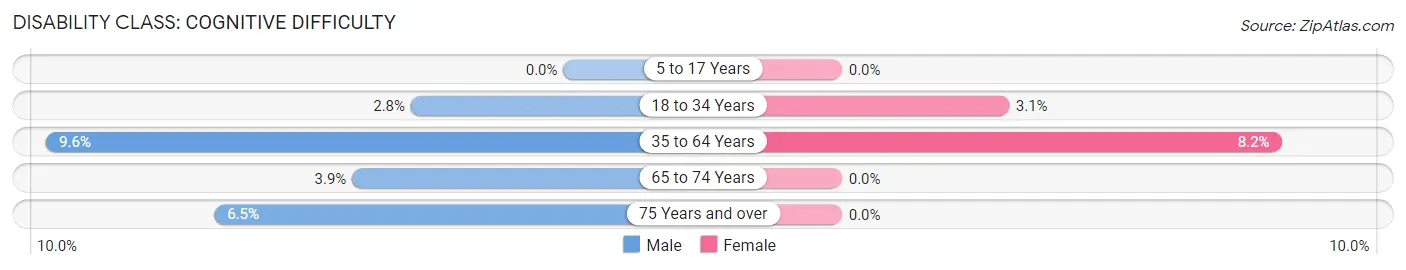
| Age Bracket | Male | Female |
| 5 to 17 Years | 0 (0.0%) | 0 (0.0%) |
| 18 to 34 Years | 28 (2.8%) | 35 (3.1%) |
| 35 to 64 Years | 154 (9.6%) | 131 (8.2%) |
| 65 to 74 Years | 14 (3.9%) | 0 (0.0%) |
| 75 Years and over | 50 (6.5%) | 0 (0.0%) |
Disability Class: Ambulatory Difficulty
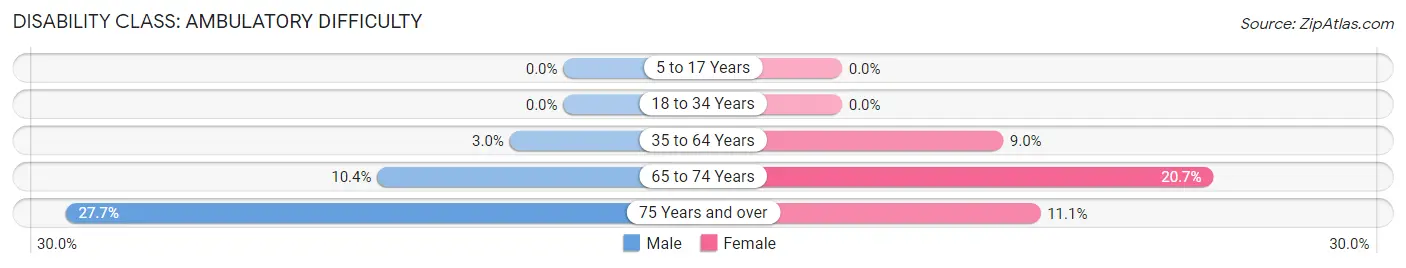
| Age Bracket | Male | Female |
| 5 to 17 Years | 0 (0.0%) | 0 (0.0%) |
| 18 to 34 Years | 0 (0.0%) | 0 (0.0%) |
| 35 to 64 Years | 48 (3.0%) | 144 (9.0%) |
| 65 to 74 Years | 37 (10.4%) | 168 (20.7%) |
| 75 Years and over | 214 (27.7%) | 75 (11.1%) |
Disability Class: Self-Care Difficulty
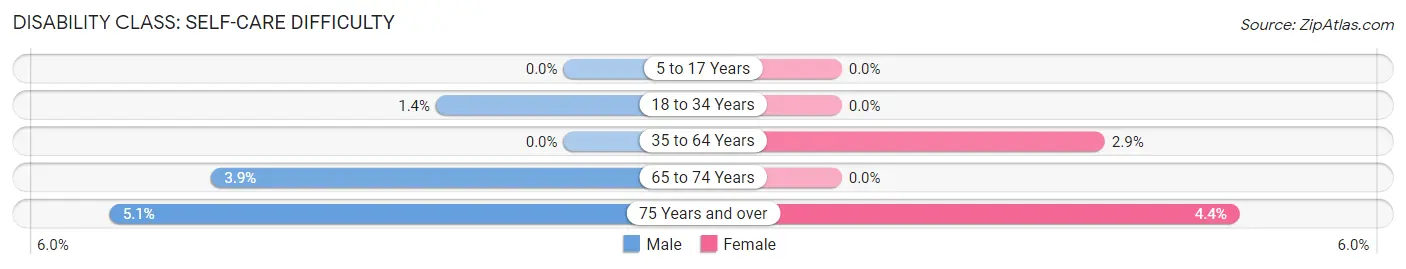
| Age Bracket | Male | Female |
| 5 to 17 Years | 0 (0.0%) | 0 (0.0%) |
| 18 to 34 Years | 14 (1.4%) | 0 (0.0%) |
| 35 to 64 Years | 0 (0.0%) | 47 (2.9%) |
| 65 to 74 Years | 14 (3.9%) | 0 (0.0%) |
| 75 Years and over | 39 (5.1%) | 30 (4.4%) |
Technology Access in Smithville
Computing Device Access in Smithville
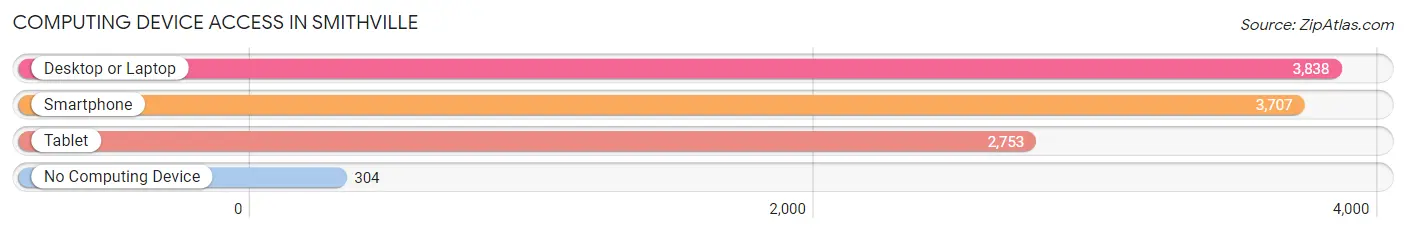
| Device Type | # Households | % Households |
| Desktop or Laptop | 3,838 | 83.9% |
| Smartphone | 3,707 | 81.0% |
| Tablet | 2,753 | 60.2% |
| No Computing Device | 304 | 6.7% |
| Total | 4,574 | 100.0% |
Internet Access in Smithville
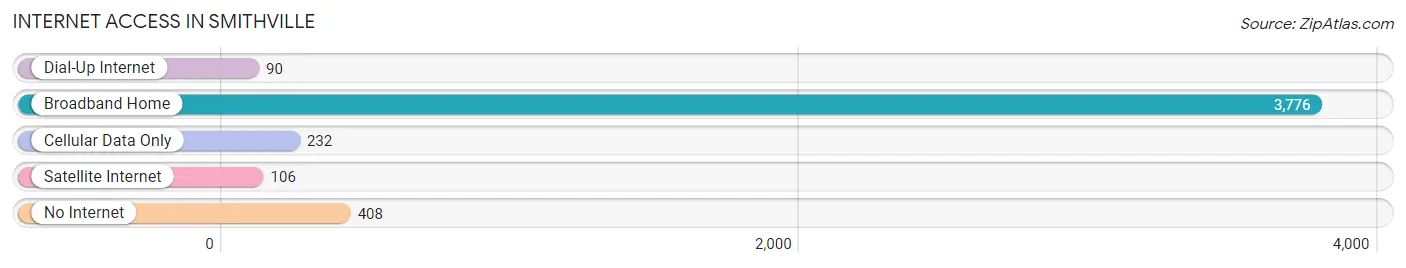
| Internet Type | # Households | % Households |
| Dial-Up Internet | 90 | 2.0% |
| Broadband Home | 3,776 | 82.6% |
| Cellular Data Only | 232 | 5.1% |
| Satellite Internet | 106 | 2.3% |
| No Internet | 408 | 8.9% |
| Total | 4,574 | 100.0% |
Smithville Summary
History
The area now known as Smithville, New Jersey was first settled in the late 1700s by a group of Quakers from Pennsylvania. The town was originally known as Quakertown, but was later renamed Smithville in honor of the Smith family, who were among the first settlers. The town was officially incorporated in 1845.
In the early 19th century, Smithville was a thriving agricultural community, with many farms and orchards. The town was also home to several mills, including a grist mill, a saw mill, and a paper mill. The paper mill was the largest employer in town, and it provided paper for the local newspaper, the Smithville Gazette.
In the late 19th century, Smithville began to experience a period of industrialization. The town was home to several factories, including a glass factory, a brick factory, and a furniture factory. The factories provided jobs for many of the town’s residents, and the town’s population began to grow.
In the early 20th century, Smithville experienced a period of decline. Many of the factories closed, and the town’s population began to decline. In the 1950s, the town was revitalized by the construction of a new highway, which brought new businesses and residents to the area.
Today, Smithville is a small town with a population of about 4,000. The town is home to several small businesses, including a few restaurants, a grocery store, and a few shops. The town is also home to a few historic sites, including the Smithville Historic District, which is listed on the National Register of Historic Places.
Geography
Smithville is located in Atlantic County, New Jersey, in the United States. The town is situated on the Atlantic Coastal Plain, and is bordered by the towns of Egg Harbor Township, Galloway Township, and Absecon. The town is located about 10 miles south of Atlantic City, and about 50 miles east of Philadelphia.
The town has a total area of 4.2 square miles, of which 4.1 square miles is land and 0.1 square miles is water. The town is located in a humid subtropical climate zone, and experiences hot, humid summers and mild winters.
Economy
The economy of Smithville is largely based on tourism and retail. The town is home to several small businesses, including restaurants, shops, and a grocery store. The town is also home to a few historic sites, which attract visitors from around the region.
The town is also home to a few manufacturing companies, including a glass factory and a furniture factory. The town is also home to a few small farms, which produce fruits and vegetables for local markets.
Demographics
As of the 2010 census, the population of Smithville was 4,039. The town has a population density of 962.3 people per square mile. The median age of the town’s population is 43.7 years, and the median household income is $50,945.
The town is predominantly white, with 87.3% of the population identifying as white. The town also has a small Hispanic population, with 5.3% of the population identifying as Hispanic or Latino. The town also has a small African American population, with 4.2% of the population identifying as African American.
Conclusion
Smithville, New Jersey is a small town with a rich history and a vibrant economy. The town is home to several small businesses, historic sites, and manufacturing companies. The town has a predominantly white population, with a small Hispanic and African American population. The town is a popular tourist destination, and is a great place to live and work.
Common Questions
What is Per Capita Income in Smithville?
Per Capita income in Smithville is $43,720.
What is the Median Family Income in Smithville?
Median Family Income in Smithville is $78,445.
What is the Median Household income in Smithville?
Median Household Income in Smithville is $67,453.
What is Income or Wage Gap in Smithville?
Income or Wage Gap in Smithville is 7.7%.
Women in Smithville earn 92.3 cents for every dollar earned by a man.
What is Inequality or Gini Index in Smithville?
Inequality or Gini Index in Smithville is 0.41.
What is the Total Population of Smithville?
Total Population of Smithville is 9,135.
What is the Total Male Population of Smithville?
Total Male Population of Smithville is 4,225.
What is the Total Female Population of Smithville?
Total Female Population of Smithville is 4,910.
What is the Ratio of Males per 100 Females in Smithville?
There are 86.05 Males per 100 Females in Smithville.
What is the Ratio of Females per 100 Males in Smithville?
There are 116.21 Females per 100 Males in Smithville.
What is the Median Population Age in Smithville?
Median Population Age in Smithville is 48.9 Years.
What is the Average Family Size in Smithville
Average Family Size in Smithville is 2.8 People.
What is the Average Household Size in Smithville
Average Household Size in Smithville is 2.0 People.
How Large is the Labor Force in Smithville?
There are 4,768 People in the Labor Forcein in Smithville.
What is the Percentage of People in the Labor Force in Smithville?
58.7% of People are in the Labor Force in Smithville.
What is the Unemployment Rate in Smithville?
Unemployment Rate in Smithville is 4.3%.