Harmony, NJ Map & Demographics
Harmony Map
Harmony Overview
$40,694
PER CAPITA INCOME
41.7%
WAGE / INCOME GAP [ % ]
58.3¢/ $1
WAGE / INCOME GAP [ $ ]
0.37
INEQUALITY / GINI INDEX
329
TOTAL POPULATION
166
MALE POPULATION
163
FEMALE POPULATION
101.84
MALES / 100 FEMALES
98.19
FEMALES / 100 MALES
49.2
MEDIAN AGE
2.8
AVG FAMILY SIZE
2.2
AVG HOUSEHOLD SIZE
161
LABOR FORCE [ PEOPLE ]
54.0%
PERCENT IN LABOR FORCE
Income in Harmony
Income Overview in Harmony
| Characteristic | Number | Measure |
| Per Capita Income | 329 | $40,694 |
| Median Family Income | 93 | $0 |
| Mean Family Income | 93 | $97,233 |
| Median Household Income | 146 | $0 |
| Mean Household Income | 146 | $89,384 |
| Income Deficit | 93 | $0 |
| Wage / Income Gap (%) | 329 | 41.75% |
| Wage / Income Gap ($) | 329 | 58.25¢ per $1 |
| Gini / Inequality Index | 329 | 0.37 |
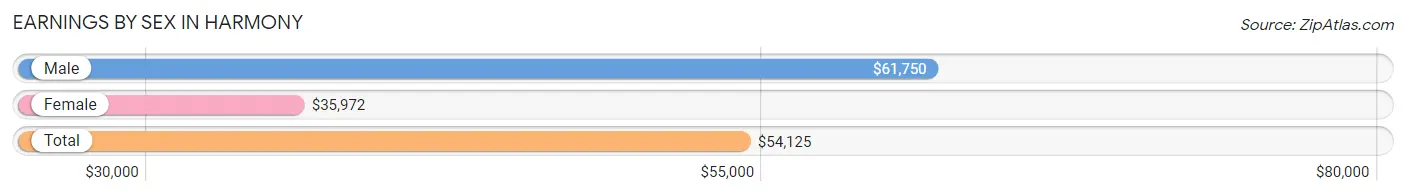
Earnings by Sex in Harmony
Average Earnings in Harmony are $54,125, $61,750 for men and $35,972 for women, a difference of 41.7%.
| Sex | Number | Average Earnings |
| Male | 105 (59.0%) | $61,750 |
| Female | 73 (41.0%) | $35,972 |
| Total | 178 (100.0%) | $54,125 |
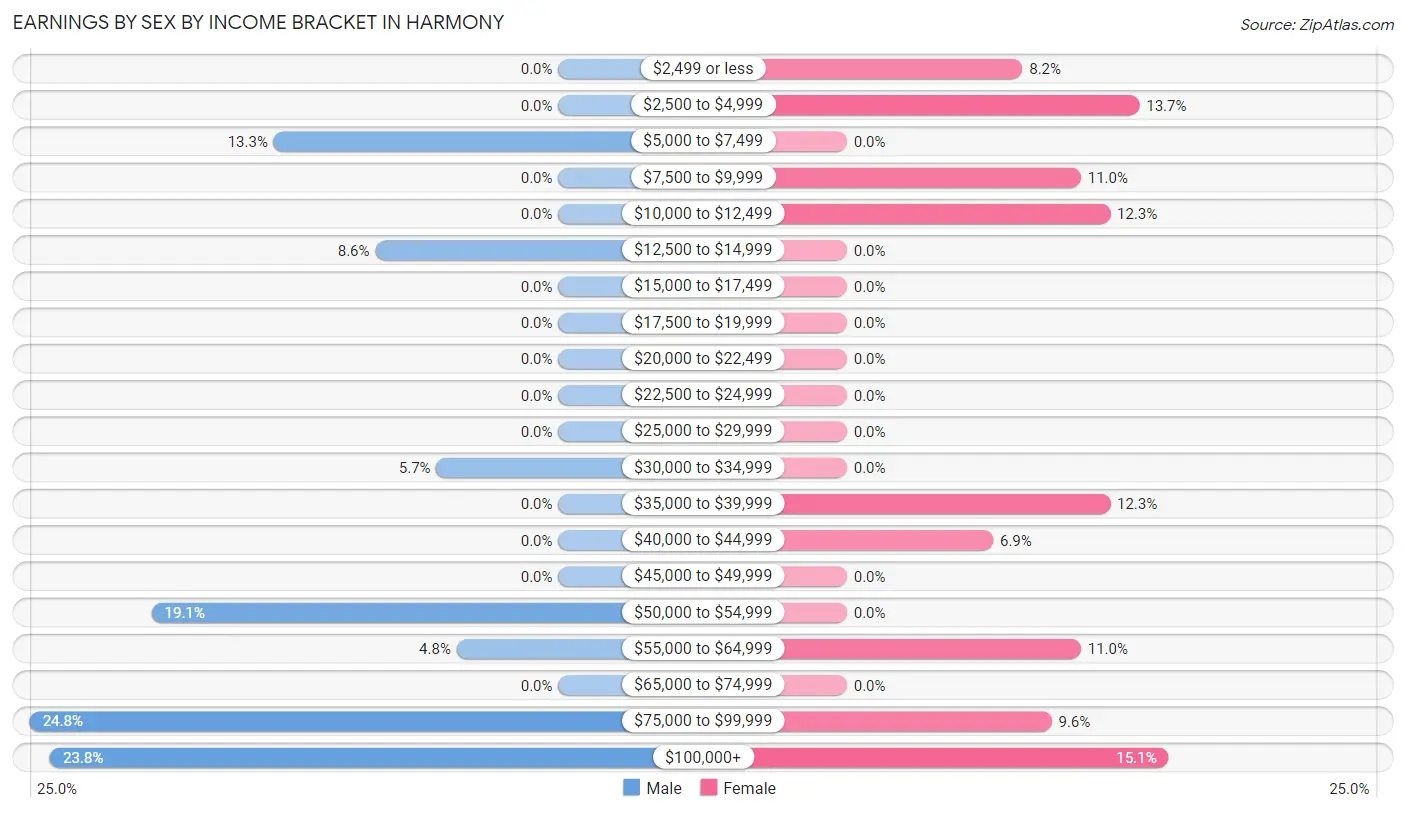
Earnings by Sex by Income Bracket in Harmony
The most common earnings brackets in Harmony are $75,000 to $99,999 for men (26 | 24.8%) and $100,000+ for women (11 | 15.1%).
| Income | Male | Female |
| $2,499 or less | 0 (0.0%) | 6 (8.2%) |
| $2,500 to $4,999 | 0 (0.0%) | 10 (13.7%) |
| $5,000 to $7,499 | 14 (13.3%) | 0 (0.0%) |
| $7,500 to $9,999 | 0 (0.0%) | 8 (11.0%) |
| $10,000 to $12,499 | 0 (0.0%) | 9 (12.3%) |
| $12,500 to $14,999 | 9 (8.6%) | 0 (0.0%) |
| $15,000 to $17,499 | 0 (0.0%) | 0 (0.0%) |
| $17,500 to $19,999 | 0 (0.0%) | 0 (0.0%) |
| $20,000 to $22,499 | 0 (0.0%) | 0 (0.0%) |
| $22,500 to $24,999 | 0 (0.0%) | 0 (0.0%) |
| $25,000 to $29,999 | 0 (0.0%) | 0 (0.0%) |
| $30,000 to $34,999 | 6 (5.7%) | 0 (0.0%) |
| $35,000 to $39,999 | 0 (0.0%) | 9 (12.3%) |
| $40,000 to $44,999 | 0 (0.0%) | 5 (6.9%) |
| $45,000 to $49,999 | 0 (0.0%) | 0 (0.0%) |
| $50,000 to $54,999 | 20 (19.1%) | 0 (0.0%) |
| $55,000 to $64,999 | 5 (4.8%) | 8 (11.0%) |
| $65,000 to $74,999 | 0 (0.0%) | 0 (0.0%) |
| $75,000 to $99,999 | 26 (24.8%) | 7 (9.6%) |
| $100,000+ | 25 (23.8%) | 11 (15.1%) |
| Total | 105 (100.0%) | 73 (100.0%) |
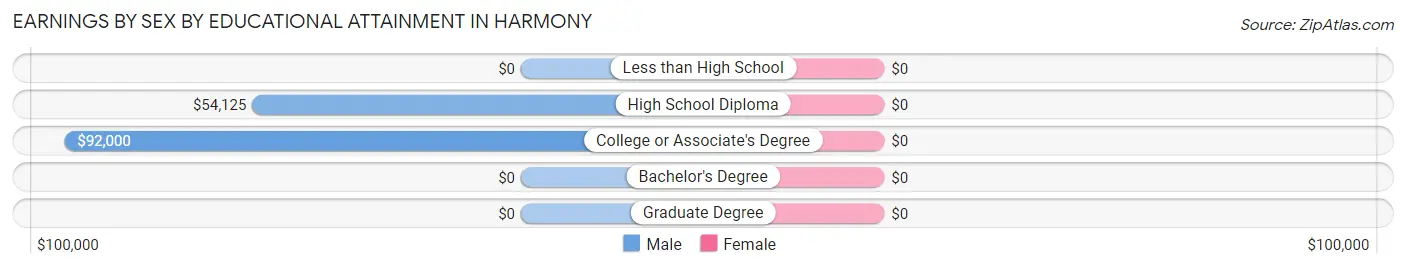
Earnings by Sex by Educational Attainment in Harmony
| Educational Attainment | Male Income | Female Income |
| Less than High School | - | - |
| High School Diploma | $54,125 | $0 |
| College or Associate's Degree | $92,000 | $0 |
| Bachelor's Degree | - | - |
| Graduate Degree | - | - |
| Total | $76,375 | $44,250 |
Family Income in Harmony
Family Income Brackets in Harmony
According to the Harmony family income data, there are 25 families falling into the $35,000 to $49,999 income range, which is the most common income bracket and makes up 26.9% of all families.
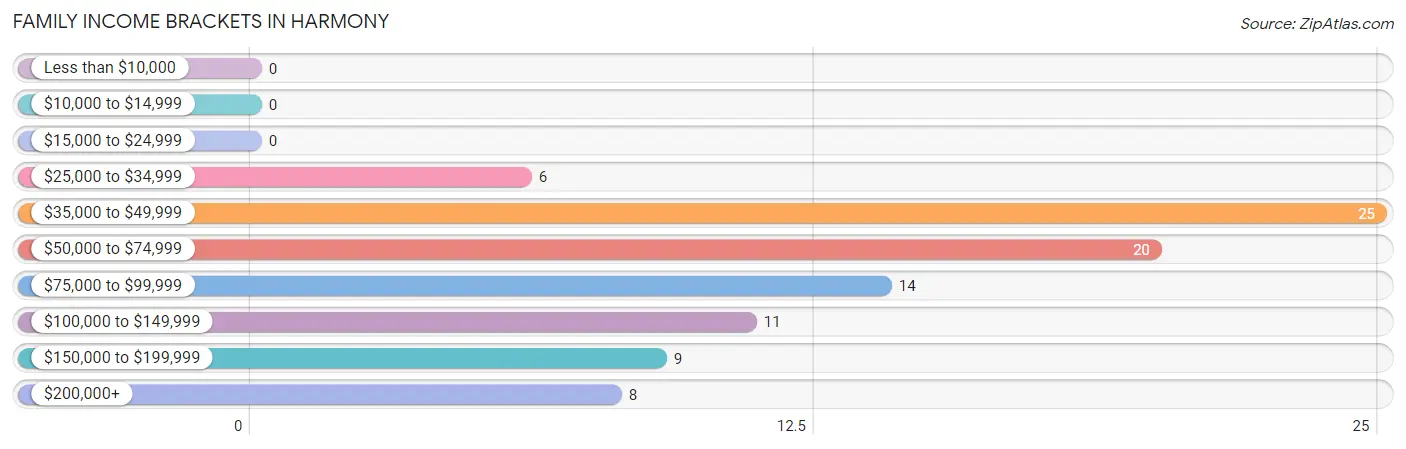
| Income Bracket | # Families | % Families |
| Less than $10,000 | 0 | 0.0% |
| $10,000 to $14,999 | 0 | 0.0% |
| $15,000 to $24,999 | 0 | 0.0% |
| $25,000 to $34,999 | 6 | 6.5% |
| $35,000 to $49,999 | 25 | 26.9% |
| $50,000 to $74,999 | 20 | 21.5% |
| $75,000 to $99,999 | 14 | 15.1% |
| $100,000 to $149,999 | 11 | 11.8% |
| $150,000 to $199,999 | 9 | 9.7% |
| $200,000+ | 8 | 8.6% |
Family Income by Famaliy Size in Harmony
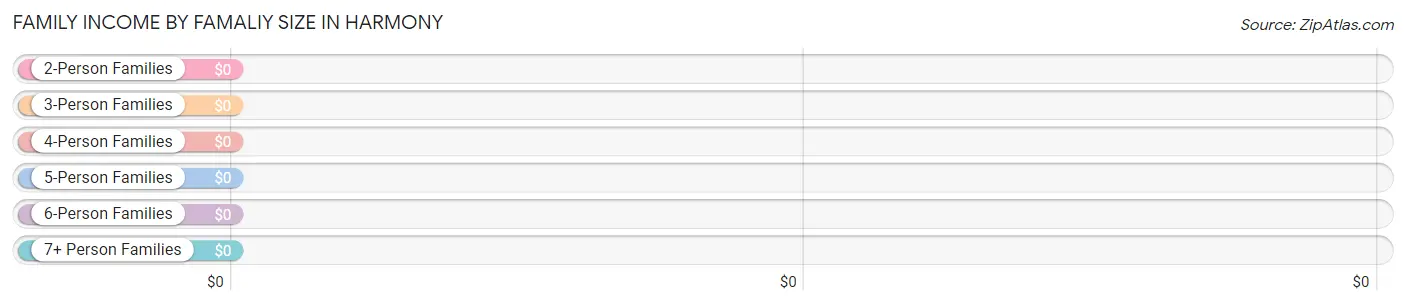
| Income Bracket | # Families | Median Income |
| 2-Person Families | 29 (31.2%) | $0 |
| 3-Person Families | 55 (59.1%) | $0 |
| 4-Person Families | 9 (9.7%) | $0 |
| 5-Person Families | 0 (0.0%) | $0 |
| 6-Person Families | 0 (0.0%) | $0 |
| 7+ Person Families | 0 (0.0%) | $0 |
| Total | 93 (100.0%) | $0 |
Family Income by Number of Earners in Harmony
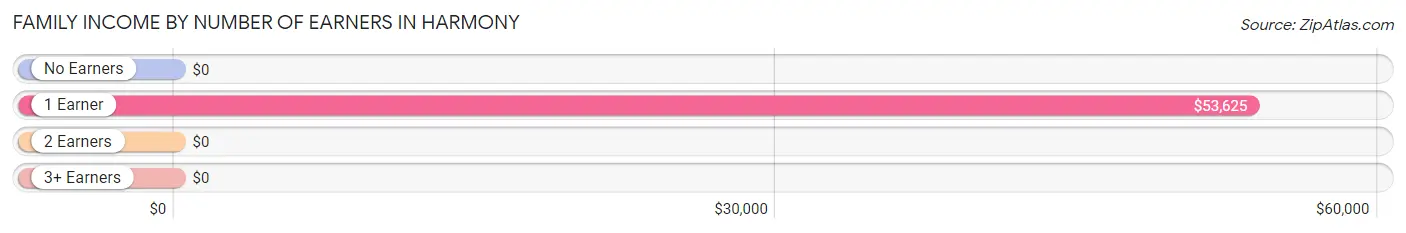
| Number of Earners | # Families | Median Income |
| No Earners | 5 (5.4%) | $0 |
| 1 Earner | 52 (55.9%) | $53,625 |
| 2 Earners | 33 (35.5%) | $0 |
| 3+ Earners | 3 (3.2%) | $0 |
| Total | 93 (100.0%) | $0 |
Household Income in Harmony
Household Income Brackets in Harmony
With 48 households falling in the category, the $35,000 to $49,999 income range is the most frequent in Harmony, accounting for 32.9% of all households.
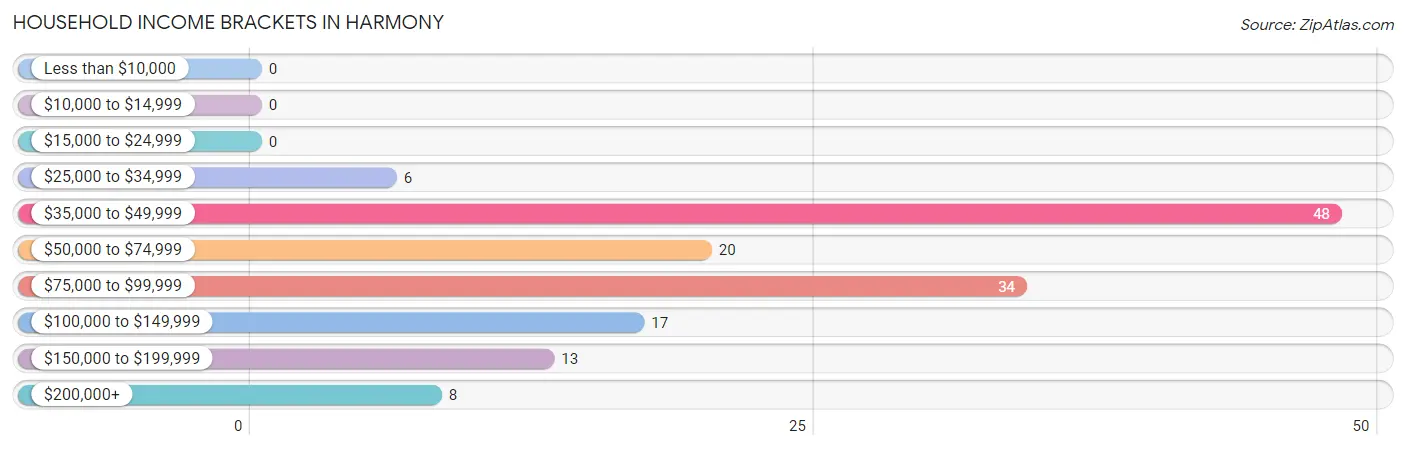
| Income Bracket | # Households | % Households |
| Less than $10,000 | 0 | 0.0% |
| $10,000 to $14,999 | 0 | 0.0% |
| $15,000 to $24,999 | 0 | 0.0% |
| $25,000 to $34,999 | 6 | 4.1% |
| $35,000 to $49,999 | 48 | 32.9% |
| $50,000 to $74,999 | 20 | 13.7% |
| $75,000 to $99,999 | 34 | 23.3% |
| $100,000 to $149,999 | 17 | 11.6% |
| $150,000 to $199,999 | 13 | 8.9% |
| $200,000+ | 8 | 5.5% |
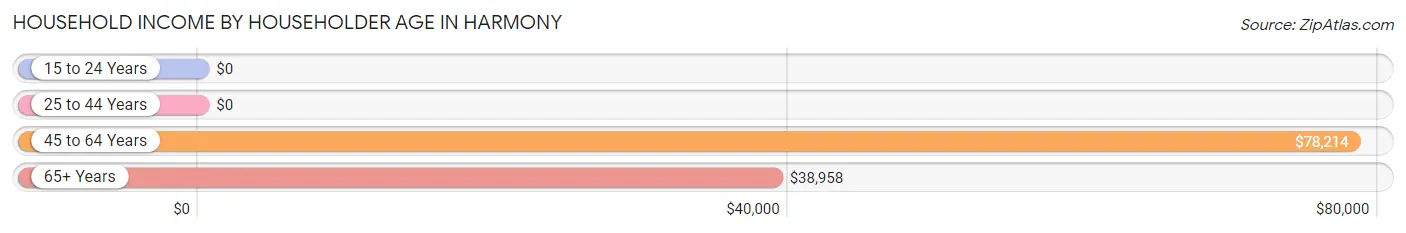
Household Income by Householder Age in Harmony
The median household income in Harmony is $0, with the highest median household income of $78,214 found in the 45 to 64 years age bracket for the primary householder. A total of 72 households (49.3%) fall into this category.
| Income Bracket | # Households | Median Income |
| 15 to 24 Years | 0 (0.0%) | $0 |
| 25 to 44 Years | 19 (13.0%) | $0 |
| 45 to 64 Years | 72 (49.3%) | $78,214 |
| 65+ Years | 55 (37.7%) | $38,958 |
| Total | 146 (100.0%) | $0 |
Poverty in Harmony
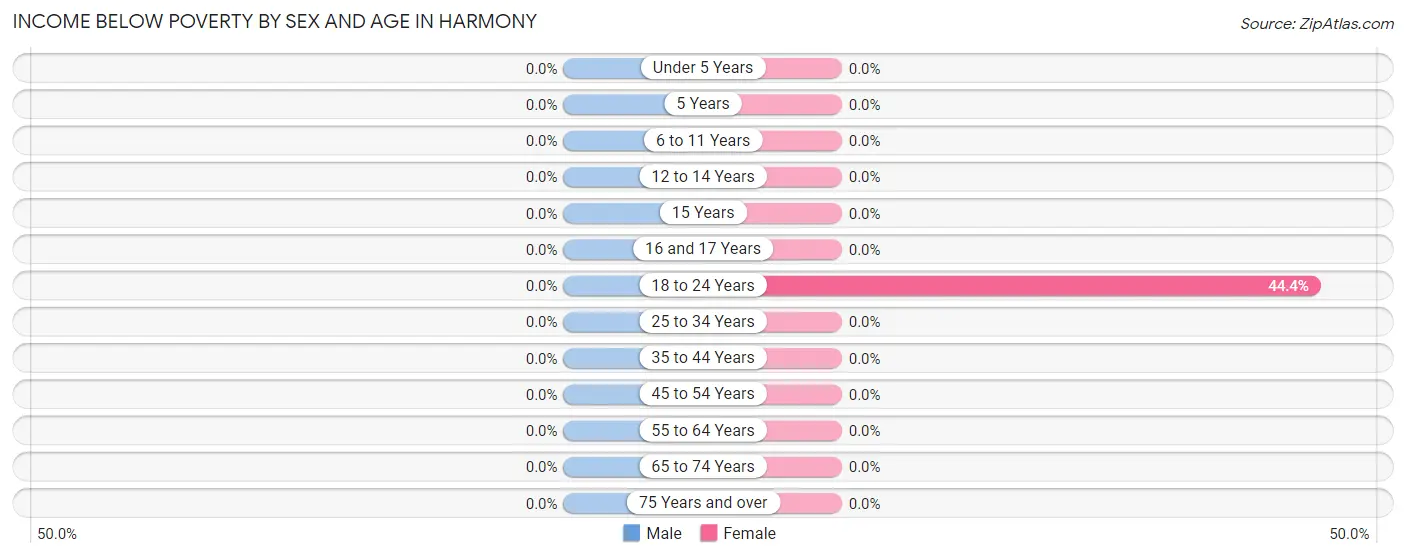
Income Below Poverty by Sex and Age in Harmony
| Age Bracket | Male | Female |
| Under 5 Years | 0 (0.0%) | 0 (0.0%) |
| 5 Years | 0 (0.0%) | 0 (0.0%) |
| 6 to 11 Years | 0 (0.0%) | 0 (0.0%) |
| 12 to 14 Years | 0 (0.0%) | 0 (0.0%) |
| 15 Years | 0 (0.0%) | 0 (0.0%) |
| 16 and 17 Years | 0 (0.0%) | 0 (0.0%) |
| 18 to 24 Years | 0 (0.0%) | 8 (44.4%) |
| 25 to 34 Years | 0 (0.0%) | 0 (0.0%) |
| 35 to 44 Years | 0 (0.0%) | 0 (0.0%) |
| 45 to 54 Years | 0 (0.0%) | 0 (0.0%) |
| 55 to 64 Years | 0 (0.0%) | 0 (0.0%) |
| 65 to 74 Years | 0 (0.0%) | 0 (0.0%) |
| 75 Years and over | 0 (0.0%) | 0 (0.0%) |
| Total | 0 (0.0%) | 8 (4.9%) |
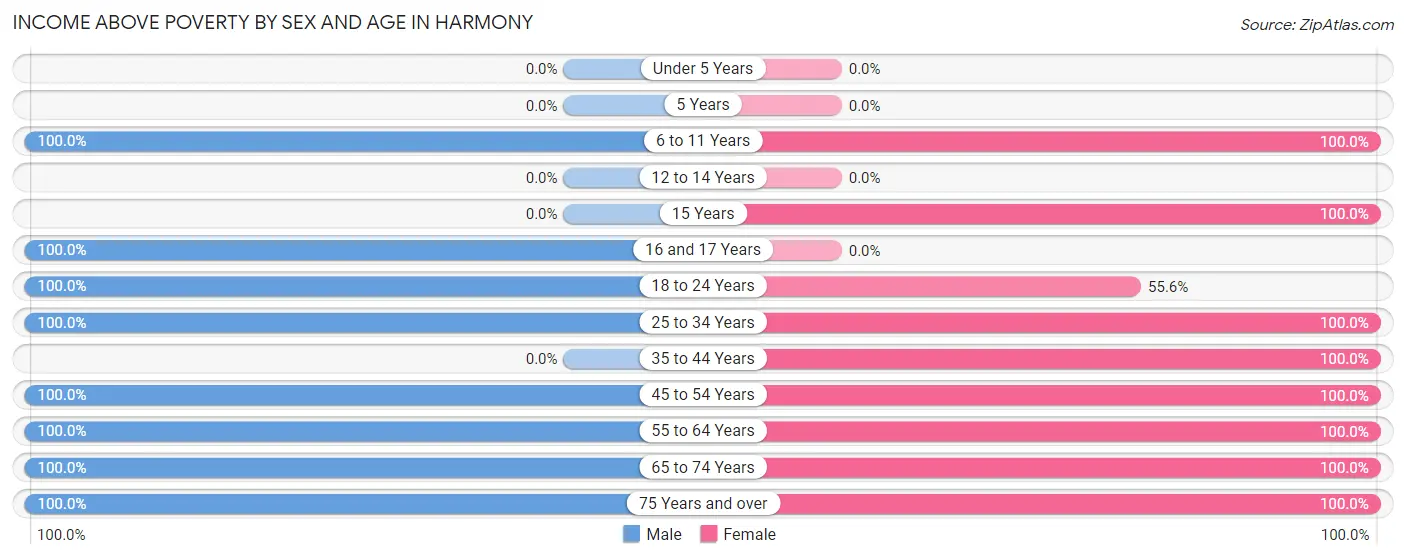
Income Above Poverty by Sex and Age in Harmony
According to the poverty statistics in Harmony, males aged 6 to 11 years and females aged 6 to 11 years are the age groups that are most secure financially, with 100.0% of males and 100.0% of females in these age groups living above the poverty line.
| Age Bracket | Male | Female |
| Under 5 Years | 0 (0.0%) | 0 (0.0%) |
| 5 Years | 0 (0.0%) | 0 (0.0%) |
| 6 to 11 Years | 10 (100.0%) | 5 (100.0%) |
| 12 to 14 Years | 0 (0.0%) | 0 (0.0%) |
| 15 Years | 0 (0.0%) | 16 (100.0%) |
| 16 and 17 Years | 11 (100.0%) | 0 (0.0%) |
| 18 to 24 Years | 14 (100.0%) | 10 (55.6%) |
| 25 to 34 Years | 29 (100.0%) | 17 (100.0%) |
| 35 to 44 Years | 0 (0.0%) | 4 (100.0%) |
| 45 to 54 Years | 54 (100.0%) | 29 (100.0%) |
| 55 to 64 Years | 20 (100.0%) | 27 (100.0%) |
| 65 to 74 Years | 14 (100.0%) | 29 (100.0%) |
| 75 Years and over | 14 (100.0%) | 18 (100.0%) |
| Total | 166 (100.0%) | 155 (95.1%) |
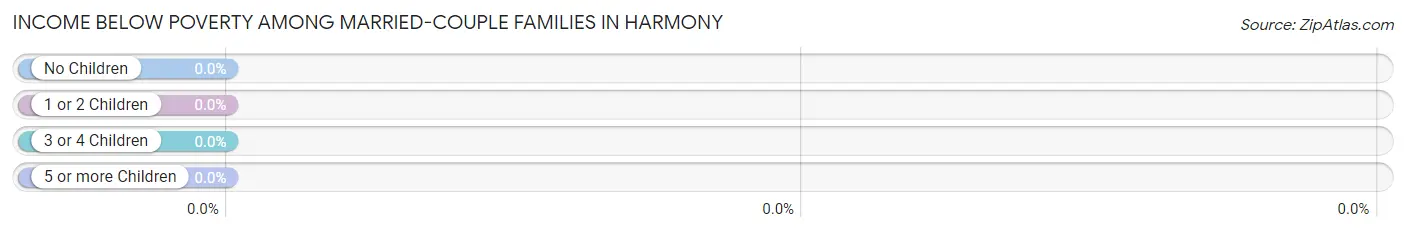
Income Below Poverty Among Married-Couple Families in Harmony
| Children | Above Poverty | Below Poverty |
| No Children | 44 (100.0%) | 0 (0.0%) |
| 1 or 2 Children | 45 (100.0%) | 0 (0.0%) |
| 3 or 4 Children | 0 (0.0%) | 0 (0.0%) |
| 5 or more Children | 0 (0.0%) | 0 (0.0%) |
| Total | 89 (100.0%) | 0 (0.0%) |
Income Below Poverty Among Single-Parent Households in Harmony
| Children | Single Father | Single Mother |
| No Children | 0 (0.0%) | 0 (0.0%) |
| 1 or 2 Children | 0 (0.0%) | 0 (0.0%) |
| 3 or 4 Children | 0 (0.0%) | 0 (0.0%) |
| 5 or more Children | 0 (0.0%) | 0 (0.0%) |
| Total | 0 (0.0%) | 0 (0.0%) |
Income Below Poverty Among Married-Couple vs Single-Parent Households in Harmony
| Children | Married-Couple Families | Single-Parent Households |
| No Children | 0 (0.0%) | 0 (0.0%) |
| 1 or 2 Children | 0 (0.0%) | 0 (0.0%) |
| 3 or 4 Children | 0 (0.0%) | 0 (0.0%) |
| 5 or more Children | 0 (0.0%) | 0 (0.0%) |
| Total | 0 (0.0%) | 0 (0.0%) |
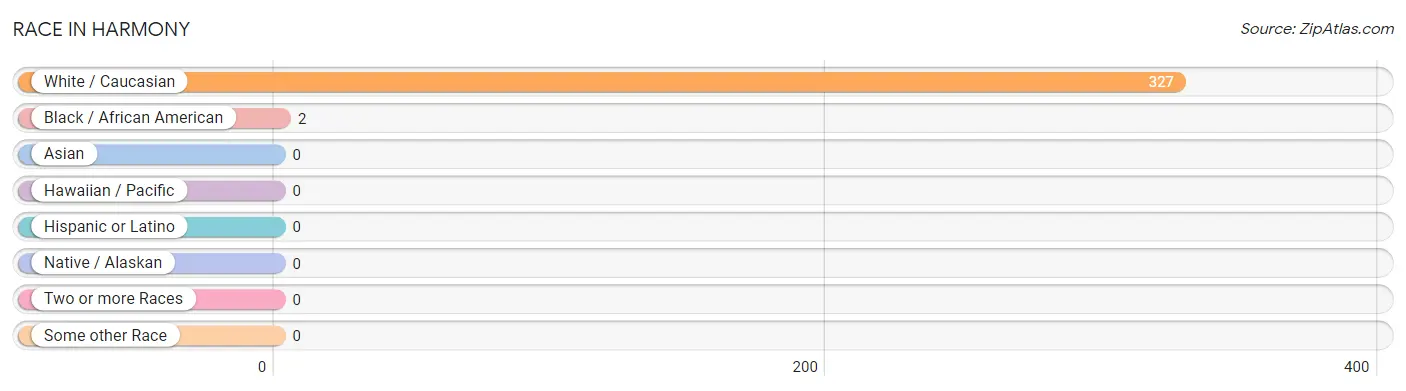
Race in Harmony
The most populous races in Harmony are White / Caucasian (327 | 99.4%), and Black / African American (2 | 0.6%).
| Race | # Population | % Population |
| Asian | 0 | 0.0% |
| Black / African American | 2 | 0.6% |
| Hawaiian / Pacific | 0 | 0.0% |
| Hispanic or Latino | 0 | 0.0% |
| Native / Alaskan | 0 | 0.0% |
| White / Caucasian | 327 | 99.4% |
| Two or more Races | 0 | 0.0% |
| Some other Race | 0 | 0.0% |
| Total | 329 | 100.0% |
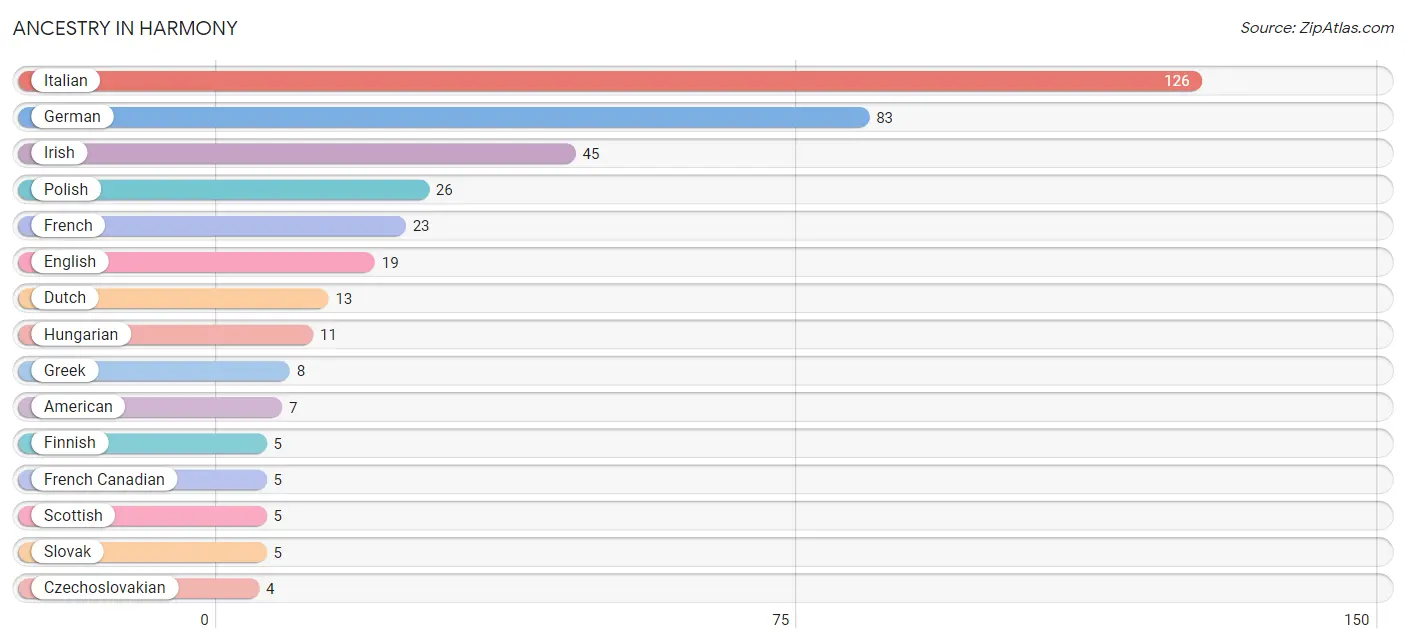
Ancestry in Harmony
The most populous ancestries reported in Harmony are Italian (126 | 38.3%), German (83 | 25.2%), Irish (45 | 13.7%), Polish (26 | 7.9%), and French (23 | 7.0%), together accounting for 92.1% of all Harmony residents.
| Ancestry | # Population | % Population |
| African | 2 | 0.6% |
| American | 7 | 2.1% |
| Czechoslovakian | 4 | 1.2% |
| Dutch | 13 | 4.0% |
| English | 19 | 5.8% |
| Finnish | 5 | 1.5% |
| French | 23 | 7.0% |
| French Canadian | 5 | 1.5% |
| German | 83 | 25.2% |
| Greek | 8 | 2.4% |
| Hungarian | 11 | 3.3% |
| Irish | 45 | 13.7% |
| Italian | 126 | 38.3% |
| Polish | 26 | 7.9% |
| Scottish | 5 | 1.5% |
| Slovak | 5 | 1.5% |
| Subsaharan African | 2 | 0.6% | View All 17 Rows |
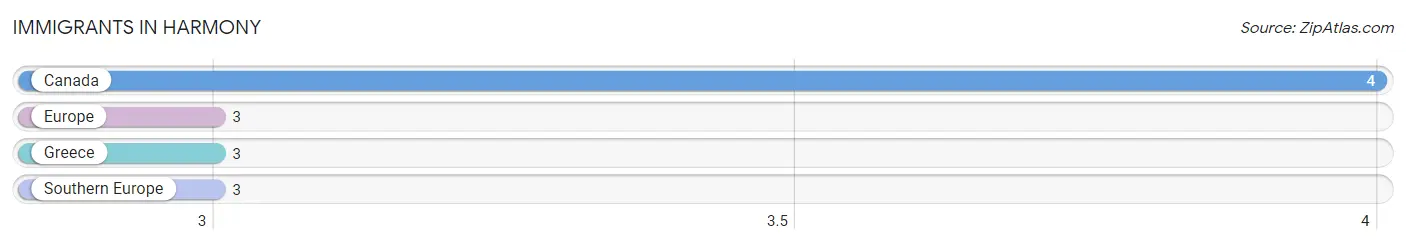
Immigrants in Harmony
The most numerous immigrant groups reported in Harmony came from Canada (4 | 1.2%), Europe (3 | 0.9%), Greece (3 | 0.9%), and Southern Europe (3 | 0.9%), together accounting for 4.0% of all Harmony residents.
| Immigration Origin | # Population | % Population |
| Canada | 4 | 1.2% |
| Europe | 3 | 0.9% |
| Greece | 3 | 0.9% |
| Southern Europe | 3 | 0.9% | View All 4 Rows |
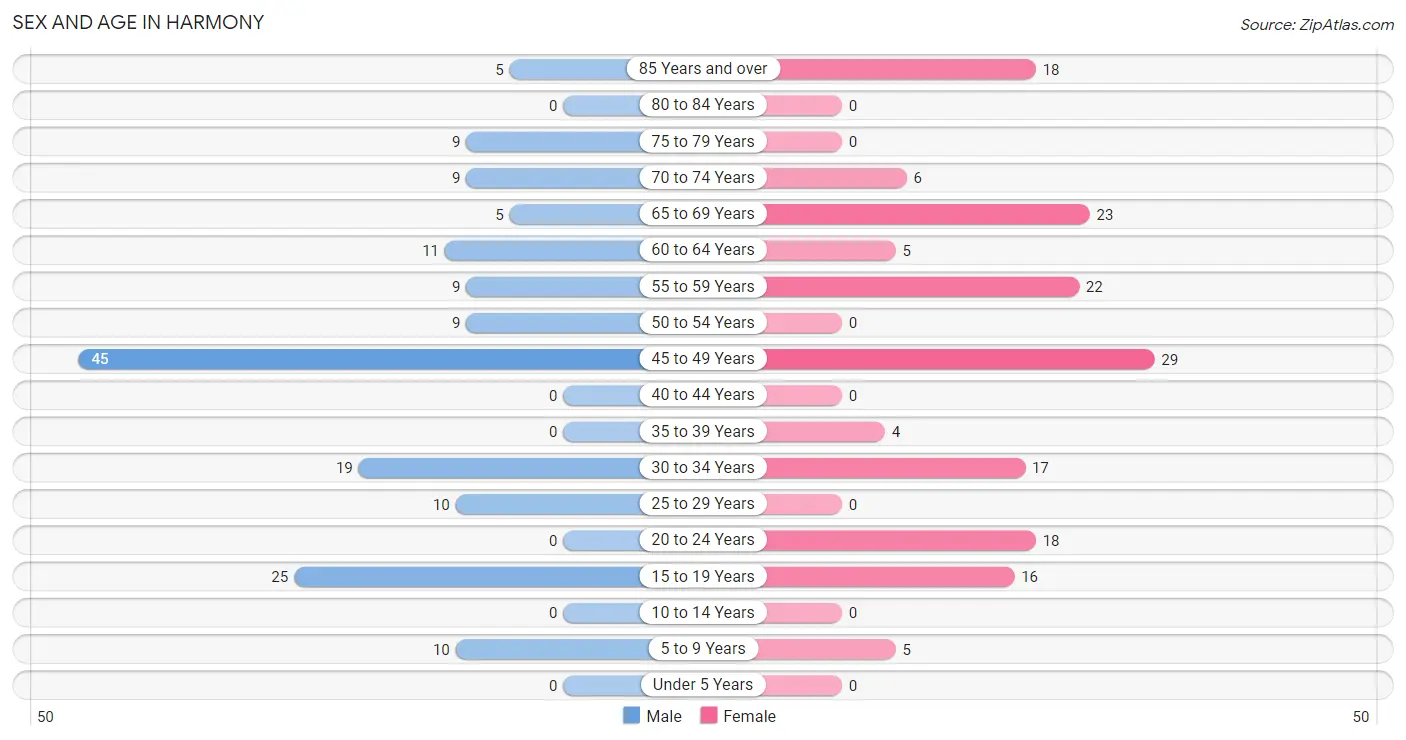
Sex and Age in Harmony
Sex and Age in Harmony
The most populous age groups in Harmony are 45 to 49 Years (45 | 27.1%) for men and 45 to 49 Years (29 | 17.8%) for women.
| Age Bracket | Male | Female |
| Under 5 Years | 0 (0.0%) | 0 (0.0%) |
| 5 to 9 Years | 10 (6.0%) | 5 (3.1%) |
| 10 to 14 Years | 0 (0.0%) | 0 (0.0%) |
| 15 to 19 Years | 25 (15.1%) | 16 (9.8%) |
| 20 to 24 Years | 0 (0.0%) | 18 (11.0%) |
| 25 to 29 Years | 10 (6.0%) | 0 (0.0%) |
| 30 to 34 Years | 19 (11.5%) | 17 (10.4%) |
| 35 to 39 Years | 0 (0.0%) | 4 (2.5%) |
| 40 to 44 Years | 0 (0.0%) | 0 (0.0%) |
| 45 to 49 Years | 45 (27.1%) | 29 (17.8%) |
| 50 to 54 Years | 9 (5.4%) | 0 (0.0%) |
| 55 to 59 Years | 9 (5.4%) | 22 (13.5%) |
| 60 to 64 Years | 11 (6.6%) | 5 (3.1%) |
| 65 to 69 Years | 5 (3.0%) | 23 (14.1%) |
| 70 to 74 Years | 9 (5.4%) | 6 (3.7%) |
| 75 to 79 Years | 9 (5.4%) | 0 (0.0%) |
| 80 to 84 Years | 0 (0.0%) | 0 (0.0%) |
| 85 Years and over | 5 (3.0%) | 18 (11.0%) |
| Total | 166 (100.0%) | 163 (100.0%) |
Families and Households in Harmony
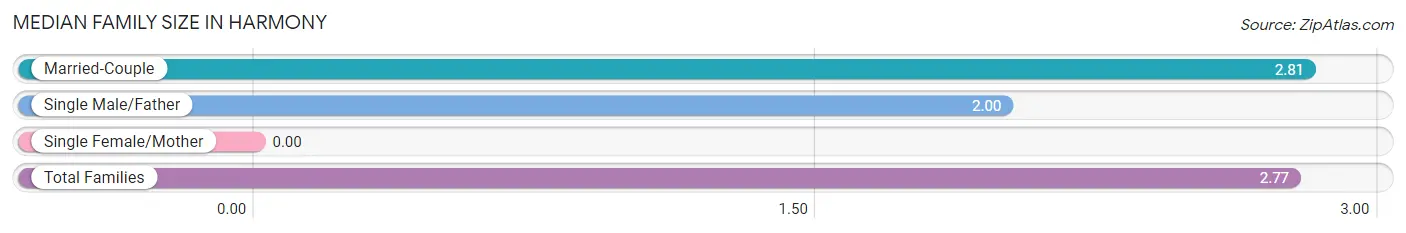
Median Family Size in Harmony
| Family Type | # Families | Family Size |
| Married-Couple | 89 (95.7%) | 2.81 |
| Single Male/Father | 4 (4.3%) | 2.00 |
| Single Female/Mother | 0 (0.0%) | - |
| Total Families | 93 (100.0%) | 2.77 |
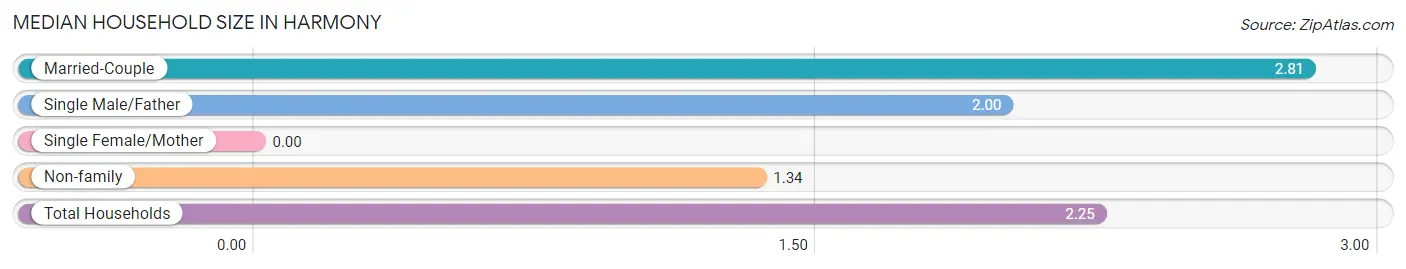
Median Household Size in Harmony
| Household Type | # Households | Household Size |
| Married-Couple | 89 (61.0%) | 2.81 |
| Single Male/Father | 4 (2.7%) | 2.00 |
| Single Female/Mother | 0 (0.0%) | - |
| Non-family | 53 (36.3%) | 1.34 |
| Total Households | 146 (100.0%) | 2.25 |
Household Size by Marriage Status in Harmony
Out of a total of 146 households in Harmony, 93 (63.7%) are family households, while 53 (36.3%) are nonfamily households. The most numerous type of family households are 3-person households, comprising 55, and the most common type of nonfamily households are 1-person households, comprising 43.
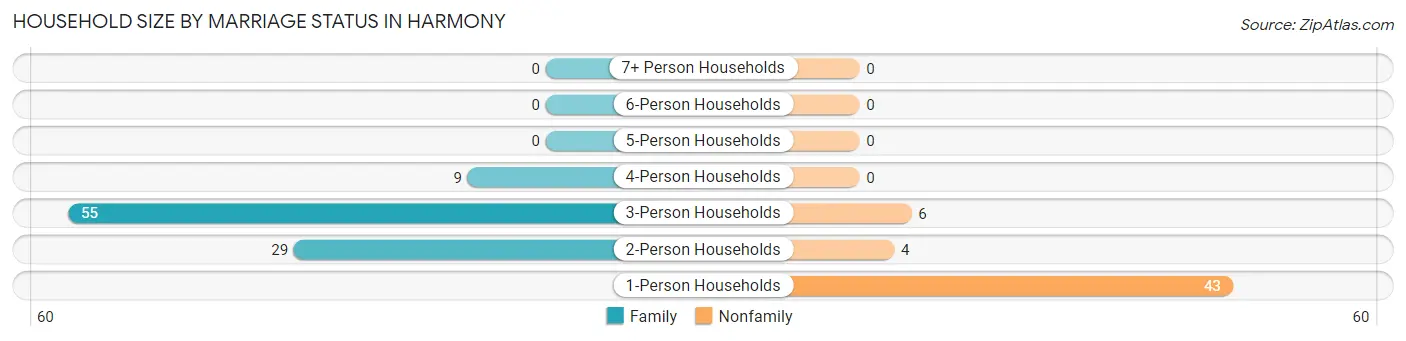
| Household Size | Family Households | Nonfamily Households |
| 1-Person Households | - | 43 (29.4%) |
| 2-Person Households | 29 (19.9%) | 4 (2.7%) |
| 3-Person Households | 55 (37.7%) | 6 (4.1%) |
| 4-Person Households | 9 (6.2%) | 0 (0.0%) |
| 5-Person Households | 0 (0.0%) | 0 (0.0%) |
| 6-Person Households | 0 (0.0%) | 0 (0.0%) |
| 7+ Person Households | 0 (0.0%) | 0 (0.0%) |
| Total | 93 (63.7%) | 53 (36.3%) |
Female Fertility in Harmony
Fertility by Age in Harmony
| Age Bracket | Women with Births | Births / 1,000 Women |
| 15 to 19 years | 0 (0.0%) | 0.0 |
| 20 to 34 years | 0 (0.0%) | 0.0 |
| 35 to 50 years | 0 (0.0%) | 0.0 |
| Total | 0 (0.0%) | 0.0 |
Fertility by Age by Marriage Status in Harmony
| Age Bracket | Married | Unmarried |
| 15 to 19 years | 0 (0.0%) | 0 (0.0%) |
| 20 to 34 years | 0 (0.0%) | 0 (0.0%) |
| 35 to 50 years | 0 (0.0%) | 0 (0.0%) |
| Total | 0 (0.0%) | 0 (0.0%) |
Fertility by Education in Harmony
| Educational Attainment | Women with Births | Births / 1,000 Women |
| Less than High School | 0 (0.0%) | 0.0 |
| High School Diploma | 0 (0.0%) | 0.0 |
| College or Associate's Degree | 0 (0.0%) | 0.0 |
| Bachelor's Degree | 0 (0.0%) | 0.0 |
| Graduate Degree | 0 (0.0%) | 0.0 |
| Total | 0 (0.0%) | 0.0 |
Fertility by Education by Marriage Status in Harmony
| Educational Attainment | Married | Unmarried |
| Less than High School | 0 (0.0%) | 0 (0.0%) |
| High School Diploma | 0 (0.0%) | 0 (0.0%) |
| College or Associate's Degree | 0 (0.0%) | 0 (0.0%) |
| Bachelor's Degree | 0 (0.0%) | 0 (0.0%) |
| Graduate Degree | 0 (0.0%) | 0 (0.0%) |
| Total | 0 (0.0%) | 0 (0.0%) |
Employment Characteristics in Harmony
Employment by Class of Employer in Harmony
Among the 154 employed individuals in Harmony, private company employees (121 | 78.6%), self-employed (incorporated) (14 | 9.1%), and local government employees (12 | 7.8%) make up the most common classes of employment.
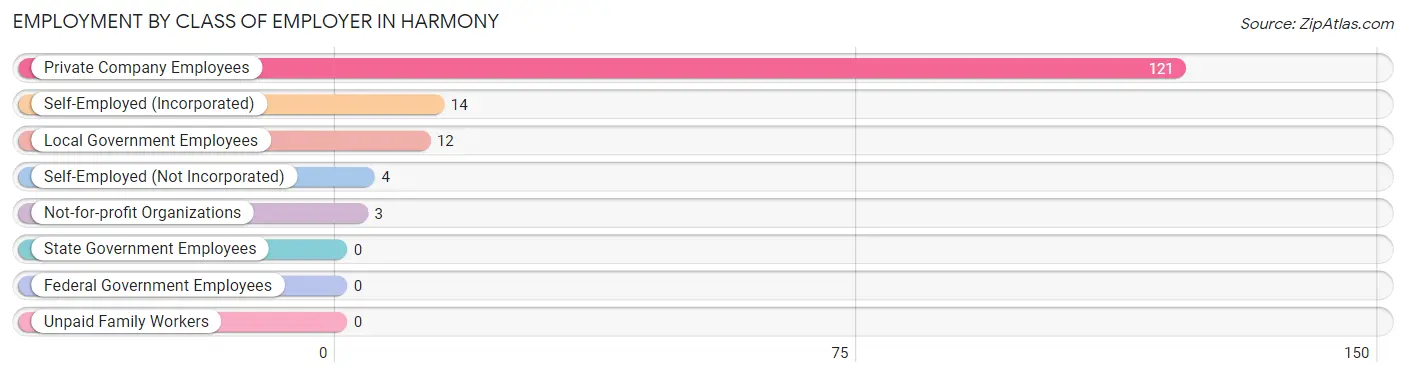
| Employer Class | # Employees | % Employees |
| Private Company Employees | 121 | 78.6% |
| Self-Employed (Incorporated) | 14 | 9.1% |
| Self-Employed (Not Incorporated) | 4 | 2.6% |
| Not-for-profit Organizations | 3 | 1.9% |
| Local Government Employees | 12 | 7.8% |
| State Government Employees | 0 | 0.0% |
| Federal Government Employees | 0 | 0.0% |
| Unpaid Family Workers | 0 | 0.0% |
| Total | 154 | 100.0% |
Employment Status by Age in Harmony
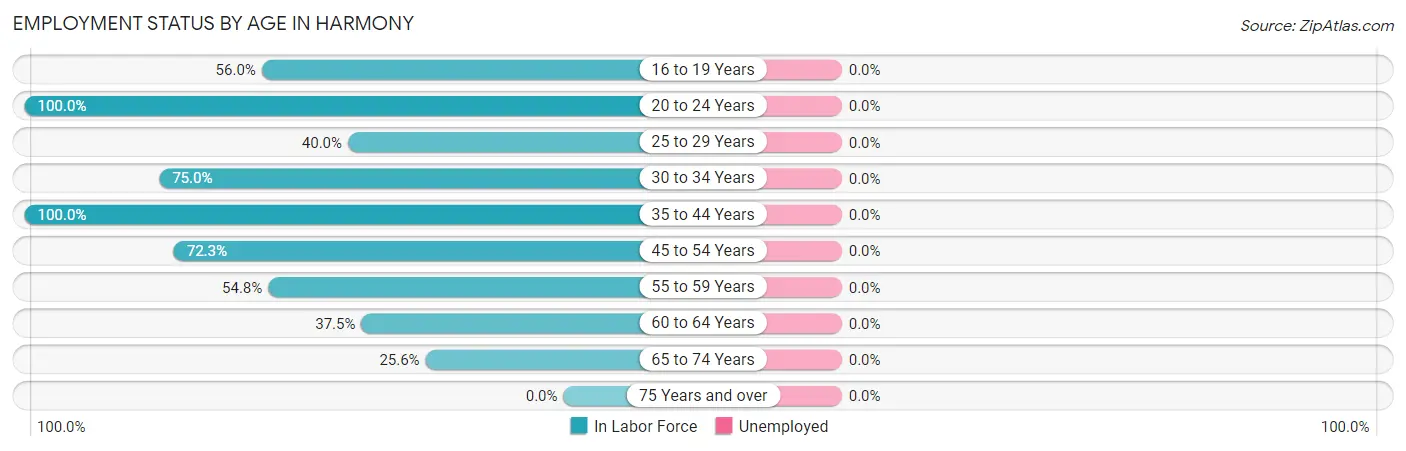
| Age Bracket | In Labor Force | Unemployed |
| 16 to 19 Years | 14 (56.0%) | 0 (0.0%) |
| 20 to 24 Years | 18 (100.0%) | 0 (0.0%) |
| 25 to 29 Years | 4 (40.0%) | 0 (0.0%) |
| 30 to 34 Years | 27 (75.0%) | 0 (0.0%) |
| 35 to 44 Years | 4 (100.0%) | 0 (0.0%) |
| 45 to 54 Years | 60 (72.3%) | 0 (0.0%) |
| 55 to 59 Years | 17 (54.8%) | 0 (0.0%) |
| 60 to 64 Years | 6 (37.5%) | 0 (0.0%) |
| 65 to 74 Years | 11 (25.6%) | 0 (0.0%) |
| 75 Years and over | 0 (0.0%) | 0 (0.0%) |
| Total | 161 (54.0%) | 0 (0.0%) |
Employment Status by Educational Attainment in Harmony
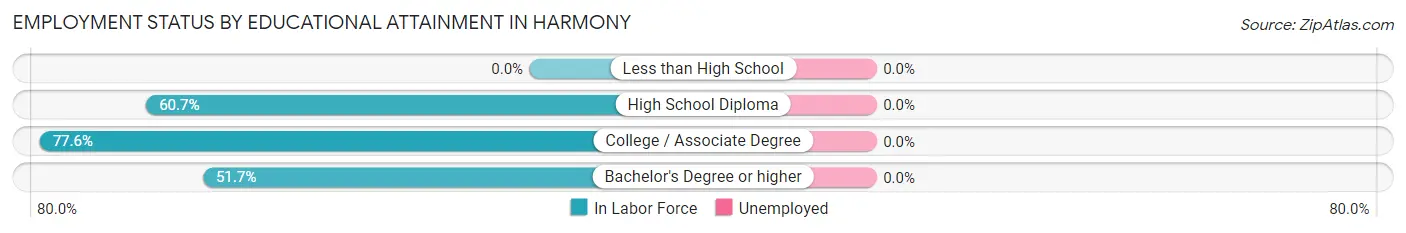
| Educational Attainment | In Labor Force | Unemployed |
| Less than High School | 0 (0.0%) | 0 (0.0%) |
| High School Diploma | 51 (60.7%) | 0 (0.0%) |
| College / Associate Degree | 52 (77.6%) | 0 (0.0%) |
| Bachelor's Degree or higher | 15 (51.7%) | 0 (0.0%) |
| Total | 118 (65.6%) | 0 (0.0%) |
Employment Occupations by Sex in Harmony
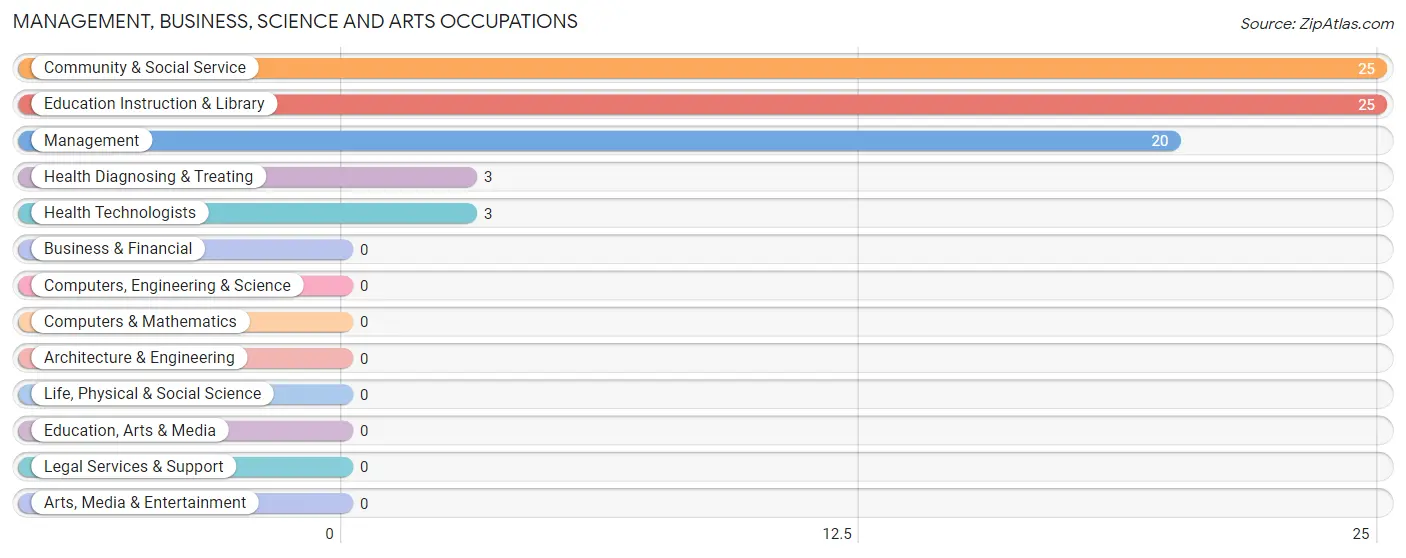
Management, Business, Science and Arts Occupations
The most common Management, Business, Science and Arts occupations in Harmony are Community & Social Service (25 | 15.5%), Education Instruction & Library (25 | 15.5%), Management (20 | 12.4%), Health Diagnosing & Treating (3 | 1.9%), and Health Technologists (3 | 1.9%).
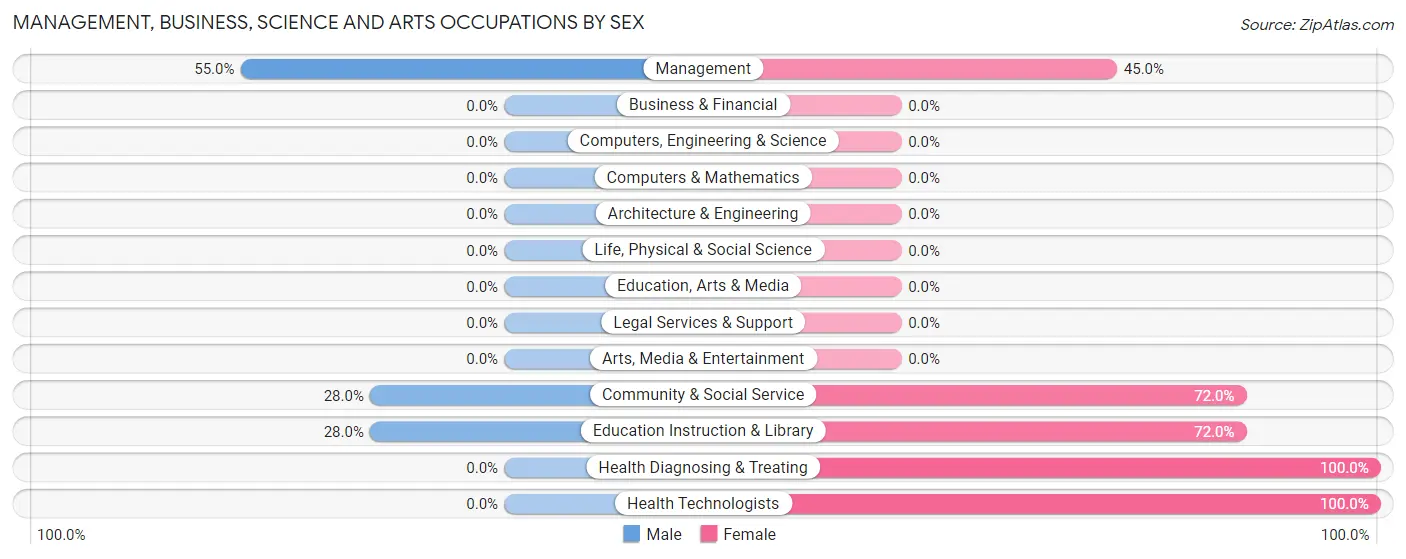
Management, Business, Science and Arts Occupations by Sex
Within the Management, Business, Science and Arts occupations in Harmony, the most male-oriented occupations are Management (55.0%), Community & Social Service (28.0%), and Education Instruction & Library (28.0%), while the most female-oriented occupations are Health Diagnosing & Treating (100.0%), Health Technologists (100.0%), and Community & Social Service (72.0%).
| Occupation | Male | Female |
| Management | 11 (55.0%) | 9 (45.0%) |
| Business & Financial | 0 (0.0%) | 0 (0.0%) |
| Computers, Engineering & Science | 0 (0.0%) | 0 (0.0%) |
| Computers & Mathematics | 0 (0.0%) | 0 (0.0%) |
| Architecture & Engineering | 0 (0.0%) | 0 (0.0%) |
| Life, Physical & Social Science | 0 (0.0%) | 0 (0.0%) |
| Community & Social Service | 7 (28.0%) | 18 (72.0%) |
| Education, Arts & Media | 0 (0.0%) | 0 (0.0%) |
| Legal Services & Support | 0 (0.0%) | 0 (0.0%) |
| Education Instruction & Library | 7 (28.0%) | 18 (72.0%) |
| Arts, Media & Entertainment | 0 (0.0%) | 0 (0.0%) |
| Health Diagnosing & Treating | 0 (0.0%) | 3 (100.0%) |
| Health Technologists | 0 (0.0%) | 3 (100.0%) |
| Total (Category) | 18 (37.5%) | 30 (62.5%) |
| Total (Overall) | 105 (65.2%) | 56 (34.8%) |
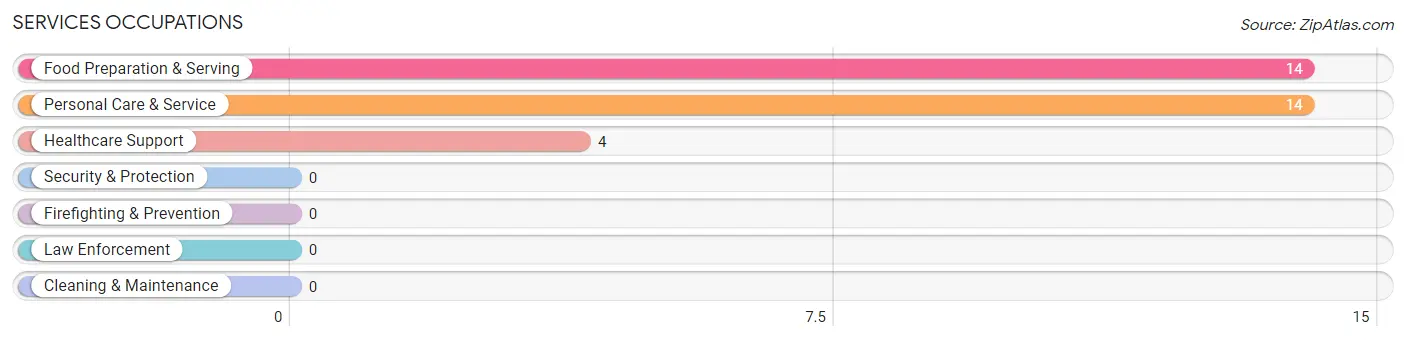
Services Occupations
The most common Services occupations in Harmony are Food Preparation & Serving (14 | 8.7%), Personal Care & Service (14 | 8.7%), and Healthcare Support (4 | 2.5%).
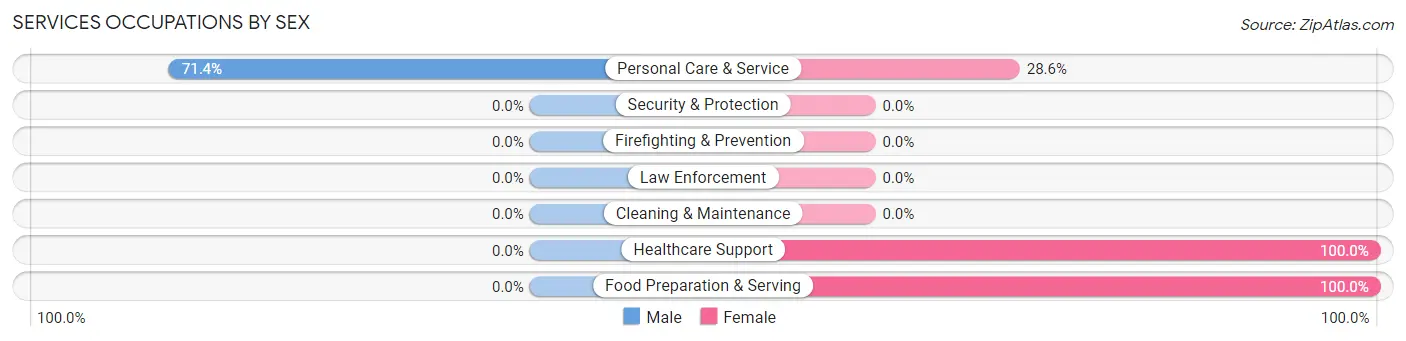
Services Occupations by Sex
| Occupation | Male | Female |
| Healthcare Support | 0 (0.0%) | 4 (100.0%) |
| Security & Protection | 0 (0.0%) | 0 (0.0%) |
| Firefighting & Prevention | 0 (0.0%) | 0 (0.0%) |
| Law Enforcement | 0 (0.0%) | 0 (0.0%) |
| Food Preparation & Serving | 0 (0.0%) | 14 (100.0%) |
| Cleaning & Maintenance | 0 (0.0%) | 0 (0.0%) |
| Personal Care & Service | 10 (71.4%) | 4 (28.6%) |
| Total (Category) | 10 (31.2%) | 22 (68.8%) |
| Total (Overall) | 105 (65.2%) | 56 (34.8%) |
Sales and Office Occupations
The most common Sales and Office occupations in Harmony are Sales & Related (14 | 8.7%), and Office & Administration (4 | 2.5%).
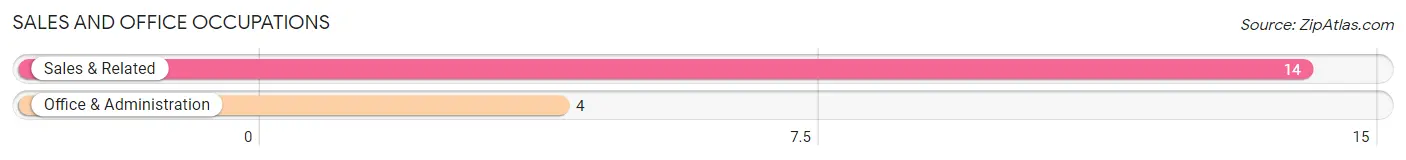
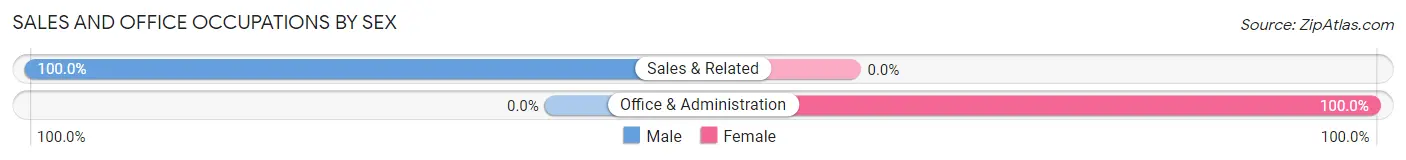
Sales and Office Occupations by Sex
| Occupation | Male | Female |
| Sales & Related | 14 (100.0%) | 0 (0.0%) |
| Office & Administration | 0 (0.0%) | 4 (100.0%) |
| Total (Category) | 14 (77.8%) | 4 (22.2%) |
| Total (Overall) | 105 (65.2%) | 56 (34.8%) |
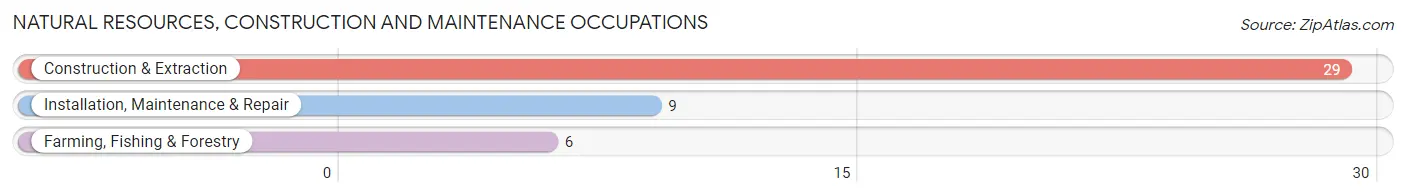
Natural Resources, Construction and Maintenance Occupations
The most common Natural Resources, Construction and Maintenance occupations in Harmony are Construction & Extraction (29 | 18.0%), Installation, Maintenance & Repair (9 | 5.6%), and Farming, Fishing & Forestry (6 | 3.7%).
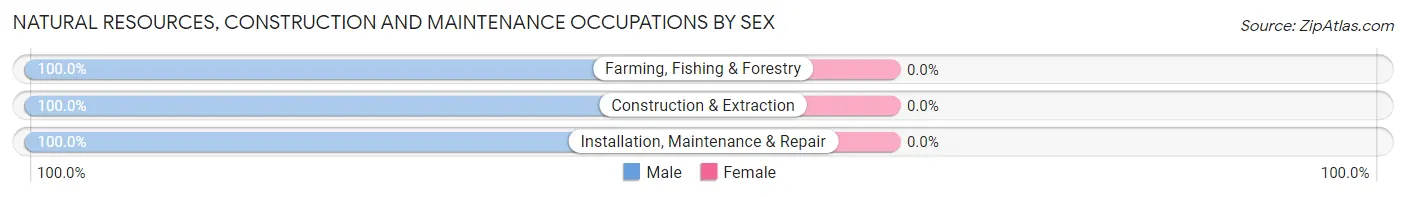
Natural Resources, Construction and Maintenance Occupations by Sex
| Occupation | Male | Female |
| Farming, Fishing & Forestry | 6 (100.0%) | 0 (0.0%) |
| Construction & Extraction | 29 (100.0%) | 0 (0.0%) |
| Installation, Maintenance & Repair | 9 (100.0%) | 0 (0.0%) |
| Total (Category) | 44 (100.0%) | 0 (0.0%) |
| Total (Overall) | 105 (65.2%) | 56 (34.8%) |
Production, Transportation and Moving Occupations
The most common Production, Transportation and Moving occupations in Harmony are Production (10 | 6.2%), and Transportation (9 | 5.6%).
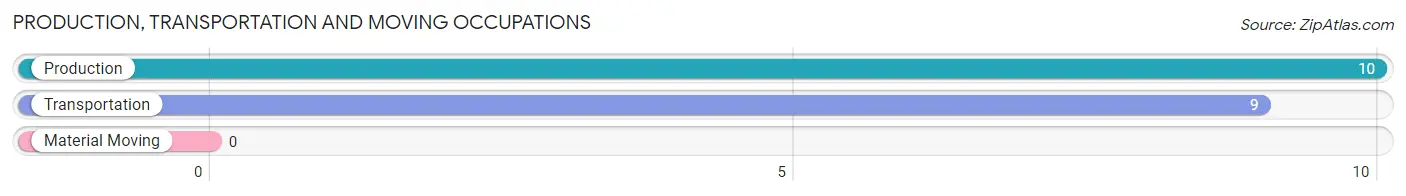
Production, Transportation and Moving Occupations by Sex
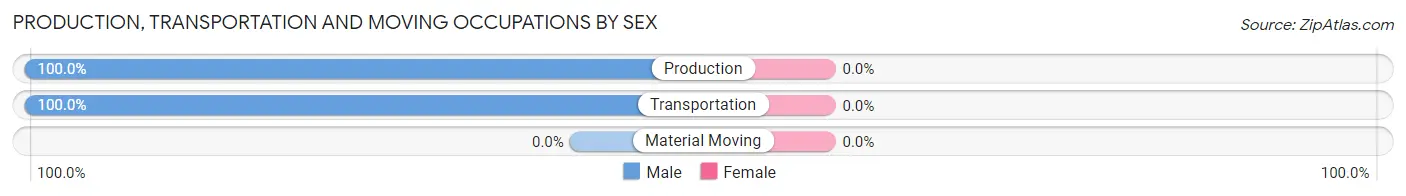
| Occupation | Male | Female |
| Production | 10 (100.0%) | 0 (0.0%) |
| Transportation | 9 (100.0%) | 0 (0.0%) |
| Material Moving | 0 (0.0%) | 0 (0.0%) |
| Total (Category) | 19 (100.0%) | 0 (0.0%) |
| Total (Overall) | 105 (65.2%) | 56 (34.8%) |
Employment Industries by Sex in Harmony
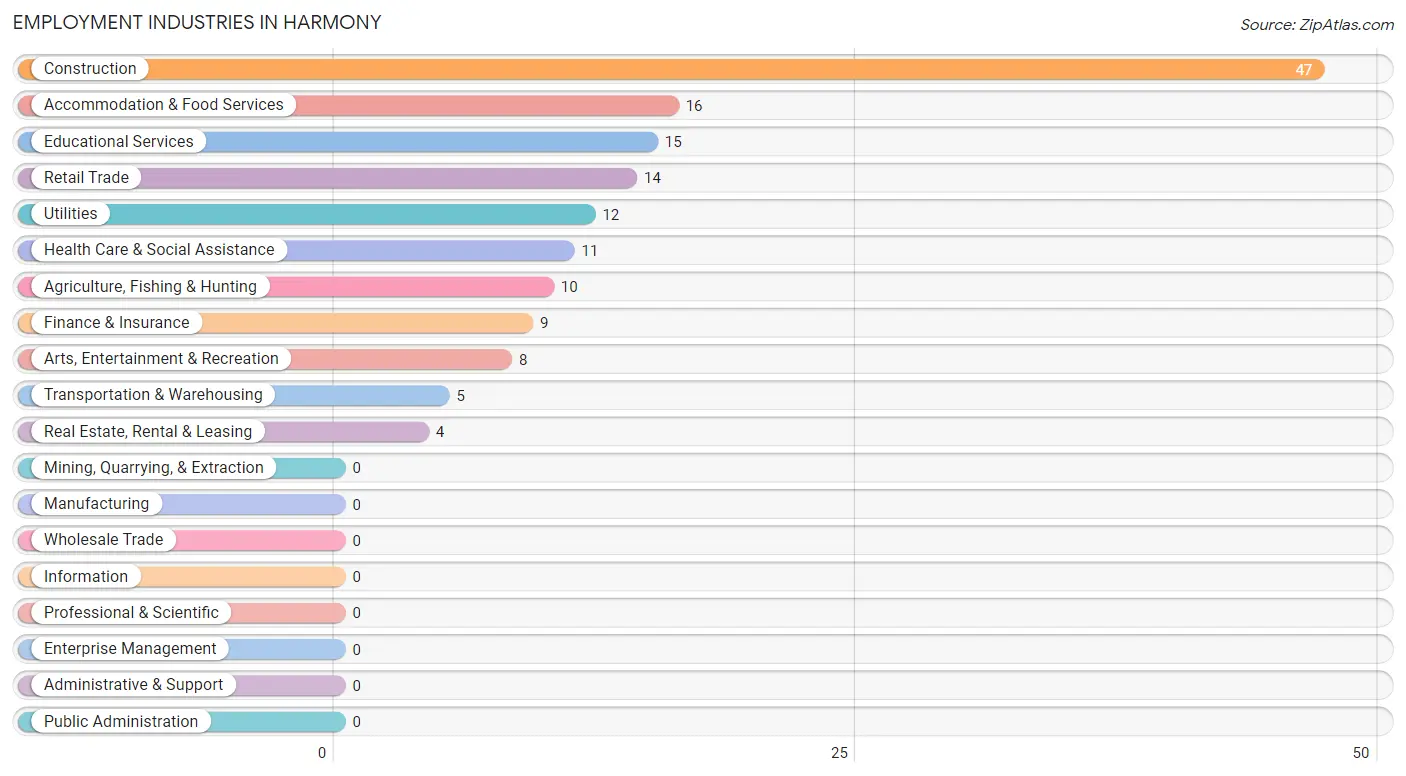
Employment Industries in Harmony
The major employment industries in Harmony include Construction (47 | 29.2%), Accommodation & Food Services (16 | 9.9%), Educational Services (15 | 9.3%), Retail Trade (14 | 8.7%), and Utilities (12 | 7.4%).
Employment Industries by Sex in Harmony
The Harmony industries that see more men than women are Construction (100.0%), Retail Trade (100.0%), and Transportation & Warehousing (100.0%), whereas the industries that tend to have a higher number of women are Finance & Insurance (100.0%), Health Care & Social Assistance (100.0%), and Arts, Entertainment & Recreation (100.0%).
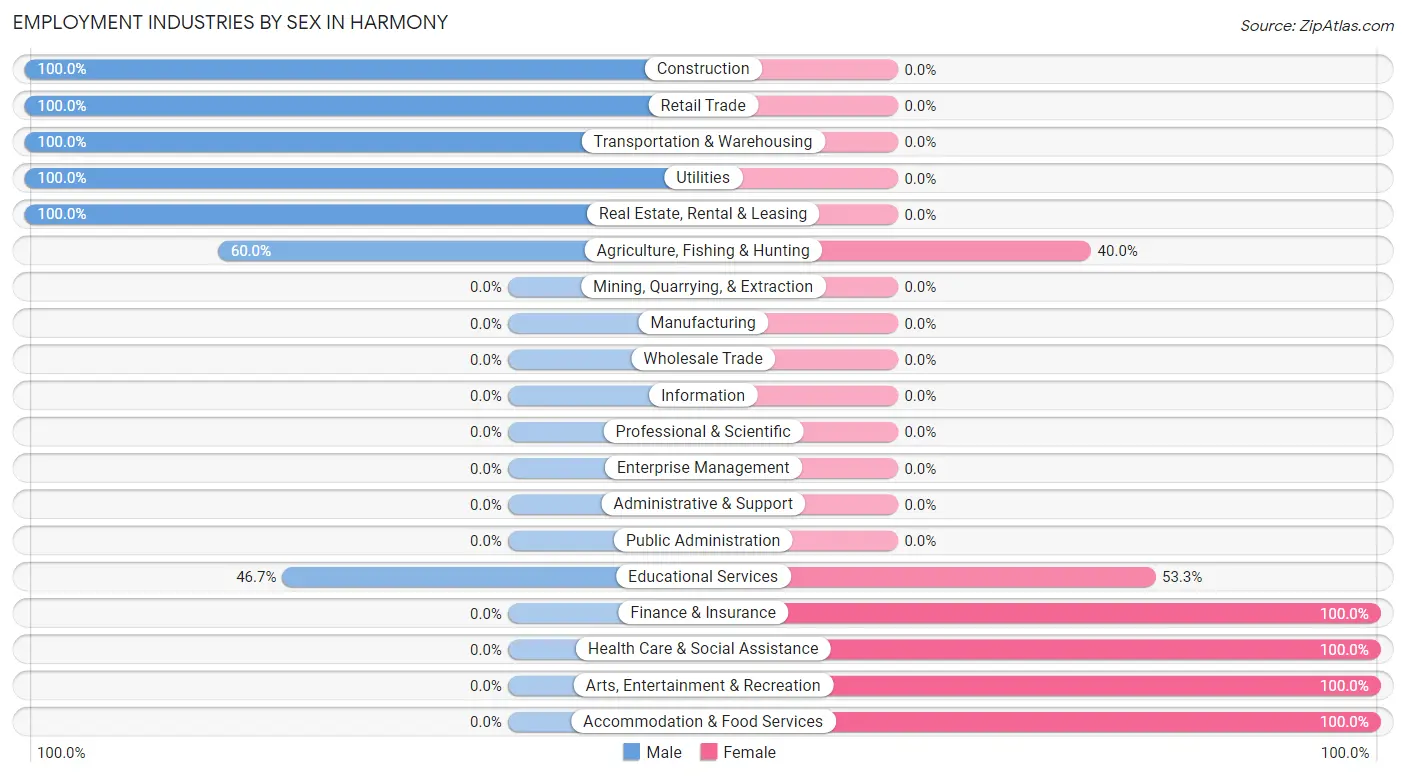
| Industry | Male | Female |
| Agriculture, Fishing & Hunting | 6 (60.0%) | 4 (40.0%) |
| Mining, Quarrying, & Extraction | 0 (0.0%) | 0 (0.0%) |
| Construction | 47 (100.0%) | 0 (0.0%) |
| Manufacturing | 0 (0.0%) | 0 (0.0%) |
| Wholesale Trade | 0 (0.0%) | 0 (0.0%) |
| Retail Trade | 14 (100.0%) | 0 (0.0%) |
| Transportation & Warehousing | 5 (100.0%) | 0 (0.0%) |
| Utilities | 12 (100.0%) | 0 (0.0%) |
| Information | 0 (0.0%) | 0 (0.0%) |
| Finance & Insurance | 0 (0.0%) | 9 (100.0%) |
| Real Estate, Rental & Leasing | 4 (100.0%) | 0 (0.0%) |
| Professional & Scientific | 0 (0.0%) | 0 (0.0%) |
| Enterprise Management | 0 (0.0%) | 0 (0.0%) |
| Administrative & Support | 0 (0.0%) | 0 (0.0%) |
| Educational Services | 7 (46.7%) | 8 (53.3%) |
| Health Care & Social Assistance | 0 (0.0%) | 11 (100.0%) |
| Arts, Entertainment & Recreation | 0 (0.0%) | 8 (100.0%) |
| Accommodation & Food Services | 0 (0.0%) | 16 (100.0%) |
| Public Administration | 0 (0.0%) | 0 (0.0%) |
| Total | 105 (65.2%) | 56 (34.8%) |
Education in Harmony
School Enrollment in Harmony
The most common levels of schooling among the 64 students in Harmony are high school (27 | 42.2%), college / undergraduate (24 | 37.5%), and graduate / professional (8 | 12.5%).
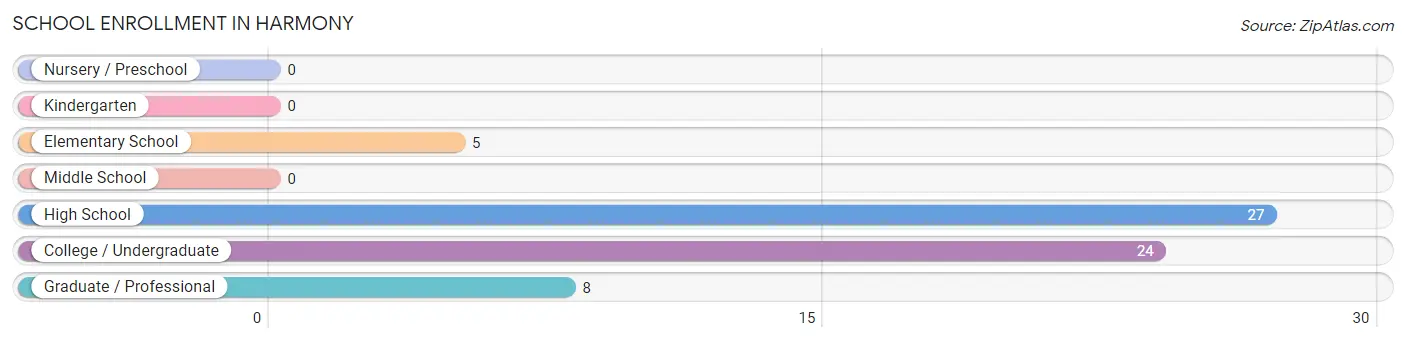
| School Level | # Students | % Students |
| Nursery / Preschool | 0 | 0.0% |
| Kindergarten | 0 | 0.0% |
| Elementary School | 5 | 7.8% |
| Middle School | 0 | 0.0% |
| High School | 27 | 42.2% |
| College / Undergraduate | 24 | 37.5% |
| Graduate / Professional | 8 | 12.5% |
| Total | 64 | 100.0% |
School Enrollment by Age by Funding Source in Harmony
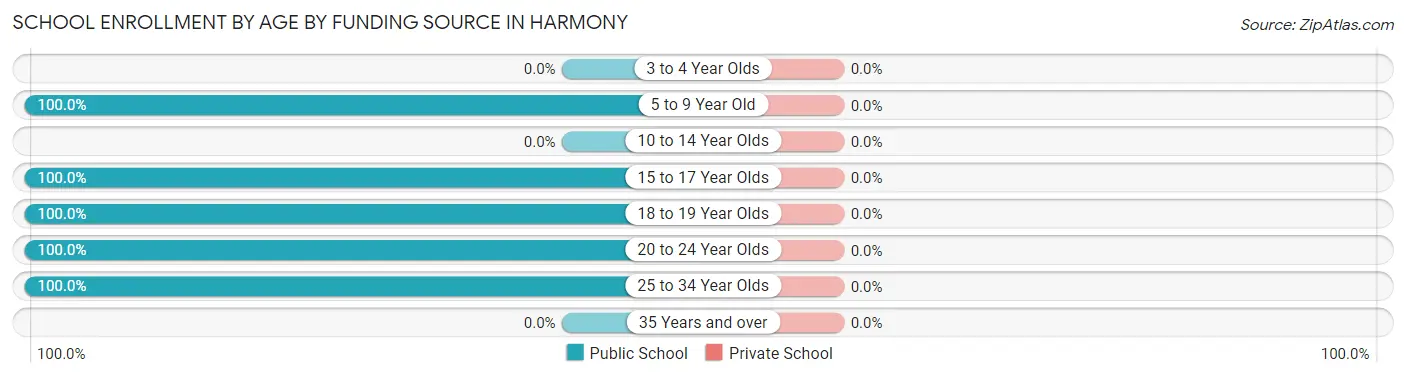
| Age Bracket | Public School | Private School |
| 3 to 4 Year Olds | 0 (0.0%) | 0 (0.0%) |
| 5 to 9 Year Old | 5 (100.0%) | 0 (0.0%) |
| 10 to 14 Year Olds | 0 (0.0%) | 0 (0.0%) |
| 15 to 17 Year Olds | 27 (100.0%) | 0 (0.0%) |
| 18 to 19 Year Olds | 14 (100.0%) | 0 (0.0%) |
| 20 to 24 Year Olds | 10 (100.0%) | 0 (0.0%) |
| 25 to 34 Year Olds | 8 (100.0%) | 0 (0.0%) |
| 35 Years and over | 0 (0.0%) | 0 (0.0%) |
| Total | 64 (100.0%) | 0 (0.0%) |
Educational Attainment by Field of Study in Harmony
Education (22 | 44.9%), arts & humanities (7 | 14.3%), psychology (6 | 12.2%), liberal arts & history (6 | 12.2%), and science & technology (5 | 10.2%) are the most common fields of study among 49 individuals in Harmony who have obtained a bachelor's degree or higher.
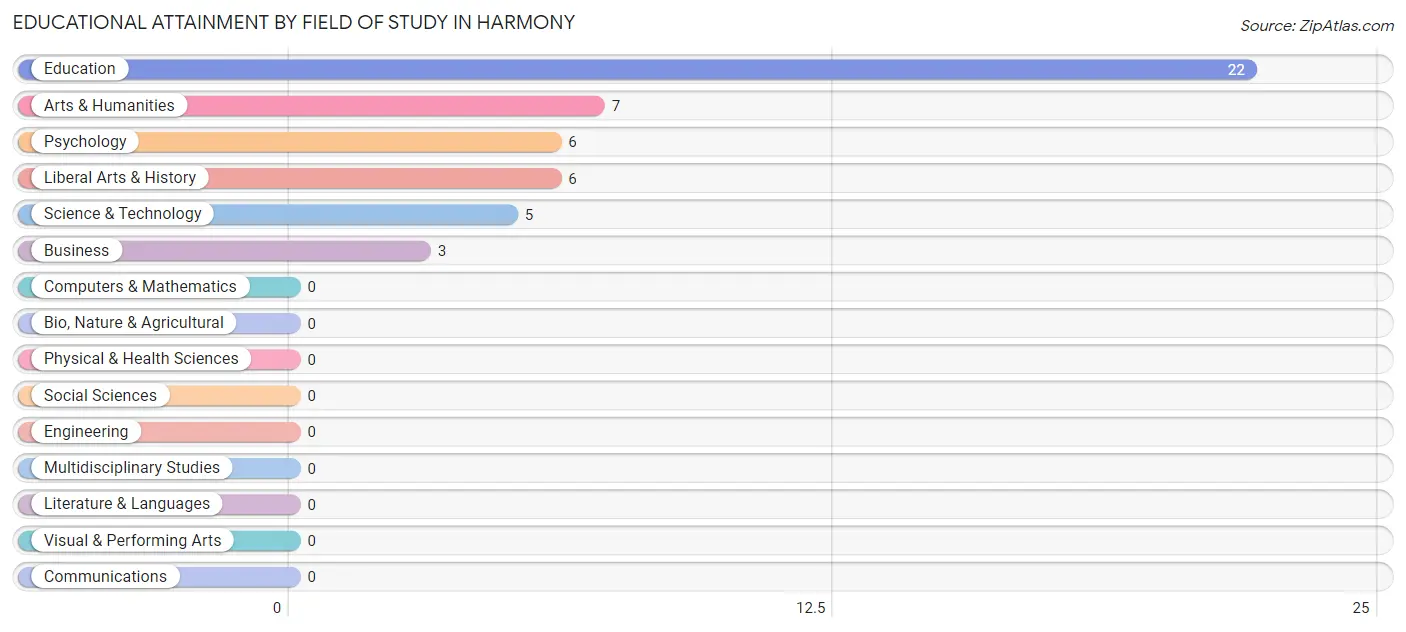
| Field of Study | # Graduates | % Graduates |
| Computers & Mathematics | 0 | 0.0% |
| Bio, Nature & Agricultural | 0 | 0.0% |
| Physical & Health Sciences | 0 | 0.0% |
| Psychology | 6 | 12.2% |
| Social Sciences | 0 | 0.0% |
| Engineering | 0 | 0.0% |
| Multidisciplinary Studies | 0 | 0.0% |
| Science & Technology | 5 | 10.2% |
| Business | 3 | 6.1% |
| Education | 22 | 44.9% |
| Literature & Languages | 0 | 0.0% |
| Liberal Arts & History | 6 | 12.2% |
| Visual & Performing Arts | 0 | 0.0% |
| Communications | 0 | 0.0% |
| Arts & Humanities | 7 | 14.3% |
| Total | 49 | 100.0% |
Transportation & Commute in Harmony
Vehicle Availability by Sex in Harmony
The most prevalent vehicle ownership categories in Harmony are males with 4 vehicles (49, accounting for 50.0%) and females with 4 vehicles (18, making up 87.5%).
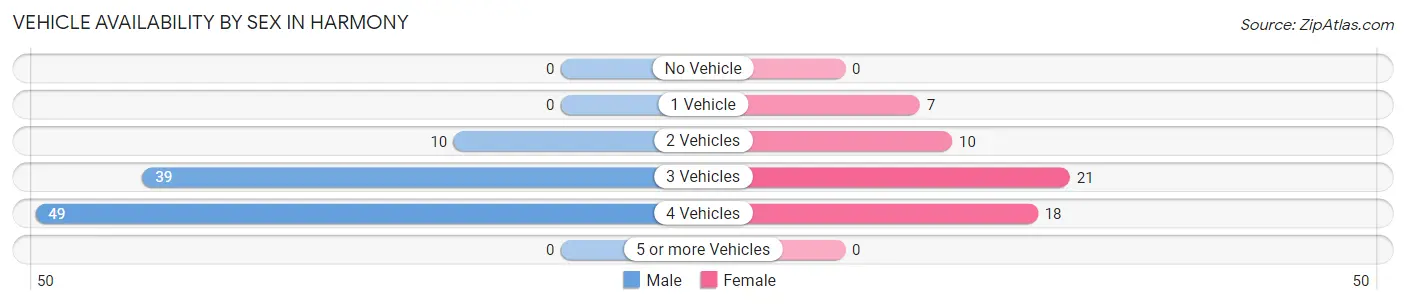
| Vehicles Available | Male | Female |
| No Vehicle | 0 (0.0%) | 0 (0.0%) |
| 1 Vehicle | 0 (0.0%) | 7 (12.5%) |
| 2 Vehicles | 10 (10.2%) | 10 (17.9%) |
| 3 Vehicles | 39 (39.8%) | 21 (37.5%) |
| 4 Vehicles | 49 (50.0%) | 18 (32.1%) |
| 5 or more Vehicles | 0 (0.0%) | 0 (0.0%) |
| Total | 98 (100.0%) | 56 (100.0%) |
Commute Time in Harmony
The most frequently occuring commute durations in Harmony are 45 to 59 minutes (49 commuters, 31.8%), 15 to 19 minutes (27 commuters, 17.5%), and 10 to 14 minutes (25 commuters, 16.2%).
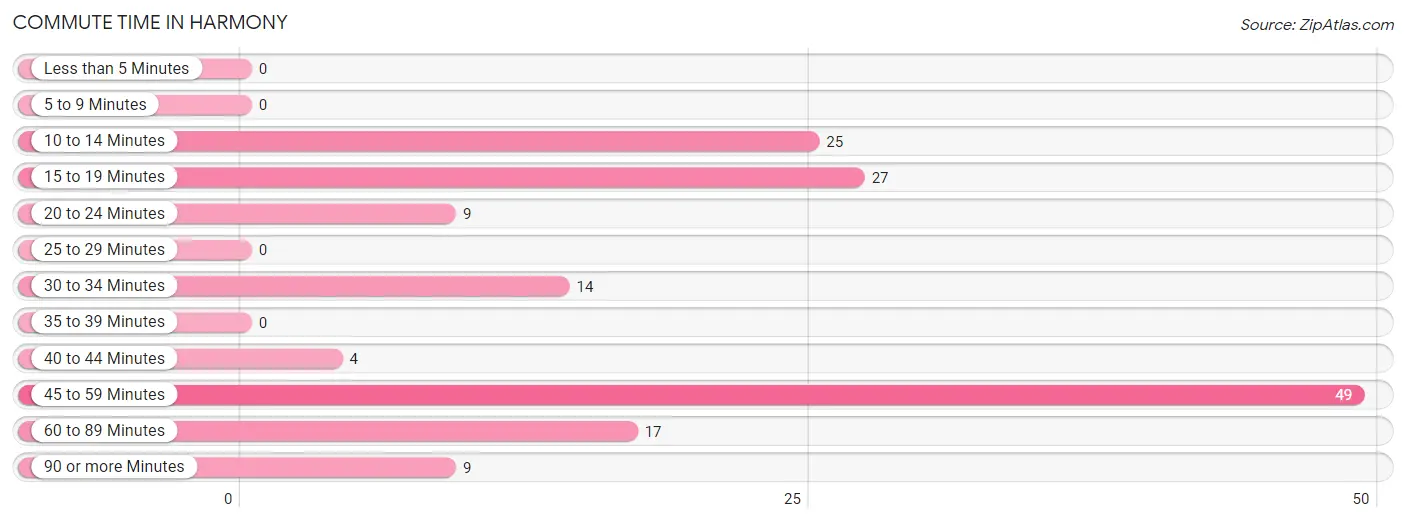
| Commute Time | # Commuters | % Commuters |
| Less than 5 Minutes | 0 | 0.0% |
| 5 to 9 Minutes | 0 | 0.0% |
| 10 to 14 Minutes | 25 | 16.2% |
| 15 to 19 Minutes | 27 | 17.5% |
| 20 to 24 Minutes | 9 | 5.8% |
| 25 to 29 Minutes | 0 | 0.0% |
| 30 to 34 Minutes | 14 | 9.1% |
| 35 to 39 Minutes | 0 | 0.0% |
| 40 to 44 Minutes | 4 | 2.6% |
| 45 to 59 Minutes | 49 | 31.8% |
| 60 to 89 Minutes | 17 | 11.0% |
| 90 or more Minutes | 9 | 5.8% |
Commute Time by Sex in Harmony
The most common commute times in Harmony are 10 to 14 minutes (25 commuters, 25.5%) for males and 45 to 59 minutes (29 commuters, 51.8%) for females.
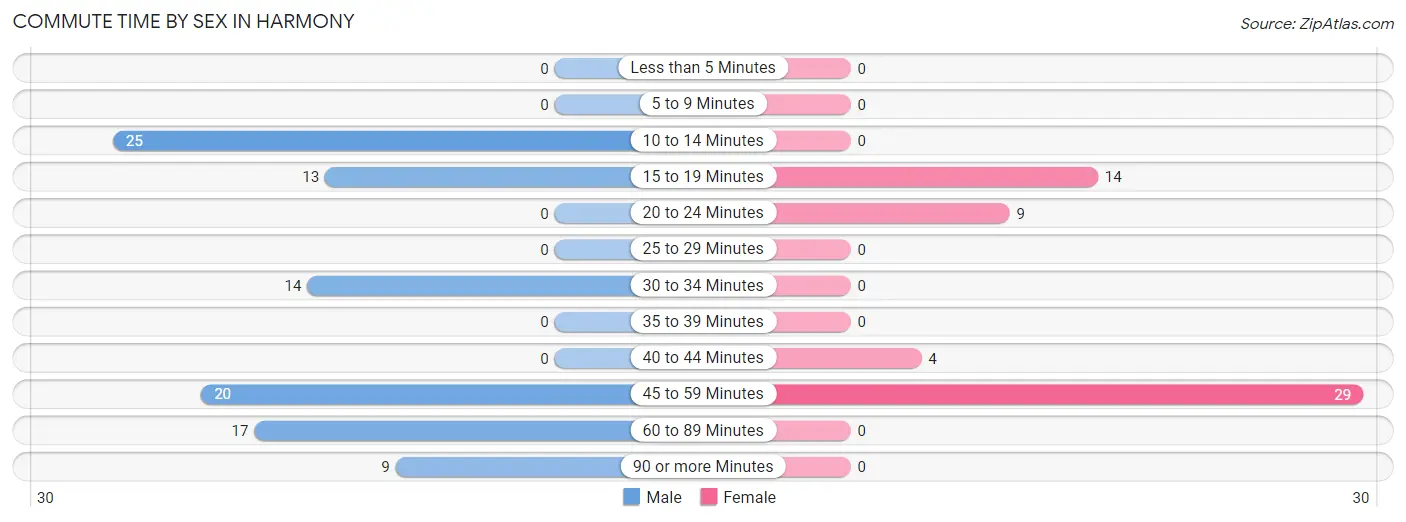
| Commute Time | Male | Female |
| Less than 5 Minutes | 0 (0.0%) | 0 (0.0%) |
| 5 to 9 Minutes | 0 (0.0%) | 0 (0.0%) |
| 10 to 14 Minutes | 25 (25.5%) | 0 (0.0%) |
| 15 to 19 Minutes | 13 (13.3%) | 14 (25.0%) |
| 20 to 24 Minutes | 0 (0.0%) | 9 (16.1%) |
| 25 to 29 Minutes | 0 (0.0%) | 0 (0.0%) |
| 30 to 34 Minutes | 14 (14.3%) | 0 (0.0%) |
| 35 to 39 Minutes | 0 (0.0%) | 0 (0.0%) |
| 40 to 44 Minutes | 0 (0.0%) | 4 (7.1%) |
| 45 to 59 Minutes | 20 (20.4%) | 29 (51.8%) |
| 60 to 89 Minutes | 17 (17.3%) | 0 (0.0%) |
| 90 or more Minutes | 9 (9.2%) | 0 (0.0%) |
Time of Departure to Work by Sex in Harmony
The most frequent times of departure to work in Harmony are 5:00 AM to 5:29 AM (39, 39.8%) for males and 9:00 AM to 9:59 AM (14, 25.0%) for females.
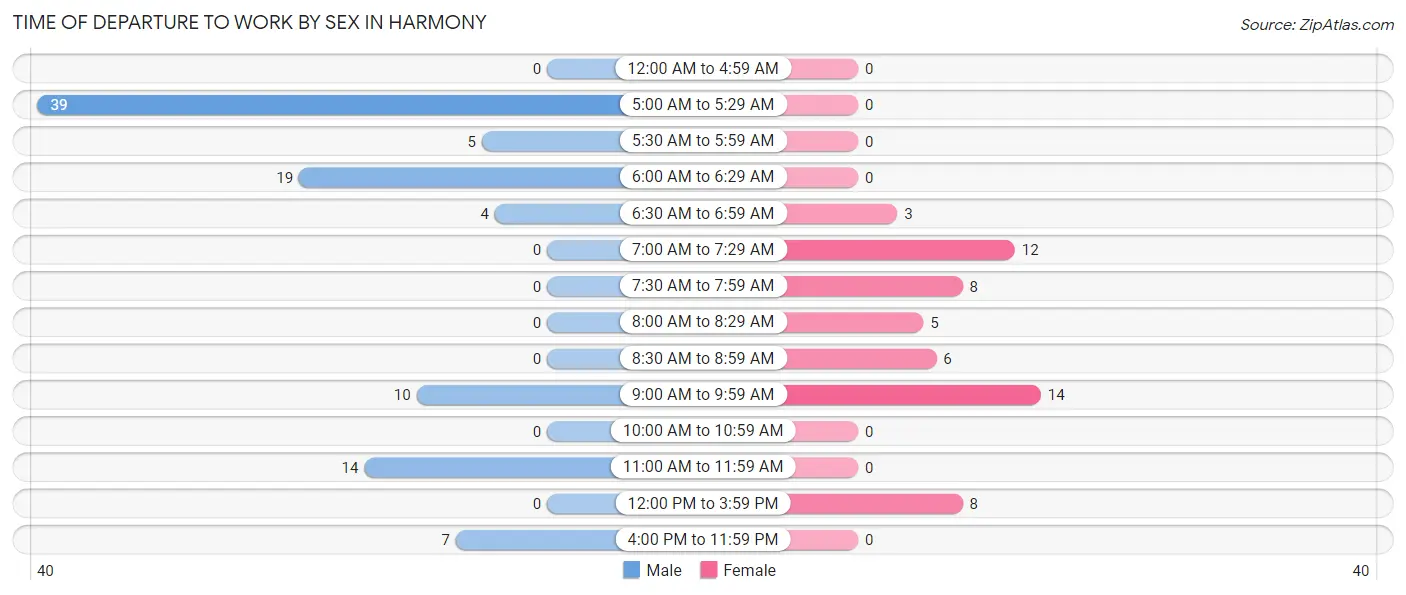
| Time of Departure | Male | Female |
| 12:00 AM to 4:59 AM | 0 (0.0%) | 0 (0.0%) |
| 5:00 AM to 5:29 AM | 39 (39.8%) | 0 (0.0%) |
| 5:30 AM to 5:59 AM | 5 (5.1%) | 0 (0.0%) |
| 6:00 AM to 6:29 AM | 19 (19.4%) | 0 (0.0%) |
| 6:30 AM to 6:59 AM | 4 (4.1%) | 3 (5.4%) |
| 7:00 AM to 7:29 AM | 0 (0.0%) | 12 (21.4%) |
| 7:30 AM to 7:59 AM | 0 (0.0%) | 8 (14.3%) |
| 8:00 AM to 8:29 AM | 0 (0.0%) | 5 (8.9%) |
| 8:30 AM to 8:59 AM | 0 (0.0%) | 6 (10.7%) |
| 9:00 AM to 9:59 AM | 10 (10.2%) | 14 (25.0%) |
| 10:00 AM to 10:59 AM | 0 (0.0%) | 0 (0.0%) |
| 11:00 AM to 11:59 AM | 14 (14.3%) | 0 (0.0%) |
| 12:00 PM to 3:59 PM | 0 (0.0%) | 8 (14.3%) |
| 4:00 PM to 11:59 PM | 7 (7.1%) | 0 (0.0%) |
| Total | 98 (100.0%) | 56 (100.0%) |
Housing Occupancy in Harmony
Occupancy by Ownership in Harmony
Of the total 146 dwellings in Harmony, owner-occupied units account for 133 (91.1%), while renter-occupied units make up 13 (8.9%).
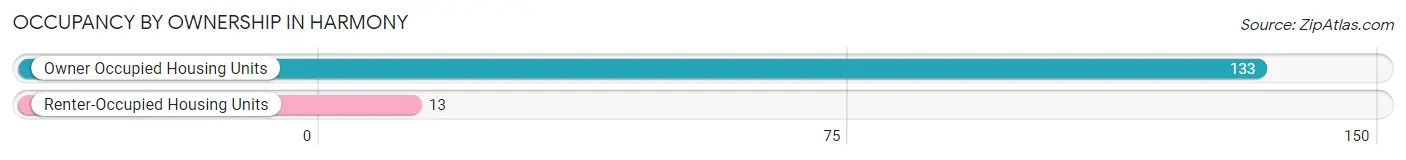
| Occupancy | # Housing Units | % Housing Units |
| Owner Occupied Housing Units | 133 | 91.1% |
| Renter-Occupied Housing Units | 13 | 8.9% |
| Total Occupied Housing Units | 146 | 100.0% |
Occupancy by Household Size in Harmony
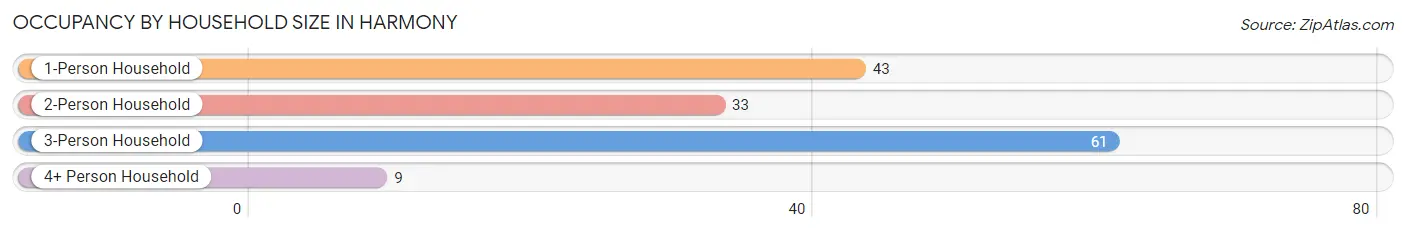
| Household Size | # Housing Units | % Housing Units |
| 1-Person Household | 43 | 29.4% |
| 2-Person Household | 33 | 22.6% |
| 3-Person Household | 61 | 41.8% |
| 4+ Person Household | 9 | 6.2% |
| Total Housing Units | 146 | 100.0% |
Occupancy by Ownership by Household Size in Harmony
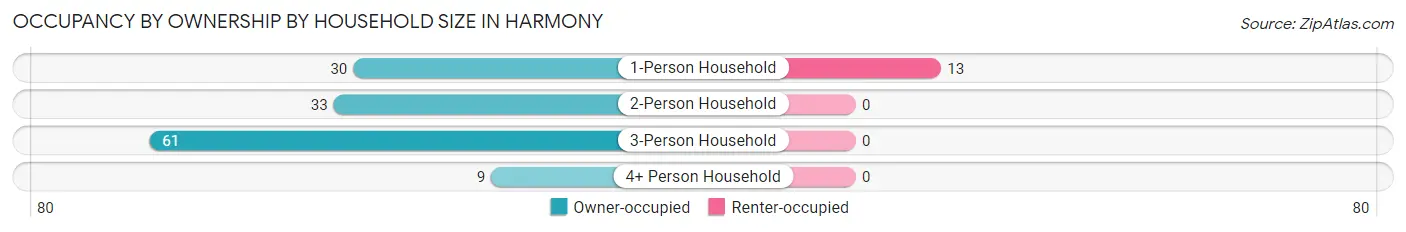
| Household Size | Owner-occupied | Renter-occupied |
| 1-Person Household | 30 (69.8%) | 13 (30.2%) |
| 2-Person Household | 33 (100.0%) | 0 (0.0%) |
| 3-Person Household | 61 (100.0%) | 0 (0.0%) |
| 4+ Person Household | 9 (100.0%) | 0 (0.0%) |
| Total Housing Units | 133 (91.1%) | 13 (8.9%) |
Occupancy by Educational Attainment in Harmony
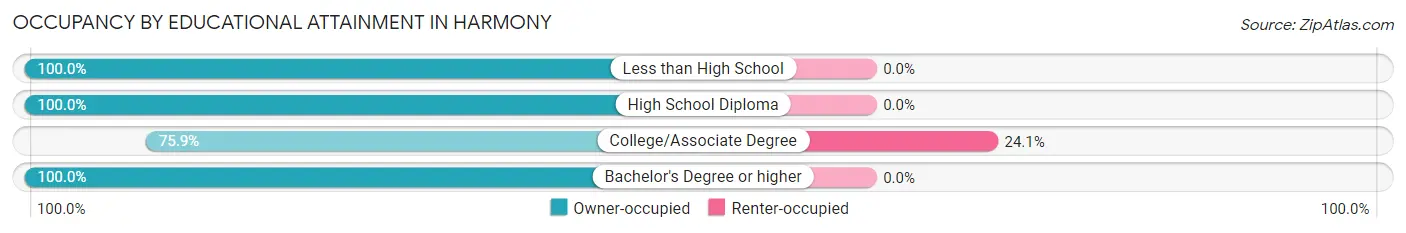
| Household Size | Owner-occupied | Renter-occupied |
| Less than High School | 5 (100.0%) | 0 (0.0%) |
| High School Diploma | 61 (100.0%) | 0 (0.0%) |
| College/Associate Degree | 41 (75.9%) | 13 (24.1%) |
| Bachelor's Degree or higher | 26 (100.0%) | 0 (0.0%) |
Occupancy by Age of Householder in Harmony
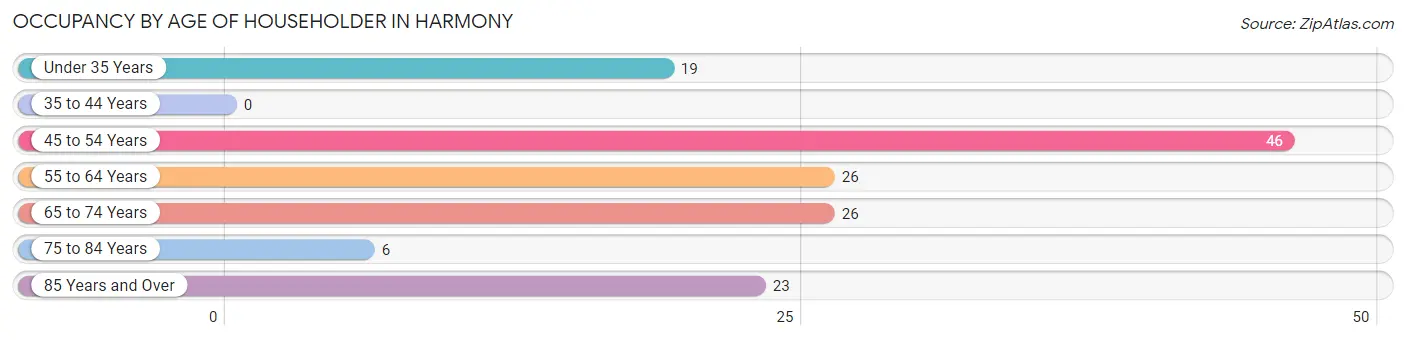
| Age Bracket | # Households | % Households |
| Under 35 Years | 19 | 13.0% |
| 35 to 44 Years | 0 | 0.0% |
| 45 to 54 Years | 46 | 31.5% |
| 55 to 64 Years | 26 | 17.8% |
| 65 to 74 Years | 26 | 17.8% |
| 75 to 84 Years | 6 | 4.1% |
| 85 Years and Over | 23 | 15.8% |
| Total | 146 | 100.0% |
Housing Finances in Harmony
Median Income by Occupancy in Harmony
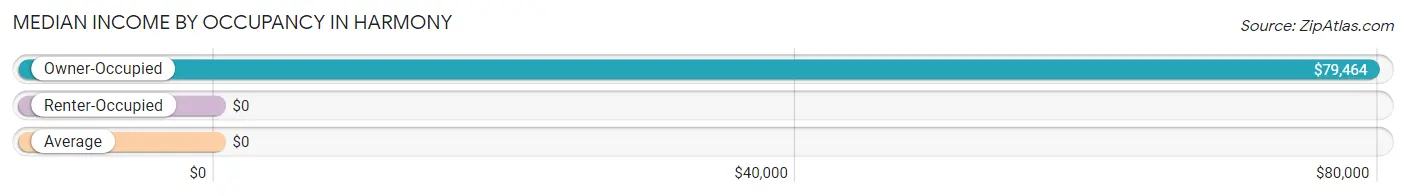
| Occupancy Type | # Households | Median Income |
| Owner-Occupied | 133 (91.1%) | $79,464 |
| Renter-Occupied | 13 (8.9%) | $0 |
| Average | 146 (100.0%) | $0 |
Occupancy by Householder Income Bracket in Harmony
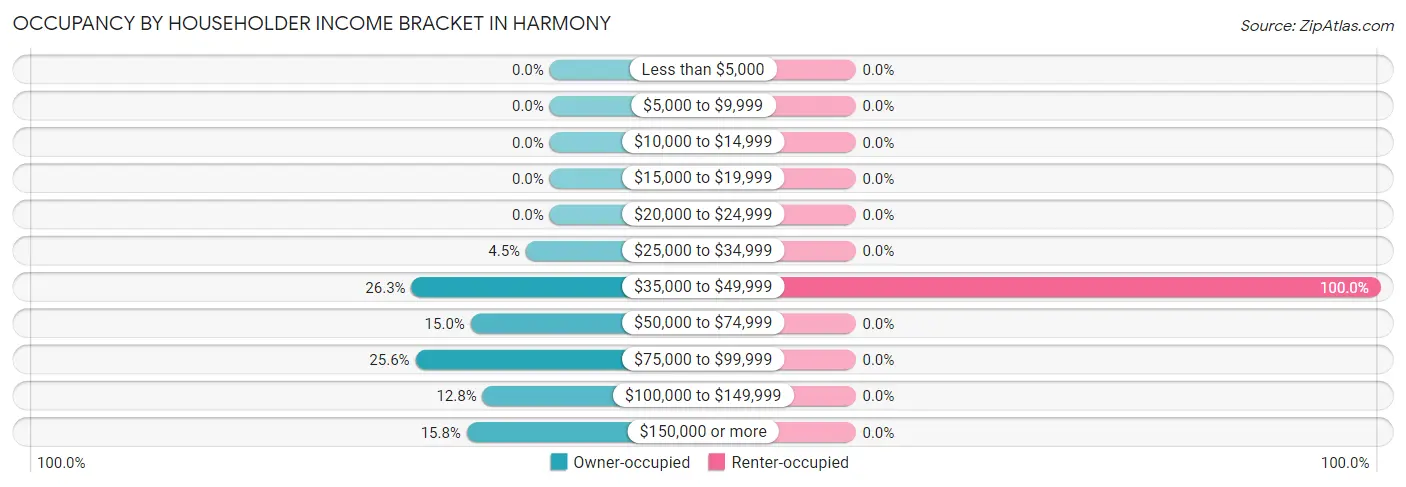
| Income Bracket | Owner-occupied | Renter-occupied |
| Less than $5,000 | 0 (0.0%) | 0 (0.0%) |
| $5,000 to $9,999 | 0 (0.0%) | 0 (0.0%) |
| $10,000 to $14,999 | 0 (0.0%) | 0 (0.0%) |
| $15,000 to $19,999 | 0 (0.0%) | 0 (0.0%) |
| $20,000 to $24,999 | 0 (0.0%) | 0 (0.0%) |
| $25,000 to $34,999 | 6 (4.5%) | 0 (0.0%) |
| $35,000 to $49,999 | 35 (26.3%) | 13 (100.0%) |
| $50,000 to $74,999 | 20 (15.0%) | 0 (0.0%) |
| $75,000 to $99,999 | 34 (25.6%) | 0 (0.0%) |
| $100,000 to $149,999 | 17 (12.8%) | 0 (0.0%) |
| $150,000 or more | 21 (15.8%) | 0 (0.0%) |
| Total | 133 (100.0%) | 13 (100.0%) |
Monthly Housing Cost Tiers in Harmony
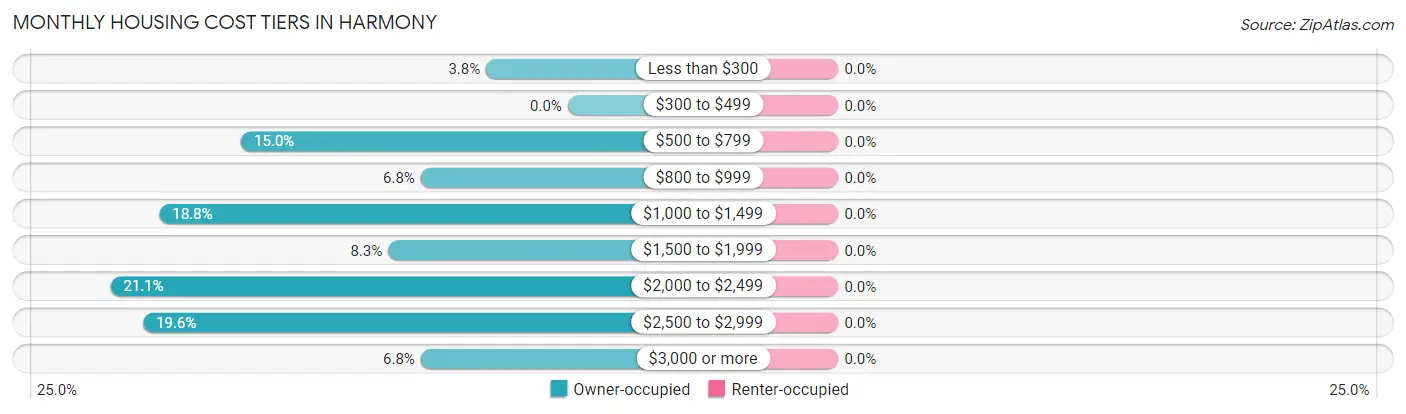
| Monthly Cost | Owner-occupied | Renter-occupied |
| Less than $300 | 5 (3.8%) | 0 (0.0%) |
| $300 to $499 | 0 (0.0%) | 0 (0.0%) |
| $500 to $799 | 20 (15.0%) | 0 (0.0%) |
| $800 to $999 | 9 (6.8%) | 0 (0.0%) |
| $1,000 to $1,499 | 25 (18.8%) | 0 (0.0%) |
| $1,500 to $1,999 | 11 (8.3%) | 0 (0.0%) |
| $2,000 to $2,499 | 28 (21.0%) | 0 (0.0%) |
| $2,500 to $2,999 | 26 (19.6%) | 0 (0.0%) |
| $3,000 or more | 9 (6.8%) | 0 (0.0%) |
| Total | 133 (100.0%) | 13 (100.0%) |
Physical Housing Characteristics in Harmony
Housing Structures in Harmony
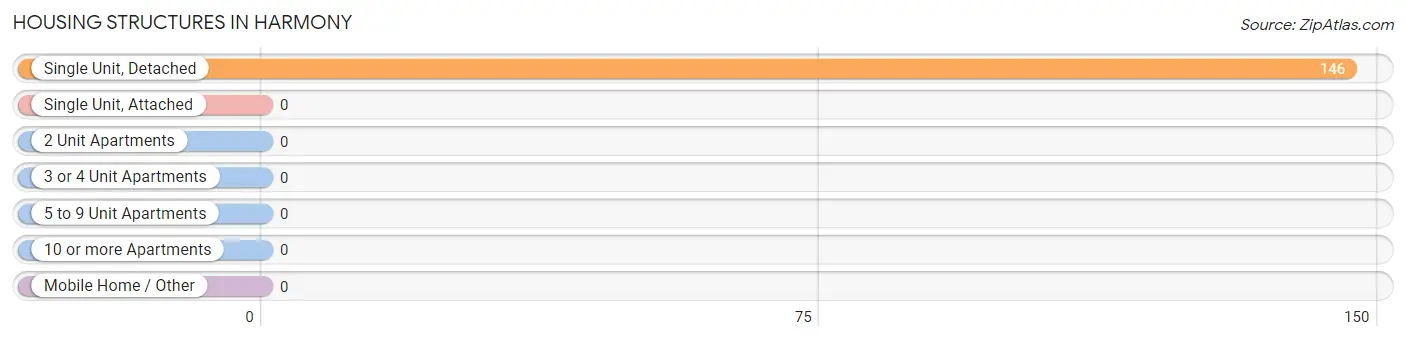
| Structure Type | # Housing Units | % Housing Units |
| Single Unit, Detached | 146 | 100.0% |
| Single Unit, Attached | 0 | 0.0% |
| 2 Unit Apartments | 0 | 0.0% |
| 3 or 4 Unit Apartments | 0 | 0.0% |
| 5 to 9 Unit Apartments | 0 | 0.0% |
| 10 or more Apartments | 0 | 0.0% |
| Mobile Home / Other | 0 | 0.0% |
| Total | 146 | 100.0% |
Housing Structures by Occupancy in Harmony
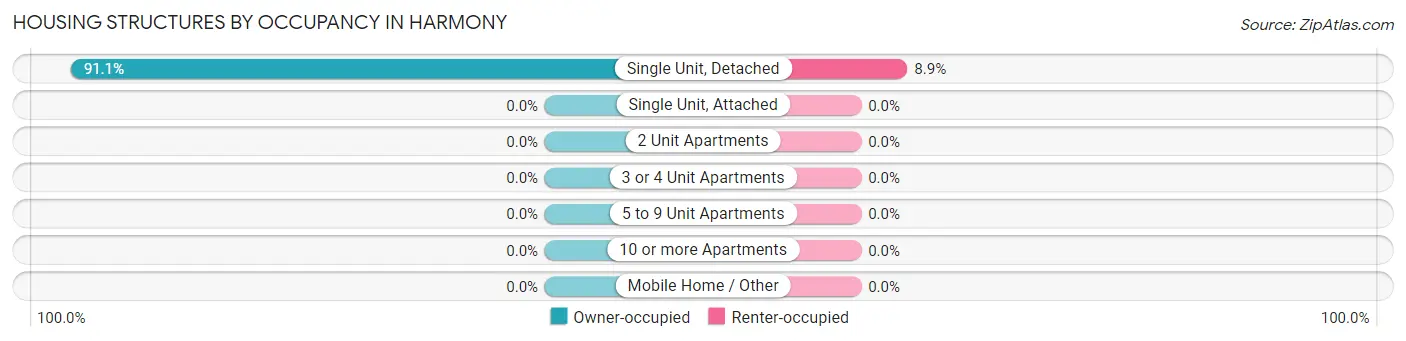
| Structure Type | Owner-occupied | Renter-occupied |
| Single Unit, Detached | 133 (91.1%) | 13 (8.9%) |
| Single Unit, Attached | 0 (0.0%) | 0 (0.0%) |
| 2 Unit Apartments | 0 (0.0%) | 0 (0.0%) |
| 3 or 4 Unit Apartments | 0 (0.0%) | 0 (0.0%) |
| 5 to 9 Unit Apartments | 0 (0.0%) | 0 (0.0%) |
| 10 or more Apartments | 0 (0.0%) | 0 (0.0%) |
| Mobile Home / Other | 0 (0.0%) | 0 (0.0%) |
| Total | 133 (91.1%) | 13 (8.9%) |
Housing Structures by Number of Rooms in Harmony
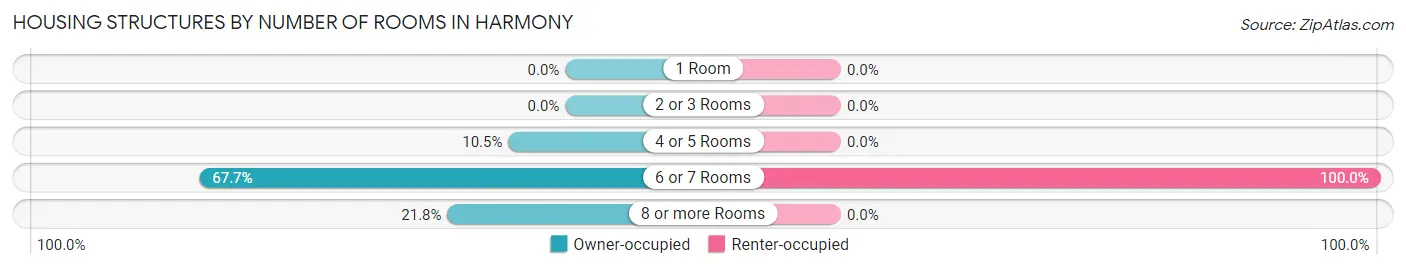
| Number of Rooms | Owner-occupied | Renter-occupied |
| 1 Room | 0 (0.0%) | 0 (0.0%) |
| 2 or 3 Rooms | 0 (0.0%) | 0 (0.0%) |
| 4 or 5 Rooms | 14 (10.5%) | 0 (0.0%) |
| 6 or 7 Rooms | 90 (67.7%) | 13 (100.0%) |
| 8 or more Rooms | 29 (21.8%) | 0 (0.0%) |
| Total | 133 (100.0%) | 13 (100.0%) |
Housing Structure by Heating Type in Harmony
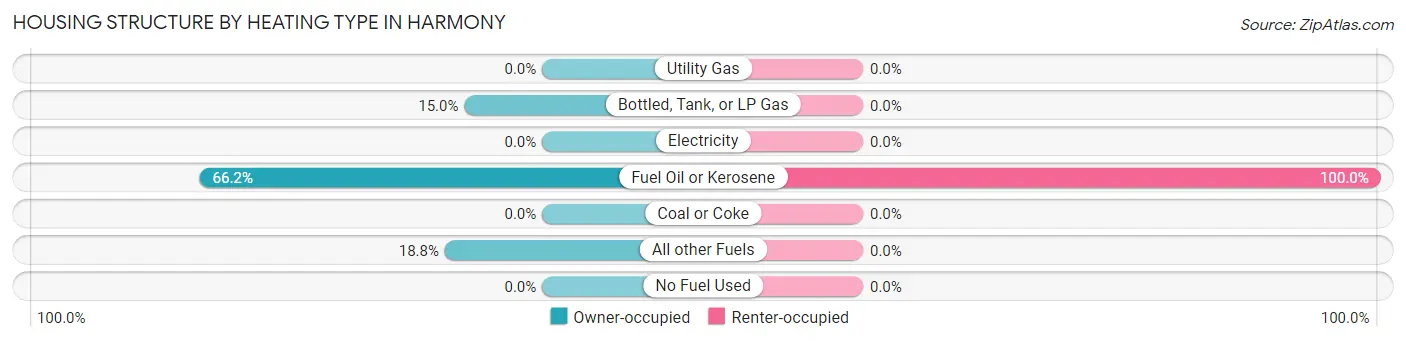
| Heating Type | Owner-occupied | Renter-occupied |
| Utility Gas | 0 (0.0%) | 0 (0.0%) |
| Bottled, Tank, or LP Gas | 20 (15.0%) | 0 (0.0%) |
| Electricity | 0 (0.0%) | 0 (0.0%) |
| Fuel Oil or Kerosene | 88 (66.2%) | 13 (100.0%) |
| Coal or Coke | 0 (0.0%) | 0 (0.0%) |
| All other Fuels | 25 (18.8%) | 0 (0.0%) |
| No Fuel Used | 0 (0.0%) | 0 (0.0%) |
| Total | 133 (100.0%) | 13 (100.0%) |
Household Vehicle Usage in Harmony
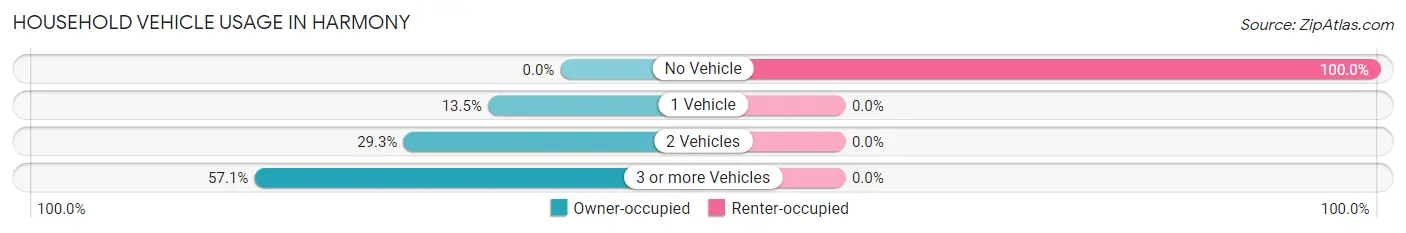
| Vehicles per Household | Owner-occupied | Renter-occupied |
| No Vehicle | 0 (0.0%) | 13 (100.0%) |
| 1 Vehicle | 18 (13.5%) | 0 (0.0%) |
| 2 Vehicles | 39 (29.3%) | 0 (0.0%) |
| 3 or more Vehicles | 76 (57.1%) | 0 (0.0%) |
| Total | 133 (100.0%) | 13 (100.0%) |
Real Estate & Mortgages in Harmony
Real Estate and Mortgage Overview in Harmony
| Characteristic | Without Mortgage | With Mortgage |
| Housing Units | 45 | 88 |
| Median Property Value | $257,800 | $315,400 |
| Median Household Income | $88,438 | $13 |
| Monthly Housing Costs | $675 | $9 |
| Real Estate Taxes | $5,560 | $0 |
Property Value by Mortgage Status in Harmony
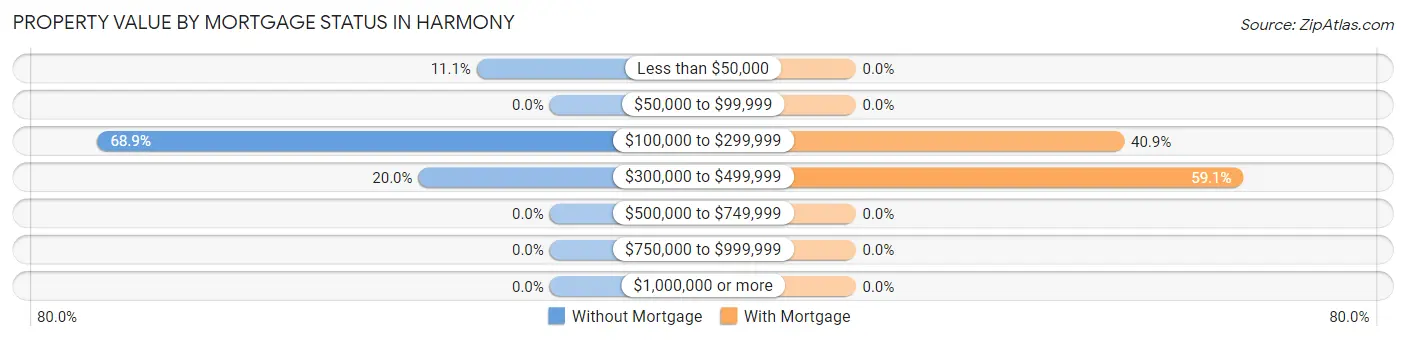
| Property Value | Without Mortgage | With Mortgage |
| Less than $50,000 | 5 (11.1%) | 0 (0.0%) |
| $50,000 to $99,999 | 0 (0.0%) | 0 (0.0%) |
| $100,000 to $299,999 | 31 (68.9%) | 36 (40.9%) |
| $300,000 to $499,999 | 9 (20.0%) | 52 (59.1%) |
| $500,000 to $749,999 | 0 (0.0%) | 0 (0.0%) |
| $750,000 to $999,999 | 0 (0.0%) | 0 (0.0%) |
| $1,000,000 or more | 0 (0.0%) | 0 (0.0%) |
| Total | 45 (100.0%) | 88 (100.0%) |
Household Income by Mortgage Status in Harmony
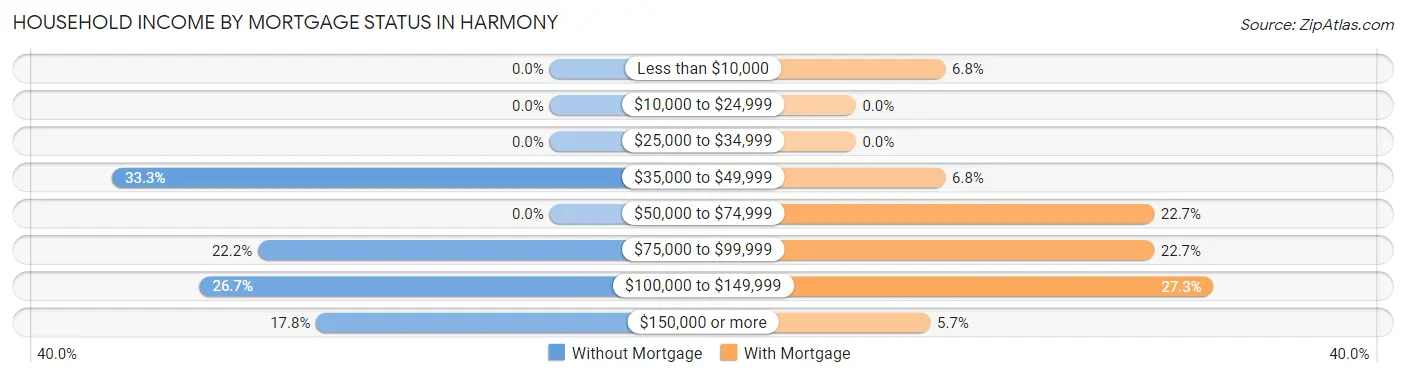
| Household Income | Without Mortgage | With Mortgage |
| Less than $10,000 | 0 (0.0%) | 6 (6.8%) |
| $10,000 to $24,999 | 0 (0.0%) | 0 (0.0%) |
| $25,000 to $34,999 | 0 (0.0%) | 0 (0.0%) |
| $35,000 to $49,999 | 15 (33.3%) | 6 (6.8%) |
| $50,000 to $74,999 | 0 (0.0%) | 20 (22.7%) |
| $75,000 to $99,999 | 10 (22.2%) | 20 (22.7%) |
| $100,000 to $149,999 | 12 (26.7%) | 24 (27.3%) |
| $150,000 or more | 8 (17.8%) | 5 (5.7%) |
| Total | 45 (100.0%) | 88 (100.0%) |
Property Value to Household Income Ratio in Harmony
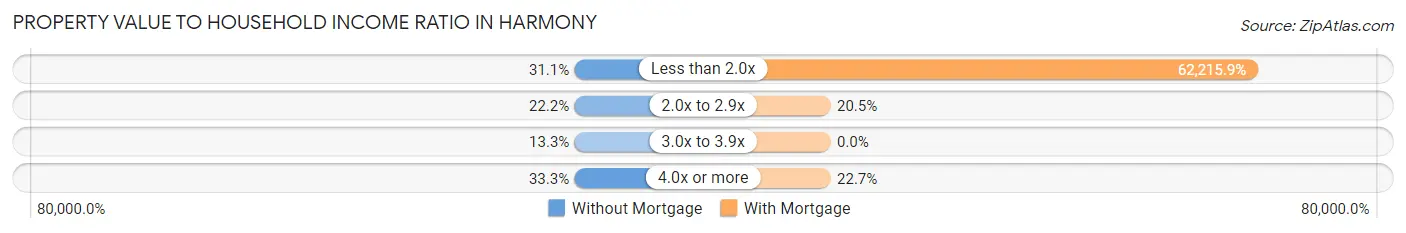
| Value-to-Income Ratio | Without Mortgage | With Mortgage |
| Less than 2.0x | 14 (31.1%) | 54,750 (62,215.9%) |
| 2.0x to 2.9x | 10 (22.2%) | 18 (20.4%) |
| 3.0x to 3.9x | 6 (13.3%) | 0 (0.0%) |
| 4.0x or more | 15 (33.3%) | 20 (22.7%) |
| Total | 45 (100.0%) | 88 (100.0%) |
Real Estate Taxes by Mortgage Status in Harmony
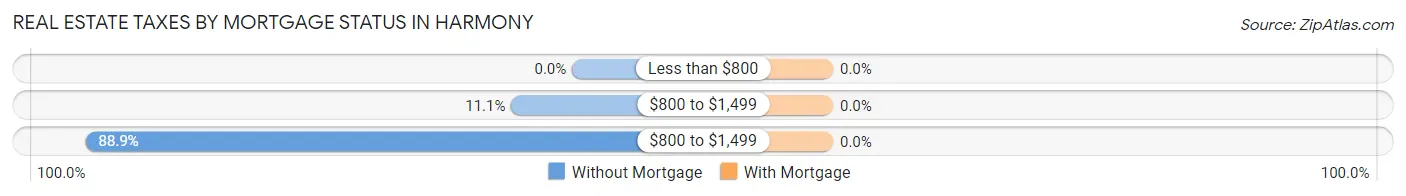
| Property Taxes | Without Mortgage | With Mortgage |
| Less than $800 | 0 (0.0%) | 0 (0.0%) |
| $800 to $1,499 | 5 (11.1%) | 0 (0.0%) |
| $800 to $1,499 | 40 (88.9%) | 0 (0.0%) |
| Total | 45 (100.0%) | 88 (100.0%) |
Health & Disability in Harmony
Health Insurance Coverage by Age in Harmony
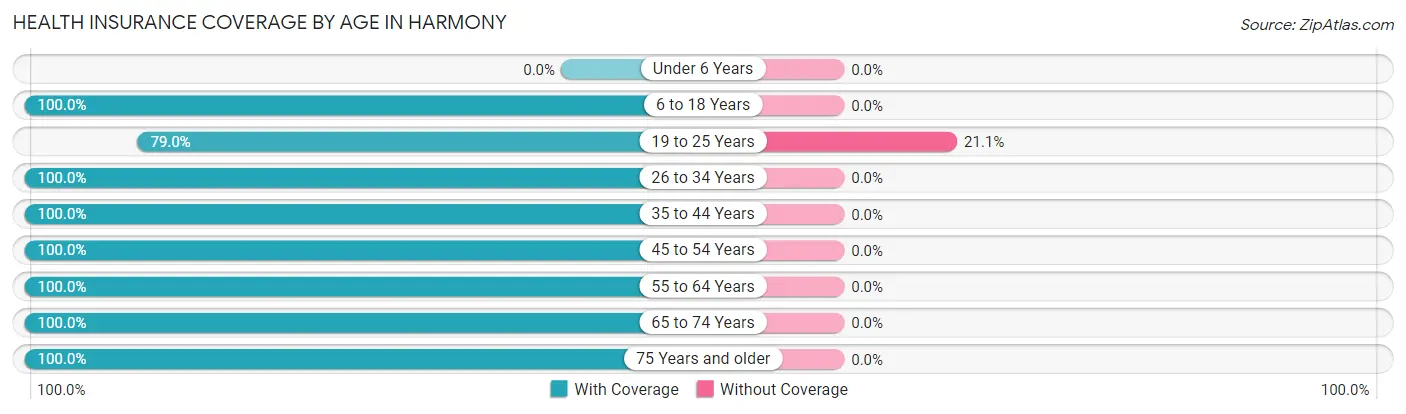
| Age Bracket | With Coverage | Without Coverage |
| Under 6 Years | 0 (0.0%) | 0 (0.0%) |
| 6 to 18 Years | 42 (100.0%) | 0 (0.0%) |
| 19 to 25 Years | 30 (78.9%) | 8 (21.0%) |
| 26 to 34 Years | 40 (100.0%) | 0 (0.0%) |
| 35 to 44 Years | 4 (100.0%) | 0 (0.0%) |
| 45 to 54 Years | 83 (100.0%) | 0 (0.0%) |
| 55 to 64 Years | 47 (100.0%) | 0 (0.0%) |
| 65 to 74 Years | 43 (100.0%) | 0 (0.0%) |
| 75 Years and older | 32 (100.0%) | 0 (0.0%) |
| Total | 321 (97.6%) | 8 (2.4%) |
Health Insurance Coverage by Citizenship Status in Harmony
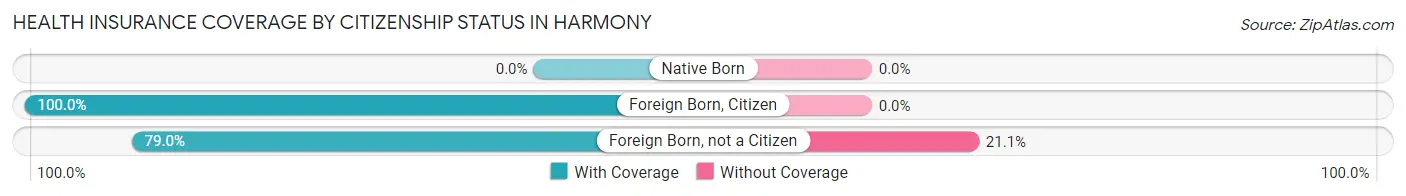
| Citizenship Status | With Coverage | Without Coverage |
| Native Born | 0 (0.0%) | 0 (0.0%) |
| Foreign Born, Citizen | 42 (100.0%) | 0 (0.0%) |
| Foreign Born, not a Citizen | 30 (78.9%) | 8 (21.0%) |
Health Insurance Coverage by Household Income in Harmony
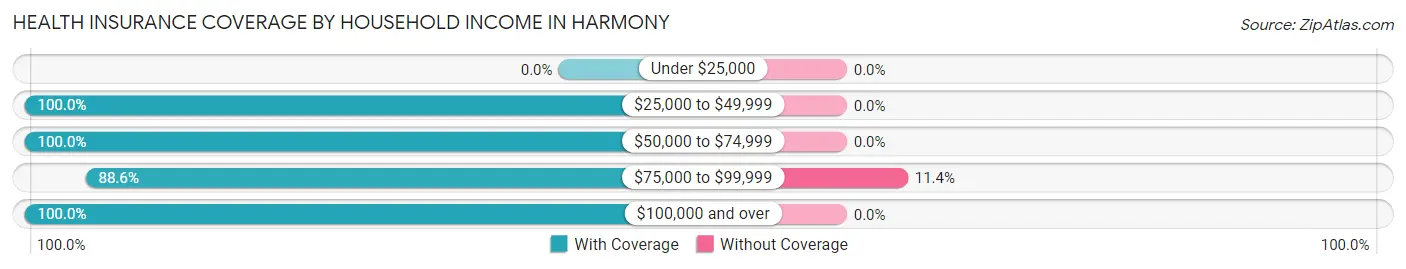
| Household Income | With Coverage | Without Coverage |
| Under $25,000 | 0 (0.0%) | 0 (0.0%) |
| $25,000 to $49,999 | 123 (100.0%) | 0 (0.0%) |
| $50,000 to $74,999 | 53 (100.0%) | 0 (0.0%) |
| $75,000 to $99,999 | 62 (88.6%) | 8 (11.4%) |
| $100,000 and over | 83 (100.0%) | 0 (0.0%) |
Public vs Private Health Insurance Coverage by Age in Harmony
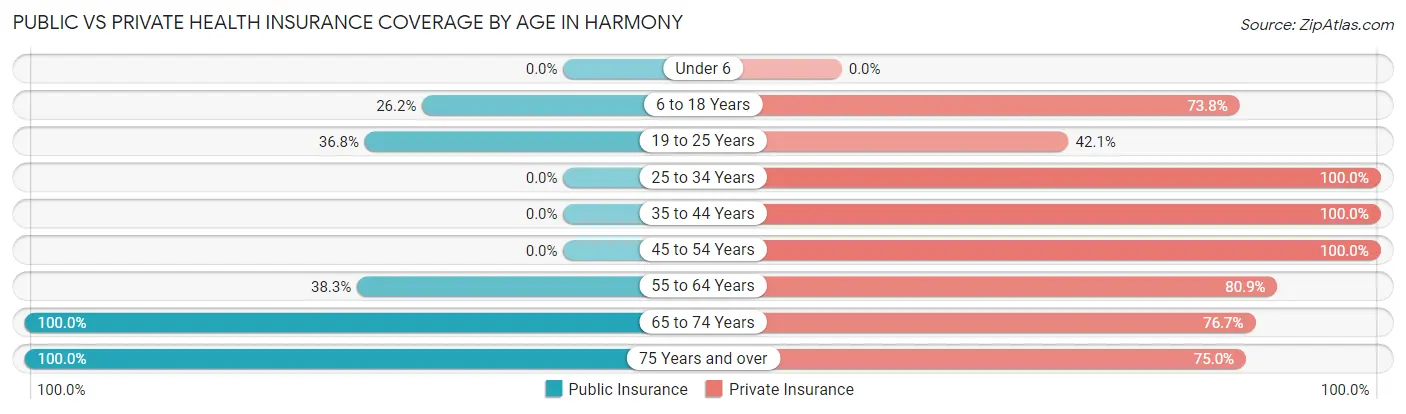
| Age Bracket | Public Insurance | Private Insurance |
| Under 6 | 0 (0.0%) | 0 (0.0%) |
| 6 to 18 Years | 11 (26.2%) | 31 (73.8%) |
| 19 to 25 Years | 14 (36.8%) | 16 (42.1%) |
| 25 to 34 Years | 0 (0.0%) | 40 (100.0%) |
| 35 to 44 Years | 0 (0.0%) | 4 (100.0%) |
| 45 to 54 Years | 0 (0.0%) | 83 (100.0%) |
| 55 to 64 Years | 18 (38.3%) | 38 (80.8%) |
| 65 to 74 Years | 43 (100.0%) | 33 (76.7%) |
| 75 Years and over | 32 (100.0%) | 24 (75.0%) |
| Total | 118 (35.9%) | 269 (81.8%) |
Disability Status by Sex by Age in Harmony
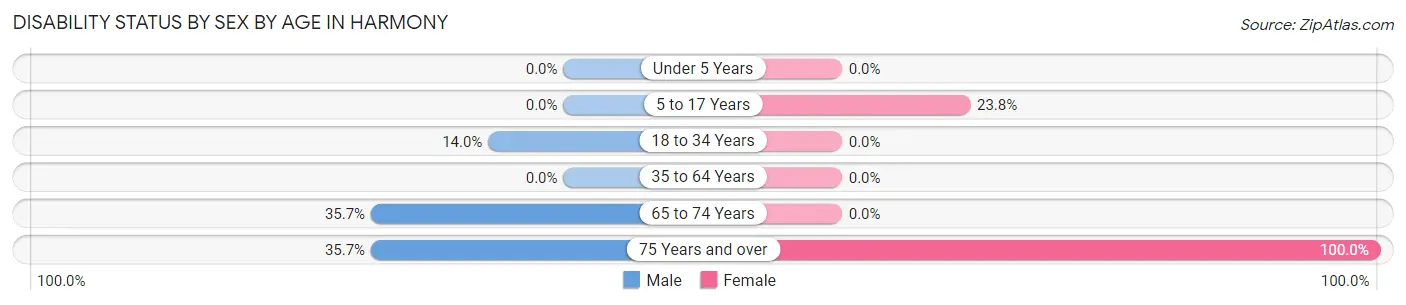
| Age Bracket | Male | Female |
| Under 5 Years | 0 (0.0%) | 0 (0.0%) |
| 5 to 17 Years | 0 (0.0%) | 5 (23.8%) |
| 18 to 34 Years | 6 (14.0%) | 0 (0.0%) |
| 35 to 64 Years | 0 (0.0%) | 0 (0.0%) |
| 65 to 74 Years | 5 (35.7%) | 0 (0.0%) |
| 75 Years and over | 5 (35.7%) | 18 (100.0%) |
Disability Class by Sex by Age in Harmony
Disability Class: Hearing Difficulty
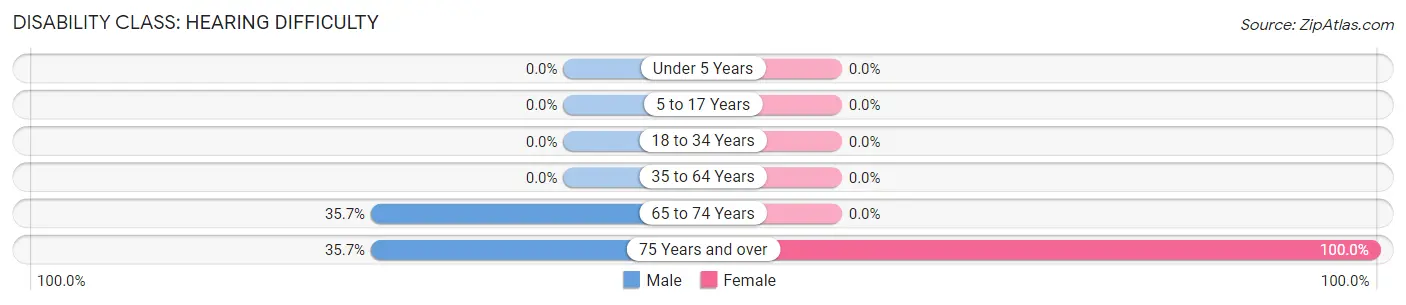
| Age Bracket | Male | Female |
| Under 5 Years | 0 (0.0%) | 0 (0.0%) |
| 5 to 17 Years | 0 (0.0%) | 0 (0.0%) |
| 18 to 34 Years | 0 (0.0%) | 0 (0.0%) |
| 35 to 64 Years | 0 (0.0%) | 0 (0.0%) |
| 65 to 74 Years | 5 (35.7%) | 0 (0.0%) |
| 75 Years and over | 5 (35.7%) | 18 (100.0%) |
Disability Class: Vision Difficulty
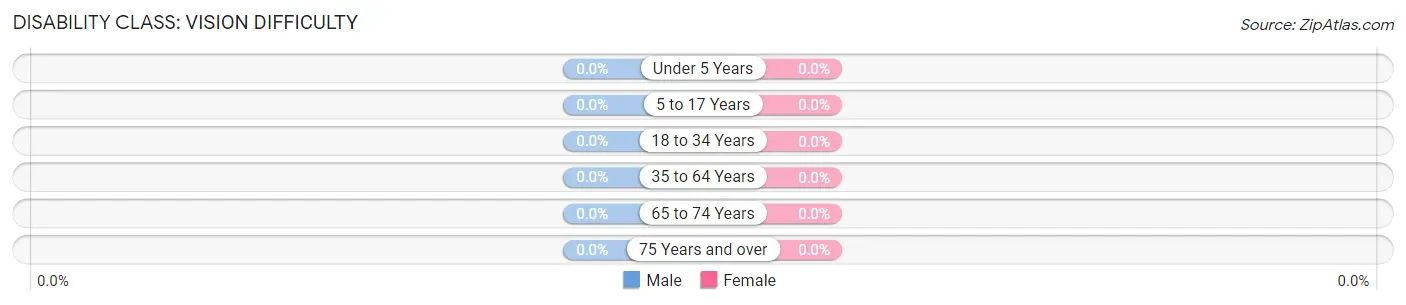
| Age Bracket | Male | Female |
| Under 5 Years | 0 (0.0%) | 0 (0.0%) |
| 5 to 17 Years | 0 (0.0%) | 0 (0.0%) |
| 18 to 34 Years | 0 (0.0%) | 0 (0.0%) |
| 35 to 64 Years | 0 (0.0%) | 0 (0.0%) |
| 65 to 74 Years | 0 (0.0%) | 0 (0.0%) |
| 75 Years and over | 0 (0.0%) | 0 (0.0%) |
Disability Class: Cognitive Difficulty
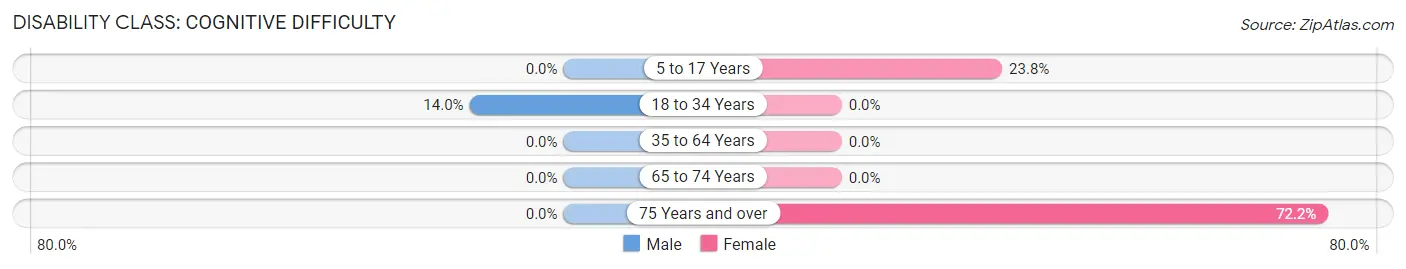
| Age Bracket | Male | Female |
| 5 to 17 Years | 0 (0.0%) | 5 (23.8%) |
| 18 to 34 Years | 6 (14.0%) | 0 (0.0%) |
| 35 to 64 Years | 0 (0.0%) | 0 (0.0%) |
| 65 to 74 Years | 0 (0.0%) | 0 (0.0%) |
| 75 Years and over | 0 (0.0%) | 13 (72.2%) |
Disability Class: Ambulatory Difficulty
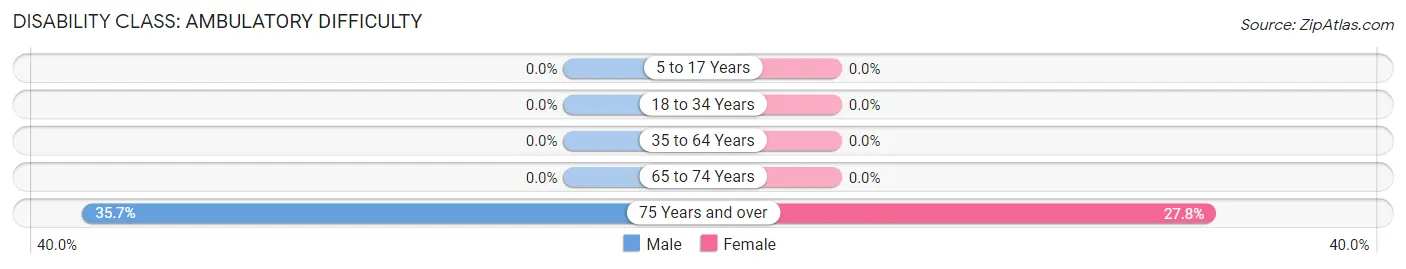
| Age Bracket | Male | Female |
| 5 to 17 Years | 0 (0.0%) | 0 (0.0%) |
| 18 to 34 Years | 0 (0.0%) | 0 (0.0%) |
| 35 to 64 Years | 0 (0.0%) | 0 (0.0%) |
| 65 to 74 Years | 0 (0.0%) | 0 (0.0%) |
| 75 Years and over | 5 (35.7%) | 5 (27.8%) |
Disability Class: Self-Care Difficulty
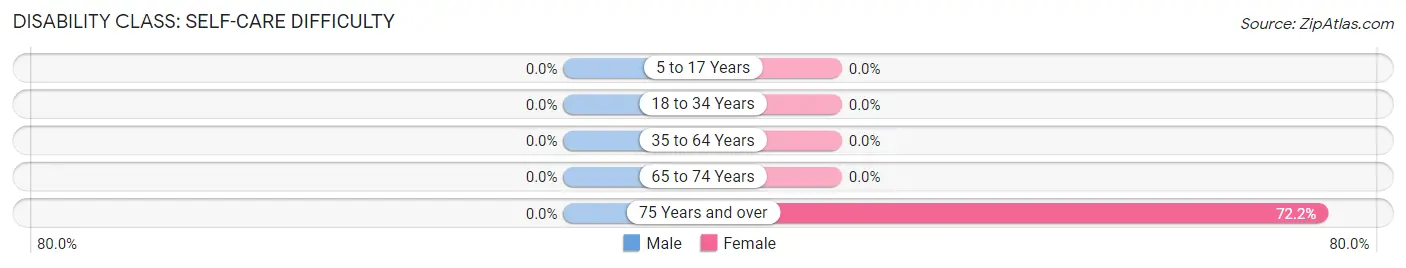
| Age Bracket | Male | Female |
| 5 to 17 Years | 0 (0.0%) | 0 (0.0%) |
| 18 to 34 Years | 0 (0.0%) | 0 (0.0%) |
| 35 to 64 Years | 0 (0.0%) | 0 (0.0%) |
| 65 to 74 Years | 0 (0.0%) | 0 (0.0%) |
| 75 Years and over | 0 (0.0%) | 13 (72.2%) |
Technology Access in Harmony
Computing Device Access in Harmony
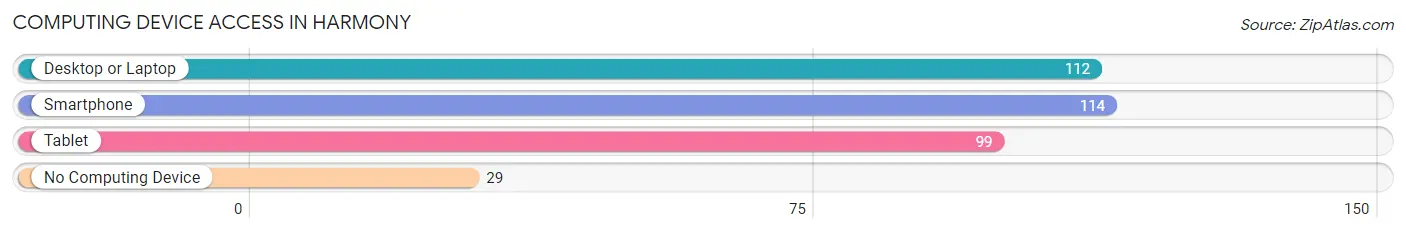
| Device Type | # Households | % Households |
| Desktop or Laptop | 112 | 76.7% |
| Smartphone | 114 | 78.1% |
| Tablet | 99 | 67.8% |
| No Computing Device | 29 | 19.9% |
| Total | 146 | 100.0% |
Internet Access in Harmony
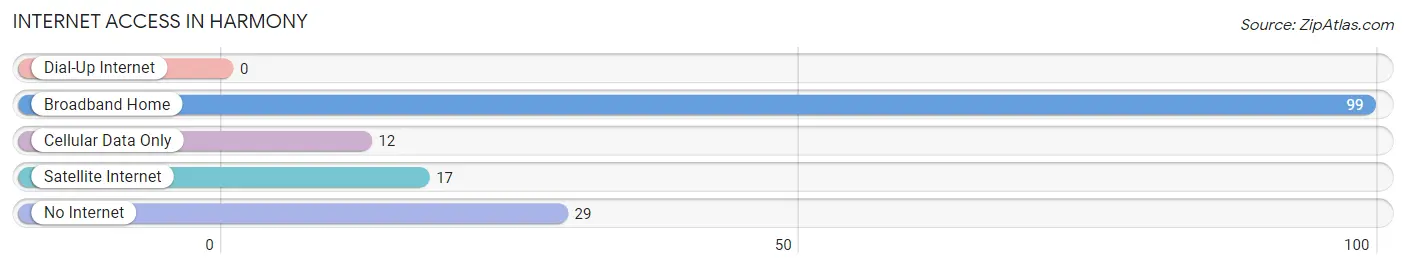
| Internet Type | # Households | % Households |
| Dial-Up Internet | 0 | 0.0% |
| Broadband Home | 99 | 67.8% |
| Cellular Data Only | 12 | 8.2% |
| Satellite Internet | 17 | 11.6% |
| No Internet | 29 | 19.9% |
| Total | 146 | 100.0% |
Harmony Summary
Harmony Township is a township located in Warren County, New Jersey, United States. As of the 2010 United States Census, the township's population was 2,845, reflecting an increase of 517 (+22.2%) from the 2,328 counted in the 2000 Census, which had in turn increased by 517 (+28.5%) from the 1,811 counted in the 1990 Census.
History
Harmony Township was formed as a township by an act of the New Jersey Legislature on April 8, 1839, from portions of Greenwich Township and Oxford Township. The township was named for the "harmony" of its inhabitants.
Geography
According to the United States Census Bureau, the township had a total area of 11.945 square miles (30.890km^2), including 11.845 square miles (30.619km^2) of land and 0.100 square miles (0.271km^2) of water (0.83%).
Unincorporated communities, localities and place names located partially or completely within the township include Beattystown, Finesville, Harmony, Marksboro, Mount Joy and Shippenport.
The township borders the Warren County municipalities of Franklin Township, Greenwich Township, Mansfield Township, Oxford Township and White Township.
Demographics
Census 2010
The Census Bureau's 2006-2010 American Community Survey showed that (in 2010 inflation-adjusted dollars) median household income was $76,250 (with a margin of error of +/- $14,945) and the median family income was $87,500 (+/- $14,945). Males had a median income of $60,000 (+/- $14,945) versus $45,000 (+/- $14,945) for females. The per capita income for the borough was $30,945 (+/- $7,945). About 4.2% of families and 5.2% of the population were below the poverty line, including 6.2% of those under age 18 and none of those age 65 or over.
2000 Census
As of the 2000 United States Census there were 2,328 people, 845 households, and 645 families residing in the township. The population density was 197.3 people per square mile (76.1/km^2). There were 876 housing units at an average density of 73.9 per square mile (28.5/km^2). The racial makeup of the township was 97.90% White, 0.43% African American, 0.09% Native American, 0.43% Asian, 0.09% Pacific Islander, 0.17% from other races, and 0.87% from two or more races. Hispanic or Latino of any race were 1.45% of the population.
There were 845 households, out of which 33.7% had children under the age of 18 living with them, 63.2% were married couples living together, 8.2% had a female householder with no husband present, and 24.7% were non-families. 19.7% of all households were made up of individuals, and 8.2% had someone living alone who was 65 years of age or older. The average household size was 2.75 and the average family size was 3.17.
In the township the population was spread out, with 25.2% under the age of 18, 6.2% from 18 to 24, 30.2% from 25 to 44, 25.2% from 45 to 64, and 13.2% who were 65 years of age or older. The median age was 38 years. For every 100 females, there were 97.2 males. For every 100 females age 18 and over, there were 94.2 males.
The median income for a household in the township was $60,000, and the median income for a family was $64,917. Males had a median income of $45,000 versus $30,000 for females. The per capita income for the township was $24,917. About 2.2% of families and 3.2% of the population were below the poverty line, including 3.2% of those under age 18 and 4.2% of those age 65 or over.
Economy
Harmony Township is home to several small businesses, including a winery, a brewery, a distillery, and a number of restaurants. The township also has a number of farms, including a dairy farm, a vegetable farm, and a Christmas tree farm.
The township is also home to a number of recreational activities, including a golf course, a ski resort, and a number of parks and trails.
The township is served by the Harmony Township School District, which serves students in grades K-8. The district is part of the Warren County Vocational-Technical School District, which serves students in grades 9-12.
Common Questions
What is Per Capita Income in Harmony?
Per Capita income in Harmony is $40,694.
What is Income or Wage Gap in Harmony?
Income or Wage Gap in Harmony is 41.7%.
Women in Harmony earn 58.3 cents for every dollar earned by a man.
What is Inequality or Gini Index in Harmony?
Inequality or Gini Index in Harmony is 0.37.
What is the Total Population of Harmony?
Total Population of Harmony is 329.
What is the Total Male Population of Harmony?
Total Male Population of Harmony is 166.
What is the Total Female Population of Harmony?
Total Female Population of Harmony is 163.
What is the Ratio of Males per 100 Females in Harmony?
There are 101.84 Males per 100 Females in Harmony.
What is the Ratio of Females per 100 Males in Harmony?
There are 98.19 Females per 100 Males in Harmony.
What is the Median Population Age in Harmony?
Median Population Age in Harmony is 49.2 Years.
What is the Average Family Size in Harmony
Average Family Size in Harmony is 2.8 People.
What is the Average Household Size in Harmony
Average Household Size in Harmony is 2.2 People.
How Large is the Labor Force in Harmony?
There are 161 People in the Labor Forcein in Harmony.
What is the Percentage of People in the Labor Force in Harmony?
54.0% of People are in the Labor Force in Harmony.