Hammonton, NJ Map & Demographics
Hammonton Map
Hammonton Overview
$43,688
PER CAPITA INCOME
$105,625
AVG FAMILY INCOME
$79,747
AVG HOUSEHOLD INCOME
33.5%
WAGE / INCOME GAP [ % ]
66.5¢/ $1
WAGE / INCOME GAP [ $ ]
0.48
INEQUALITY / GINI INDEX
14,732
TOTAL POPULATION
7,526
MALE POPULATION
7,206
FEMALE POPULATION
104.44
MALES / 100 FEMALES
95.75
FEMALES / 100 MALES
46.2
MEDIAN AGE
3.0
AVG FAMILY SIZE
2.5
AVG HOUSEHOLD SIZE
8,136
LABOR FORCE [ PEOPLE ]
65.7%
PERCENT IN LABOR FORCE
7.4%
UNEMPLOYMENT RATE
Hammonton Zip Codes
Hammonton Area Codes
Income in Hammonton
Income Overview in Hammonton
Per Capita Income in Hammonton is $43,688, while median incomes of families and households are $105,625 and $79,747 respectively.
| Characteristic | Number | Measure |
| Per Capita Income | 14,732 | $43,688 |
| Median Family Income | 3,783 | $105,625 |
| Mean Family Income | 3,783 | $131,753 |
| Median Household Income | 5,751 | $79,747 |
| Mean Household Income | 5,751 | $112,674 |
| Income Deficit | 3,783 | $0 |
| Wage / Income Gap (%) | 14,732 | 33.51% |
| Wage / Income Gap ($) | 14,732 | 66.49¢ per $1 |
| Gini / Inequality Index | 14,732 | 0.48 |
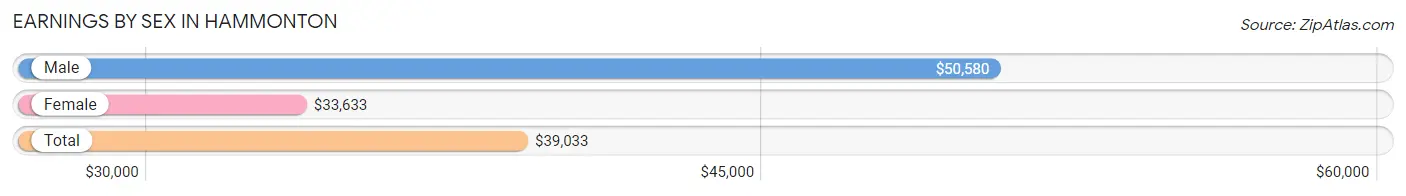
Earnings by Sex in Hammonton
Average Earnings in Hammonton are $39,033, $50,580 for men and $33,633 for women, a difference of 33.5%.
| Sex | Number | Average Earnings |
| Male | 4,798 (57.0%) | $50,580 |
| Female | 3,617 (43.0%) | $33,633 |
| Total | 8,415 (100.0%) | $39,033 |
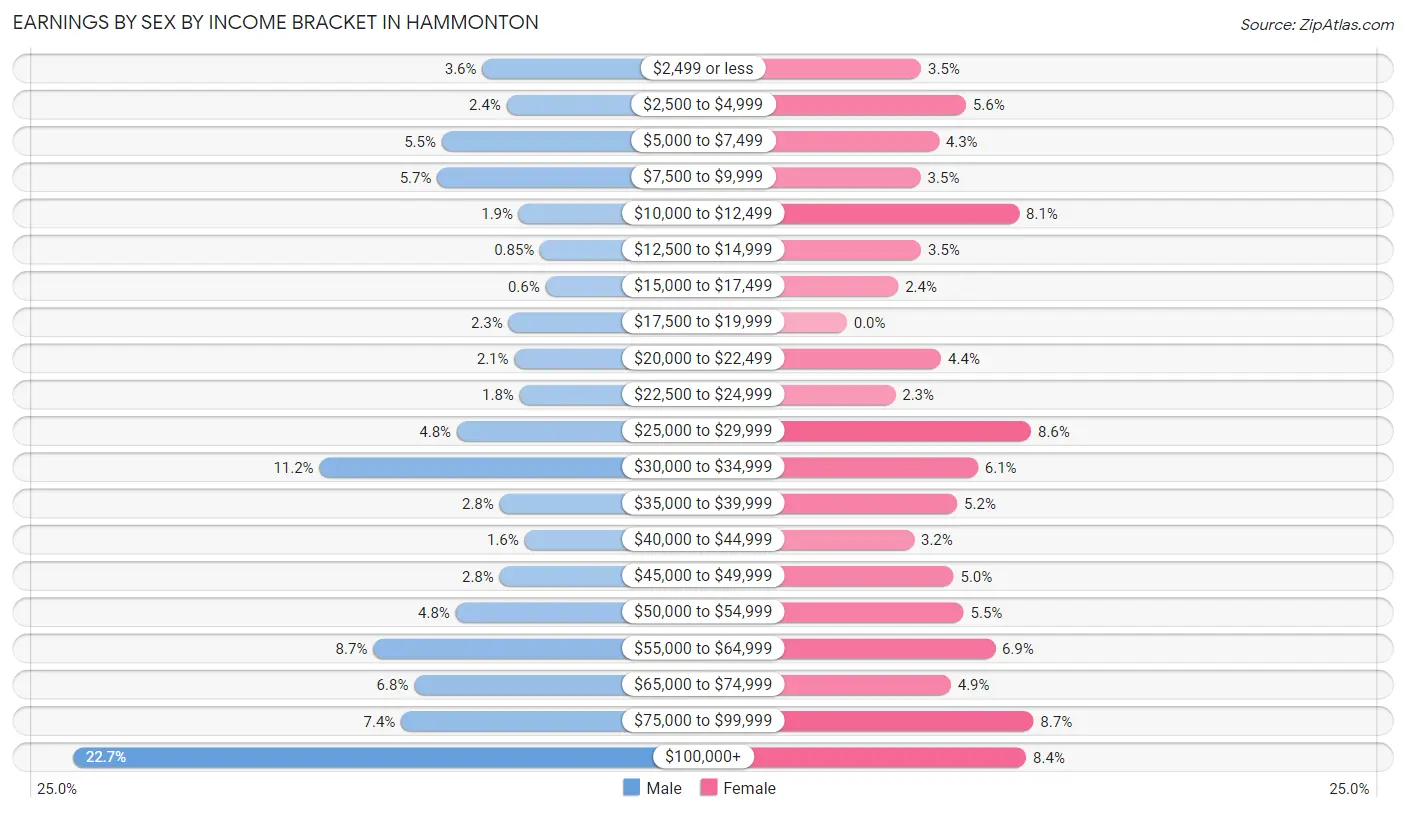
Earnings by Sex by Income Bracket in Hammonton
The most common earnings brackets in Hammonton are $100,000+ for men (1,091 | 22.7%) and $75,000 to $99,999 for women (316 | 8.7%).
| Income | Male | Female |
| $2,499 or less | 171 (3.6%) | 126 (3.5%) |
| $2,500 to $4,999 | 116 (2.4%) | 202 (5.6%) |
| $5,000 to $7,499 | 262 (5.5%) | 156 (4.3%) |
| $7,500 to $9,999 | 272 (5.7%) | 125 (3.5%) |
| $10,000 to $12,499 | 89 (1.8%) | 292 (8.1%) |
| $12,500 to $14,999 | 41 (0.9%) | 126 (3.5%) |
| $15,000 to $17,499 | 29 (0.6%) | 87 (2.4%) |
| $17,500 to $19,999 | 112 (2.3%) | 0 (0.0%) |
| $20,000 to $22,499 | 99 (2.1%) | 160 (4.4%) |
| $22,500 to $24,999 | 87 (1.8%) | 82 (2.3%) |
| $25,000 to $29,999 | 228 (4.8%) | 312 (8.6%) |
| $30,000 to $34,999 | 537 (11.2%) | 222 (6.1%) |
| $35,000 to $39,999 | 132 (2.8%) | 187 (5.2%) |
| $40,000 to $44,999 | 76 (1.6%) | 114 (3.2%) |
| $45,000 to $49,999 | 132 (2.8%) | 181 (5.0%) |
| $50,000 to $54,999 | 231 (4.8%) | 198 (5.5%) |
| $55,000 to $64,999 | 416 (8.7%) | 251 (6.9%) |
| $65,000 to $74,999 | 324 (6.8%) | 176 (4.9%) |
| $75,000 to $99,999 | 353 (7.4%) | 316 (8.7%) |
| $100,000+ | 1,091 (22.7%) | 304 (8.4%) |
| Total | 4,798 (100.0%) | 3,617 (100.0%) |
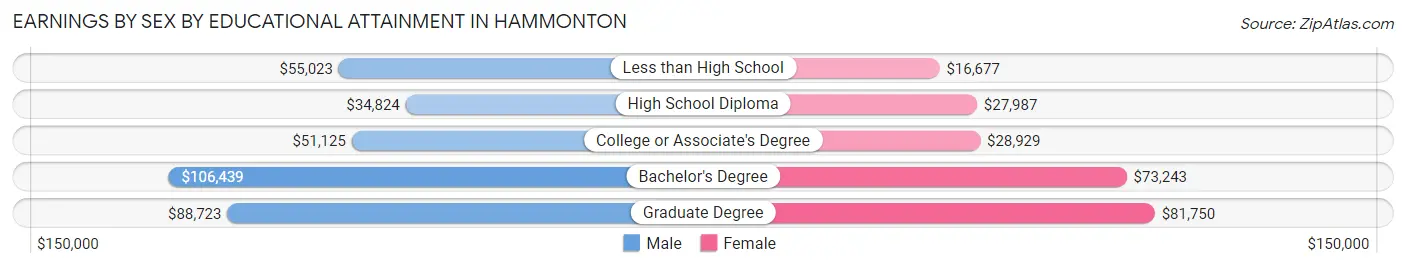
Earnings by Sex by Educational Attainment in Hammonton
Average earnings in Hammonton are $56,250 for men and $37,917 for women, a difference of 32.6%. Men with an educational attainment of bachelor's degree enjoy the highest average annual earnings of $106,439, while those with high school diploma education earn the least with $34,824. Women with an educational attainment of graduate degree earn the most with the average annual earnings of $81,750, while those with less than high school education have the smallest earnings of $16,677.
| Educational Attainment | Male Income | Female Income |
| Less than High School | $55,023 | $16,677 |
| High School Diploma | $34,824 | $27,987 |
| College or Associate's Degree | $51,125 | $28,929 |
| Bachelor's Degree | $106,439 | $73,243 |
| Graduate Degree | $88,723 | $81,750 |
| Total | $56,250 | $37,917 |
Family Income in Hammonton
Family Income Brackets in Hammonton
According to the Hammonton family income data, there are 704 families falling into the $100,000 to $149,999 income range, which is the most common income bracket and makes up 18.6% of all families. Conversely, the $10,000 to $14,999 income bracket is the least frequent group with only 53 families (1.4%) belonging to this category.
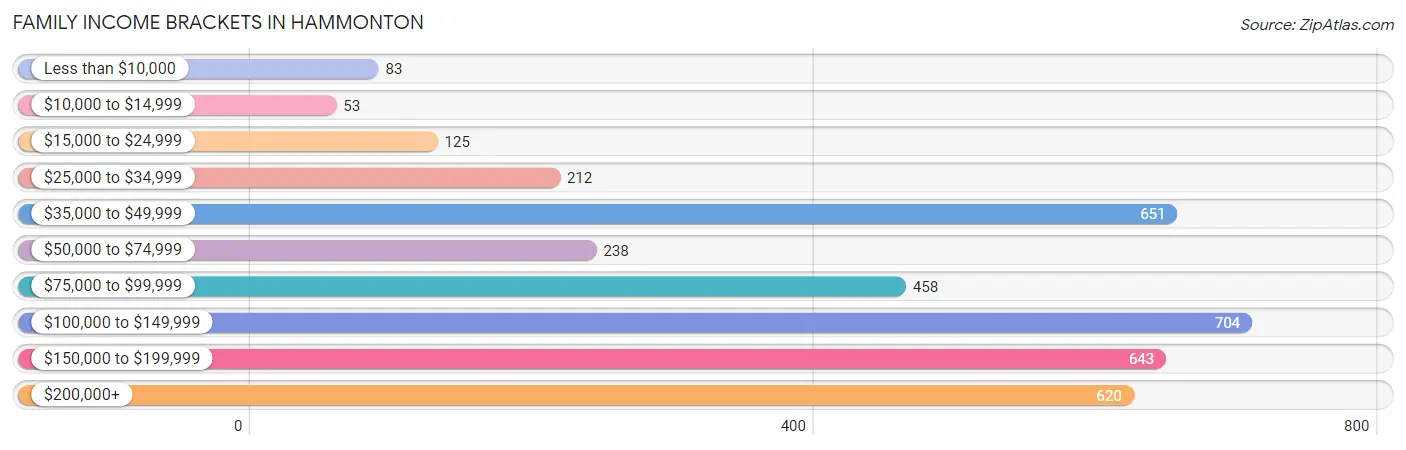
| Income Bracket | # Families | % Families |
| Less than $10,000 | 83 | 2.2% |
| $10,000 to $14,999 | 53 | 1.4% |
| $15,000 to $24,999 | 125 | 3.3% |
| $25,000 to $34,999 | 212 | 5.6% |
| $35,000 to $49,999 | 651 | 17.2% |
| $50,000 to $74,999 | 238 | 6.3% |
| $75,000 to $99,999 | 458 | 12.1% |
| $100,000 to $149,999 | 704 | 18.6% |
| $150,000 to $199,999 | 643 | 17.0% |
| $200,000+ | 620 | 16.4% |
Family Income by Famaliy Size in Hammonton
4-person families (787 | 20.8%) account for the highest median family income in Hammonton with $163,036 per family, while 4-person families (787 | 20.8%) have the highest median income of $40,759 per family member.
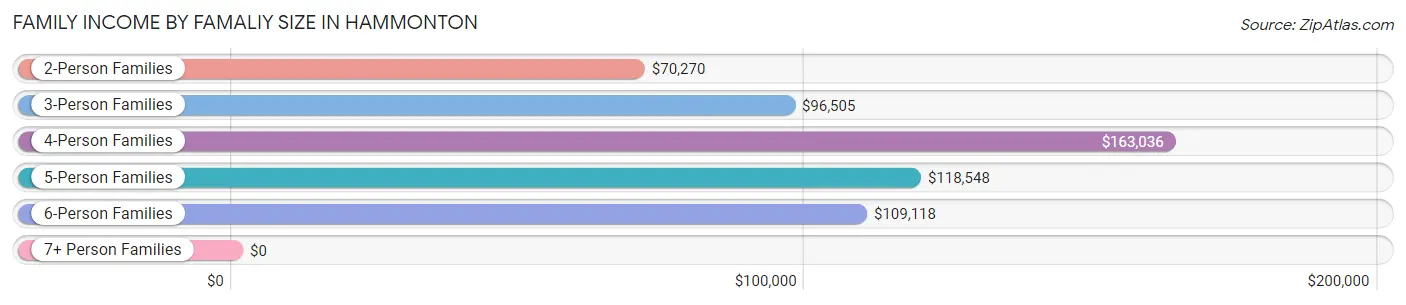
| Income Bracket | # Families | Median Income |
| 2-Person Families | 1,804 (47.7%) | $70,270 |
| 3-Person Families | 747 (19.8%) | $96,505 |
| 4-Person Families | 787 (20.8%) | $163,036 |
| 5-Person Families | 379 (10.0%) | $118,548 |
| 6-Person Families | 66 (1.7%) | $109,118 |
| 7+ Person Families | 0 (0.0%) | $0 |
| Total | 3,783 (100.0%) | $105,625 |
Family Income by Number of Earners in Hammonton
The median family income in Hammonton is $105,625, with families comprising 3+ earners (649) having the highest median family income of $193,299, while families with no earners (724) have the lowest median family income of $42,500, accounting for 17.2% and 19.1% of families, respectively.
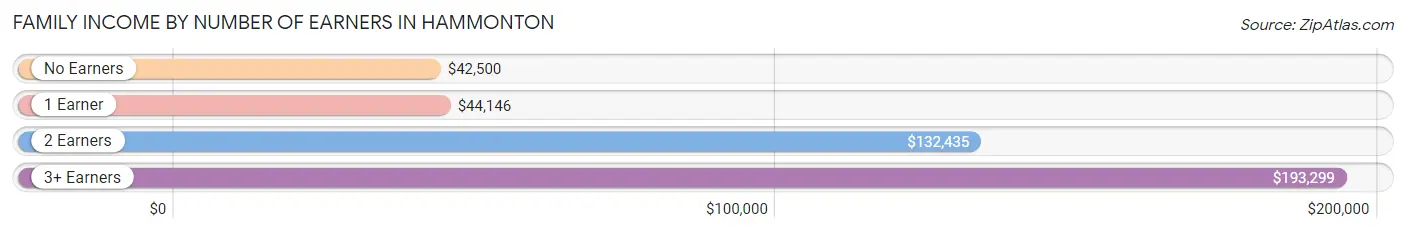
| Number of Earners | # Families | Median Income |
| No Earners | 724 (19.1%) | $42,500 |
| 1 Earner | 793 (21.0%) | $44,146 |
| 2 Earners | 1,617 (42.7%) | $132,435 |
| 3+ Earners | 649 (17.2%) | $193,299 |
| Total | 3,783 (100.0%) | $105,625 |
Household Income in Hammonton
Household Income Brackets in Hammonton
With 926 households falling in the category, the $100,000 to $149,999 income range is the most frequent in Hammonton, accounting for 16.1% of all households. In contrast, only 230 households (4.0%) fall into the less than $10,000 income bracket, making it the least populous group.
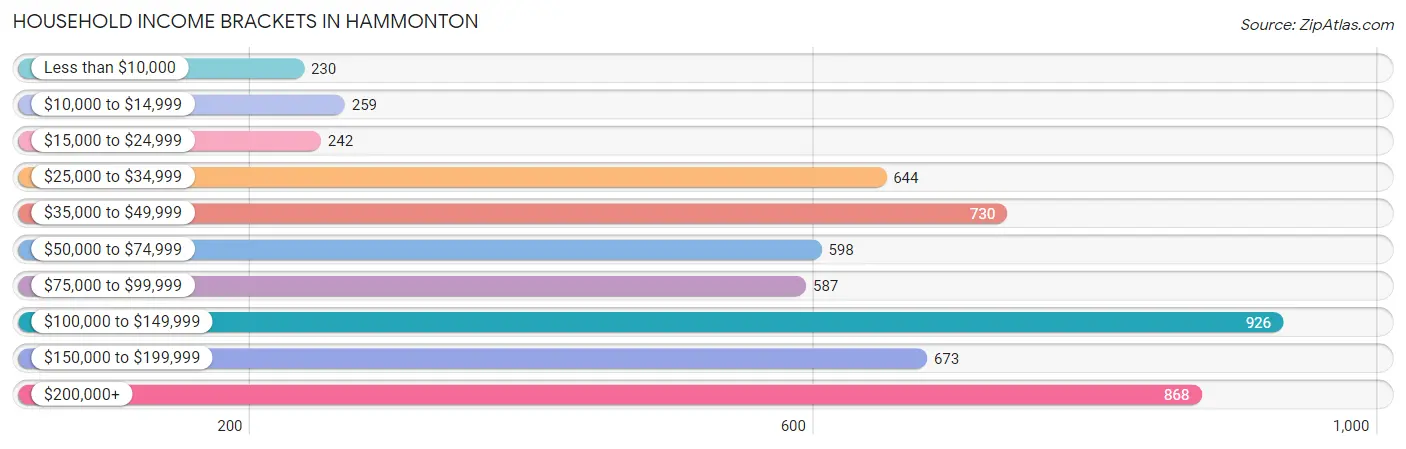
| Income Bracket | # Households | % Households |
| Less than $10,000 | 230 | 4.0% |
| $10,000 to $14,999 | 259 | 4.5% |
| $15,000 to $24,999 | 242 | 4.2% |
| $25,000 to $34,999 | 644 | 11.2% |
| $35,000 to $49,999 | 730 | 12.7% |
| $50,000 to $74,999 | 598 | 10.4% |
| $75,000 to $99,999 | 587 | 10.2% |
| $100,000 to $149,999 | 926 | 16.1% |
| $150,000 to $199,999 | 673 | 11.7% |
| $200,000+ | 868 | 15.1% |
Household Income by Householder Age in Hammonton
The median household income in Hammonton is $79,747, with the highest median household income of $117,027 found in the 25 to 44 years age bracket for the primary householder. A total of 1,558 households (27.1%) fall into this category. Meanwhile, the 15 to 24 years age bracket for the primary householder has the lowest median household income of $0, with 35 households (0.6%) in this group.
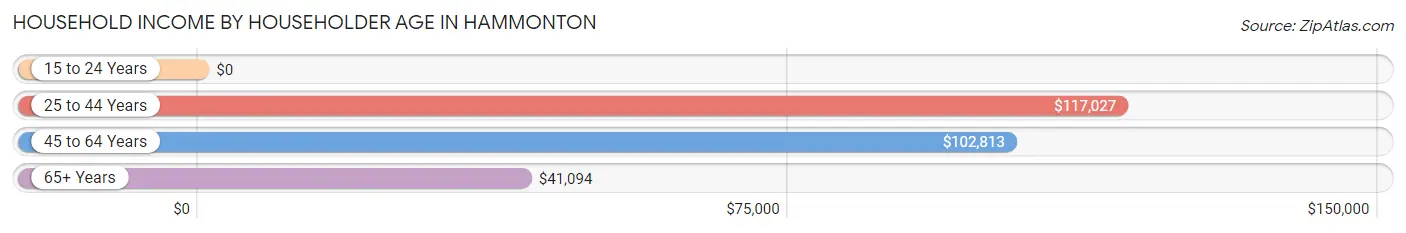
| Income Bracket | # Households | Median Income |
| 15 to 24 Years | 35 (0.6%) | $0 |
| 25 to 44 Years | 1,558 (27.1%) | $117,027 |
| 45 to 64 Years | 2,158 (37.5%) | $102,813 |
| 65+ Years | 2,000 (34.8%) | $41,094 |
| Total | 5,751 (100.0%) | $79,747 |
Poverty in Hammonton
Income Below Poverty by Sex and Age in Hammonton
With 11.0% poverty level for males and 10.2% for females among the residents of Hammonton, 12 to 14 year old males and 65 to 74 year old females are the most vulnerable to poverty, with 138 males (39.3%) and 213 females (24.8%) in their respective age groups living below the poverty level.
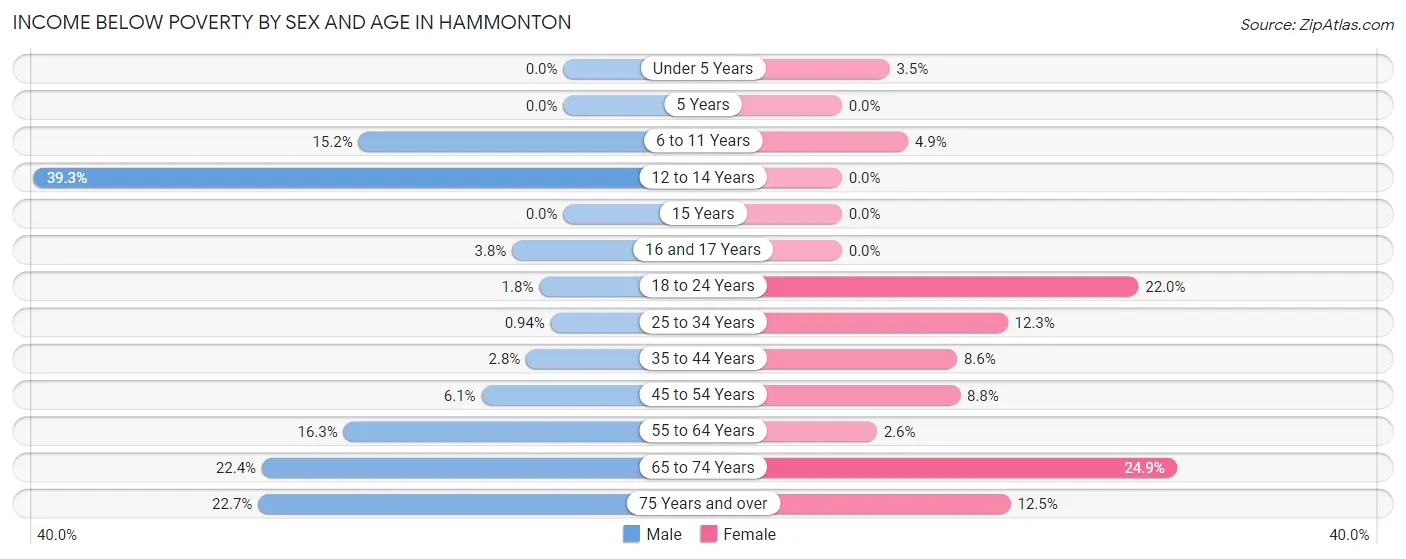
| Age Bracket | Male | Female |
| Under 5 Years | 0 (0.0%) | 13 (3.5%) |
| 5 Years | 0 (0.0%) | 0 (0.0%) |
| 6 to 11 Years | 47 (15.2%) | 25 (4.9%) |
| 12 to 14 Years | 138 (39.3%) | 0 (0.0%) |
| 15 Years | 0 (0.0%) | 0 (0.0%) |
| 16 and 17 Years | 9 (3.8%) | 0 (0.0%) |
| 18 to 24 Years | 10 (1.8%) | 83 (22.0%) |
| 25 to 34 Years | 9 (0.9%) | 98 (12.3%) |
| 35 to 44 Years | 24 (2.8%) | 63 (8.6%) |
| 45 to 54 Years | 71 (6.1%) | 96 (8.8%) |
| 55 to 64 Years | 159 (16.3%) | 22 (2.6%) |
| 65 to 74 Years | 203 (22.4%) | 213 (24.8%) |
| 75 Years and over | 148 (22.7%) | 109 (12.5%) |
| Total | 818 (11.0%) | 722 (10.2%) |
Income Above Poverty by Sex and Age in Hammonton
According to the poverty statistics in Hammonton, males aged under 5 years and females aged 5 years are the age groups that are most secure financially, with 100.0% of males and 100.0% of females in these age groups living above the poverty line.
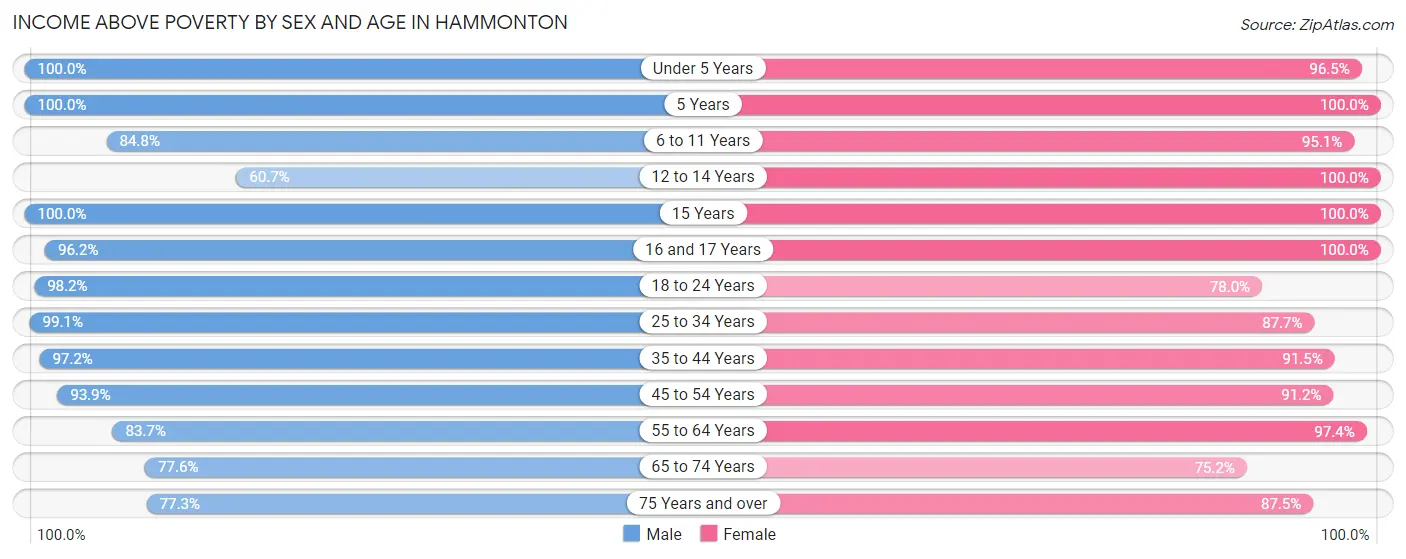
| Age Bracket | Male | Female |
| Under 5 Years | 309 (100.0%) | 354 (96.5%) |
| 5 Years | 39 (100.0%) | 94 (100.0%) |
| 6 to 11 Years | 262 (84.8%) | 484 (95.1%) |
| 12 to 14 Years | 213 (60.7%) | 114 (100.0%) |
| 15 Years | 100 (100.0%) | 153 (100.0%) |
| 16 and 17 Years | 228 (96.2%) | 268 (100.0%) |
| 18 to 24 Years | 550 (98.2%) | 294 (78.0%) |
| 25 to 34 Years | 949 (99.1%) | 698 (87.7%) |
| 35 to 44 Years | 845 (97.2%) | 674 (91.4%) |
| 45 to 54 Years | 1,097 (93.9%) | 997 (91.2%) |
| 55 to 64 Years | 815 (83.7%) | 829 (97.4%) |
| 65 to 74 Years | 704 (77.6%) | 644 (75.1%) |
| 75 Years and over | 505 (77.3%) | 761 (87.5%) |
| Total | 6,616 (89.0%) | 6,364 (89.8%) |
Income Below Poverty Among Married-Couple Families in Hammonton
The poverty statistics for married-couple families in Hammonton show that 3.2% or 86 of the total 2,711 families live below the poverty line. Families with no children have the highest poverty rate of 5.5%, comprising of 86 families. On the other hand, families with 1 or 2 children have the lowest poverty rate of 0.0%, which includes 0 families.
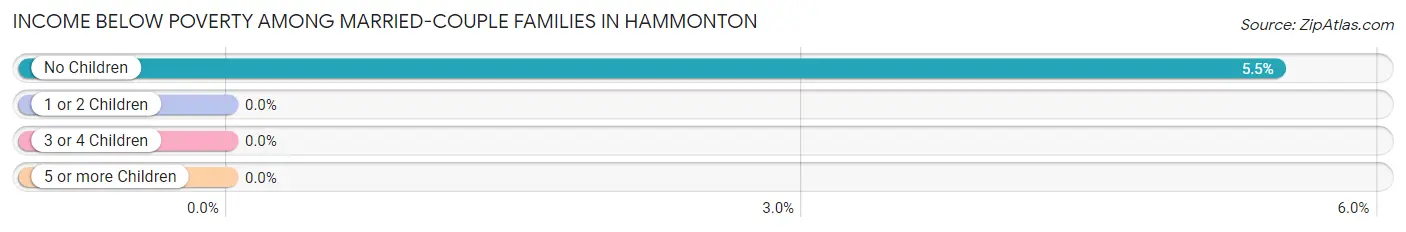
| Children | Above Poverty | Below Poverty |
| No Children | 1,487 (94.5%) | 86 (5.5%) |
| 1 or 2 Children | 972 (100.0%) | 0 (0.0%) |
| 3 or 4 Children | 166 (100.0%) | 0 (0.0%) |
| 5 or more Children | 0 (0.0%) | 0 (0.0%) |
| Total | 2,625 (96.8%) | 86 (3.2%) |
Income Below Poverty Among Single-Parent Households in Hammonton
According to the poverty data in Hammonton, 4.9% or 15 single-father households and 20.4% or 156 single-mother households are living below the poverty line. Among single-father households, those with no children have the highest poverty rate, with 15 households (9.1%) experiencing poverty. Likewise, among single-mother households, those with 3 or 4 children have the highest poverty rate, with 11 households (68.8%) falling below the poverty line.
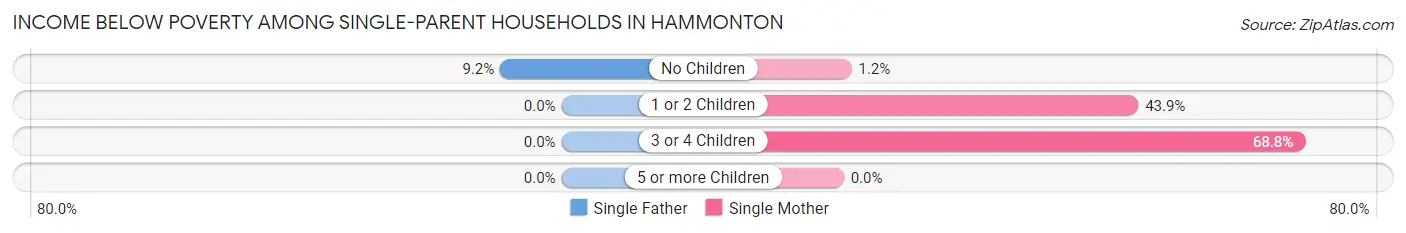
| Children | Single Father | Single Mother |
| No Children | 15 (9.1%) | 5 (1.2%) |
| 1 or 2 Children | 0 (0.0%) | 140 (43.9%) |
| 3 or 4 Children | 0 (0.0%) | 11 (68.8%) |
| 5 or more Children | 0 (0.0%) | 0 (0.0%) |
| Total | 15 (4.9%) | 156 (20.4%) |
Income Below Poverty Among Married-Couple vs Single-Parent Households in Hammonton
The poverty data for Hammonton shows that 86 of the married-couple family households (3.2%) and 171 of the single-parent households (16.0%) are living below the poverty level. Within the married-couple family households, those with no children have the highest poverty rate, with 86 households (5.5%) falling below the poverty line. Among the single-parent households, those with 1 or 2 children have the highest poverty rate, with 140 household (34.0%) living below poverty.
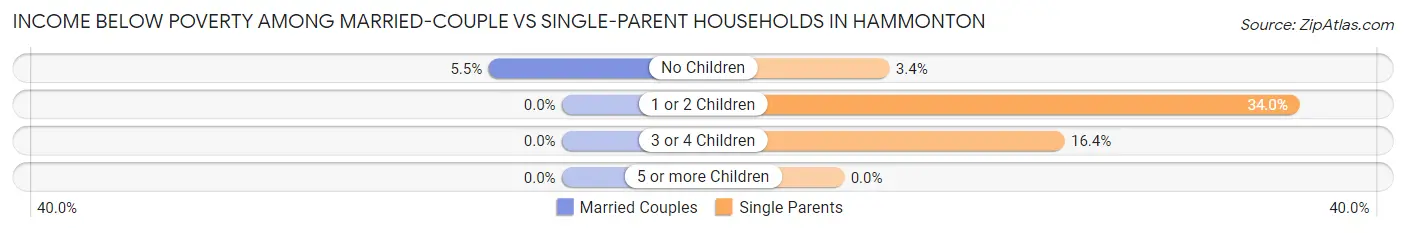
| Children | Married-Couple Families | Single-Parent Households |
| No Children | 86 (5.5%) | 20 (3.4%) |
| 1 or 2 Children | 0 (0.0%) | 140 (34.0%) |
| 3 or 4 Children | 0 (0.0%) | 11 (16.4%) |
| 5 or more Children | 0 (0.0%) | 0 (0.0%) |
| Total | 86 (3.2%) | 171 (16.0%) |
Race in Hammonton
The most populous races in Hammonton are White / Caucasian (11,199 | 76.0%), Hispanic or Latino (3,637 | 24.7%), and Some other Race (2,184 | 14.8%).
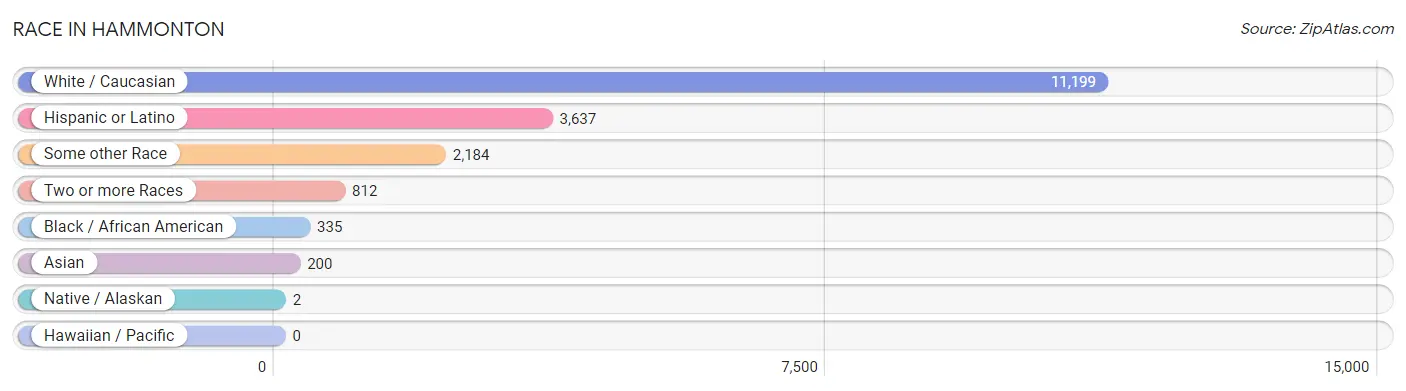
| Race | # Population | % Population |
| Asian | 200 | 1.4% |
| Black / African American | 335 | 2.3% |
| Hawaiian / Pacific | 0 | 0.0% |
| Hispanic or Latino | 3,637 | 24.7% |
| Native / Alaskan | 2 | 0.0% |
| White / Caucasian | 11,199 | 76.0% |
| Two or more Races | 812 | 5.5% |
| Some other Race | 2,184 | 14.8% |
| Total | 14,732 | 100.0% |
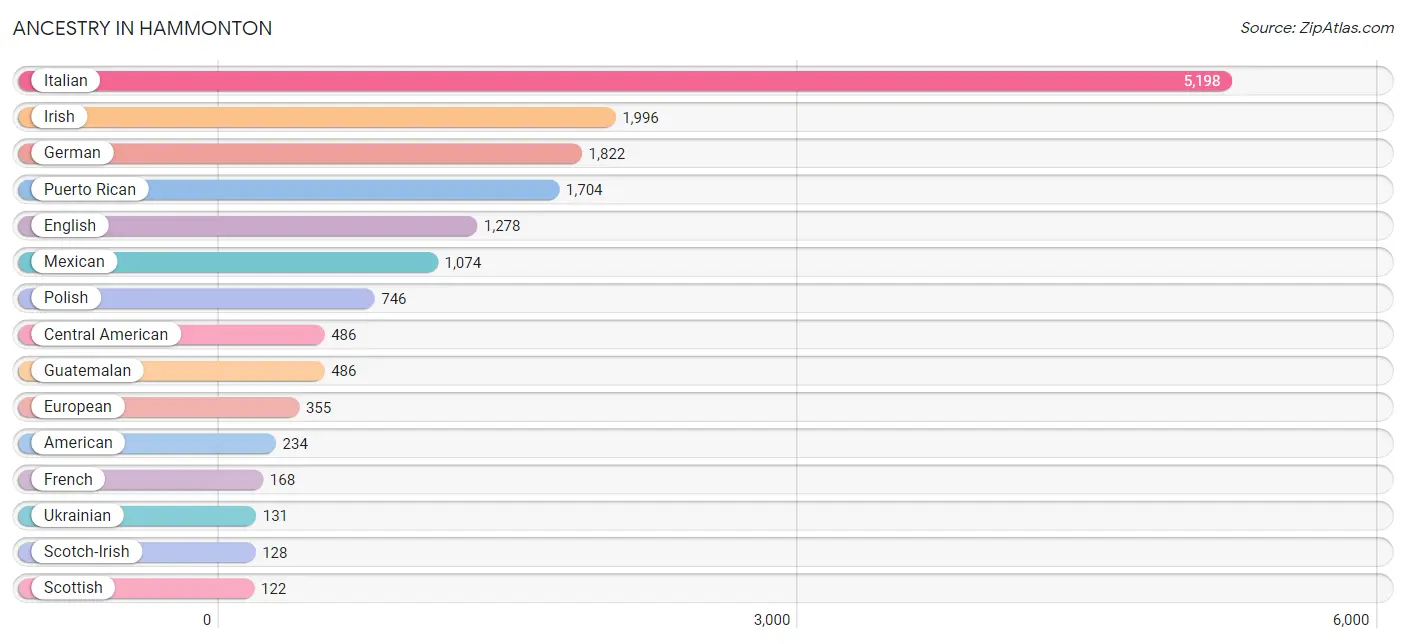
Ancestry in Hammonton
The most populous ancestries reported in Hammonton are Italian (5,198 | 35.3%), Irish (1,996 | 13.6%), German (1,822 | 12.4%), Puerto Rican (1,704 | 11.6%), and English (1,278 | 8.7%), together accounting for 81.4% of all Hammonton residents.
| Ancestry | # Population | % Population |
| American | 234 | 1.6% |
| Arab | 44 | 0.3% |
| Austrian | 13 | 0.1% |
| Bhutanese | 43 | 0.3% |
| Blackfeet | 9 | 0.1% |
| British | 21 | 0.1% |
| Burmese | 35 | 0.2% |
| Canadian | 7 | 0.1% |
| Central American | 486 | 3.3% |
| Cherokee | 12 | 0.1% |
| Chilean | 15 | 0.1% |
| Chippewa | 2 | 0.0% |
| Colombian | 15 | 0.1% |
| Croatian | 12 | 0.1% |
| Cuban | 61 | 0.4% |
| Czech | 12 | 0.1% |
| Dominican | 113 | 0.8% |
| Dutch | 117 | 0.8% |
| Eastern European | 11 | 0.1% |
| English | 1,278 | 8.7% |
| European | 355 | 2.4% |
| Filipino | 18 | 0.1% |
| French | 168 | 1.1% |
| French Canadian | 8 | 0.1% |
| German | 1,822 | 12.4% |
| Greek | 121 | 0.8% |
| Guatemalan | 486 | 3.3% |
| Guyanese | 4 | 0.0% |
| Haitian | 39 | 0.3% |
| Hungarian | 7 | 0.1% |
| Indian (Asian) | 24 | 0.2% |
| Irish | 1,996 | 13.6% |
| Italian | 5,198 | 35.3% |
| Korean | 116 | 0.8% |
| Lebanese | 44 | 0.3% |
| Maltese | 10 | 0.1% |
| Mexican | 1,074 | 7.3% |
| Nigerian | 9 | 0.1% |
| Norwegian | 59 | 0.4% |
| Pennsylvania German | 74 | 0.5% |
| Peruvian | 50 | 0.3% |
| Polish | 746 | 5.1% |
| Portuguese | 47 | 0.3% |
| Puerto Rican | 1,704 | 11.6% |
| Russian | 115 | 0.8% |
| Scandinavian | 46 | 0.3% |
| Scotch-Irish | 128 | 0.9% |
| Scottish | 122 | 0.8% |
| Slovak | 9 | 0.1% |
| South American | 84 | 0.6% |
| Spaniard | 98 | 0.7% |
| Spanish | 7 | 0.1% |
| Sri Lankan | 9 | 0.1% |
| Subsaharan African | 9 | 0.1% |
| Swedish | 81 | 0.5% |
| Swiss | 19 | 0.1% |
| Turkish | 11 | 0.1% |
| Ukrainian | 131 | 0.9% | View All 58 Rows |
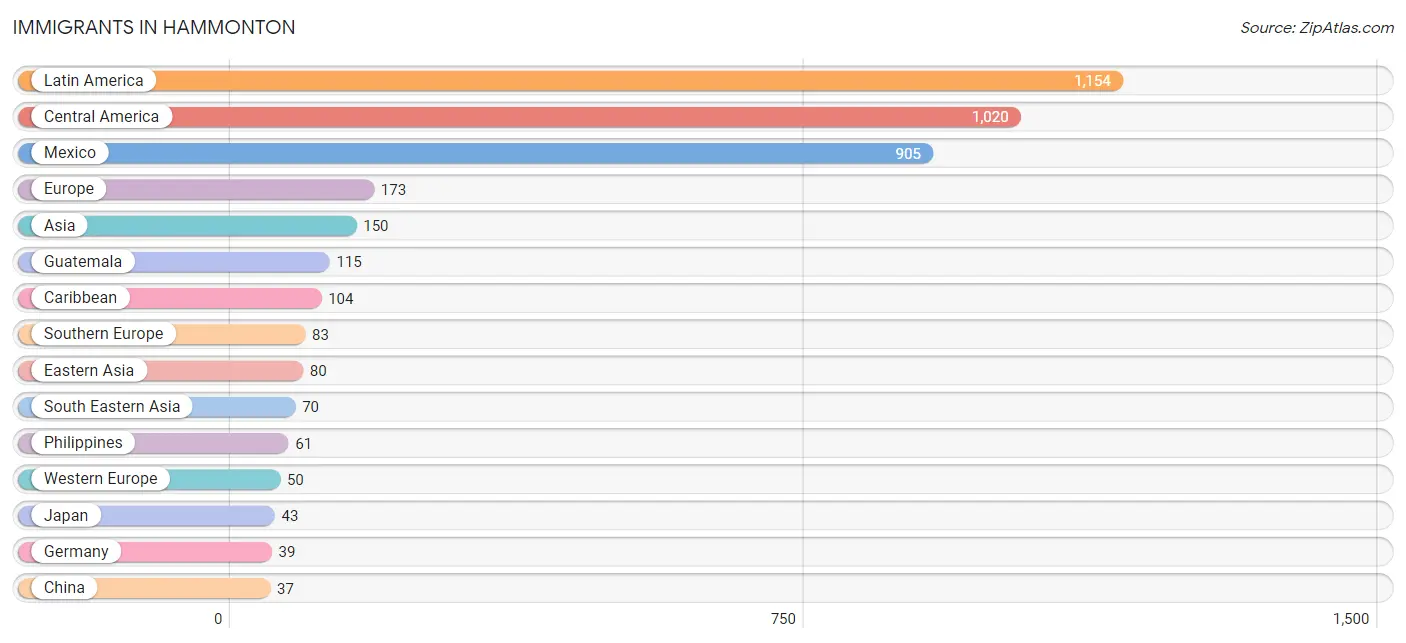
Immigrants in Hammonton
The most numerous immigrant groups reported in Hammonton came from Latin America (1,154 | 7.8%), Central America (1,020 | 6.9%), Mexico (905 | 6.1%), Europe (173 | 1.2%), and Asia (150 | 1.0%), together accounting for 23.1% of all Hammonton residents.
| Immigration Origin | # Population | % Population |
| Africa | 20 | 0.1% |
| Asia | 150 | 1.0% |
| Caribbean | 104 | 0.7% |
| Central America | 1,020 | 6.9% |
| Chile | 15 | 0.1% |
| China | 37 | 0.3% |
| Congo | 11 | 0.1% |
| Croatia | 12 | 0.1% |
| Cuba | 34 | 0.2% |
| Dominican Republic | 37 | 0.3% |
| Eastern Asia | 80 | 0.5% |
| Eastern Europe | 18 | 0.1% |
| England | 12 | 0.1% |
| Europe | 173 | 1.2% |
| Germany | 39 | 0.3% |
| Greece | 13 | 0.1% |
| Guatemala | 115 | 0.8% |
| Guyana | 4 | 0.0% |
| Haiti | 27 | 0.2% |
| Italy | 28 | 0.2% |
| Jamaica | 6 | 0.0% |
| Japan | 43 | 0.3% |
| Latin America | 1,154 | 7.8% |
| Mexico | 905 | 6.1% |
| Middle Africa | 11 | 0.1% |
| Netherlands | 11 | 0.1% |
| Nigeria | 9 | 0.1% |
| Northern Europe | 22 | 0.2% |
| Oceania | 11 | 0.1% |
| Peru | 11 | 0.1% |
| Philippines | 61 | 0.4% |
| Portugal | 32 | 0.2% |
| South America | 30 | 0.2% |
| South Eastern Asia | 70 | 0.5% |
| Southern Europe | 83 | 0.6% |
| Sweden | 10 | 0.1% |
| Taiwan | 18 | 0.1% |
| Ukraine | 6 | 0.0% |
| Vietnam | 9 | 0.1% |
| Western Africa | 9 | 0.1% |
| Western Europe | 50 | 0.3% | View All 41 Rows |
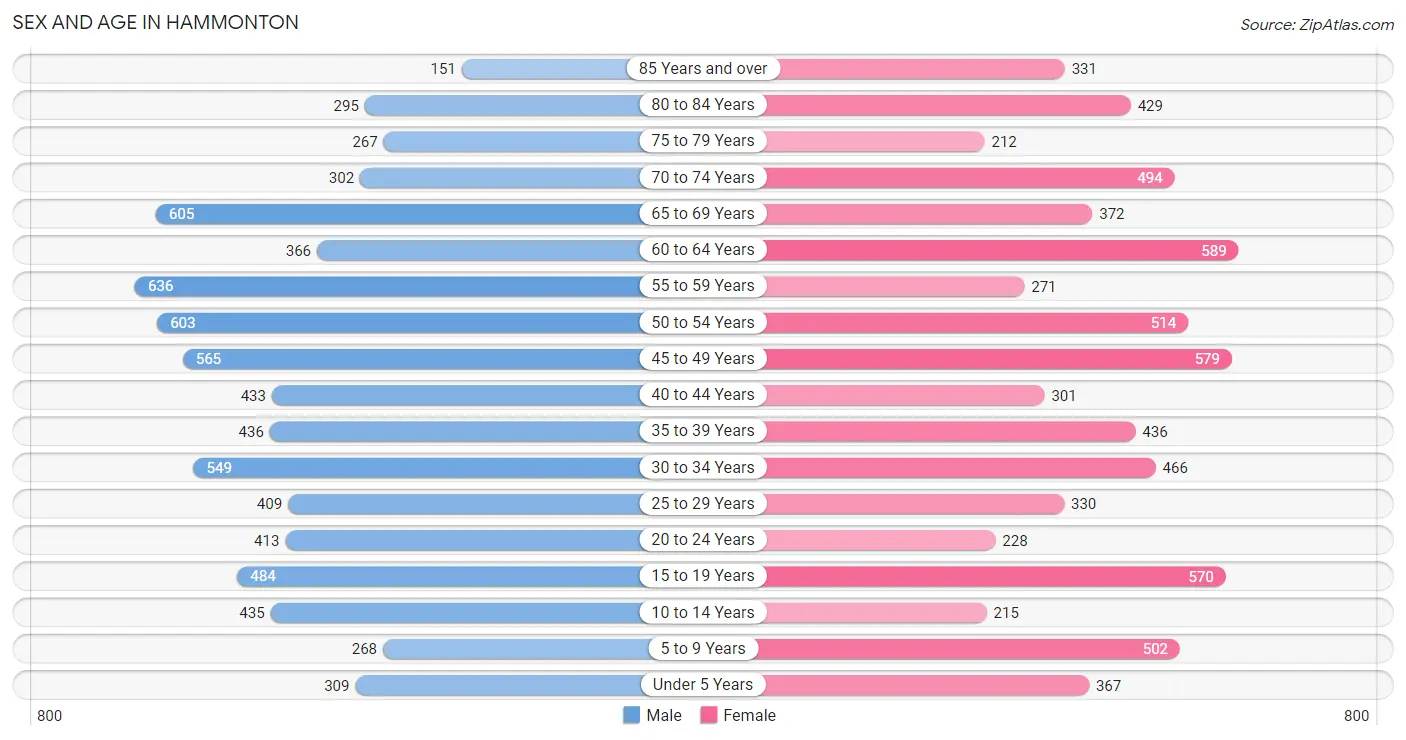
Sex and Age in Hammonton
Sex and Age in Hammonton
The most populous age groups in Hammonton are 55 to 59 Years (636 | 8.5%) for men and 60 to 64 Years (589 | 8.2%) for women.
| Age Bracket | Male | Female |
| Under 5 Years | 309 (4.1%) | 367 (5.1%) |
| 5 to 9 Years | 268 (3.6%) | 502 (7.0%) |
| 10 to 14 Years | 435 (5.8%) | 215 (3.0%) |
| 15 to 19 Years | 484 (6.4%) | 570 (7.9%) |
| 20 to 24 Years | 413 (5.5%) | 228 (3.2%) |
| 25 to 29 Years | 409 (5.4%) | 330 (4.6%) |
| 30 to 34 Years | 549 (7.3%) | 466 (6.5%) |
| 35 to 39 Years | 436 (5.8%) | 436 (6.0%) |
| 40 to 44 Years | 433 (5.8%) | 301 (4.2%) |
| 45 to 49 Years | 565 (7.5%) | 579 (8.0%) |
| 50 to 54 Years | 603 (8.0%) | 514 (7.1%) |
| 55 to 59 Years | 636 (8.5%) | 271 (3.8%) |
| 60 to 64 Years | 366 (4.9%) | 589 (8.2%) |
| 65 to 69 Years | 605 (8.0%) | 372 (5.2%) |
| 70 to 74 Years | 302 (4.0%) | 494 (6.9%) |
| 75 to 79 Years | 267 (3.5%) | 212 (2.9%) |
| 80 to 84 Years | 295 (3.9%) | 429 (5.9%) |
| 85 Years and over | 151 (2.0%) | 331 (4.6%) |
| Total | 7,526 (100.0%) | 7,206 (100.0%) |
Families and Households in Hammonton
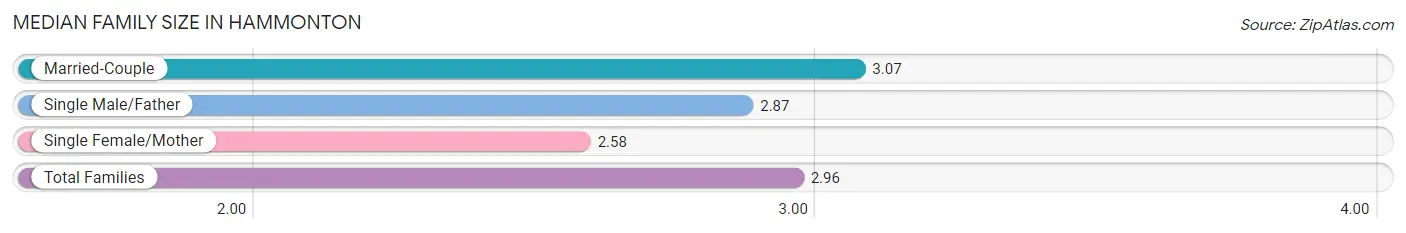
Median Family Size in Hammonton
The median family size in Hammonton is 2.96 persons per family, with married-couple families (2,711 | 71.7%) accounting for the largest median family size of 3.07 persons per family. On the other hand, single female/mother families (764 | 20.2%) represent the smallest median family size with 2.58 persons per family.
| Family Type | # Families | Family Size |
| Married-Couple | 2,711 (71.7%) | 3.07 |
| Single Male/Father | 308 (8.1%) | 2.87 |
| Single Female/Mother | 764 (20.2%) | 2.58 |
| Total Families | 3,783 (100.0%) | 2.96 |
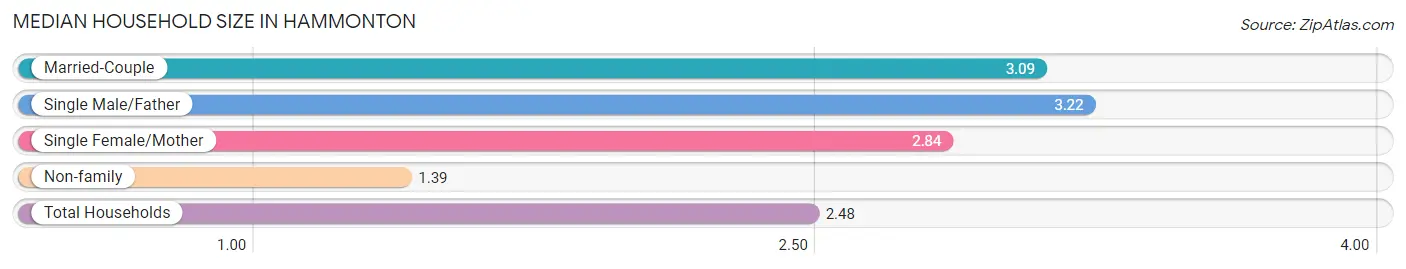
Median Household Size in Hammonton
The median household size in Hammonton is 2.48 persons per household, with single male/father households (308 | 5.4%) accounting for the largest median household size of 3.22 persons per household. non-family households (1,968 | 34.2%) represent the smallest median household size with 1.39 persons per household.
| Household Type | # Households | Household Size |
| Married-Couple | 2,711 (47.1%) | 3.09 |
| Single Male/Father | 308 (5.4%) | 3.22 |
| Single Female/Mother | 764 (13.3%) | 2.84 |
| Non-family | 1,968 (34.2%) | 1.39 |
| Total Households | 5,751 (100.0%) | 2.48 |
Household Size by Marriage Status in Hammonton
Out of a total of 5,751 households in Hammonton, 3,783 (65.8%) are family households, while 1,968 (34.2%) are nonfamily households. The most numerous type of family households are 2-person households, comprising 1,714, and the most common type of nonfamily households are 1-person households, comprising 1,419.
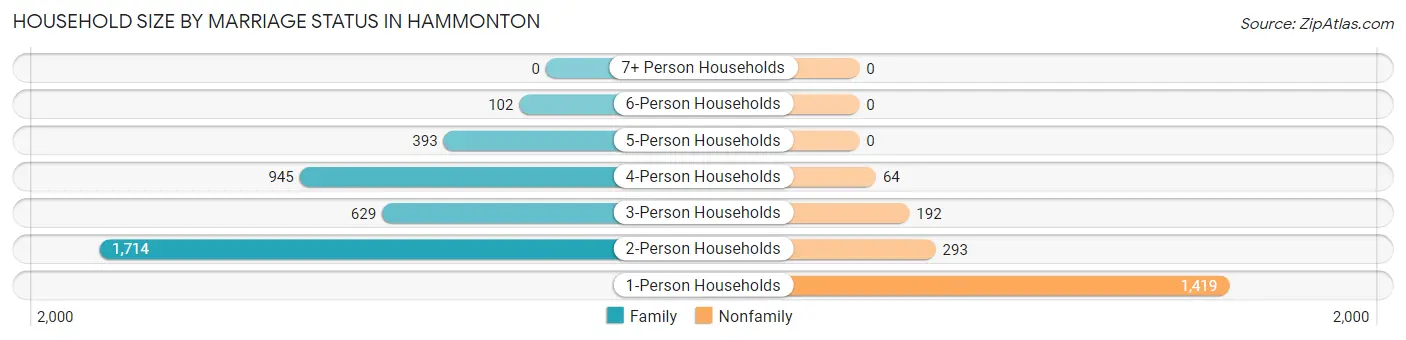
| Household Size | Family Households | Nonfamily Households |
| 1-Person Households | - | 1,419 (24.7%) |
| 2-Person Households | 1,714 (29.8%) | 293 (5.1%) |
| 3-Person Households | 629 (10.9%) | 192 (3.3%) |
| 4-Person Households | 945 (16.4%) | 64 (1.1%) |
| 5-Person Households | 393 (6.8%) | 0 (0.0%) |
| 6-Person Households | 102 (1.8%) | 0 (0.0%) |
| 7+ Person Households | 0 (0.0%) | 0 (0.0%) |
| Total | 3,783 (65.8%) | 1,968 (34.2%) |
Female Fertility in Hammonton
Fertility by Age in Hammonton
Average fertility rate in Hammonton is 41.0 births per 1,000 women. Women in the age bracket of 20 to 34 years have the highest fertility rate with 93.0 births per 1,000 women. Women in the age bracket of 20 to 34 years acount for 77.2% of all women with births.
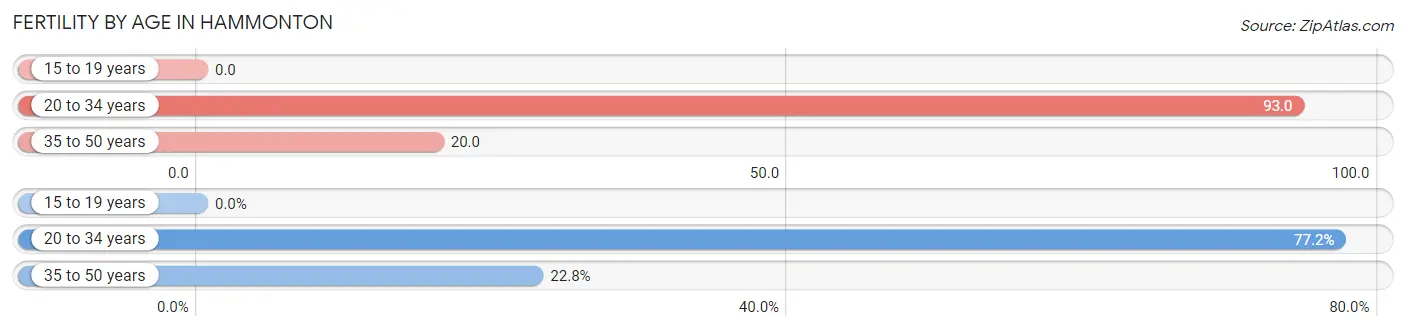
| Age Bracket | Women with Births | Births / 1,000 Women |
| 15 to 19 years | 0 (0.0%) | 0.0 |
| 20 to 34 years | 95 (77.2%) | 93.0 |
| 35 to 50 years | 28 (22.8%) | 20.0 |
| Total | 123 (100.0%) | 41.0 |
Fertility by Age by Marriage Status in Hammonton
91.9% of women with births (123) in Hammonton are married. The highest percentage of unmarried women with births falls into 35 to 50 years age bracket with 35.7% of them unmarried at the time of birth, while the lowest percentage of unmarried women with births belong to 20 to 34 years age bracket with 0.0% of them unmarried.
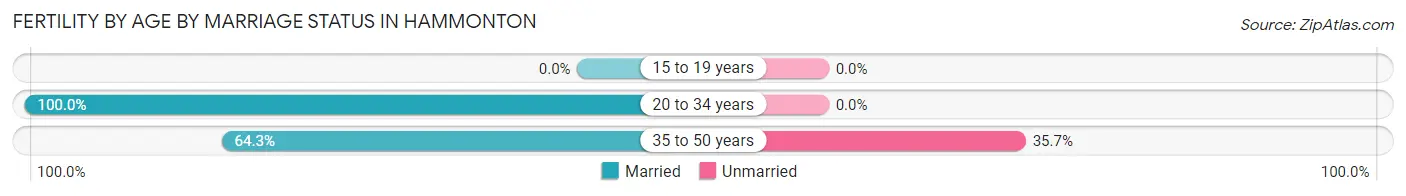
| Age Bracket | Married | Unmarried |
| 15 to 19 years | 0 (0.0%) | 0 (0.0%) |
| 20 to 34 years | 95 (100.0%) | 0 (0.0%) |
| 35 to 50 years | 18 (64.3%) | 10 (35.7%) |
| Total | 113 (91.9%) | 10 (8.1%) |
Fertility by Education in Hammonton
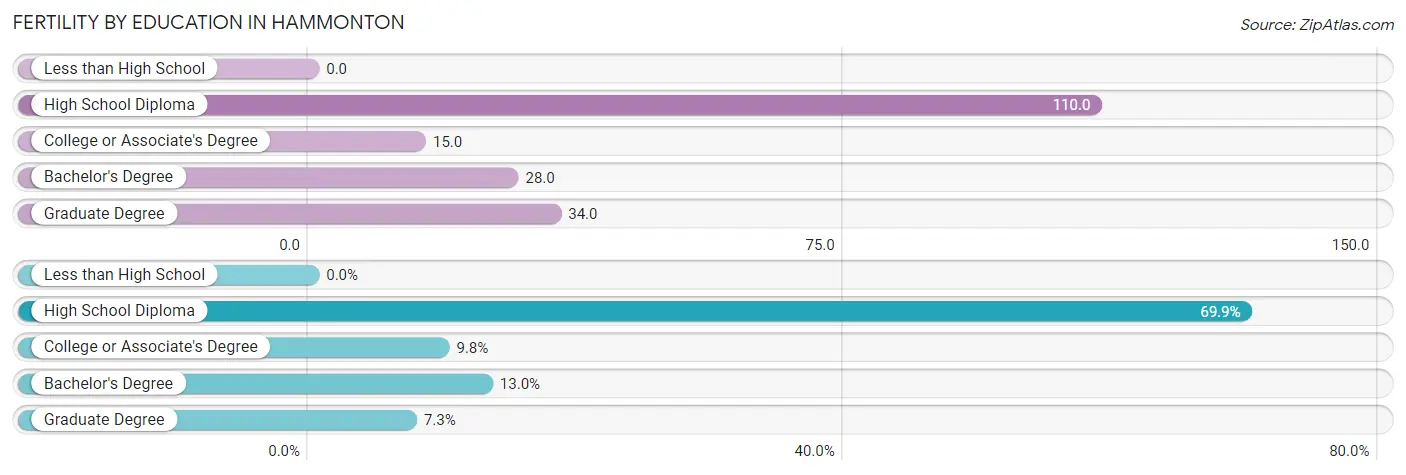
| Educational Attainment | Women with Births | Births / 1,000 Women |
| Less than High School | 0 (0.0%) | 0.0 |
| High School Diploma | 86 (69.9%) | 110.0 |
| College or Associate's Degree | 12 (9.8%) | 15.0 |
| Bachelor's Degree | 16 (13.0%) | 28.0 |
| Graduate Degree | 9 (7.3%) | 34.0 |
| Total | 123 (100.0%) | 41.0 |
Fertility by Education by Marriage Status in Hammonton
8.1% of women with births in Hammonton are unmarried. Women with the educational attainment of college or associate's degree are most likely to be married with 100.0% of them married at childbirth, while women with the educational attainment of high school diploma are least likely to be married with 11.6% of them unmarried at childbirth.
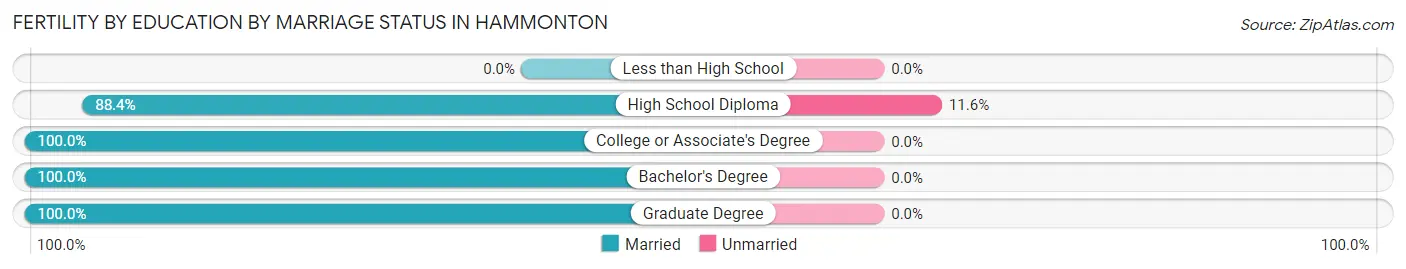
| Educational Attainment | Married | Unmarried |
| Less than High School | 0 (0.0%) | 0 (0.0%) |
| High School Diploma | 76 (88.4%) | 10 (11.6%) |
| College or Associate's Degree | 12 (100.0%) | 0 (0.0%) |
| Bachelor's Degree | 16 (100.0%) | 0 (0.0%) |
| Graduate Degree | 9 (100.0%) | 0 (0.0%) |
| Total | 113 (91.9%) | 10 (8.1%) |
Employment Characteristics in Hammonton
Employment by Class of Employer in Hammonton
Among the 7,248 employed individuals in Hammonton, private company employees (4,900 | 67.6%), local government employees (945 | 13.0%), and not-for-profit organizations (369 | 5.1%) make up the most common classes of employment.
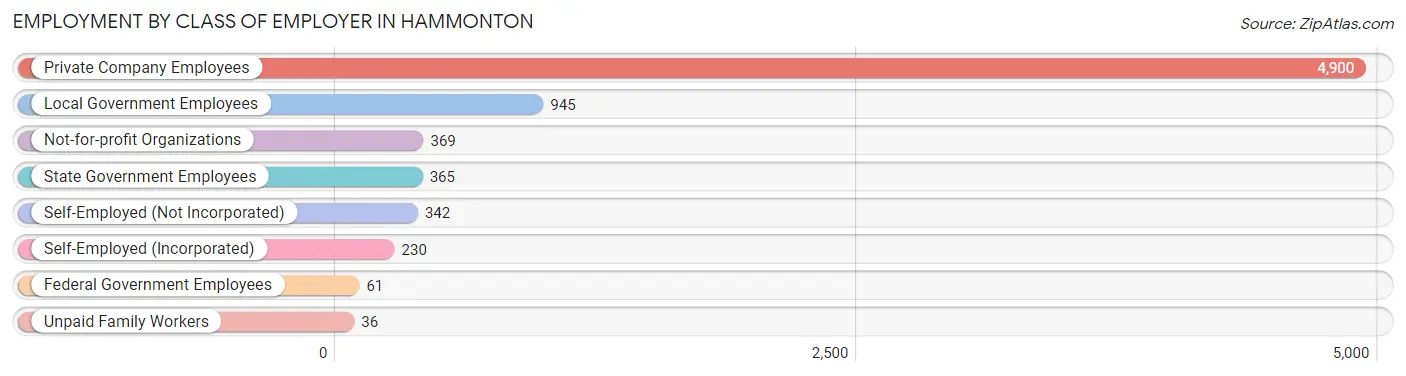
| Employer Class | # Employees | % Employees |
| Private Company Employees | 4,900 | 67.6% |
| Self-Employed (Incorporated) | 230 | 3.2% |
| Self-Employed (Not Incorporated) | 342 | 4.7% |
| Not-for-profit Organizations | 369 | 5.1% |
| Local Government Employees | 945 | 13.0% |
| State Government Employees | 365 | 5.0% |
| Federal Government Employees | 61 | 0.8% |
| Unpaid Family Workers | 36 | 0.5% |
| Total | 7,248 | 100.0% |
Employment Status by Age in Hammonton
According to the labor force statistics for Hammonton, out of the total population over 16 years of age (12,383), 65.7% or 8,136 individuals are in the labor force, with 7.4% or 602 of them unemployed. The age group with the highest labor force participation rate is 30 to 34 years, with 99.5% or 1,010 individuals in the labor force. Within the labor force, the 20 to 24 years age range has the highest percentage of unemployed individuals, with 31.8% or 188 of them being unemployed.
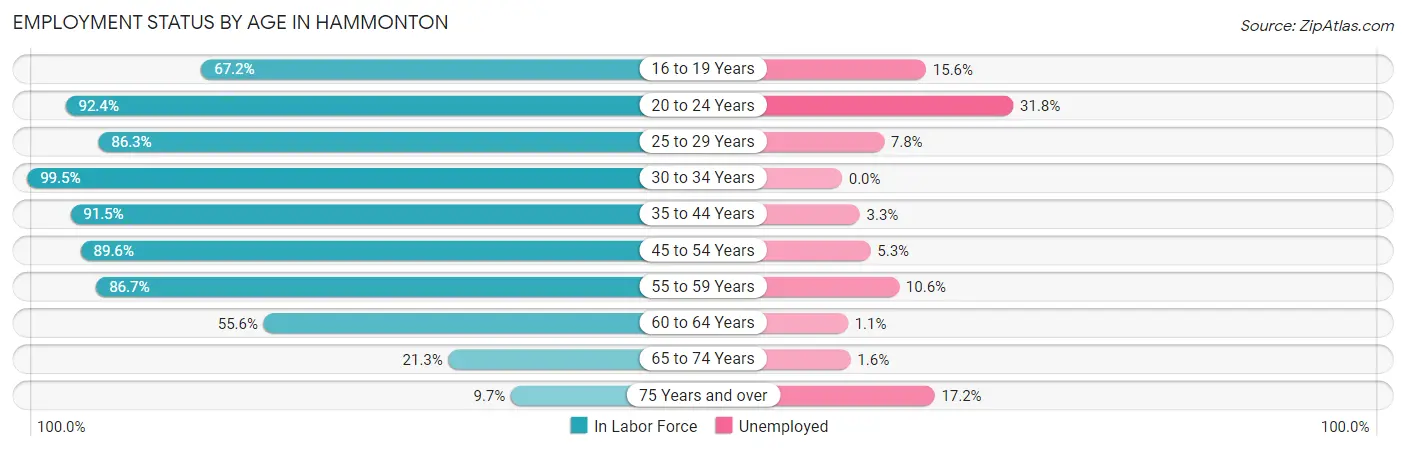
| Age Bracket | In Labor Force | Unemployed |
| 16 to 19 Years | 538 (67.2%) | 84 (15.6%) |
| 20 to 24 Years | 592 (92.4%) | 188 (31.8%) |
| 25 to 29 Years | 638 (86.3%) | 50 (7.8%) |
| 30 to 34 Years | 1,010 (99.5%) | 0 (0.0%) |
| 35 to 44 Years | 1,469 (91.5%) | 48 (3.3%) |
| 45 to 54 Years | 2,026 (89.6%) | 107 (5.3%) |
| 55 to 59 Years | 786 (86.7%) | 83 (10.6%) |
| 60 to 64 Years | 531 (55.6%) | 6 (1.1%) |
| 65 to 74 Years | 378 (21.3%) | 6 (1.6%) |
| 75 Years and over | 163 (9.7%) | 28 (17.2%) |
| Total | 8,136 (65.7%) | 602 (7.4%) |
Employment Status by Educational Attainment in Hammonton
According to labor force statistics for Hammonton, 86.3% of individuals (6,458) out of the total population between 25 and 64 years of age (7,483) are in the labor force, with 4.6% or 297 of them being unemployed. The group with the highest labor force participation rate are those with the educational attainment of bachelor's degree or higher, with 94.4% or 2,426 individuals in the labor force. Within the labor force, individuals with college / associate degree education have the highest percentage of unemployment, with 8.3% or 126 of them being unemployed.
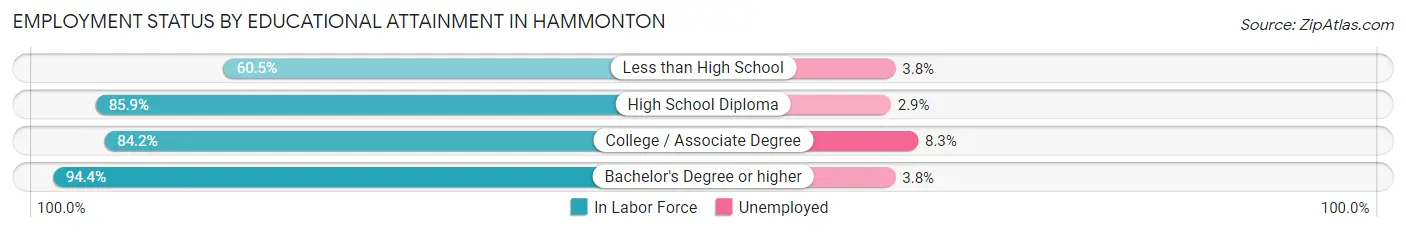
| Educational Attainment | In Labor Force | Unemployed |
| Less than High School | 371 (60.5%) | 23 (3.8%) |
| High School Diploma | 2,140 (85.9%) | 72 (2.9%) |
| College / Associate Degree | 1,523 (84.2%) | 150 (8.3%) |
| Bachelor's Degree or higher | 2,426 (94.4%) | 98 (3.8%) |
| Total | 6,458 (86.3%) | 344 (4.6%) |
Employment Occupations by Sex in Hammonton
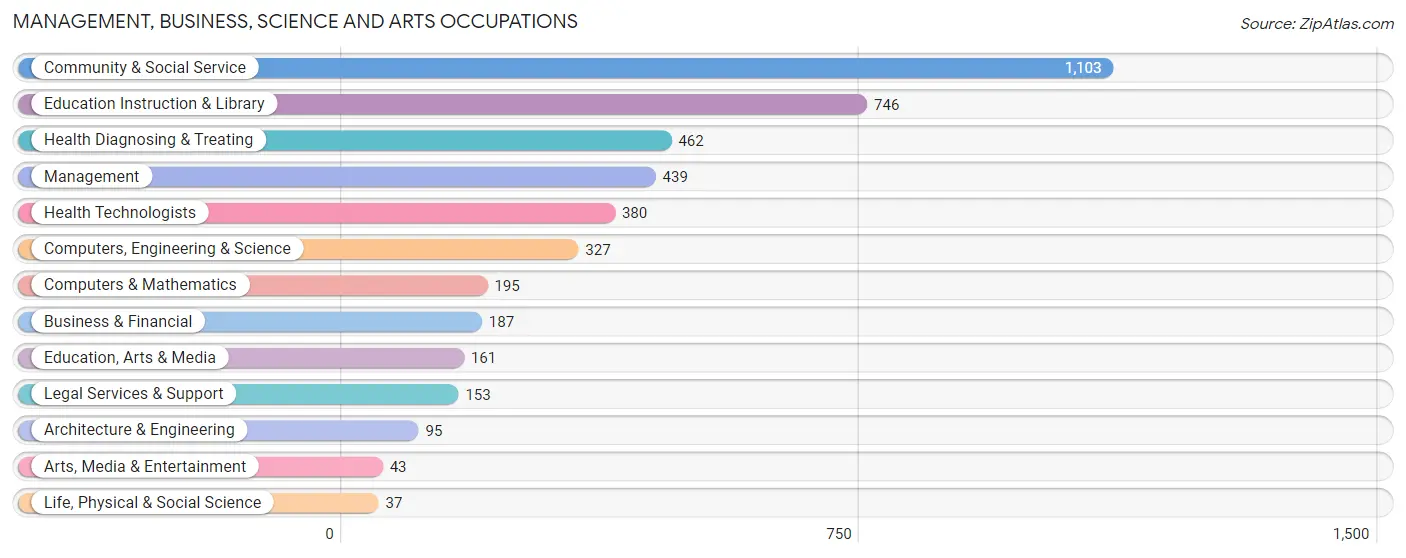
Management, Business, Science and Arts Occupations
The most common Management, Business, Science and Arts occupations in Hammonton are Community & Social Service (1,103 | 14.6%), Education Instruction & Library (746 | 9.9%), Health Diagnosing & Treating (462 | 6.1%), Management (439 | 5.8%), and Health Technologists (380 | 5.1%).
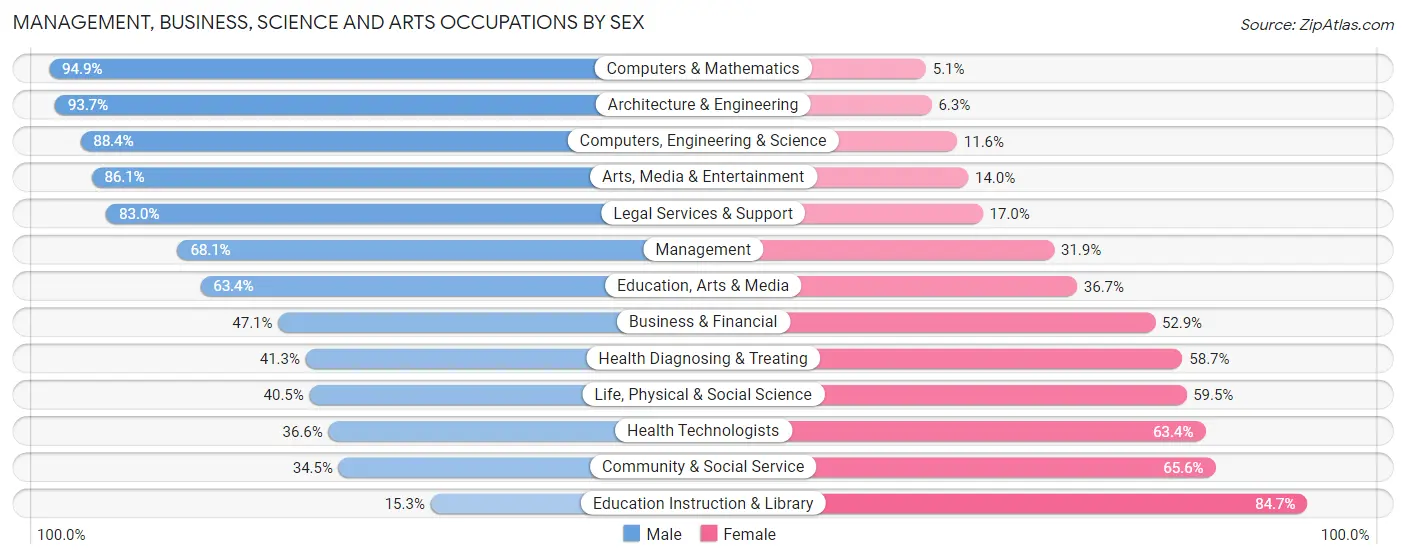
Management, Business, Science and Arts Occupations by Sex
Within the Management, Business, Science and Arts occupations in Hammonton, the most male-oriented occupations are Computers & Mathematics (94.9%), Architecture & Engineering (93.7%), and Computers, Engineering & Science (88.4%), while the most female-oriented occupations are Education Instruction & Library (84.7%), Community & Social Service (65.5%), and Health Technologists (63.4%).
| Occupation | Male | Female |
| Management | 299 (68.1%) | 140 (31.9%) |
| Business & Financial | 88 (47.1%) | 99 (52.9%) |
| Computers, Engineering & Science | 289 (88.4%) | 38 (11.6%) |
| Computers & Mathematics | 185 (94.9%) | 10 (5.1%) |
| Architecture & Engineering | 89 (93.7%) | 6 (6.3%) |
| Life, Physical & Social Science | 15 (40.5%) | 22 (59.5%) |
| Community & Social Service | 380 (34.4%) | 723 (65.5%) |
| Education, Arts & Media | 102 (63.3%) | 59 (36.6%) |
| Legal Services & Support | 127 (83.0%) | 26 (17.0%) |
| Education Instruction & Library | 114 (15.3%) | 632 (84.7%) |
| Arts, Media & Entertainment | 37 (86.1%) | 6 (14.0%) |
| Health Diagnosing & Treating | 191 (41.3%) | 271 (58.7%) |
| Health Technologists | 139 (36.6%) | 241 (63.4%) |
| Total (Category) | 1,247 (49.5%) | 1,271 (50.5%) |
| Total (Overall) | 4,239 (56.3%) | 3,292 (43.7%) |
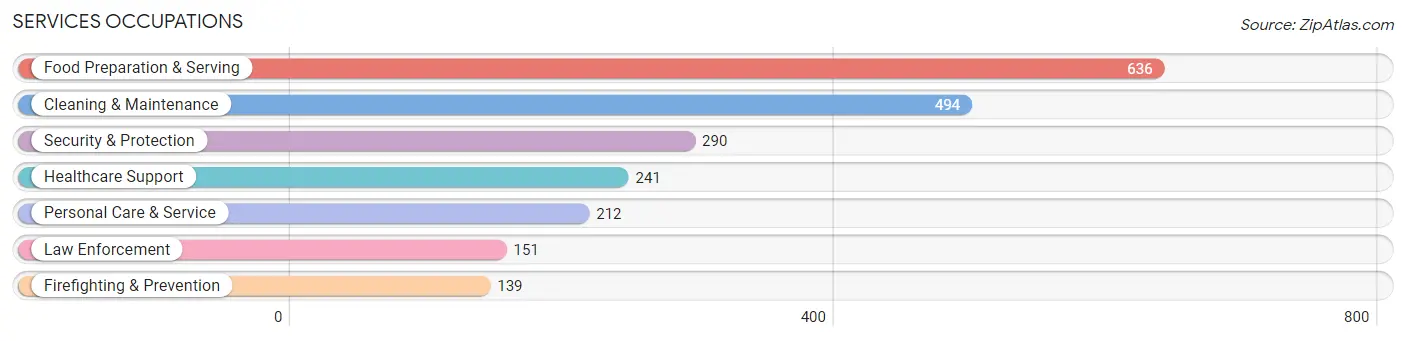
Services Occupations
The most common Services occupations in Hammonton are Food Preparation & Serving (636 | 8.5%), Cleaning & Maintenance (494 | 6.6%), Security & Protection (290 | 3.8%), Healthcare Support (241 | 3.2%), and Personal Care & Service (212 | 2.8%).
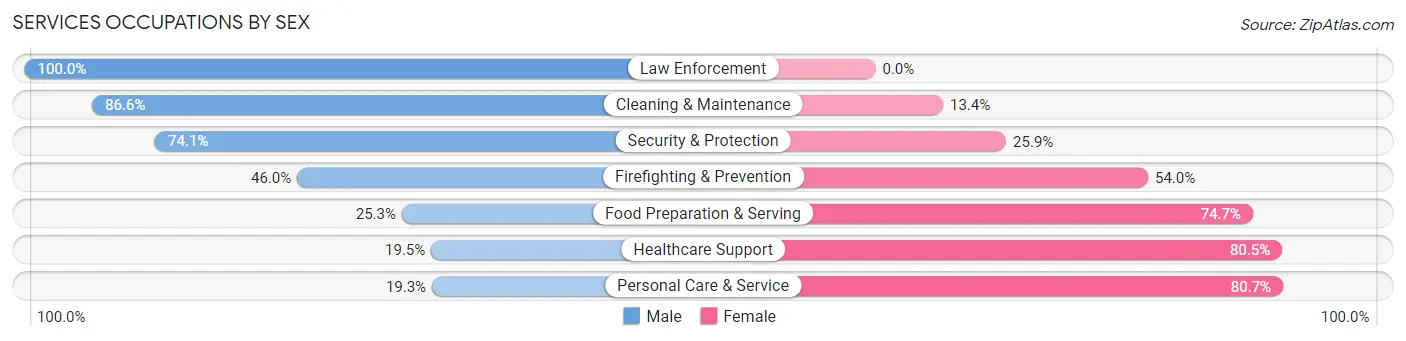
Services Occupations by Sex
Within the Services occupations in Hammonton, the most male-oriented occupations are Law Enforcement (100.0%), Cleaning & Maintenance (86.6%), and Security & Protection (74.1%), while the most female-oriented occupations are Personal Care & Service (80.7%), Healthcare Support (80.5%), and Food Preparation & Serving (74.7%).
| Occupation | Male | Female |
| Healthcare Support | 47 (19.5%) | 194 (80.5%) |
| Security & Protection | 215 (74.1%) | 75 (25.9%) |
| Firefighting & Prevention | 64 (46.0%) | 75 (54.0%) |
| Law Enforcement | 151 (100.0%) | 0 (0.0%) |
| Food Preparation & Serving | 161 (25.3%) | 475 (74.7%) |
| Cleaning & Maintenance | 428 (86.6%) | 66 (13.4%) |
| Personal Care & Service | 41 (19.3%) | 171 (80.7%) |
| Total (Category) | 892 (47.6%) | 981 (52.4%) |
| Total (Overall) | 4,239 (56.3%) | 3,292 (43.7%) |
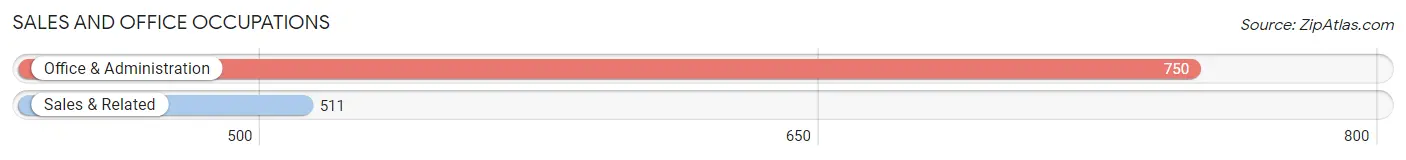
Sales and Office Occupations
The most common Sales and Office occupations in Hammonton are Office & Administration (750 | 10.0%), and Sales & Related (511 | 6.8%).
Sales and Office Occupations by Sex
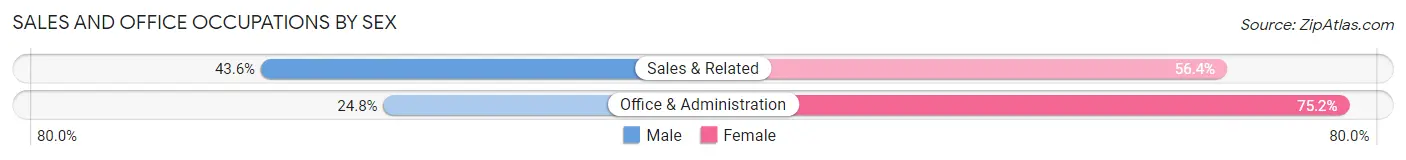
| Occupation | Male | Female |
| Sales & Related | 223 (43.6%) | 288 (56.4%) |
| Office & Administration | 186 (24.8%) | 564 (75.2%) |
| Total (Category) | 409 (32.4%) | 852 (67.6%) |
| Total (Overall) | 4,239 (56.3%) | 3,292 (43.7%) |
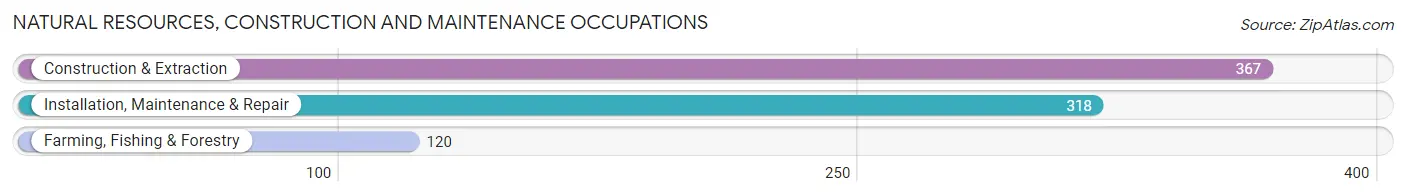
Natural Resources, Construction and Maintenance Occupations
The most common Natural Resources, Construction and Maintenance occupations in Hammonton are Construction & Extraction (367 | 4.9%), Installation, Maintenance & Repair (318 | 4.2%), and Farming, Fishing & Forestry (120 | 1.6%).
Natural Resources, Construction and Maintenance Occupations by Sex
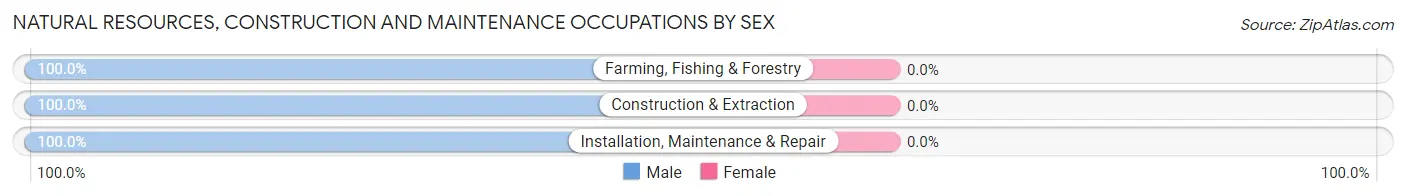
| Occupation | Male | Female |
| Farming, Fishing & Forestry | 120 (100.0%) | 0 (0.0%) |
| Construction & Extraction | 367 (100.0%) | 0 (0.0%) |
| Installation, Maintenance & Repair | 318 (100.0%) | 0 (0.0%) |
| Total (Category) | 805 (100.0%) | 0 (0.0%) |
| Total (Overall) | 4,239 (56.3%) | 3,292 (43.7%) |
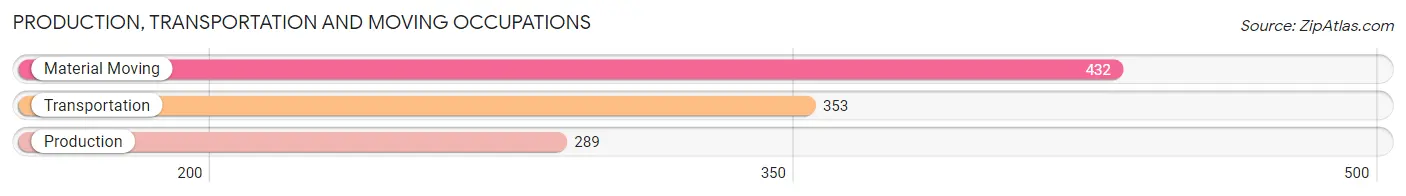
Production, Transportation and Moving Occupations
The most common Production, Transportation and Moving occupations in Hammonton are Material Moving (432 | 5.7%), Transportation (353 | 4.7%), and Production (289 | 3.8%).
Production, Transportation and Moving Occupations by Sex
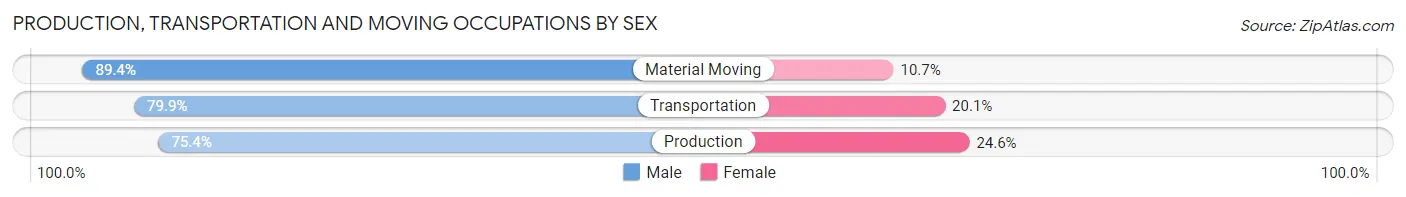
| Occupation | Male | Female |
| Production | 218 (75.4%) | 71 (24.6%) |
| Transportation | 282 (79.9%) | 71 (20.1%) |
| Material Moving | 386 (89.3%) | 46 (10.6%) |
| Total (Category) | 886 (82.5%) | 188 (17.5%) |
| Total (Overall) | 4,239 (56.3%) | 3,292 (43.7%) |
Employment Industries by Sex in Hammonton
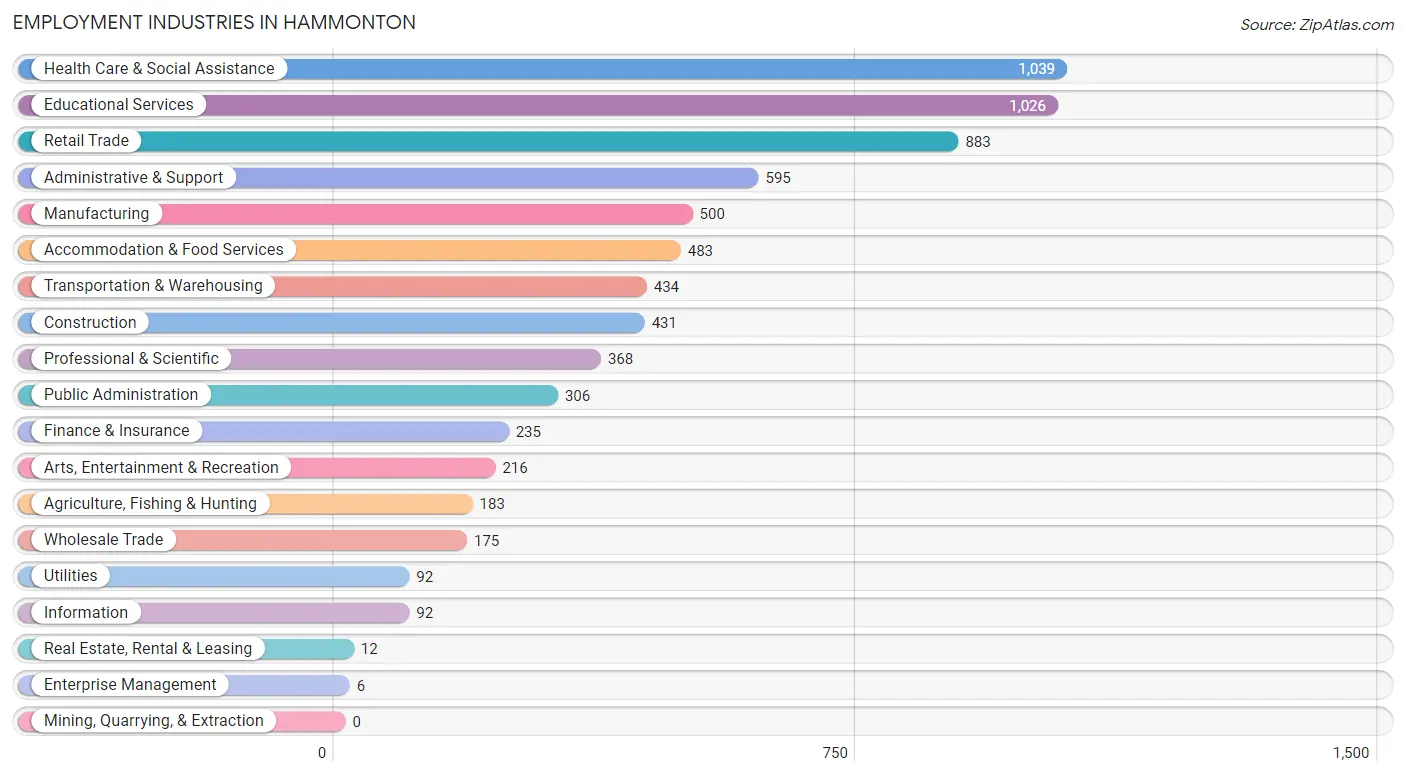
Employment Industries in Hammonton
The major employment industries in Hammonton include Health Care & Social Assistance (1,039 | 13.8%), Educational Services (1,026 | 13.6%), Retail Trade (883 | 11.7%), Administrative & Support (595 | 7.9%), and Manufacturing (500 | 6.6%).
Employment Industries by Sex in Hammonton
The Hammonton industries that see more men than women are Construction (92.6%), Agriculture, Fishing & Hunting (90.2%), and Manufacturing (87.6%), whereas the industries that tend to have a higher number of women are Enterprise Management (100.0%), Real Estate, Rental & Leasing (83.3%), and Educational Services (78.2%).

| Industry | Male | Female |
| Agriculture, Fishing & Hunting | 165 (90.2%) | 18 (9.8%) |
| Mining, Quarrying, & Extraction | 0 (0.0%) | 0 (0.0%) |
| Construction | 399 (92.6%) | 32 (7.4%) |
| Manufacturing | 438 (87.6%) | 62 (12.4%) |
| Wholesale Trade | 99 (56.6%) | 76 (43.4%) |
| Retail Trade | 522 (59.1%) | 361 (40.9%) |
| Transportation & Warehousing | 300 (69.1%) | 134 (30.9%) |
| Utilities | 77 (83.7%) | 15 (16.3%) |
| Information | 36 (39.1%) | 56 (60.9%) |
| Finance & Insurance | 67 (28.5%) | 168 (71.5%) |
| Real Estate, Rental & Leasing | 2 (16.7%) | 10 (83.3%) |
| Professional & Scientific | 291 (79.1%) | 77 (20.9%) |
| Enterprise Management | 0 (0.0%) | 6 (100.0%) |
| Administrative & Support | 471 (79.2%) | 124 (20.8%) |
| Educational Services | 224 (21.8%) | 802 (78.2%) |
| Health Care & Social Assistance | 351 (33.8%) | 688 (66.2%) |
| Arts, Entertainment & Recreation | 158 (73.2%) | 58 (26.9%) |
| Accommodation & Food Services | 132 (27.3%) | 351 (72.7%) |
| Public Administration | 251 (82.0%) | 55 (18.0%) |
| Total | 4,239 (56.3%) | 3,292 (43.7%) |
Education in Hammonton
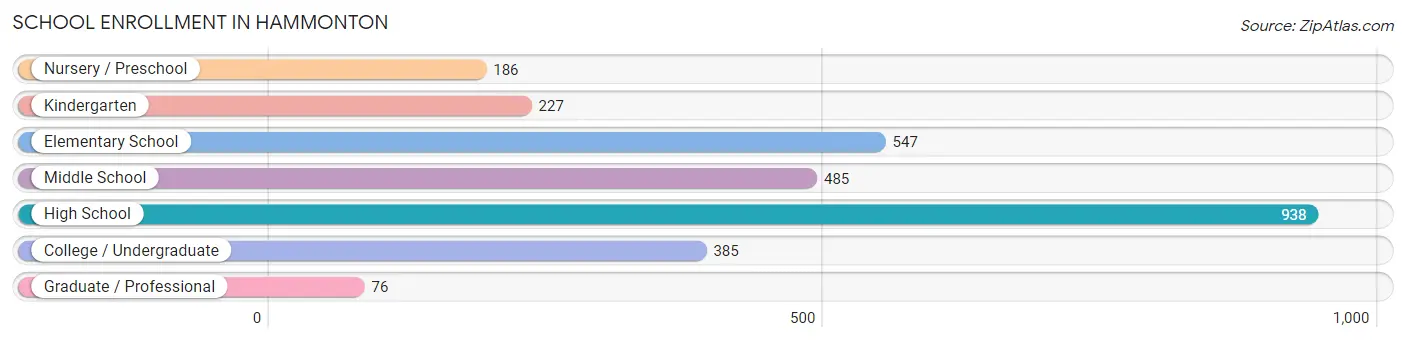
School Enrollment in Hammonton
The most common levels of schooling among the 2,844 students in Hammonton are high school (938 | 33.0%), elementary school (547 | 19.2%), and middle school (485 | 17.1%).
| School Level | # Students | % Students |
| Nursery / Preschool | 186 | 6.5% |
| Kindergarten | 227 | 8.0% |
| Elementary School | 547 | 19.2% |
| Middle School | 485 | 17.1% |
| High School | 938 | 33.0% |
| College / Undergraduate | 385 | 13.5% |
| Graduate / Professional | 76 | 2.7% |
| Total | 2,844 | 100.0% |
School Enrollment by Age by Funding Source in Hammonton
Out of a total of 2,844 students who are enrolled in schools in Hammonton, 452 (15.9%) attend a private institution, while the remaining 2,392 (84.1%) are enrolled in public schools. The age group of 3 to 4 year olds has the highest likelihood of being enrolled in private schools, with 80 (47.6% in the age bracket) enrolled. Conversely, the age group of 5 to 9 year old has the lowest likelihood of being enrolled in a private school, with 765 (99.4% in the age bracket) attending a public institution.
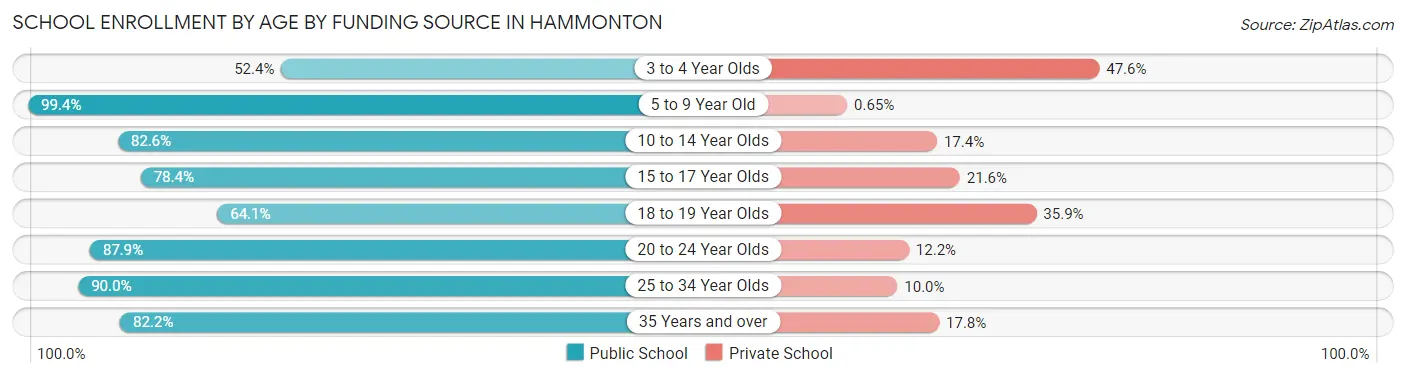
| Age Bracket | Public School | Private School |
| 3 to 4 Year Olds | 88 (52.4%) | 80 (47.6%) |
| 5 to 9 Year Old | 765 (99.4%) | 5 (0.6%) |
| 10 to 14 Year Olds | 537 (82.6%) | 113 (17.4%) |
| 15 to 17 Year Olds | 594 (78.4%) | 164 (21.6%) |
| 18 to 19 Year Olds | 75 (64.1%) | 42 (35.9%) |
| 20 to 24 Year Olds | 159 (87.8%) | 22 (12.1%) |
| 25 to 34 Year Olds | 99 (90.0%) | 11 (10.0%) |
| 35 Years and over | 74 (82.2%) | 16 (17.8%) |
| Total | 2,392 (84.1%) | 452 (15.9%) |
Educational Attainment by Field of Study in Hammonton
Education (812 | 22.2%), business (605 | 16.5%), science & technology (545 | 14.9%), arts & humanities (302 | 8.3%), and bio, nature & agricultural (266 | 7.3%) are the most common fields of study among 3,660 individuals in Hammonton who have obtained a bachelor's degree or higher.
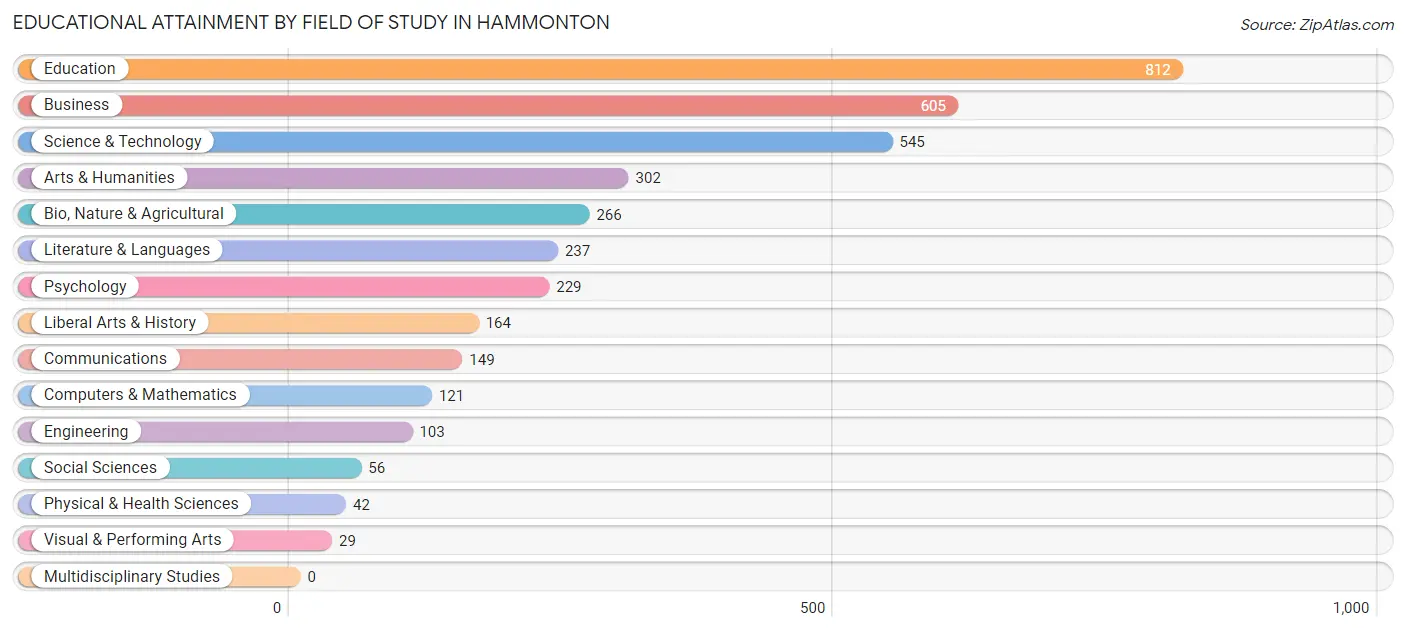
| Field of Study | # Graduates | % Graduates |
| Computers & Mathematics | 121 | 3.3% |
| Bio, Nature & Agricultural | 266 | 7.3% |
| Physical & Health Sciences | 42 | 1.1% |
| Psychology | 229 | 6.3% |
| Social Sciences | 56 | 1.5% |
| Engineering | 103 | 2.8% |
| Multidisciplinary Studies | 0 | 0.0% |
| Science & Technology | 545 | 14.9% |
| Business | 605 | 16.5% |
| Education | 812 | 22.2% |
| Literature & Languages | 237 | 6.5% |
| Liberal Arts & History | 164 | 4.5% |
| Visual & Performing Arts | 29 | 0.8% |
| Communications | 149 | 4.1% |
| Arts & Humanities | 302 | 8.3% |
| Total | 3,660 | 100.0% |
Transportation & Commute in Hammonton
Vehicle Availability by Sex in Hammonton
The most prevalent vehicle ownership categories in Hammonton are males with 3 vehicles (1,439, accounting for 35.5%) and females with 3 vehicles (714, making up 46.3%).
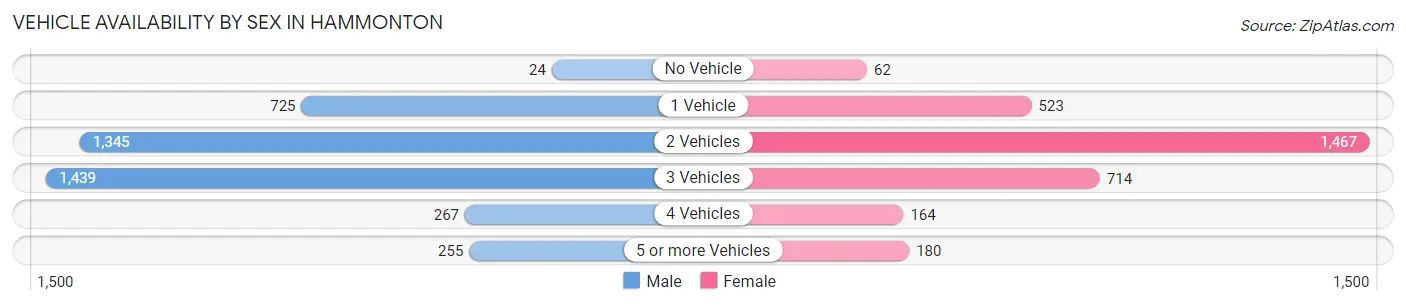
| Vehicles Available | Male | Female |
| No Vehicle | 24 (0.6%) | 62 (2.0%) |
| 1 Vehicle | 725 (17.9%) | 523 (16.8%) |
| 2 Vehicles | 1,345 (33.2%) | 1,467 (47.2%) |
| 3 Vehicles | 1,439 (35.5%) | 714 (23.0%) |
| 4 Vehicles | 267 (6.6%) | 164 (5.3%) |
| 5 or more Vehicles | 255 (6.3%) | 180 (5.8%) |
| Total | 4,055 (100.0%) | 3,110 (100.0%) |
Commute Time in Hammonton
The most frequently occuring commute durations in Hammonton are 5 to 9 minutes (1,161 commuters, 17.3%), 30 to 34 minutes (1,116 commuters, 16.7%), and 45 to 59 minutes (920 commuters, 13.7%).
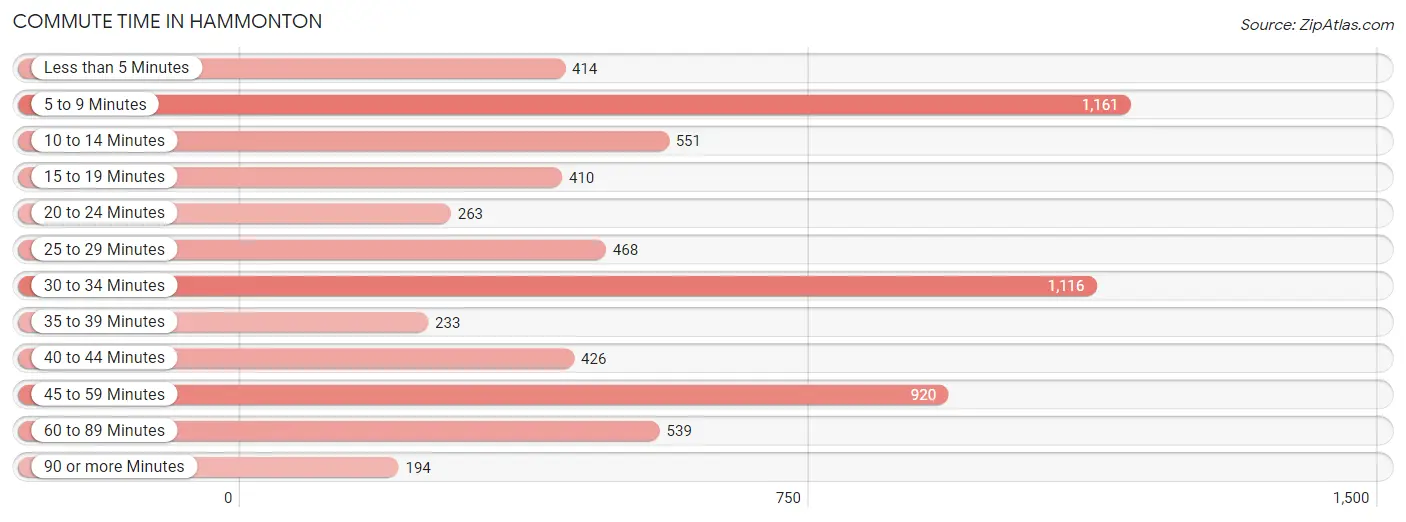
| Commute Time | # Commuters | % Commuters |
| Less than 5 Minutes | 414 | 6.2% |
| 5 to 9 Minutes | 1,161 | 17.3% |
| 10 to 14 Minutes | 551 | 8.2% |
| 15 to 19 Minutes | 410 | 6.1% |
| 20 to 24 Minutes | 263 | 3.9% |
| 25 to 29 Minutes | 468 | 7.0% |
| 30 to 34 Minutes | 1,116 | 16.7% |
| 35 to 39 Minutes | 233 | 3.5% |
| 40 to 44 Minutes | 426 | 6.4% |
| 45 to 59 Minutes | 920 | 13.7% |
| 60 to 89 Minutes | 539 | 8.1% |
| 90 or more Minutes | 194 | 2.9% |
Commute Time by Sex in Hammonton
The most common commute times in Hammonton are 45 to 59 minutes (625 commuters, 15.8%) for males and 5 to 9 minutes (552 commuters, 20.2%) for females.
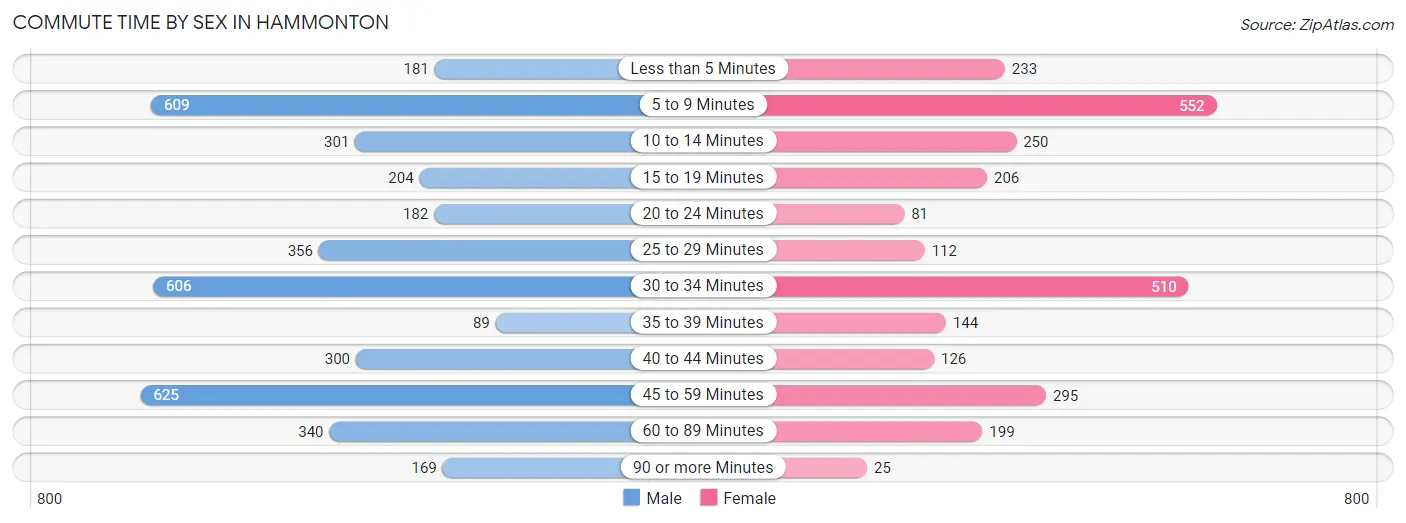
| Commute Time | Male | Female |
| Less than 5 Minutes | 181 (4.6%) | 233 (8.5%) |
| 5 to 9 Minutes | 609 (15.4%) | 552 (20.2%) |
| 10 to 14 Minutes | 301 (7.6%) | 250 (9.1%) |
| 15 to 19 Minutes | 204 (5.1%) | 206 (7.5%) |
| 20 to 24 Minutes | 182 (4.6%) | 81 (3.0%) |
| 25 to 29 Minutes | 356 (9.0%) | 112 (4.1%) |
| 30 to 34 Minutes | 606 (15.3%) | 510 (18.7%) |
| 35 to 39 Minutes | 89 (2.2%) | 144 (5.3%) |
| 40 to 44 Minutes | 300 (7.6%) | 126 (4.6%) |
| 45 to 59 Minutes | 625 (15.8%) | 295 (10.8%) |
| 60 to 89 Minutes | 340 (8.6%) | 199 (7.3%) |
| 90 or more Minutes | 169 (4.3%) | 25 (0.9%) |
Time of Departure to Work by Sex in Hammonton
The most frequent times of departure to work in Hammonton are 6:30 AM to 6:59 AM (792, 20.0%) for males and 8:00 AM to 8:29 AM (489, 17.9%) for females.
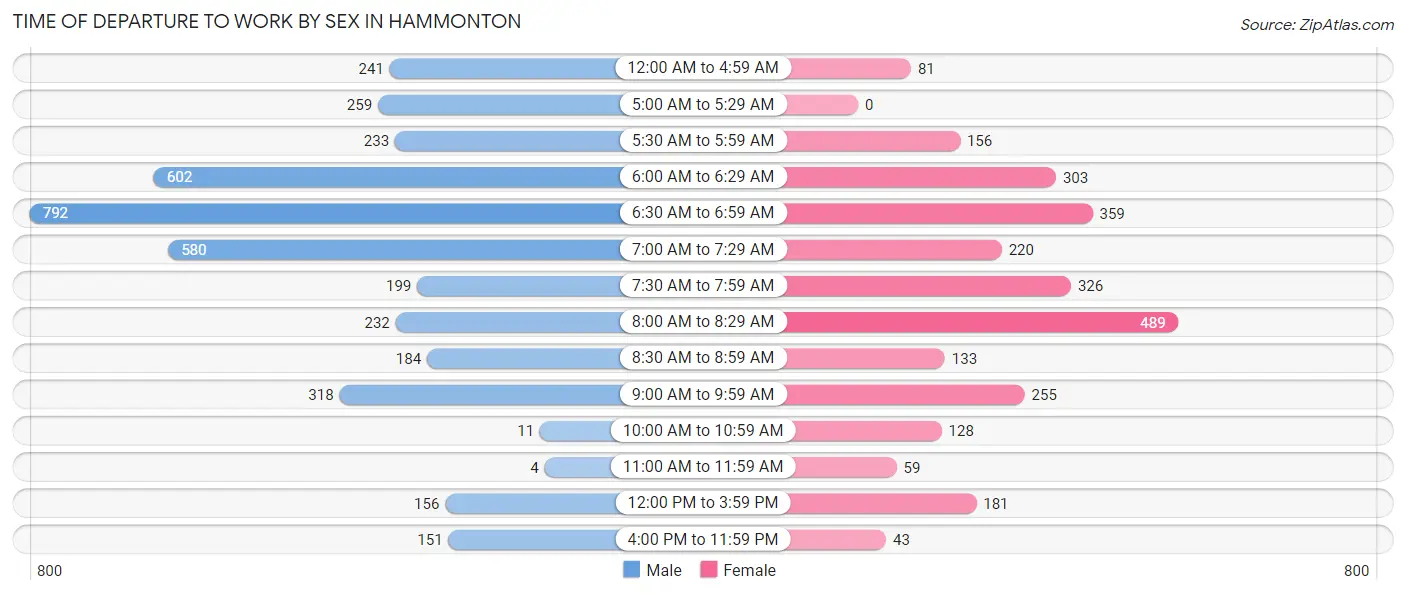
| Time of Departure | Male | Female |
| 12:00 AM to 4:59 AM | 241 (6.1%) | 81 (3.0%) |
| 5:00 AM to 5:29 AM | 259 (6.5%) | 0 (0.0%) |
| 5:30 AM to 5:59 AM | 233 (5.9%) | 156 (5.7%) |
| 6:00 AM to 6:29 AM | 602 (15.2%) | 303 (11.1%) |
| 6:30 AM to 6:59 AM | 792 (20.0%) | 359 (13.1%) |
| 7:00 AM to 7:29 AM | 580 (14.6%) | 220 (8.1%) |
| 7:30 AM to 7:59 AM | 199 (5.0%) | 326 (11.9%) |
| 8:00 AM to 8:29 AM | 232 (5.9%) | 489 (17.9%) |
| 8:30 AM to 8:59 AM | 184 (4.6%) | 133 (4.9%) |
| 9:00 AM to 9:59 AM | 318 (8.0%) | 255 (9.3%) |
| 10:00 AM to 10:59 AM | 11 (0.3%) | 128 (4.7%) |
| 11:00 AM to 11:59 AM | 4 (0.1%) | 59 (2.2%) |
| 12:00 PM to 3:59 PM | 156 (3.9%) | 181 (6.6%) |
| 4:00 PM to 11:59 PM | 151 (3.8%) | 43 (1.6%) |
| Total | 3,962 (100.0%) | 2,733 (100.0%) |
Housing Occupancy in Hammonton
Occupancy by Ownership in Hammonton
Of the total 5,751 dwellings in Hammonton, owner-occupied units account for 4,310 (74.9%), while renter-occupied units make up 1,441 (25.1%).
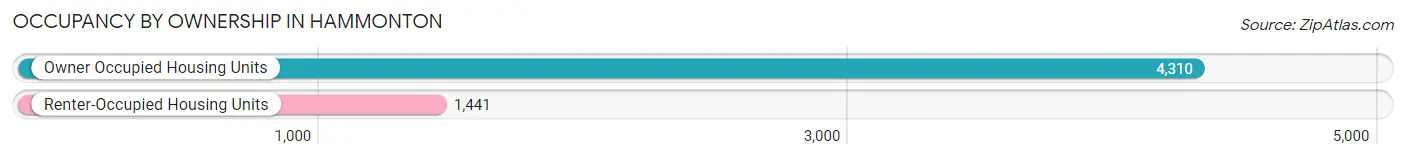
| Occupancy | # Housing Units | % Housing Units |
| Owner Occupied Housing Units | 4,310 | 74.9% |
| Renter-Occupied Housing Units | 1,441 | 25.1% |
| Total Occupied Housing Units | 5,751 | 100.0% |
Occupancy by Household Size in Hammonton
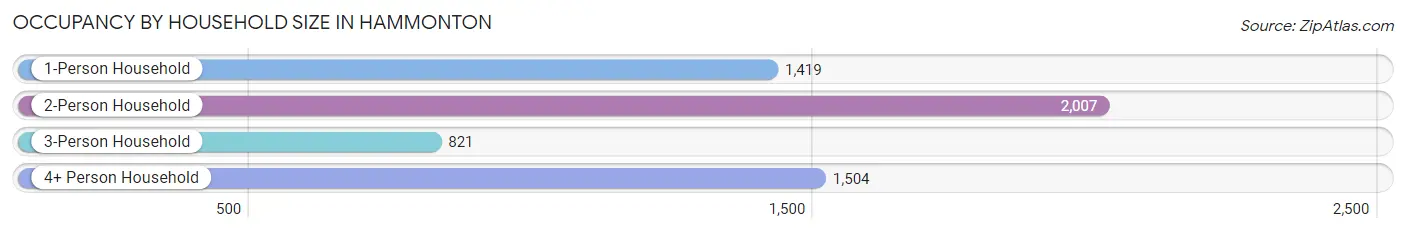
| Household Size | # Housing Units | % Housing Units |
| 1-Person Household | 1,419 | 24.7% |
| 2-Person Household | 2,007 | 34.9% |
| 3-Person Household | 821 | 14.3% |
| 4+ Person Household | 1,504 | 26.2% |
| Total Housing Units | 5,751 | 100.0% |
Occupancy by Ownership by Household Size in Hammonton
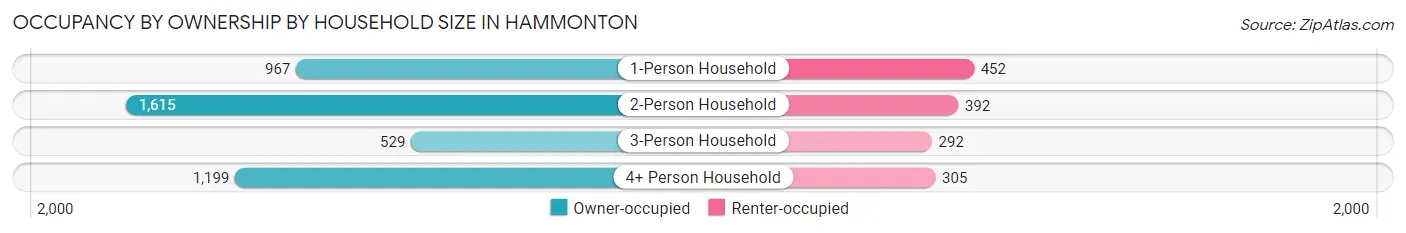
| Household Size | Owner-occupied | Renter-occupied |
| 1-Person Household | 967 (68.1%) | 452 (31.9%) |
| 2-Person Household | 1,615 (80.5%) | 392 (19.5%) |
| 3-Person Household | 529 (64.4%) | 292 (35.6%) |
| 4+ Person Household | 1,199 (79.7%) | 305 (20.3%) |
| Total Housing Units | 4,310 (74.9%) | 1,441 (25.1%) |
Occupancy by Educational Attainment in Hammonton
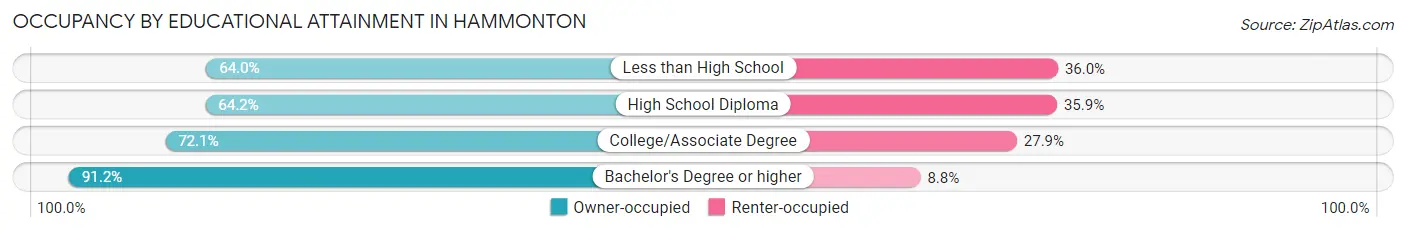
| Household Size | Owner-occupied | Renter-occupied |
| Less than High School | 291 (64.0%) | 164 (36.0%) |
| High School Diploma | 1,208 (64.1%) | 675 (35.8%) |
| College/Associate Degree | 1,140 (72.1%) | 441 (27.9%) |
| Bachelor's Degree or higher | 1,671 (91.2%) | 161 (8.8%) |
Occupancy by Age of Householder in Hammonton
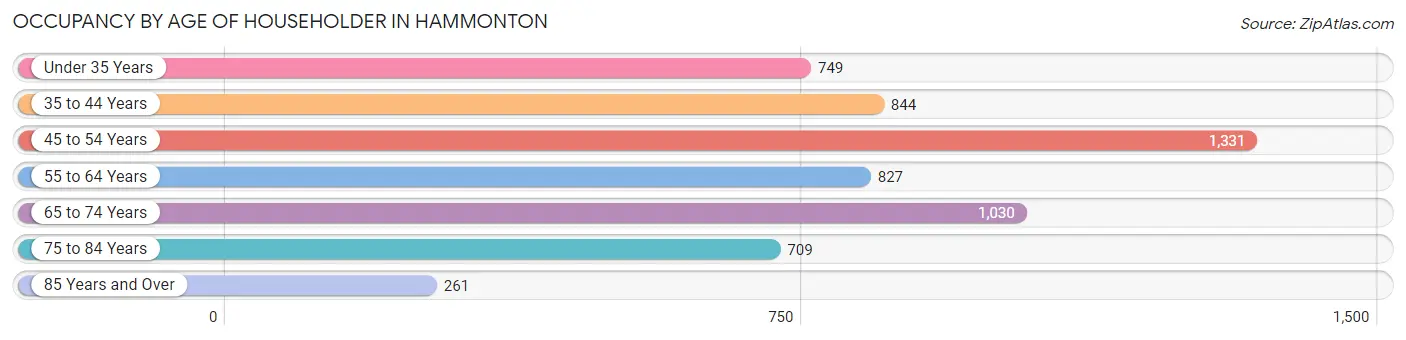
| Age Bracket | # Households | % Households |
| Under 35 Years | 749 | 13.0% |
| 35 to 44 Years | 844 | 14.7% |
| 45 to 54 Years | 1,331 | 23.1% |
| 55 to 64 Years | 827 | 14.4% |
| 65 to 74 Years | 1,030 | 17.9% |
| 75 to 84 Years | 709 | 12.3% |
| 85 Years and Over | 261 | 4.5% |
| Total | 5,751 | 100.0% |
Housing Finances in Hammonton
Median Income by Occupancy in Hammonton
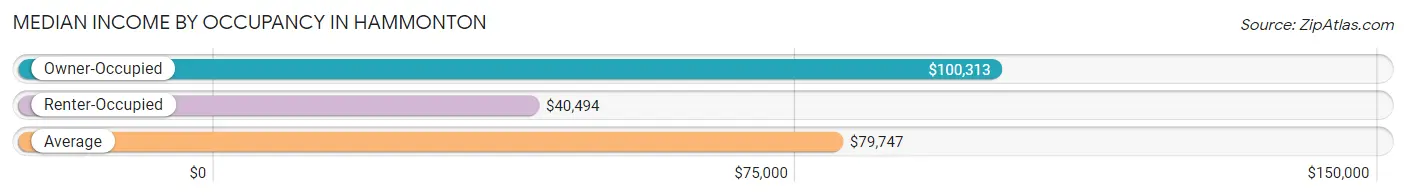
| Occupancy Type | # Households | Median Income |
| Owner-Occupied | 4,310 (74.9%) | $100,313 |
| Renter-Occupied | 1,441 (25.1%) | $40,494 |
| Average | 5,751 (100.0%) | $79,747 |
Occupancy by Householder Income Bracket in Hammonton
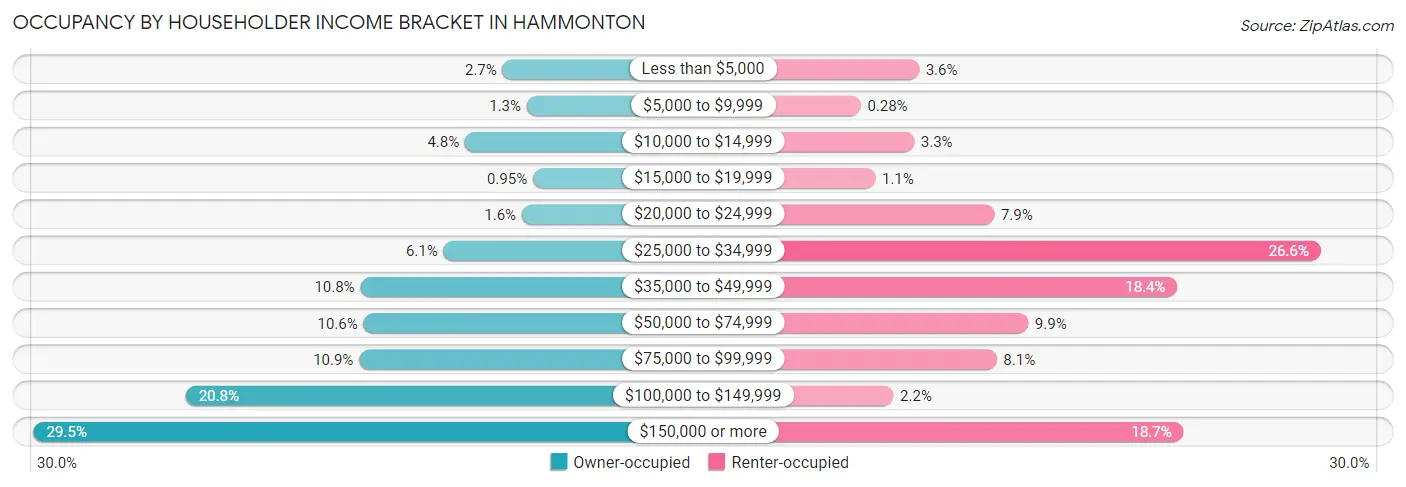
| Income Bracket | Owner-occupied | Renter-occupied |
| Less than $5,000 | 116 (2.7%) | 52 (3.6%) |
| $5,000 to $9,999 | 56 (1.3%) | 4 (0.3%) |
| $10,000 to $14,999 | 208 (4.8%) | 48 (3.3%) |
| $15,000 to $19,999 | 41 (0.9%) | 16 (1.1%) |
| $20,000 to $24,999 | 68 (1.6%) | 114 (7.9%) |
| $25,000 to $34,999 | 261 (6.1%) | 383 (26.6%) |
| $35,000 to $49,999 | 466 (10.8%) | 265 (18.4%) |
| $50,000 to $74,999 | 458 (10.6%) | 142 (9.9%) |
| $75,000 to $99,999 | 469 (10.9%) | 116 (8.1%) |
| $100,000 to $149,999 | 896 (20.8%) | 31 (2.1%) |
| $150,000 or more | 1,271 (29.5%) | 270 (18.7%) |
| Total | 4,310 (100.0%) | 1,441 (100.0%) |
Monthly Housing Cost Tiers in Hammonton
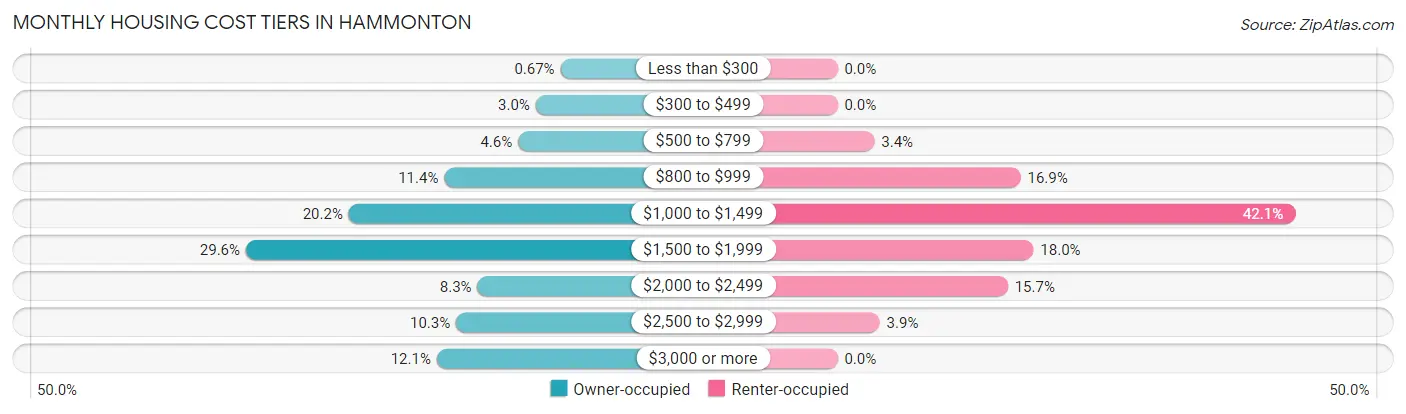
| Monthly Cost | Owner-occupied | Renter-occupied |
| Less than $300 | 29 (0.7%) | 0 (0.0%) |
| $300 to $499 | 127 (2.9%) | 0 (0.0%) |
| $500 to $799 | 197 (4.6%) | 49 (3.4%) |
| $800 to $999 | 490 (11.4%) | 243 (16.9%) |
| $1,000 to $1,499 | 869 (20.2%) | 607 (42.1%) |
| $1,500 to $1,999 | 1,277 (29.6%) | 260 (18.0%) |
| $2,000 to $2,499 | 358 (8.3%) | 226 (15.7%) |
| $2,500 to $2,999 | 443 (10.3%) | 56 (3.9%) |
| $3,000 or more | 520 (12.1%) | 0 (0.0%) |
| Total | 4,310 (100.0%) | 1,441 (100.0%) |
Physical Housing Characteristics in Hammonton
Housing Structures in Hammonton
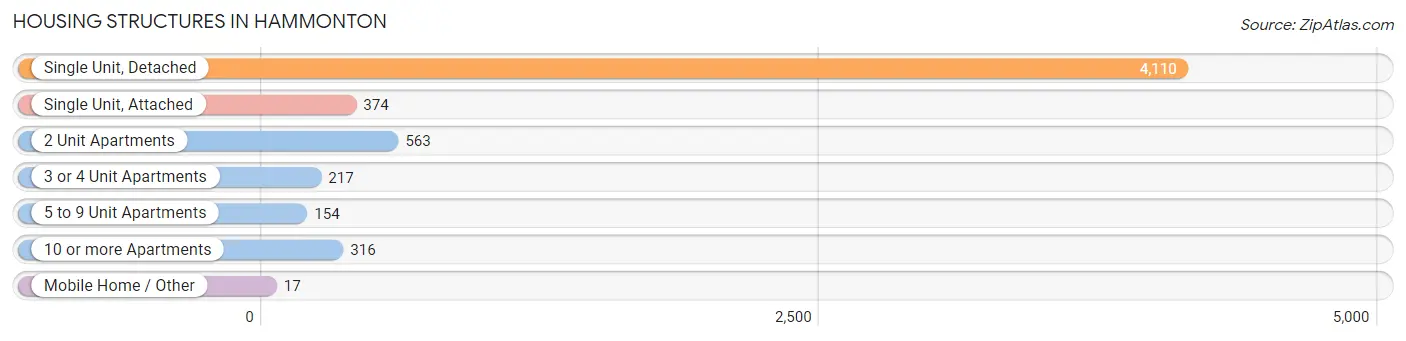
| Structure Type | # Housing Units | % Housing Units |
| Single Unit, Detached | 4,110 | 71.5% |
| Single Unit, Attached | 374 | 6.5% |
| 2 Unit Apartments | 563 | 9.8% |
| 3 or 4 Unit Apartments | 217 | 3.8% |
| 5 to 9 Unit Apartments | 154 | 2.7% |
| 10 or more Apartments | 316 | 5.5% |
| Mobile Home / Other | 17 | 0.3% |
| Total | 5,751 | 100.0% |
Housing Structures by Occupancy in Hammonton
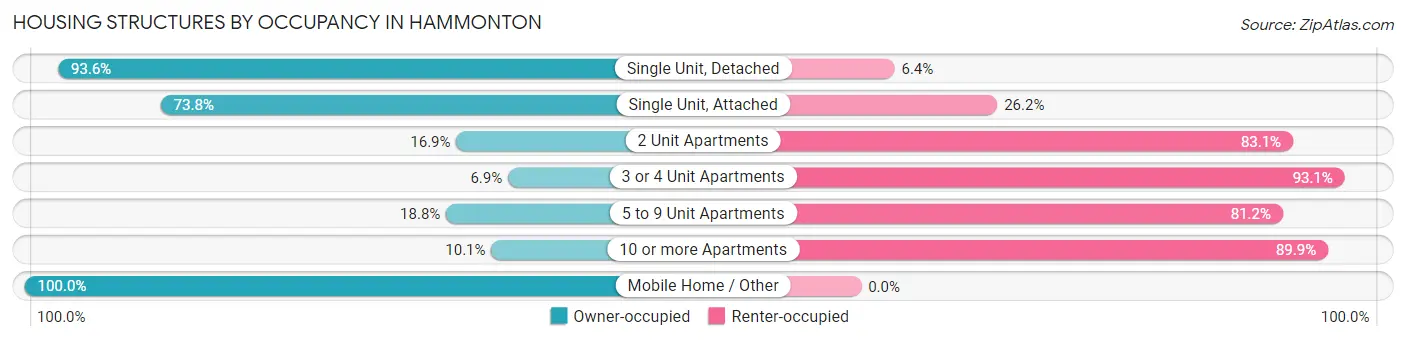
| Structure Type | Owner-occupied | Renter-occupied |
| Single Unit, Detached | 3,846 (93.6%) | 264 (6.4%) |
| Single Unit, Attached | 276 (73.8%) | 98 (26.2%) |
| 2 Unit Apartments | 95 (16.9%) | 468 (83.1%) |
| 3 or 4 Unit Apartments | 15 (6.9%) | 202 (93.1%) |
| 5 to 9 Unit Apartments | 29 (18.8%) | 125 (81.2%) |
| 10 or more Apartments | 32 (10.1%) | 284 (89.9%) |
| Mobile Home / Other | 17 (100.0%) | 0 (0.0%) |
| Total | 4,310 (74.9%) | 1,441 (25.1%) |
Housing Structures by Number of Rooms in Hammonton
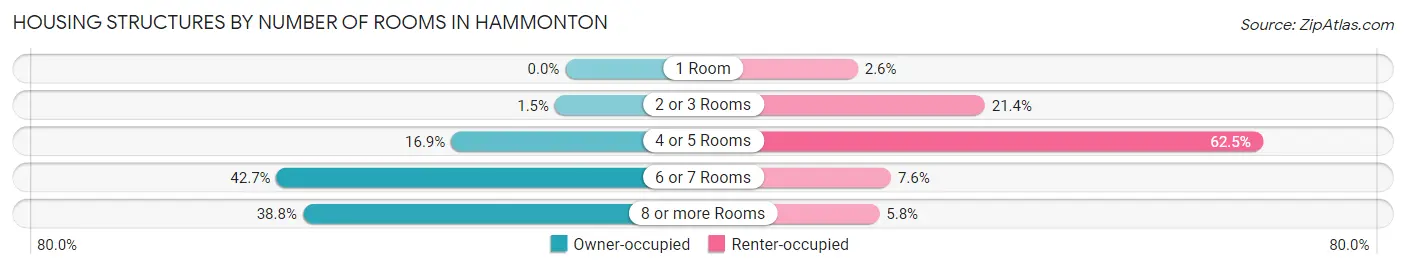
| Number of Rooms | Owner-occupied | Renter-occupied |
| 1 Room | 0 (0.0%) | 38 (2.6%) |
| 2 or 3 Rooms | 66 (1.5%) | 309 (21.4%) |
| 4 or 5 Rooms | 728 (16.9%) | 901 (62.5%) |
| 6 or 7 Rooms | 1,842 (42.7%) | 109 (7.6%) |
| 8 or more Rooms | 1,674 (38.8%) | 84 (5.8%) |
| Total | 4,310 (100.0%) | 1,441 (100.0%) |
Housing Structure by Heating Type in Hammonton
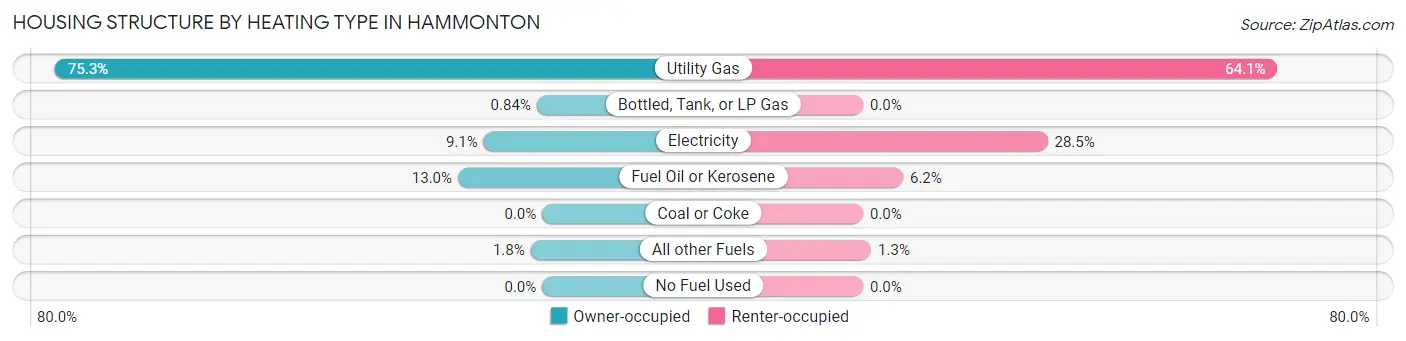
| Heating Type | Owner-occupied | Renter-occupied |
| Utility Gas | 3,246 (75.3%) | 923 (64.0%) |
| Bottled, Tank, or LP Gas | 36 (0.8%) | 0 (0.0%) |
| Electricity | 390 (9.0%) | 411 (28.5%) |
| Fuel Oil or Kerosene | 561 (13.0%) | 89 (6.2%) |
| Coal or Coke | 0 (0.0%) | 0 (0.0%) |
| All other Fuels | 77 (1.8%) | 18 (1.3%) |
| No Fuel Used | 0 (0.0%) | 0 (0.0%) |
| Total | 4,310 (100.0%) | 1,441 (100.0%) |
Household Vehicle Usage in Hammonton
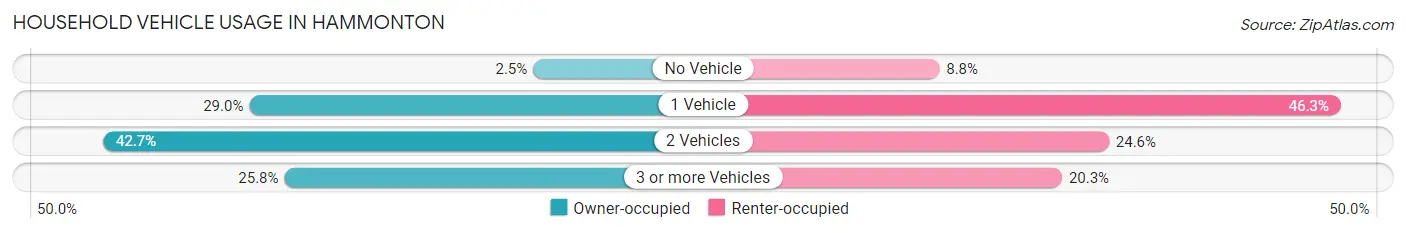
| Vehicles per Household | Owner-occupied | Renter-occupied |
| No Vehicle | 109 (2.5%) | 127 (8.8%) |
| 1 Vehicle | 1,251 (29.0%) | 667 (46.3%) |
| 2 Vehicles | 1,840 (42.7%) | 355 (24.6%) |
| 3 or more Vehicles | 1,110 (25.8%) | 292 (20.3%) |
| Total | 4,310 (100.0%) | 1,441 (100.0%) |
Real Estate & Mortgages in Hammonton
Real Estate and Mortgage Overview in Hammonton
| Characteristic | Without Mortgage | With Mortgage |
| Housing Units | 1,758 | 2,552 |
| Median Property Value | $283,800 | $305,900 |
| Median Household Income | $48,803 | $1,118 |
| Monthly Housing Costs | $1,035 | $520 |
| Real Estate Taxes | $6,279 | $42 |
Property Value by Mortgage Status in Hammonton
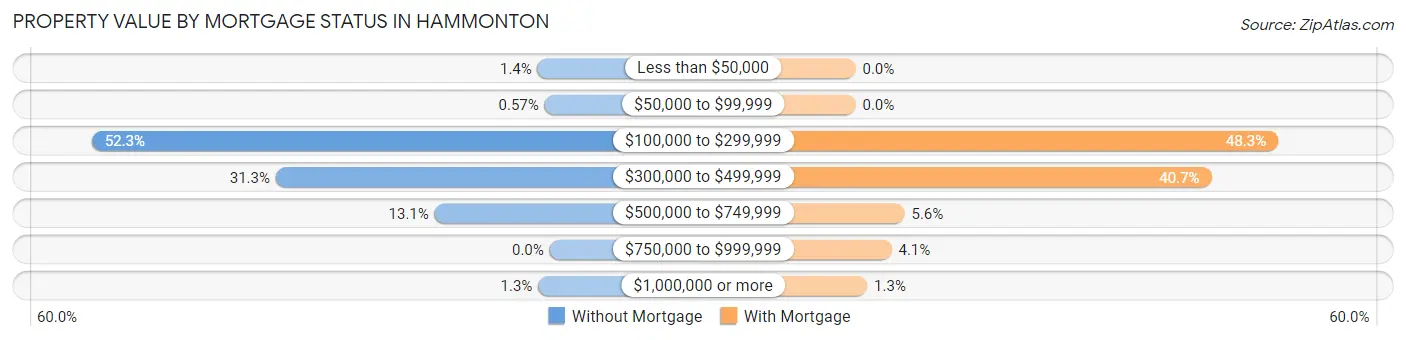
| Property Value | Without Mortgage | With Mortgage |
| Less than $50,000 | 24 (1.4%) | 0 (0.0%) |
| $50,000 to $99,999 | 10 (0.6%) | 0 (0.0%) |
| $100,000 to $299,999 | 920 (52.3%) | 1,232 (48.3%) |
| $300,000 to $499,999 | 550 (31.3%) | 1,038 (40.7%) |
| $500,000 to $749,999 | 231 (13.1%) | 143 (5.6%) |
| $750,000 to $999,999 | 0 (0.0%) | 105 (4.1%) |
| $1,000,000 or more | 23 (1.3%) | 34 (1.3%) |
| Total | 1,758 (100.0%) | 2,552 (100.0%) |
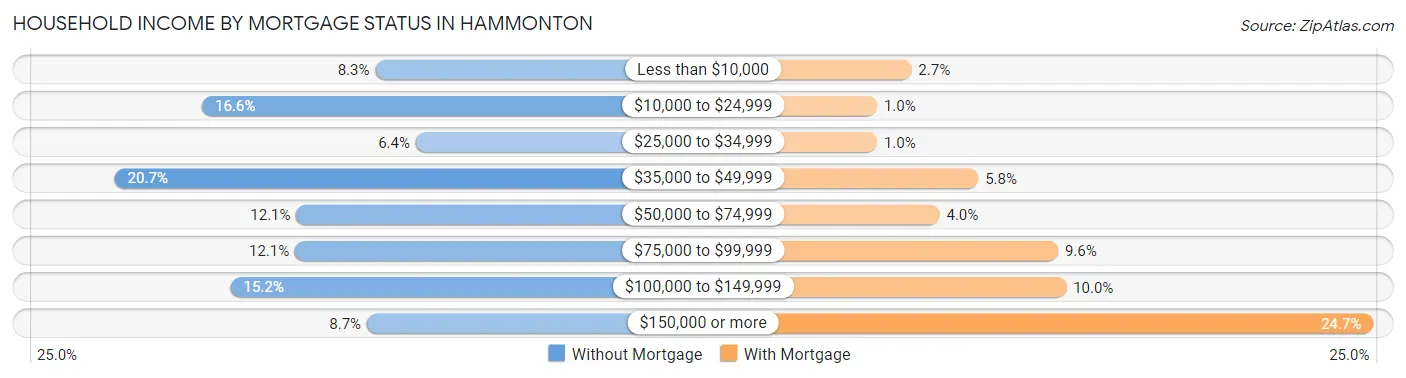
Household Income by Mortgage Status in Hammonton
| Household Income | Without Mortgage | With Mortgage |
| Less than $10,000 | 146 (8.3%) | 68 (2.7%) |
| $10,000 to $24,999 | 291 (16.6%) | 26 (1.0%) |
| $25,000 to $34,999 | 112 (6.4%) | 26 (1.0%) |
| $35,000 to $49,999 | 364 (20.7%) | 149 (5.8%) |
| $50,000 to $74,999 | 212 (12.1%) | 102 (4.0%) |
| $75,000 to $99,999 | 213 (12.1%) | 246 (9.6%) |
| $100,000 to $149,999 | 267 (15.2%) | 256 (10.0%) |
| $150,000 or more | 153 (8.7%) | 629 (24.6%) |
| Total | 1,758 (100.0%) | 2,552 (100.0%) |
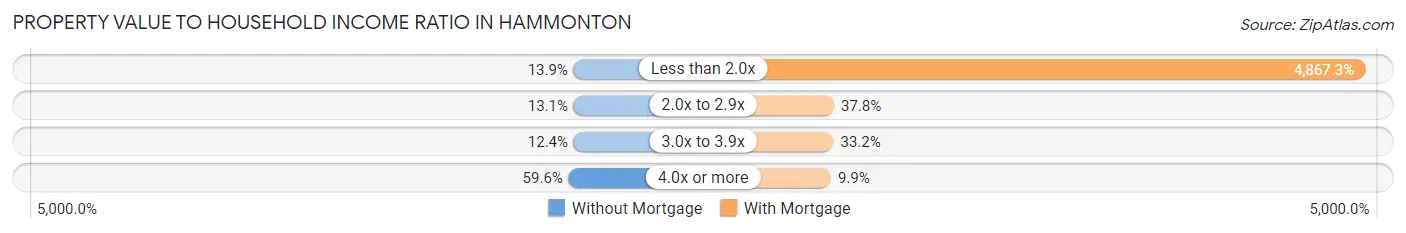
Property Value to Household Income Ratio in Hammonton
| Value-to-Income Ratio | Without Mortgage | With Mortgage |
| Less than 2.0x | 245 (13.9%) | 124,213 (4,867.3%) |
| 2.0x to 2.9x | 231 (13.1%) | 965 (37.8%) |
| 3.0x to 3.9x | 218 (12.4%) | 847 (33.2%) |
| 4.0x or more | 1,048 (59.6%) | 253 (9.9%) |
| Total | 1,758 (100.0%) | 2,552 (100.0%) |
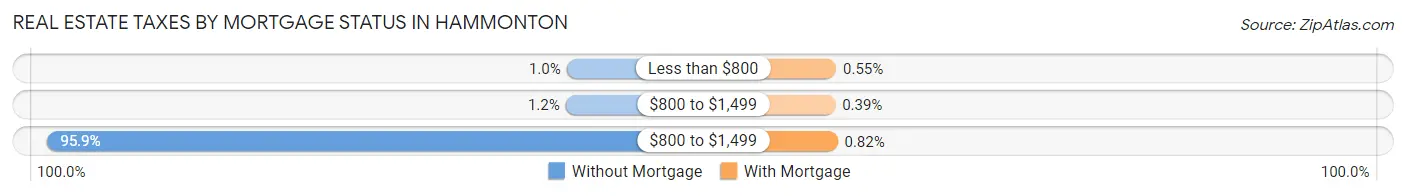
Real Estate Taxes by Mortgage Status in Hammonton
| Property Taxes | Without Mortgage | With Mortgage |
| Less than $800 | 18 (1.0%) | 14 (0.5%) |
| $800 to $1,499 | 21 (1.2%) | 10 (0.4%) |
| $800 to $1,499 | 1,685 (95.9%) | 21 (0.8%) |
| Total | 1,758 (100.0%) | 2,552 (100.0%) |
Health & Disability in Hammonton
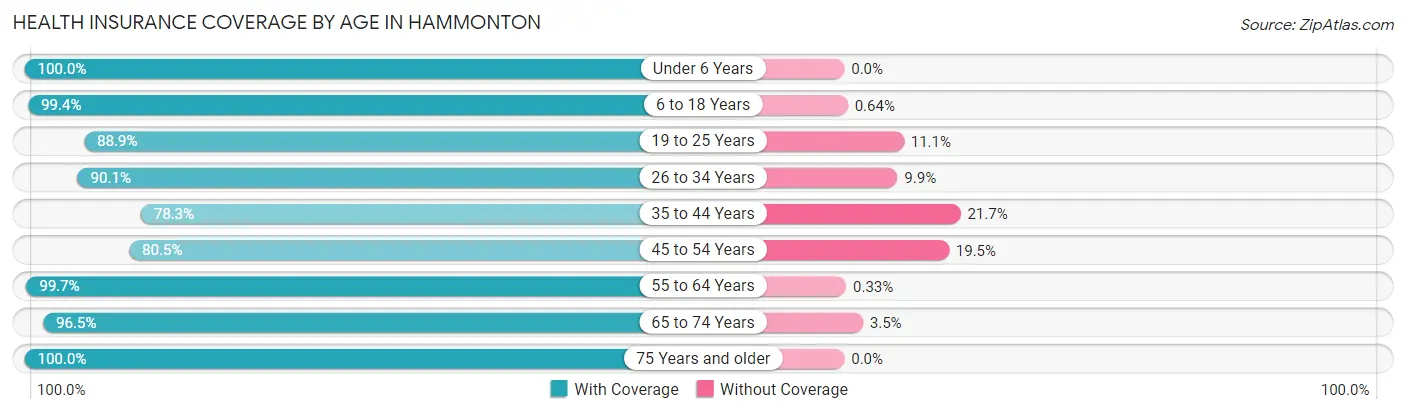
Health Insurance Coverage by Age in Hammonton
| Age Bracket | With Coverage | Without Coverage |
| Under 6 Years | 809 (100.0%) | 0 (0.0%) |
| 6 to 18 Years | 2,184 (99.4%) | 14 (0.6%) |
| 19 to 25 Years | 802 (88.9%) | 100 (11.1%) |
| 26 to 34 Years | 1,474 (90.1%) | 162 (9.9%) |
| 35 to 44 Years | 1,258 (78.3%) | 348 (21.7%) |
| 45 to 54 Years | 1,820 (80.5%) | 441 (19.5%) |
| 55 to 64 Years | 1,819 (99.7%) | 6 (0.3%) |
| 65 to 74 Years | 1,703 (96.5%) | 61 (3.5%) |
| 75 Years and older | 1,523 (100.0%) | 0 (0.0%) |
| Total | 13,392 (92.2%) | 1,132 (7.8%) |
Health Insurance Coverage by Citizenship Status in Hammonton
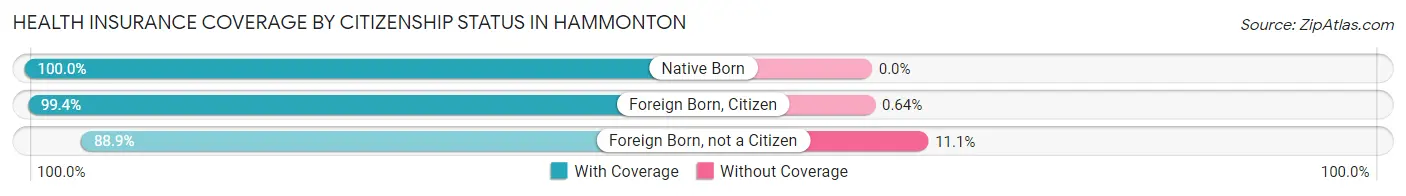
| Citizenship Status | With Coverage | Without Coverage |
| Native Born | 809 (100.0%) | 0 (0.0%) |
| Foreign Born, Citizen | 2,184 (99.4%) | 14 (0.6%) |
| Foreign Born, not a Citizen | 802 (88.9%) | 100 (11.1%) |
Health Insurance Coverage by Household Income in Hammonton
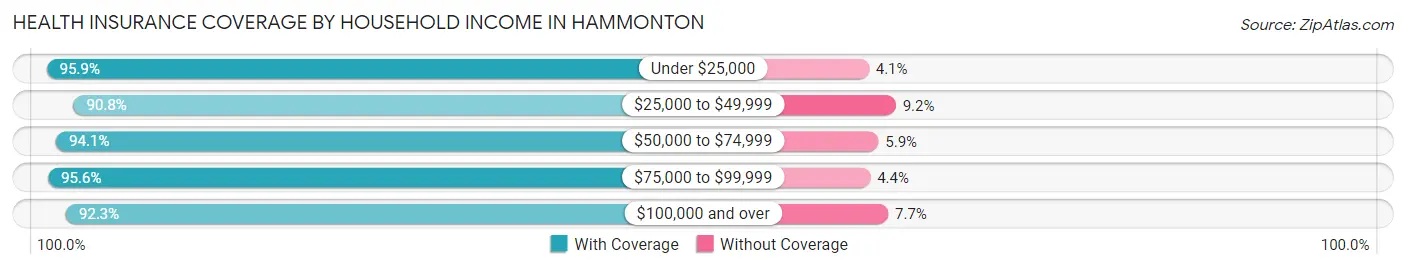
| Household Income | With Coverage | Without Coverage |
| Under $25,000 | 1,211 (95.9%) | 52 (4.1%) |
| $25,000 to $49,999 | 2,153 (90.8%) | 217 (9.2%) |
| $50,000 to $74,999 | 1,082 (94.1%) | 68 (5.9%) |
| $75,000 to $99,999 | 1,720 (95.6%) | 79 (4.4%) |
| $100,000 and over | 7,101 (92.3%) | 596 (7.7%) |
Public vs Private Health Insurance Coverage by Age in Hammonton
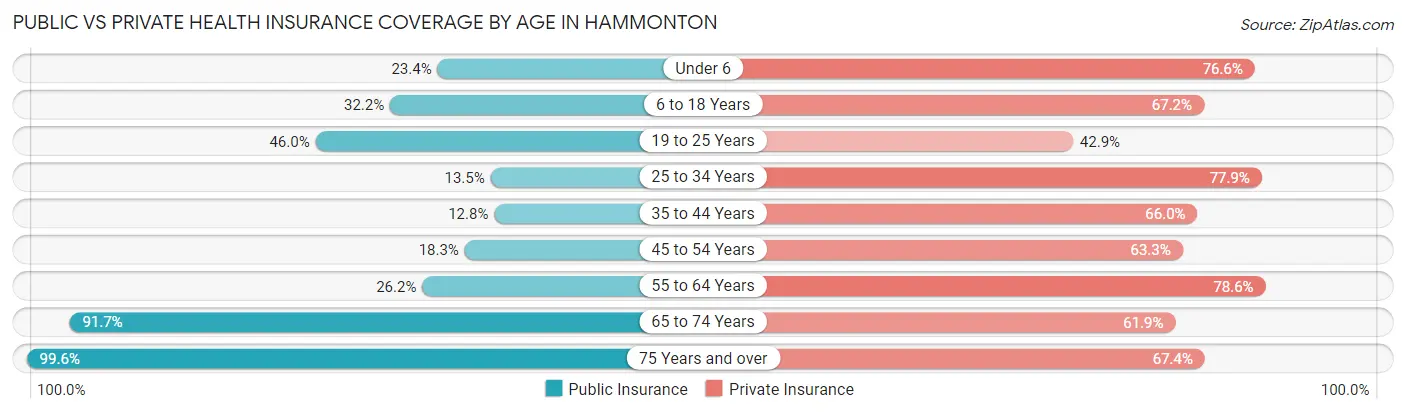
| Age Bracket | Public Insurance | Private Insurance |
| Under 6 | 189 (23.4%) | 620 (76.6%) |
| 6 to 18 Years | 707 (32.2%) | 1,477 (67.2%) |
| 19 to 25 Years | 415 (46.0%) | 387 (42.9%) |
| 25 to 34 Years | 221 (13.5%) | 1,275 (77.9%) |
| 35 to 44 Years | 206 (12.8%) | 1,060 (66.0%) |
| 45 to 54 Years | 414 (18.3%) | 1,430 (63.2%) |
| 55 to 64 Years | 478 (26.2%) | 1,435 (78.6%) |
| 65 to 74 Years | 1,617 (91.7%) | 1,092 (61.9%) |
| 75 Years and over | 1,517 (99.6%) | 1,026 (67.4%) |
| Total | 5,764 (39.7%) | 9,802 (67.5%) |
Disability Status by Sex by Age in Hammonton
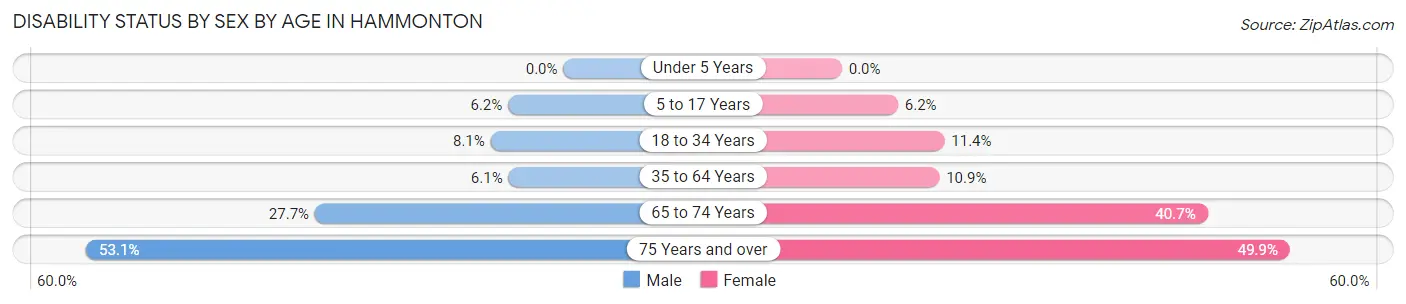
| Age Bracket | Male | Female |
| Under 5 Years | 0 (0.0%) | 0 (0.0%) |
| 5 to 17 Years | 64 (6.1%) | 71 (6.2%) |
| 18 to 34 Years | 123 (8.1%) | 134 (11.4%) |
| 35 to 64 Years | 184 (6.1%) | 291 (10.8%) |
| 65 to 74 Years | 251 (27.7%) | 349 (40.7%) |
| 75 Years and over | 347 (53.1%) | 434 (49.9%) |
Disability Class by Sex by Age in Hammonton
Disability Class: Hearing Difficulty
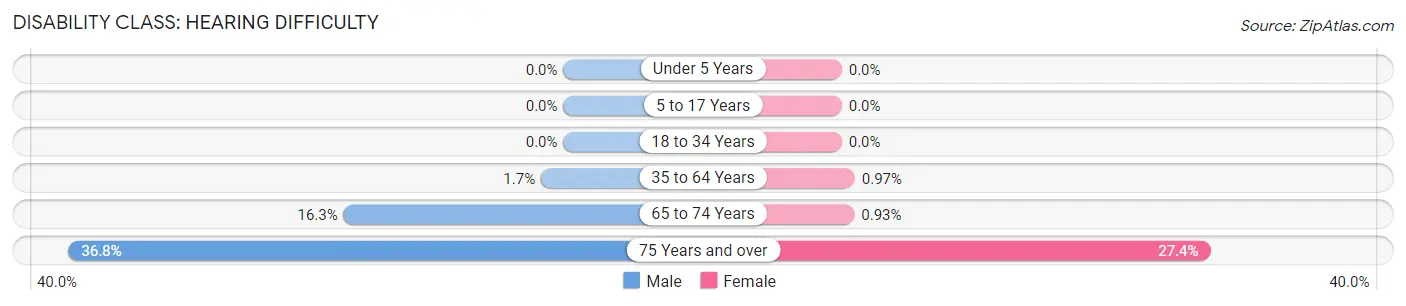
| Age Bracket | Male | Female |
| Under 5 Years | 0 (0.0%) | 0 (0.0%) |
| 5 to 17 Years | 0 (0.0%) | 0 (0.0%) |
| 18 to 34 Years | 0 (0.0%) | 0 (0.0%) |
| 35 to 64 Years | 50 (1.7%) | 26 (1.0%) |
| 65 to 74 Years | 148 (16.3%) | 8 (0.9%) |
| 75 Years and over | 240 (36.7%) | 238 (27.4%) |
Disability Class: Vision Difficulty
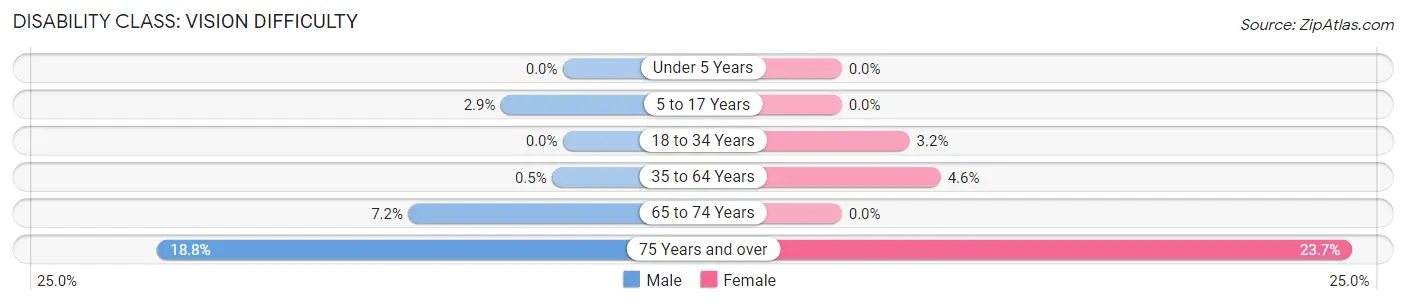
| Age Bracket | Male | Female |
| Under 5 Years | 0 (0.0%) | 0 (0.0%) |
| 5 to 17 Years | 30 (2.9%) | 0 (0.0%) |
| 18 to 34 Years | 0 (0.0%) | 37 (3.2%) |
| 35 to 64 Years | 15 (0.5%) | 123 (4.6%) |
| 65 to 74 Years | 65 (7.2%) | 0 (0.0%) |
| 75 Years and over | 123 (18.8%) | 206 (23.7%) |
Disability Class: Cognitive Difficulty
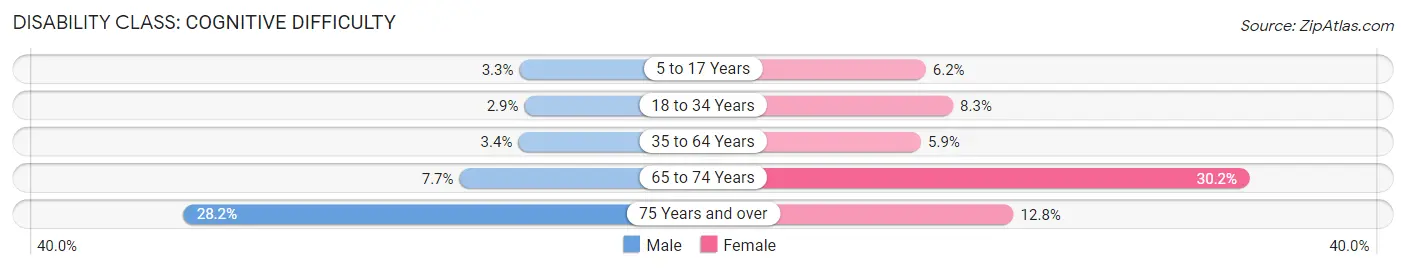
| Age Bracket | Male | Female |
| 5 to 17 Years | 34 (3.3%) | 71 (6.2%) |
| 18 to 34 Years | 44 (2.9%) | 97 (8.3%) |
| 35 to 64 Years | 101 (3.4%) | 158 (5.9%) |
| 65 to 74 Years | 70 (7.7%) | 259 (30.2%) |
| 75 Years and over | 184 (28.2%) | 111 (12.8%) |
Disability Class: Ambulatory Difficulty
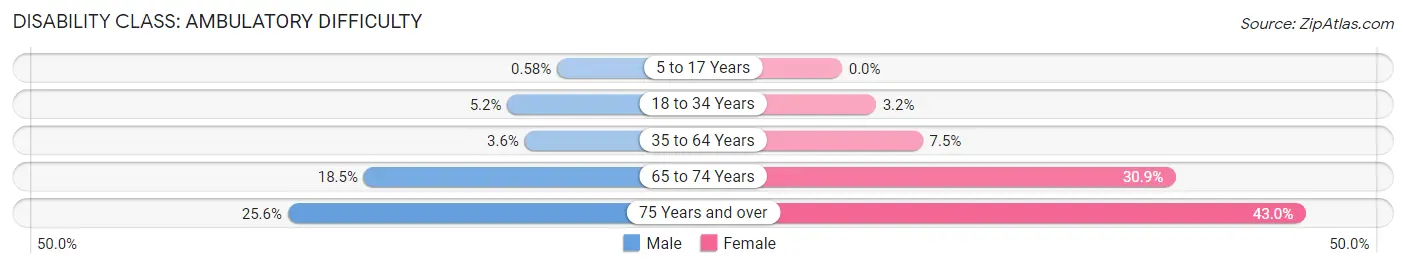
| Age Bracket | Male | Female |
| 5 to 17 Years | 6 (0.6%) | 0 (0.0%) |
| 18 to 34 Years | 79 (5.2%) | 37 (3.2%) |
| 35 to 64 Years | 108 (3.6%) | 201 (7.5%) |
| 65 to 74 Years | 168 (18.5%) | 265 (30.9%) |
| 75 Years and over | 167 (25.6%) | 374 (43.0%) |
Disability Class: Self-Care Difficulty
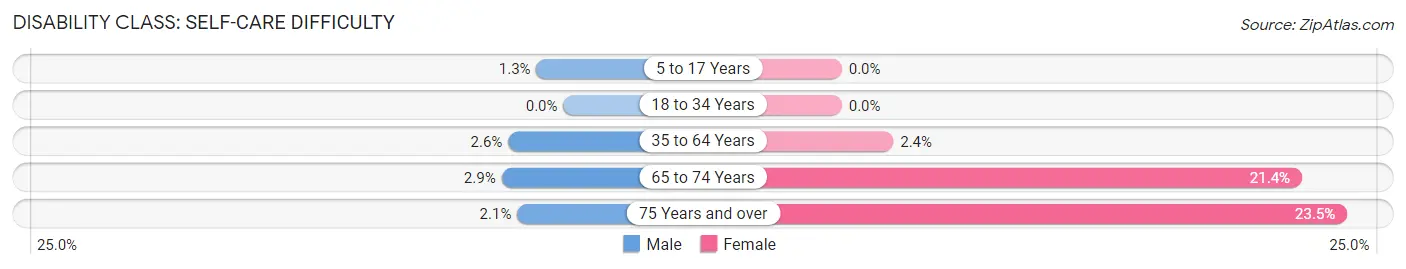
| Age Bracket | Male | Female |
| 5 to 17 Years | 13 (1.3%) | 0 (0.0%) |
| 18 to 34 Years | 0 (0.0%) | 0 (0.0%) |
| 35 to 64 Years | 77 (2.6%) | 64 (2.4%) |
| 65 to 74 Years | 26 (2.9%) | 183 (21.3%) |
| 75 Years and over | 14 (2.1%) | 204 (23.4%) |
Technology Access in Hammonton
Computing Device Access in Hammonton
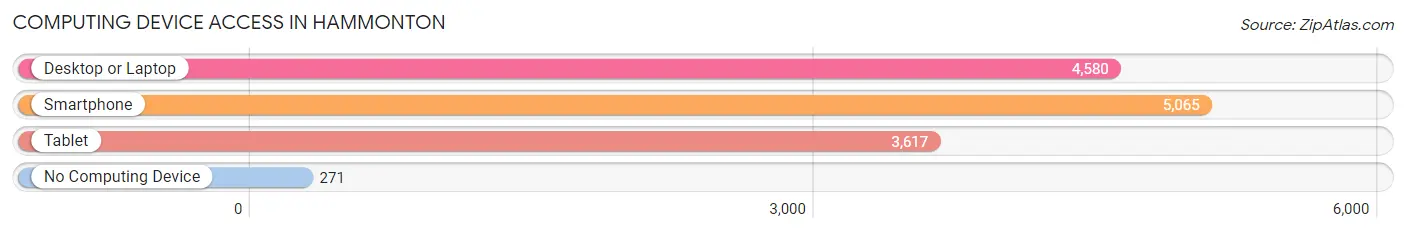
| Device Type | # Households | % Households |
| Desktop or Laptop | 4,580 | 79.6% |
| Smartphone | 5,065 | 88.1% |
| Tablet | 3,617 | 62.9% |
| No Computing Device | 271 | 4.7% |
| Total | 5,751 | 100.0% |
Internet Access in Hammonton
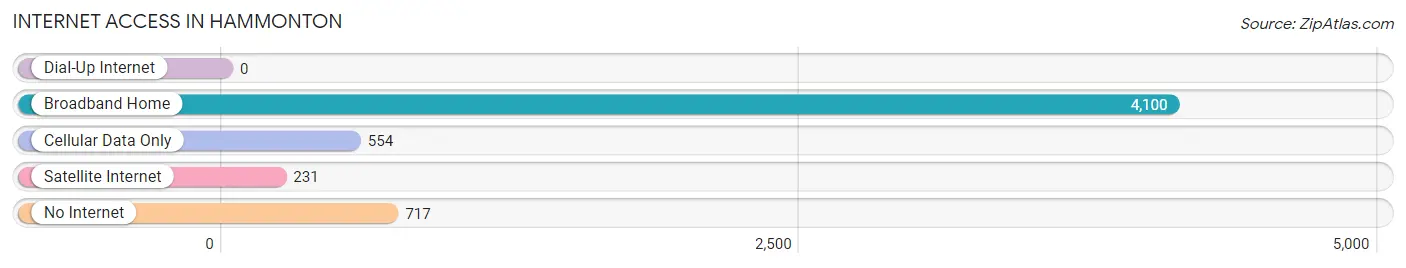
| Internet Type | # Households | % Households |
| Dial-Up Internet | 0 | 0.0% |
| Broadband Home | 4,100 | 71.3% |
| Cellular Data Only | 554 | 9.6% |
| Satellite Internet | 231 | 4.0% |
| No Internet | 717 | 12.5% |
| Total | 5,751 | 100.0% |
Hammonton Summary
Hammonton, New Jersey is a small town located in Atlantic County, approximately 30 miles west of Atlantic City. It is situated on the banks of the Mullica River and is home to a population of 14,791 people as of the 2010 census. The town is known for its rich history, diverse geography, and vibrant economy.
History
Hammonton was first settled in 1763 by John and William Eves, two Quaker brothers from Philadelphia. The town was originally known as “John’s Landing” and was later renamed “Hammonton” in honor of John Hammon, a prominent local landowner. The town was officially incorporated in 1866 and has since grown to become a thriving community.
Hammonton has a long and storied history. During the Revolutionary War, the town was a major supply center for the Continental Army. In the 19th century, the town was a major hub for the lumber industry, with several sawmills located along the Mullica River. The town was also home to several glass factories, which produced bottles and jars for the local canning industry.
Geography
Hammonton is located in Atlantic County, approximately 30 miles west of Atlantic City. The town is situated on the banks of the Mullica River and is surrounded by several small towns and villages. The town is located in the Pine Barrens, a large area of pine forests and wetlands that stretches across the southern part of New Jersey.
The town is divided into two distinct sections: the “Old Town” and the “New Town.” The Old Town is located on the banks of the Mullica River and is home to many of the town’s historic buildings and landmarks. The New Town is located on higher ground and is home to many of the town’s newer developments.
Economy
Hammonton’s economy is largely based on agriculture and tourism. The town is home to several farms, which produce a variety of fruits and vegetables. The town is also home to several wineries, which produce a variety of wines.
The town is also home to several small businesses, including restaurants, retail stores, and professional services. The town is also home to several manufacturing companies, which produce a variety of products, including furniture, clothing, and electronics.
Demographics
As of the 2010 census, the population of Hammonton was 14,791. The town is predominantly white (87.3%), with a small Hispanic population (7.2%) and a small African American population (3.2%). The median household income is $60,945, and the median age is 40.
Hammonton is a small town with a rich history, diverse geography, and vibrant economy. The town is home to a diverse population and is a great place to live, work, and play.
Common Questions
What is Per Capita Income in Hammonton?
Per Capita income in Hammonton is $43,688.
What is the Median Family Income in Hammonton?
Median Family Income in Hammonton is $105,625.
What is the Median Household income in Hammonton?
Median Household Income in Hammonton is $79,747.
What is Income or Wage Gap in Hammonton?
Income or Wage Gap in Hammonton is 33.5%.
Women in Hammonton earn 66.5 cents for every dollar earned by a man.
What is Inequality or Gini Index in Hammonton?
Inequality or Gini Index in Hammonton is 0.48.
What is the Total Population of Hammonton?
Total Population of Hammonton is 14,732.
What is the Total Male Population of Hammonton?
Total Male Population of Hammonton is 7,526.
What is the Total Female Population of Hammonton?
Total Female Population of Hammonton is 7,206.
What is the Ratio of Males per 100 Females in Hammonton?
There are 104.44 Males per 100 Females in Hammonton.
What is the Ratio of Females per 100 Males in Hammonton?
There are 95.75 Females per 100 Males in Hammonton.
What is the Median Population Age in Hammonton?
Median Population Age in Hammonton is 46.2 Years.
What is the Average Family Size in Hammonton
Average Family Size in Hammonton is 3.0 People.
What is the Average Household Size in Hammonton
Average Household Size in Hammonton is 2.5 People.
How Large is the Labor Force in Hammonton?
There are 8,136 People in the Labor Forcein in Hammonton.
What is the Percentage of People in the Labor Force in Hammonton?
65.7% of People are in the Labor Force in Hammonton.
What is the Unemployment Rate in Hammonton?
Unemployment Rate in Hammonton is 7.4%.