Oxford, NJ Map & Demographics
Oxford Map
Oxford Overview
$50,080
PER CAPITA INCOME
$79,583
AVG FAMILY INCOME
$60,833
AVG HOUSEHOLD INCOME
13.2%
WAGE / INCOME GAP [ % ]
86.8¢/ $1
WAGE / INCOME GAP [ $ ]
0.50
INEQUALITY / GINI INDEX
1,249
TOTAL POPULATION
714
MALE POPULATION
535
FEMALE POPULATION
133.46
MALES / 100 FEMALES
74.93
FEMALES / 100 MALES
43.1
MEDIAN AGE
2.9
AVG FAMILY SIZE
2.5
AVG HOUSEHOLD SIZE
806
LABOR FORCE [ PEOPLE ]
73.3%
PERCENT IN LABOR FORCE
8.2%
UNEMPLOYMENT RATE
Oxford Zip Codes
Oxford Area Codes
Income in Oxford
Income Overview in Oxford
Per Capita Income in Oxford is $50,080, while median incomes of families and households are $79,583 and $60,833 respectively.
| Characteristic | Number | Measure |
| Per Capita Income | 1,249 | $50,080 |
| Median Family Income | 291 | $79,583 |
| Mean Family Income | 291 | $108,197 |
| Median Household Income | 480 | $60,833 |
| Mean Household Income | 480 | $109,070 |
| Income Deficit | 291 | $0 |
| Wage / Income Gap (%) | 1,249 | 13.23% |
| Wage / Income Gap ($) | 1,249 | 86.77¢ per $1 |
| Gini / Inequality Index | 1,249 | 0.50 |
Earnings by Sex in Oxford
Average Earnings in Oxford are $46,140, $48,813 for men and $42,353 for women, a difference of 13.2%.
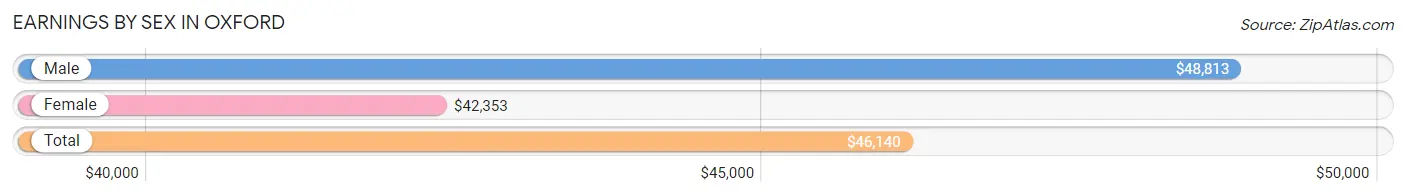
| Sex | Number | Average Earnings |
| Male | 421 (53.6%) | $48,813 |
| Female | 364 (46.4%) | $42,353 |
| Total | 785 (100.0%) | $46,140 |
Earnings by Sex by Income Bracket in Oxford
The most common earnings brackets in Oxford are $100,000+ for men (115 | 27.3%) and $45,000 to $49,999 for women (68 | 18.7%).
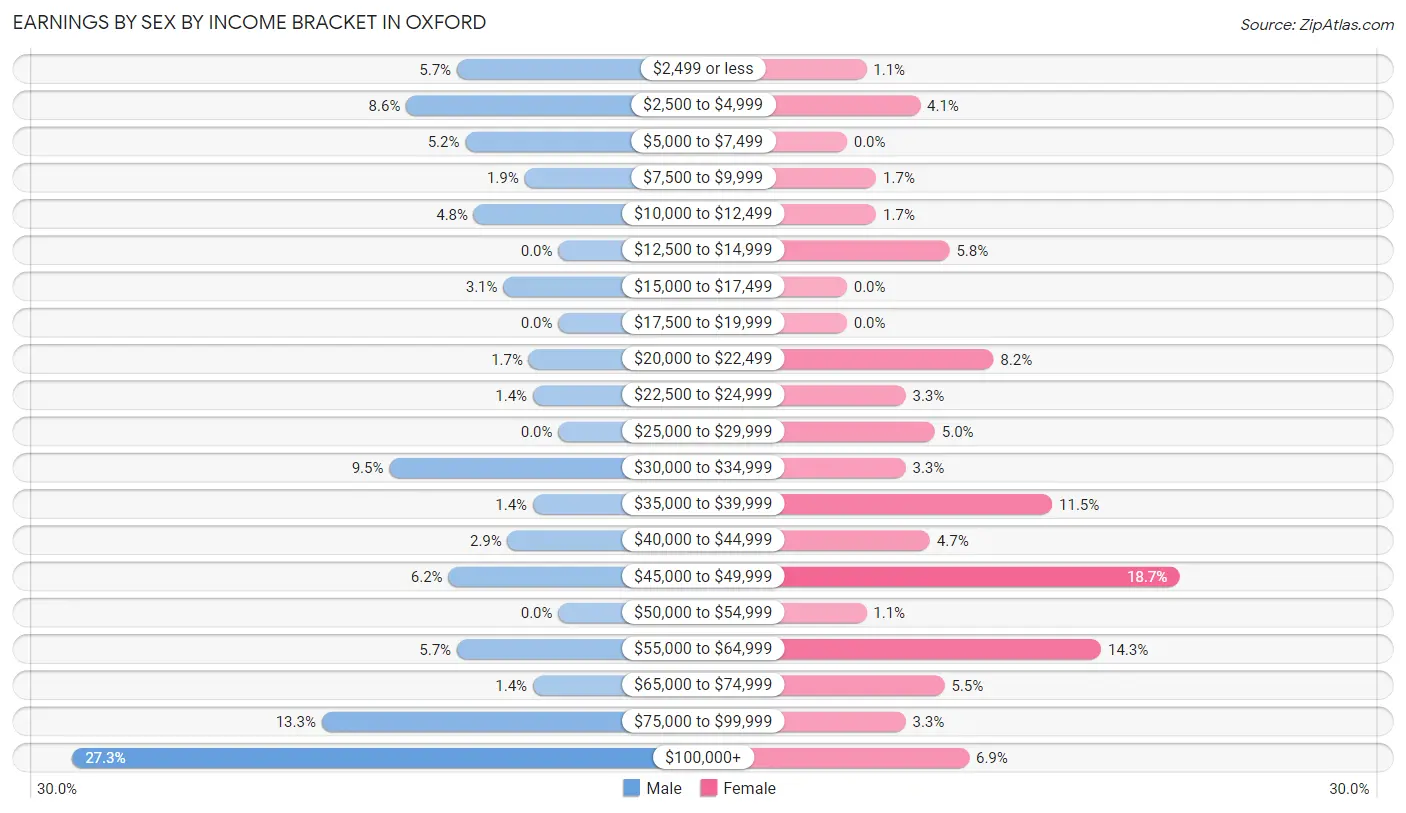
| Income | Male | Female |
| $2,499 or less | 24 (5.7%) | 4 (1.1%) |
| $2,500 to $4,999 | 36 (8.6%) | 15 (4.1%) |
| $5,000 to $7,499 | 22 (5.2%) | 0 (0.0%) |
| $7,500 to $9,999 | 8 (1.9%) | 6 (1.7%) |
| $10,000 to $12,499 | 20 (4.8%) | 6 (1.7%) |
| $12,500 to $14,999 | 0 (0.0%) | 21 (5.8%) |
| $15,000 to $17,499 | 13 (3.1%) | 0 (0.0%) |
| $17,500 to $19,999 | 0 (0.0%) | 0 (0.0%) |
| $20,000 to $22,499 | 7 (1.7%) | 30 (8.2%) |
| $22,500 to $24,999 | 6 (1.4%) | 12 (3.3%) |
| $25,000 to $29,999 | 0 (0.0%) | 18 (5.0%) |
| $30,000 to $34,999 | 40 (9.5%) | 12 (3.3%) |
| $35,000 to $39,999 | 6 (1.4%) | 42 (11.5%) |
| $40,000 to $44,999 | 12 (2.9%) | 17 (4.7%) |
| $45,000 to $49,999 | 26 (6.2%) | 68 (18.7%) |
| $50,000 to $54,999 | 0 (0.0%) | 4 (1.1%) |
| $55,000 to $64,999 | 24 (5.7%) | 52 (14.3%) |
| $65,000 to $74,999 | 6 (1.4%) | 20 (5.5%) |
| $75,000 to $99,999 | 56 (13.3%) | 12 (3.3%) |
| $100,000+ | 115 (27.3%) | 25 (6.9%) |
| Total | 421 (100.0%) | 364 (100.0%) |
Earnings by Sex by Educational Attainment in Oxford
Average earnings in Oxford are $70,208 for men and $45,848 for women, a difference of 34.7%. Men with an educational attainment of high school diploma enjoy the highest average annual earnings of $153,077, while those with college or associate's degree education earn the least with $40,000. Women with an educational attainment of less than high school earn the most with the average annual earnings of $150,750, while those with high school diploma education have the smallest earnings of $28,333.
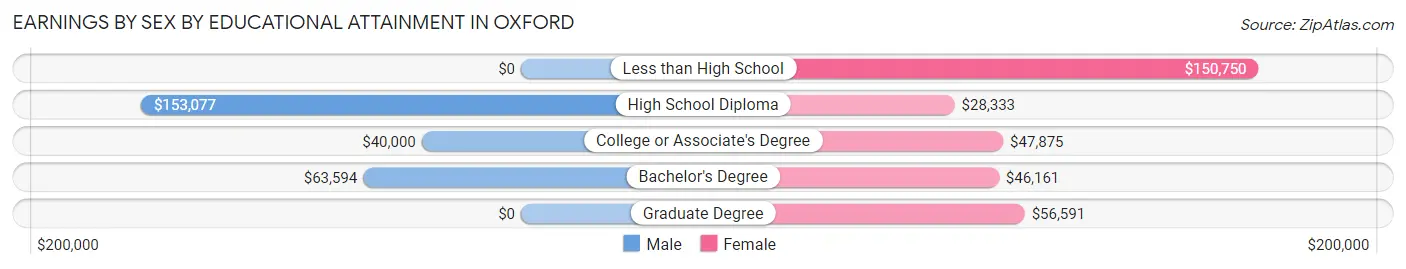
| Educational Attainment | Male Income | Female Income |
| Less than High School | - | - |
| High School Diploma | $153,077 | $28,333 |
| College or Associate's Degree | $40,000 | $47,875 |
| Bachelor's Degree | $63,594 | $46,161 |
| Graduate Degree | - | - |
| Total | $70,208 | $45,848 |
Family Income in Oxford
Family Income Brackets in Oxford
According to the Oxford family income data, there are 62 families falling into the $35,000 to $49,999 income range, which is the most common income bracket and makes up 21.3% of all families.
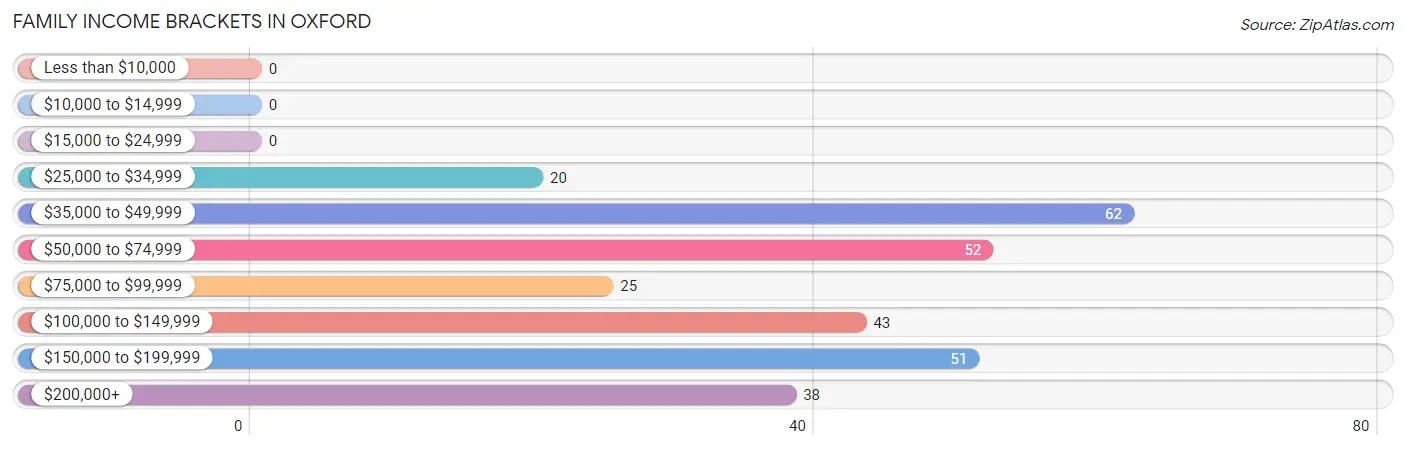
| Income Bracket | # Families | % Families |
| Less than $10,000 | 0 | 0.0% |
| $10,000 to $14,999 | 0 | 0.0% |
| $15,000 to $24,999 | 0 | 0.0% |
| $25,000 to $34,999 | 20 | 6.9% |
| $35,000 to $49,999 | 62 | 21.3% |
| $50,000 to $74,999 | 52 | 17.9% |
| $75,000 to $99,999 | 25 | 8.6% |
| $100,000 to $149,999 | 43 | 14.8% |
| $150,000 to $199,999 | 51 | 17.5% |
| $200,000+ | 38 | 13.1% |
Family Income by Famaliy Size in Oxford
3-person families (70 | 24.0%) account for the highest median family income in Oxford with $130,926 per family, while 3-person families (70 | 24.0%) have the highest median income of $43,642 per family member.
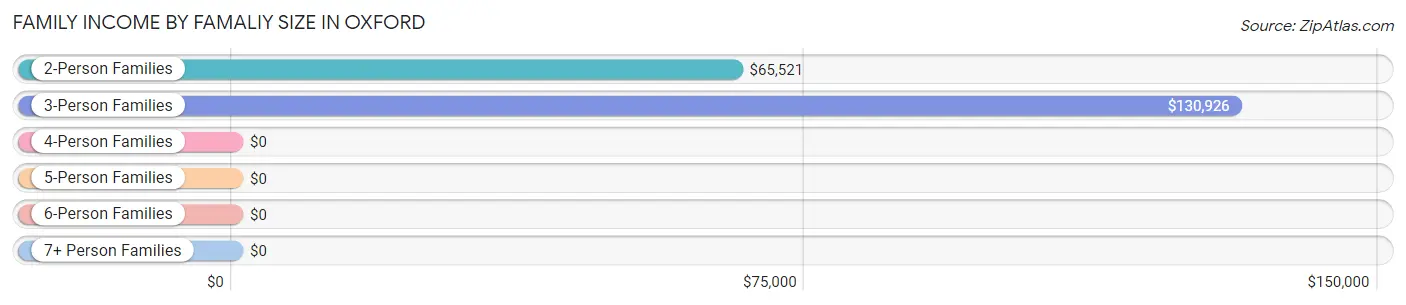
| Income Bracket | # Families | Median Income |
| 2-Person Families | 155 (53.3%) | $65,521 |
| 3-Person Families | 70 (24.0%) | $130,926 |
| 4-Person Families | 34 (11.7%) | $0 |
| 5-Person Families | 25 (8.6%) | $0 |
| 6-Person Families | 2 (0.7%) | $0 |
| 7+ Person Families | 5 (1.7%) | $0 |
| Total | 291 (100.0%) | $79,583 |
Family Income by Number of Earners in Oxford
The median family income in Oxford is $79,583, with families comprising 3+ earners (22) having the highest median family income of $181,750, while families with 1 earner (61) have the lowest median family income of $49,485, accounting for 7.6% and 21.0% of families, respectively.
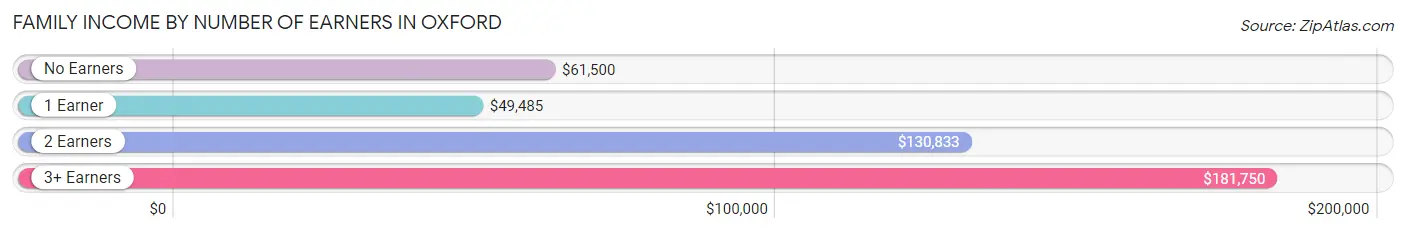
| Number of Earners | # Families | Median Income |
| No Earners | 40 (13.8%) | $61,500 |
| 1 Earner | 61 (21.0%) | $49,485 |
| 2 Earners | 168 (57.7%) | $130,833 |
| 3+ Earners | 22 (7.6%) | $181,750 |
| Total | 291 (100.0%) | $79,583 |
Household Income in Oxford
Household Income Brackets in Oxford
With 104 households falling in the category, the $35,000 to $49,999 income range is the most frequent in Oxford, accounting for 21.7% of all households. In contrast, only 7 households (1.5%) fall into the $15,000 to $24,999 income bracket, making it the least populous group.
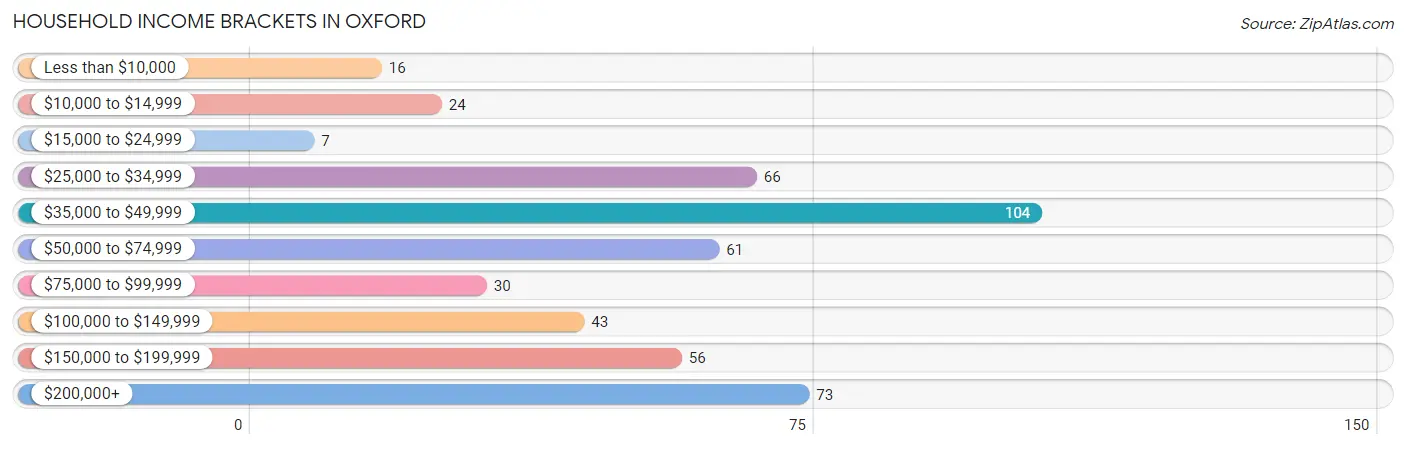
| Income Bracket | # Households | % Households |
| Less than $10,000 | 16 | 3.3% |
| $10,000 to $14,999 | 24 | 5.0% |
| $15,000 to $24,999 | 7 | 1.5% |
| $25,000 to $34,999 | 66 | 13.8% |
| $35,000 to $49,999 | 104 | 21.7% |
| $50,000 to $74,999 | 61 | 12.7% |
| $75,000 to $99,999 | 30 | 6.3% |
| $100,000 to $149,999 | 43 | 9.0% |
| $150,000 to $199,999 | 56 | 11.7% |
| $200,000+ | 73 | 15.2% |
Household Income by Householder Age in Oxford
The median household income in Oxford is $60,833, with the highest median household income of $130,926 found in the 25 to 44 years age bracket for the primary householder. A total of 164 households (34.2%) fall into this category. Meanwhile, the 15 to 24 years age bracket for the primary householder has the lowest median household income of $0, with 8 households (1.7%) in this group.
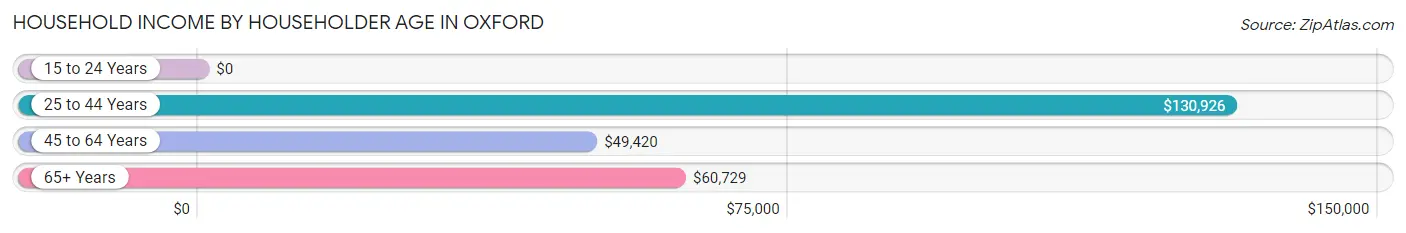
| Income Bracket | # Households | Median Income |
| 15 to 24 Years | 8 (1.7%) | $0 |
| 25 to 44 Years | 164 (34.2%) | $130,926 |
| 45 to 64 Years | 151 (31.5%) | $49,420 |
| 65+ Years | 157 (32.7%) | $60,729 |
| Total | 480 (100.0%) | $60,833 |
Poverty in Oxford
Income Below Poverty by Sex and Age in Oxford
With 12.5% poverty level for males and 4.3% for females among the residents of Oxford, 25 to 34 year old males and 18 to 24 year old females are the most vulnerable to poverty, with 29 males (34.9%) and 14 females (43.8%) in their respective age groups living below the poverty level.
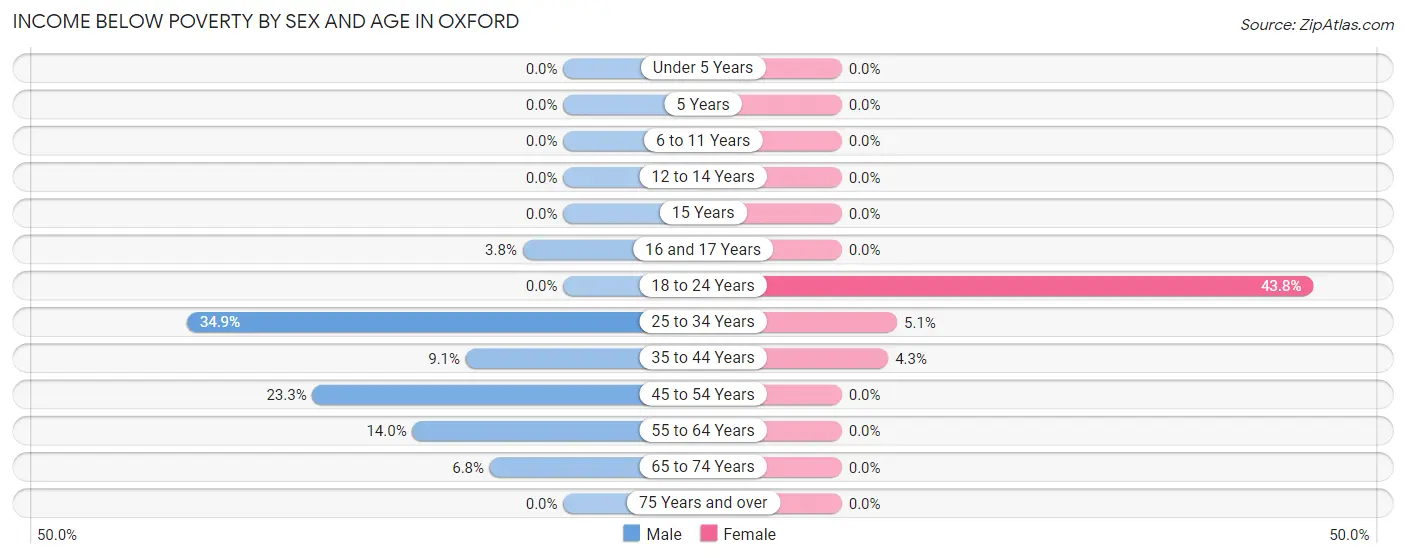
| Age Bracket | Male | Female |
| Under 5 Years | 0 (0.0%) | 0 (0.0%) |
| 5 Years | 0 (0.0%) | 0 (0.0%) |
| 6 to 11 Years | 0 (0.0%) | 0 (0.0%) |
| 12 to 14 Years | 0 (0.0%) | 0 (0.0%) |
| 15 Years | 0 (0.0%) | 0 (0.0%) |
| 16 and 17 Years | 2 (3.8%) | 0 (0.0%) |
| 18 to 24 Years | 0 (0.0%) | 14 (43.8%) |
| 25 to 34 Years | 29 (34.9%) | 4 (5.1%) |
| 35 to 44 Years | 18 (9.0%) | 5 (4.3%) |
| 45 to 54 Years | 27 (23.3%) | 0 (0.0%) |
| 55 to 64 Years | 7 (14.0%) | 0 (0.0%) |
| 65 to 74 Years | 6 (6.8%) | 0 (0.0%) |
| 75 Years and over | 0 (0.0%) | 0 (0.0%) |
| Total | 89 (12.5%) | 23 (4.3%) |
Income Above Poverty by Sex and Age in Oxford
According to the poverty statistics in Oxford, males aged under 5 years and females aged under 5 years are the age groups that are most secure financially, with 100.0% of males and 100.0% of females in these age groups living above the poverty line.
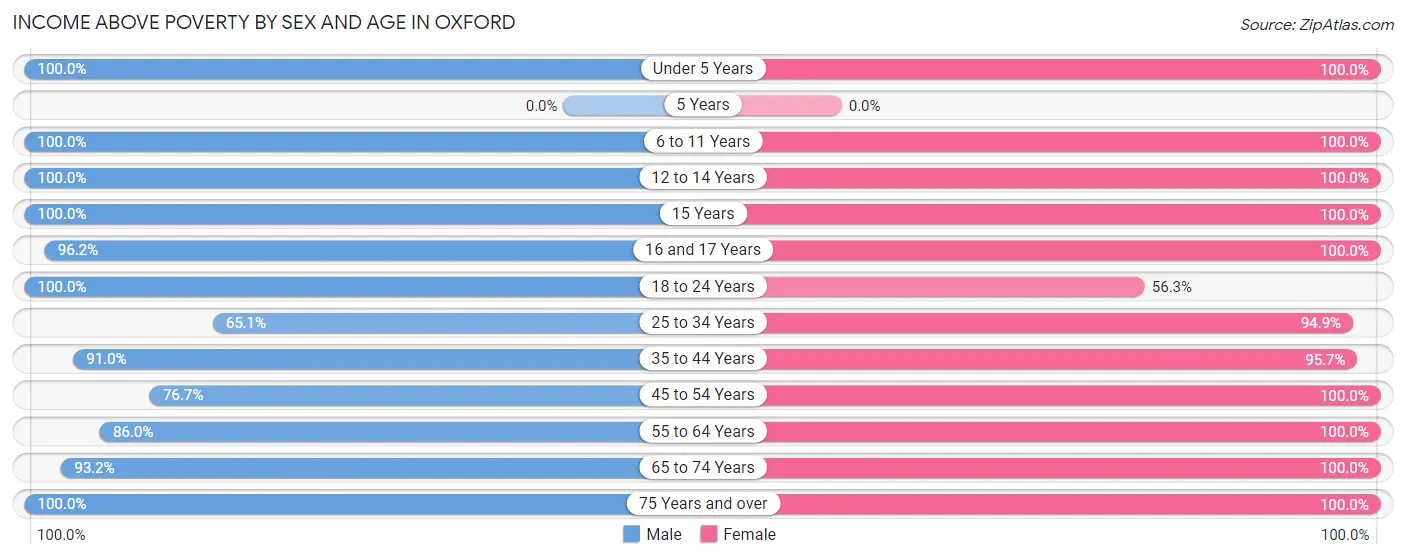
| Age Bracket | Male | Female |
| Under 5 Years | 29 (100.0%) | 18 (100.0%) |
| 5 Years | 0 (0.0%) | 0 (0.0%) |
| 6 to 11 Years | 10 (100.0%) | 34 (100.0%) |
| 12 to 14 Years | 19 (100.0%) | 19 (100.0%) |
| 15 Years | 16 (100.0%) | 3 (100.0%) |
| 16 and 17 Years | 51 (96.2%) | 22 (100.0%) |
| 18 to 24 Years | 32 (100.0%) | 18 (56.2%) |
| 25 to 34 Years | 54 (65.1%) | 74 (94.9%) |
| 35 to 44 Years | 181 (90.9%) | 111 (95.7%) |
| 45 to 54 Years | 89 (76.7%) | 40 (100.0%) |
| 55 to 64 Years | 43 (86.0%) | 82 (100.0%) |
| 65 to 74 Years | 82 (93.2%) | 47 (100.0%) |
| 75 Years and over | 19 (100.0%) | 42 (100.0%) |
| Total | 625 (87.5%) | 510 (95.7%) |
Income Below Poverty Among Married-Couple Families in Oxford
| Children | Above Poverty | Below Poverty |
| No Children | 72 (100.0%) | 0 (0.0%) |
| 1 or 2 Children | 89 (100.0%) | 0 (0.0%) |
| 3 or 4 Children | 27 (100.0%) | 0 (0.0%) |
| 5 or more Children | 0 (0.0%) | 0 (0.0%) |
| Total | 188 (100.0%) | 0 (0.0%) |
Income Below Poverty Among Single-Parent Households in Oxford
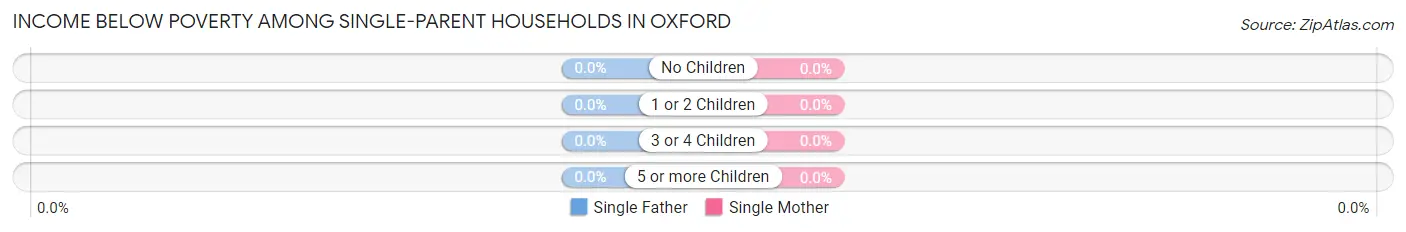
| Children | Single Father | Single Mother |
| No Children | 0 (0.0%) | 0 (0.0%) |
| 1 or 2 Children | 0 (0.0%) | 0 (0.0%) |
| 3 or 4 Children | 0 (0.0%) | 0 (0.0%) |
| 5 or more Children | 0 (0.0%) | 0 (0.0%) |
| Total | 0 (0.0%) | 0 (0.0%) |
Income Below Poverty Among Married-Couple vs Single-Parent Households in Oxford
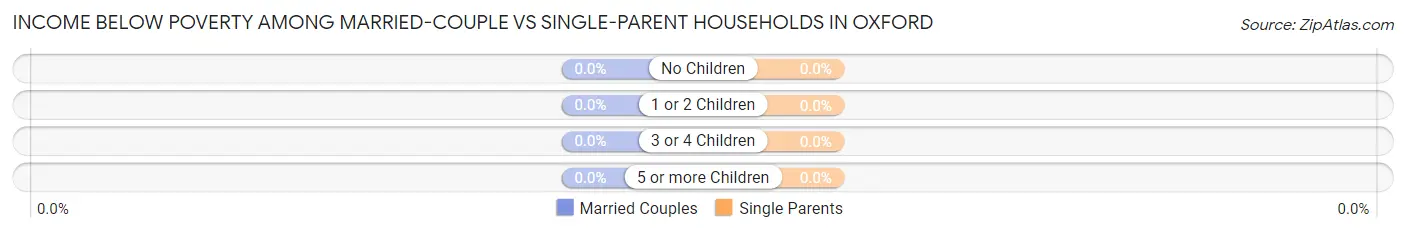
| Children | Married-Couple Families | Single-Parent Households |
| No Children | 0 (0.0%) | 0 (0.0%) |
| 1 or 2 Children | 0 (0.0%) | 0 (0.0%) |
| 3 or 4 Children | 0 (0.0%) | 0 (0.0%) |
| 5 or more Children | 0 (0.0%) | 0 (0.0%) |
| Total | 0 (0.0%) | 0 (0.0%) |
Race in Oxford
The most populous races in Oxford are White / Caucasian (1,112 | 89.0%), Hispanic or Latino (204 | 16.3%), and Some other Race (57 | 4.6%).
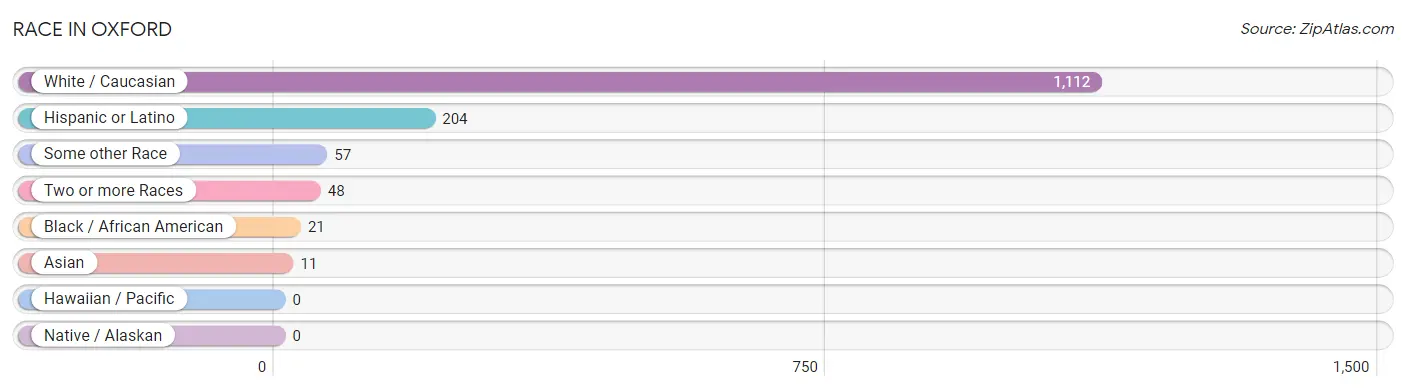
| Race | # Population | % Population |
| Asian | 11 | 0.9% |
| Black / African American | 21 | 1.7% |
| Hawaiian / Pacific | 0 | 0.0% |
| Hispanic or Latino | 204 | 16.3% |
| Native / Alaskan | 0 | 0.0% |
| White / Caucasian | 1,112 | 89.0% |
| Two or more Races | 48 | 3.8% |
| Some other Race | 57 | 4.6% |
| Total | 1,249 | 100.0% |
Ancestry in Oxford
The most populous ancestries reported in Oxford are German (257 | 20.6%), Italian (197 | 15.8%), Irish (153 | 12.2%), English (128 | 10.2%), and American (91 | 7.3%), together accounting for 66.1% of all Oxford residents.
| Ancestry | # Population | % Population |
| American | 91 | 7.3% |
| Arapaho | 6 | 0.5% |
| Austrian | 5 | 0.4% |
| Bangladeshi | 11 | 0.9% |
| Central American | 33 | 2.6% |
| Colombian | 65 | 5.2% |
| Costa Rican | 33 | 2.6% |
| Cuban | 22 | 1.8% |
| Danish | 8 | 0.6% |
| Dutch | 36 | 2.9% |
| Eastern European | 4 | 0.3% |
| English | 128 | 10.2% |
| French | 14 | 1.1% |
| German | 257 | 20.6% |
| Greek | 6 | 0.5% |
| Hungarian | 10 | 0.8% |
| Irish | 153 | 12.2% |
| Italian | 197 | 15.8% |
| Native Hawaiian | 3 | 0.2% |
| Nigerian | 5 | 0.4% |
| Polish | 58 | 4.6% |
| Portuguese | 11 | 0.9% |
| Puerto Rican | 53 | 4.2% |
| Russian | 75 | 6.0% |
| Scotch-Irish | 3 | 0.2% |
| Scottish | 8 | 0.6% |
| Slovak | 17 | 1.4% |
| South American | 65 | 5.2% |
| Spanish | 17 | 1.4% |
| Subsaharan African | 5 | 0.4% |
| Swedish | 6 | 0.5% |
| Ukrainian | 66 | 5.3% |
| Welsh | 23 | 1.8% | View All 33 Rows |
Immigrants in Oxford
The most numerous immigrant groups reported in Oxford came from Latin America (73 | 5.8%), Colombia (53 | 4.2%), South America (53 | 4.2%), Central America (20 | 1.6%), and Costa Rica (20 | 1.6%), together accounting for 17.5% of all Oxford residents.
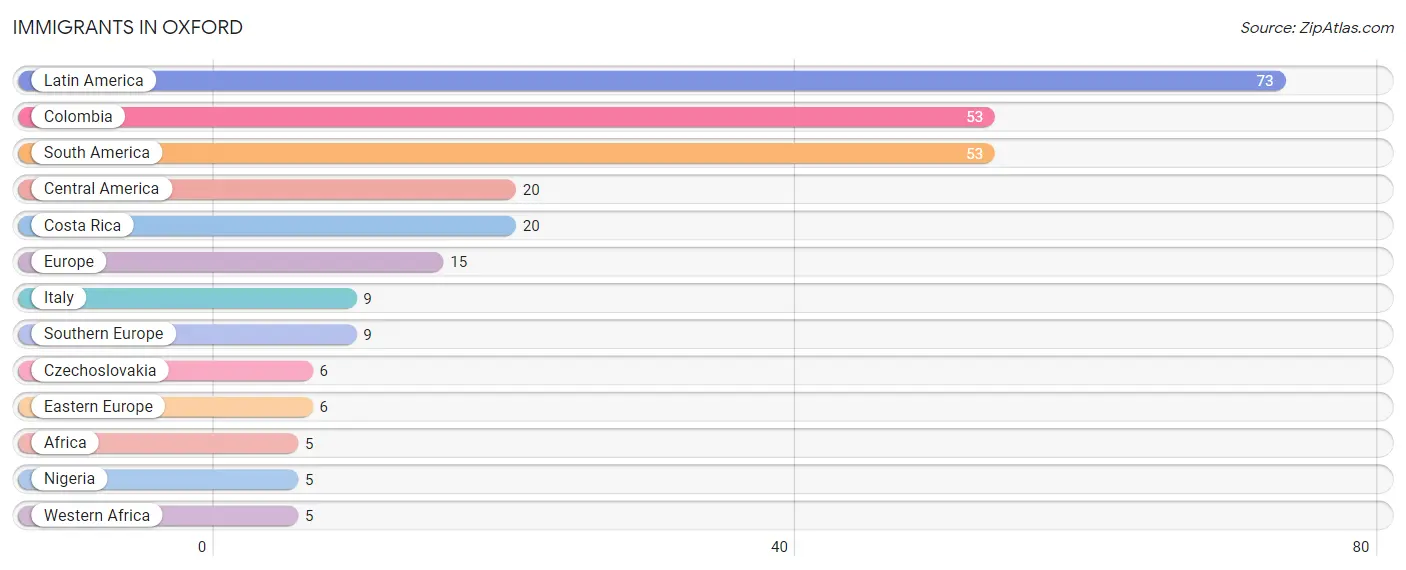
| Immigration Origin | # Population | % Population |
| Africa | 5 | 0.4% |
| Central America | 20 | 1.6% |
| Colombia | 53 | 4.2% |
| Costa Rica | 20 | 1.6% |
| Czechoslovakia | 6 | 0.5% |
| Eastern Europe | 6 | 0.5% |
| Europe | 15 | 1.2% |
| Italy | 9 | 0.7% |
| Latin America | 73 | 5.8% |
| Nigeria | 5 | 0.4% |
| South America | 53 | 4.2% |
| Southern Europe | 9 | 0.7% |
| Western Africa | 5 | 0.4% | View All 13 Rows |
Sex and Age in Oxford
Sex and Age in Oxford
The most populous age groups in Oxford are 40 to 44 Years (144 | 20.2%) for men and 25 to 29 Years (74 | 13.8%) for women.
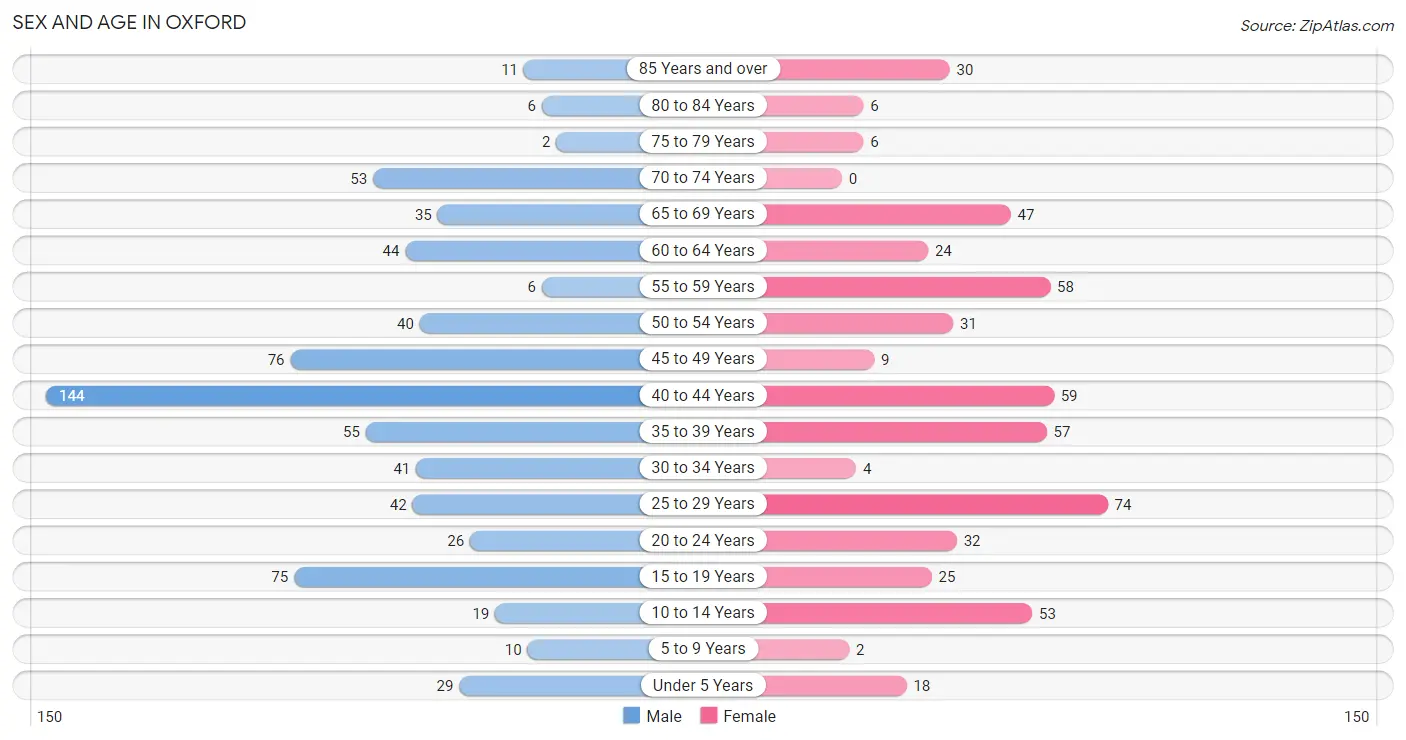
| Age Bracket | Male | Female |
| Under 5 Years | 29 (4.1%) | 18 (3.4%) |
| 5 to 9 Years | 10 (1.4%) | 2 (0.4%) |
| 10 to 14 Years | 19 (2.7%) | 53 (9.9%) |
| 15 to 19 Years | 75 (10.5%) | 25 (4.7%) |
| 20 to 24 Years | 26 (3.6%) | 32 (6.0%) |
| 25 to 29 Years | 42 (5.9%) | 74 (13.8%) |
| 30 to 34 Years | 41 (5.7%) | 4 (0.7%) |
| 35 to 39 Years | 55 (7.7%) | 57 (10.6%) |
| 40 to 44 Years | 144 (20.2%) | 59 (11.0%) |
| 45 to 49 Years | 76 (10.6%) | 9 (1.7%) |
| 50 to 54 Years | 40 (5.6%) | 31 (5.8%) |
| 55 to 59 Years | 6 (0.8%) | 58 (10.8%) |
| 60 to 64 Years | 44 (6.2%) | 24 (4.5%) |
| 65 to 69 Years | 35 (4.9%) | 47 (8.8%) |
| 70 to 74 Years | 53 (7.4%) | 0 (0.0%) |
| 75 to 79 Years | 2 (0.3%) | 6 (1.1%) |
| 80 to 84 Years | 6 (0.8%) | 6 (1.1%) |
| 85 Years and over | 11 (1.5%) | 30 (5.6%) |
| Total | 714 (100.0%) | 535 (100.0%) |
Families and Households in Oxford
Median Family Size in Oxford
The median family size in Oxford is 2.87 persons per family, with married-couple families (188 | 64.6%) accounting for the largest median family size of 3.22 persons per family. On the other hand, single male/father families (31 | 10.6%) represent the smallest median family size with 1.77 persons per family.
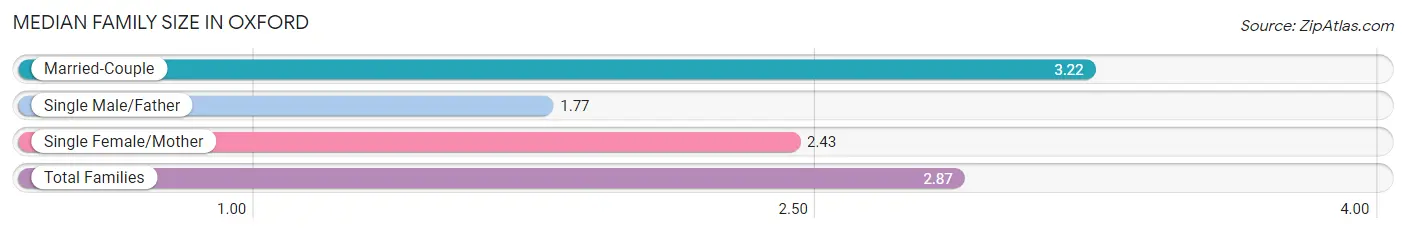
| Family Type | # Families | Family Size |
| Married-Couple | 188 (64.6%) | 3.22 |
| Single Male/Father | 31 (10.6%) | 1.77 |
| Single Female/Mother | 72 (24.7%) | 2.43 |
| Total Families | 291 (100.0%) | 2.87 |
Median Household Size in Oxford
The median household size in Oxford is 2.53 persons per household, with single female/mother households (72 | 15.0%) accounting for the largest median household size of 4.08 persons per household. non-family households (189 | 39.4%) represent the smallest median household size with 1.21 persons per household.
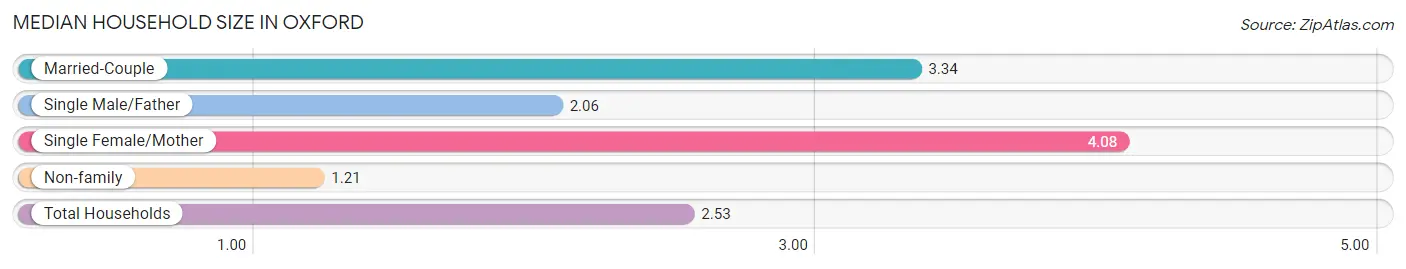
| Household Type | # Households | Household Size |
| Married-Couple | 188 (39.2%) | 3.34 |
| Single Male/Father | 31 (6.5%) | 2.06 |
| Single Female/Mother | 72 (15.0%) | 4.08 |
| Non-family | 189 (39.4%) | 1.21 |
| Total Households | 480 (100.0%) | 2.53 |
Household Size by Marriage Status in Oxford
Out of a total of 480 households in Oxford, 291 (60.6%) are family households, while 189 (39.4%) are nonfamily households. The most numerous type of family households are 2-person households, comprising 124, and the most common type of nonfamily households are 1-person households, comprising 152.
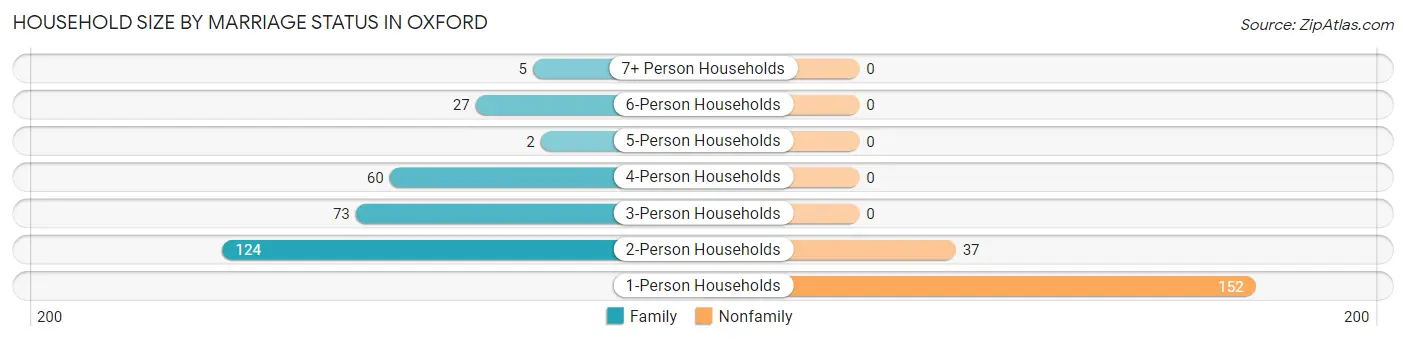
| Household Size | Family Households | Nonfamily Households |
| 1-Person Households | - | 152 (31.7%) |
| 2-Person Households | 124 (25.8%) | 37 (7.7%) |
| 3-Person Households | 73 (15.2%) | 0 (0.0%) |
| 4-Person Households | 60 (12.5%) | 0 (0.0%) |
| 5-Person Households | 2 (0.4%) | 0 (0.0%) |
| 6-Person Households | 27 (5.6%) | 0 (0.0%) |
| 7+ Person Households | 5 (1.0%) | 0 (0.0%) |
| Total | 291 (60.6%) | 189 (39.4%) |
Female Fertility in Oxford
Fertility by Age in Oxford
Average fertility rate in Oxford is 14.0 births per 1,000 women. Women in the age bracket of 20 to 34 years have the highest fertility rate with 27.0 births per 1,000 women. Women in the age bracket of 20 to 34 years acount for 75.0% of all women with births.
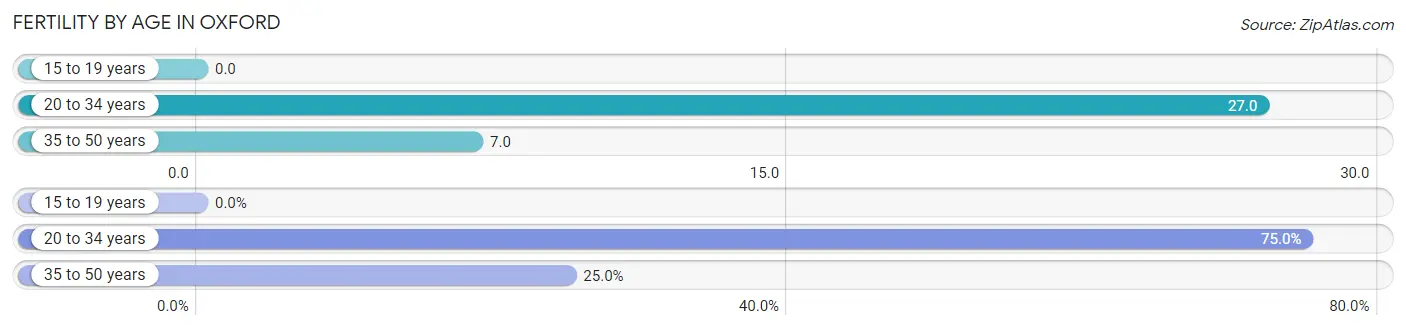
| Age Bracket | Women with Births | Births / 1,000 Women |
| 15 to 19 years | 0 (0.0%) | 0.0 |
| 20 to 34 years | 3 (75.0%) | 27.0 |
| 35 to 50 years | 1 (25.0%) | 7.0 |
| Total | 4 (100.0%) | 14.0 |
Fertility by Age by Marriage Status in Oxford
25.0% of women with births (4) in Oxford are married. The highest percentage of unmarried women with births falls into 20 to 34 years age bracket with 100.0% of them unmarried at the time of birth, while the lowest percentage of unmarried women with births belong to 35 to 50 years age bracket with 0.0% of them unmarried.
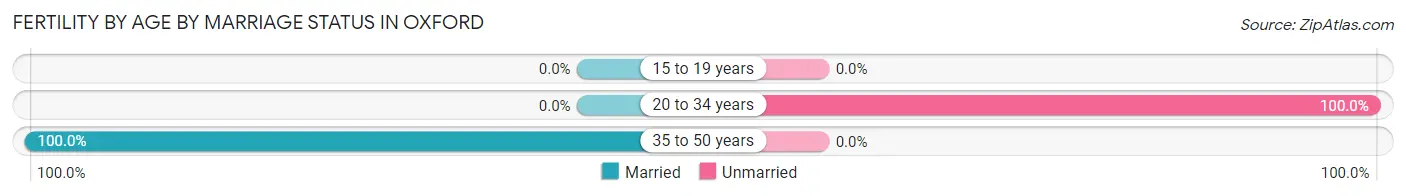
| Age Bracket | Married | Unmarried |
| 15 to 19 years | 0 (0.0%) | 0 (0.0%) |
| 20 to 34 years | 0 (0.0%) | 3 (100.0%) |
| 35 to 50 years | 1 (100.0%) | 0 (0.0%) |
| Total | 1 (25.0%) | 3 (75.0%) |
Fertility by Education in Oxford
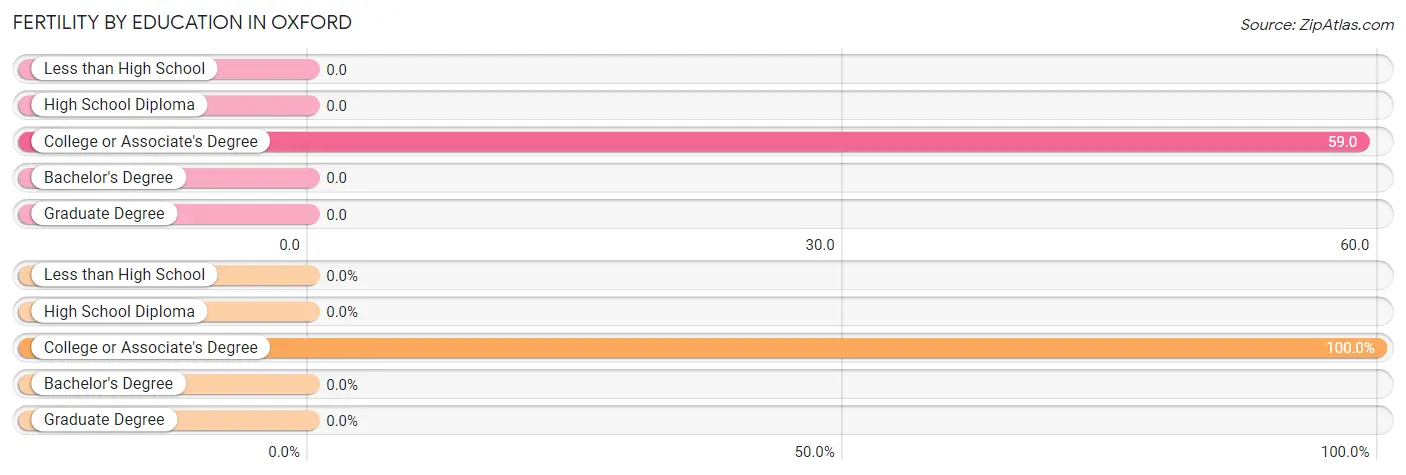
| Educational Attainment | Women with Births | Births / 1,000 Women |
| Less than High School | 0 (0.0%) | 0.0 |
| High School Diploma | 0 (0.0%) | 0.0 |
| College or Associate's Degree | 4 (100.0%) | 59.0 |
| Bachelor's Degree | 0 (0.0%) | 0.0 |
| Graduate Degree | 0 (0.0%) | 0.0 |
| Total | 4 (100.0%) | 14.0 |
Fertility by Education by Marriage Status in Oxford
75.0% of women with births in Oxford are unmarried. Women with the educational attainment of college or associate's degree are most likely to be married with 25.0% of them married at childbirth, while women with the educational attainment of college or associate's degree are least likely to be married with 75.0% of them unmarried at childbirth.
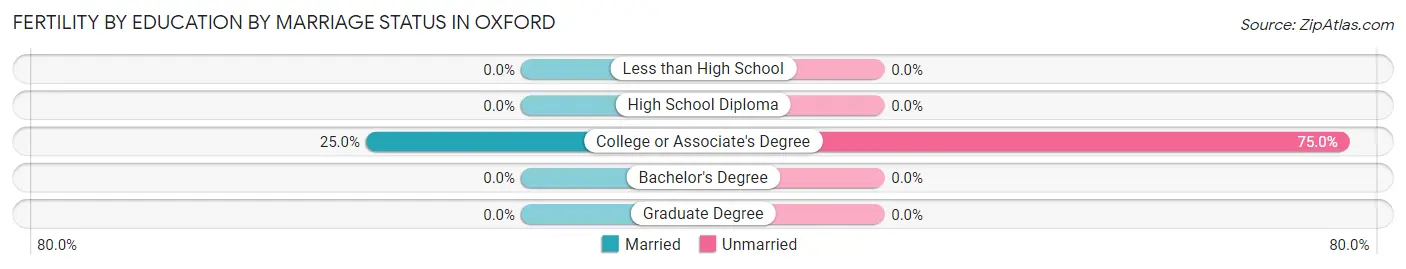
| Educational Attainment | Married | Unmarried |
| Less than High School | 0 (0.0%) | 0 (0.0%) |
| High School Diploma | 0 (0.0%) | 0 (0.0%) |
| College or Associate's Degree | 1 (25.0%) | 3 (75.0%) |
| Bachelor's Degree | 0 (0.0%) | 0 (0.0%) |
| Graduate Degree | 0 (0.0%) | 0 (0.0%) |
| Total | 1 (25.0%) | 3 (75.0%) |
Employment Characteristics in Oxford
Employment by Class of Employer in Oxford
Among the 734 employed individuals in Oxford, private company employees (511 | 69.6%), self-employed (not incorporated) (64 | 8.7%), and not-for-profit organizations (52 | 7.1%) make up the most common classes of employment.
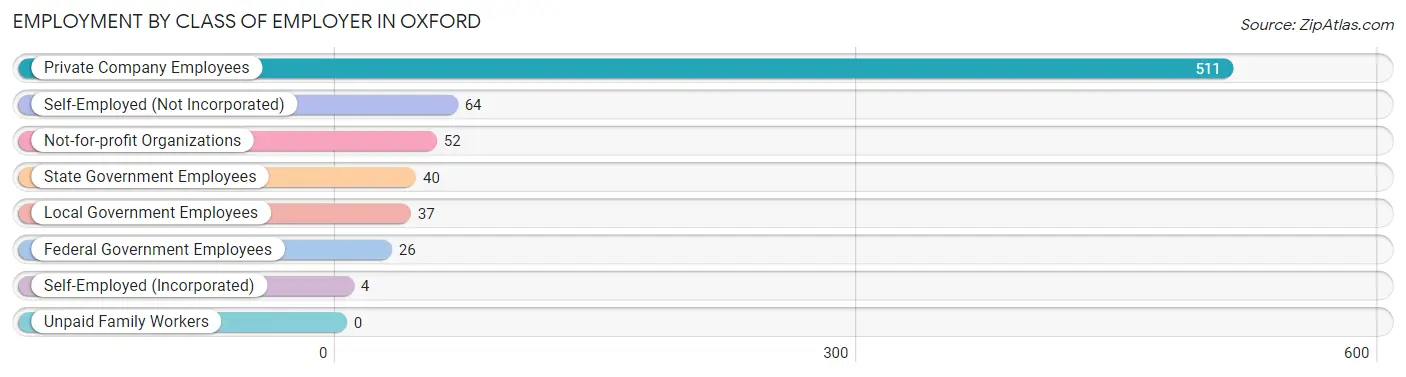
| Employer Class | # Employees | % Employees |
| Private Company Employees | 511 | 69.6% |
| Self-Employed (Incorporated) | 4 | 0.5% |
| Self-Employed (Not Incorporated) | 64 | 8.7% |
| Not-for-profit Organizations | 52 | 7.1% |
| Local Government Employees | 37 | 5.0% |
| State Government Employees | 40 | 5.4% |
| Federal Government Employees | 26 | 3.5% |
| Unpaid Family Workers | 0 | 0.0% |
| Total | 734 | 100.0% |
Employment Status by Age in Oxford
According to the labor force statistics for Oxford, out of the total population over 16 years of age (1,099), 73.3% or 806 individuals are in the labor force, with 8.2% or 66 of them unemployed. The age group with the highest labor force participation rate is 25 to 29 years, with 100.0% or 116 individuals in the labor force. Within the labor force, the 45 to 54 years age range has the highest percentage of unemployed individuals, with 17.7% or 22 of them being unemployed.
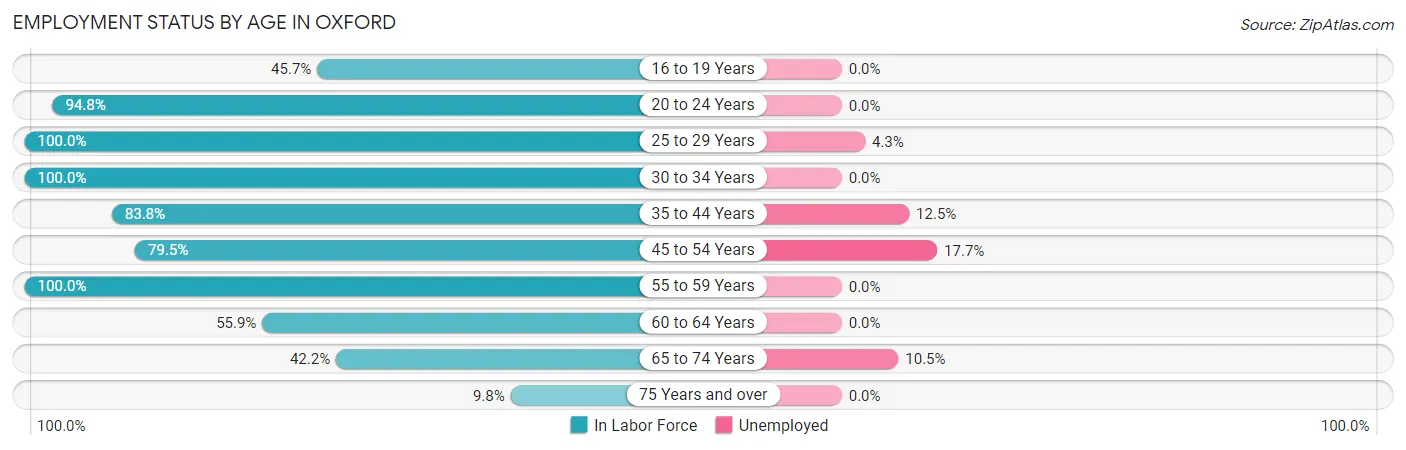
| Age Bracket | In Labor Force | Unemployed |
| 16 to 19 Years | 37 (45.7%) | 0 (0.0%) |
| 20 to 24 Years | 55 (94.8%) | 0 (0.0%) |
| 25 to 29 Years | 116 (100.0%) | 5 (4.3%) |
| 30 to 34 Years | 45 (100.0%) | 0 (0.0%) |
| 35 to 44 Years | 264 (83.8%) | 33 (12.5%) |
| 45 to 54 Years | 124 (79.5%) | 22 (17.7%) |
| 55 to 59 Years | 64 (100.0%) | 0 (0.0%) |
| 60 to 64 Years | 38 (55.9%) | 0 (0.0%) |
| 65 to 74 Years | 57 (42.2%) | 6 (10.5%) |
| 75 Years and over | 6 (9.8%) | 0 (0.0%) |
| Total | 806 (73.3%) | 66 (8.2%) |
Employment Status by Educational Attainment in Oxford
According to labor force statistics for Oxford, 85.2% of individuals (651) out of the total population between 25 and 64 years of age (764) are in the labor force, with 9.2% or 60 of them being unemployed. The group with the highest labor force participation rate are those with the educational attainment of bachelor's degree or higher, with 97.5% or 237 individuals in the labor force. Within the labor force, individuals with high school diploma education have the highest percentage of unemployment, with 10.9% or 30 of them being unemployed.
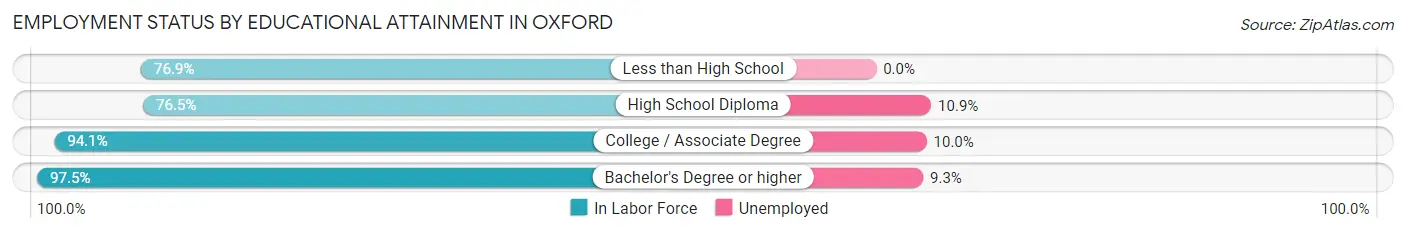
| Educational Attainment | In Labor Force | Unemployed |
| Less than High School | 60 (76.9%) | 0 (0.0%) |
| High School Diploma | 274 (76.5%) | 39 (10.9%) |
| College / Associate Degree | 80 (94.1%) | 8 (10.0%) |
| Bachelor's Degree or higher | 237 (97.5%) | 23 (9.3%) |
| Total | 651 (85.2%) | 70 (9.2%) |
Employment Occupations by Sex in Oxford
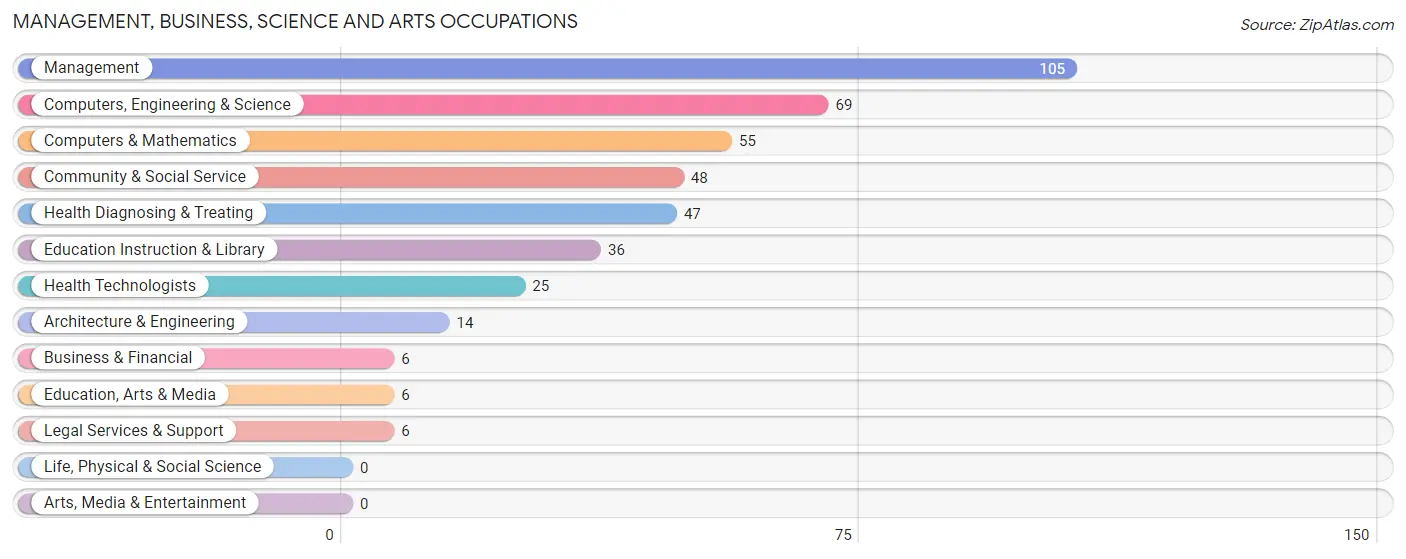
Management, Business, Science and Arts Occupations
The most common Management, Business, Science and Arts occupations in Oxford are Management (105 | 14.2%), Computers, Engineering & Science (69 | 9.3%), Computers & Mathematics (55 | 7.4%), Community & Social Service (48 | 6.5%), and Health Diagnosing & Treating (47 | 6.4%).
Management, Business, Science and Arts Occupations by Sex
Within the Management, Business, Science and Arts occupations in Oxford, the most male-oriented occupations are Business & Financial (100.0%), Architecture & Engineering (100.0%), and Education, Arts & Media (100.0%), while the most female-oriented occupations are Legal Services & Support (100.0%), Education Instruction & Library (100.0%), and Health Diagnosing & Treating (100.0%).
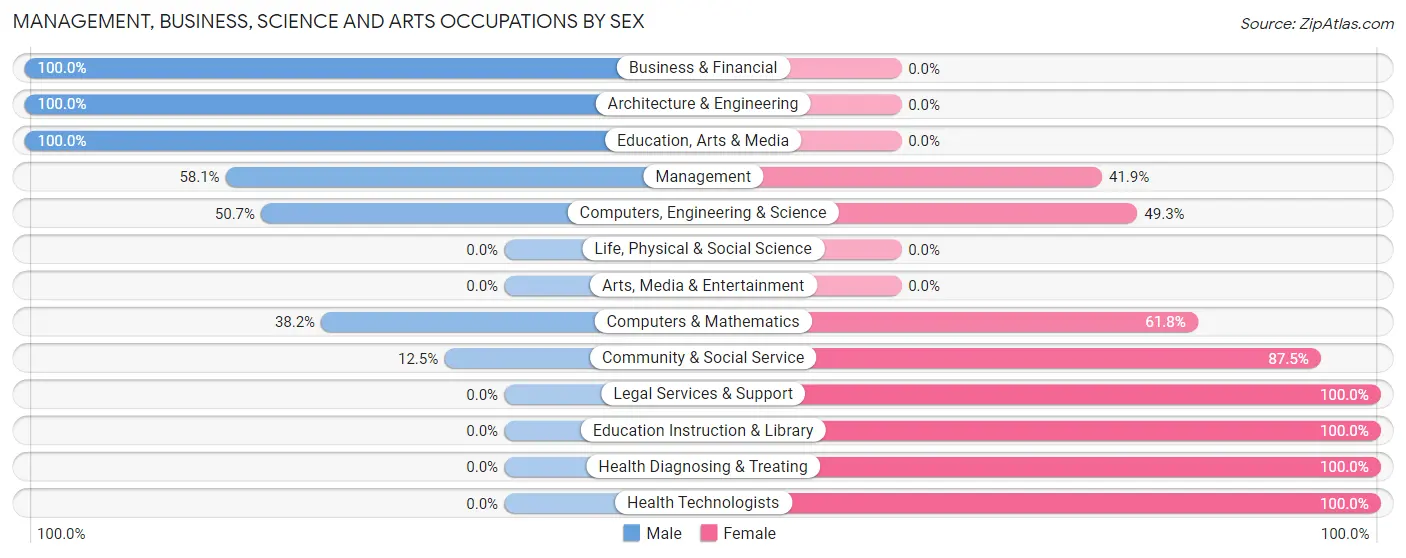
| Occupation | Male | Female |
| Management | 61 (58.1%) | 44 (41.9%) |
| Business & Financial | 6 (100.0%) | 0 (0.0%) |
| Computers, Engineering & Science | 35 (50.7%) | 34 (49.3%) |
| Computers & Mathematics | 21 (38.2%) | 34 (61.8%) |
| Architecture & Engineering | 14 (100.0%) | 0 (0.0%) |
| Life, Physical & Social Science | 0 (0.0%) | 0 (0.0%) |
| Community & Social Service | 6 (12.5%) | 42 (87.5%) |
| Education, Arts & Media | 6 (100.0%) | 0 (0.0%) |
| Legal Services & Support | 0 (0.0%) | 6 (100.0%) |
| Education Instruction & Library | 0 (0.0%) | 36 (100.0%) |
| Arts, Media & Entertainment | 0 (0.0%) | 0 (0.0%) |
| Health Diagnosing & Treating | 0 (0.0%) | 47 (100.0%) |
| Health Technologists | 0 (0.0%) | 25 (100.0%) |
| Total (Category) | 108 (39.3%) | 167 (60.7%) |
| Total (Overall) | 385 (52.0%) | 355 (48.0%) |
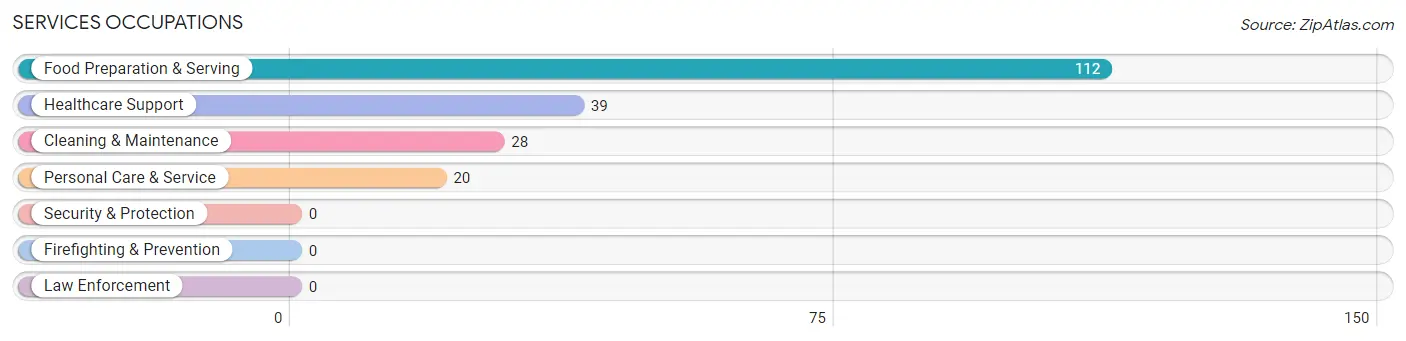
Services Occupations
The most common Services occupations in Oxford are Food Preparation & Serving (112 | 15.1%), Healthcare Support (39 | 5.3%), Cleaning & Maintenance (28 | 3.8%), and Personal Care & Service (20 | 2.7%).
Services Occupations by Sex
Within the Services occupations in Oxford, the most male-oriented occupations are Food Preparation & Serving (75.0%), Personal Care & Service (25.0%), and Healthcare Support (23.1%), while the most female-oriented occupations are Cleaning & Maintenance (100.0%), Healthcare Support (76.9%), and Personal Care & Service (75.0%).
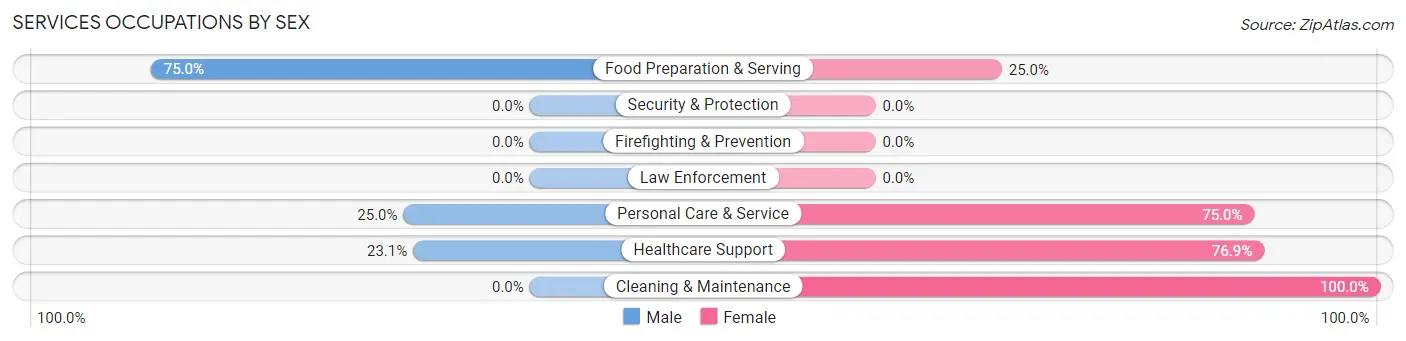
| Occupation | Male | Female |
| Healthcare Support | 9 (23.1%) | 30 (76.9%) |
| Security & Protection | 0 (0.0%) | 0 (0.0%) |
| Firefighting & Prevention | 0 (0.0%) | 0 (0.0%) |
| Law Enforcement | 0 (0.0%) | 0 (0.0%) |
| Food Preparation & Serving | 84 (75.0%) | 28 (25.0%) |
| Cleaning & Maintenance | 0 (0.0%) | 28 (100.0%) |
| Personal Care & Service | 5 (25.0%) | 15 (75.0%) |
| Total (Category) | 98 (49.2%) | 101 (50.7%) |
| Total (Overall) | 385 (52.0%) | 355 (48.0%) |
Sales and Office Occupations
The most common Sales and Office occupations in Oxford are Office & Administration (55 | 7.4%), and Sales & Related (45 | 6.1%).
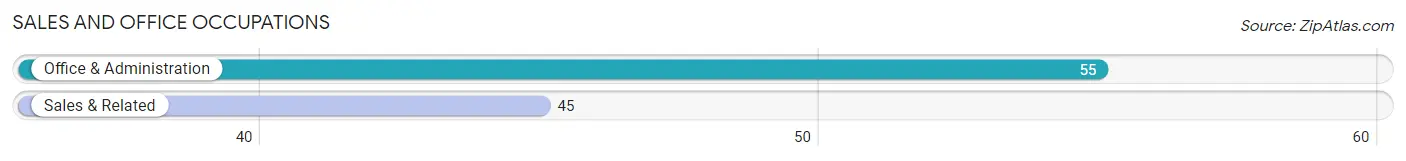
Sales and Office Occupations by Sex
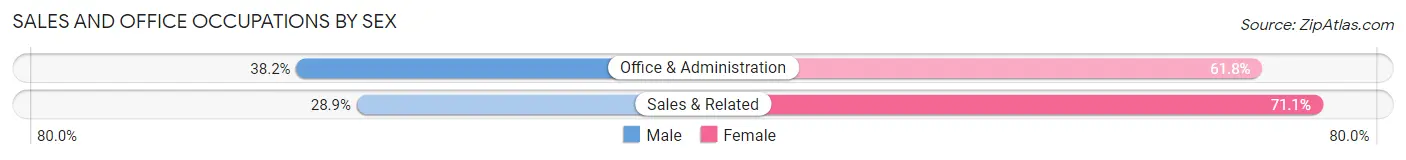
| Occupation | Male | Female |
| Sales & Related | 13 (28.9%) | 32 (71.1%) |
| Office & Administration | 21 (38.2%) | 34 (61.8%) |
| Total (Category) | 34 (34.0%) | 66 (66.0%) |
| Total (Overall) | 385 (52.0%) | 355 (48.0%) |
Natural Resources, Construction and Maintenance Occupations
The most common Natural Resources, Construction and Maintenance occupations in Oxford are Construction & Extraction (107 | 14.5%), and Installation, Maintenance & Repair (3 | 0.4%).
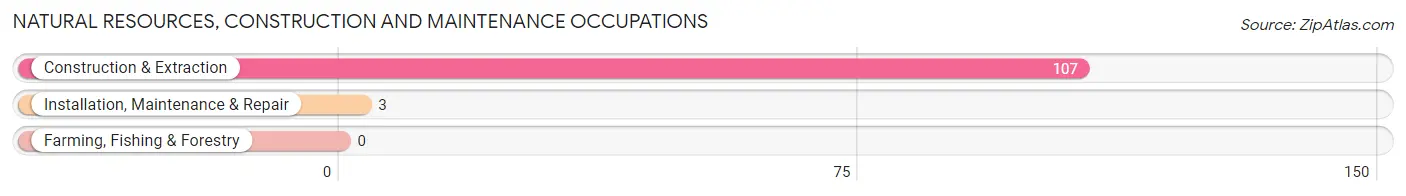
Natural Resources, Construction and Maintenance Occupations by Sex
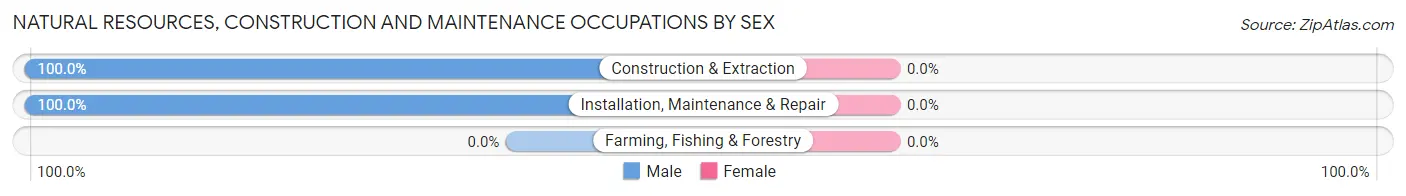
| Occupation | Male | Female |
| Farming, Fishing & Forestry | 0 (0.0%) | 0 (0.0%) |
| Construction & Extraction | 107 (100.0%) | 0 (0.0%) |
| Installation, Maintenance & Repair | 3 (100.0%) | 0 (0.0%) |
| Total (Category) | 110 (100.0%) | 0 (0.0%) |
| Total (Overall) | 385 (52.0%) | 355 (48.0%) |
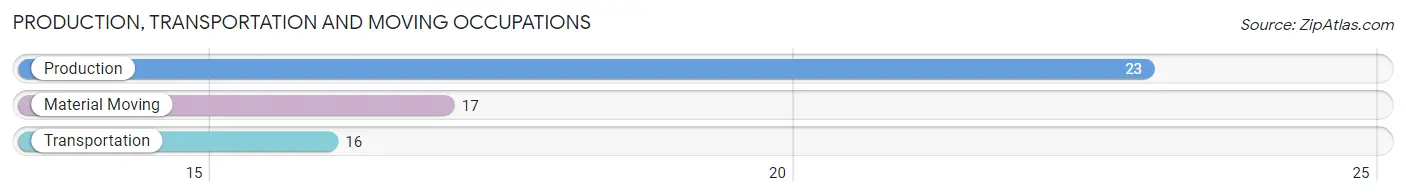
Production, Transportation and Moving Occupations
The most common Production, Transportation and Moving occupations in Oxford are Production (23 | 3.1%), Material Moving (17 | 2.3%), and Transportation (16 | 2.2%).
Production, Transportation and Moving Occupations by Sex
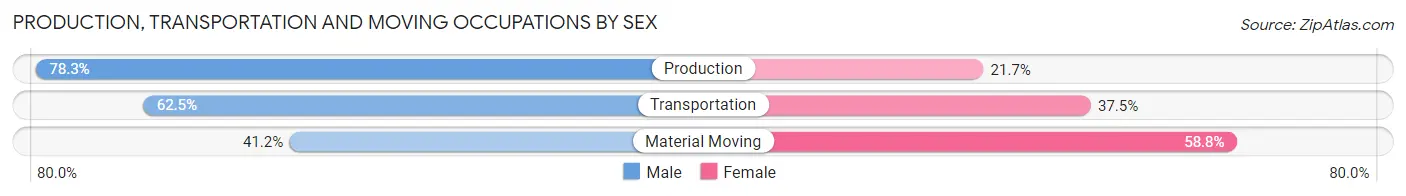
| Occupation | Male | Female |
| Production | 18 (78.3%) | 5 (21.7%) |
| Transportation | 10 (62.5%) | 6 (37.5%) |
| Material Moving | 7 (41.2%) | 10 (58.8%) |
| Total (Category) | 35 (62.5%) | 21 (37.5%) |
| Total (Overall) | 385 (52.0%) | 355 (48.0%) |
Employment Industries by Sex in Oxford
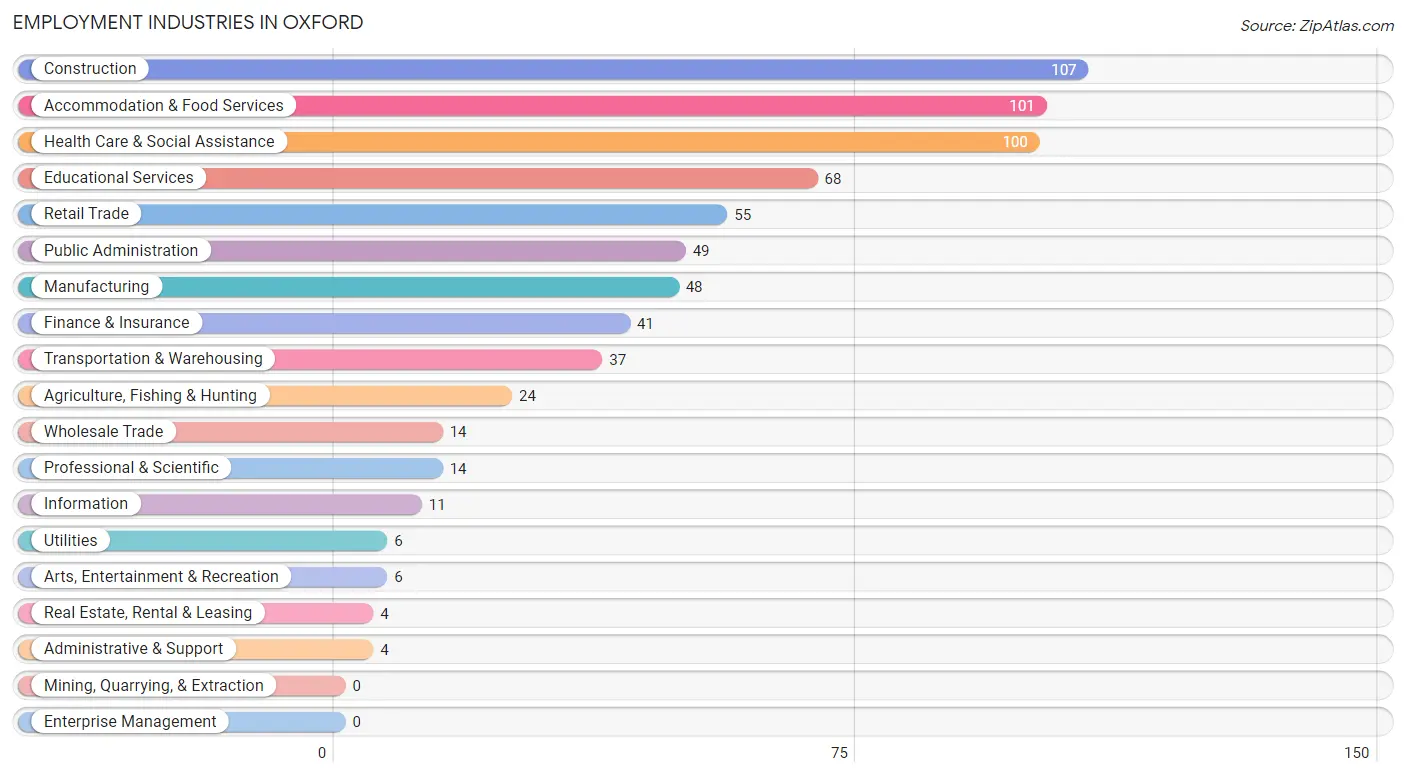
Employment Industries in Oxford
The major employment industries in Oxford include Construction (107 | 14.5%), Accommodation & Food Services (101 | 13.7%), Health Care & Social Assistance (100 | 13.5%), Educational Services (68 | 9.2%), and Retail Trade (55 | 7.4%).
Employment Industries by Sex in Oxford
The Oxford industries that see more men than women are Agriculture, Fishing & Hunting (100.0%), Construction (100.0%), and Utilities (100.0%), whereas the industries that tend to have a higher number of women are Administrative & Support (100.0%), Arts, Entertainment & Recreation (100.0%), and Health Care & Social Assistance (81.0%).
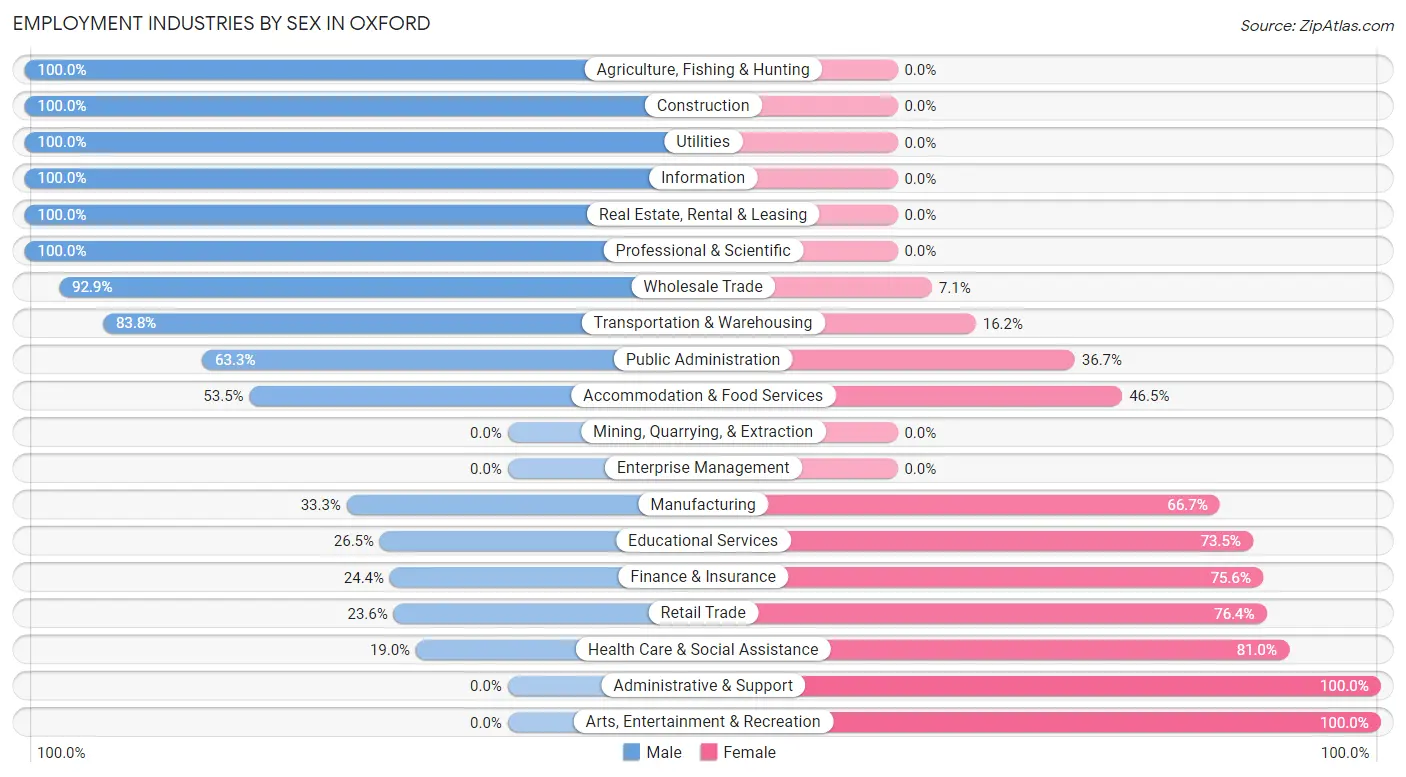
| Industry | Male | Female |
| Agriculture, Fishing & Hunting | 24 (100.0%) | 0 (0.0%) |
| Mining, Quarrying, & Extraction | 0 (0.0%) | 0 (0.0%) |
| Construction | 107 (100.0%) | 0 (0.0%) |
| Manufacturing | 16 (33.3%) | 32 (66.7%) |
| Wholesale Trade | 13 (92.9%) | 1 (7.1%) |
| Retail Trade | 13 (23.6%) | 42 (76.4%) |
| Transportation & Warehousing | 31 (83.8%) | 6 (16.2%) |
| Utilities | 6 (100.0%) | 0 (0.0%) |
| Information | 11 (100.0%) | 0 (0.0%) |
| Finance & Insurance | 10 (24.4%) | 31 (75.6%) |
| Real Estate, Rental & Leasing | 4 (100.0%) | 0 (0.0%) |
| Professional & Scientific | 14 (100.0%) | 0 (0.0%) |
| Enterprise Management | 0 (0.0%) | 0 (0.0%) |
| Administrative & Support | 0 (0.0%) | 4 (100.0%) |
| Educational Services | 18 (26.5%) | 50 (73.5%) |
| Health Care & Social Assistance | 19 (19.0%) | 81 (81.0%) |
| Arts, Entertainment & Recreation | 0 (0.0%) | 6 (100.0%) |
| Accommodation & Food Services | 54 (53.5%) | 47 (46.5%) |
| Public Administration | 31 (63.3%) | 18 (36.7%) |
| Total | 385 (52.0%) | 355 (48.0%) |
Education in Oxford
School Enrollment in Oxford
The most common levels of schooling among the 260 students in Oxford are high school (94 | 36.1%), middle school (71 | 27.3%), and college / undergraduate (53 | 20.4%).
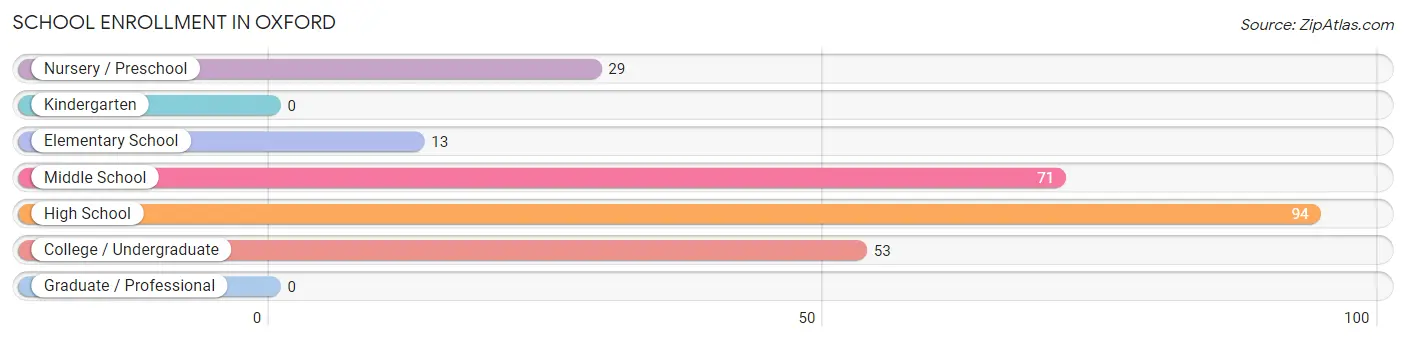
| School Level | # Students | % Students |
| Nursery / Preschool | 29 | 11.2% |
| Kindergarten | 0 | 0.0% |
| Elementary School | 13 | 5.0% |
| Middle School | 71 | 27.3% |
| High School | 94 | 36.1% |
| College / Undergraduate | 53 | 20.4% |
| Graduate / Professional | 0 | 0.0% |
| Total | 260 | 100.0% |
School Enrollment by Age by Funding Source in Oxford
Out of a total of 260 students who are enrolled in schools in Oxford, 27 (10.4%) attend a private institution, while the remaining 233 (89.6%) are enrolled in public schools. The age group of 20 to 24 year olds has the highest likelihood of being enrolled in private schools, with 21 (60.0% in the age bracket) enrolled. Conversely, the age group of 3 to 4 year olds has the lowest likelihood of being enrolled in a private school, with 29 (100.0% in the age bracket) attending a public institution.
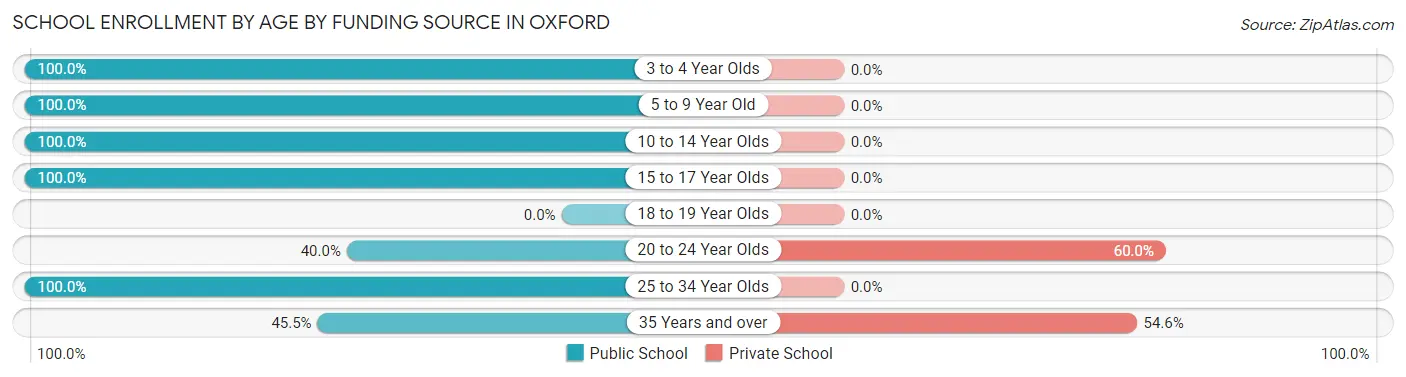
| Age Bracket | Public School | Private School |
| 3 to 4 Year Olds | 29 (100.0%) | 0 (0.0%) |
| 5 to 9 Year Old | 12 (100.0%) | 0 (0.0%) |
| 10 to 14 Year Olds | 72 (100.0%) | 0 (0.0%) |
| 15 to 17 Year Olds | 94 (100.0%) | 0 (0.0%) |
| 18 to 19 Year Olds | 0 (0.0%) | 0 (0.0%) |
| 20 to 24 Year Olds | 14 (40.0%) | 21 (60.0%) |
| 25 to 34 Year Olds | 7 (100.0%) | 0 (0.0%) |
| 35 Years and over | 5 (45.5%) | 6 (54.5%) |
| Total | 233 (89.6%) | 27 (10.4%) |
Educational Attainment by Field of Study in Oxford
Business (60 | 20.4%), arts & humanities (49 | 16.7%), computers & mathematics (47 | 16.0%), science & technology (45 | 15.3%), and psychology (34 | 11.6%) are the most common fields of study among 294 individuals in Oxford who have obtained a bachelor's degree or higher.
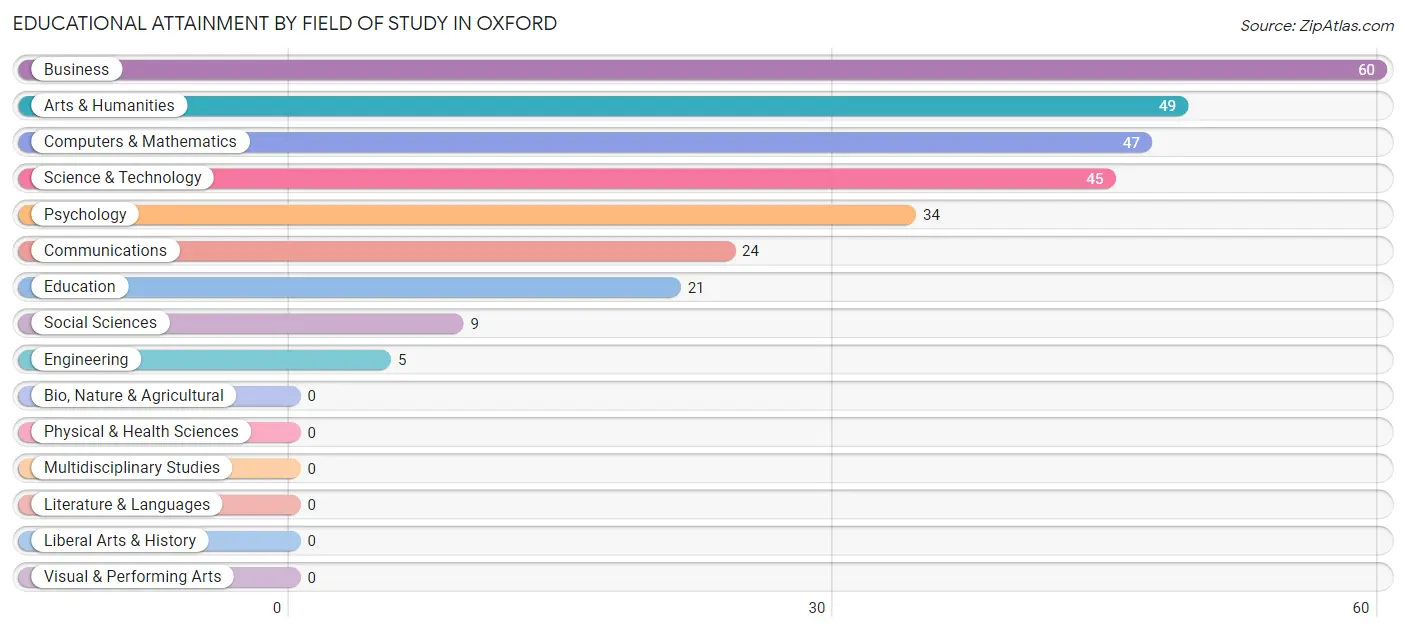
| Field of Study | # Graduates | % Graduates |
| Computers & Mathematics | 47 | 16.0% |
| Bio, Nature & Agricultural | 0 | 0.0% |
| Physical & Health Sciences | 0 | 0.0% |
| Psychology | 34 | 11.6% |
| Social Sciences | 9 | 3.1% |
| Engineering | 5 | 1.7% |
| Multidisciplinary Studies | 0 | 0.0% |
| Science & Technology | 45 | 15.3% |
| Business | 60 | 20.4% |
| Education | 21 | 7.1% |
| Literature & Languages | 0 | 0.0% |
| Liberal Arts & History | 0 | 0.0% |
| Visual & Performing Arts | 0 | 0.0% |
| Communications | 24 | 8.2% |
| Arts & Humanities | 49 | 16.7% |
| Total | 294 | 100.0% |
Transportation & Commute in Oxford
Vehicle Availability by Sex in Oxford
The most prevalent vehicle ownership categories in Oxford are males with 3 vehicles (128, accounting for 33.3%) and females with 3 vehicles (120, making up 37.1%).
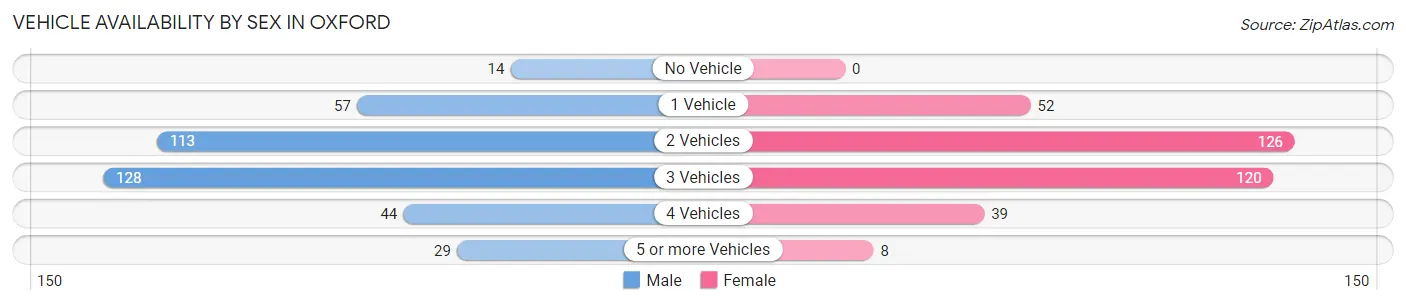
| Vehicles Available | Male | Female |
| No Vehicle | 14 (3.6%) | 0 (0.0%) |
| 1 Vehicle | 57 (14.8%) | 52 (15.1%) |
| 2 Vehicles | 113 (29.3%) | 126 (36.5%) |
| 3 Vehicles | 128 (33.3%) | 120 (34.8%) |
| 4 Vehicles | 44 (11.4%) | 39 (11.3%) |
| 5 or more Vehicles | 29 (7.5%) | 8 (2.3%) |
| Total | 385 (100.0%) | 345 (100.0%) |
Commute Time in Oxford
The most frequently occuring commute durations in Oxford are 45 to 59 minutes (91 commuters, 13.8%), 30 to 34 minutes (84 commuters, 12.7%), and 90 or more minutes (79 commuters, 11.9%).
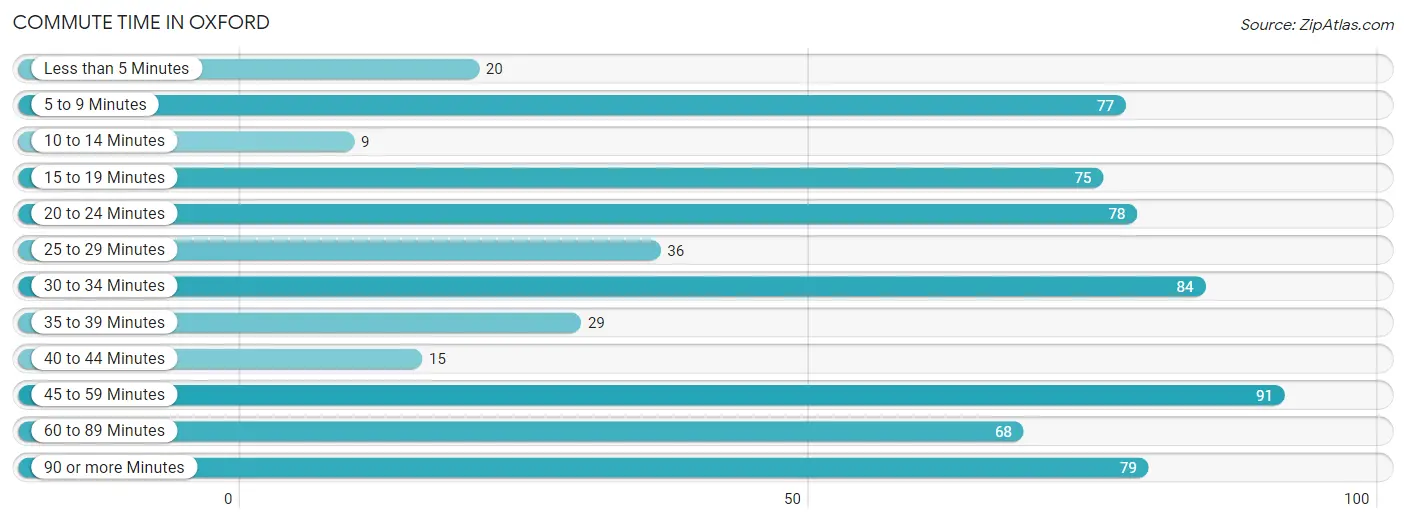
| Commute Time | # Commuters | % Commuters |
| Less than 5 Minutes | 20 | 3.0% |
| 5 to 9 Minutes | 77 | 11.7% |
| 10 to 14 Minutes | 9 | 1.4% |
| 15 to 19 Minutes | 75 | 11.4% |
| 20 to 24 Minutes | 78 | 11.8% |
| 25 to 29 Minutes | 36 | 5.4% |
| 30 to 34 Minutes | 84 | 12.7% |
| 35 to 39 Minutes | 29 | 4.4% |
| 40 to 44 Minutes | 15 | 2.3% |
| 45 to 59 Minutes | 91 | 13.8% |
| 60 to 89 Minutes | 68 | 10.3% |
| 90 or more Minutes | 79 | 11.9% |
Commute Time by Sex in Oxford
The most common commute times in Oxford are 90 or more minutes (79 commuters, 21.6%) for males and 20 to 24 minutes (66 commuters, 22.4%) for females.
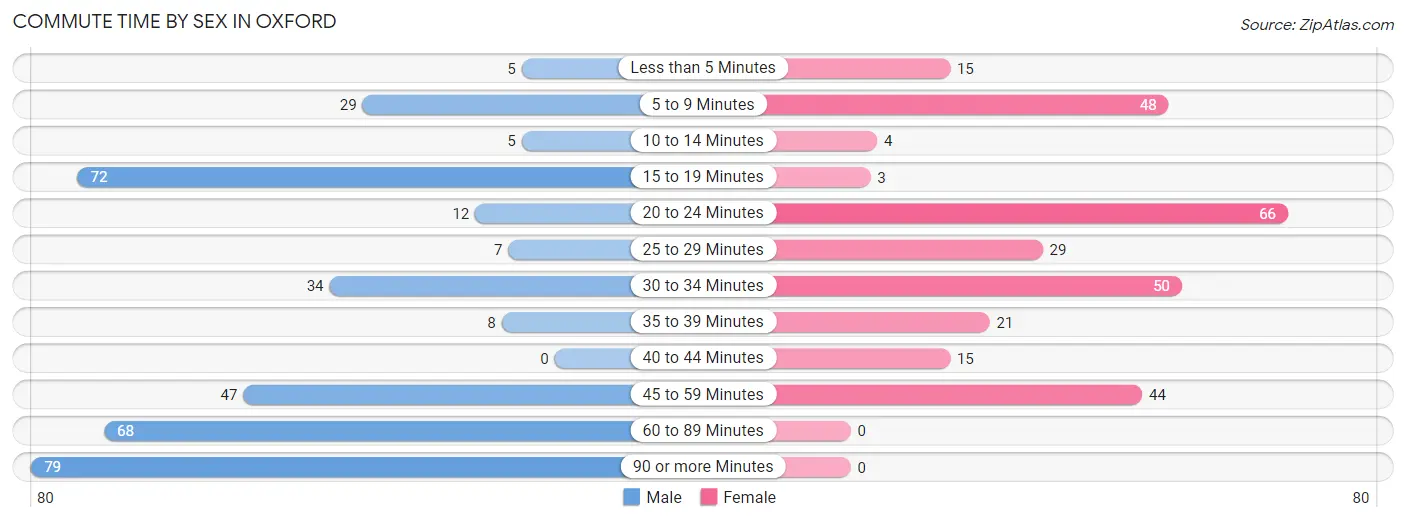
| Commute Time | Male | Female |
| Less than 5 Minutes | 5 (1.4%) | 15 (5.1%) |
| 5 to 9 Minutes | 29 (7.9%) | 48 (16.3%) |
| 10 to 14 Minutes | 5 (1.4%) | 4 (1.4%) |
| 15 to 19 Minutes | 72 (19.7%) | 3 (1.0%) |
| 20 to 24 Minutes | 12 (3.3%) | 66 (22.4%) |
| 25 to 29 Minutes | 7 (1.9%) | 29 (9.8%) |
| 30 to 34 Minutes | 34 (9.3%) | 50 (17.0%) |
| 35 to 39 Minutes | 8 (2.2%) | 21 (7.1%) |
| 40 to 44 Minutes | 0 (0.0%) | 15 (5.1%) |
| 45 to 59 Minutes | 47 (12.8%) | 44 (14.9%) |
| 60 to 89 Minutes | 68 (18.6%) | 0 (0.0%) |
| 90 or more Minutes | 79 (21.6%) | 0 (0.0%) |
Time of Departure to Work by Sex in Oxford
The most frequent times of departure to work in Oxford are 5:00 AM to 5:29 AM (106, 29.0%) for males and 8:30 AM to 8:59 AM (78, 26.4%) for females.
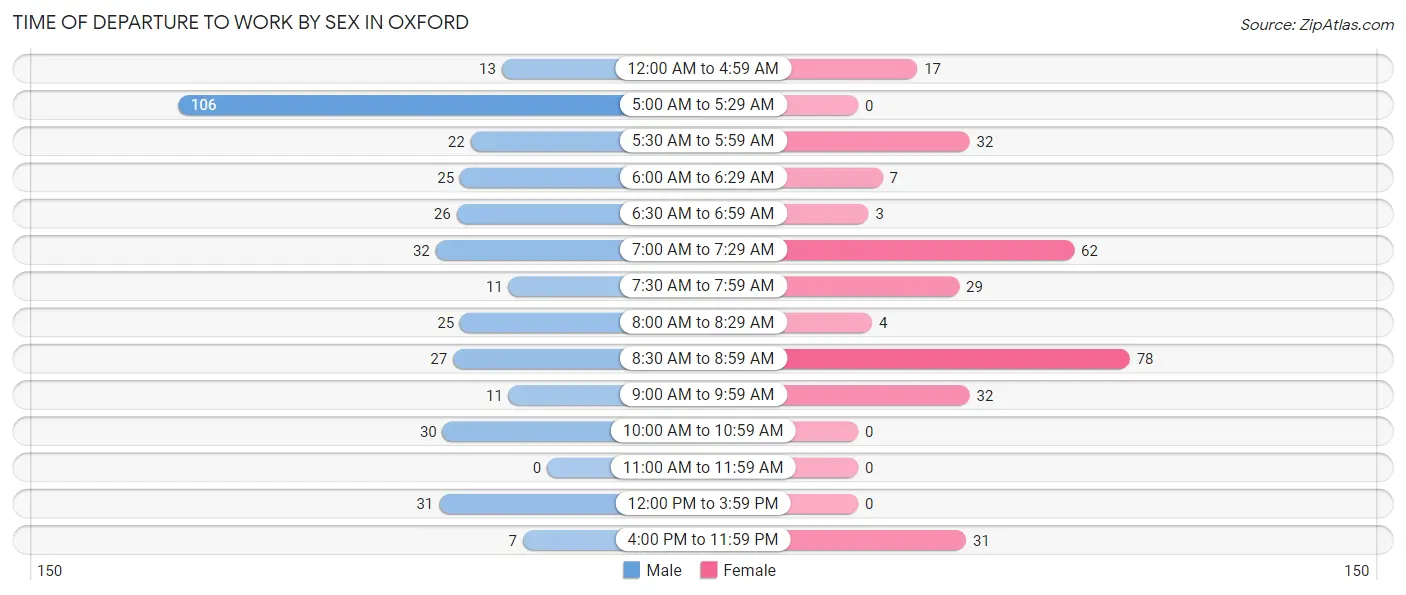
| Time of Departure | Male | Female |
| 12:00 AM to 4:59 AM | 13 (3.5%) | 17 (5.8%) |
| 5:00 AM to 5:29 AM | 106 (29.0%) | 0 (0.0%) |
| 5:30 AM to 5:59 AM | 22 (6.0%) | 32 (10.8%) |
| 6:00 AM to 6:29 AM | 25 (6.8%) | 7 (2.4%) |
| 6:30 AM to 6:59 AM | 26 (7.1%) | 3 (1.0%) |
| 7:00 AM to 7:29 AM | 32 (8.7%) | 62 (21.0%) |
| 7:30 AM to 7:59 AM | 11 (3.0%) | 29 (9.8%) |
| 8:00 AM to 8:29 AM | 25 (6.8%) | 4 (1.4%) |
| 8:30 AM to 8:59 AM | 27 (7.4%) | 78 (26.4%) |
| 9:00 AM to 9:59 AM | 11 (3.0%) | 32 (10.8%) |
| 10:00 AM to 10:59 AM | 30 (8.2%) | 0 (0.0%) |
| 11:00 AM to 11:59 AM | 0 (0.0%) | 0 (0.0%) |
| 12:00 PM to 3:59 PM | 31 (8.5%) | 0 (0.0%) |
| 4:00 PM to 11:59 PM | 7 (1.9%) | 31 (10.5%) |
| Total | 366 (100.0%) | 295 (100.0%) |
Housing Occupancy in Oxford
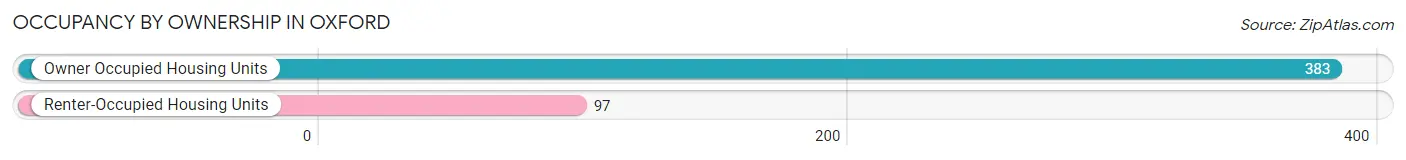
Occupancy by Ownership in Oxford
Of the total 480 dwellings in Oxford, owner-occupied units account for 383 (79.8%), while renter-occupied units make up 97 (20.2%).
| Occupancy | # Housing Units | % Housing Units |
| Owner Occupied Housing Units | 383 | 79.8% |
| Renter-Occupied Housing Units | 97 | 20.2% |
| Total Occupied Housing Units | 480 | 100.0% |
Occupancy by Household Size in Oxford
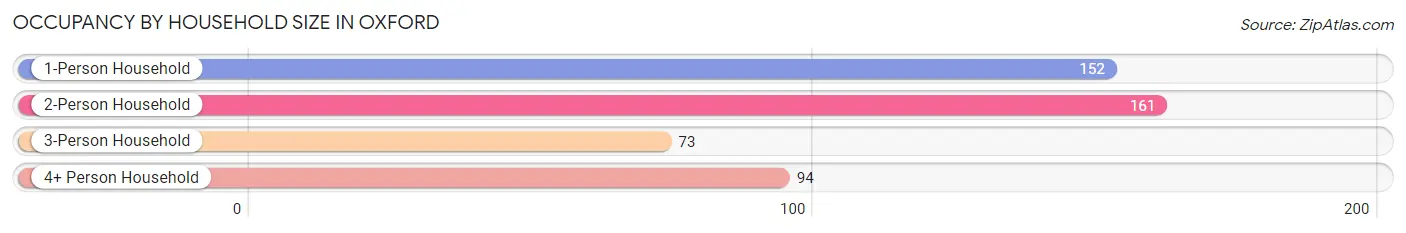
| Household Size | # Housing Units | % Housing Units |
| 1-Person Household | 152 | 31.7% |
| 2-Person Household | 161 | 33.5% |
| 3-Person Household | 73 | 15.2% |
| 4+ Person Household | 94 | 19.6% |
| Total Housing Units | 480 | 100.0% |
Occupancy by Ownership by Household Size in Oxford
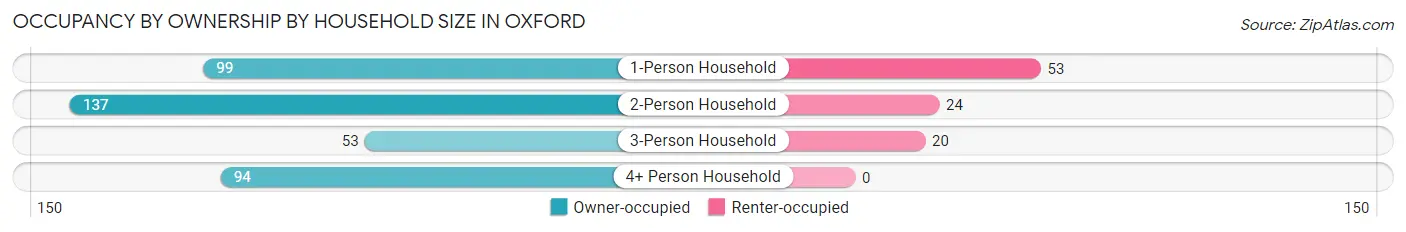
| Household Size | Owner-occupied | Renter-occupied |
| 1-Person Household | 99 (65.1%) | 53 (34.9%) |
| 2-Person Household | 137 (85.1%) | 24 (14.9%) |
| 3-Person Household | 53 (72.6%) | 20 (27.4%) |
| 4+ Person Household | 94 (100.0%) | 0 (0.0%) |
| Total Housing Units | 383 (79.8%) | 97 (20.2%) |
Occupancy by Educational Attainment in Oxford
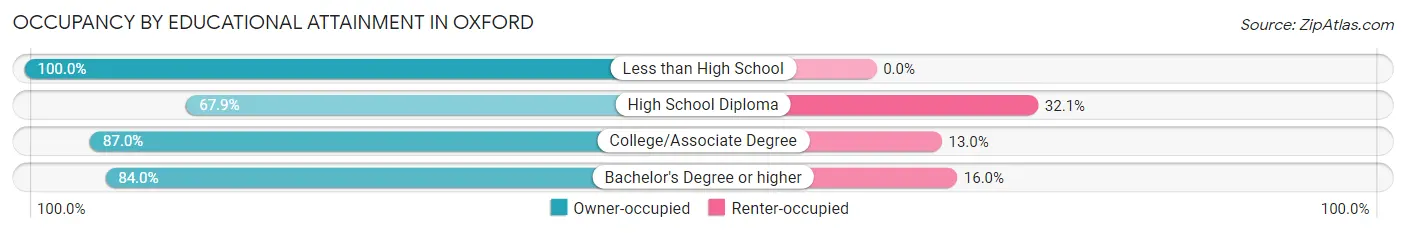
| Household Size | Owner-occupied | Renter-occupied |
| Less than High School | 38 (100.0%) | 0 (0.0%) |
| High School Diploma | 125 (67.9%) | 59 (32.1%) |
| College/Associate Degree | 94 (87.0%) | 14 (13.0%) |
| Bachelor's Degree or higher | 126 (84.0%) | 24 (16.0%) |
Occupancy by Age of Householder in Oxford
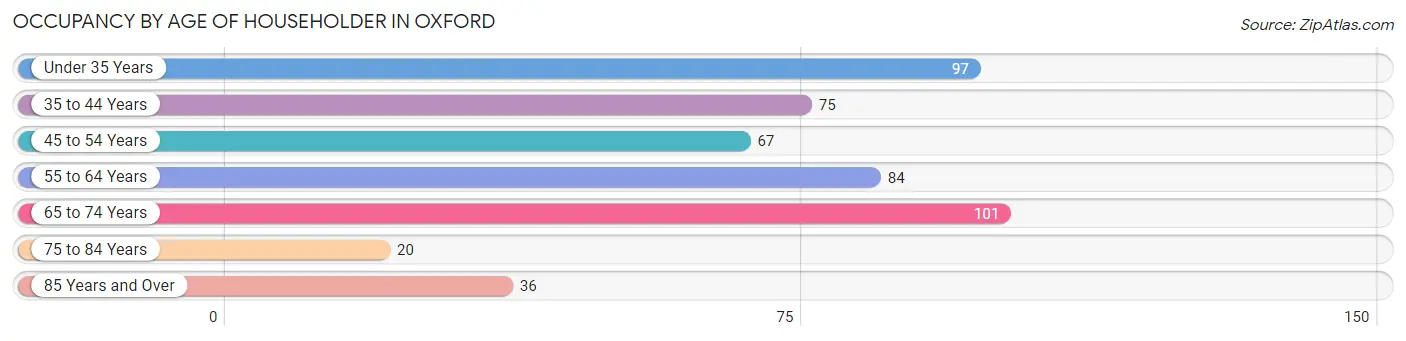
| Age Bracket | # Households | % Households |
| Under 35 Years | 97 | 20.2% |
| 35 to 44 Years | 75 | 15.6% |
| 45 to 54 Years | 67 | 14.0% |
| 55 to 64 Years | 84 | 17.5% |
| 65 to 74 Years | 101 | 21.0% |
| 75 to 84 Years | 20 | 4.2% |
| 85 Years and Over | 36 | 7.5% |
| Total | 480 | 100.0% |
Housing Finances in Oxford
Median Income by Occupancy in Oxford
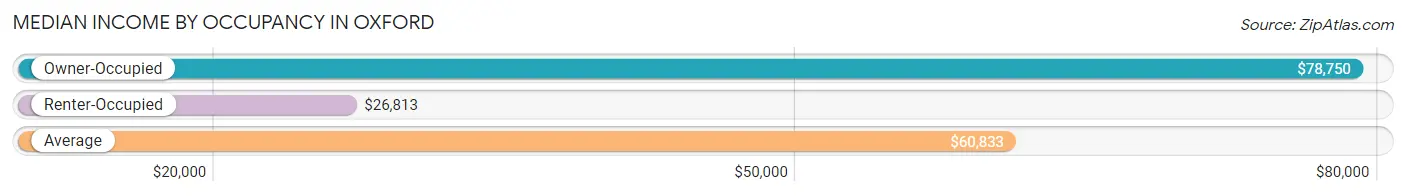
| Occupancy Type | # Households | Median Income |
| Owner-Occupied | 383 (79.8%) | $78,750 |
| Renter-Occupied | 97 (20.2%) | $26,813 |
| Average | 480 (100.0%) | $60,833 |
Occupancy by Householder Income Bracket in Oxford
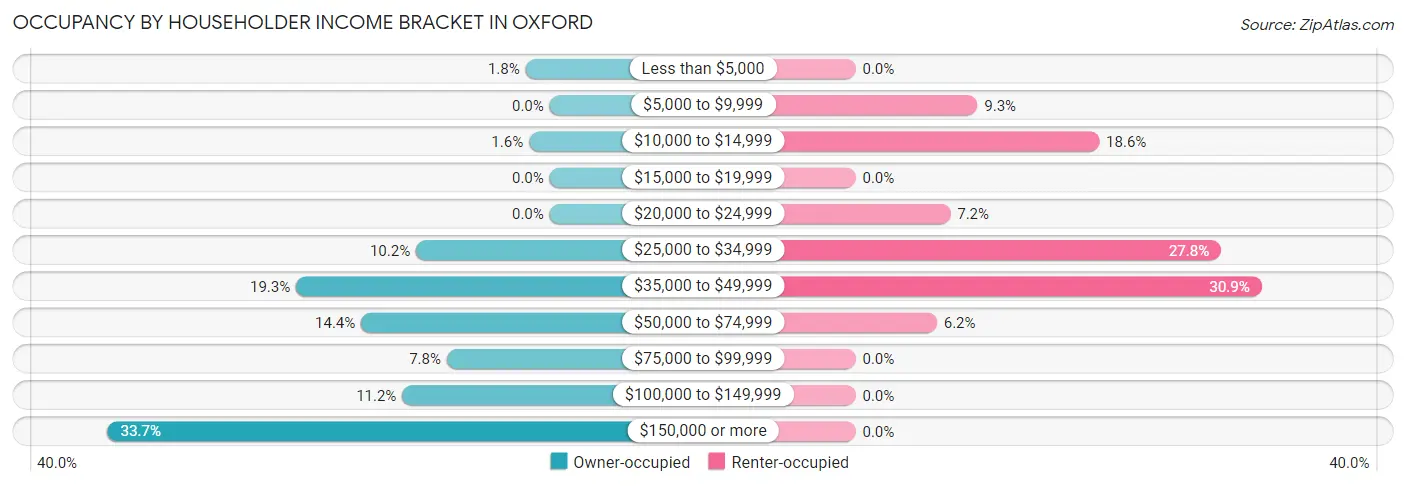
| Income Bracket | Owner-occupied | Renter-occupied |
| Less than $5,000 | 7 (1.8%) | 0 (0.0%) |
| $5,000 to $9,999 | 0 (0.0%) | 9 (9.3%) |
| $10,000 to $14,999 | 6 (1.6%) | 18 (18.6%) |
| $15,000 to $19,999 | 0 (0.0%) | 0 (0.0%) |
| $20,000 to $24,999 | 0 (0.0%) | 7 (7.2%) |
| $25,000 to $34,999 | 39 (10.2%) | 27 (27.8%) |
| $35,000 to $49,999 | 74 (19.3%) | 30 (30.9%) |
| $50,000 to $74,999 | 55 (14.4%) | 6 (6.2%) |
| $75,000 to $99,999 | 30 (7.8%) | 0 (0.0%) |
| $100,000 to $149,999 | 43 (11.2%) | 0 (0.0%) |
| $150,000 or more | 129 (33.7%) | 0 (0.0%) |
| Total | 383 (100.0%) | 97 (100.0%) |
Monthly Housing Cost Tiers in Oxford
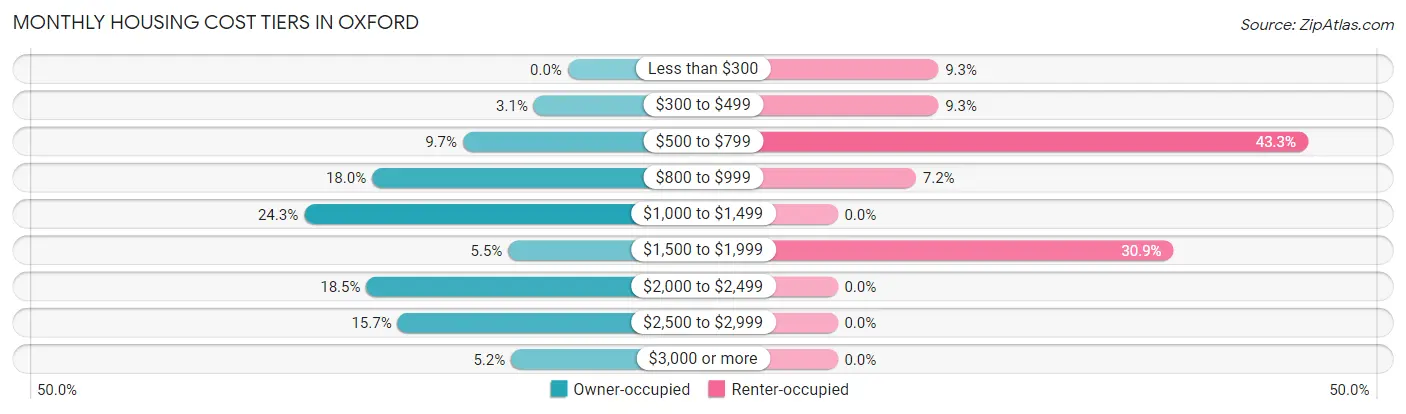
| Monthly Cost | Owner-occupied | Renter-occupied |
| Less than $300 | 0 (0.0%) | 9 (9.3%) |
| $300 to $499 | 12 (3.1%) | 9 (9.3%) |
| $500 to $799 | 37 (9.7%) | 42 (43.3%) |
| $800 to $999 | 69 (18.0%) | 7 (7.2%) |
| $1,000 to $1,499 | 93 (24.3%) | 0 (0.0%) |
| $1,500 to $1,999 | 21 (5.5%) | 30 (30.9%) |
| $2,000 to $2,499 | 71 (18.5%) | 0 (0.0%) |
| $2,500 to $2,999 | 60 (15.7%) | 0 (0.0%) |
| $3,000 or more | 20 (5.2%) | 0 (0.0%) |
| Total | 383 (100.0%) | 97 (100.0%) |
Physical Housing Characteristics in Oxford
Housing Structures in Oxford
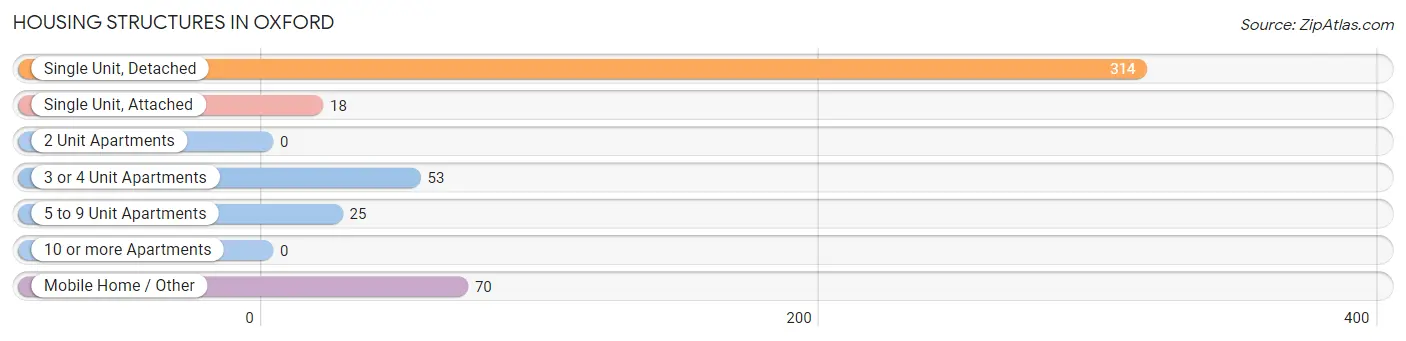
| Structure Type | # Housing Units | % Housing Units |
| Single Unit, Detached | 314 | 65.4% |
| Single Unit, Attached | 18 | 3.7% |
| 2 Unit Apartments | 0 | 0.0% |
| 3 or 4 Unit Apartments | 53 | 11.0% |
| 5 to 9 Unit Apartments | 25 | 5.2% |
| 10 or more Apartments | 0 | 0.0% |
| Mobile Home / Other | 70 | 14.6% |
| Total | 480 | 100.0% |
Housing Structures by Occupancy in Oxford
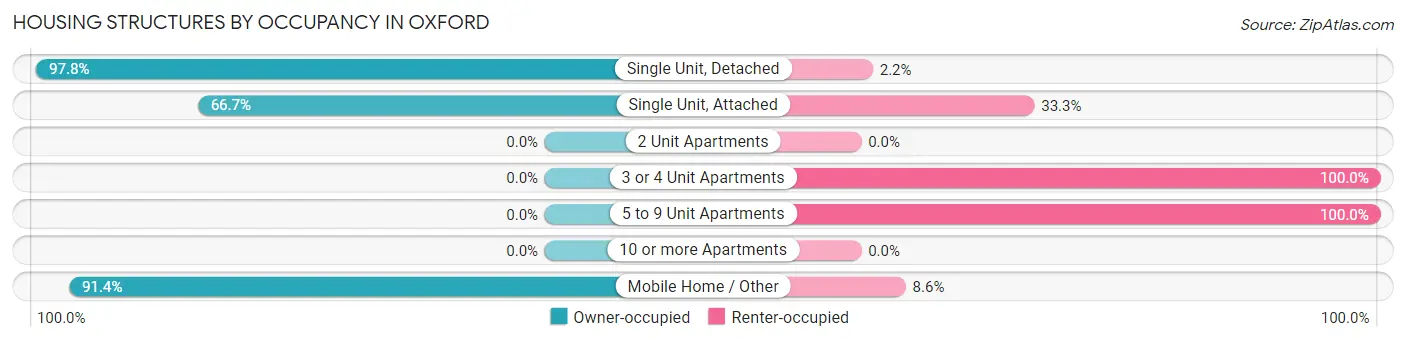
| Structure Type | Owner-occupied | Renter-occupied |
| Single Unit, Detached | 307 (97.8%) | 7 (2.2%) |
| Single Unit, Attached | 12 (66.7%) | 6 (33.3%) |
| 2 Unit Apartments | 0 (0.0%) | 0 (0.0%) |
| 3 or 4 Unit Apartments | 0 (0.0%) | 53 (100.0%) |
| 5 to 9 Unit Apartments | 0 (0.0%) | 25 (100.0%) |
| 10 or more Apartments | 0 (0.0%) | 0 (0.0%) |
| Mobile Home / Other | 64 (91.4%) | 6 (8.6%) |
| Total | 383 (79.8%) | 97 (20.2%) |
Housing Structures by Number of Rooms in Oxford
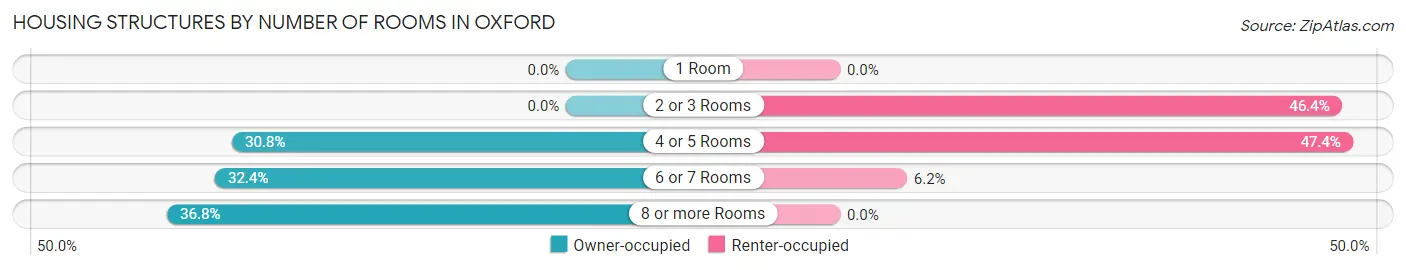
| Number of Rooms | Owner-occupied | Renter-occupied |
| 1 Room | 0 (0.0%) | 0 (0.0%) |
| 2 or 3 Rooms | 0 (0.0%) | 45 (46.4%) |
| 4 or 5 Rooms | 118 (30.8%) | 46 (47.4%) |
| 6 or 7 Rooms | 124 (32.4%) | 6 (6.2%) |
| 8 or more Rooms | 141 (36.8%) | 0 (0.0%) |
| Total | 383 (100.0%) | 97 (100.0%) |
Housing Structure by Heating Type in Oxford
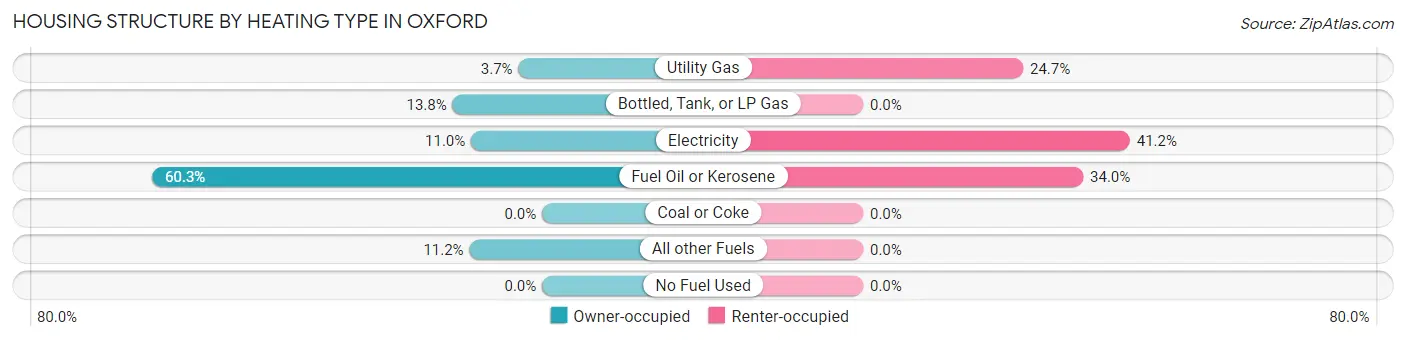
| Heating Type | Owner-occupied | Renter-occupied |
| Utility Gas | 14 (3.7%) | 24 (24.7%) |
| Bottled, Tank, or LP Gas | 53 (13.8%) | 0 (0.0%) |
| Electricity | 42 (11.0%) | 40 (41.2%) |
| Fuel Oil or Kerosene | 231 (60.3%) | 33 (34.0%) |
| Coal or Coke | 0 (0.0%) | 0 (0.0%) |
| All other Fuels | 43 (11.2%) | 0 (0.0%) |
| No Fuel Used | 0 (0.0%) | 0 (0.0%) |
| Total | 383 (100.0%) | 97 (100.0%) |
Household Vehicle Usage in Oxford
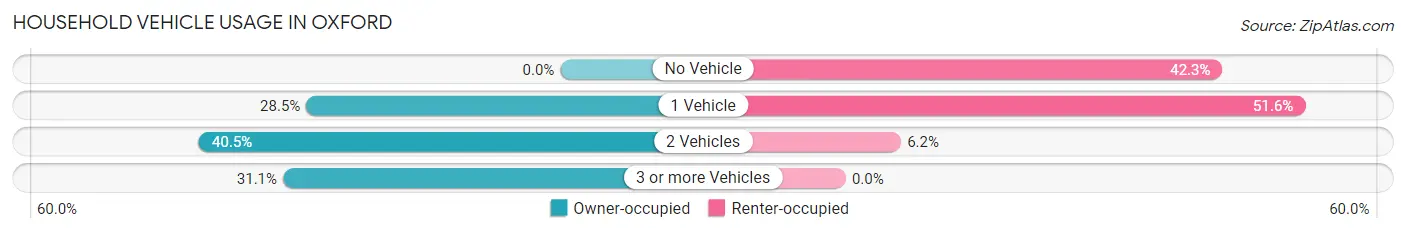
| Vehicles per Household | Owner-occupied | Renter-occupied |
| No Vehicle | 0 (0.0%) | 41 (42.3%) |
| 1 Vehicle | 109 (28.5%) | 50 (51.5%) |
| 2 Vehicles | 155 (40.5%) | 6 (6.2%) |
| 3 or more Vehicles | 119 (31.1%) | 0 (0.0%) |
| Total | 383 (100.0%) | 97 (100.0%) |
Real Estate & Mortgages in Oxford
Real Estate and Mortgage Overview in Oxford
| Characteristic | Without Mortgage | With Mortgage |
| Housing Units | 156 | 227 |
| Median Property Value | $114,500 | $212,100 |
| Median Household Income | $61,458 | $102 |
| Monthly Housing Costs | $929 | $14 |
| Real Estate Taxes | $6,526 | $5 |
Property Value by Mortgage Status in Oxford
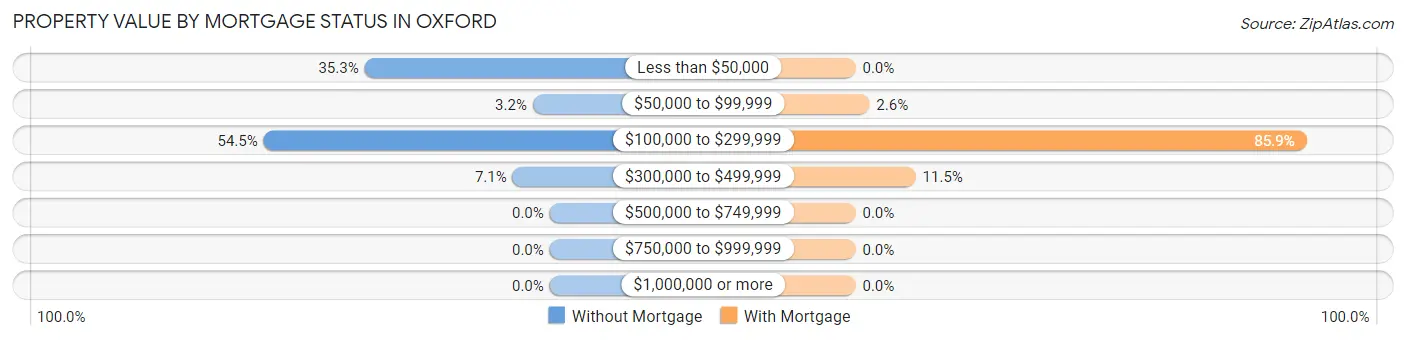
| Property Value | Without Mortgage | With Mortgage |
| Less than $50,000 | 55 (35.3%) | 0 (0.0%) |
| $50,000 to $99,999 | 5 (3.2%) | 6 (2.6%) |
| $100,000 to $299,999 | 85 (54.5%) | 195 (85.9%) |
| $300,000 to $499,999 | 11 (7.0%) | 26 (11.5%) |
| $500,000 to $749,999 | 0 (0.0%) | 0 (0.0%) |
| $750,000 to $999,999 | 0 (0.0%) | 0 (0.0%) |
| $1,000,000 or more | 0 (0.0%) | 0 (0.0%) |
| Total | 156 (100.0%) | 227 (100.0%) |
Household Income by Mortgage Status in Oxford
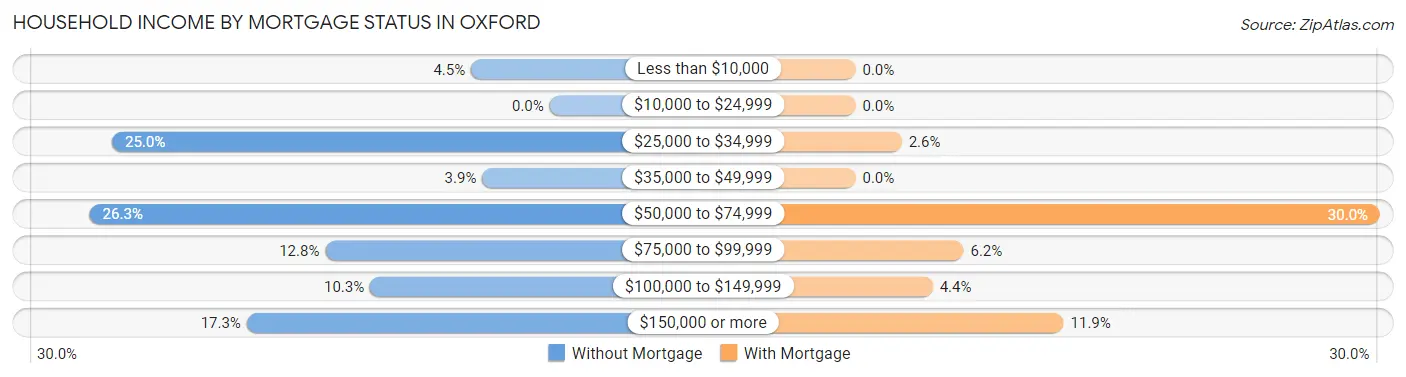
| Household Income | Without Mortgage | With Mortgage |
| Less than $10,000 | 7 (4.5%) | 0 (0.0%) |
| $10,000 to $24,999 | 0 (0.0%) | 0 (0.0%) |
| $25,000 to $34,999 | 39 (25.0%) | 6 (2.6%) |
| $35,000 to $49,999 | 6 (3.8%) | 0 (0.0%) |
| $50,000 to $74,999 | 41 (26.3%) | 68 (30.0%) |
| $75,000 to $99,999 | 20 (12.8%) | 14 (6.2%) |
| $100,000 to $149,999 | 16 (10.3%) | 10 (4.4%) |
| $150,000 or more | 27 (17.3%) | 27 (11.9%) |
| Total | 156 (100.0%) | 227 (100.0%) |
Property Value to Household Income Ratio in Oxford
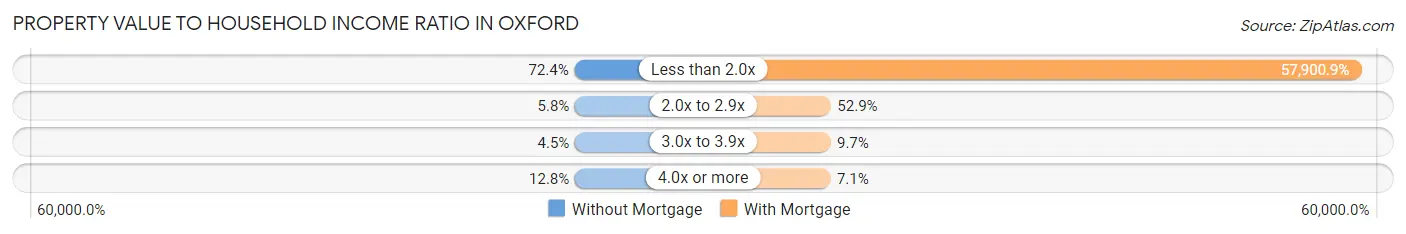
| Value-to-Income Ratio | Without Mortgage | With Mortgage |
| Less than 2.0x | 113 (72.4%) | 131,435 (57,900.9%) |
| 2.0x to 2.9x | 9 (5.8%) | 120 (52.9%) |
| 3.0x to 3.9x | 7 (4.5%) | 22 (9.7%) |
| 4.0x or more | 20 (12.8%) | 16 (7.0%) |
| Total | 156 (100.0%) | 227 (100.0%) |
Real Estate Taxes by Mortgage Status in Oxford
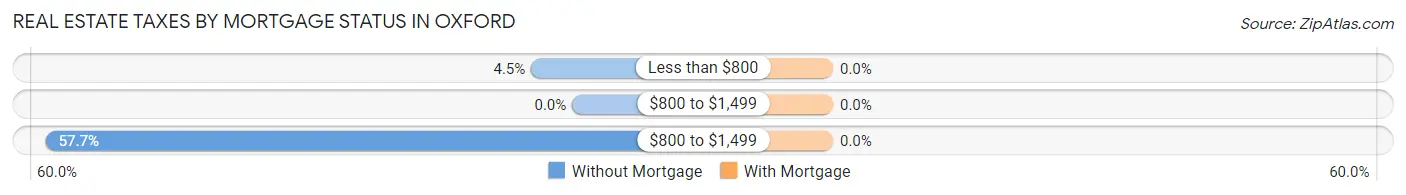
| Property Taxes | Without Mortgage | With Mortgage |
| Less than $800 | 7 (4.5%) | 0 (0.0%) |
| $800 to $1,499 | 0 (0.0%) | 0 (0.0%) |
| $800 to $1,499 | 90 (57.7%) | 0 (0.0%) |
| Total | 156 (100.0%) | 227 (100.0%) |
Health & Disability in Oxford
Health Insurance Coverage by Age in Oxford
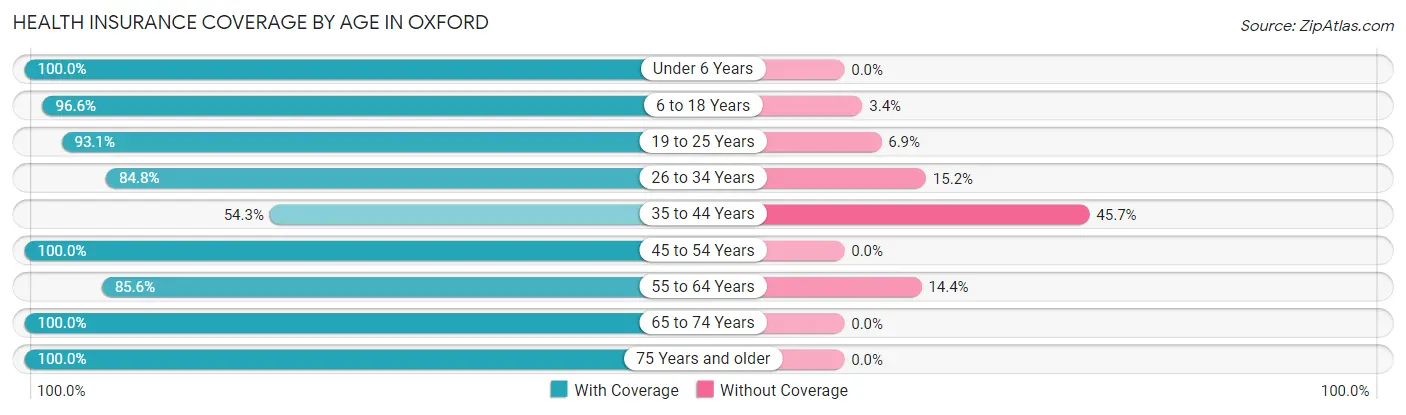
| Age Bracket | With Coverage | Without Coverage |
| Under 6 Years | 47 (100.0%) | 0 (0.0%) |
| 6 to 18 Years | 172 (96.6%) | 6 (3.4%) |
| 19 to 25 Years | 81 (93.1%) | 6 (6.9%) |
| 26 to 34 Years | 117 (84.8%) | 21 (15.2%) |
| 35 to 44 Years | 171 (54.3%) | 144 (45.7%) |
| 45 to 54 Years | 156 (100.0%) | 0 (0.0%) |
| 55 to 64 Years | 113 (85.6%) | 19 (14.4%) |
| 65 to 74 Years | 135 (100.0%) | 0 (0.0%) |
| 75 Years and older | 61 (100.0%) | 0 (0.0%) |
| Total | 1,053 (84.3%) | 196 (15.7%) |
Health Insurance Coverage by Citizenship Status in Oxford
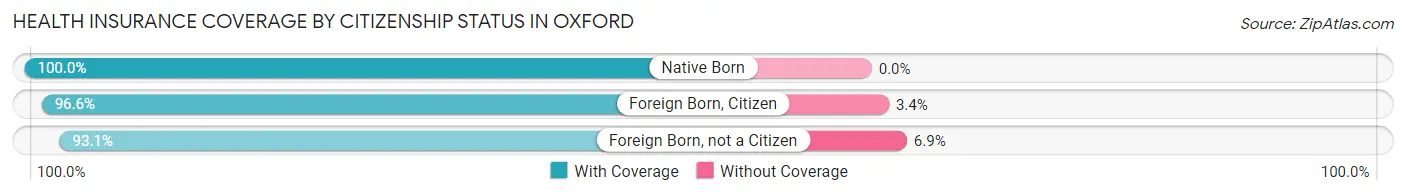
| Citizenship Status | With Coverage | Without Coverage |
| Native Born | 47 (100.0%) | 0 (0.0%) |
| Foreign Born, Citizen | 172 (96.6%) | 6 (3.4%) |
| Foreign Born, not a Citizen | 81 (93.1%) | 6 (6.9%) |
Health Insurance Coverage by Household Income in Oxford
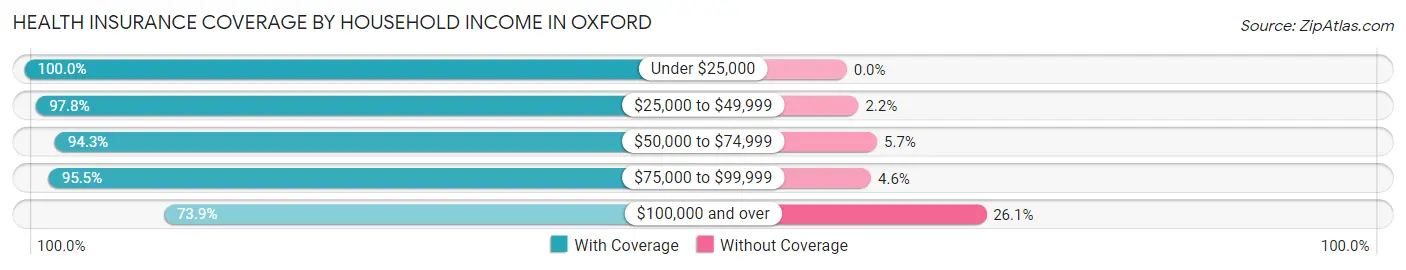
| Household Income | With Coverage | Without Coverage |
| Under $25,000 | 47 (100.0%) | 0 (0.0%) |
| $25,000 to $49,999 | 313 (97.8%) | 7 (2.2%) |
| $50,000 to $74,999 | 83 (94.3%) | 5 (5.7%) |
| $75,000 to $99,999 | 63 (95.5%) | 3 (4.5%) |
| $100,000 and over | 512 (73.9%) | 181 (26.1%) |
Public vs Private Health Insurance Coverage by Age in Oxford
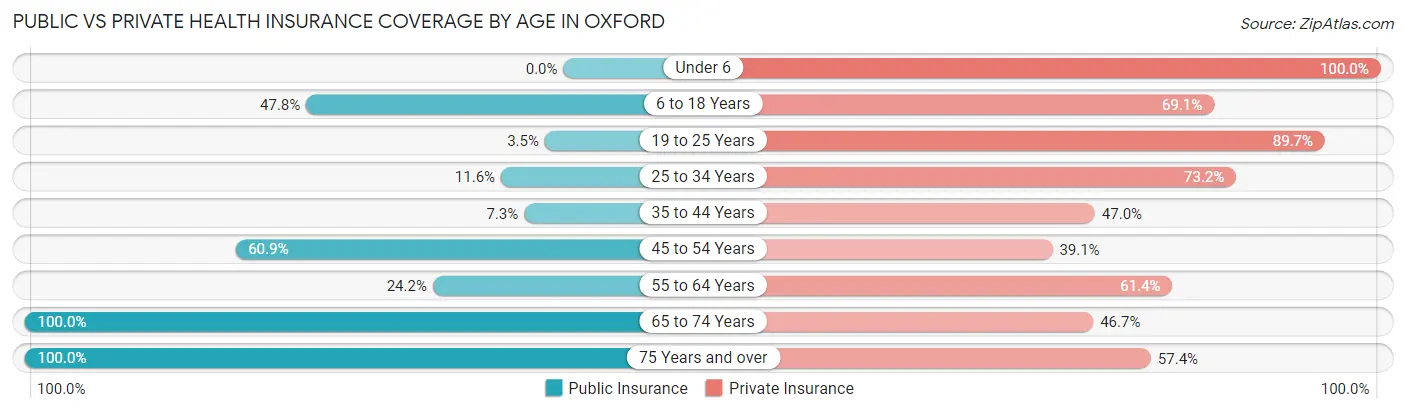
| Age Bracket | Public Insurance | Private Insurance |
| Under 6 | 0 (0.0%) | 47 (100.0%) |
| 6 to 18 Years | 85 (47.7%) | 123 (69.1%) |
| 19 to 25 Years | 3 (3.5%) | 78 (89.7%) |
| 25 to 34 Years | 16 (11.6%) | 101 (73.2%) |
| 35 to 44 Years | 23 (7.3%) | 148 (47.0%) |
| 45 to 54 Years | 95 (60.9%) | 61 (39.1%) |
| 55 to 64 Years | 32 (24.2%) | 81 (61.4%) |
| 65 to 74 Years | 135 (100.0%) | 63 (46.7%) |
| 75 Years and over | 61 (100.0%) | 35 (57.4%) |
| Total | 450 (36.0%) | 737 (59.0%) |
Disability Status by Sex by Age in Oxford
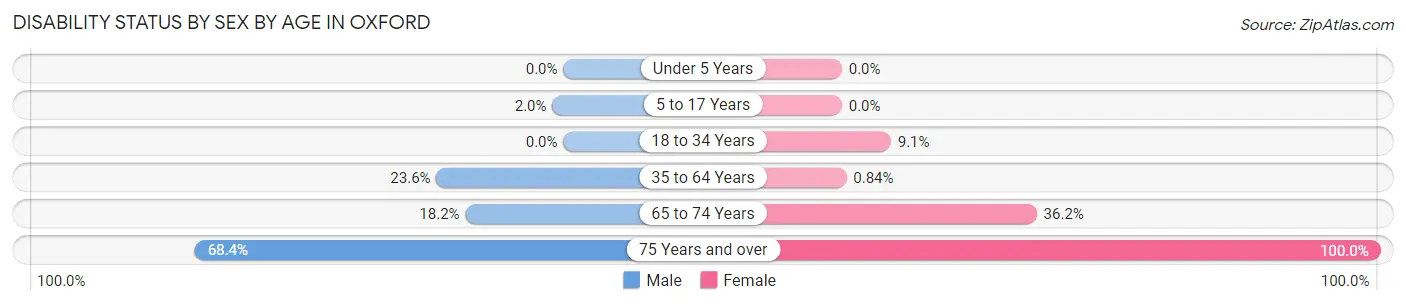
| Age Bracket | Male | Female |
| Under 5 Years | 0 (0.0%) | 0 (0.0%) |
| 5 to 17 Years | 2 (2.0%) | 0 (0.0%) |
| 18 to 34 Years | 0 (0.0%) | 10 (9.1%) |
| 35 to 64 Years | 86 (23.6%) | 2 (0.8%) |
| 65 to 74 Years | 16 (18.2%) | 17 (36.2%) |
| 75 Years and over | 13 (68.4%) | 42 (100.0%) |
Disability Class by Sex by Age in Oxford
Disability Class: Hearing Difficulty
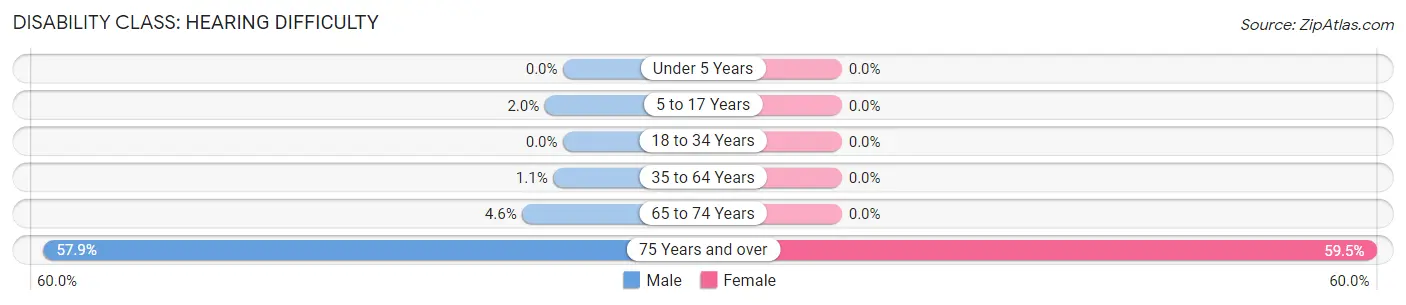
| Age Bracket | Male | Female |
| Under 5 Years | 0 (0.0%) | 0 (0.0%) |
| 5 to 17 Years | 2 (2.0%) | 0 (0.0%) |
| 18 to 34 Years | 0 (0.0%) | 0 (0.0%) |
| 35 to 64 Years | 4 (1.1%) | 0 (0.0%) |
| 65 to 74 Years | 4 (4.5%) | 0 (0.0%) |
| 75 Years and over | 11 (57.9%) | 25 (59.5%) |
Disability Class: Vision Difficulty
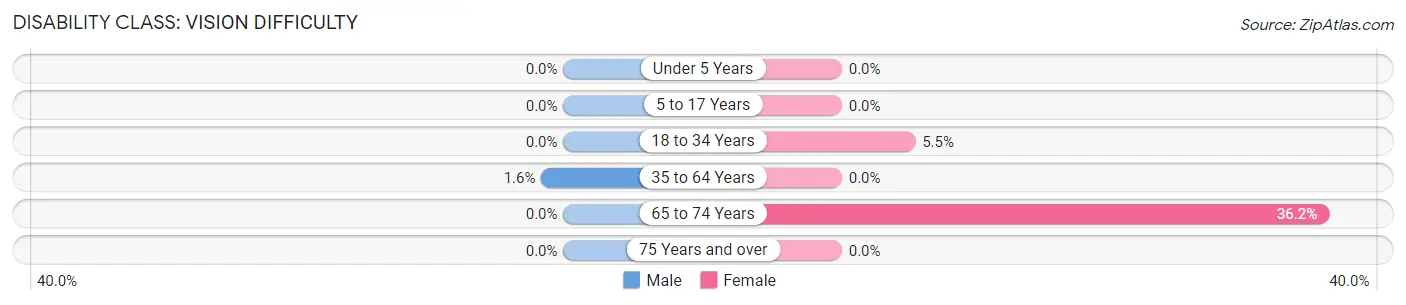
| Age Bracket | Male | Female |
| Under 5 Years | 0 (0.0%) | 0 (0.0%) |
| 5 to 17 Years | 0 (0.0%) | 0 (0.0%) |
| 18 to 34 Years | 0 (0.0%) | 6 (5.4%) |
| 35 to 64 Years | 6 (1.6%) | 0 (0.0%) |
| 65 to 74 Years | 0 (0.0%) | 17 (36.2%) |
| 75 Years and over | 0 (0.0%) | 0 (0.0%) |
Disability Class: Cognitive Difficulty
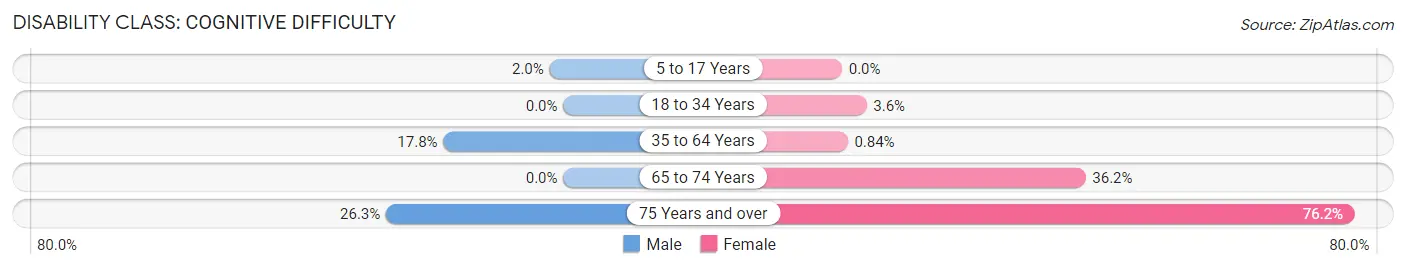
| Age Bracket | Male | Female |
| 5 to 17 Years | 2 (2.0%) | 0 (0.0%) |
| 18 to 34 Years | 0 (0.0%) | 4 (3.6%) |
| 35 to 64 Years | 65 (17.8%) | 2 (0.8%) |
| 65 to 74 Years | 0 (0.0%) | 17 (36.2%) |
| 75 Years and over | 5 (26.3%) | 32 (76.2%) |
Disability Class: Ambulatory Difficulty
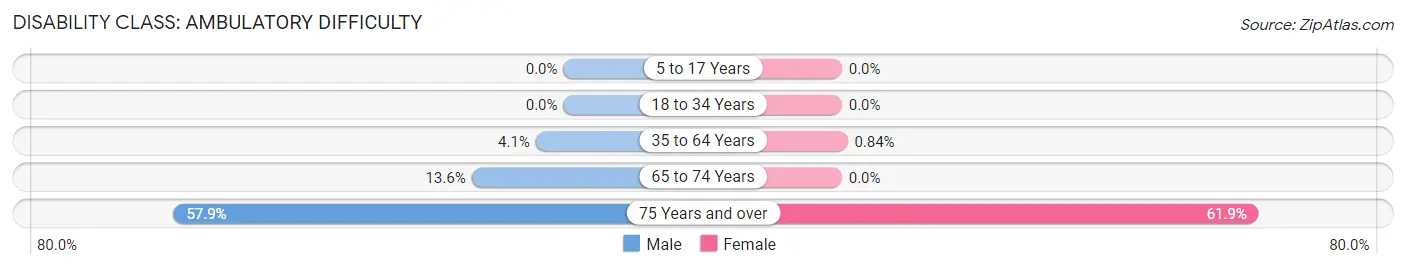
| Age Bracket | Male | Female |
| 5 to 17 Years | 0 (0.0%) | 0 (0.0%) |
| 18 to 34 Years | 0 (0.0%) | 0 (0.0%) |
| 35 to 64 Years | 15 (4.1%) | 2 (0.8%) |
| 65 to 74 Years | 12 (13.6%) | 0 (0.0%) |
| 75 Years and over | 11 (57.9%) | 26 (61.9%) |
Disability Class: Self-Care Difficulty
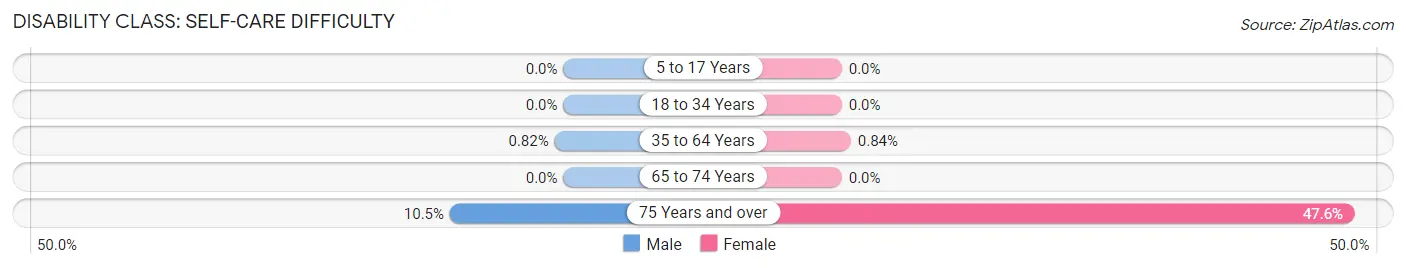
| Age Bracket | Male | Female |
| 5 to 17 Years | 0 (0.0%) | 0 (0.0%) |
| 18 to 34 Years | 0 (0.0%) | 0 (0.0%) |
| 35 to 64 Years | 3 (0.8%) | 2 (0.8%) |
| 65 to 74 Years | 0 (0.0%) | 0 (0.0%) |
| 75 Years and over | 2 (10.5%) | 20 (47.6%) |
Technology Access in Oxford
Computing Device Access in Oxford
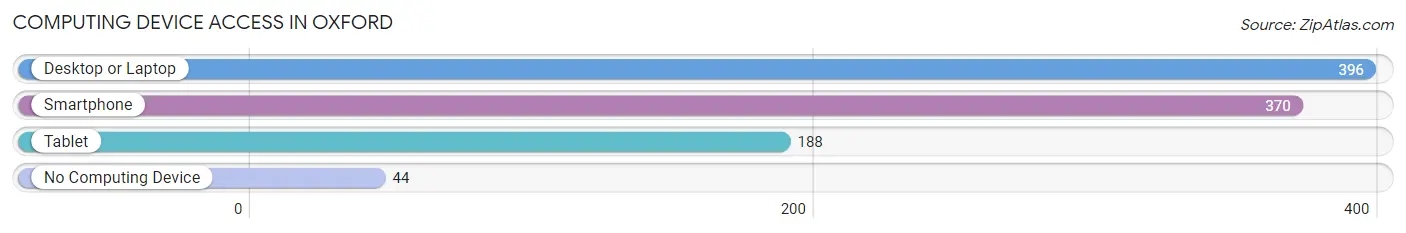
| Device Type | # Households | % Households |
| Desktop or Laptop | 396 | 82.5% |
| Smartphone | 370 | 77.1% |
| Tablet | 188 | 39.2% |
| No Computing Device | 44 | 9.2% |
| Total | 480 | 100.0% |
Internet Access in Oxford
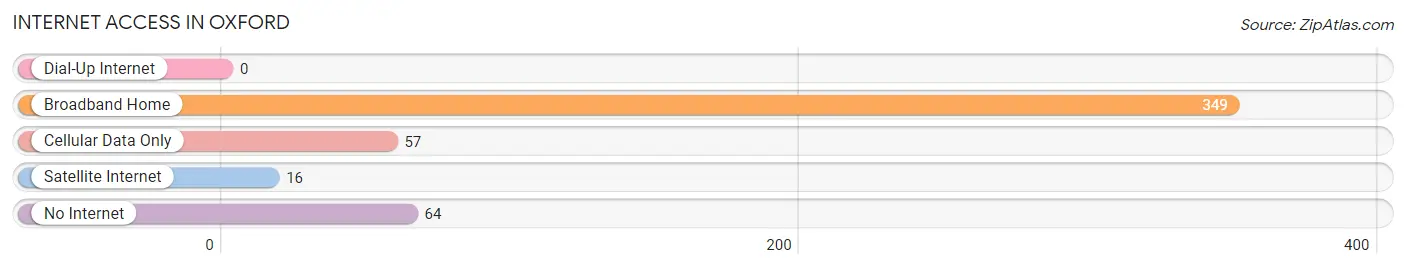
| Internet Type | # Households | % Households |
| Dial-Up Internet | 0 | 0.0% |
| Broadband Home | 349 | 72.7% |
| Cellular Data Only | 57 | 11.9% |
| Satellite Internet | 16 | 3.3% |
| No Internet | 64 | 13.3% |
| Total | 480 | 100.0% |
Oxford Summary
Oxford is a small borough located in the northwest corner of New Jersey in Warren County. It is situated on the banks of the Musconetcong River, which is a tributary of the Delaware River. The borough is bordered by Washington Township to the north, Mansfield Township to the east, and Holland Township to the south. Oxford is approximately 40 miles from both New York City and Philadelphia.
History
Oxford was first settled in 1739 by a group of German immigrants led by John Jacob Faesch. The town was originally known as Faesch’s Landing, and was later renamed Oxford in 1824. The name was chosen to honor the English university town of Oxford.
The town was officially incorporated in 1853, and the first mayor was John B. Smith. During the 19th century, Oxford was a thriving agricultural community, with many farms and mills located in the area. The town also had a thriving lumber industry, and was home to several sawmills and gristmills.
In the early 20th century, Oxford began to experience a period of growth and development. The town was home to several factories, including a silk mill, a paper mill, and a brickyard. The town also had a thriving retail sector, with several stores and shops located in the downtown area.
Geography
Oxford is located in the northwest corner of New Jersey in Warren County. It is situated on the banks of the Musconetcong River, which is a tributary of the Delaware River. The borough is bordered by Washington Township to the north, Mansfield Township to the east, and Holland Township to the south.
The town has a total area of 1.3 square miles, all of which is land. The terrain is mostly flat, with some rolling hills in the northern part of the borough. The highest point in Oxford is located at the intersection of Route 57 and Route 519, which is approximately 500 feet above sea level.
Economy
Oxford’s economy is largely based on agriculture and manufacturing. The town is home to several farms, which produce a variety of crops, including corn, soybeans, and hay. The town also has several factories, including a paper mill, a brickyard, and a silk mill.
The town also has a thriving retail sector, with several stores and shops located in the downtown area. The town is also home to several restaurants, bars, and other businesses.
Demographics
As of the 2010 census, Oxford had a population of 2,845 people. The racial makeup of the town was 94.3% White, 2.2% African American, 0.3% Native American, 0.7% Asian, 0.1% Pacific Islander, and 2.4% from other races. Hispanic or Latino of any race were 5.2% of the population.
The median household income in Oxford was $60,938, and the median family income was $68,750. The per capita income for the town was $25,945. About 4.3% of families and 5.7% of the population were below the poverty line, including 6.3% of those under age 18 and 5.2% of those age 65 or over.
Common Questions
What is Per Capita Income in Oxford?
Per Capita income in Oxford is $50,080.
What is the Median Family Income in Oxford?
Median Family Income in Oxford is $79,583.
What is the Median Household income in Oxford?
Median Household Income in Oxford is $60,833.
What is Income or Wage Gap in Oxford?
Income or Wage Gap in Oxford is 13.2%.
Women in Oxford earn 86.8 cents for every dollar earned by a man.
What is Inequality or Gini Index in Oxford?
Inequality or Gini Index in Oxford is 0.50.
What is the Total Population of Oxford?
Total Population of Oxford is 1,249.
What is the Total Male Population of Oxford?
Total Male Population of Oxford is 714.
What is the Total Female Population of Oxford?
Total Female Population of Oxford is 535.
What is the Ratio of Males per 100 Females in Oxford?
There are 133.46 Males per 100 Females in Oxford.
What is the Ratio of Females per 100 Males in Oxford?
There are 74.93 Females per 100 Males in Oxford.
What is the Median Population Age in Oxford?
Median Population Age in Oxford is 43.1 Years.
What is the Average Family Size in Oxford
Average Family Size in Oxford is 2.9 People.
What is the Average Household Size in Oxford
Average Household Size in Oxford is 2.5 People.
How Large is the Labor Force in Oxford?
There are 806 People in the Labor Forcein in Oxford.
What is the Percentage of People in the Labor Force in Oxford?
73.3% of People are in the Labor Force in Oxford.
What is the Unemployment Rate in Oxford?
Unemployment Rate in Oxford is 8.2%.