Zip Codes with the Highest Percentage of Population Employed in Food Preparation & Serving in New Jersey
RELATED REPORTS & OPTIONS
Food Preparation & Serving
New Jersey
Compare Zip Codes
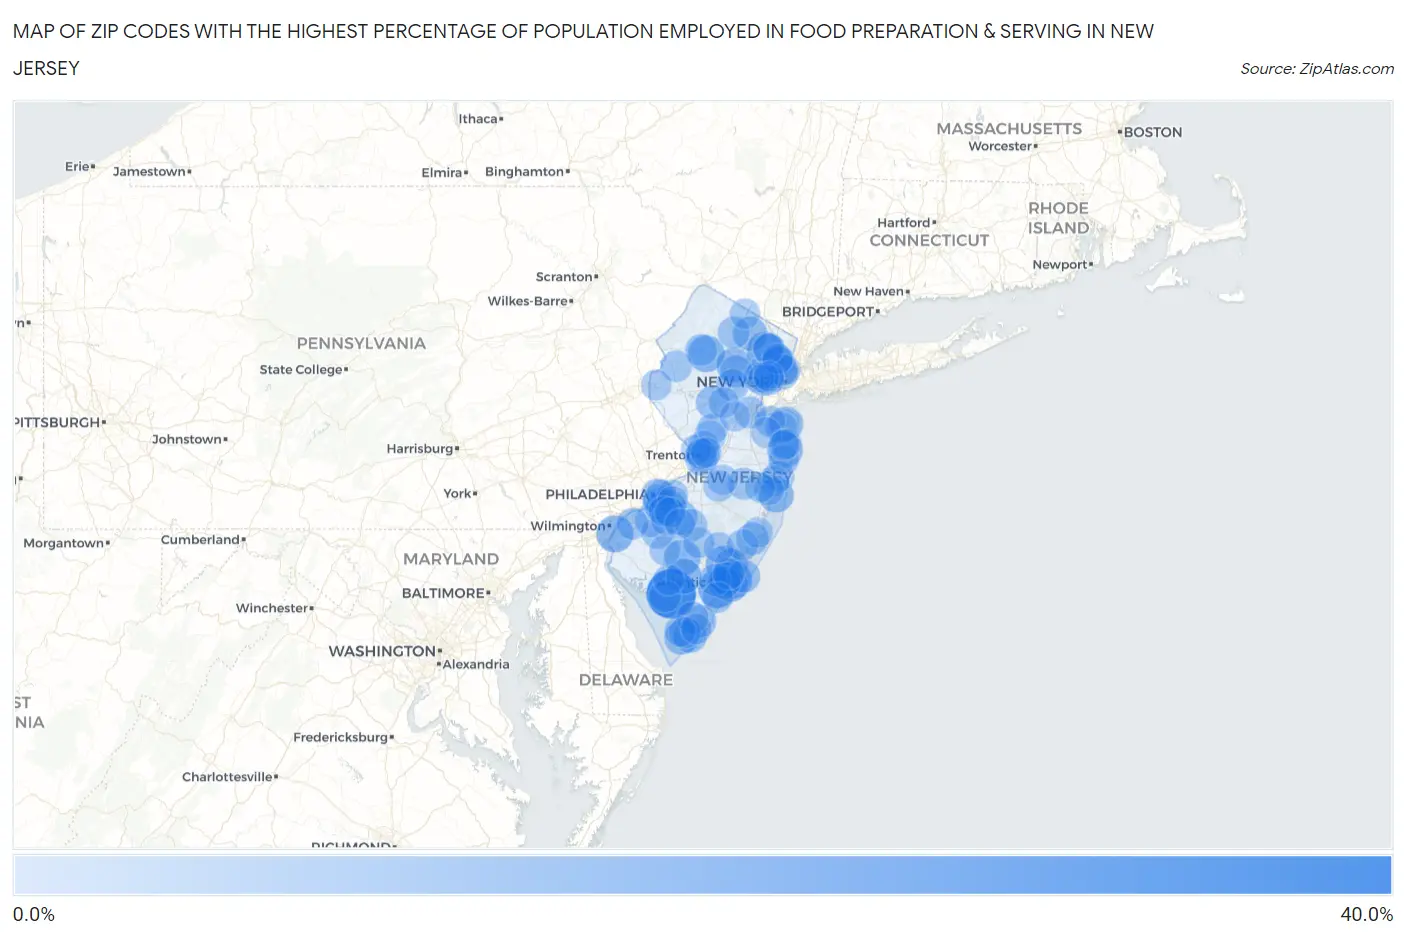
Map of Zip Codes with the Highest Percentage of Population Employed in Food Preparation & Serving in New Jersey
0.0%
40.0%
Zip Codes with the Highest Percentage of Population Employed in Food Preparation & Serving in New Jersey
| Zip Code | % Employed | vs State | vs National | |
| 1. | 08329 | 33.3% | 4.0%(+29.4)#1 | 5.3%(+28.0)#168 |
| 2. | 07505 | 17.7% | 4.0%(+13.7)#2 | 5.3%(+12.4)#684 |
| 3. | 08244 | 17.6% | 4.0%(+13.6)#3 | 5.3%(+12.3)#699 |
| 4. | 08023 | 15.3% | 4.0%(+11.3)#4 | 5.3%(+10.0)#947 |
| 5. | 08401 | 15.0% | 4.0%(+11.1)#5 | 5.3%(+9.76)#977 |
| 6. | 07857 | 14.8% | 4.0%(+10.8)#6 | 5.3%(+9.47)#1,017 |
| 7. | 08310 | 14.2% | 4.0%(+10.2)#7 | 5.3%(+8.87)#1,132 |
| 8. | 08240 | 13.8% | 4.0%(+9.81)#8 | 5.3%(+8.49)#1,213 |
| 9. | 07723 | 13.3% | 4.0%(+9.35)#9 | 5.3%(+8.03)#1,318 |
| 10. | 08340 | 12.8% | 4.0%(+8.88)#10 | 5.3%(+7.56)#1,432 |
| 11. | 08751 | 12.4% | 4.0%(+8.42)#11 | 5.3%(+7.10)#1,546 |
| 12. | 07927 | 12.2% | 4.0%(+8.27)#12 | 5.3%(+6.94)#1,587 |
| 13. | 08091 | 12.0% | 4.0%(+7.99)#13 | 5.3%(+6.67)#1,685 |
| 14. | 08045 | 11.6% | 4.0%(+7.69)#14 | 5.3%(+6.36)#1,795 |
| 15. | 07420 | 11.3% | 4.0%(+7.35)#15 | 5.3%(+6.02)#1,916 |
| 16. | 07732 | 11.2% | 4.0%(+7.26)#16 | 5.3%(+5.94)#1,948 |
| 17. | 08204 | 11.0% | 4.0%(+7.04)#17 | 5.3%(+5.72)#2,055 |
| 18. | 08406 | 10.6% | 4.0%(+6.67)#18 | 5.3%(+5.35)#2,240 |
| 19. | 08260 | 10.2% | 4.0%(+6.21)#19 | 5.3%(+4.88)#2,508 |
| 20. | 08205 | 9.9% | 4.0%(+5.92)#20 | 5.3%(+4.60)#2,721 |
| 21. | 08869 | 9.9% | 4.0%(+5.90)#21 | 5.3%(+4.58)#2,739 |
| 22. | 08629 | 9.8% | 4.0%(+5.79)#22 | 5.3%(+4.47)#2,837 |
| 23. | 08232 | 9.5% | 4.0%(+5.58)#23 | 5.3%(+4.26)#3,018 |
| 24. | 08225 | 9.4% | 4.0%(+5.44)#24 | 5.3%(+4.12)#3,133 |
| 25. | 08203 | 9.3% | 4.0%(+5.36)#25 | 5.3%(+4.04)#3,218 |
| 26. | 08051 | 9.2% | 4.0%(+5.20)#26 | 5.3%(+3.88)#3,358 |
| 27. | 07074 | 9.1% | 4.0%(+5.14)#27 | 5.3%(+3.82)#3,412 |
| 28. | 08102 | 9.1% | 4.0%(+5.10)#28 | 5.3%(+3.77)#3,462 |
| 29. | 07961 | 8.8% | 4.0%(+4.86)#29 | 5.3%(+3.54)#3,703 |
| 30. | 08202 | 8.7% | 4.0%(+4.78)#30 | 5.3%(+3.45)#3,797 |
| 31. | 08092 | 8.7% | 4.0%(+4.75)#31 | 5.3%(+3.43)#3,836 |
| 32. | 07933 | 8.6% | 4.0%(+4.60)#32 | 5.3%(+3.28)#4,011 |
| 33. | 08349 | 8.2% | 4.0%(+4.28)#33 | 5.3%(+2.96)#4,383 |
| 34. | 08832 | 8.2% | 4.0%(+4.22)#34 | 5.3%(+2.90)#4,462 |
| 35. | 08733 | 8.2% | 4.0%(+4.21)#35 | 5.3%(+2.88)#4,485 |
| 36. | 07435 | 8.1% | 4.0%(+4.15)#36 | 5.3%(+2.83)#4,552 |
| 37. | 08234 | 8.0% | 4.0%(+4.06)#37 | 5.3%(+2.74)#4,696 |
| 38. | 08004 | 7.9% | 4.0%(+3.98)#38 | 5.3%(+2.66)#4,813 |
| 39. | 07874 | 7.9% | 4.0%(+3.98)#39 | 5.3%(+2.65)#4,830 |
| 40. | 08028 | 7.9% | 4.0%(+3.93)#40 | 5.3%(+2.61)#4,895 |
| 41. | 07716 | 7.8% | 4.0%(+3.80)#41 | 5.3%(+2.48)#5,116 |
| 42. | 08210 | 7.8% | 4.0%(+3.80)#42 | 5.3%(+2.47)#5,121 |
| 43. | 08611 | 7.7% | 4.0%(+3.72)#43 | 5.3%(+2.39)#5,244 |
| 44. | 08201 | 7.6% | 4.0%(+3.63)#44 | 5.3%(+2.31)#5,388 |
| 45. | 07863 | 7.5% | 4.0%(+3.56)#45 | 5.3%(+2.24)#5,506 |
| 46. | 08030 | 7.5% | 4.0%(+3.55)#46 | 5.3%(+2.23)#5,530 |
| 47. | 08085 | 7.5% | 4.0%(+3.53)#47 | 5.3%(+2.21)#5,573 |
| 48. | 08544 | 7.4% | 4.0%(+3.49)#48 | 5.3%(+2.16)#5,655 |
| 49. | 08242 | 7.4% | 4.0%(+3.39)#49 | 5.3%(+2.07)#5,842 |
| 50. | 07087 | 7.3% | 4.0%(+3.37)#50 | 5.3%(+2.05)#5,866 |
| 51. | 07017 | 7.3% | 4.0%(+3.30)#51 | 5.3%(+1.97)#6,000 |
| 52. | 08087 | 7.1% | 4.0%(+3.16)#52 | 5.3%(+1.83)#6,298 |
| 53. | 08031 | 7.1% | 4.0%(+3.13)#53 | 5.3%(+1.81)#6,348 |
| 54. | 08742 | 7.0% | 4.0%(+3.05)#54 | 5.3%(+1.73)#6,532 |
| 55. | 07108 | 7.0% | 4.0%(+3.00)#55 | 5.3%(+1.68)#6,652 |
| 56. | 07093 | 7.0% | 4.0%(+3.00)#56 | 5.3%(+1.67)#6,664 |
| 57. | 08104 | 6.9% | 4.0%(+2.90)#57 | 5.3%(+1.58)#6,905 |
| 58. | 08251 | 6.7% | 4.0%(+2.76)#58 | 5.3%(+1.44)#7,273 |
| 59. | 08640 | 6.7% | 4.0%(+2.72)#59 | 5.3%(+1.39)#7,385 |
| 60. | 08037 | 6.6% | 4.0%(+2.68)#60 | 5.3%(+1.36)#7,503 |
| 61. | 08332 | 6.6% | 4.0%(+2.68)#61 | 5.3%(+1.35)#7,512 |
| 62. | 08723 | 6.6% | 4.0%(+2.63)#62 | 5.3%(+1.31)#7,612 |
| 63. | 08648 | 6.6% | 4.0%(+2.63)#63 | 5.3%(+1.31)#7,618 |
| 64. | 08328 | 6.6% | 4.0%(+2.60)#64 | 5.3%(+1.28)#7,688 |
| 65. | 07606 | 6.5% | 4.0%(+2.58)#65 | 5.3%(+1.26)#7,754 |
| 66. | 08226 | 6.5% | 4.0%(+2.57)#66 | 5.3%(+1.24)#7,803 |
| 67. | 07047 | 6.5% | 4.0%(+2.56)#67 | 5.3%(+1.23)#7,835 |
| 68. | 07105 | 6.5% | 4.0%(+2.49)#68 | 5.3%(+1.17)#7,989 |
| 69. | 08618 | 6.5% | 4.0%(+2.49)#69 | 5.3%(+1.17)#7,990 |
| 70. | 08052 | 6.4% | 4.0%(+2.43)#70 | 5.3%(+1.11)#8,160 |
| 71. | 07106 | 6.4% | 4.0%(+2.42)#71 | 5.3%(+1.10)#8,172 |
| 72. | 08865 | 6.4% | 4.0%(+2.40)#72 | 5.3%(+1.08)#8,240 |
| 73. | 08105 | 6.4% | 4.0%(+2.40)#73 | 5.3%(+1.07)#8,243 |
| 74. | 07734 | 6.3% | 4.0%(+2.36)#74 | 5.3%(+1.03)#8,375 |
| 75. | 08247 | 6.2% | 4.0%(+2.29)#75 | 5.3%(+0.964)#8,583 |
| 76. | 08553 | 6.2% | 4.0%(+2.29)#76 | 5.3%(+0.964)#8,585 |
| 77. | 07524 | 6.2% | 4.0%(+2.24)#77 | 5.3%(+0.917)#8,717 |
| 78. | 07514 | 6.2% | 4.0%(+2.23)#78 | 5.3%(+0.902)#8,771 |
| 79. | 07733 | 6.2% | 4.0%(+2.22)#79 | 5.3%(+0.898)#8,787 |
| 80. | 08609 | 6.2% | 4.0%(+2.19)#80 | 5.3%(+0.865)#8,878 |
| 81. | 08511 | 6.1% | 4.0%(+2.16)#81 | 5.3%(+0.836)#8,954 |
| 82. | 08050 | 6.1% | 4.0%(+2.12)#82 | 5.3%(+0.799)#9,072 |
| 83. | 07604 | 6.1% | 4.0%(+2.11)#83 | 5.3%(+0.790)#9,102 |
| 84. | 08805 | 6.0% | 4.0%(+2.08)#84 | 5.3%(+0.754)#9,208 |
| 85. | 08012 | 6.0% | 4.0%(+2.07)#85 | 5.3%(+0.742)#9,249 |
| 86. | 08215 | 6.0% | 4.0%(+2.06)#86 | 5.3%(+0.734)#9,279 |
| 87. | 08901 | 6.0% | 4.0%(+2.06)#87 | 5.3%(+0.732)#9,289 |
| 88. | 07717 | 6.0% | 4.0%(+2.02)#88 | 5.3%(+0.694)#9,410 |
| 89. | 08619 | 6.0% | 4.0%(+1.99)#89 | 5.3%(+0.669)#9,487 |
| 90. | 07740 | 5.9% | 4.0%(+1.96)#90 | 5.3%(+0.640)#9,592 |
| 91. | 08034 | 5.9% | 4.0%(+1.94)#91 | 5.3%(+0.616)#9,674 |
| 92. | 08029 | 5.9% | 4.0%(+1.91)#92 | 5.3%(+0.590)#9,766 |
| 93. | 08084 | 5.9% | 4.0%(+1.90)#93 | 5.3%(+0.574)#9,820 |
| 94. | 07764 | 5.8% | 4.0%(+1.84)#94 | 5.3%(+0.518)#10,027 |
| 95. | 08753 | 5.8% | 4.0%(+1.82)#95 | 5.3%(+0.499)#10,071 |
| 96. | 07421 | 5.8% | 4.0%(+1.81)#96 | 5.3%(+0.483)#10,127 |
| 97. | 07103 | 5.8% | 4.0%(+1.80)#97 | 5.3%(+0.472)#10,157 |
| 98. | 07029 | 5.8% | 4.0%(+1.79)#98 | 5.3%(+0.471)#10,162 |
| 99. | 08755 | 5.7% | 4.0%(+1.70)#99 | 5.3%(+0.380)#10,469 |
| 100. | 08009 | 5.6% | 4.0%(+1.68)#100 | 5.3%(+0.352)#10,567 |
Common Questions
What are the Top 10 Zip Codes with the Highest Percentage of Population Employed in Food Preparation & Serving in New Jersey?
Top 10 Zip Codes with the Highest Percentage of Population Employed in Food Preparation & Serving in New Jersey are:
What zip code has the Highest Percentage of Population Employed in Food Preparation & Serving in New Jersey?
08329 has the Highest Percentage of Population Employed in Food Preparation & Serving in New Jersey with 33.3%.
What is the Percentage of Population Employed in Food Preparation & Serving in the State of New Jersey?
Percentage of Population Employed in Food Preparation & Serving in New Jersey is 4.0%.
What is the Percentage of Population Employed in Food Preparation & Serving in the United States?
Percentage of Population Employed in Food Preparation & Serving in the United States is 5.3%.