Zip Codes with the Highest Percentage of Population Employed in Food Preparation & Serving in Plainfield, NJ
RELATED REPORTS & OPTIONS
Food Preparation & Serving
Plainfield
Compare Zip Codes
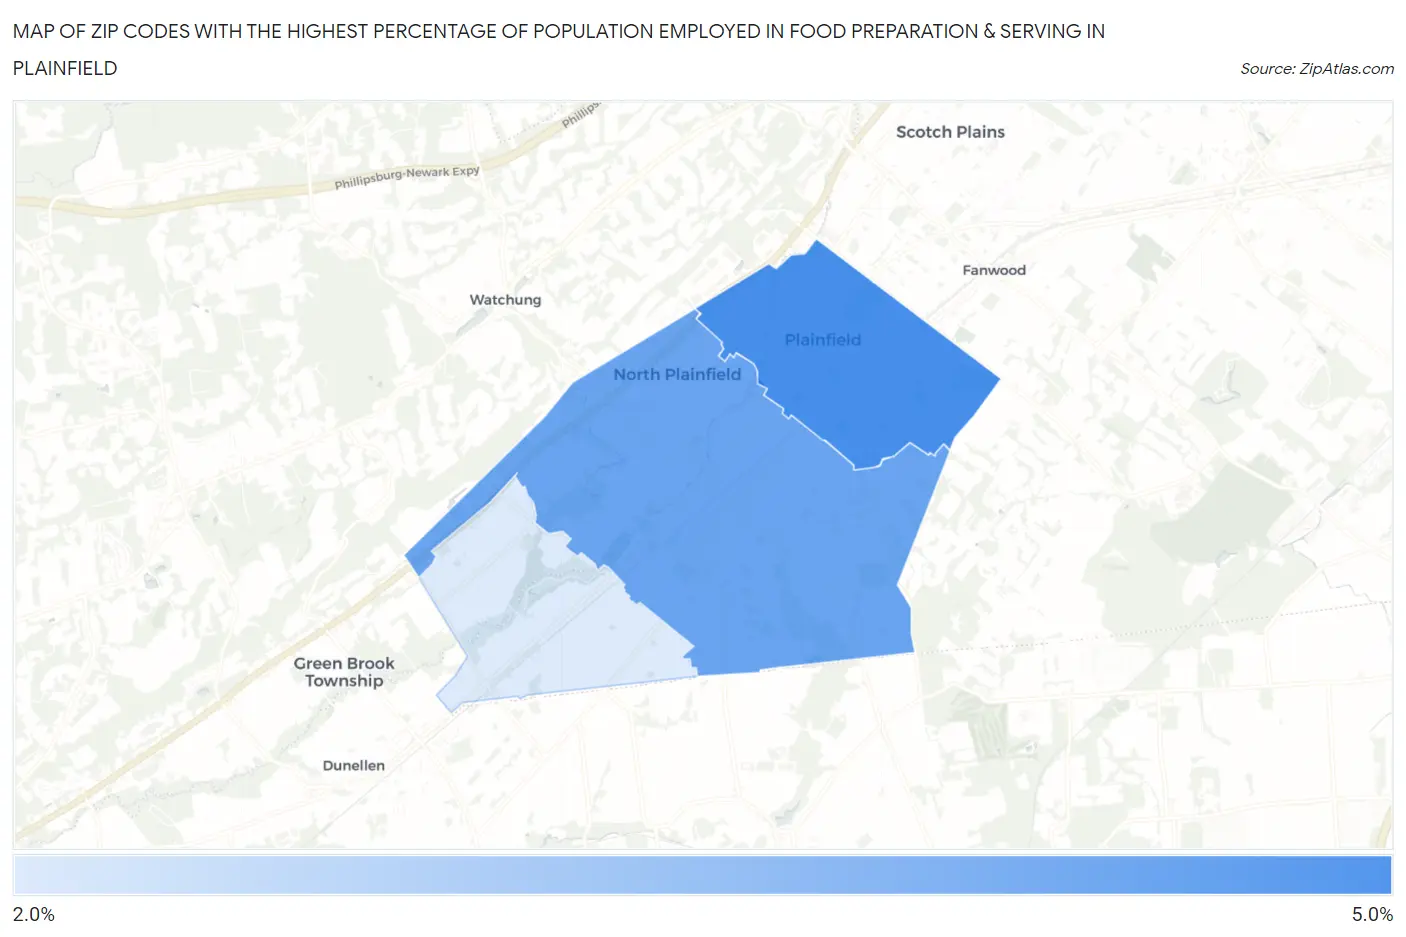
Map of Zip Codes with the Highest Percentage of Population Employed in Food Preparation & Serving in Plainfield
2.3%
4.5%
Zip Codes with the Highest Percentage of Population Employed in Food Preparation & Serving in Plainfield, NJ
| Zip Code | % Employed | vs State | vs National | |
| 1. | 07062 | 4.5% | 4.0%(+0.577)#172 | 5.3%(-0.746)#14,859 |
| 2. | 07060 | 4.0% | 4.0%(+0.049)#215 | 5.3%(-1.27)#17,085 |
| 3. | 07063 | 2.3% | 4.0%(-1.69)#416 | 5.3%(-3.02)#23,890 |
1
Common Questions
What are the Top Zip Codes with the Highest Percentage of Population Employed in Food Preparation & Serving in Plainfield, NJ?
Top Zip Codes with the Highest Percentage of Population Employed in Food Preparation & Serving in Plainfield, NJ are:
What zip code has the Highest Percentage of Population Employed in Food Preparation & Serving in Plainfield, NJ?
07062 has the Highest Percentage of Population Employed in Food Preparation & Serving in Plainfield, NJ with 4.5%.
What is the Percentage of Population Employed in Food Preparation & Serving in Plainfield, NJ?
Percentage of Population Employed in Food Preparation & Serving in Plainfield is 4.0%.
What is the Percentage of Population Employed in Food Preparation & Serving in New Jersey?
Percentage of Population Employed in Food Preparation & Serving in New Jersey is 4.0%.
What is the Percentage of Population Employed in Food Preparation & Serving in the United States?
Percentage of Population Employed in Food Preparation & Serving in the United States is 5.3%.