Laurel Lake, NJ Map & Demographics
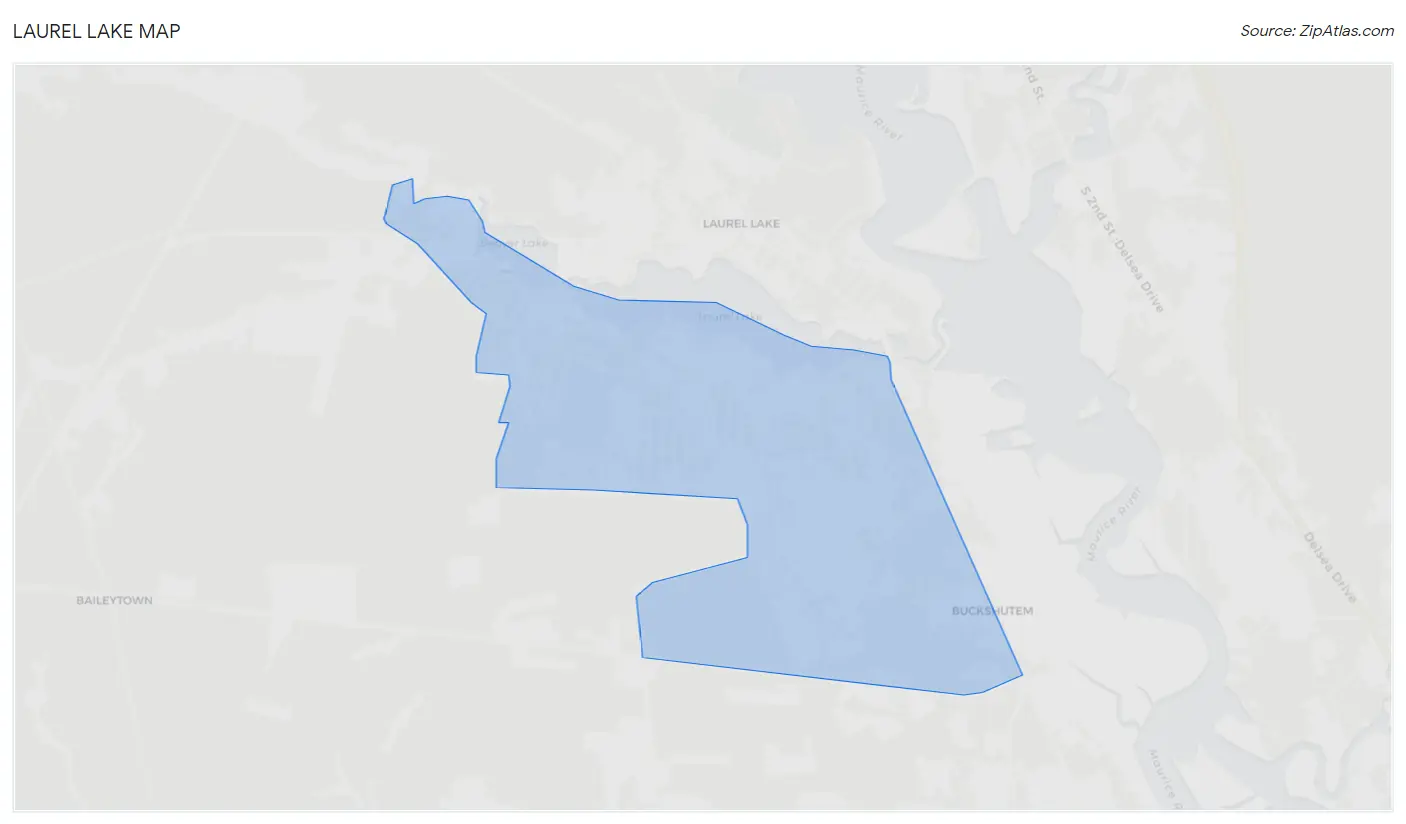
Laurel Lake Map
Laurel Lake Overview
$25,784
PER CAPITA INCOME
$63,864
AVG FAMILY INCOME
$52,321
AVG HOUSEHOLD INCOME
38.7%
WAGE / INCOME GAP [ % ]
61.3¢/ $1
WAGE / INCOME GAP [ $ ]
0.43
INEQUALITY / GINI INDEX
2,346
TOTAL POPULATION
1,147
MALE POPULATION
1,199
FEMALE POPULATION
95.66
MALES / 100 FEMALES
104.53
FEMALES / 100 MALES
40.5
MEDIAN AGE
3.2
AVG FAMILY SIZE
2.6
AVG HOUSEHOLD SIZE
1,069
LABOR FORCE [ PEOPLE ]
61.5%
PERCENT IN LABOR FORCE
6.8%
UNEMPLOYMENT RATE
Income in Laurel Lake
Income Overview in Laurel Lake
Per Capita Income in Laurel Lake is $25,784, while median incomes of families and households are $63,864 and $52,321 respectively.
| Characteristic | Number | Measure |
| Per Capita Income | 2,346 | $25,784 |
| Median Family Income | 560 | $63,864 |
| Mean Family Income | 560 | $72,547 |
| Median Household Income | 906 | $52,321 |
| Mean Household Income | 906 | $64,143 |
| Income Deficit | 560 | $0 |
| Wage / Income Gap (%) | 2,346 | 38.72% |
| Wage / Income Gap ($) | 2,346 | 61.28¢ per $1 |
| Gini / Inequality Index | 2,346 | 0.43 |
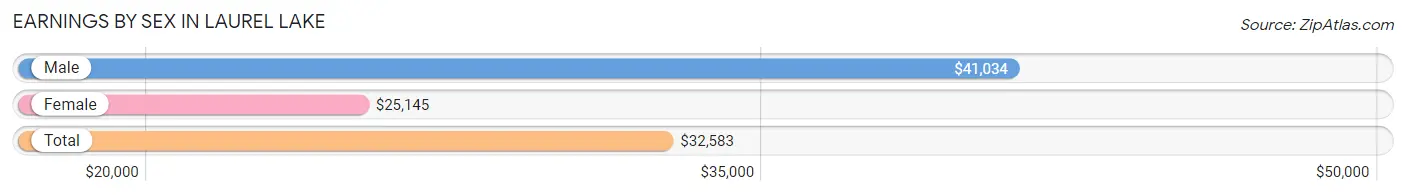
Earnings by Sex in Laurel Lake
Average Earnings in Laurel Lake are $32,583, $41,034 for men and $25,145 for women, a difference of 38.7%.
| Sex | Number | Average Earnings |
| Male | 673 (62.1%) | $41,034 |
| Female | 411 (37.9%) | $25,145 |
| Total | 1,084 (100.0%) | $32,583 |
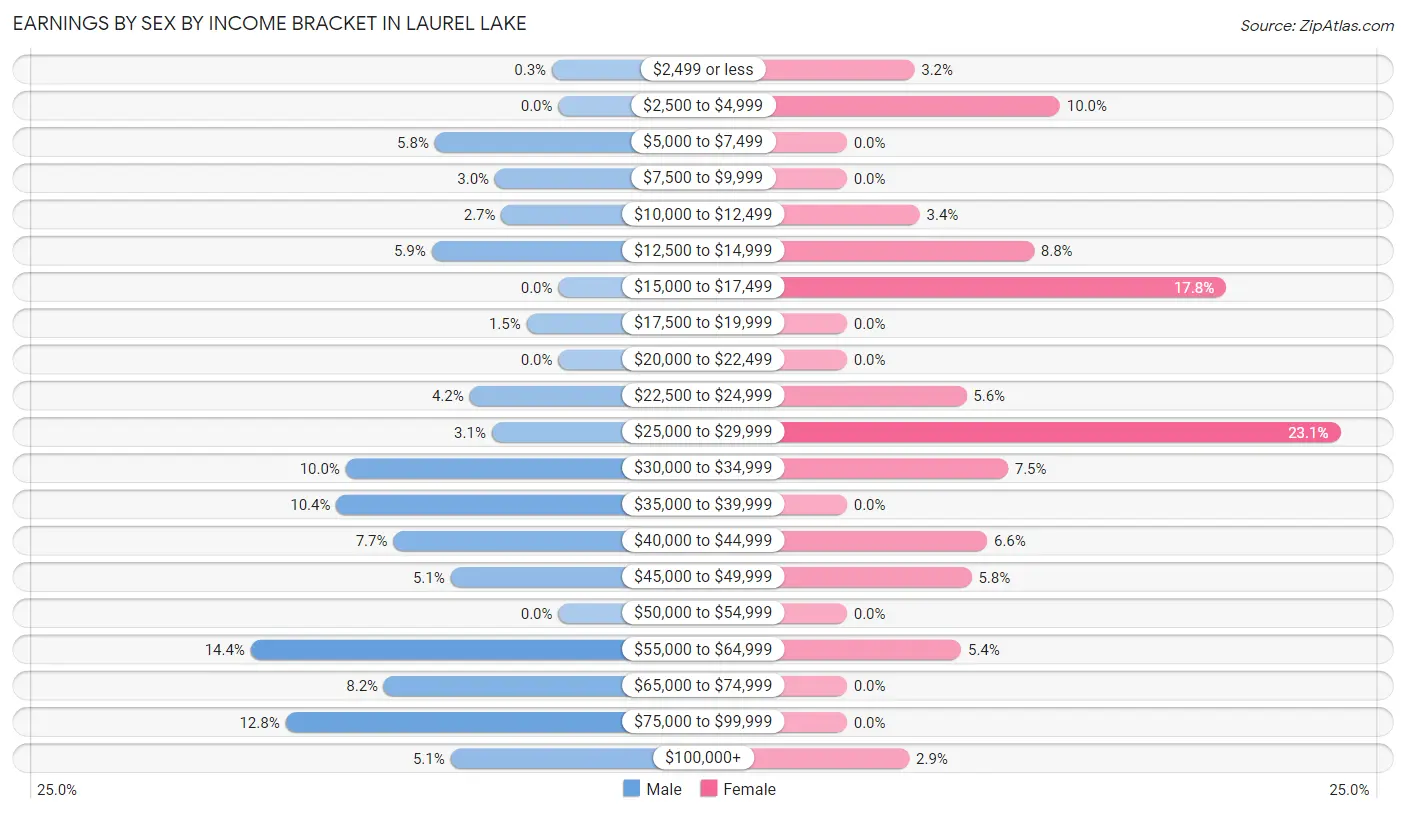
Earnings by Sex by Income Bracket in Laurel Lake
The most common earnings brackets in Laurel Lake are $55,000 to $64,999 for men (97 | 14.4%) and $25,000 to $29,999 for women (95 | 23.1%).
| Income | Male | Female |
| $2,499 or less | 2 (0.3%) | 13 (3.2%) |
| $2,500 to $4,999 | 0 (0.0%) | 41 (10.0%) |
| $5,000 to $7,499 | 39 (5.8%) | 0 (0.0%) |
| $7,500 to $9,999 | 20 (3.0%) | 0 (0.0%) |
| $10,000 to $12,499 | 18 (2.7%) | 14 (3.4%) |
| $12,500 to $14,999 | 40 (5.9%) | 36 (8.8%) |
| $15,000 to $17,499 | 0 (0.0%) | 73 (17.8%) |
| $17,500 to $19,999 | 10 (1.5%) | 0 (0.0%) |
| $20,000 to $22,499 | 0 (0.0%) | 0 (0.0%) |
| $22,500 to $24,999 | 28 (4.2%) | 23 (5.6%) |
| $25,000 to $29,999 | 21 (3.1%) | 95 (23.1%) |
| $30,000 to $34,999 | 67 (10.0%) | 31 (7.5%) |
| $35,000 to $39,999 | 70 (10.4%) | 0 (0.0%) |
| $40,000 to $44,999 | 52 (7.7%) | 27 (6.6%) |
| $45,000 to $49,999 | 34 (5.1%) | 24 (5.8%) |
| $50,000 to $54,999 | 0 (0.0%) | 0 (0.0%) |
| $55,000 to $64,999 | 97 (14.4%) | 22 (5.3%) |
| $65,000 to $74,999 | 55 (8.2%) | 0 (0.0%) |
| $75,000 to $99,999 | 86 (12.8%) | 0 (0.0%) |
| $100,000+ | 34 (5.1%) | 12 (2.9%) |
| Total | 673 (100.0%) | 411 (100.0%) |
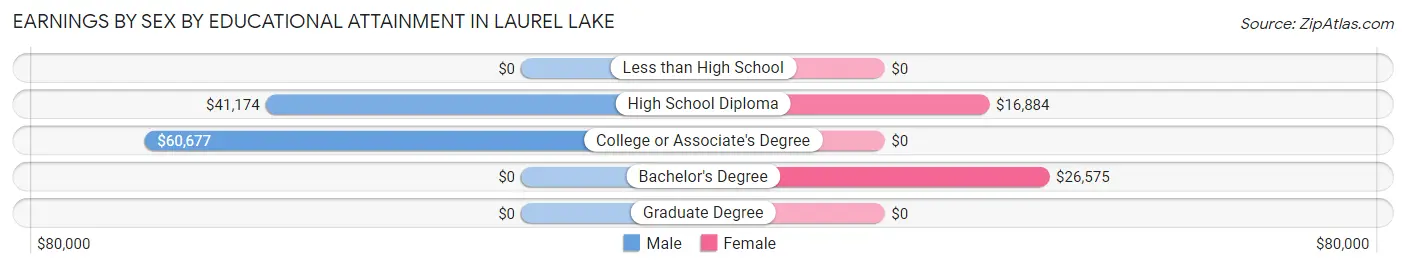
Earnings by Sex by Educational Attainment in Laurel Lake
Average earnings in Laurel Lake are $48,810 for men and $25,145 for women, a difference of 48.5%. Men with an educational attainment of college or associate's degree enjoy the highest average annual earnings of $60,677, while those with high school diploma education earn the least with $41,174. Women with an educational attainment of bachelor's degree earn the most with the average annual earnings of $26,575, while those with high school diploma education have the smallest earnings of $16,884.
| Educational Attainment | Male Income | Female Income |
| Less than High School | - | - |
| High School Diploma | $41,174 | $16,884 |
| College or Associate's Degree | $60,677 | $0 |
| Bachelor's Degree | - | - |
| Graduate Degree | - | - |
| Total | $48,810 | $25,145 |
Family Income in Laurel Lake
Family Income Brackets in Laurel Lake
According to the Laurel Lake family income data, there are 204 families falling into the $100,000 to $149,999 income range, which is the most common income bracket and makes up 36.4% of all families.
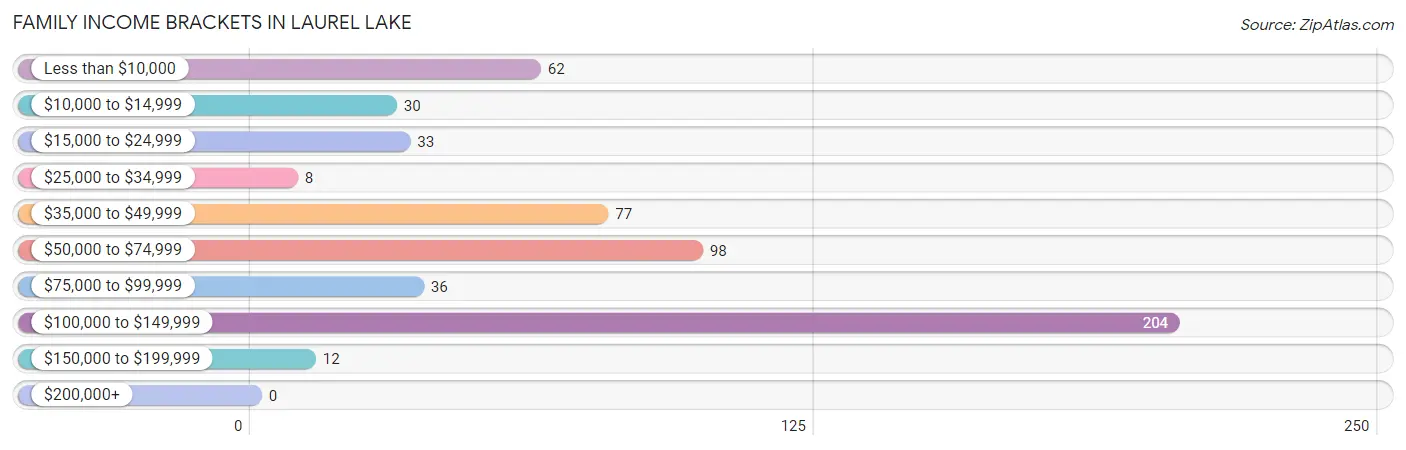
| Income Bracket | # Families | % Families |
| Less than $10,000 | 62 | 11.1% |
| $10,000 to $14,999 | 30 | 5.4% |
| $15,000 to $24,999 | 33 | 5.9% |
| $25,000 to $34,999 | 8 | 1.4% |
| $35,000 to $49,999 | 77 | 13.8% |
| $50,000 to $74,999 | 98 | 17.5% |
| $75,000 to $99,999 | 36 | 6.4% |
| $100,000 to $149,999 | 204 | 36.4% |
| $150,000 to $199,999 | 12 | 2.1% |
| $200,000+ | 0 | 0.0% |
Family Income by Famaliy Size in Laurel Lake
4-person families (159 | 28.4%) account for the highest median family income in Laurel Lake with $101,058 per family, while 2-person families (183 | 32.7%) have the highest median income of $31,988 per family member.
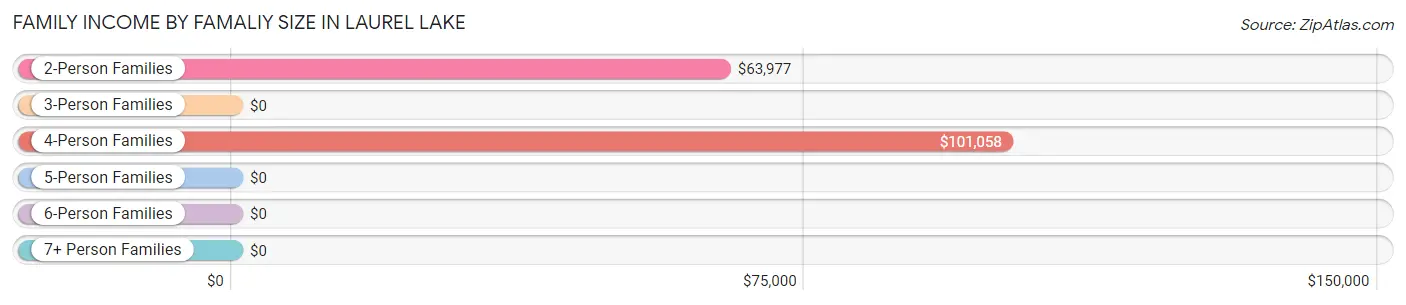
| Income Bracket | # Families | Median Income |
| 2-Person Families | 183 (32.7%) | $63,977 |
| 3-Person Families | 179 (32.0%) | $0 |
| 4-Person Families | 159 (28.4%) | $101,058 |
| 5-Person Families | 32 (5.7%) | $0 |
| 6-Person Families | 0 (0.0%) | $0 |
| 7+ Person Families | 7 (1.3%) | $0 |
| Total | 560 (100.0%) | $63,864 |
Family Income by Number of Earners in Laurel Lake
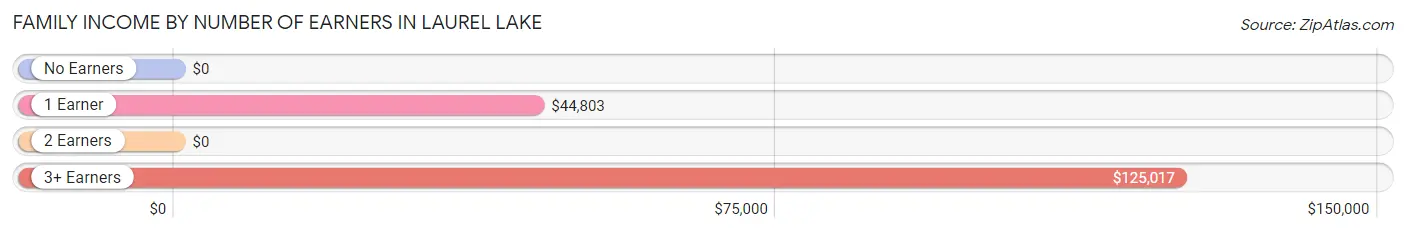
| Number of Earners | # Families | Median Income |
| No Earners | 80 (14.3%) | $0 |
| 1 Earner | 247 (44.1%) | $44,803 |
| 2 Earners | 90 (16.1%) | $0 |
| 3+ Earners | 143 (25.5%) | $125,017 |
| Total | 560 (100.0%) | $63,864 |
Household Income in Laurel Lake
Household Income Brackets in Laurel Lake
With 254 households falling in the category, the $100,000 to $149,999 income range is the most frequent in Laurel Lake, accounting for 28.0% of all households. In contrast, only 9 households (1.0%) fall into the $200,000+ income bracket, making it the least populous group.
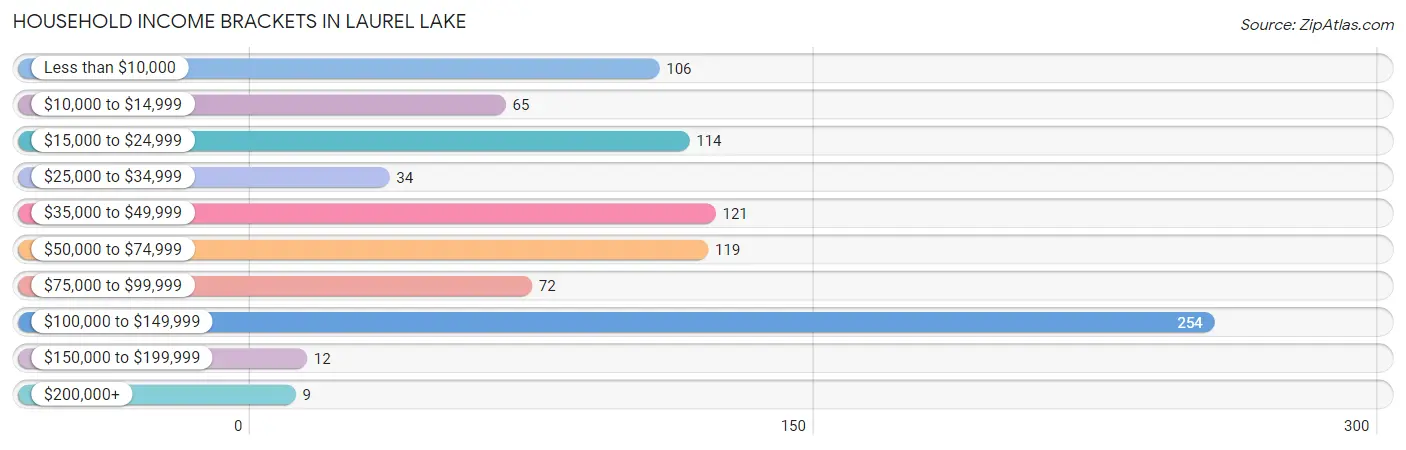
| Income Bracket | # Households | % Households |
| Less than $10,000 | 106 | 11.7% |
| $10,000 to $14,999 | 65 | 7.2% |
| $15,000 to $24,999 | 114 | 12.6% |
| $25,000 to $34,999 | 34 | 3.8% |
| $35,000 to $49,999 | 121 | 13.4% |
| $50,000 to $74,999 | 119 | 13.1% |
| $75,000 to $99,999 | 72 | 7.9% |
| $100,000 to $149,999 | 254 | 28.0% |
| $150,000 to $199,999 | 12 | 1.3% |
| $200,000+ | 9 | 1.0% |
Household Income by Householder Age in Laurel Lake
The median household income in Laurel Lake is $52,321, with the highest median household income of $41,833 found in the 65+ years age bracket for the primary householder. A total of 186 households (20.5%) fall into this category. Meanwhile, the 15 to 24 years age bracket for the primary householder has the lowest median household income of $0, with 14 households (1.5%) in this group.
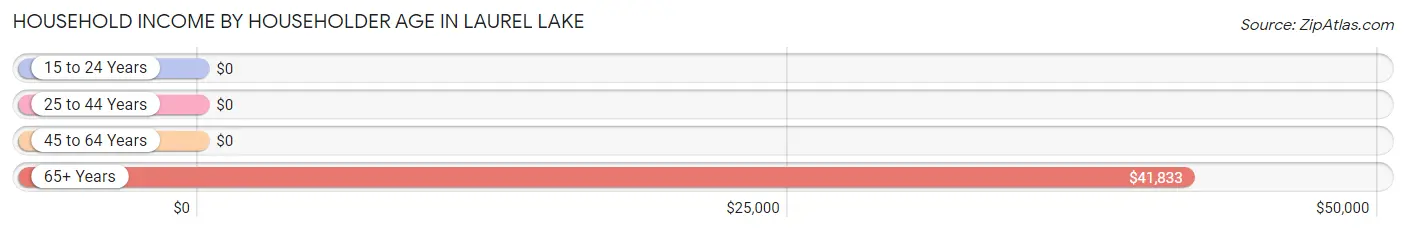
| Income Bracket | # Households | Median Income |
| 15 to 24 Years | 14 (1.5%) | $0 |
| 25 to 44 Years | 300 (33.1%) | $0 |
| 45 to 64 Years | 406 (44.8%) | $0 |
| 65+ Years | 186 (20.5%) | $41,833 |
| Total | 906 (100.0%) | $52,321 |
Poverty in Laurel Lake
Income Below Poverty by Sex and Age in Laurel Lake
With 24.7% poverty level for males and 20.8% for females among the residents of Laurel Lake, 12 to 14 year old males and 12 to 14 year old females are the most vulnerable to poverty, with 28 males (100.0%) and 43 females (64.2%) in their respective age groups living below the poverty level.
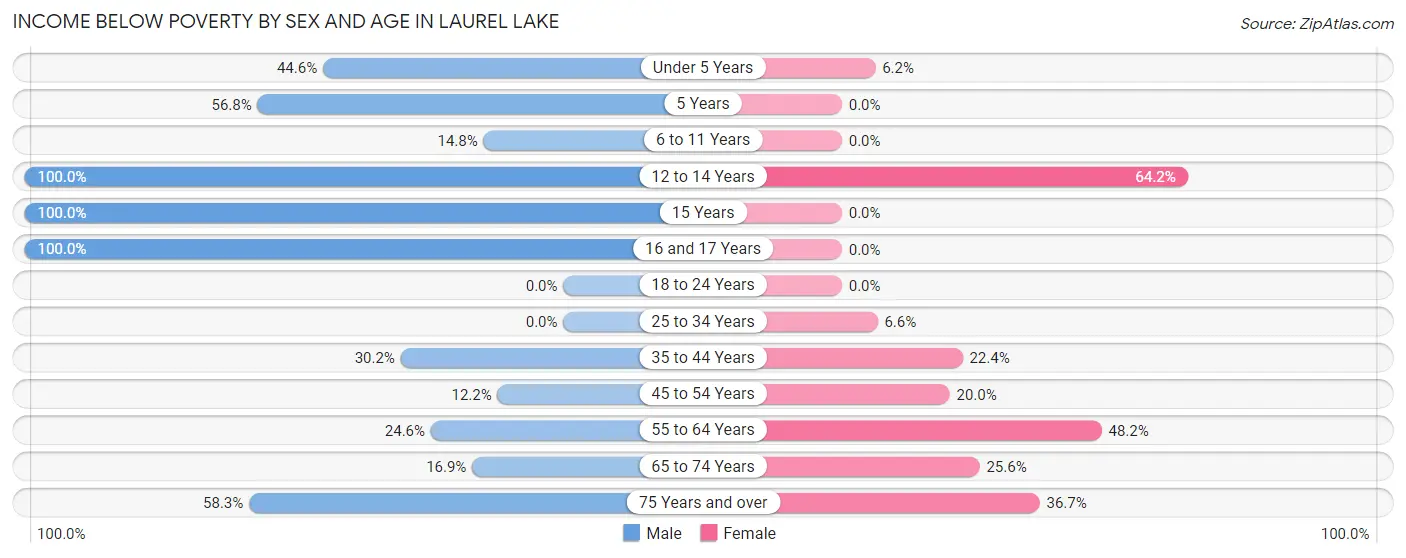
| Age Bracket | Male | Female |
| Under 5 Years | 29 (44.6%) | 8 (6.2%) |
| 5 Years | 21 (56.8%) | 0 (0.0%) |
| 6 to 11 Years | 12 (14.8%) | 0 (0.0%) |
| 12 to 14 Years | 28 (100.0%) | 43 (64.2%) |
| 15 Years | 23 (100.0%) | 0 (0.0%) |
| 16 and 17 Years | 23 (100.0%) | 0 (0.0%) |
| 18 to 24 Years | 0 (0.0%) | 0 (0.0%) |
| 25 to 34 Years | 0 (0.0%) | 9 (6.6%) |
| 35 to 44 Years | 48 (30.2%) | 43 (22.4%) |
| 45 to 54 Years | 22 (12.2%) | 41 (20.0%) |
| 55 to 64 Years | 45 (24.6%) | 54 (48.2%) |
| 65 to 74 Years | 11 (16.9%) | 23 (25.6%) |
| 75 Years and over | 21 (58.3%) | 29 (36.7%) |
| Total | 283 (24.7%) | 250 (20.8%) |
Income Above Poverty by Sex and Age in Laurel Lake
According to the poverty statistics in Laurel Lake, males aged 18 to 24 years and females aged 5 years are the age groups that are most secure financially, with 100.0% of males and 100.0% of females in these age groups living above the poverty line.
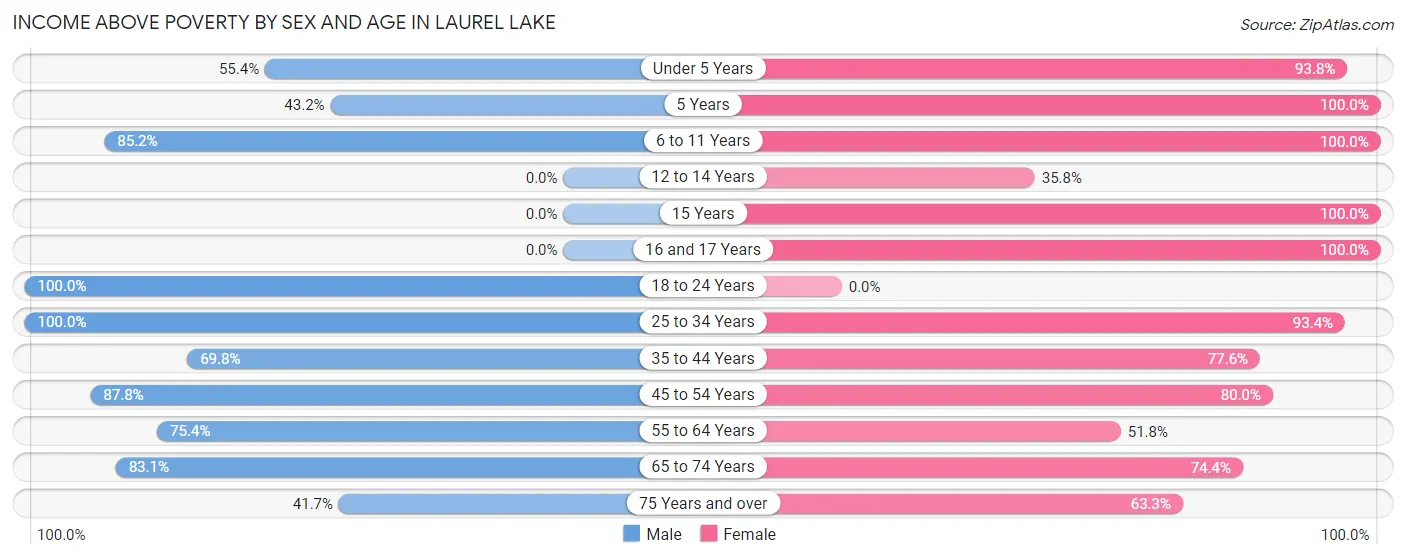
| Age Bracket | Male | Female |
| Under 5 Years | 36 (55.4%) | 121 (93.8%) |
| 5 Years | 16 (43.2%) | 13 (100.0%) |
| 6 to 11 Years | 69 (85.2%) | 144 (100.0%) |
| 12 to 14 Years | 0 (0.0%) | 24 (35.8%) |
| 15 Years | 0 (0.0%) | 20 (100.0%) |
| 16 and 17 Years | 0 (0.0%) | 12 (100.0%) |
| 18 to 24 Years | 115 (100.0%) | 0 (0.0%) |
| 25 to 34 Years | 152 (100.0%) | 127 (93.4%) |
| 35 to 44 Years | 111 (69.8%) | 149 (77.6%) |
| 45 to 54 Years | 158 (87.8%) | 164 (80.0%) |
| 55 to 64 Years | 138 (75.4%) | 58 (51.8%) |
| 65 to 74 Years | 54 (83.1%) | 67 (74.4%) |
| 75 Years and over | 15 (41.7%) | 50 (63.3%) |
| Total | 864 (75.3%) | 949 (79.1%) |
Income Below Poverty Among Married-Couple Families in Laurel Lake
The poverty statistics for married-couple families in Laurel Lake show that 5.7% or 21 of the total 369 families live below the poverty line. Families with 1 or 2 children have the highest poverty rate of 11.9%, comprising of 21 families. On the other hand, families with no children have the lowest poverty rate of 0.0%, which includes 0 families.
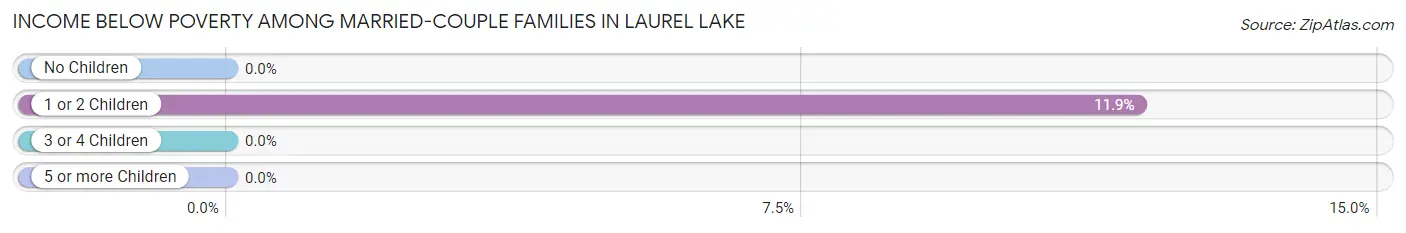
| Children | Above Poverty | Below Poverty |
| No Children | 178 (100.0%) | 0 (0.0%) |
| 1 or 2 Children | 156 (88.1%) | 21 (11.9%) |
| 3 or 4 Children | 7 (100.0%) | 0 (0.0%) |
| 5 or more Children | 7 (100.0%) | 0 (0.0%) |
| Total | 348 (94.3%) | 21 (5.7%) |
Income Below Poverty Among Single-Parent Households in Laurel Lake
According to the poverty data in Laurel Lake, 32.9% or 28 single-father households and 67.0% or 71 single-mother households are living below the poverty line. Among single-father households, those with 1 or 2 children have the highest poverty rate, with 28 households (100.0%) experiencing poverty. Likewise, among single-mother households, those with 1 or 2 children have the highest poverty rate, with 71 households (78.9%) falling below the poverty line.
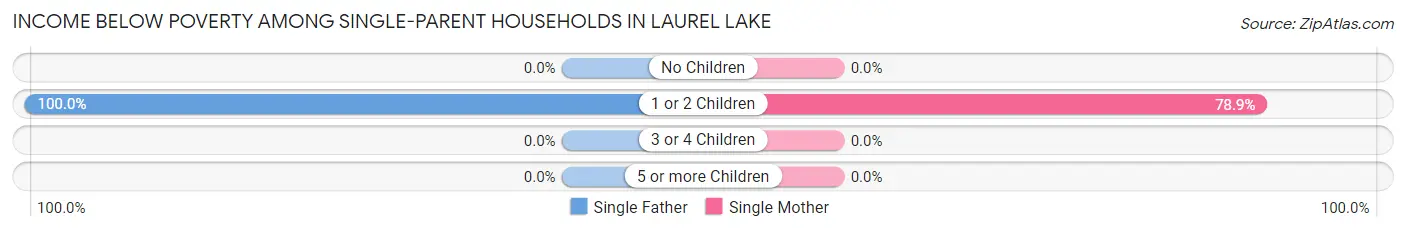
| Children | Single Father | Single Mother |
| No Children | 0 (0.0%) | 0 (0.0%) |
| 1 or 2 Children | 28 (100.0%) | 71 (78.9%) |
| 3 or 4 Children | 0 (0.0%) | 0 (0.0%) |
| 5 or more Children | 0 (0.0%) | 0 (0.0%) |
| Total | 28 (32.9%) | 71 (67.0%) |
Income Below Poverty Among Married-Couple vs Single-Parent Households in Laurel Lake
The poverty data for Laurel Lake shows that 21 of the married-couple family households (5.7%) and 99 of the single-parent households (51.8%) are living below the poverty level. Within the married-couple family households, those with 1 or 2 children have the highest poverty rate, with 21 households (11.9%) falling below the poverty line. Among the single-parent households, those with 1 or 2 children have the highest poverty rate, with 99 household (83.9%) living below poverty.
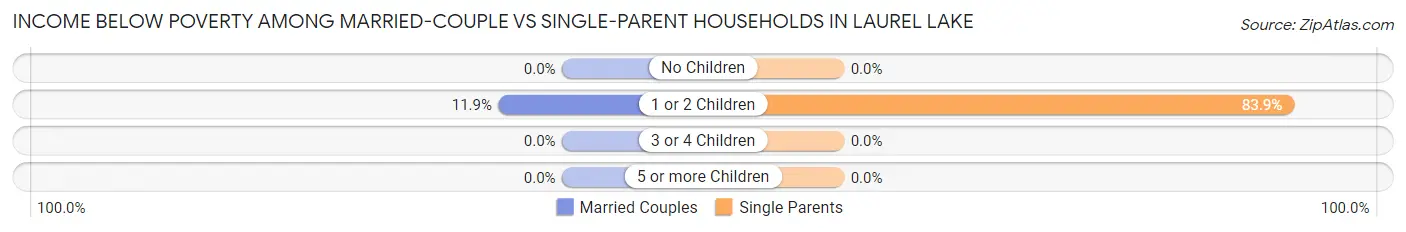
| Children | Married-Couple Families | Single-Parent Households |
| No Children | 0 (0.0%) | 0 (0.0%) |
| 1 or 2 Children | 21 (11.9%) | 99 (83.9%) |
| 3 or 4 Children | 0 (0.0%) | 0 (0.0%) |
| 5 or more Children | 0 (0.0%) | 0 (0.0%) |
| Total | 21 (5.7%) | 99 (51.8%) |
Race in Laurel Lake
The most populous races in Laurel Lake are White / Caucasian (1,993 | 85.0%), Two or more Races (278 | 11.8%), and Hispanic or Latino (198 | 8.4%).
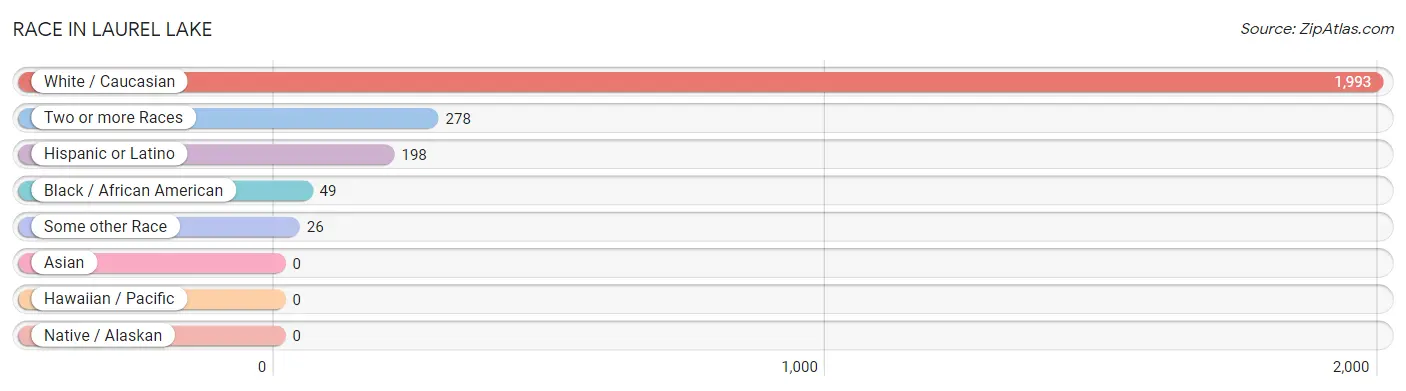
| Race | # Population | % Population |
| Asian | 0 | 0.0% |
| Black / African American | 49 | 2.1% |
| Hawaiian / Pacific | 0 | 0.0% |
| Hispanic or Latino | 198 | 8.4% |
| Native / Alaskan | 0 | 0.0% |
| White / Caucasian | 1,993 | 85.0% |
| Two or more Races | 278 | 11.8% |
| Some other Race | 26 | 1.1% |
| Total | 2,346 | 100.0% |
Ancestry in Laurel Lake
The most populous ancestries reported in Laurel Lake are Irish (857 | 36.5%), German (405 | 17.3%), English (198 | 8.4%), Puerto Rican (179 | 7.6%), and Welsh (168 | 7.2%), together accounting for 77.0% of all Laurel Lake residents.
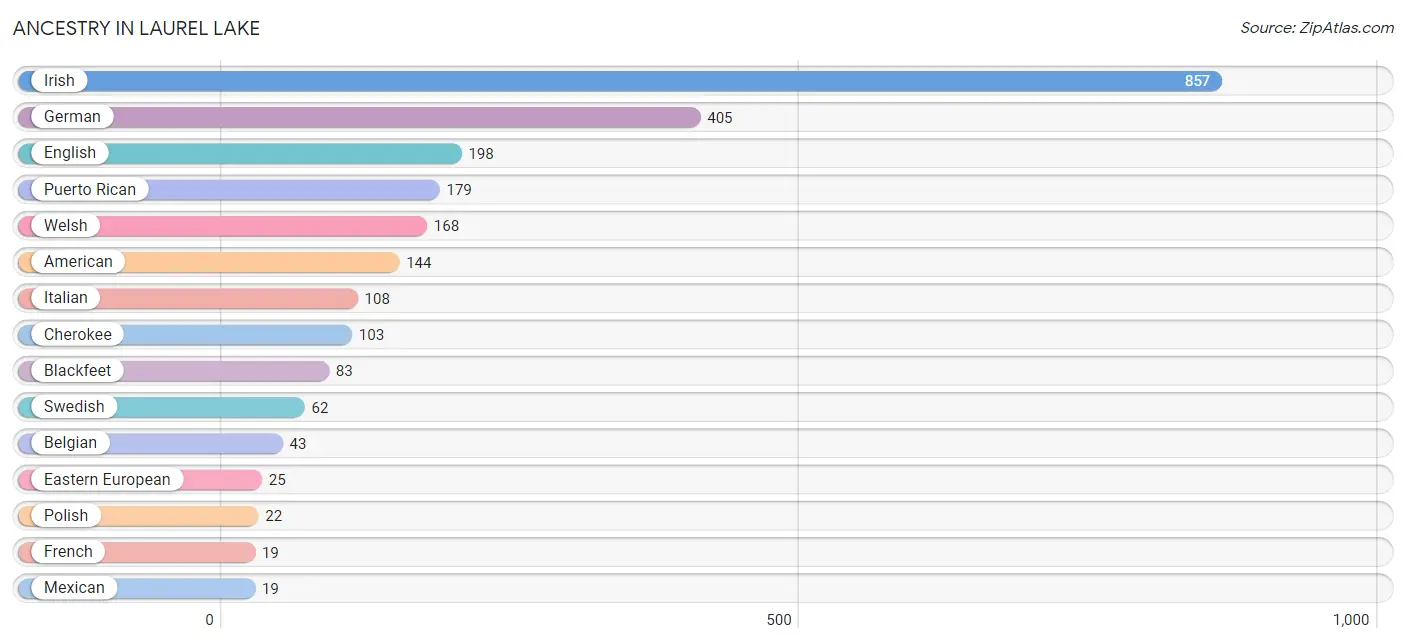
| Ancestry | # Population | % Population |
| American | 144 | 6.1% |
| Belgian | 43 | 1.8% |
| Blackfeet | 83 | 3.5% |
| British | 12 | 0.5% |
| Cherokee | 103 | 4.4% |
| Dutch | 15 | 0.6% |
| Eastern European | 25 | 1.1% |
| English | 198 | 8.4% |
| European | 11 | 0.5% |
| French | 19 | 0.8% |
| German | 405 | 17.3% |
| Hungarian | 18 | 0.8% |
| Irish | 857 | 36.5% |
| Italian | 108 | 4.6% |
| Mexican | 19 | 0.8% |
| Pennsylvania German | 16 | 0.7% |
| Polish | 22 | 0.9% |
| Puerto Rican | 179 | 7.6% |
| Russian | 19 | 0.8% |
| Scotch-Irish | 13 | 0.5% |
| Swedish | 62 | 2.6% |
| Welsh | 168 | 7.2% | View All 22 Rows |
Immigrants in Laurel Lake
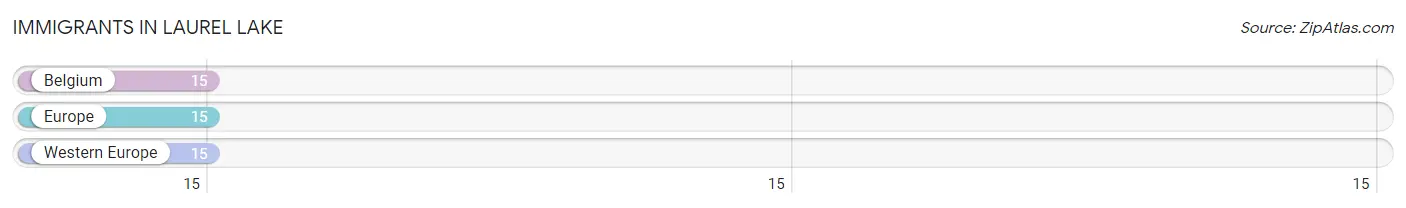
The most numerous immigrant groups reported in Laurel Lake came from Belgium (15 | 0.6%), Europe (15 | 0.6%), and Western Europe (15 | 0.6%), together accounting for 1.9% of all Laurel Lake residents.
| Immigration Origin | # Population | % Population |
| Belgium | 15 | 0.6% |
| Europe | 15 | 0.6% |
| Western Europe | 15 | 0.6% | View All 3 Rows |
Sex and Age in Laurel Lake
Sex and Age in Laurel Lake
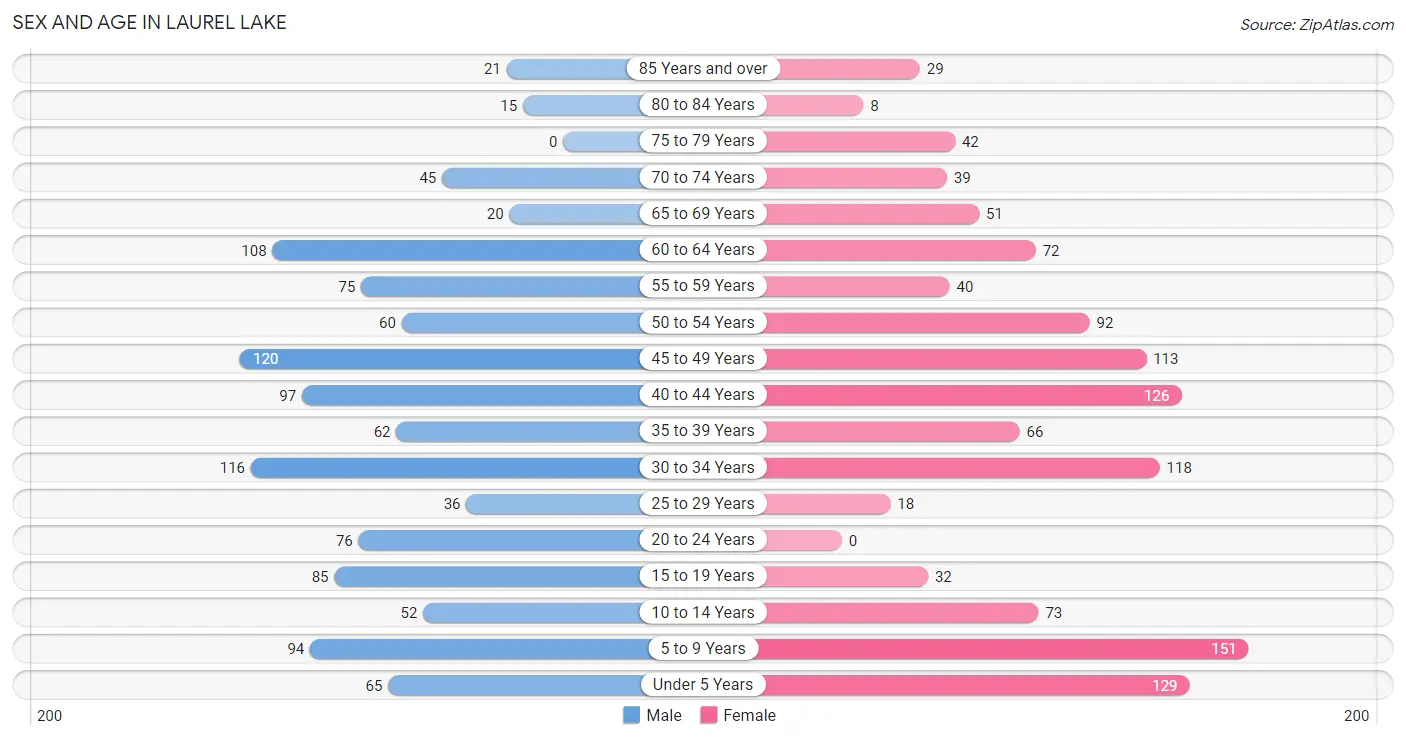
The most populous age groups in Laurel Lake are 45 to 49 Years (120 | 10.5%) for men and 5 to 9 Years (151 | 12.6%) for women.
| Age Bracket | Male | Female |
| Under 5 Years | 65 (5.7%) | 129 (10.8%) |
| 5 to 9 Years | 94 (8.2%) | 151 (12.6%) |
| 10 to 14 Years | 52 (4.5%) | 73 (6.1%) |
| 15 to 19 Years | 85 (7.4%) | 32 (2.7%) |
| 20 to 24 Years | 76 (6.6%) | 0 (0.0%) |
| 25 to 29 Years | 36 (3.1%) | 18 (1.5%) |
| 30 to 34 Years | 116 (10.1%) | 118 (9.8%) |
| 35 to 39 Years | 62 (5.4%) | 66 (5.5%) |
| 40 to 44 Years | 97 (8.5%) | 126 (10.5%) |
| 45 to 49 Years | 120 (10.5%) | 113 (9.4%) |
| 50 to 54 Years | 60 (5.2%) | 92 (7.7%) |
| 55 to 59 Years | 75 (6.5%) | 40 (3.3%) |
| 60 to 64 Years | 108 (9.4%) | 72 (6.0%) |
| 65 to 69 Years | 20 (1.7%) | 51 (4.3%) |
| 70 to 74 Years | 45 (3.9%) | 39 (3.3%) |
| 75 to 79 Years | 0 (0.0%) | 42 (3.5%) |
| 80 to 84 Years | 15 (1.3%) | 8 (0.7%) |
| 85 Years and over | 21 (1.8%) | 29 (2.4%) |
| Total | 1,147 (100.0%) | 1,199 (100.0%) |
Families and Households in Laurel Lake
Median Family Size in Laurel Lake
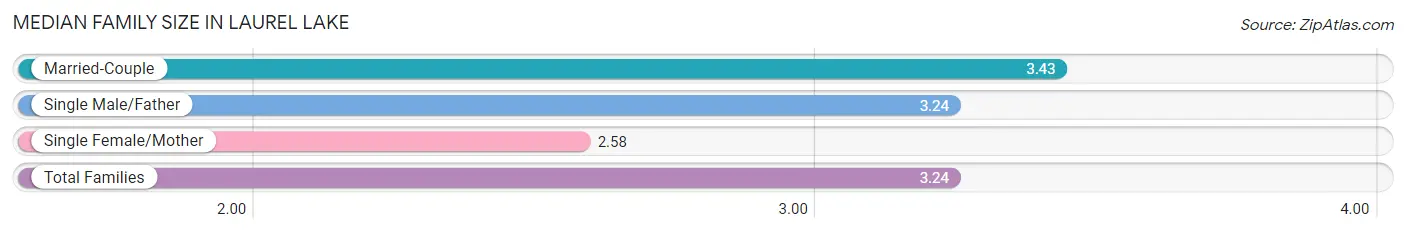
The median family size in Laurel Lake is 3.24 persons per family, with married-couple families (369 | 65.9%) accounting for the largest median family size of 3.43 persons per family. On the other hand, single female/mother families (106 | 18.9%) represent the smallest median family size with 2.58 persons per family.
| Family Type | # Families | Family Size |
| Married-Couple | 369 (65.9%) | 3.43 |
| Single Male/Father | 85 (15.2%) | 3.24 |
| Single Female/Mother | 106 (18.9%) | 2.58 |
| Total Families | 560 (100.0%) | 3.24 |
Median Household Size in Laurel Lake
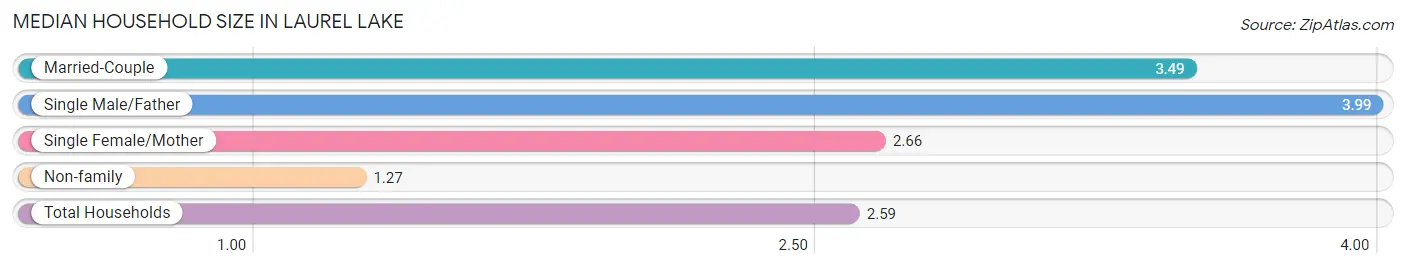
The median household size in Laurel Lake is 2.59 persons per household, with single male/father households (85 | 9.4%) accounting for the largest median household size of 3.99 persons per household. non-family households (346 | 38.2%) represent the smallest median household size with 1.27 persons per household.
| Household Type | # Households | Household Size |
| Married-Couple | 369 (40.7%) | 3.49 |
| Single Male/Father | 85 (9.4%) | 3.99 |
| Single Female/Mother | 106 (11.7%) | 2.66 |
| Non-family | 346 (38.2%) | 1.27 |
| Total Households | 906 (100.0%) | 2.59 |
Household Size by Marriage Status in Laurel Lake
Out of a total of 906 households in Laurel Lake, 560 (61.8%) are family households, while 346 (38.2%) are nonfamily households. The most numerous type of family households are 4-person households, comprising 202, and the most common type of nonfamily households are 1-person households, comprising 235.
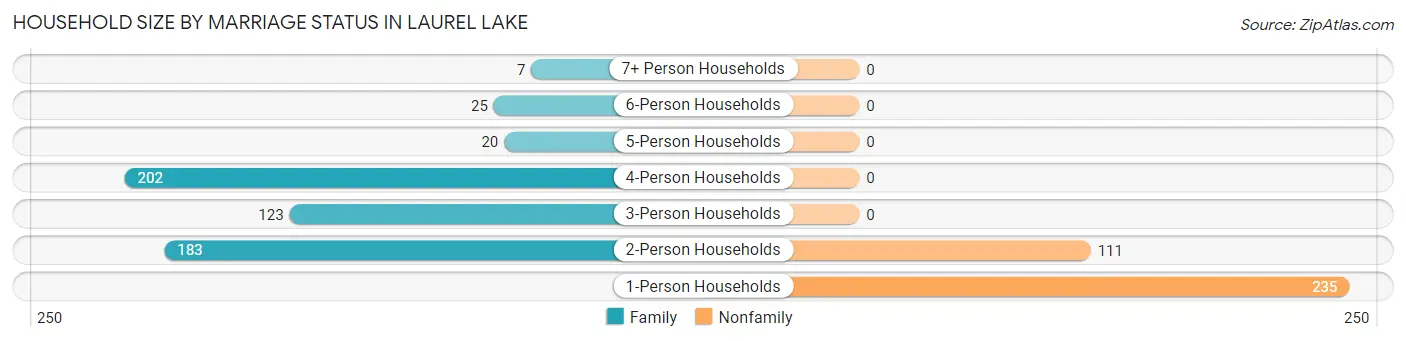
| Household Size | Family Households | Nonfamily Households |
| 1-Person Households | - | 235 (25.9%) |
| 2-Person Households | 183 (20.2%) | 111 (12.2%) |
| 3-Person Households | 123 (13.6%) | 0 (0.0%) |
| 4-Person Households | 202 (22.3%) | 0 (0.0%) |
| 5-Person Households | 20 (2.2%) | 0 (0.0%) |
| 6-Person Households | 25 (2.8%) | 0 (0.0%) |
| 7+ Person Households | 7 (0.8%) | 0 (0.0%) |
| Total | 560 (61.8%) | 346 (38.2%) |
Female Fertility in Laurel Lake
Fertility by Age in Laurel Lake
| Age Bracket | Women with Births | Births / 1,000 Women |
| 15 to 19 years | 0 (0.0%) | 0.0 |
| 20 to 34 years | 0 (0.0%) | 0.0 |
| 35 to 50 years | 0 (0.0%) | 0.0 |
| Total | 0 (0.0%) | 0.0 |
Fertility by Age by Marriage Status in Laurel Lake
| Age Bracket | Married | Unmarried |
| 15 to 19 years | 0 (0.0%) | 0 (0.0%) |
| 20 to 34 years | 0 (0.0%) | 0 (0.0%) |
| 35 to 50 years | 0 (0.0%) | 0 (0.0%) |
| Total | 0 (0.0%) | 0 (0.0%) |
Fertility by Education in Laurel Lake
| Educational Attainment | Women with Births | Births / 1,000 Women |
| Less than High School | 0 (0.0%) | 0.0 |
| High School Diploma | 0 (0.0%) | 0.0 |
| College or Associate's Degree | 0 (0.0%) | 0.0 |
| Bachelor's Degree | 0 (0.0%) | 0.0 |
| Graduate Degree | 0 (0.0%) | 0.0 |
| Total | 0 (0.0%) | 0.0 |
Fertility by Education by Marriage Status in Laurel Lake
| Educational Attainment | Married | Unmarried |
| Less than High School | 0 (0.0%) | 0 (0.0%) |
| High School Diploma | 0 (0.0%) | 0 (0.0%) |
| College or Associate's Degree | 0 (0.0%) | 0 (0.0%) |
| Bachelor's Degree | 0 (0.0%) | 0 (0.0%) |
| Graduate Degree | 0 (0.0%) | 0 (0.0%) |
| Total | 0 (0.0%) | 0 (0.0%) |
Employment Characteristics in Laurel Lake
Employment by Class of Employer in Laurel Lake
Among the 996 employed individuals in Laurel Lake, private company employees (639 | 64.2%), local government employees (165 | 16.6%), and state government employees (99 | 9.9%) make up the most common classes of employment.
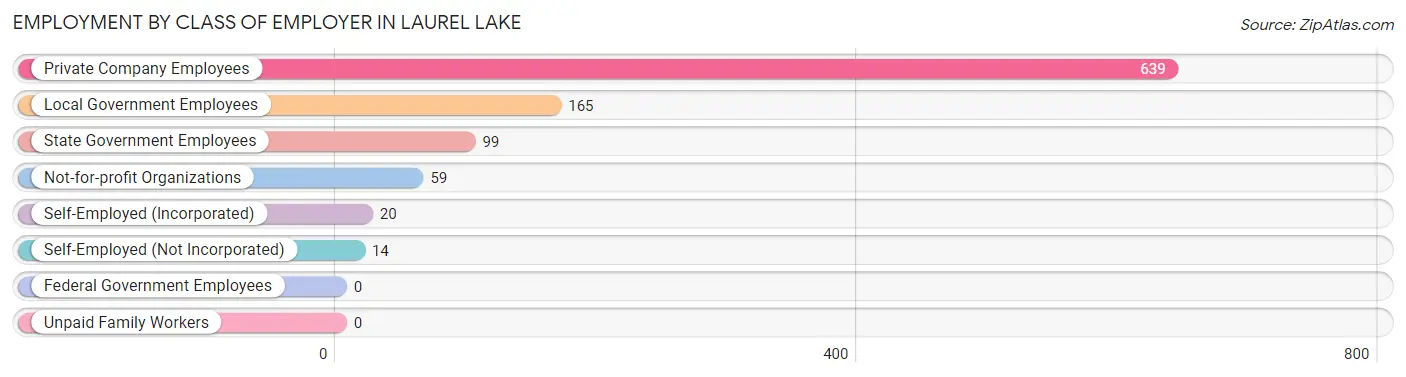
| Employer Class | # Employees | % Employees |
| Private Company Employees | 639 | 64.2% |
| Self-Employed (Incorporated) | 20 | 2.0% |
| Self-Employed (Not Incorporated) | 14 | 1.4% |
| Not-for-profit Organizations | 59 | 5.9% |
| Local Government Employees | 165 | 16.6% |
| State Government Employees | 99 | 9.9% |
| Federal Government Employees | 0 | 0.0% |
| Unpaid Family Workers | 0 | 0.0% |
| Total | 996 | 100.0% |
Employment Status by Age in Laurel Lake
According to the labor force statistics for Laurel Lake, out of the total population over 16 years of age (1,739), 61.5% or 1,069 individuals are in the labor force, with 6.8% or 73 of them unemployed. The age group with the highest labor force participation rate is 20 to 24 years, with 92.1% or 70 individuals in the labor force. Within the labor force, the 35 to 44 years age range has the highest percentage of unemployed individuals, with 17.3% or 52 of them being unemployed.
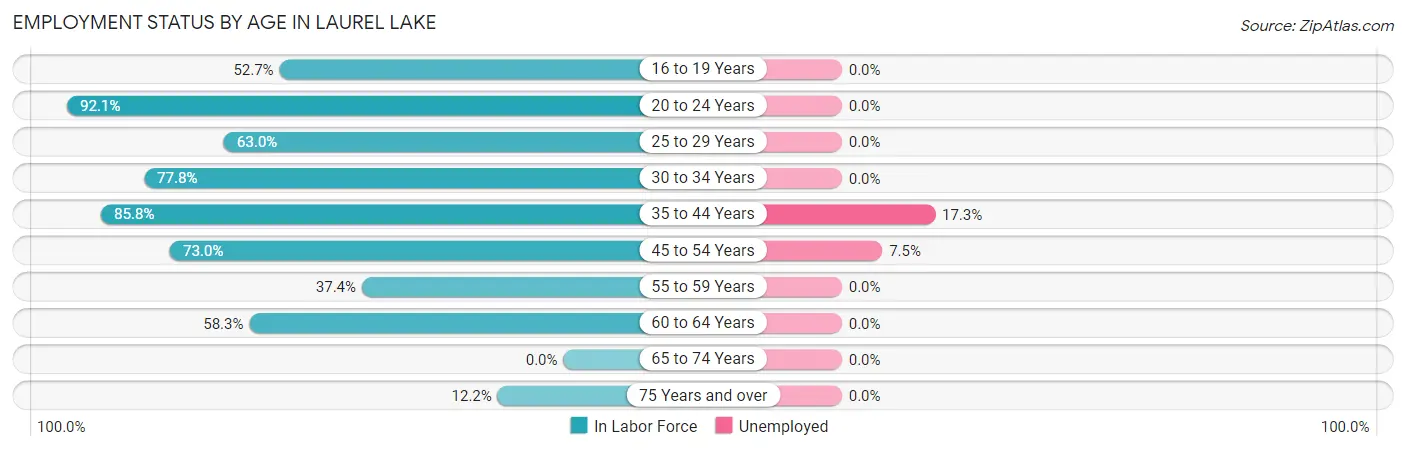
| Age Bracket | In Labor Force | Unemployed |
| 16 to 19 Years | 39 (52.7%) | 0 (0.0%) |
| 20 to 24 Years | 70 (92.1%) | 0 (0.0%) |
| 25 to 29 Years | 34 (63.0%) | 0 (0.0%) |
| 30 to 34 Years | 182 (77.8%) | 0 (0.0%) |
| 35 to 44 Years | 301 (85.8%) | 52 (17.3%) |
| 45 to 54 Years | 281 (73.0%) | 21 (7.5%) |
| 55 to 59 Years | 43 (37.4%) | 0 (0.0%) |
| 60 to 64 Years | 105 (58.3%) | 0 (0.0%) |
| 65 to 74 Years | 0 (0.0%) | 0 (0.0%) |
| 75 Years and over | 14 (12.2%) | 0 (0.0%) |
| Total | 1,069 (61.5%) | 73 (6.8%) |
Employment Status by Educational Attainment in Laurel Lake
According to labor force statistics for Laurel Lake, 71.7% of individuals (946) out of the total population between 25 and 64 years of age (1,319) are in the labor force, with 7.7% or 73 of them being unemployed. The group with the highest labor force participation rate are those with the educational attainment of college / associate degree, with 82.6% or 428 individuals in the labor force. Within the labor force, individuals with less than high school education have the highest percentage of unemployment, with 40.4% or 21 of them being unemployed.
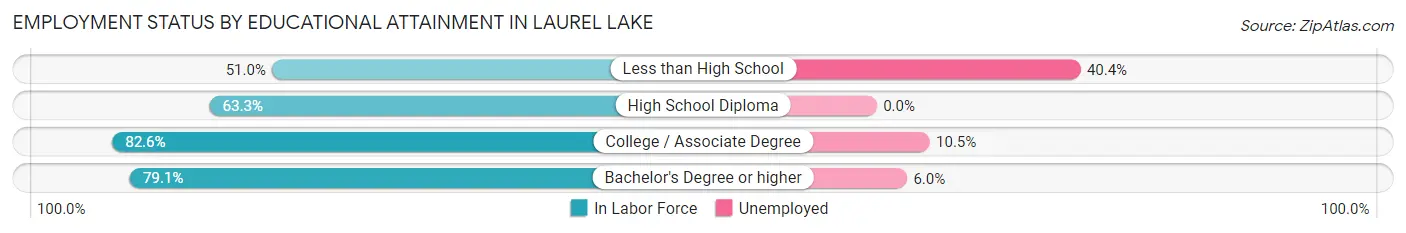
| Educational Attainment | In Labor Force | Unemployed |
| Less than High School | 52 (51.0%) | 41 (40.4%) |
| High School Diploma | 349 (63.3%) | 0 (0.0%) |
| College / Associate Degree | 428 (82.6%) | 54 (10.5%) |
| Bachelor's Degree or higher | 117 (79.1%) | 9 (6.0%) |
| Total | 946 (71.7%) | 102 (7.7%) |
Employment Occupations by Sex in Laurel Lake
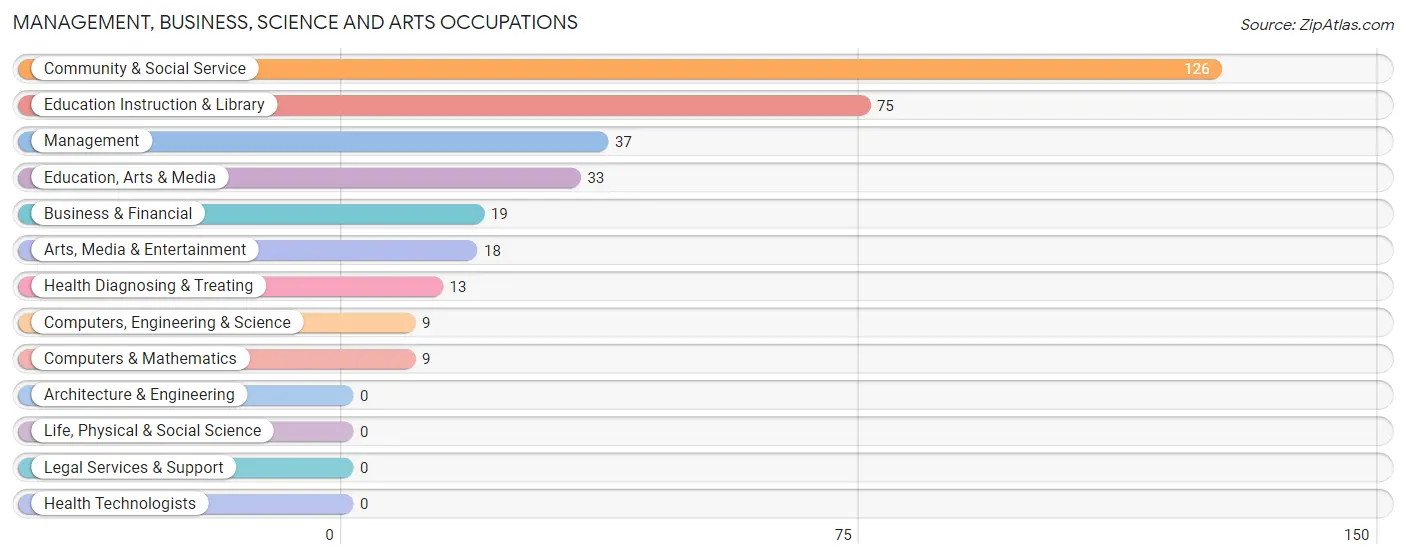
Management, Business, Science and Arts Occupations
The most common Management, Business, Science and Arts occupations in Laurel Lake are Community & Social Service (126 | 12.7%), Education Instruction & Library (75 | 7.5%), Management (37 | 3.7%), Education, Arts & Media (33 | 3.3%), and Business & Financial (19 | 1.9%).
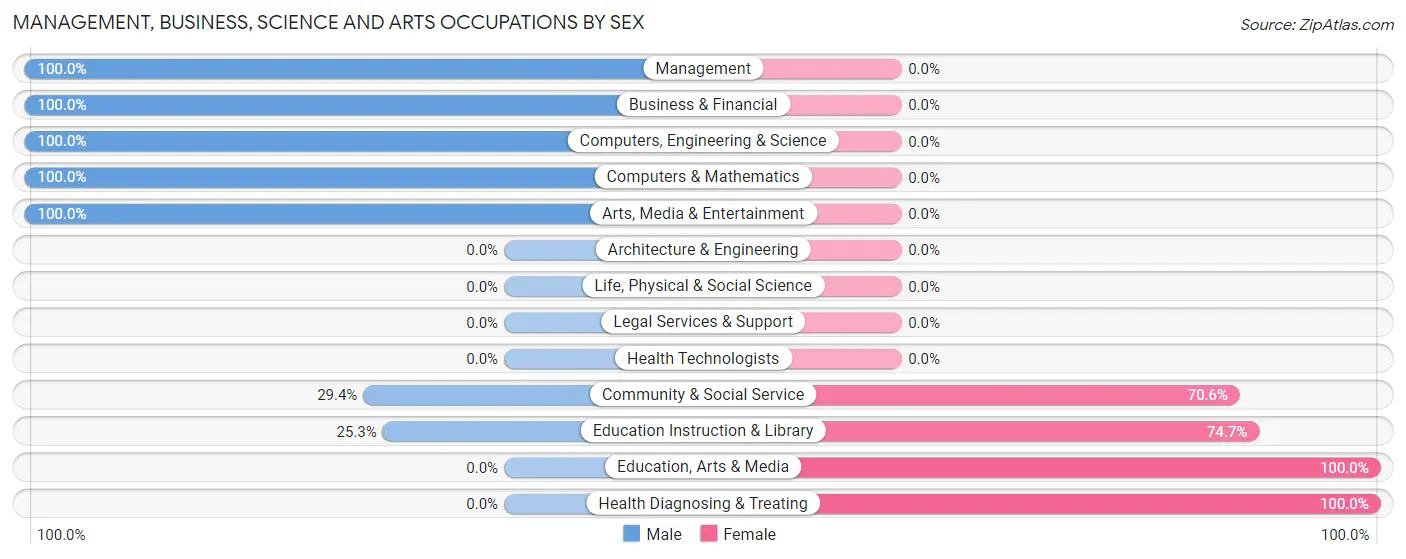
Management, Business, Science and Arts Occupations by Sex
Within the Management, Business, Science and Arts occupations in Laurel Lake, the most male-oriented occupations are Management (100.0%), Business & Financial (100.0%), and Computers, Engineering & Science (100.0%), while the most female-oriented occupations are Education, Arts & Media (100.0%), Health Diagnosing & Treating (100.0%), and Education Instruction & Library (74.7%).
| Occupation | Male | Female |
| Management | 37 (100.0%) | 0 (0.0%) |
| Business & Financial | 19 (100.0%) | 0 (0.0%) |
| Computers, Engineering & Science | 9 (100.0%) | 0 (0.0%) |
| Computers & Mathematics | 9 (100.0%) | 0 (0.0%) |
| Architecture & Engineering | 0 (0.0%) | 0 (0.0%) |
| Life, Physical & Social Science | 0 (0.0%) | 0 (0.0%) |
| Community & Social Service | 37 (29.4%) | 89 (70.6%) |
| Education, Arts & Media | 0 (0.0%) | 33 (100.0%) |
| Legal Services & Support | 0 (0.0%) | 0 (0.0%) |
| Education Instruction & Library | 19 (25.3%) | 56 (74.7%) |
| Arts, Media & Entertainment | 18 (100.0%) | 0 (0.0%) |
| Health Diagnosing & Treating | 0 (0.0%) | 13 (100.0%) |
| Health Technologists | 0 (0.0%) | 0 (0.0%) |
| Total (Category) | 102 (50.0%) | 102 (50.0%) |
| Total (Overall) | 601 (60.3%) | 395 (39.7%) |
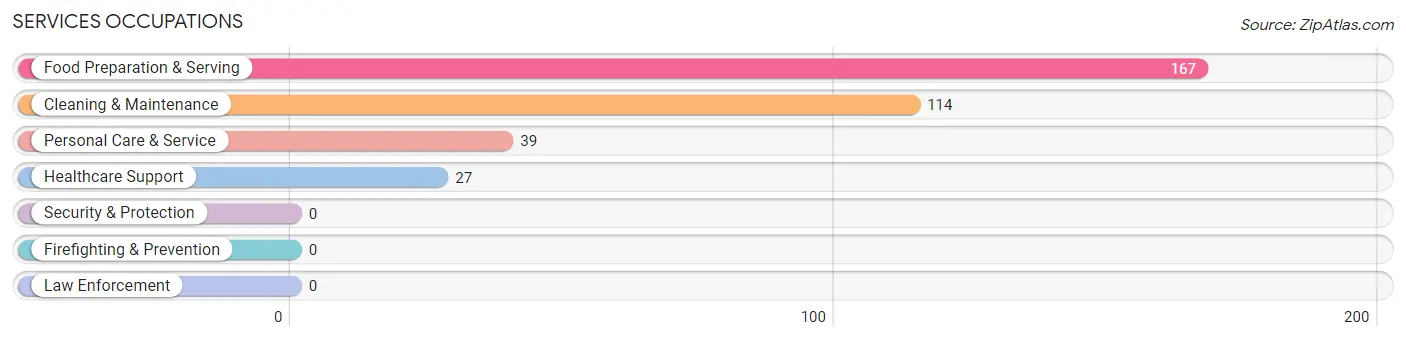
Services Occupations
The most common Services occupations in Laurel Lake are Food Preparation & Serving (167 | 16.8%), Cleaning & Maintenance (114 | 11.5%), Personal Care & Service (39 | 3.9%), and Healthcare Support (27 | 2.7%).
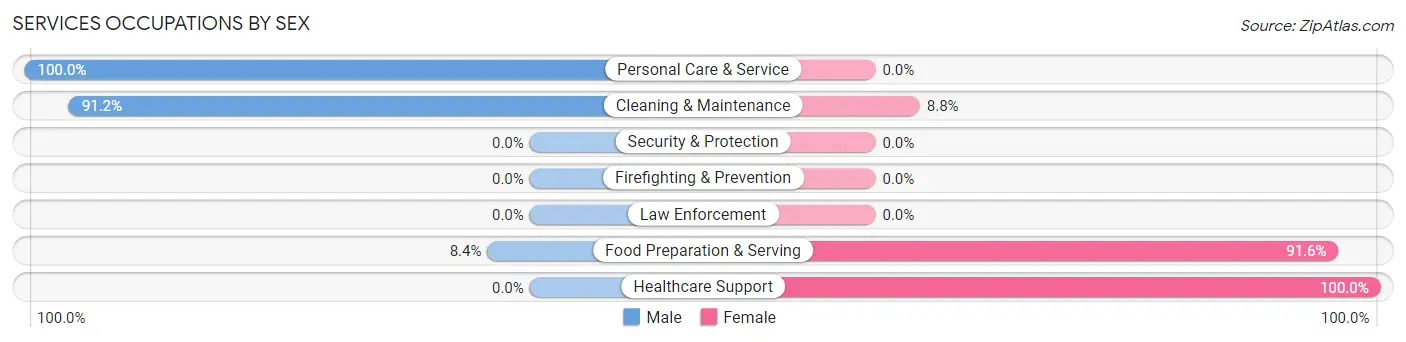
Services Occupations by Sex
Within the Services occupations in Laurel Lake, the most male-oriented occupations are Personal Care & Service (100.0%), Cleaning & Maintenance (91.2%), and Food Preparation & Serving (8.4%), while the most female-oriented occupations are Healthcare Support (100.0%), Food Preparation & Serving (91.6%), and Cleaning & Maintenance (8.8%).
| Occupation | Male | Female |
| Healthcare Support | 0 (0.0%) | 27 (100.0%) |
| Security & Protection | 0 (0.0%) | 0 (0.0%) |
| Firefighting & Prevention | 0 (0.0%) | 0 (0.0%) |
| Law Enforcement | 0 (0.0%) | 0 (0.0%) |
| Food Preparation & Serving | 14 (8.4%) | 153 (91.6%) |
| Cleaning & Maintenance | 104 (91.2%) | 10 (8.8%) |
| Personal Care & Service | 39 (100.0%) | 0 (0.0%) |
| Total (Category) | 157 (45.2%) | 190 (54.8%) |
| Total (Overall) | 601 (60.3%) | 395 (39.7%) |
Sales and Office Occupations
The most common Sales and Office occupations in Laurel Lake are Office & Administration (76 | 7.6%), and Sales & Related (34 | 3.4%).
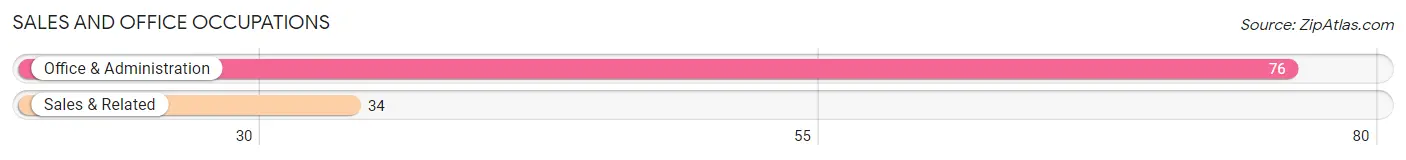
Sales and Office Occupations by Sex
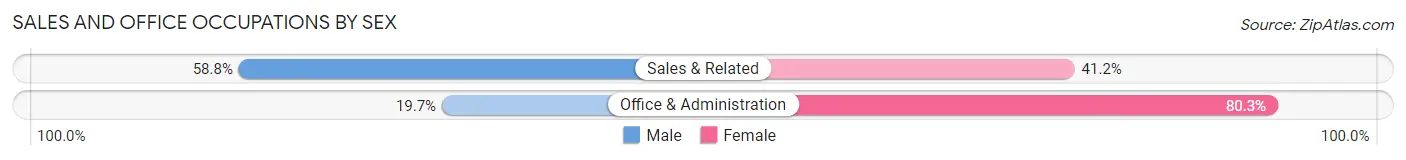
| Occupation | Male | Female |
| Sales & Related | 20 (58.8%) | 14 (41.2%) |
| Office & Administration | 15 (19.7%) | 61 (80.3%) |
| Total (Category) | 35 (31.8%) | 75 (68.2%) |
| Total (Overall) | 601 (60.3%) | 395 (39.7%) |
Natural Resources, Construction and Maintenance Occupations
The most common Natural Resources, Construction and Maintenance occupations in Laurel Lake are Installation, Maintenance & Repair (126 | 12.7%), and Construction & Extraction (100 | 10.0%).
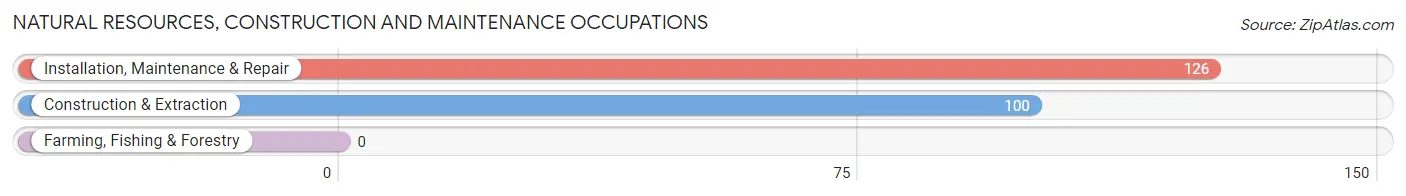
Natural Resources, Construction and Maintenance Occupations by Sex
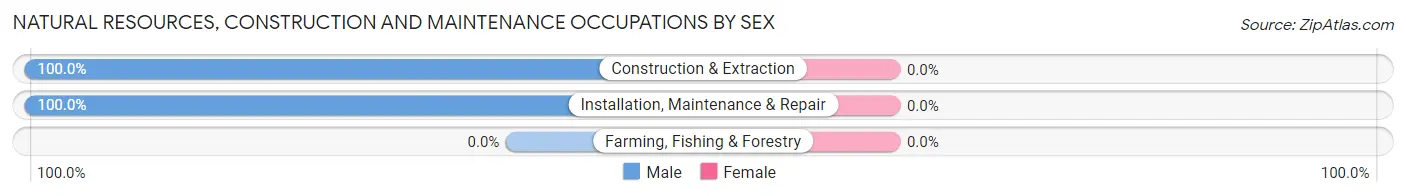
| Occupation | Male | Female |
| Farming, Fishing & Forestry | 0 (0.0%) | 0 (0.0%) |
| Construction & Extraction | 100 (100.0%) | 0 (0.0%) |
| Installation, Maintenance & Repair | 126 (100.0%) | 0 (0.0%) |
| Total (Category) | 226 (100.0%) | 0 (0.0%) |
| Total (Overall) | 601 (60.3%) | 395 (39.7%) |
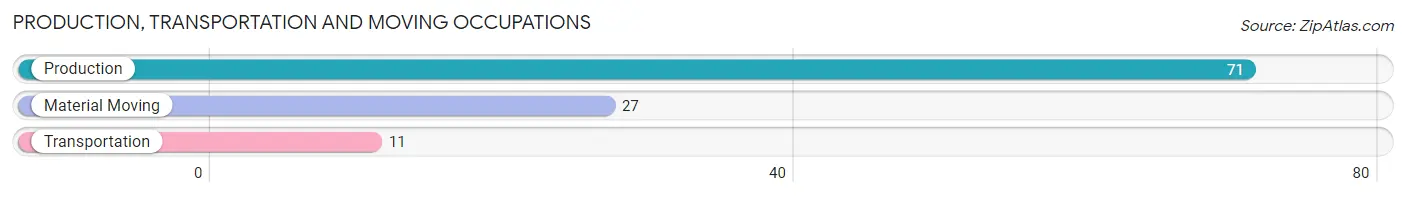
Production, Transportation and Moving Occupations
The most common Production, Transportation and Moving occupations in Laurel Lake are Production (71 | 7.1%), Material Moving (27 | 2.7%), and Transportation (11 | 1.1%).
Production, Transportation and Moving Occupations by Sex
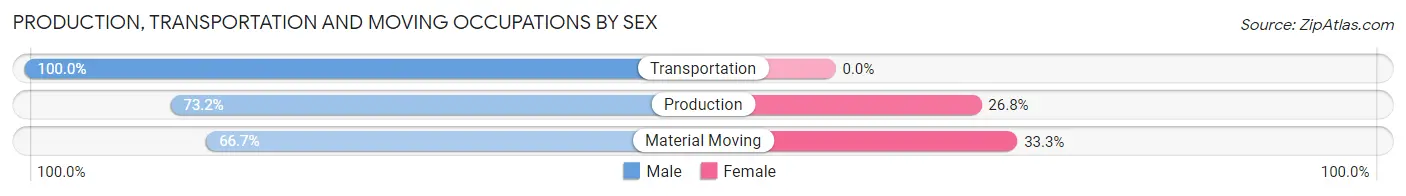
| Occupation | Male | Female |
| Production | 52 (73.2%) | 19 (26.8%) |
| Transportation | 11 (100.0%) | 0 (0.0%) |
| Material Moving | 18 (66.7%) | 9 (33.3%) |
| Total (Category) | 81 (74.3%) | 28 (25.7%) |
| Total (Overall) | 601 (60.3%) | 395 (39.7%) |
Employment Industries by Sex in Laurel Lake
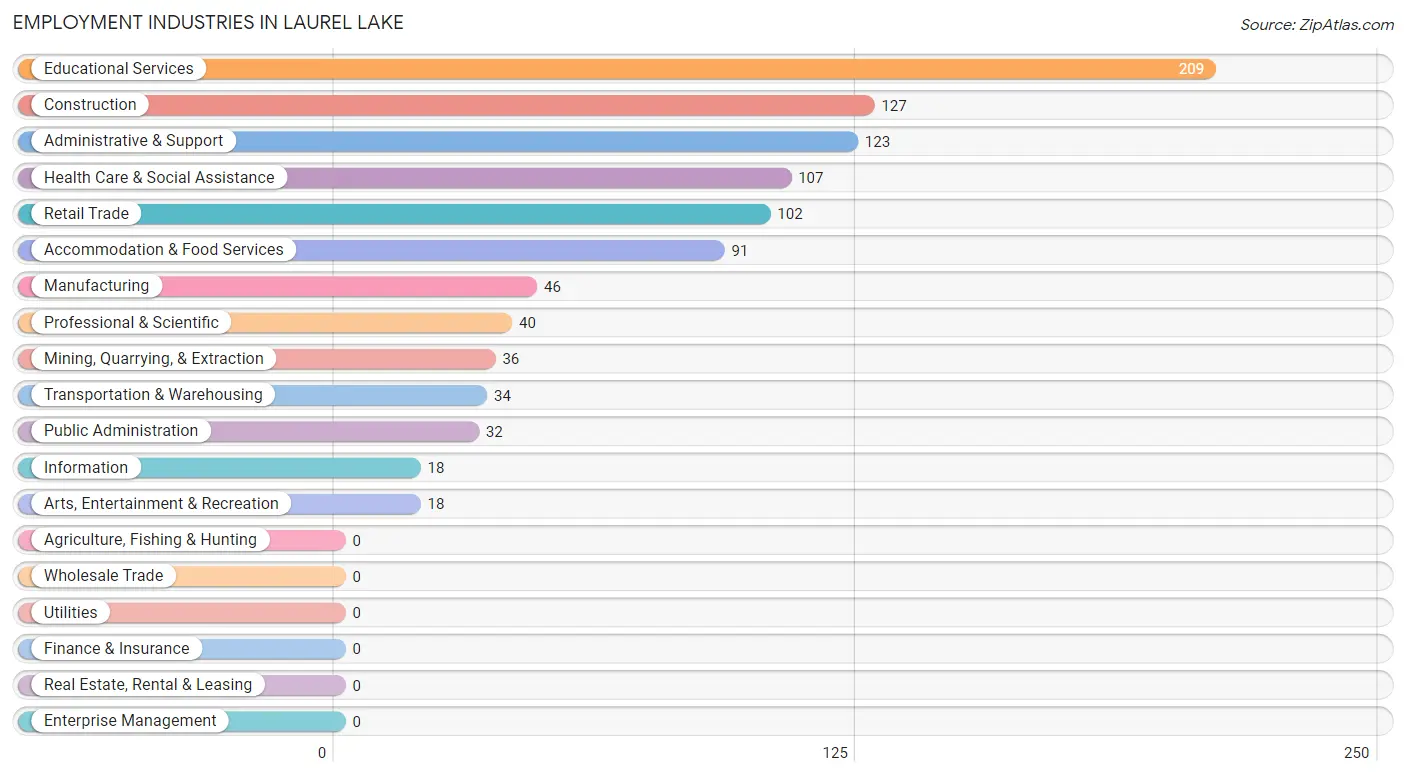
Employment Industries in Laurel Lake
The major employment industries in Laurel Lake include Educational Services (209 | 21.0%), Construction (127 | 12.8%), Administrative & Support (123 | 12.3%), Health Care & Social Assistance (107 | 10.7%), and Retail Trade (102 | 10.2%).
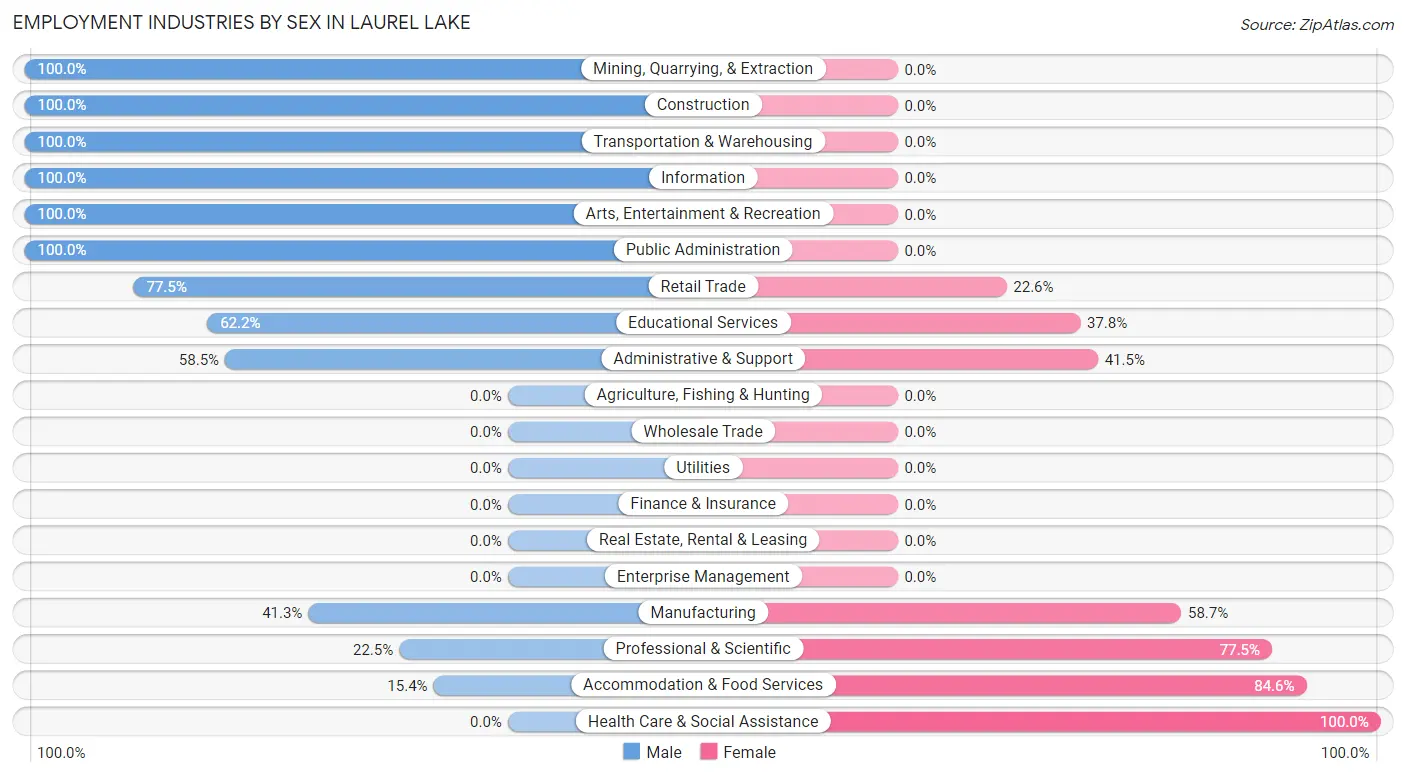
Employment Industries by Sex in Laurel Lake
The Laurel Lake industries that see more men than women are Mining, Quarrying, & Extraction (100.0%), Construction (100.0%), and Transportation & Warehousing (100.0%), whereas the industries that tend to have a higher number of women are Health Care & Social Assistance (100.0%), Accommodation & Food Services (84.6%), and Professional & Scientific (77.5%).
| Industry | Male | Female |
| Agriculture, Fishing & Hunting | 0 (0.0%) | 0 (0.0%) |
| Mining, Quarrying, & Extraction | 36 (100.0%) | 0 (0.0%) |
| Construction | 127 (100.0%) | 0 (0.0%) |
| Manufacturing | 19 (41.3%) | 27 (58.7%) |
| Wholesale Trade | 0 (0.0%) | 0 (0.0%) |
| Retail Trade | 79 (77.4%) | 23 (22.6%) |
| Transportation & Warehousing | 34 (100.0%) | 0 (0.0%) |
| Utilities | 0 (0.0%) | 0 (0.0%) |
| Information | 18 (100.0%) | 0 (0.0%) |
| Finance & Insurance | 0 (0.0%) | 0 (0.0%) |
| Real Estate, Rental & Leasing | 0 (0.0%) | 0 (0.0%) |
| Professional & Scientific | 9 (22.5%) | 31 (77.5%) |
| Enterprise Management | 0 (0.0%) | 0 (0.0%) |
| Administrative & Support | 72 (58.5%) | 51 (41.5%) |
| Educational Services | 130 (62.2%) | 79 (37.8%) |
| Health Care & Social Assistance | 0 (0.0%) | 107 (100.0%) |
| Arts, Entertainment & Recreation | 18 (100.0%) | 0 (0.0%) |
| Accommodation & Food Services | 14 (15.4%) | 77 (84.6%) |
| Public Administration | 32 (100.0%) | 0 (0.0%) |
| Total | 601 (60.3%) | 395 (39.7%) |
Education in Laurel Lake
School Enrollment in Laurel Lake
The most common levels of schooling among the 610 students in Laurel Lake are elementary school (180 | 29.5%), middle school (125 | 20.5%), and college / undergraduate (110 | 18.0%).
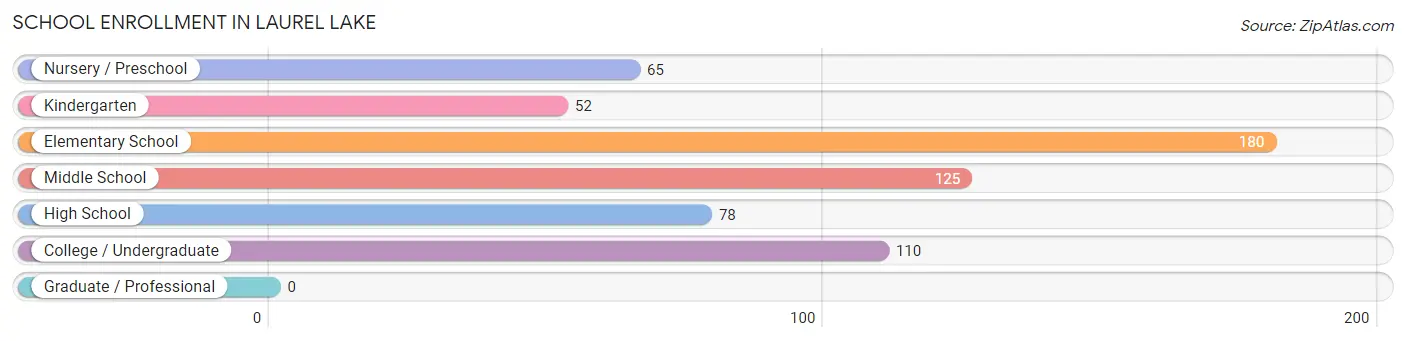
| School Level | # Students | % Students |
| Nursery / Preschool | 65 | 10.7% |
| Kindergarten | 52 | 8.5% |
| Elementary School | 180 | 29.5% |
| Middle School | 125 | 20.5% |
| High School | 78 | 12.8% |
| College / Undergraduate | 110 | 18.0% |
| Graduate / Professional | 0 | 0.0% |
| Total | 610 | 100.0% |
School Enrollment by Age by Funding Source in Laurel Lake
Out of a total of 610 students who are enrolled in schools in Laurel Lake, 145 (23.8%) attend a private institution, while the remaining 465 (76.2%) are enrolled in public schools. The age group of 3 to 4 year olds has the highest likelihood of being enrolled in private schools, with 36 (69.2% in the age bracket) enrolled. Conversely, the age group of 18 to 19 year olds has the lowest likelihood of being enrolled in a private school, with 39 (100.0% in the age bracket) attending a public institution.
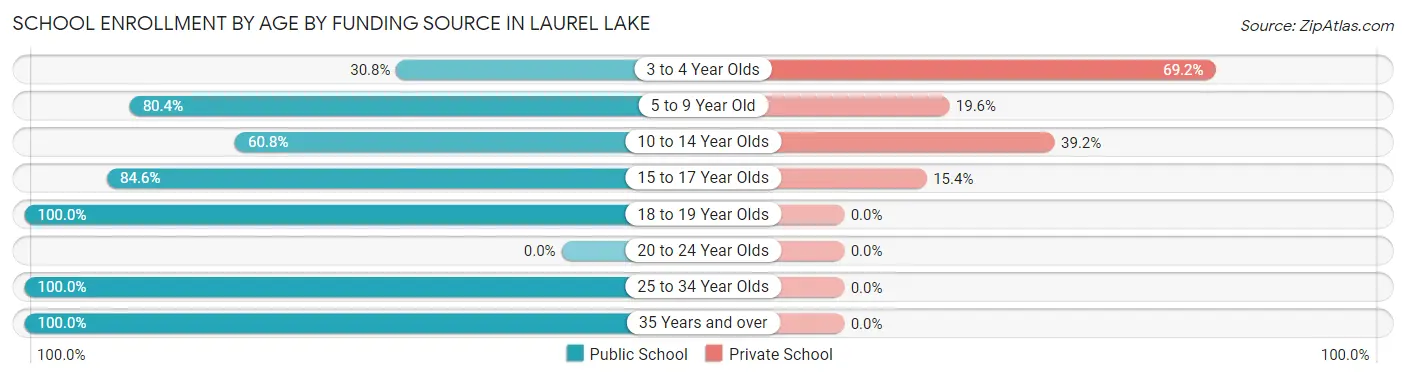
| Age Bracket | Public School | Private School |
| 3 to 4 Year Olds | 16 (30.8%) | 36 (69.2%) |
| 5 to 9 Year Old | 197 (80.4%) | 48 (19.6%) |
| 10 to 14 Year Olds | 76 (60.8%) | 49 (39.2%) |
| 15 to 17 Year Olds | 66 (84.6%) | 12 (15.4%) |
| 18 to 19 Year Olds | 39 (100.0%) | 0 (0.0%) |
| 20 to 24 Year Olds | 0 (0.0%) | 0 (0.0%) |
| 25 to 34 Year Olds | 30 (100.0%) | 0 (0.0%) |
| 35 Years and over | 41 (100.0%) | 0 (0.0%) |
| Total | 465 (76.2%) | 145 (23.8%) |
Educational Attainment by Field of Study in Laurel Lake
Psychology (82 | 47.1%), arts & humanities (37 | 21.3%), business (21 | 12.1%), education (15 | 8.6%), and multidisciplinary studies (12 | 6.9%) are the most common fields of study among 174 individuals in Laurel Lake who have obtained a bachelor's degree or higher.
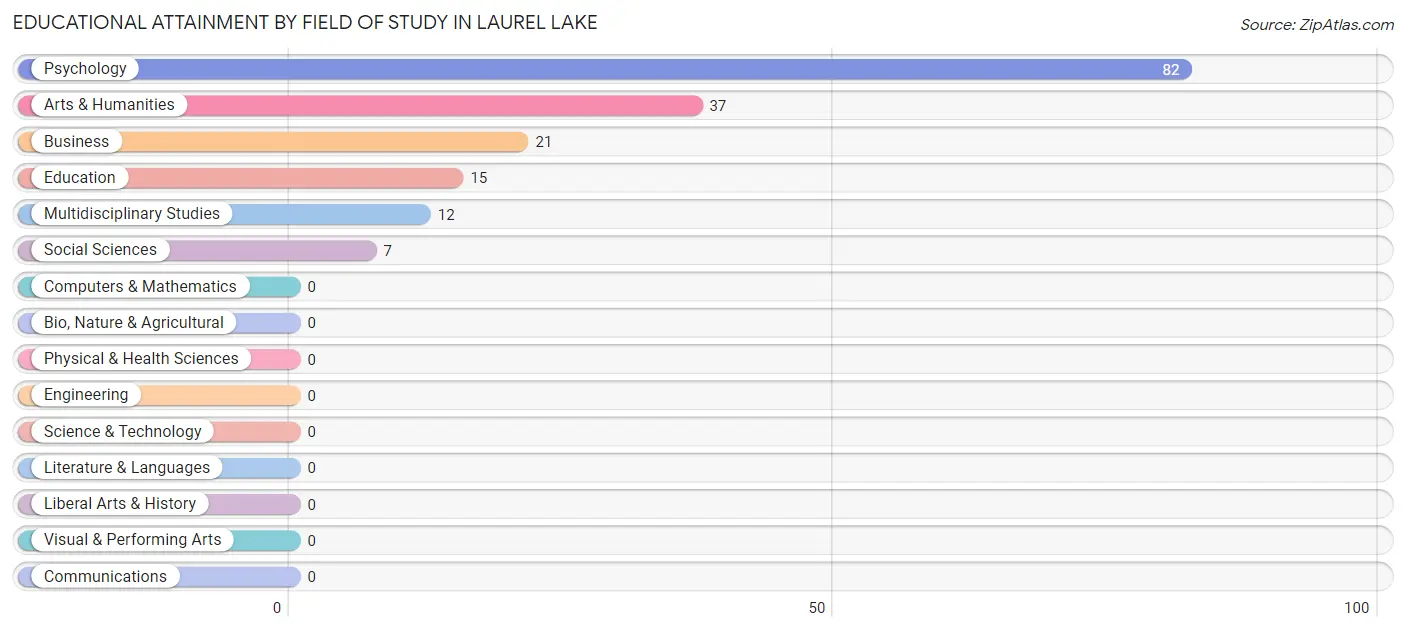
| Field of Study | # Graduates | % Graduates |
| Computers & Mathematics | 0 | 0.0% |
| Bio, Nature & Agricultural | 0 | 0.0% |
| Physical & Health Sciences | 0 | 0.0% |
| Psychology | 82 | 47.1% |
| Social Sciences | 7 | 4.0% |
| Engineering | 0 | 0.0% |
| Multidisciplinary Studies | 12 | 6.9% |
| Science & Technology | 0 | 0.0% |
| Business | 21 | 12.1% |
| Education | 15 | 8.6% |
| Literature & Languages | 0 | 0.0% |
| Liberal Arts & History | 0 | 0.0% |
| Visual & Performing Arts | 0 | 0.0% |
| Communications | 0 | 0.0% |
| Arts & Humanities | 37 | 21.3% |
| Total | 174 | 100.0% |
Transportation & Commute in Laurel Lake
Vehicle Availability by Sex in Laurel Lake
The most prevalent vehicle ownership categories in Laurel Lake are males with 3 vehicles (219, accounting for 36.4%) and females with 3 vehicles (122, making up 55.4%).
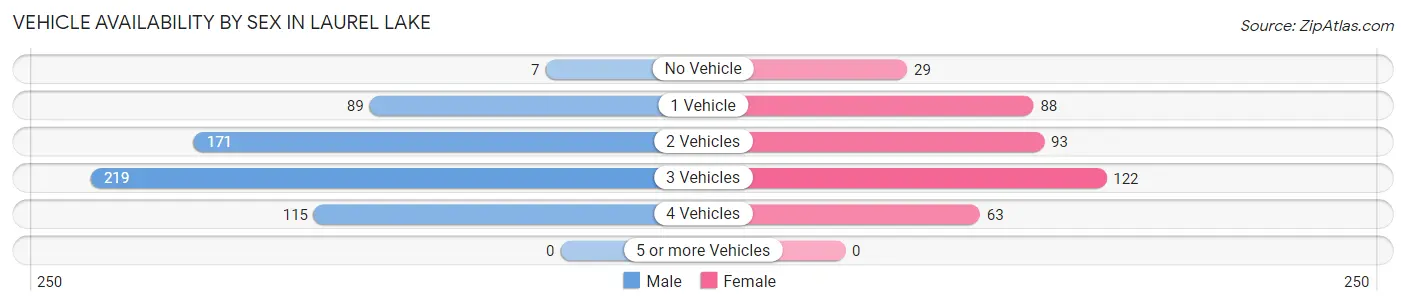
| Vehicles Available | Male | Female |
| No Vehicle | 7 (1.2%) | 29 (7.3%) |
| 1 Vehicle | 89 (14.8%) | 88 (22.3%) |
| 2 Vehicles | 171 (28.4%) | 93 (23.5%) |
| 3 Vehicles | 219 (36.4%) | 122 (30.9%) |
| 4 Vehicles | 115 (19.1%) | 63 (16.0%) |
| 5 or more Vehicles | 0 (0.0%) | 0 (0.0%) |
| Total | 601 (100.0%) | 395 (100.0%) |
Commute Time in Laurel Lake
The most frequently occuring commute durations in Laurel Lake are 15 to 19 minutes (241 commuters, 24.7%), 20 to 24 minutes (167 commuters, 17.1%), and 30 to 34 minutes (133 commuters, 13.6%).
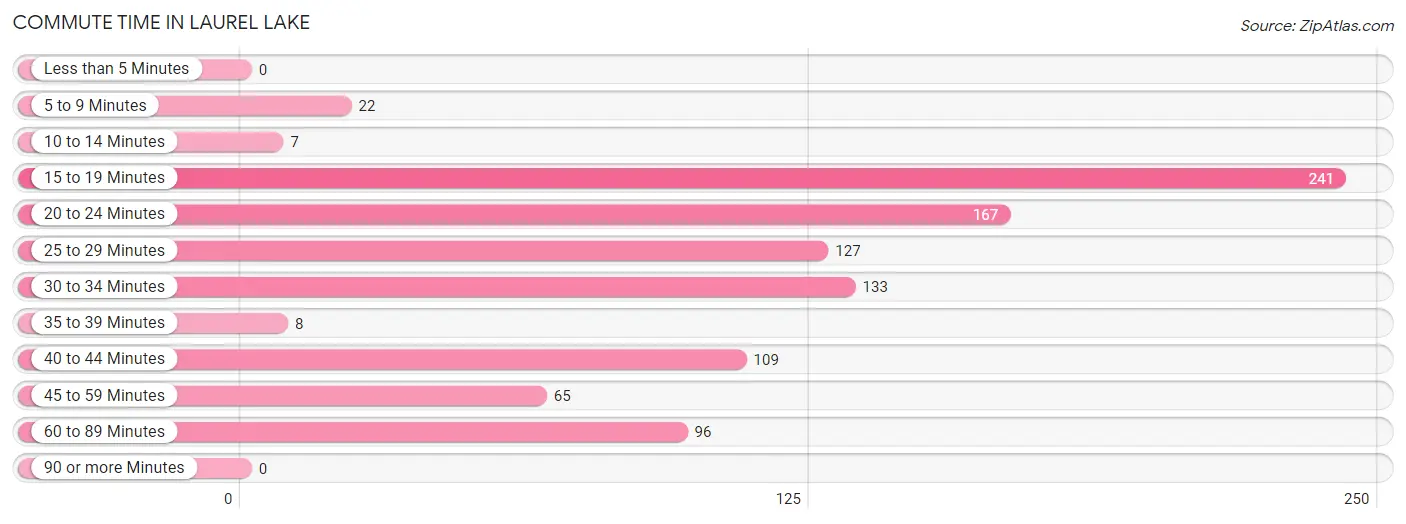
| Commute Time | # Commuters | % Commuters |
| Less than 5 Minutes | 0 | 0.0% |
| 5 to 9 Minutes | 22 | 2.3% |
| 10 to 14 Minutes | 7 | 0.7% |
| 15 to 19 Minutes | 241 | 24.7% |
| 20 to 24 Minutes | 167 | 17.1% |
| 25 to 29 Minutes | 127 | 13.0% |
| 30 to 34 Minutes | 133 | 13.6% |
| 35 to 39 Minutes | 8 | 0.8% |
| 40 to 44 Minutes | 109 | 11.2% |
| 45 to 59 Minutes | 65 | 6.7% |
| 60 to 89 Minutes | 96 | 9.9% |
| 90 or more Minutes | 0 | 0.0% |
Commute Time by Sex in Laurel Lake
The most common commute times in Laurel Lake are 15 to 19 minutes (154 commuters, 25.6%) for males and 30 to 34 minutes (93 commuters, 24.9%) for females.
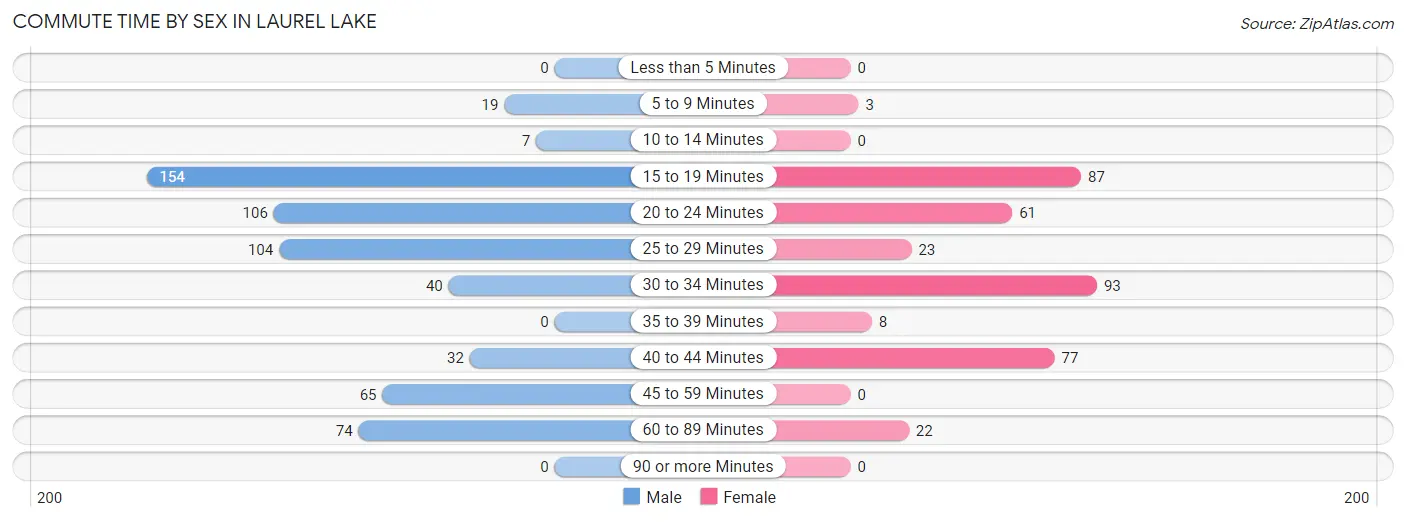
| Commute Time | Male | Female |
| Less than 5 Minutes | 0 (0.0%) | 0 (0.0%) |
| 5 to 9 Minutes | 19 (3.2%) | 3 (0.8%) |
| 10 to 14 Minutes | 7 (1.2%) | 0 (0.0%) |
| 15 to 19 Minutes | 154 (25.6%) | 87 (23.3%) |
| 20 to 24 Minutes | 106 (17.6%) | 61 (16.3%) |
| 25 to 29 Minutes | 104 (17.3%) | 23 (6.1%) |
| 30 to 34 Minutes | 40 (6.7%) | 93 (24.9%) |
| 35 to 39 Minutes | 0 (0.0%) | 8 (2.1%) |
| 40 to 44 Minutes | 32 (5.3%) | 77 (20.6%) |
| 45 to 59 Minutes | 65 (10.8%) | 0 (0.0%) |
| 60 to 89 Minutes | 74 (12.3%) | 22 (5.9%) |
| 90 or more Minutes | 0 (0.0%) | 0 (0.0%) |
Time of Departure to Work by Sex in Laurel Lake
The most frequent times of departure to work in Laurel Lake are 6:30 AM to 6:59 AM (128, 21.3%) for males and 7:00 AM to 7:29 AM (87, 23.3%) for females.
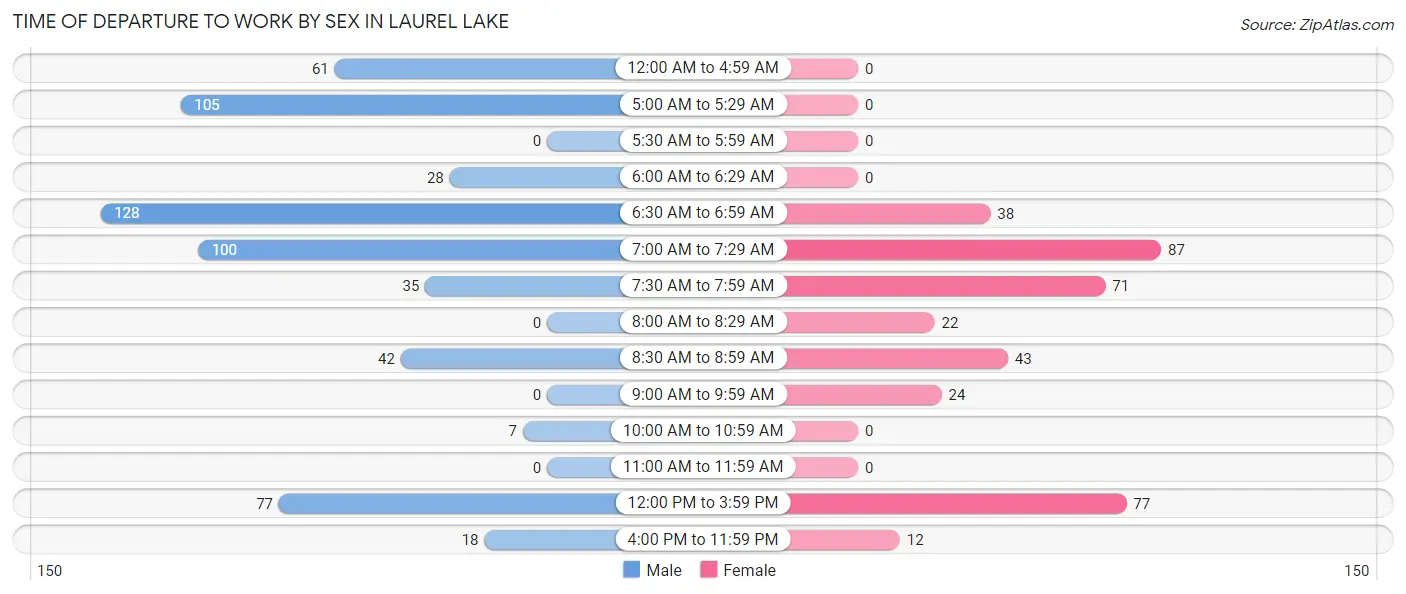
| Time of Departure | Male | Female |
| 12:00 AM to 4:59 AM | 61 (10.2%) | 0 (0.0%) |
| 5:00 AM to 5:29 AM | 105 (17.5%) | 0 (0.0%) |
| 5:30 AM to 5:59 AM | 0 (0.0%) | 0 (0.0%) |
| 6:00 AM to 6:29 AM | 28 (4.7%) | 0 (0.0%) |
| 6:30 AM to 6:59 AM | 128 (21.3%) | 38 (10.2%) |
| 7:00 AM to 7:29 AM | 100 (16.6%) | 87 (23.3%) |
| 7:30 AM to 7:59 AM | 35 (5.8%) | 71 (19.0%) |
| 8:00 AM to 8:29 AM | 0 (0.0%) | 22 (5.9%) |
| 8:30 AM to 8:59 AM | 42 (7.0%) | 43 (11.5%) |
| 9:00 AM to 9:59 AM | 0 (0.0%) | 24 (6.4%) |
| 10:00 AM to 10:59 AM | 7 (1.2%) | 0 (0.0%) |
| 11:00 AM to 11:59 AM | 0 (0.0%) | 0 (0.0%) |
| 12:00 PM to 3:59 PM | 77 (12.8%) | 77 (20.6%) |
| 4:00 PM to 11:59 PM | 18 (3.0%) | 12 (3.2%) |
| Total | 601 (100.0%) | 374 (100.0%) |
Housing Occupancy in Laurel Lake
Occupancy by Ownership in Laurel Lake
Of the total 906 dwellings in Laurel Lake, owner-occupied units account for 643 (71.0%), while renter-occupied units make up 263 (29.0%).
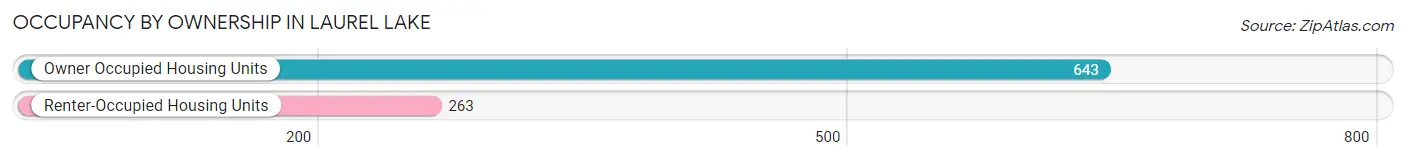
| Occupancy | # Housing Units | % Housing Units |
| Owner Occupied Housing Units | 643 | 71.0% |
| Renter-Occupied Housing Units | 263 | 29.0% |
| Total Occupied Housing Units | 906 | 100.0% |
Occupancy by Household Size in Laurel Lake
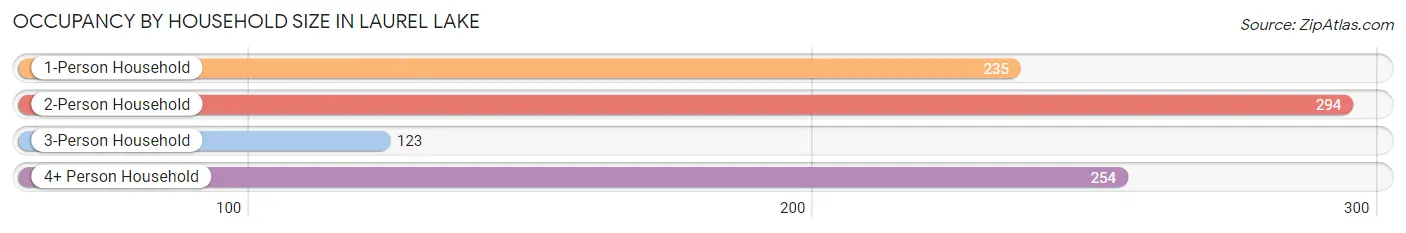
| Household Size | # Housing Units | % Housing Units |
| 1-Person Household | 235 | 25.9% |
| 2-Person Household | 294 | 32.5% |
| 3-Person Household | 123 | 13.6% |
| 4+ Person Household | 254 | 28.0% |
| Total Housing Units | 906 | 100.0% |
Occupancy by Ownership by Household Size in Laurel Lake
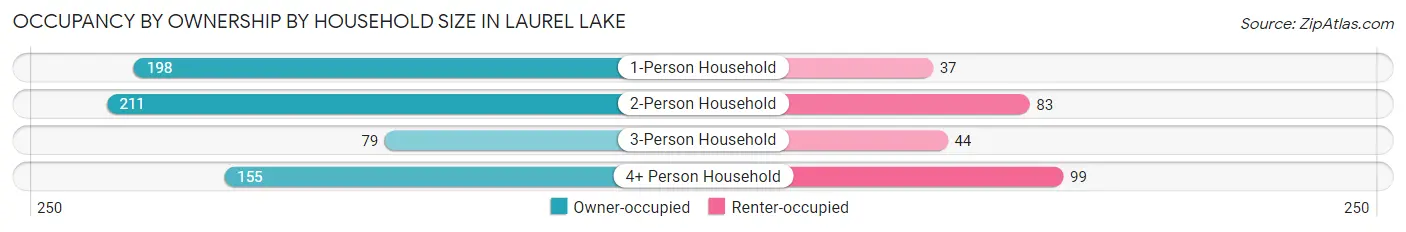
| Household Size | Owner-occupied | Renter-occupied |
| 1-Person Household | 198 (84.3%) | 37 (15.7%) |
| 2-Person Household | 211 (71.8%) | 83 (28.2%) |
| 3-Person Household | 79 (64.2%) | 44 (35.8%) |
| 4+ Person Household | 155 (61.0%) | 99 (39.0%) |
| Total Housing Units | 643 (71.0%) | 263 (29.0%) |
Occupancy by Educational Attainment in Laurel Lake
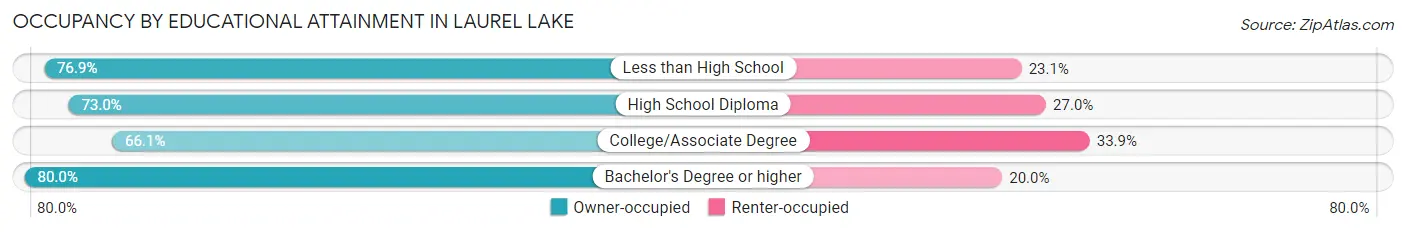
| Household Size | Owner-occupied | Renter-occupied |
| Less than High School | 30 (76.9%) | 9 (23.1%) |
| High School Diploma | 317 (73.0%) | 117 (27.0%) |
| College/Associate Degree | 240 (66.1%) | 123 (33.9%) |
| Bachelor's Degree or higher | 56 (80.0%) | 14 (20.0%) |
Occupancy by Age of Householder in Laurel Lake
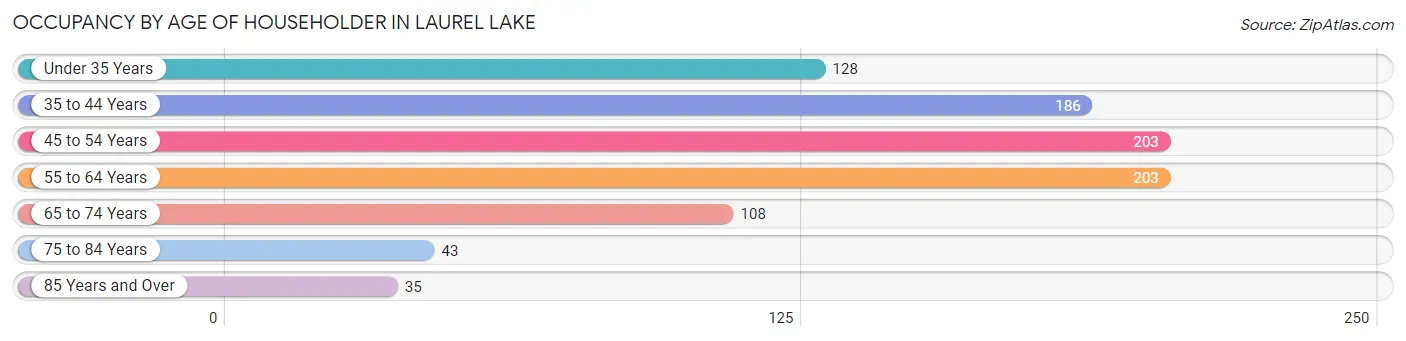
| Age Bracket | # Households | % Households |
| Under 35 Years | 128 | 14.1% |
| 35 to 44 Years | 186 | 20.5% |
| 45 to 54 Years | 203 | 22.4% |
| 55 to 64 Years | 203 | 22.4% |
| 65 to 74 Years | 108 | 11.9% |
| 75 to 84 Years | 43 | 4.8% |
| 85 Years and Over | 35 | 3.9% |
| Total | 906 | 100.0% |
Housing Finances in Laurel Lake
Median Income by Occupancy in Laurel Lake
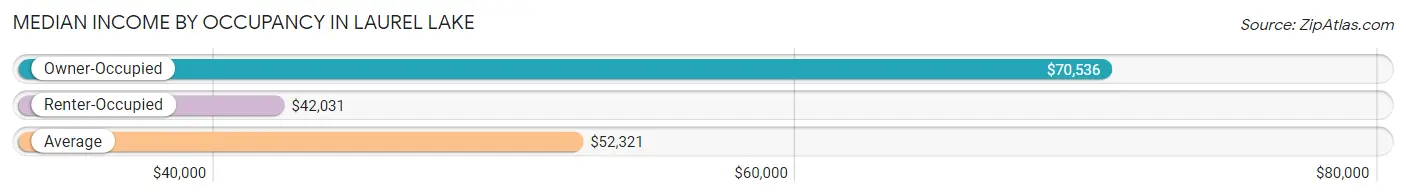
| Occupancy Type | # Households | Median Income |
| Owner-Occupied | 643 (71.0%) | $70,536 |
| Renter-Occupied | 263 (29.0%) | $42,031 |
| Average | 906 (100.0%) | $52,321 |
Occupancy by Householder Income Bracket in Laurel Lake
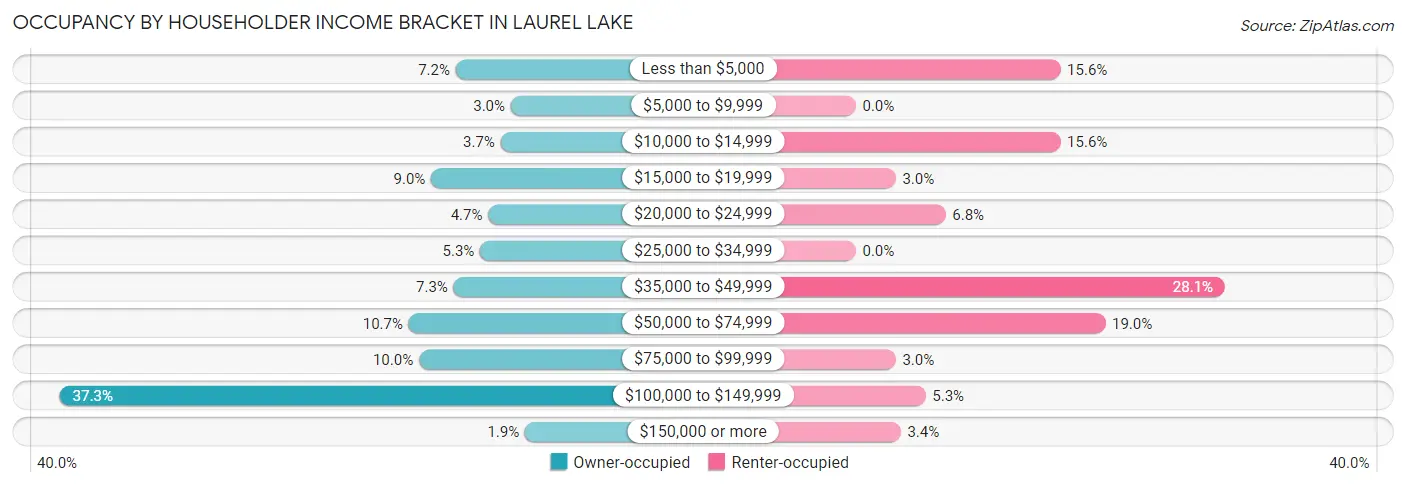
| Income Bracket | Owner-occupied | Renter-occupied |
| Less than $5,000 | 46 (7.1%) | 41 (15.6%) |
| $5,000 to $9,999 | 19 (2.9%) | 0 (0.0%) |
| $10,000 to $14,999 | 24 (3.7%) | 41 (15.6%) |
| $15,000 to $19,999 | 58 (9.0%) | 8 (3.0%) |
| $20,000 to $24,999 | 30 (4.7%) | 18 (6.8%) |
| $25,000 to $34,999 | 34 (5.3%) | 0 (0.0%) |
| $35,000 to $49,999 | 47 (7.3%) | 74 (28.1%) |
| $50,000 to $74,999 | 69 (10.7%) | 50 (19.0%) |
| $75,000 to $99,999 | 64 (10.0%) | 8 (3.0%) |
| $100,000 to $149,999 | 240 (37.3%) | 14 (5.3%) |
| $150,000 or more | 12 (1.9%) | 9 (3.4%) |
| Total | 643 (100.0%) | 263 (100.0%) |
Monthly Housing Cost Tiers in Laurel Lake
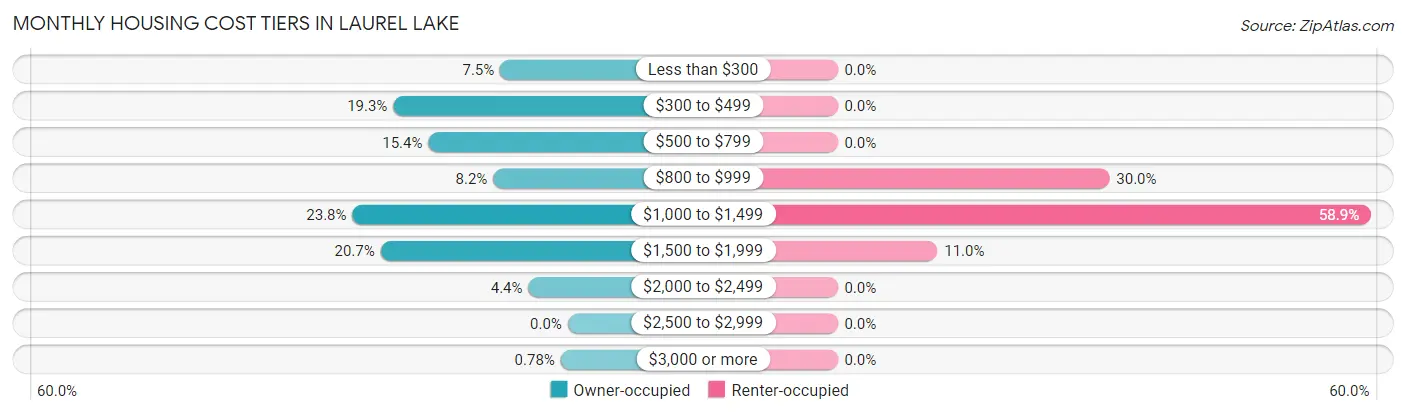
| Monthly Cost | Owner-occupied | Renter-occupied |
| Less than $300 | 48 (7.5%) | 0 (0.0%) |
| $300 to $499 | 124 (19.3%) | 0 (0.0%) |
| $500 to $799 | 99 (15.4%) | 0 (0.0%) |
| $800 to $999 | 53 (8.2%) | 79 (30.0%) |
| $1,000 to $1,499 | 153 (23.8%) | 155 (58.9%) |
| $1,500 to $1,999 | 133 (20.7%) | 29 (11.0%) |
| $2,000 to $2,499 | 28 (4.3%) | 0 (0.0%) |
| $2,500 to $2,999 | 0 (0.0%) | 0 (0.0%) |
| $3,000 or more | 5 (0.8%) | 0 (0.0%) |
| Total | 643 (100.0%) | 263 (100.0%) |
Physical Housing Characteristics in Laurel Lake
Housing Structures in Laurel Lake
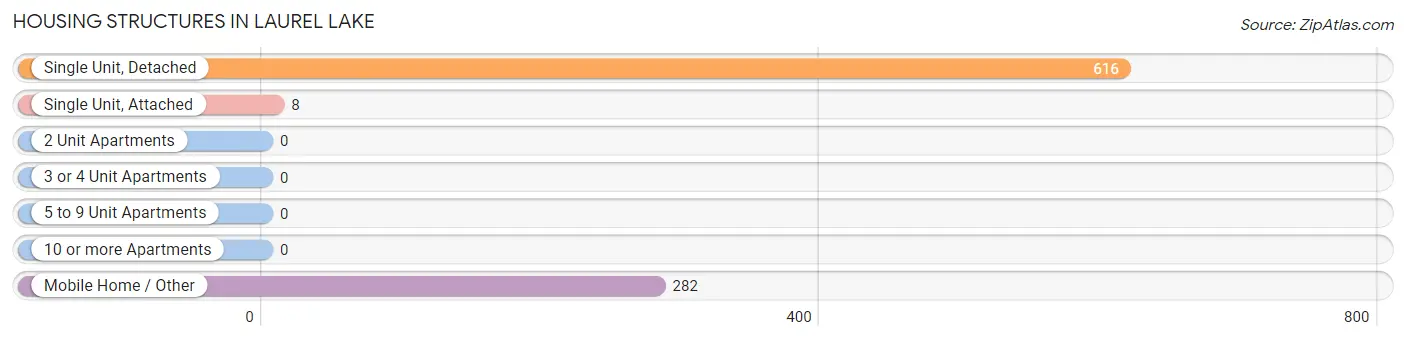
| Structure Type | # Housing Units | % Housing Units |
| Single Unit, Detached | 616 | 68.0% |
| Single Unit, Attached | 8 | 0.9% |
| 2 Unit Apartments | 0 | 0.0% |
| 3 or 4 Unit Apartments | 0 | 0.0% |
| 5 to 9 Unit Apartments | 0 | 0.0% |
| 10 or more Apartments | 0 | 0.0% |
| Mobile Home / Other | 282 | 31.1% |
| Total | 906 | 100.0% |
Housing Structures by Occupancy in Laurel Lake
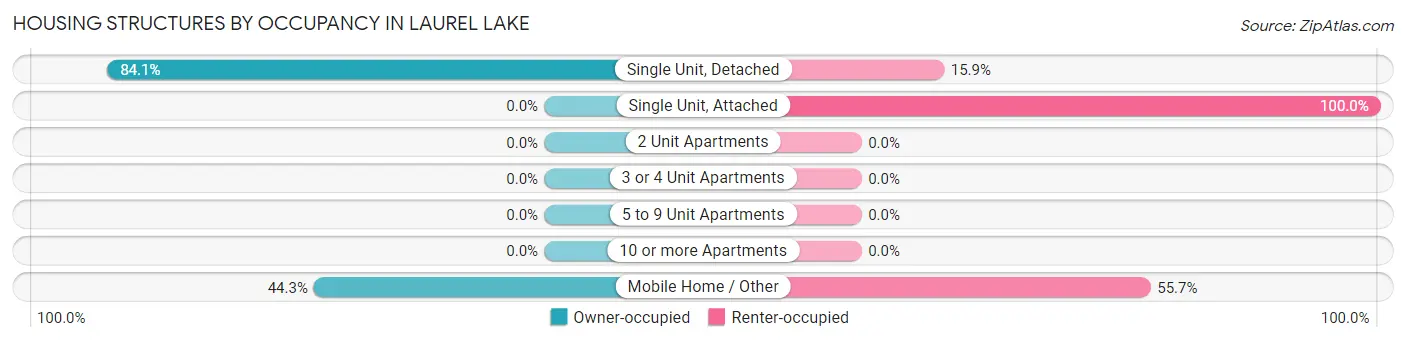
| Structure Type | Owner-occupied | Renter-occupied |
| Single Unit, Detached | 518 (84.1%) | 98 (15.9%) |
| Single Unit, Attached | 0 (0.0%) | 8 (100.0%) |
| 2 Unit Apartments | 0 (0.0%) | 0 (0.0%) |
| 3 or 4 Unit Apartments | 0 (0.0%) | 0 (0.0%) |
| 5 to 9 Unit Apartments | 0 (0.0%) | 0 (0.0%) |
| 10 or more Apartments | 0 (0.0%) | 0 (0.0%) |
| Mobile Home / Other | 125 (44.3%) | 157 (55.7%) |
| Total | 643 (71.0%) | 263 (29.0%) |
Housing Structures by Number of Rooms in Laurel Lake
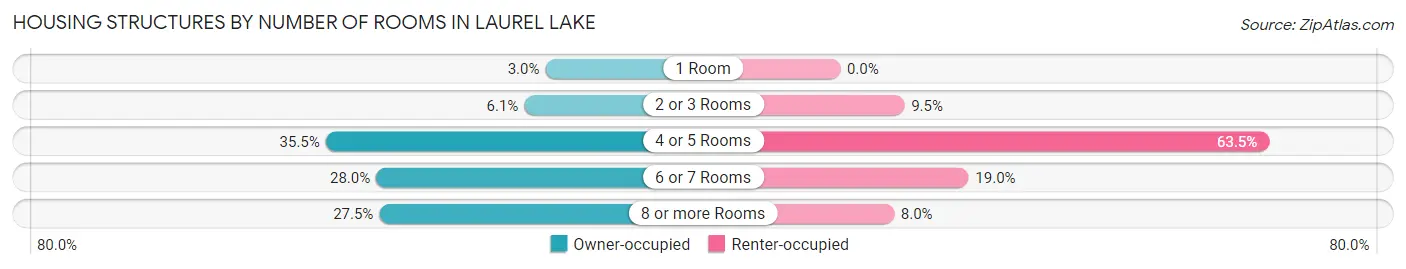
| Number of Rooms | Owner-occupied | Renter-occupied |
| 1 Room | 19 (2.9%) | 0 (0.0%) |
| 2 or 3 Rooms | 39 (6.1%) | 25 (9.5%) |
| 4 or 5 Rooms | 228 (35.5%) | 167 (63.5%) |
| 6 or 7 Rooms | 180 (28.0%) | 50 (19.0%) |
| 8 or more Rooms | 177 (27.5%) | 21 (8.0%) |
| Total | 643 (100.0%) | 263 (100.0%) |
Housing Structure by Heating Type in Laurel Lake
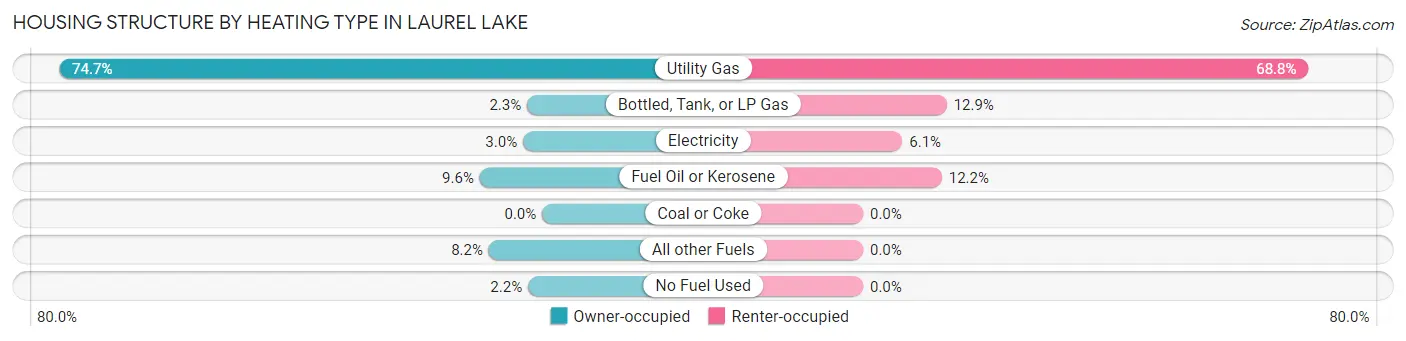
| Heating Type | Owner-occupied | Renter-occupied |
| Utility Gas | 480 (74.7%) | 181 (68.8%) |
| Bottled, Tank, or LP Gas | 15 (2.3%) | 34 (12.9%) |
| Electricity | 19 (2.9%) | 16 (6.1%) |
| Fuel Oil or Kerosene | 62 (9.6%) | 32 (12.2%) |
| Coal or Coke | 0 (0.0%) | 0 (0.0%) |
| All other Fuels | 53 (8.2%) | 0 (0.0%) |
| No Fuel Used | 14 (2.2%) | 0 (0.0%) |
| Total | 643 (100.0%) | 263 (100.0%) |
Household Vehicle Usage in Laurel Lake
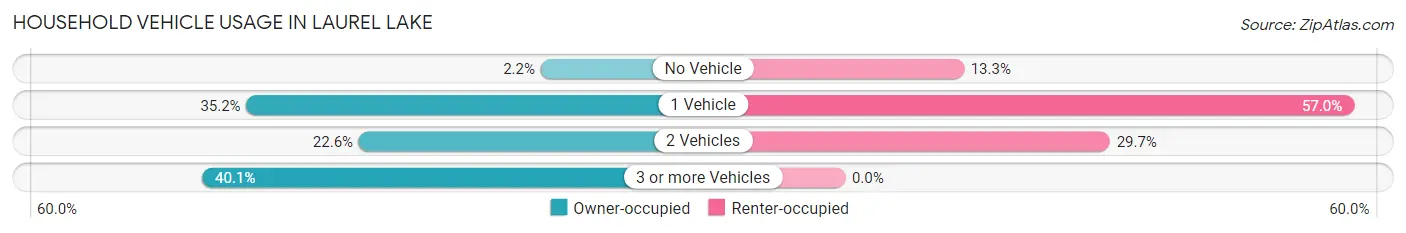
| Vehicles per Household | Owner-occupied | Renter-occupied |
| No Vehicle | 14 (2.2%) | 35 (13.3%) |
| 1 Vehicle | 226 (35.1%) | 150 (57.0%) |
| 2 Vehicles | 145 (22.6%) | 78 (29.7%) |
| 3 or more Vehicles | 258 (40.1%) | 0 (0.0%) |
| Total | 643 (100.0%) | 263 (100.0%) |
Real Estate & Mortgages in Laurel Lake
Real Estate and Mortgage Overview in Laurel Lake
| Characteristic | Without Mortgage | With Mortgage |
| Housing Units | 321 | 322 |
| Median Property Value | $116,400 | $159,100 |
| Median Household Income | $25,066 | $0 |
| Monthly Housing Costs | $488 | $5 |
| Real Estate Taxes | $2,526 | $20 |
Property Value by Mortgage Status in Laurel Lake
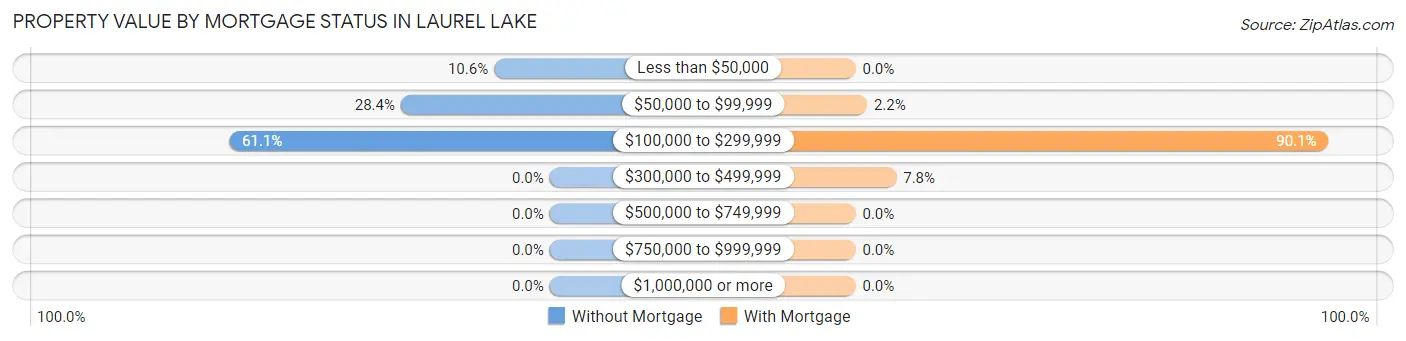
| Property Value | Without Mortgage | With Mortgage |
| Less than $50,000 | 34 (10.6%) | 0 (0.0%) |
| $50,000 to $99,999 | 91 (28.3%) | 7 (2.2%) |
| $100,000 to $299,999 | 196 (61.1%) | 290 (90.1%) |
| $300,000 to $499,999 | 0 (0.0%) | 25 (7.8%) |
| $500,000 to $749,999 | 0 (0.0%) | 0 (0.0%) |
| $750,000 to $999,999 | 0 (0.0%) | 0 (0.0%) |
| $1,000,000 or more | 0 (0.0%) | 0 (0.0%) |
| Total | 321 (100.0%) | 322 (100.0%) |
Household Income by Mortgage Status in Laurel Lake
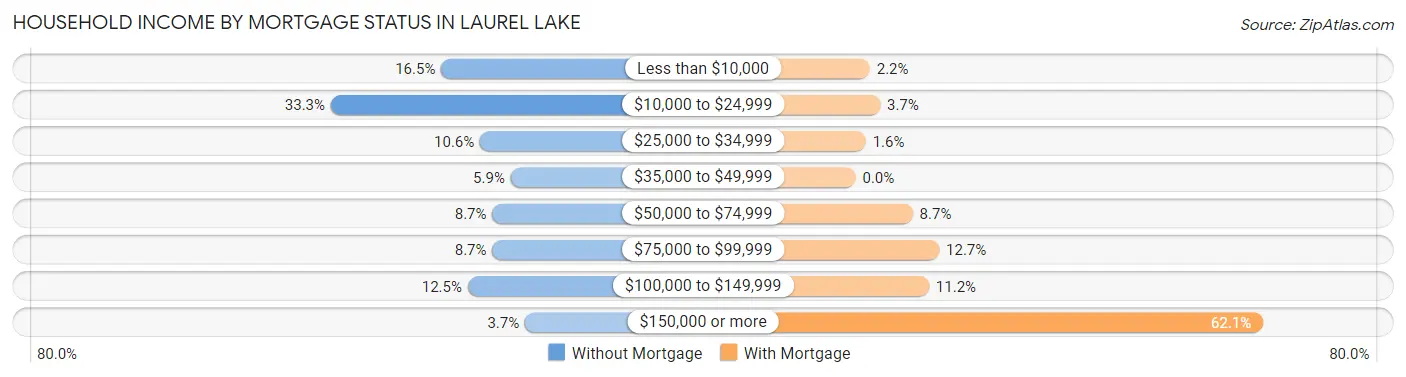
| Household Income | Without Mortgage | With Mortgage |
| Less than $10,000 | 53 (16.5%) | 7 (2.2%) |
| $10,000 to $24,999 | 107 (33.3%) | 12 (3.7%) |
| $25,000 to $34,999 | 34 (10.6%) | 5 (1.5%) |
| $35,000 to $49,999 | 19 (5.9%) | 0 (0.0%) |
| $50,000 to $74,999 | 28 (8.7%) | 28 (8.7%) |
| $75,000 to $99,999 | 28 (8.7%) | 41 (12.7%) |
| $100,000 to $149,999 | 40 (12.5%) | 36 (11.2%) |
| $150,000 or more | 12 (3.7%) | 200 (62.1%) |
| Total | 321 (100.0%) | 322 (100.0%) |
Property Value to Household Income Ratio in Laurel Lake
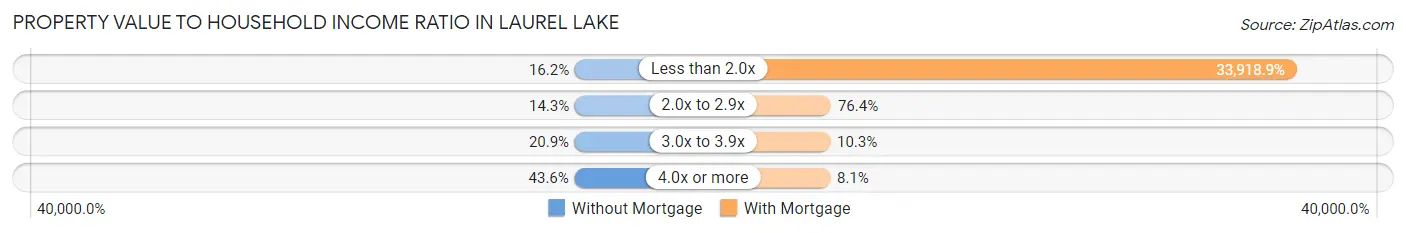
| Value-to-Income Ratio | Without Mortgage | With Mortgage |
| Less than 2.0x | 52 (16.2%) | 109,219 (33,918.9%) |
| 2.0x to 2.9x | 46 (14.3%) | 246 (76.4%) |
| 3.0x to 3.9x | 67 (20.9%) | 33 (10.2%) |
| 4.0x or more | 140 (43.6%) | 26 (8.1%) |
| Total | 321 (100.0%) | 322 (100.0%) |
Real Estate Taxes by Mortgage Status in Laurel Lake
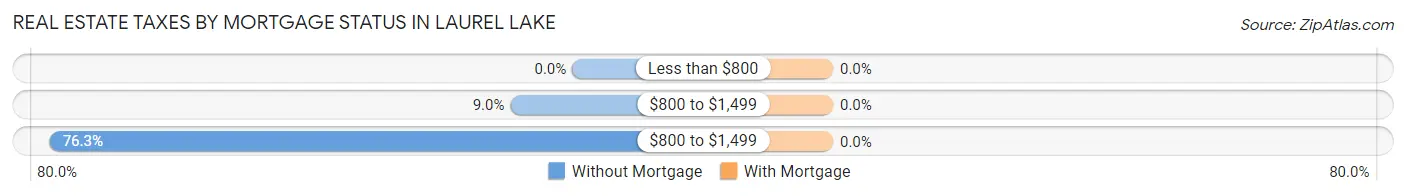
| Property Taxes | Without Mortgage | With Mortgage |
| Less than $800 | 0 (0.0%) | 0 (0.0%) |
| $800 to $1,499 | 29 (9.0%) | 0 (0.0%) |
| $800 to $1,499 | 245 (76.3%) | 0 (0.0%) |
| Total | 321 (100.0%) | 322 (100.0%) |
Health & Disability in Laurel Lake
Health Insurance Coverage by Age in Laurel Lake
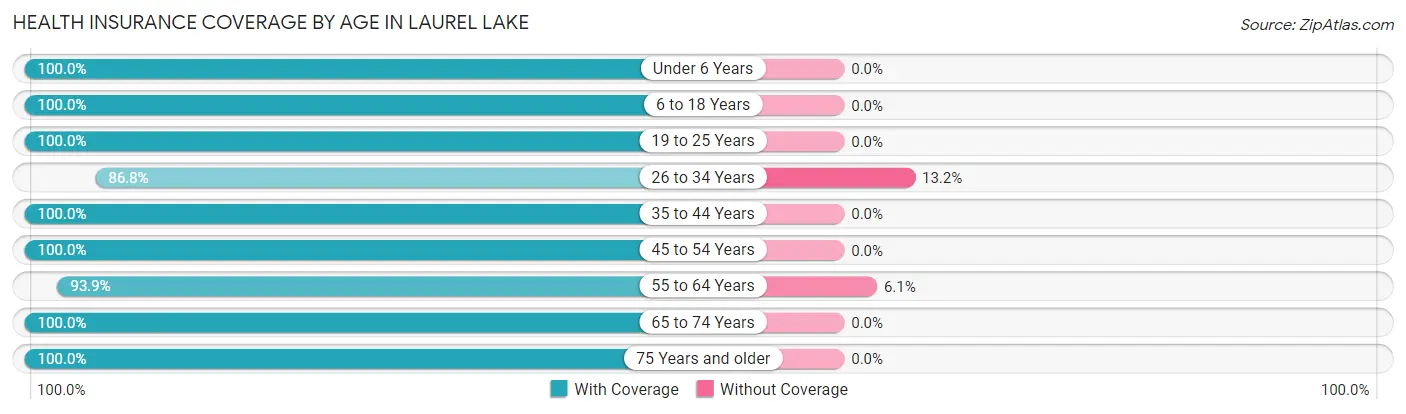
| Age Bracket | With Coverage | Without Coverage |
| Under 6 Years | 244 (100.0%) | 0 (0.0%) |
| 6 to 18 Years | 437 (100.0%) | 0 (0.0%) |
| 19 to 25 Years | 76 (100.0%) | 0 (0.0%) |
| 26 to 34 Years | 250 (86.8%) | 38 (13.2%) |
| 35 to 44 Years | 351 (100.0%) | 0 (0.0%) |
| 45 to 54 Years | 385 (100.0%) | 0 (0.0%) |
| 55 to 64 Years | 277 (93.9%) | 18 (6.1%) |
| 65 to 74 Years | 155 (100.0%) | 0 (0.0%) |
| 75 Years and older | 115 (100.0%) | 0 (0.0%) |
| Total | 2,290 (97.6%) | 56 (2.4%) |
Health Insurance Coverage by Citizenship Status in Laurel Lake
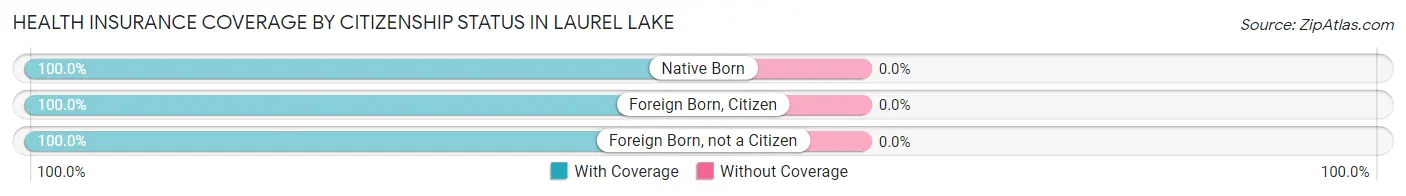
| Citizenship Status | With Coverage | Without Coverage |
| Native Born | 244 (100.0%) | 0 (0.0%) |
| Foreign Born, Citizen | 437 (100.0%) | 0 (0.0%) |
| Foreign Born, not a Citizen | 76 (100.0%) | 0 (0.0%) |
Health Insurance Coverage by Household Income in Laurel Lake
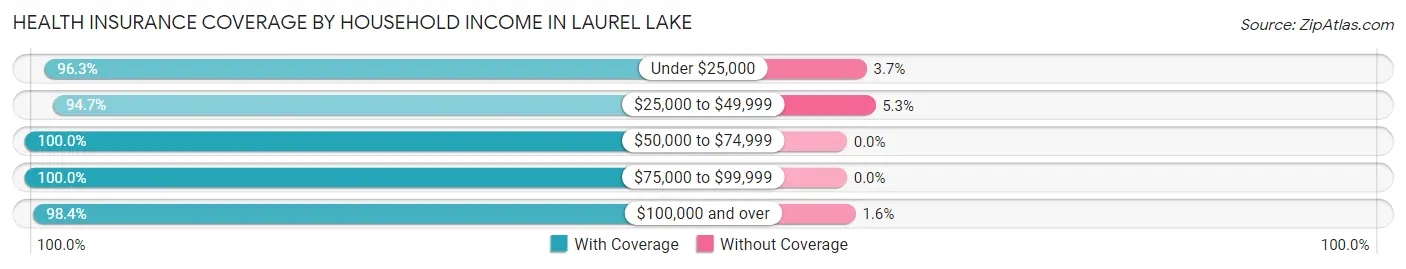
| Household Income | With Coverage | Without Coverage |
| Under $25,000 | 468 (96.3%) | 18 (3.7%) |
| $25,000 to $49,999 | 409 (94.7%) | 23 (5.3%) |
| $50,000 to $74,999 | 354 (100.0%) | 0 (0.0%) |
| $75,000 to $99,999 | 152 (100.0%) | 0 (0.0%) |
| $100,000 and over | 907 (98.4%) | 15 (1.6%) |
Public vs Private Health Insurance Coverage by Age in Laurel Lake
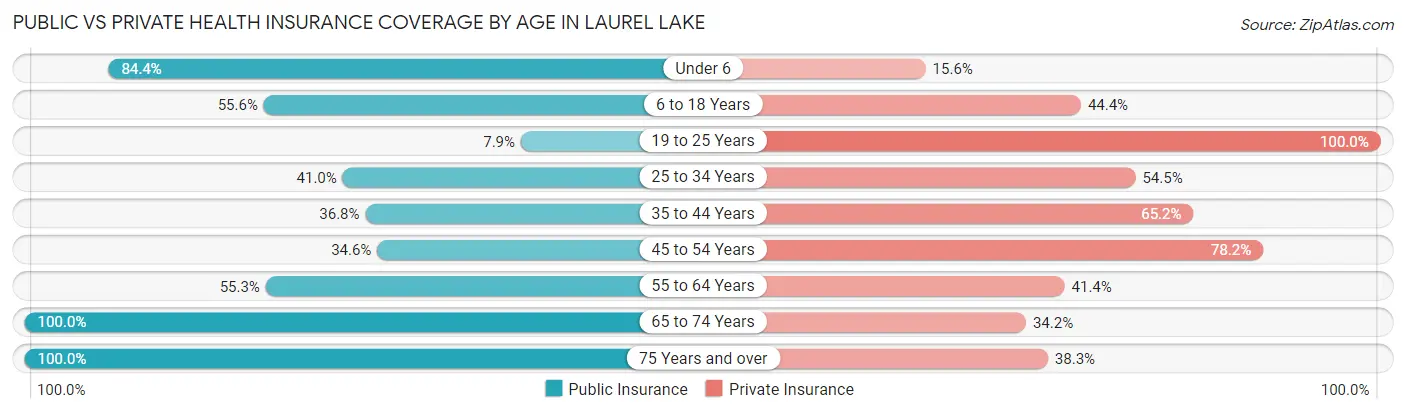
| Age Bracket | Public Insurance | Private Insurance |
| Under 6 | 206 (84.4%) | 38 (15.6%) |
| 6 to 18 Years | 243 (55.6%) | 194 (44.4%) |
| 19 to 25 Years | 6 (7.9%) | 76 (100.0%) |
| 25 to 34 Years | 118 (41.0%) | 157 (54.5%) |
| 35 to 44 Years | 129 (36.7%) | 229 (65.2%) |
| 45 to 54 Years | 133 (34.5%) | 301 (78.2%) |
| 55 to 64 Years | 163 (55.2%) | 122 (41.4%) |
| 65 to 74 Years | 155 (100.0%) | 53 (34.2%) |
| 75 Years and over | 115 (100.0%) | 44 (38.3%) |
| Total | 1,268 (54.0%) | 1,214 (51.7%) |
Disability Status by Sex by Age in Laurel Lake
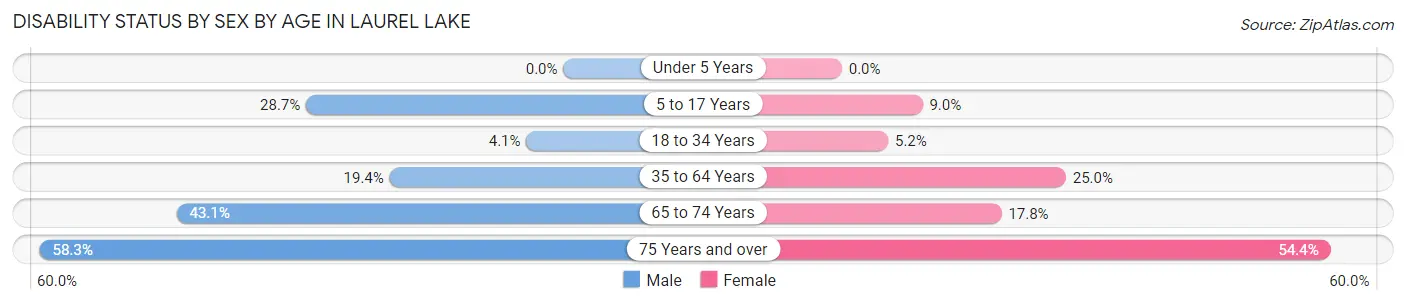
| Age Bracket | Male | Female |
| Under 5 Years | 0 (0.0%) | 0 (0.0%) |
| 5 to 17 Years | 55 (28.6%) | 23 (9.0%) |
| 18 to 34 Years | 11 (4.1%) | 7 (5.1%) |
| 35 to 64 Years | 101 (19.4%) | 127 (24.9%) |
| 65 to 74 Years | 28 (43.1%) | 16 (17.8%) |
| 75 Years and over | 21 (58.3%) | 43 (54.4%) |
Disability Class by Sex by Age in Laurel Lake
Disability Class: Hearing Difficulty
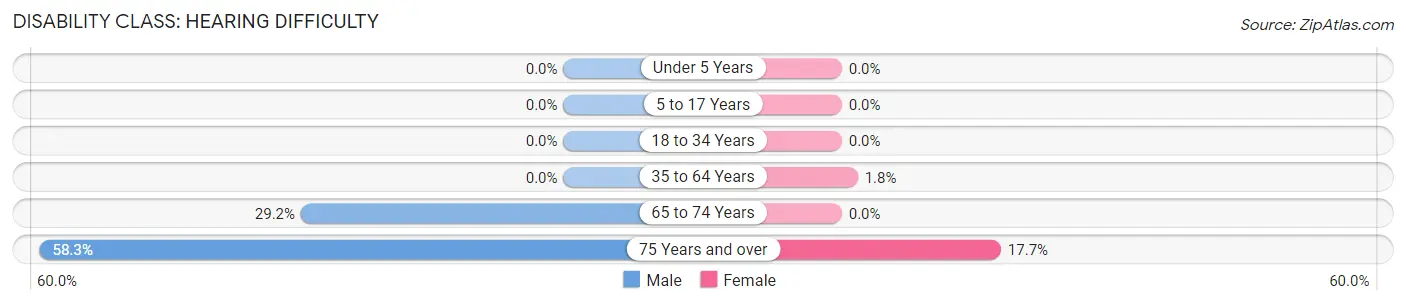
| Age Bracket | Male | Female |
| Under 5 Years | 0 (0.0%) | 0 (0.0%) |
| 5 to 17 Years | 0 (0.0%) | 0 (0.0%) |
| 18 to 34 Years | 0 (0.0%) | 0 (0.0%) |
| 35 to 64 Years | 0 (0.0%) | 9 (1.8%) |
| 65 to 74 Years | 19 (29.2%) | 0 (0.0%) |
| 75 Years and over | 21 (58.3%) | 14 (17.7%) |
Disability Class: Vision Difficulty
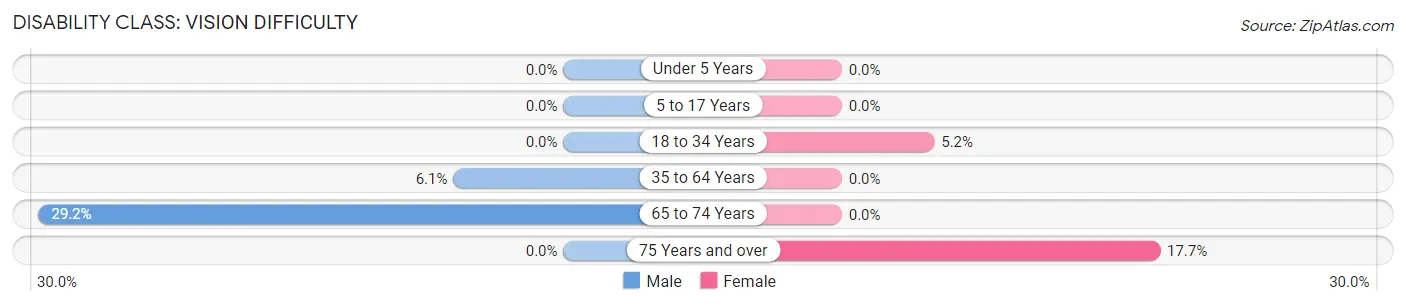
| Age Bracket | Male | Female |
| Under 5 Years | 0 (0.0%) | 0 (0.0%) |
| 5 to 17 Years | 0 (0.0%) | 0 (0.0%) |
| 18 to 34 Years | 0 (0.0%) | 7 (5.1%) |
| 35 to 64 Years | 32 (6.1%) | 0 (0.0%) |
| 65 to 74 Years | 19 (29.2%) | 0 (0.0%) |
| 75 Years and over | 0 (0.0%) | 14 (17.7%) |
Disability Class: Cognitive Difficulty
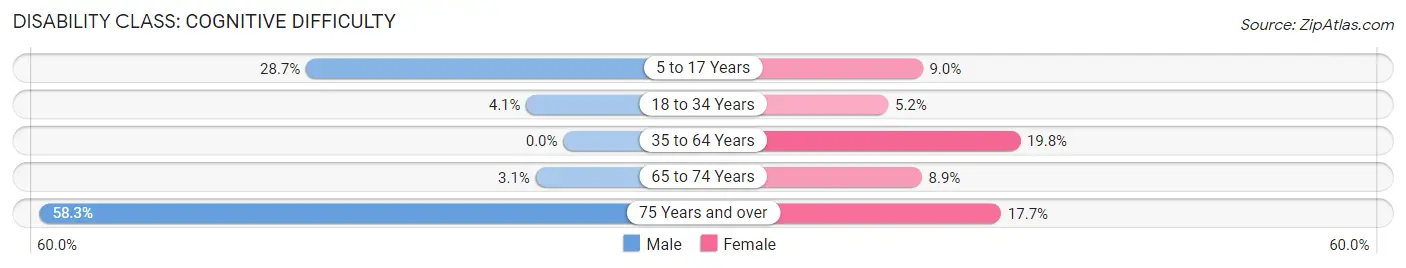
| Age Bracket | Male | Female |
| 5 to 17 Years | 55 (28.6%) | 23 (9.0%) |
| 18 to 34 Years | 11 (4.1%) | 7 (5.1%) |
| 35 to 64 Years | 0 (0.0%) | 101 (19.8%) |
| 65 to 74 Years | 2 (3.1%) | 8 (8.9%) |
| 75 Years and over | 21 (58.3%) | 14 (17.7%) |
Disability Class: Ambulatory Difficulty
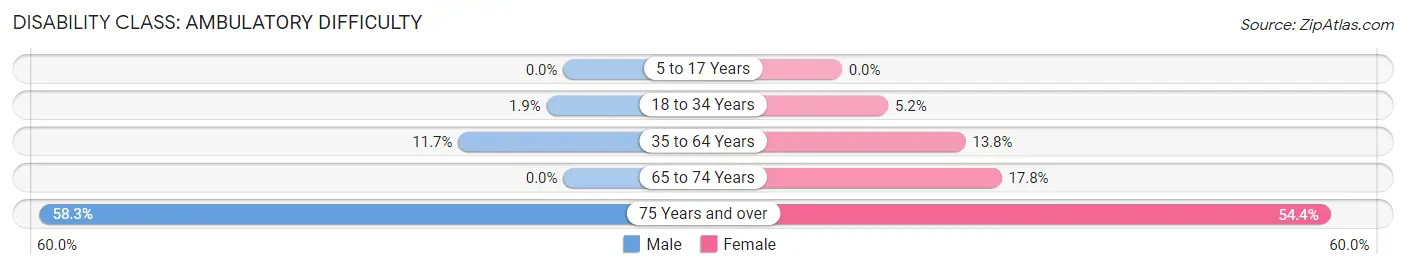
| Age Bracket | Male | Female |
| 5 to 17 Years | 0 (0.0%) | 0 (0.0%) |
| 18 to 34 Years | 5 (1.9%) | 7 (5.1%) |
| 35 to 64 Years | 61 (11.7%) | 70 (13.8%) |
| 65 to 74 Years | 0 (0.0%) | 16 (17.8%) |
| 75 Years and over | 21 (58.3%) | 43 (54.4%) |
Disability Class: Self-Care Difficulty
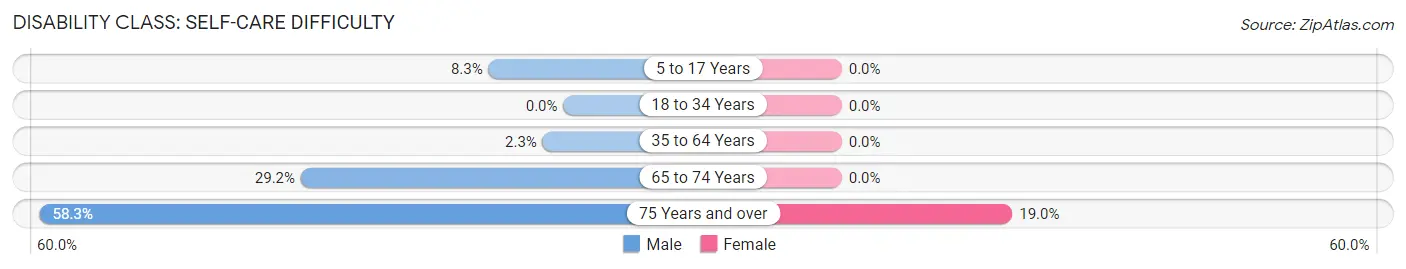
| Age Bracket | Male | Female |
| 5 to 17 Years | 16 (8.3%) | 0 (0.0%) |
| 18 to 34 Years | 0 (0.0%) | 0 (0.0%) |
| 35 to 64 Years | 12 (2.3%) | 0 (0.0%) |
| 65 to 74 Years | 19 (29.2%) | 0 (0.0%) |
| 75 Years and over | 21 (58.3%) | 15 (19.0%) |
Technology Access in Laurel Lake
Computing Device Access in Laurel Lake
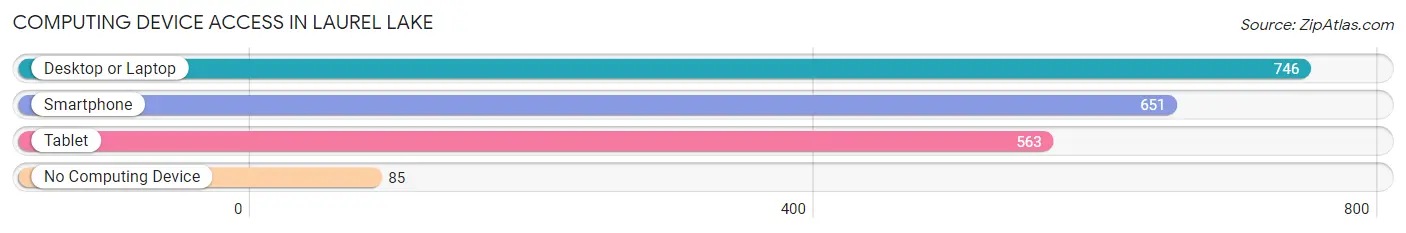
| Device Type | # Households | % Households |
| Desktop or Laptop | 746 | 82.3% |
| Smartphone | 651 | 71.9% |
| Tablet | 563 | 62.1% |
| No Computing Device | 85 | 9.4% |
| Total | 906 | 100.0% |
Internet Access in Laurel Lake
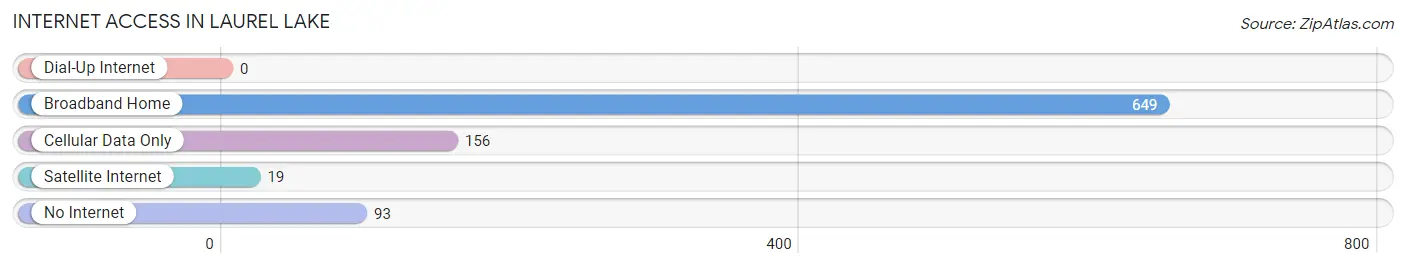
| Internet Type | # Households | % Households |
| Dial-Up Internet | 0 | 0.0% |
| Broadband Home | 649 | 71.6% |
| Cellular Data Only | 156 | 17.2% |
| Satellite Internet | 19 | 2.1% |
| No Internet | 93 | 10.3% |
| Total | 906 | 100.0% |
Laurel Lake Summary
Laurel Lake is a small unincorporated community located in the northern part of Ocean County, New Jersey. It is situated in the Pine Barrens region of the state, and is bordered by the towns of Barnegat, Little Egg Harbor, and Tuckerton. The community is home to a population of approximately 1,000 people, and is known for its rural atmosphere and natural beauty.
History
The area that is now Laurel Lake was originally inhabited by the Lenape Native Americans. The first European settlers arrived in the area in the late 17th century, and the community was officially established in 1790. The town was named after the nearby lake, which was named for the abundance of laurel trees that grew along its banks.
In the 19th century, the town became a popular destination for vacationers, who came to enjoy the area’s natural beauty and peaceful atmosphere. The town was also home to a number of small businesses, including a sawmill, a gristmill, and a general store.
Geography
Laurel Lake is located in the northern part of Ocean County, New Jersey. It is situated in the Pine Barrens region of the state, and is bordered by the towns of Barnegat, Little Egg Harbor, and Tuckerton. The community is located on the banks of the Tuckerton Creek, which flows into the nearby Barnegat Bay.
The town is home to a number of natural attractions, including the Laurel Lake Wildlife Management Area, which is a popular spot for bird watching and fishing. The area is also home to a number of parks and recreational areas, including the Laurel Lake Park, which features a playground, picnic areas, and a walking trail.
Economy
The economy of Laurel Lake is largely based on tourism and recreation. The town is home to a number of small businesses, including restaurants, shops, and lodging. The town is also home to a number of marinas, which offer boat rentals and other services.
The town is also home to a number of agricultural operations, including farms and nurseries. The area is also home to a number of wineries, which produce a variety of wines from locally grown grapes.
Demographics
As of the 2010 census, the population of Laurel Lake was 1,000 people. The racial makeup of the town was 94.2% White, 2.2% African American, 0.7% Asian, 0.3% Native American, and 2.6% from other races. The median household income was $50,000, and the median age was 44.
Conclusion
Laurel Lake is a small unincorporated community located in the northern part of Ocean County, New Jersey. It is situated in the Pine Barrens region of the state, and is bordered by the towns of Barnegat, Little Egg Harbor, and Tuckerton. The community is home to a population of approximately 1,000 people, and is known for its rural atmosphere and natural beauty. The economy of Laurel Lake is largely based on tourism and recreation, and the town is home to a number of small businesses, including restaurants, shops, and lodging. The racial makeup of the town is 94.2% White, 2.2% African American, 0.7% Asian, 0.3% Native American, and 2.6% from other races. The median household income was $50,000, and the median age was 44.
Common Questions
What is Per Capita Income in Laurel Lake?
Per Capita income in Laurel Lake is $25,784.
What is the Median Family Income in Laurel Lake?
Median Family Income in Laurel Lake is $63,864.
What is the Median Household income in Laurel Lake?
Median Household Income in Laurel Lake is $52,321.
What is Income or Wage Gap in Laurel Lake?
Income or Wage Gap in Laurel Lake is 38.7%.
Women in Laurel Lake earn 61.3 cents for every dollar earned by a man.
What is Inequality or Gini Index in Laurel Lake?
Inequality or Gini Index in Laurel Lake is 0.43.
What is the Total Population of Laurel Lake?
Total Population of Laurel Lake is 2,346.
What is the Total Male Population of Laurel Lake?
Total Male Population of Laurel Lake is 1,147.
What is the Total Female Population of Laurel Lake?
Total Female Population of Laurel Lake is 1,199.
What is the Ratio of Males per 100 Females in Laurel Lake?
There are 95.66 Males per 100 Females in Laurel Lake.
What is the Ratio of Females per 100 Males in Laurel Lake?
There are 104.53 Females per 100 Males in Laurel Lake.
What is the Median Population Age in Laurel Lake?
Median Population Age in Laurel Lake is 40.5 Years.
What is the Average Family Size in Laurel Lake
Average Family Size in Laurel Lake is 3.2 People.
What is the Average Household Size in Laurel Lake
Average Household Size in Laurel Lake is 2.6 People.
How Large is the Labor Force in Laurel Lake?
There are 1,069 People in the Labor Forcein in Laurel Lake.
What is the Percentage of People in the Labor Force in Laurel Lake?
61.5% of People are in the Labor Force in Laurel Lake.
What is the Unemployment Rate in Laurel Lake?
Unemployment Rate in Laurel Lake is 6.8%.