Anderson, NJ Map & Demographics
Anderson Map
Anderson Overview
$26,616
PER CAPITA INCOME
$76,913
AVG FAMILY INCOME
$77,405
AVG HOUSEHOLD INCOME
0.21
INEQUALITY / GINI INDEX
664
TOTAL POPULATION
297
MALE POPULATION
367
FEMALE POPULATION
80.93
MALES / 100 FEMALES
123.57
FEMALES / 100 MALES
28.6
MEDIAN AGE
3.4
AVG FAMILY SIZE
3.2
AVG HOUSEHOLD SIZE
336
LABOR FORCE [ PEOPLE ]
60.1%
PERCENT IN LABOR FORCE
5.7%
UNEMPLOYMENT RATE
Income in Anderson
Income Overview in Anderson
Per Capita Income in Anderson is $26,616, while median incomes of families and households are $76,913 and $77,405 respectively.
| Characteristic | Number | Measure |
| Per Capita Income | 664 | $26,616 |
| Median Family Income | 179 | $76,913 |
| Mean Family Income | 179 | $80,396 |
| Median Household Income | 205 | $77,405 |
| Mean Household Income | 205 | $82,970 |
| Income Deficit | 179 | $0 |
| Wage / Income Gap (%) | 664 | 0.00% |
| Wage / Income Gap ($) | 664 | 100.00¢ per $1 |
| Gini / Inequality Index | 664 | 0.21 |
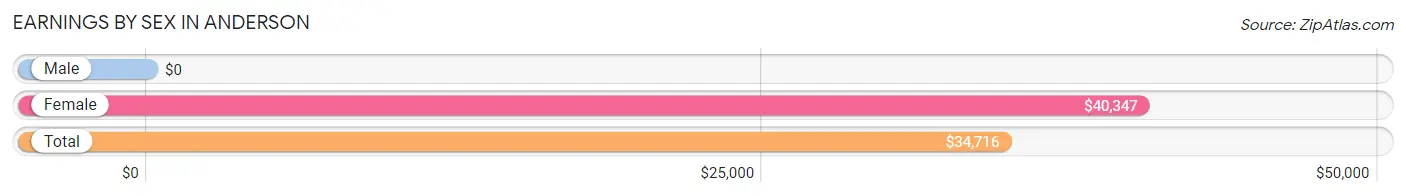
Earnings by Sex in Anderson
| Sex | Number | Average Earnings |
| Male | 180 (56.8%) | $0 |
| Female | 137 (43.2%) | $40,347 |
| Total | 317 (100.0%) | $34,716 |
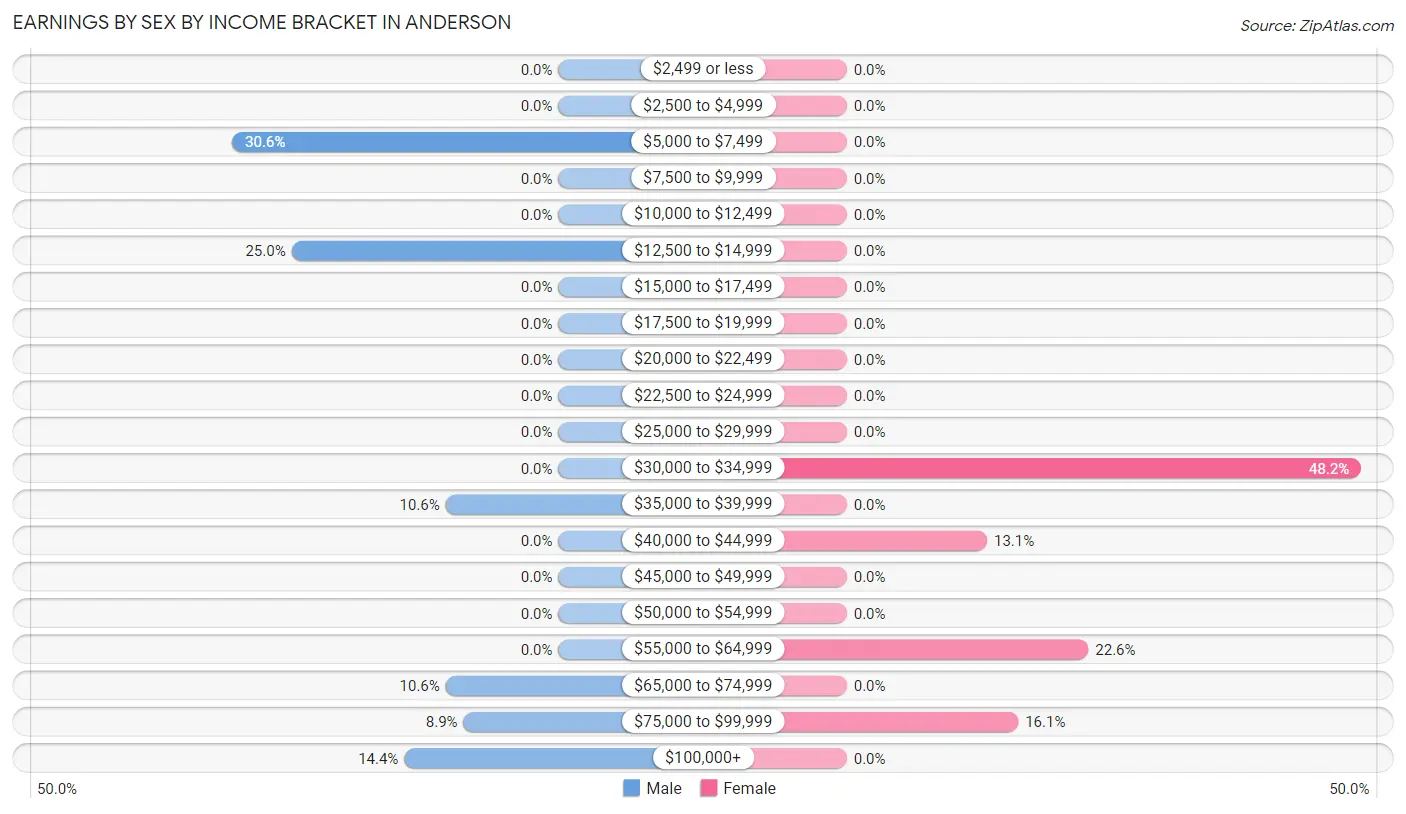
Earnings by Sex by Income Bracket in Anderson
The most common earnings brackets in Anderson are $5,000 to $7,499 for men (55 | 30.6%) and $30,000 to $34,999 for women (66 | 48.2%).
| Income | Male | Female |
| $2,499 or less | 0 (0.0%) | 0 (0.0%) |
| $2,500 to $4,999 | 0 (0.0%) | 0 (0.0%) |
| $5,000 to $7,499 | 55 (30.6%) | 0 (0.0%) |
| $7,500 to $9,999 | 0 (0.0%) | 0 (0.0%) |
| $10,000 to $12,499 | 0 (0.0%) | 0 (0.0%) |
| $12,500 to $14,999 | 45 (25.0%) | 0 (0.0%) |
| $15,000 to $17,499 | 0 (0.0%) | 0 (0.0%) |
| $17,500 to $19,999 | 0 (0.0%) | 0 (0.0%) |
| $20,000 to $22,499 | 0 (0.0%) | 0 (0.0%) |
| $22,500 to $24,999 | 0 (0.0%) | 0 (0.0%) |
| $25,000 to $29,999 | 0 (0.0%) | 0 (0.0%) |
| $30,000 to $34,999 | 0 (0.0%) | 66 (48.2%) |
| $35,000 to $39,999 | 19 (10.6%) | 0 (0.0%) |
| $40,000 to $44,999 | 0 (0.0%) | 18 (13.1%) |
| $45,000 to $49,999 | 0 (0.0%) | 0 (0.0%) |
| $50,000 to $54,999 | 0 (0.0%) | 0 (0.0%) |
| $55,000 to $64,999 | 0 (0.0%) | 31 (22.6%) |
| $65,000 to $74,999 | 19 (10.6%) | 0 (0.0%) |
| $75,000 to $99,999 | 16 (8.9%) | 22 (16.1%) |
| $100,000+ | 26 (14.4%) | 0 (0.0%) |
| Total | 180 (100.0%) | 137 (100.0%) |
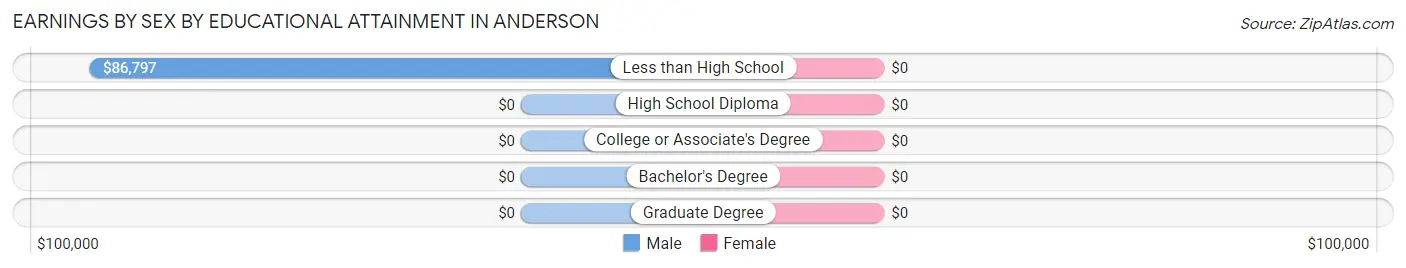
Earnings by Sex by Educational Attainment in Anderson
| Educational Attainment | Male Income | Female Income |
| Less than High School | $86,797 | $0 |
| High School Diploma | - | - |
| College or Associate's Degree | - | - |
| Bachelor's Degree | - | - |
| Graduate Degree | - | - |
| Total | - | - |
Family Income in Anderson
Family Income Brackets in Anderson
According to the Anderson family income data, there are 101 families falling into the $75,000 to $99,999 income range, which is the most common income bracket and makes up 56.4% of all families.
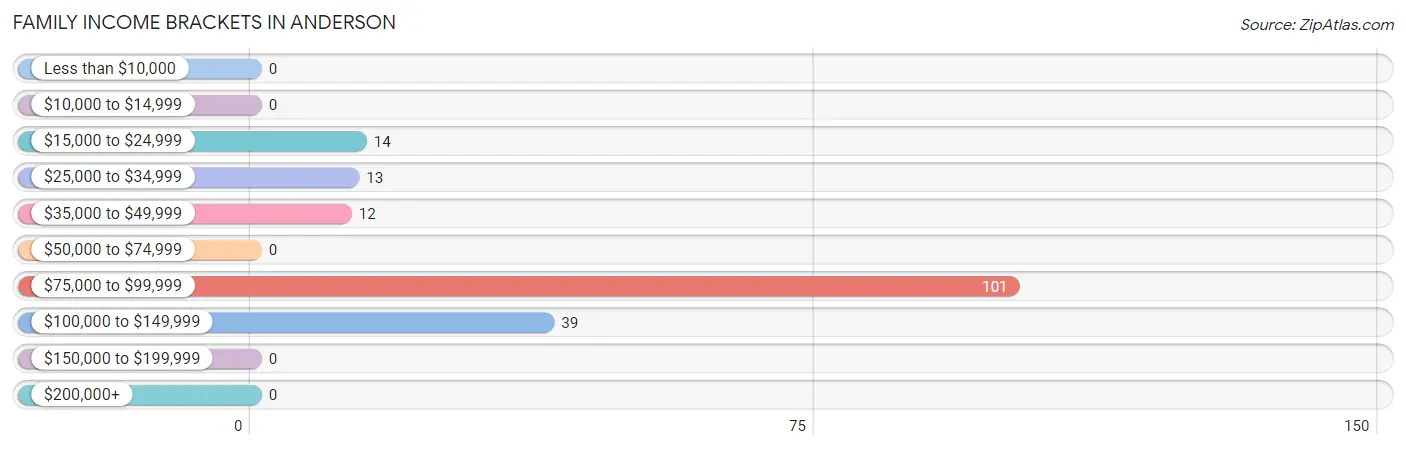
| Income Bracket | # Families | % Families |
| Less than $10,000 | 0 | 0.0% |
| $10,000 to $14,999 | 0 | 0.0% |
| $15,000 to $24,999 | 14 | 7.8% |
| $25,000 to $34,999 | 13 | 7.3% |
| $35,000 to $49,999 | 12 | 6.7% |
| $50,000 to $74,999 | 0 | 0.0% |
| $75,000 to $99,999 | 101 | 56.4% |
| $100,000 to $149,999 | 39 | 21.8% |
| $150,000 to $199,999 | 0 | 0.0% |
| $200,000+ | 0 | 0.0% |
Family Income by Famaliy Size in Anderson
3-person families (103 | 57.5%) account for the highest median family income in Anderson with $76,951 per family, while 3-person families (103 | 57.5%) have the highest median income of $25,650 per family member.
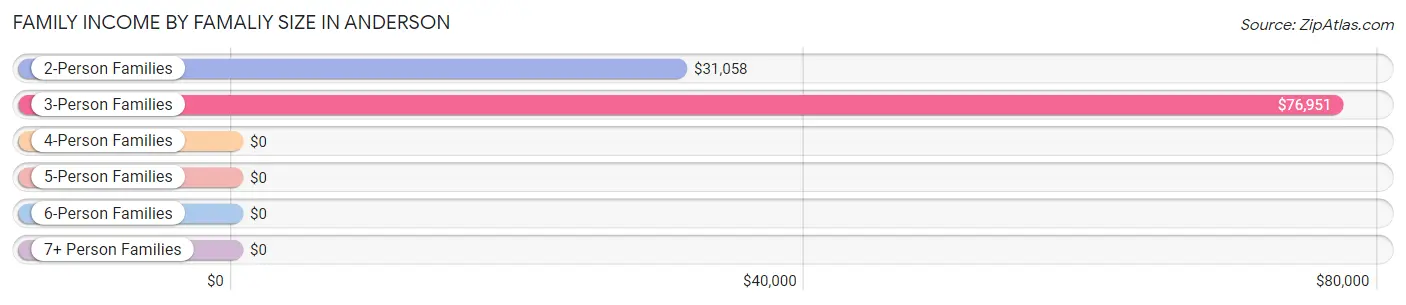
| Income Bracket | # Families | Median Income |
| 2-Person Families | 39 (21.8%) | $31,058 |
| 3-Person Families | 103 (57.5%) | $76,951 |
| 4-Person Families | 19 (10.6%) | $0 |
| 5-Person Families | 0 (0.0%) | $0 |
| 6-Person Families | 18 (10.1%) | $0 |
| 7+ Person Families | 0 (0.0%) | $0 |
| Total | 179 (100.0%) | $76,913 |
Family Income by Number of Earners in Anderson
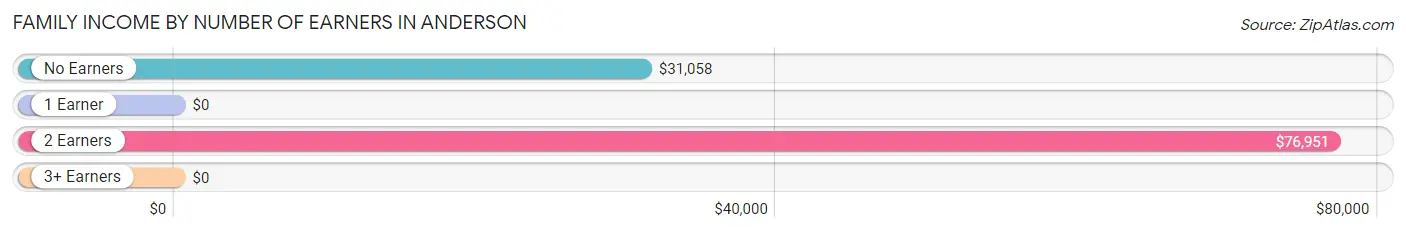
| Number of Earners | # Families | Median Income |
| No Earners | 39 (21.8%) | $31,058 |
| 1 Earner | 16 (8.9%) | $0 |
| 2 Earners | 103 (57.5%) | $76,951 |
| 3+ Earners | 21 (11.7%) | $0 |
| Total | 179 (100.0%) | $76,913 |
Household Income in Anderson
Household Income Brackets in Anderson
With 101 households falling in the category, the $75,000 to $99,999 income range is the most frequent in Anderson, accounting for 49.3% of all households.
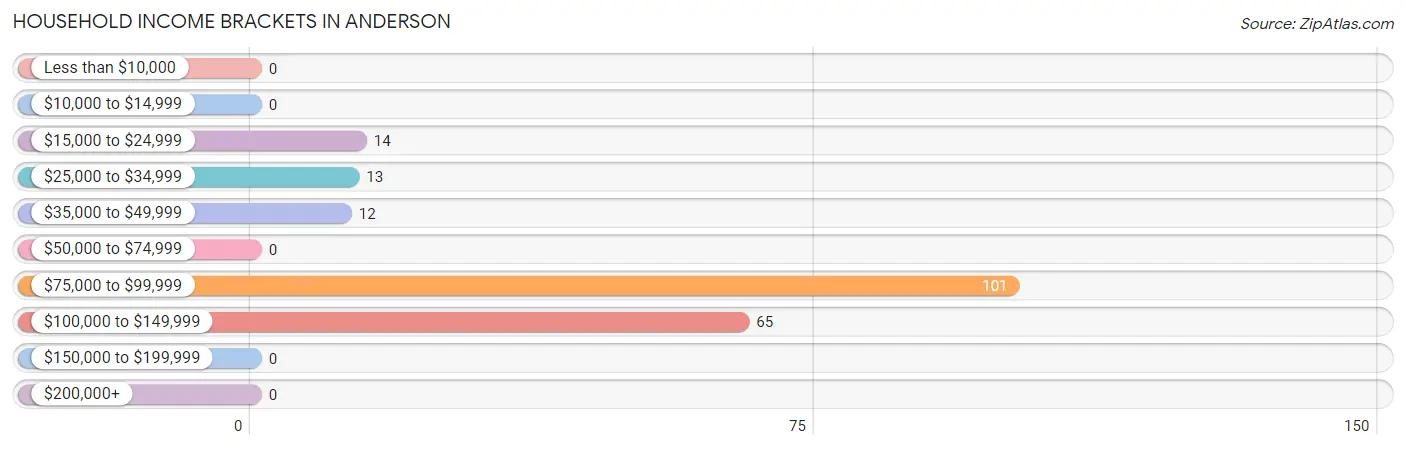
| Income Bracket | # Households | % Households |
| Less than $10,000 | 0 | 0.0% |
| $10,000 to $14,999 | 0 | 0.0% |
| $15,000 to $24,999 | 14 | 6.8% |
| $25,000 to $34,999 | 13 | 6.3% |
| $35,000 to $49,999 | 12 | 5.9% |
| $50,000 to $74,999 | 0 | 0.0% |
| $75,000 to $99,999 | 101 | 49.3% |
| $100,000 to $149,999 | 65 | 31.7% |
| $150,000 to $199,999 | 0 | 0.0% |
| $200,000+ | 0 | 0.0% |
Household Income by Householder Age in Anderson
The median household income in Anderson is $77,405, with the highest median household income of $102,212 found in the 45 to 64 years age bracket for the primary householder. A total of 84 households (41.0%) fall into this category.
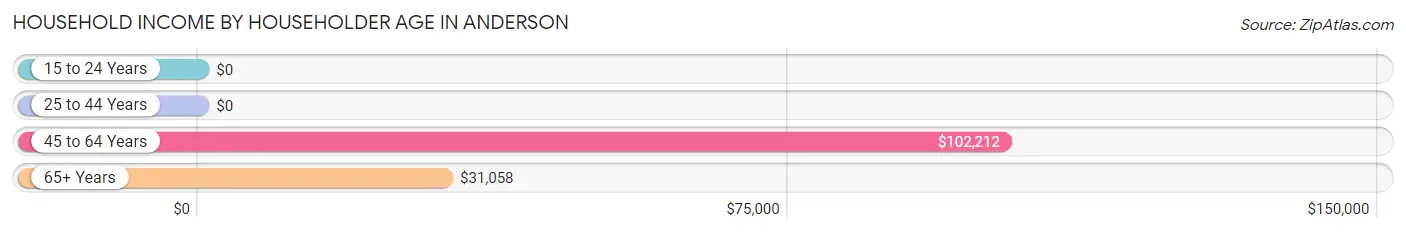
| Income Bracket | # Households | Median Income |
| 15 to 24 Years | 0 (0.0%) | $0 |
| 25 to 44 Years | 82 (40.0%) | $0 |
| 45 to 64 Years | 84 (41.0%) | $102,212 |
| 65+ Years | 39 (19.0%) | $31,058 |
| Total | 205 (100.0%) | $77,405 |
Poverty in Anderson
Income Below Poverty by Sex and Age in Anderson
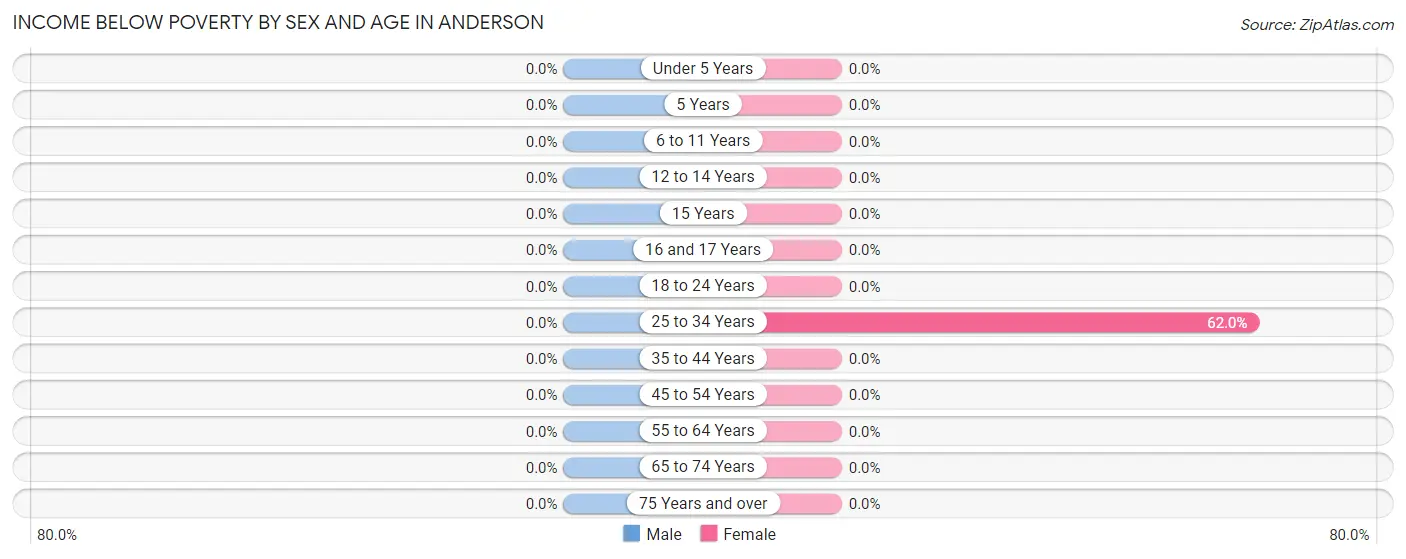
| Age Bracket | Male | Female |
| Under 5 Years | 0 (0.0%) | 0 (0.0%) |
| 5 Years | 0 (0.0%) | 0 (0.0%) |
| 6 to 11 Years | 0 (0.0%) | 0 (0.0%) |
| 12 to 14 Years | 0 (0.0%) | 0 (0.0%) |
| 15 Years | 0 (0.0%) | 0 (0.0%) |
| 16 and 17 Years | 0 (0.0%) | 0 (0.0%) |
| 18 to 24 Years | 0 (0.0%) | 0 (0.0%) |
| 25 to 34 Years | 0 (0.0%) | 31 (62.0%) |
| 35 to 44 Years | 0 (0.0%) | 0 (0.0%) |
| 45 to 54 Years | 0 (0.0%) | 0 (0.0%) |
| 55 to 64 Years | 0 (0.0%) | 0 (0.0%) |
| 65 to 74 Years | 0 (0.0%) | 0 (0.0%) |
| 75 Years and over | 0 (0.0%) | 0 (0.0%) |
| Total | 0 (0.0%) | 31 (8.5%) |
Income Above Poverty by Sex and Age in Anderson
According to the poverty statistics in Anderson, males aged 16 and 17 years and females aged under 5 years are the age groups that are most secure financially, with 100.0% of males and 100.0% of females in these age groups living above the poverty line.
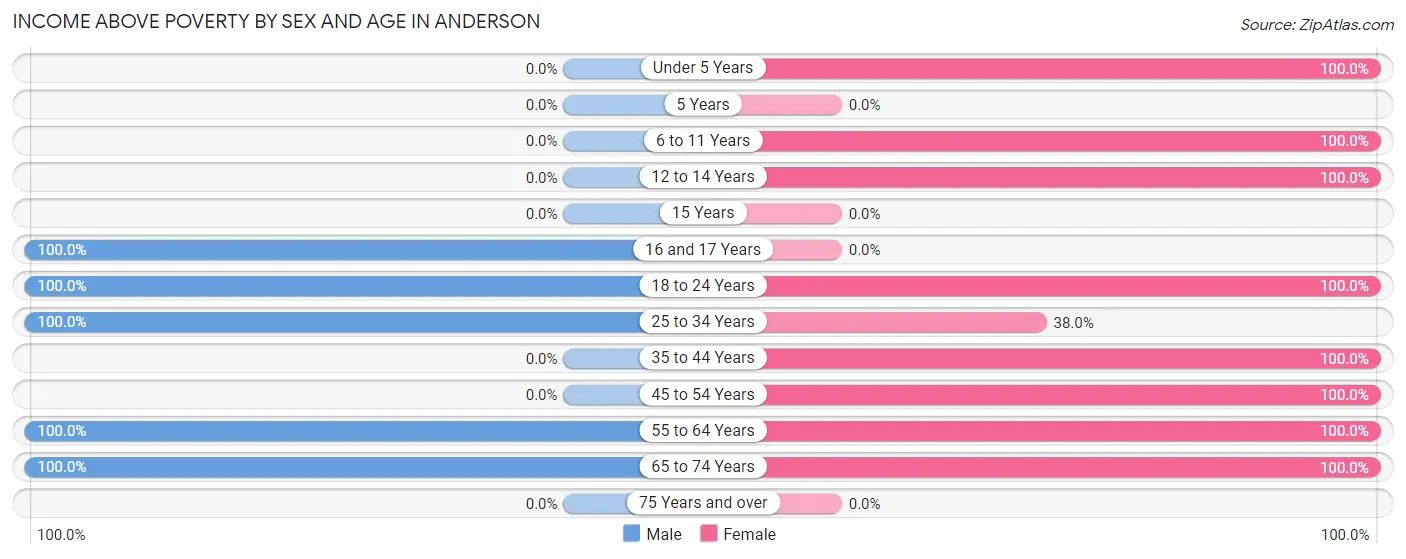
| Age Bracket | Male | Female |
| Under 5 Years | 0 (0.0%) | 31 (100.0%) |
| 5 Years | 0 (0.0%) | 0 (0.0%) |
| 6 to 11 Years | 0 (0.0%) | 56 (100.0%) |
| 12 to 14 Years | 0 (0.0%) | 18 (100.0%) |
| 15 Years | 0 (0.0%) | 0 (0.0%) |
| 16 and 17 Years | 78 (100.0%) | 0 (0.0%) |
| 18 to 24 Years | 24 (100.0%) | 31 (100.0%) |
| 25 to 34 Years | 71 (100.0%) | 19 (38.0%) |
| 35 to 44 Years | 0 (0.0%) | 84 (100.0%) |
| 45 to 54 Years | 0 (0.0%) | 22 (100.0%) |
| 55 to 64 Years | 85 (100.0%) | 35 (100.0%) |
| 65 to 74 Years | 39 (100.0%) | 40 (100.0%) |
| 75 Years and over | 0 (0.0%) | 0 (0.0%) |
| Total | 297 (100.0%) | 336 (91.5%) |
Income Below Poverty Among Married-Couple Families in Anderson
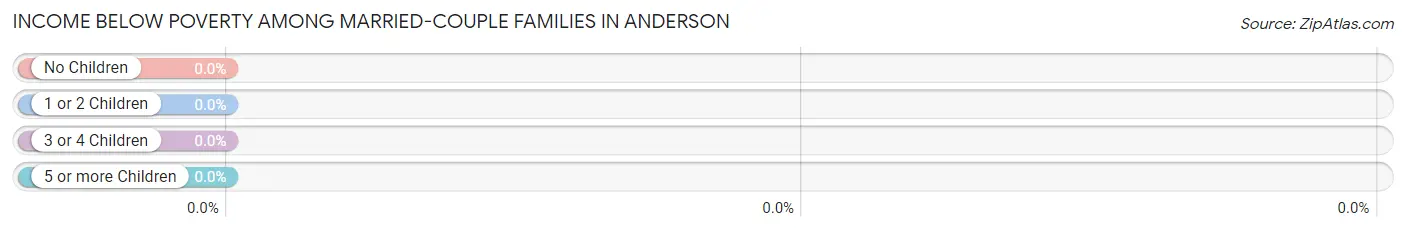
| Children | Above Poverty | Below Poverty |
| No Children | 46 (100.0%) | 0 (0.0%) |
| 1 or 2 Children | 37 (100.0%) | 0 (0.0%) |
| 3 or 4 Children | 0 (0.0%) | 0 (0.0%) |
| 5 or more Children | 0 (0.0%) | 0 (0.0%) |
| Total | 83 (100.0%) | 0 (0.0%) |
Income Below Poverty Among Single-Parent Households in Anderson
| Children | Single Father | Single Mother |
| No Children | 0 (0.0%) | 0 (0.0%) |
| 1 or 2 Children | 0 (0.0%) | 0 (0.0%) |
| 3 or 4 Children | 0 (0.0%) | 0 (0.0%) |
| 5 or more Children | 0 (0.0%) | 0 (0.0%) |
| Total | 0 (0.0%) | 0 (0.0%) |
Income Below Poverty Among Married-Couple vs Single-Parent Households in Anderson
| Children | Married-Couple Families | Single-Parent Households |
| No Children | 0 (0.0%) | 0 (0.0%) |
| 1 or 2 Children | 0 (0.0%) | 0 (0.0%) |
| 3 or 4 Children | 0 (0.0%) | 0 (0.0%) |
| 5 or more Children | 0 (0.0%) | 0 (0.0%) |
| Total | 0 (0.0%) | 0 (0.0%) |
Race in Anderson
The most populous races in Anderson are White / Caucasian (310 | 46.7%), Two or more Races (251 | 37.8%), and Hispanic or Latino (151 | 22.7%).
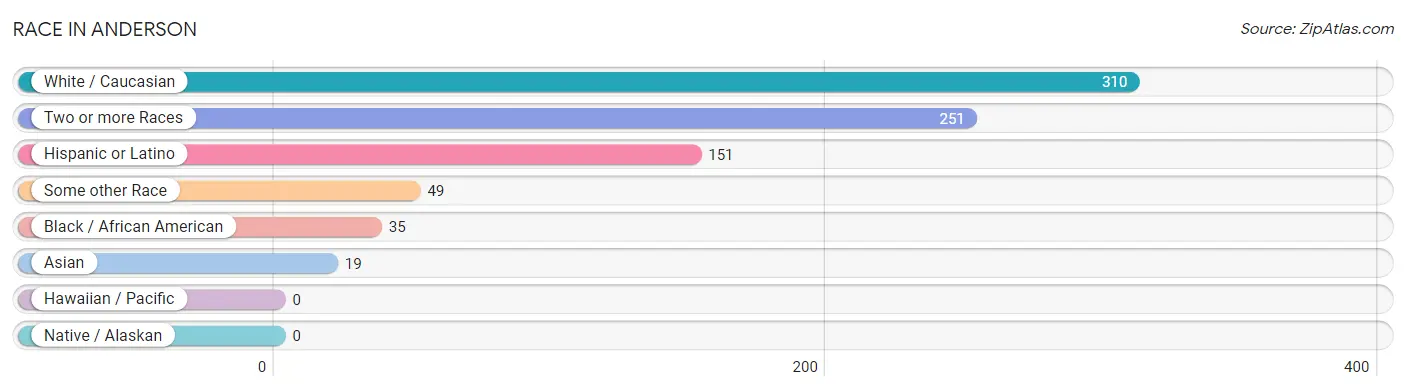
| Race | # Population | % Population |
| Asian | 19 | 2.9% |
| Black / African American | 35 | 5.3% |
| Hawaiian / Pacific | 0 | 0.0% |
| Hispanic or Latino | 151 | 22.7% |
| Native / Alaskan | 0 | 0.0% |
| White / Caucasian | 310 | 46.7% |
| Two or more Races | 251 | 37.8% |
| Some other Race | 49 | 7.4% |
| Total | 664 | 100.0% |
Ancestry in Anderson
The most populous ancestries reported in Anderson are Italian (116 | 17.5%), South American (96 | 14.5%), Irish (86 | 13.0%), Colombian (80 | 12.0%), and Dominican (55 | 8.3%), together accounting for 65.2% of all Anderson residents.
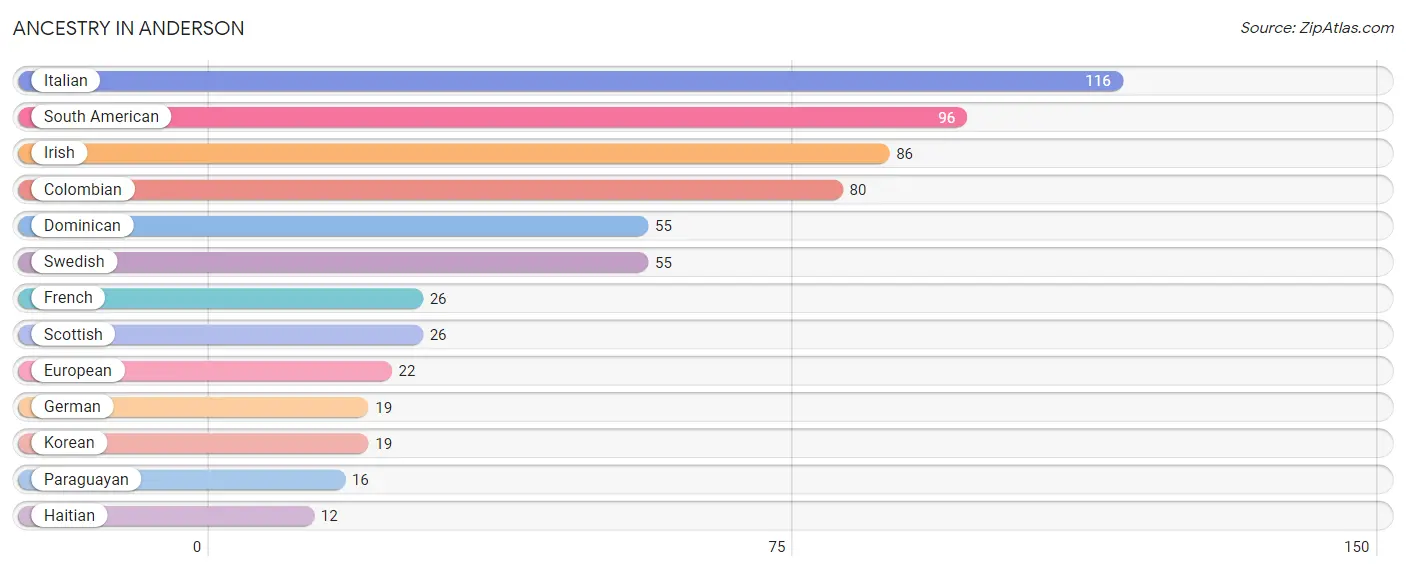
| Ancestry | # Population | % Population |
| Colombian | 80 | 12.0% |
| Dominican | 55 | 8.3% |
| European | 22 | 3.3% |
| French | 26 | 3.9% |
| German | 19 | 2.9% |
| Haitian | 12 | 1.8% |
| Irish | 86 | 13.0% |
| Italian | 116 | 17.5% |
| Korean | 19 | 2.9% |
| Paraguayan | 16 | 2.4% |
| Scottish | 26 | 3.9% |
| South American | 96 | 14.5% |
| Swedish | 55 | 8.3% | View All 13 Rows |
Immigrants in Anderson
The most numerous immigrant groups reported in Anderson came from Latin America (59 | 8.9%), South America (47 | 7.1%), Colombia (31 | 4.7%), Asia (19 | 2.9%), and Philippines (19 | 2.9%), together accounting for 26.4% of all Anderson residents.
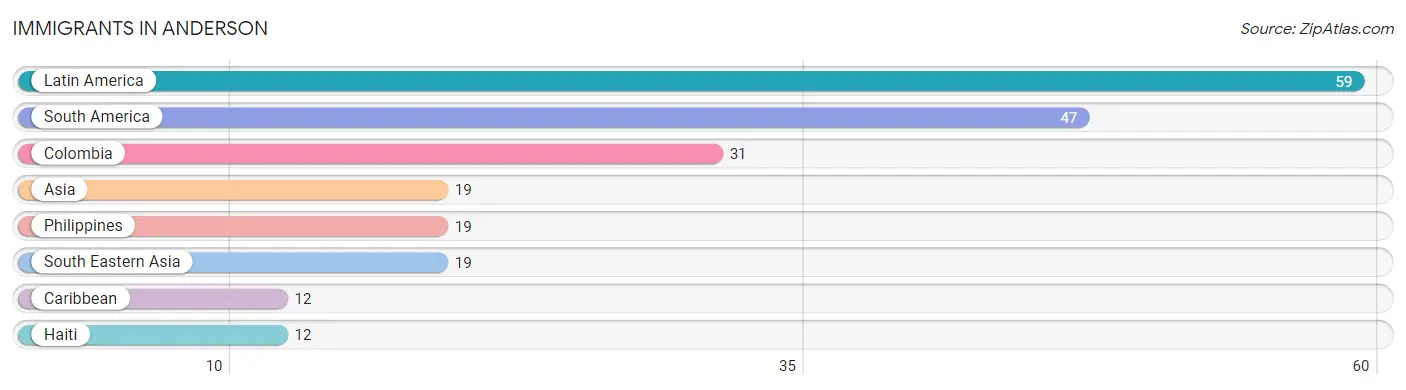
| Immigration Origin | # Population | % Population |
| Asia | 19 | 2.9% |
| Caribbean | 12 | 1.8% |
| Colombia | 31 | 4.7% |
| Haiti | 12 | 1.8% |
| Latin America | 59 | 8.9% |
| Philippines | 19 | 2.9% |
| South America | 47 | 7.1% |
| South Eastern Asia | 19 | 2.9% | View All 8 Rows |
Sex and Age in Anderson
Sex and Age in Anderson
The most populous age groups in Anderson are 15 to 19 Years (78 | 26.3%) for men and 40 to 44 Years (66 | 18.0%) for women.
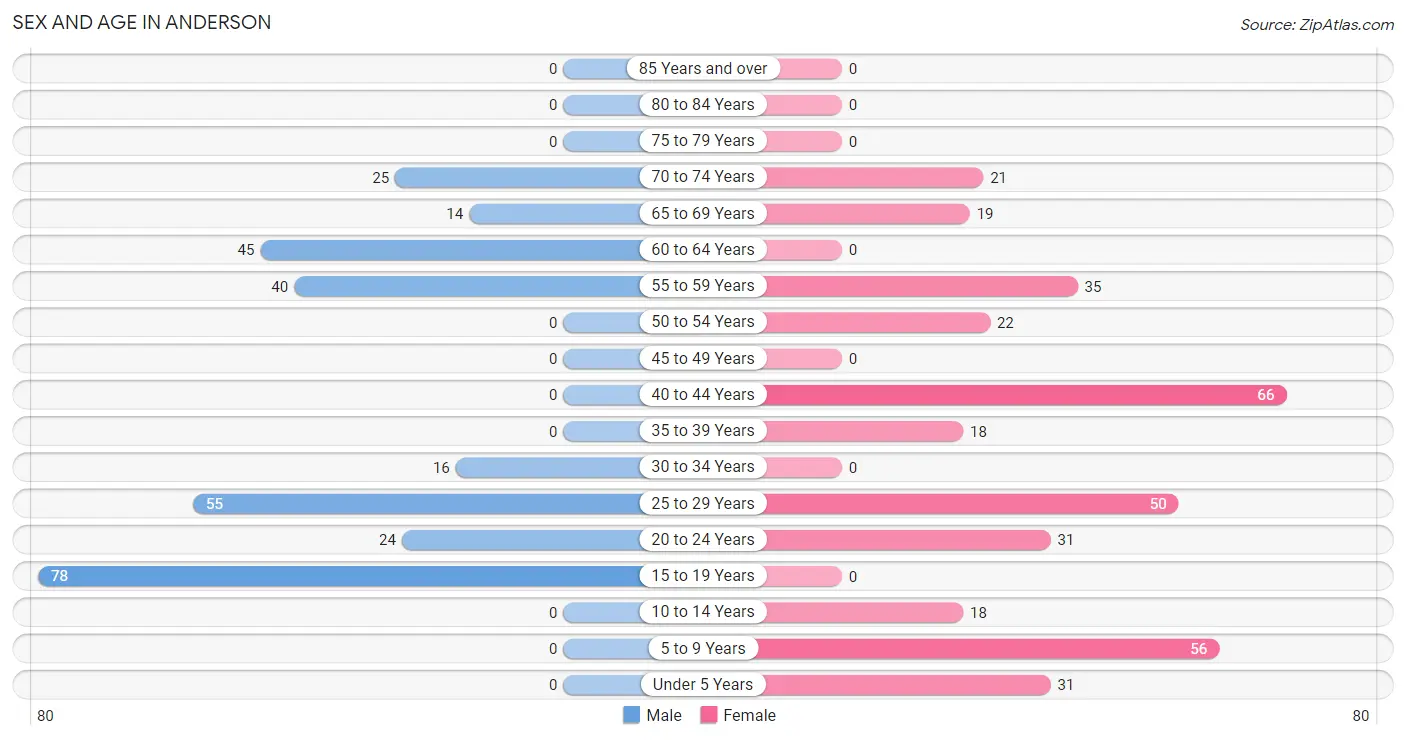
| Age Bracket | Male | Female |
| Under 5 Years | 0 (0.0%) | 31 (8.5%) |
| 5 to 9 Years | 0 (0.0%) | 56 (15.3%) |
| 10 to 14 Years | 0 (0.0%) | 18 (4.9%) |
| 15 to 19 Years | 78 (26.3%) | 0 (0.0%) |
| 20 to 24 Years | 24 (8.1%) | 31 (8.5%) |
| 25 to 29 Years | 55 (18.5%) | 50 (13.6%) |
| 30 to 34 Years | 16 (5.4%) | 0 (0.0%) |
| 35 to 39 Years | 0 (0.0%) | 18 (4.9%) |
| 40 to 44 Years | 0 (0.0%) | 66 (18.0%) |
| 45 to 49 Years | 0 (0.0%) | 0 (0.0%) |
| 50 to 54 Years | 0 (0.0%) | 22 (6.0%) |
| 55 to 59 Years | 40 (13.5%) | 35 (9.5%) |
| 60 to 64 Years | 45 (15.1%) | 0 (0.0%) |
| 65 to 69 Years | 14 (4.7%) | 19 (5.2%) |
| 70 to 74 Years | 25 (8.4%) | 21 (5.7%) |
| 75 to 79 Years | 0 (0.0%) | 0 (0.0%) |
| 80 to 84 Years | 0 (0.0%) | 0 (0.0%) |
| 85 Years and over | 0 (0.0%) | 0 (0.0%) |
| Total | 297 (100.0%) | 367 (100.0%) |
Families and Households in Anderson
Median Family Size in Anderson
The median family size in Anderson is 3.39 persons per family, with married-couple families (83 | 46.4%) accounting for the largest median family size of 3.86 persons per family. On the other hand, single male/father families (30 | 16.8%) represent the smallest median family size with 2.93 persons per family.
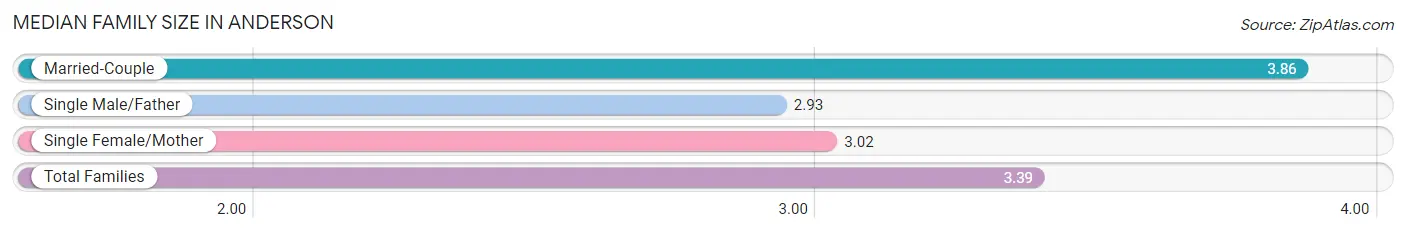
| Family Type | # Families | Family Size |
| Married-Couple | 83 (46.4%) | 3.86 |
| Single Male/Father | 30 (16.8%) | 2.93 |
| Single Female/Mother | 66 (36.9%) | 3.02 |
| Total Families | 179 (100.0%) | 3.39 |
Median Household Size in Anderson
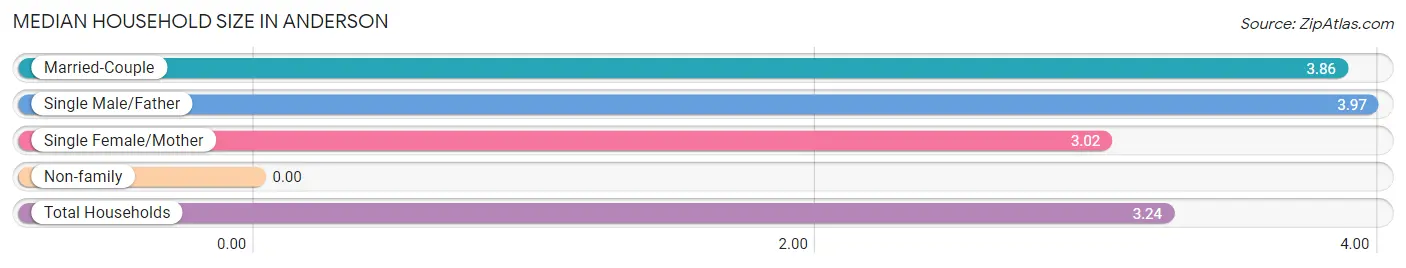
| Household Type | # Households | Household Size |
| Married-Couple | 83 (40.5%) | 3.86 |
| Single Male/Father | 30 (14.6%) | 3.97 |
| Single Female/Mother | 66 (32.2%) | 3.02 |
| Non-family | 26 (12.7%) | - |
| Total Households | 205 (100.0%) | 3.24 |
Household Size by Marriage Status in Anderson
Out of a total of 205 households in Anderson, 179 (87.3%) are family households, while 26 (12.7%) are nonfamily households. The most numerous type of family households are 3-person households, comprising 87, and the most common type of nonfamily households are 1-person households, comprising 26.
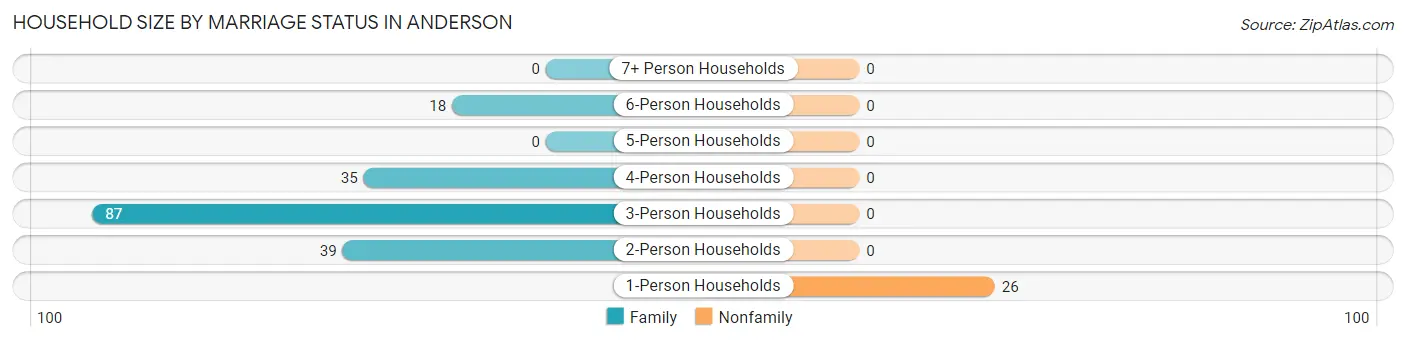
| Household Size | Family Households | Nonfamily Households |
| 1-Person Households | - | 26 (12.7%) |
| 2-Person Households | 39 (19.0%) | 0 (0.0%) |
| 3-Person Households | 87 (42.4%) | 0 (0.0%) |
| 4-Person Households | 35 (17.1%) | 0 (0.0%) |
| 5-Person Households | 0 (0.0%) | 0 (0.0%) |
| 6-Person Households | 18 (8.8%) | 0 (0.0%) |
| 7+ Person Households | 0 (0.0%) | 0 (0.0%) |
| Total | 179 (87.3%) | 26 (12.7%) |
Female Fertility in Anderson
Fertility by Age in Anderson
| Age Bracket | Women with Births | Births / 1,000 Women |
| 15 to 19 years | 0 (0.0%) | 0.0 |
| 20 to 34 years | 0 (0.0%) | 0.0 |
| 35 to 50 years | 0 (0.0%) | 0.0 |
| Total | 0 (0.0%) | 0.0 |
Fertility by Age by Marriage Status in Anderson
| Age Bracket | Married | Unmarried |
| 15 to 19 years | 0 (0.0%) | 0 (0.0%) |
| 20 to 34 years | 0 (0.0%) | 0 (0.0%) |
| 35 to 50 years | 0 (0.0%) | 0 (0.0%) |
| Total | 0 (0.0%) | 0 (0.0%) |
Fertility by Education in Anderson
| Educational Attainment | Women with Births | Births / 1,000 Women |
| Less than High School | 0 (0.0%) | 0.0 |
| High School Diploma | 0 (0.0%) | 0.0 |
| College or Associate's Degree | 0 (0.0%) | 0.0 |
| Bachelor's Degree | 0 (0.0%) | 0.0 |
| Graduate Degree | 0 (0.0%) | 0.0 |
| Total | 0 (0.0%) | 0.0 |
Fertility by Education by Marriage Status in Anderson
| Educational Attainment | Married | Unmarried |
| Less than High School | 0 (0.0%) | 0 (0.0%) |
| High School Diploma | 0 (0.0%) | 0 (0.0%) |
| College or Associate's Degree | 0 (0.0%) | 0 (0.0%) |
| Bachelor's Degree | 0 (0.0%) | 0 (0.0%) |
| Graduate Degree | 0 (0.0%) | 0 (0.0%) |
| Total | 0 (0.0%) | 0 (0.0%) |
Employment Characteristics in Anderson
Employment by Class of Employer in Anderson
Among the 298 employed individuals in Anderson, private company employees (171 | 57.4%), state government employees (66 | 22.2%), and not-for-profit organizations (43 | 14.4%) make up the most common classes of employment.
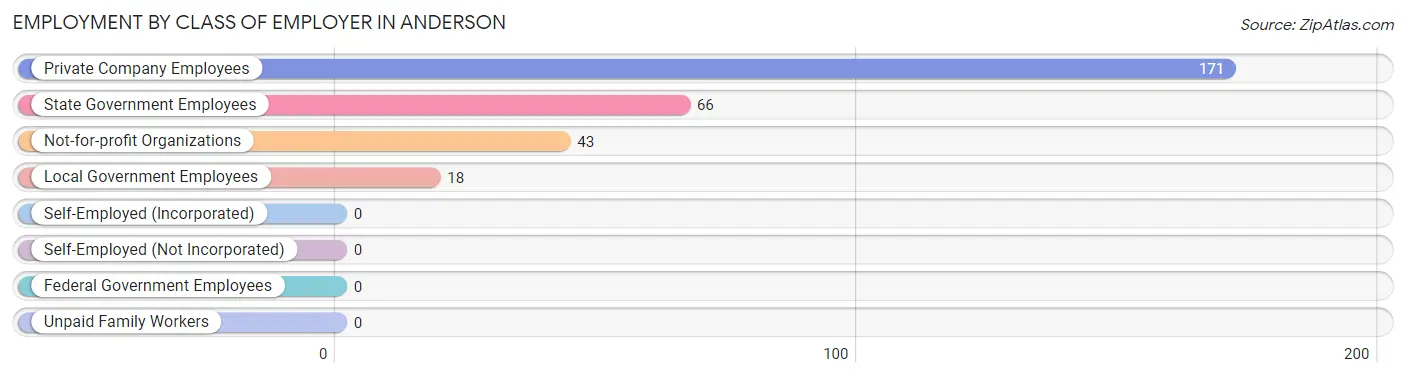
| Employer Class | # Employees | % Employees |
| Private Company Employees | 171 | 57.4% |
| Self-Employed (Incorporated) | 0 | 0.0% |
| Self-Employed (Not Incorporated) | 0 | 0.0% |
| Not-for-profit Organizations | 43 | 14.4% |
| Local Government Employees | 18 | 6.0% |
| State Government Employees | 66 | 22.2% |
| Federal Government Employees | 0 | 0.0% |
| Unpaid Family Workers | 0 | 0.0% |
| Total | 298 | 100.0% |
Employment Status by Age in Anderson
According to the labor force statistics for Anderson, out of the total population over 16 years of age (559), 60.1% or 336 individuals are in the labor force, with 5.7% or 19 of them unemployed. The age group with the highest labor force participation rate is 20 to 24 years, with 100.0% or 55 individuals in the labor force. Within the labor force, the 25 to 29 years age range has the highest percentage of unemployed individuals, with 25.7% or 19 of them being unemployed.
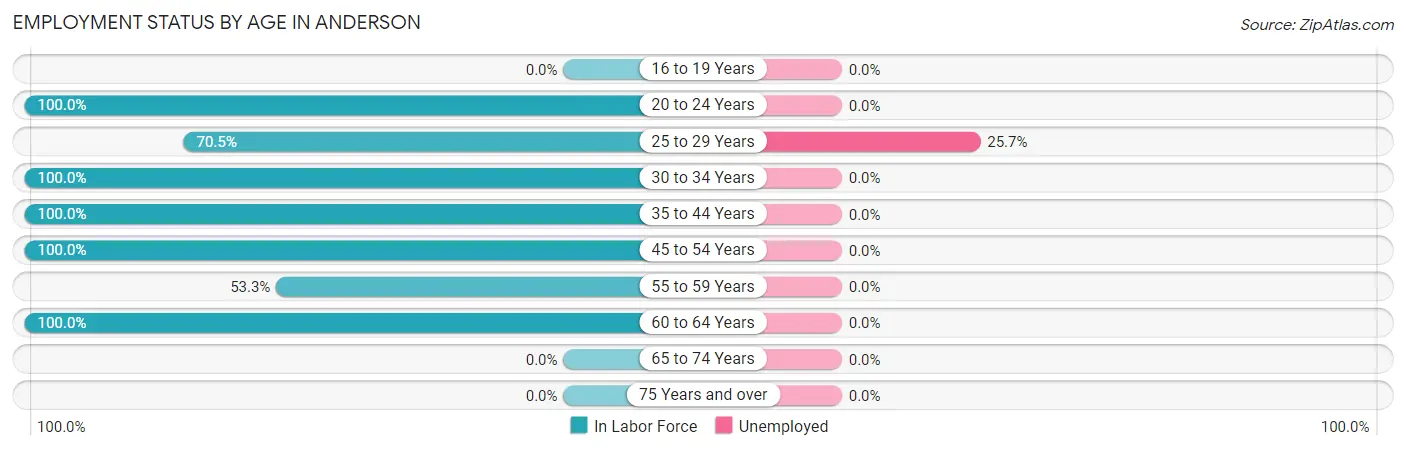
| Age Bracket | In Labor Force | Unemployed |
| 16 to 19 Years | 0 (0.0%) | 0 (0.0%) |
| 20 to 24 Years | 55 (100.0%) | 0 (0.0%) |
| 25 to 29 Years | 74 (70.5%) | 19 (25.7%) |
| 30 to 34 Years | 16 (100.0%) | 0 (0.0%) |
| 35 to 44 Years | 84 (100.0%) | 0 (0.0%) |
| 45 to 54 Years | 22 (100.0%) | 0 (0.0%) |
| 55 to 59 Years | 40 (53.3%) | 0 (0.0%) |
| 60 to 64 Years | 45 (100.0%) | 0 (0.0%) |
| 65 to 74 Years | 0 (0.0%) | 0 (0.0%) |
| 75 Years and over | 0 (0.0%) | 0 (0.0%) |
| Total | 336 (60.1%) | 19 (5.7%) |
Employment Status by Educational Attainment in Anderson
According to labor force statistics for Anderson, 81.0% of individuals (281) out of the total population between 25 and 64 years of age (347) are in the labor force, with 6.8% or 19 of them being unemployed. The group with the highest labor force participation rate are those with the educational attainment of college / associate degree, with 100.0% or 142 individuals in the labor force. Within the labor force, individuals with bachelor's degree or higher education have the highest percentage of unemployment, with 31.7% or 19 of them being unemployed.
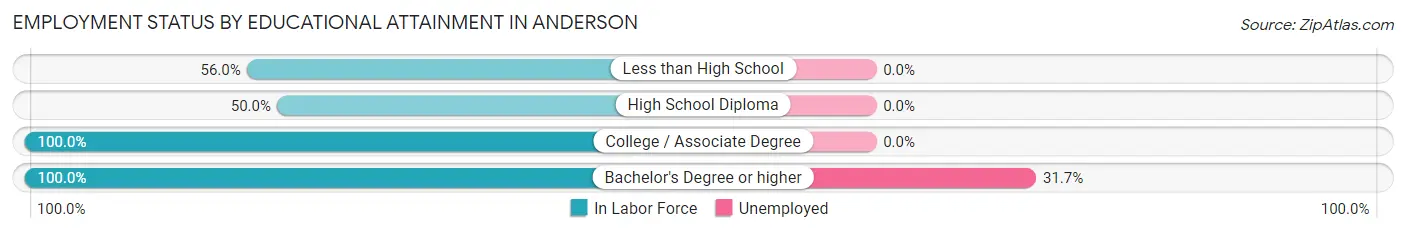
| Educational Attainment | In Labor Force | Unemployed |
| Less than High School | 61 (56.0%) | 0 (0.0%) |
| High School Diploma | 18 (50.0%) | 0 (0.0%) |
| College / Associate Degree | 142 (100.0%) | 0 (0.0%) |
| Bachelor's Degree or higher | 60 (100.0%) | 19 (31.7%) |
| Total | 281 (81.0%) | 24 (6.8%) |
Employment Occupations by Sex in Anderson
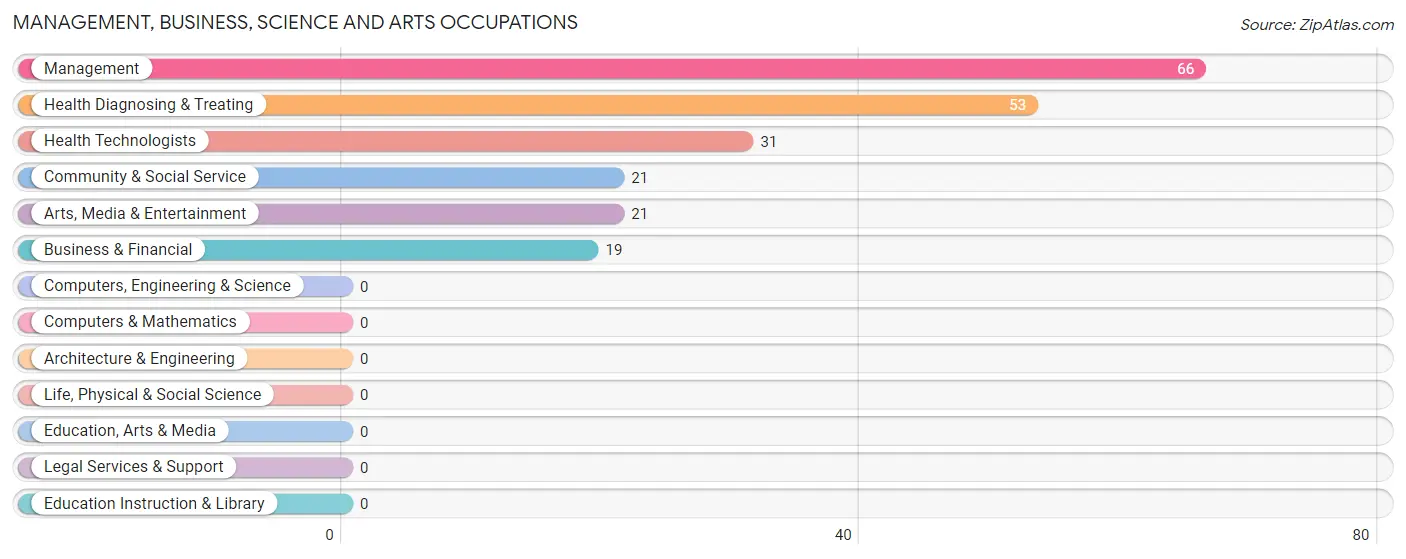
Management, Business, Science and Arts Occupations
The most common Management, Business, Science and Arts occupations in Anderson are Management (66 | 20.8%), Health Diagnosing & Treating (53 | 16.7%), Health Technologists (31 | 9.8%), Community & Social Service (21 | 6.6%), and Arts, Media & Entertainment (21 | 6.6%).
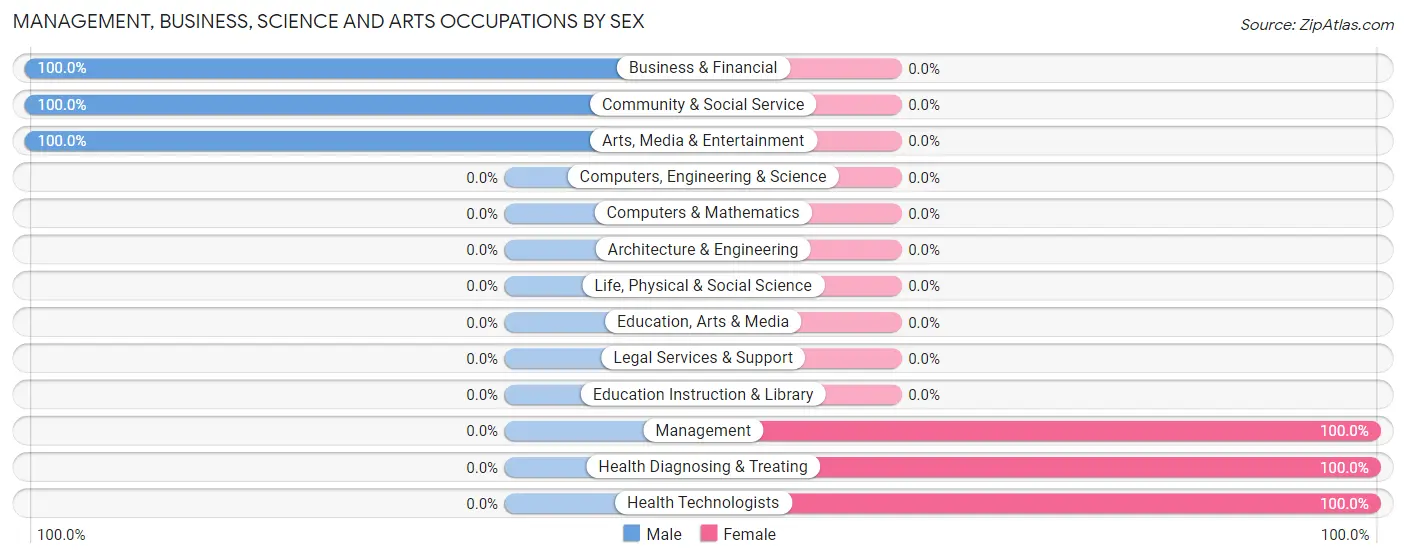
Management, Business, Science and Arts Occupations by Sex
Within the Management, Business, Science and Arts occupations in Anderson, the most male-oriented occupations are Business & Financial (100.0%), Community & Social Service (100.0%), and Arts, Media & Entertainment (100.0%), while the most female-oriented occupations are Management (100.0%), Health Diagnosing & Treating (100.0%), and Health Technologists (100.0%).
| Occupation | Male | Female |
| Management | 0 (0.0%) | 66 (100.0%) |
| Business & Financial | 19 (100.0%) | 0 (0.0%) |
| Computers, Engineering & Science | 0 (0.0%) | 0 (0.0%) |
| Computers & Mathematics | 0 (0.0%) | 0 (0.0%) |
| Architecture & Engineering | 0 (0.0%) | 0 (0.0%) |
| Life, Physical & Social Science | 0 (0.0%) | 0 (0.0%) |
| Community & Social Service | 21 (100.0%) | 0 (0.0%) |
| Education, Arts & Media | 0 (0.0%) | 0 (0.0%) |
| Legal Services & Support | 0 (0.0%) | 0 (0.0%) |
| Education Instruction & Library | 0 (0.0%) | 0 (0.0%) |
| Arts, Media & Entertainment | 21 (100.0%) | 0 (0.0%) |
| Health Diagnosing & Treating | 0 (0.0%) | 53 (100.0%) |
| Health Technologists | 0 (0.0%) | 31 (100.0%) |
| Total (Category) | 40 (25.2%) | 119 (74.8%) |
| Total (Overall) | 180 (56.8%) | 137 (43.2%) |
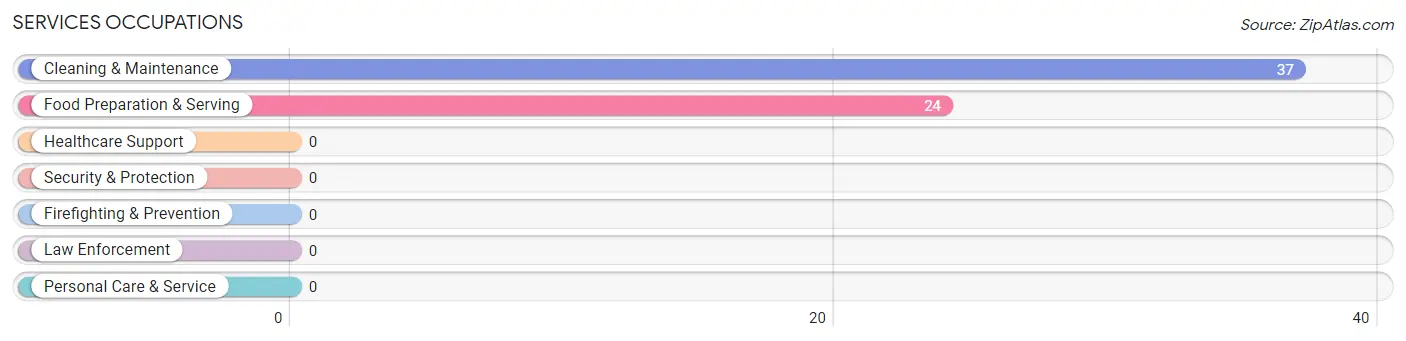
Services Occupations
The most common Services occupations in Anderson are Cleaning & Maintenance (37 | 11.7%), and Food Preparation & Serving (24 | 7.6%).
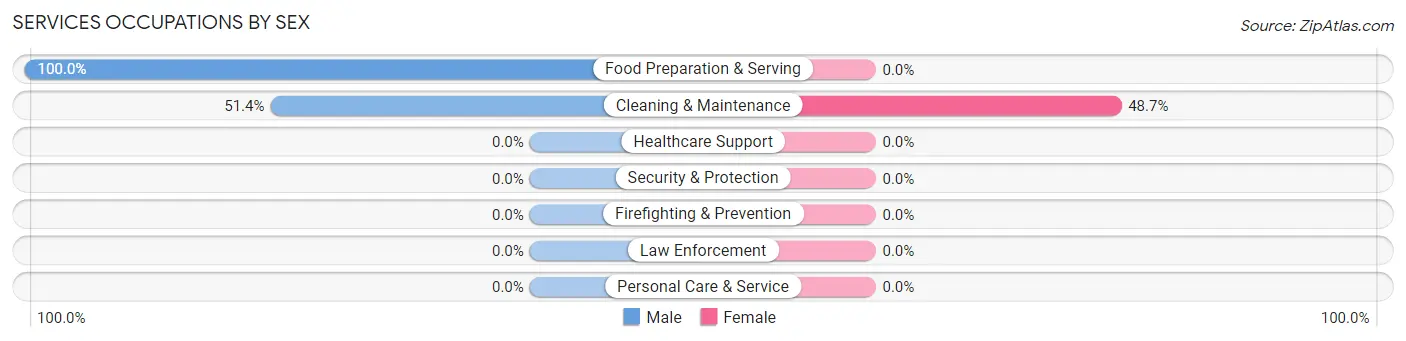
Services Occupations by Sex
| Occupation | Male | Female |
| Healthcare Support | 0 (0.0%) | 0 (0.0%) |
| Security & Protection | 0 (0.0%) | 0 (0.0%) |
| Firefighting & Prevention | 0 (0.0%) | 0 (0.0%) |
| Law Enforcement | 0 (0.0%) | 0 (0.0%) |
| Food Preparation & Serving | 24 (100.0%) | 0 (0.0%) |
| Cleaning & Maintenance | 19 (51.3%) | 18 (48.6%) |
| Personal Care & Service | 0 (0.0%) | 0 (0.0%) |
| Total (Category) | 43 (70.5%) | 18 (29.5%) |
| Total (Overall) | 180 (56.8%) | 137 (43.2%) |
Sales and Office Occupations
The most common Sales and Office occupations in Anderson are , and Office & Administration (26 | 8.2%).
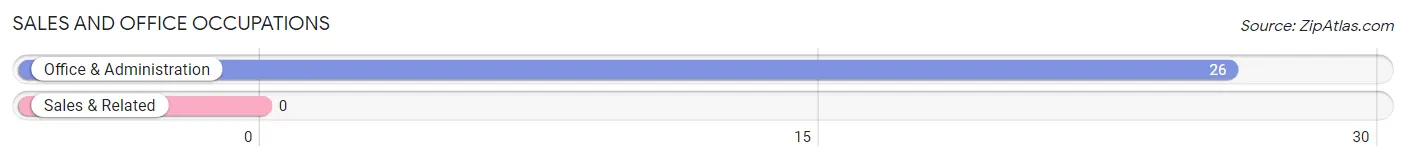
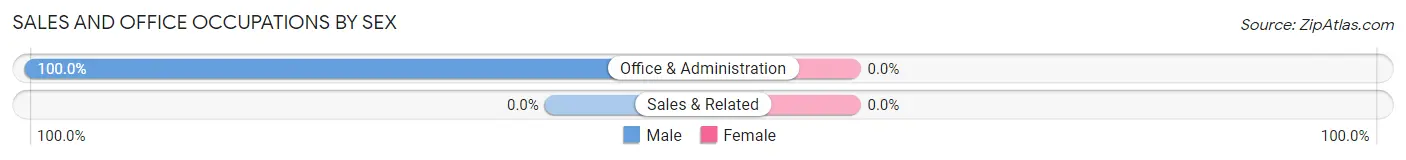
Sales and Office Occupations by Sex
| Occupation | Male | Female |
| Sales & Related | 0 (0.0%) | 0 (0.0%) |
| Office & Administration | 26 (100.0%) | 0 (0.0%) |
| Total (Category) | 26 (100.0%) | 0 (0.0%) |
| Total (Overall) | 180 (56.8%) | 137 (43.2%) |
Natural Resources, Construction and Maintenance Occupations
The most common Natural Resources, Construction and Maintenance occupations in Anderson are , and Construction & Extraction (16 | 5.1%).
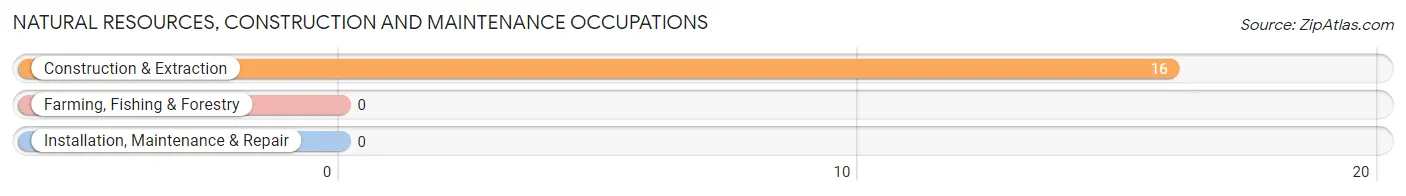
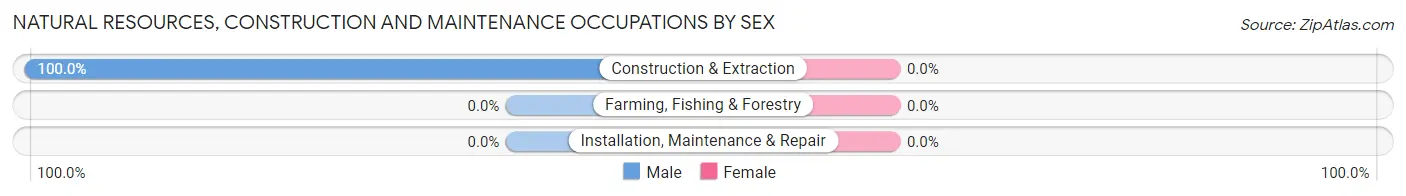
Natural Resources, Construction and Maintenance Occupations by Sex
| Occupation | Male | Female |
| Farming, Fishing & Forestry | 0 (0.0%) | 0 (0.0%) |
| Construction & Extraction | 16 (100.0%) | 0 (0.0%) |
| Installation, Maintenance & Repair | 0 (0.0%) | 0 (0.0%) |
| Total (Category) | 16 (100.0%) | 0 (0.0%) |
| Total (Overall) | 180 (56.8%) | 137 (43.2%) |
Production, Transportation and Moving Occupations
The most common Production, Transportation and Moving occupations in Anderson are , and Material Moving (55 | 17.3%).
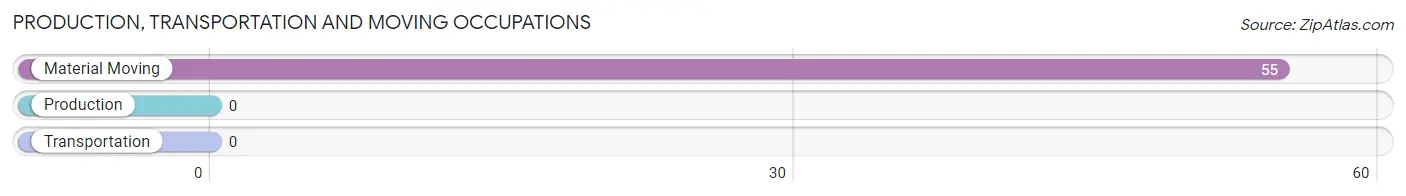
Production, Transportation and Moving Occupations by Sex
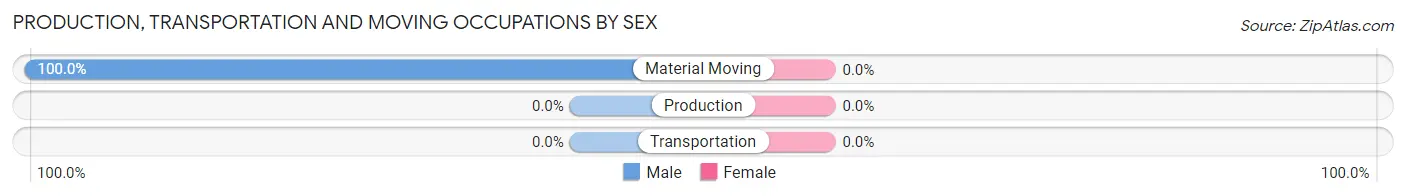
| Occupation | Male | Female |
| Production | 0 (0.0%) | 0 (0.0%) |
| Transportation | 0 (0.0%) | 0 (0.0%) |
| Material Moving | 55 (100.0%) | 0 (0.0%) |
| Total (Category) | 55 (100.0%) | 0 (0.0%) |
| Total (Overall) | 180 (56.8%) | 137 (43.2%) |
Employment Industries by Sex in Anderson
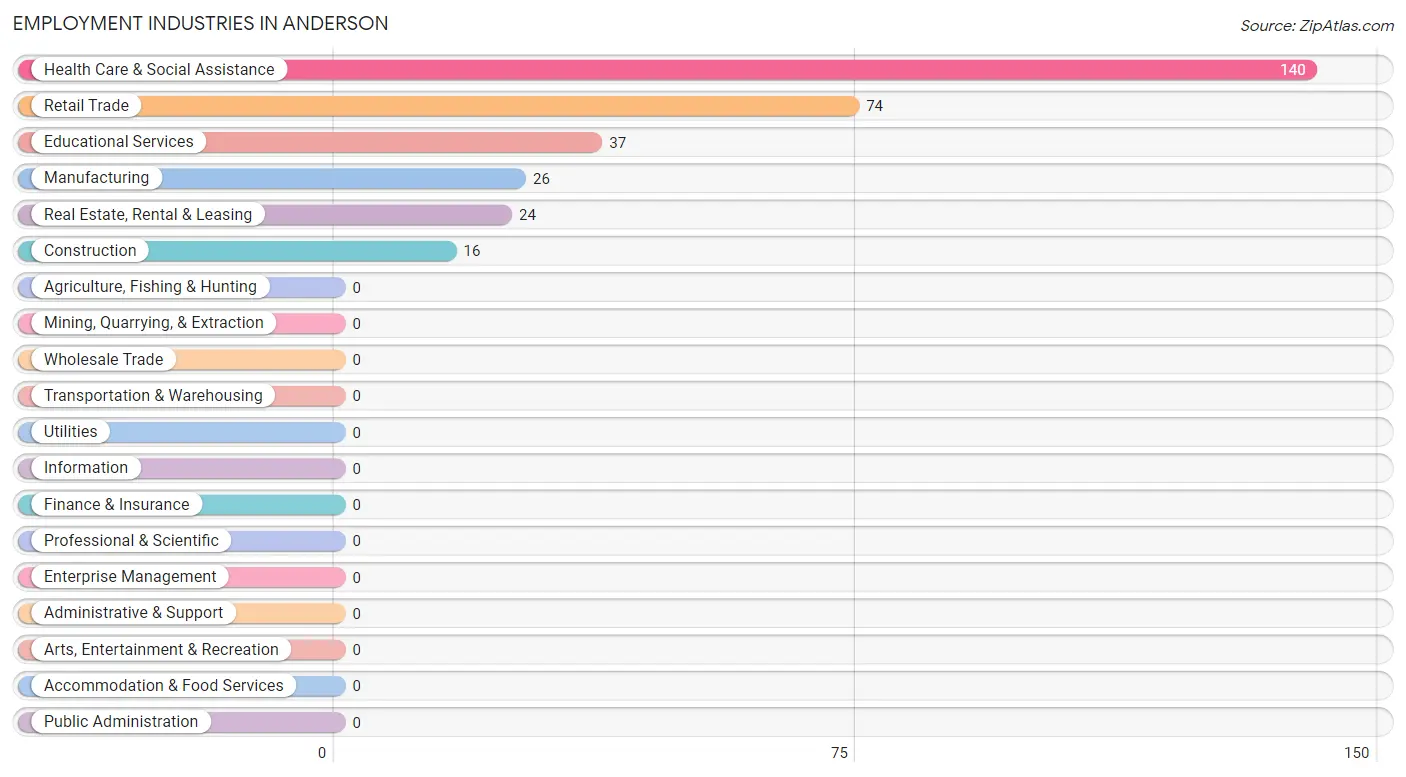
Employment Industries in Anderson
The major employment industries in Anderson include Health Care & Social Assistance (140 | 44.2%), Retail Trade (74 | 23.3%), Educational Services (37 | 11.7%), Manufacturing (26 | 8.2%), and Real Estate, Rental & Leasing (24 | 7.6%).
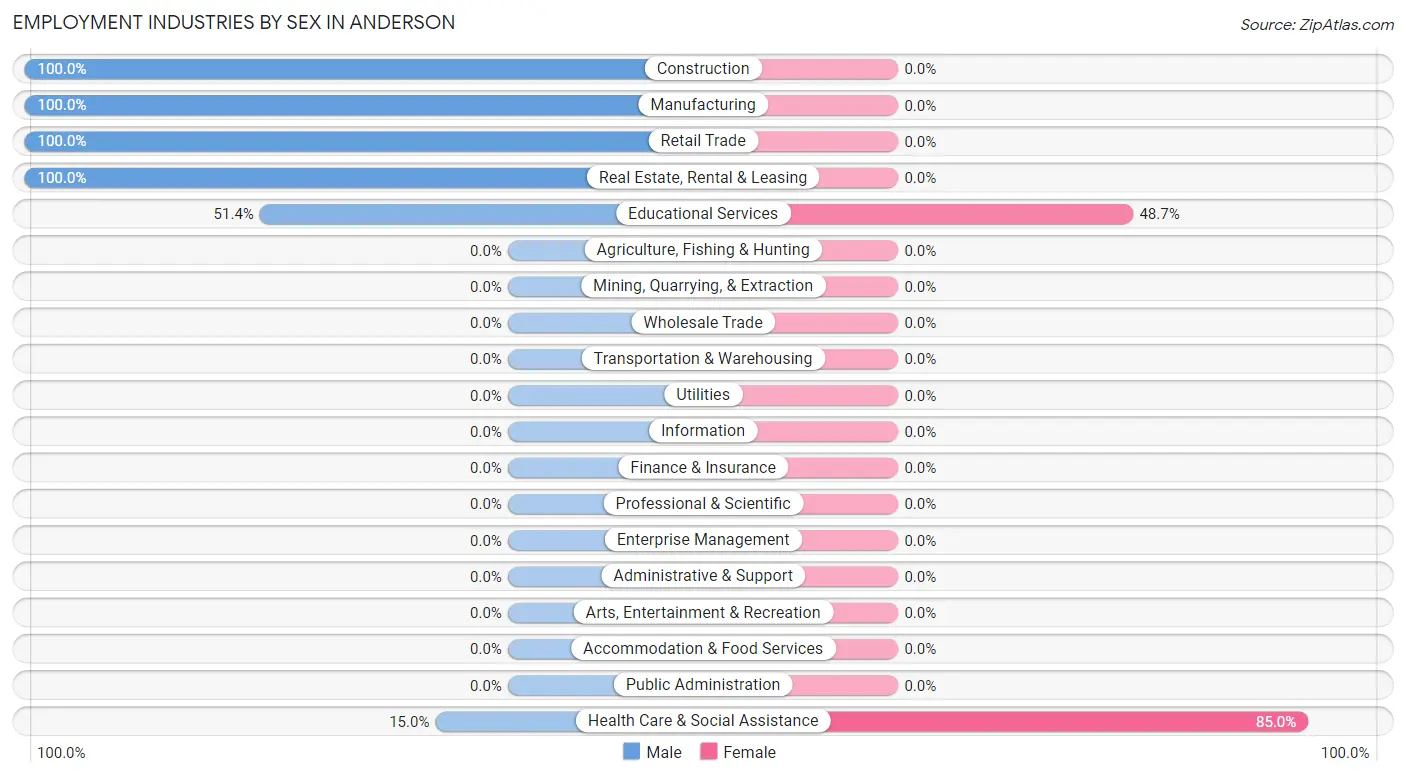
Employment Industries by Sex in Anderson
The Anderson industries that see more men than women are Construction (100.0%), Manufacturing (100.0%), and Retail Trade (100.0%), whereas the industries that tend to have a higher number of women are Health Care & Social Assistance (85.0%), and Educational Services (48.6%).
| Industry | Male | Female |
| Agriculture, Fishing & Hunting | 0 (0.0%) | 0 (0.0%) |
| Mining, Quarrying, & Extraction | 0 (0.0%) | 0 (0.0%) |
| Construction | 16 (100.0%) | 0 (0.0%) |
| Manufacturing | 26 (100.0%) | 0 (0.0%) |
| Wholesale Trade | 0 (0.0%) | 0 (0.0%) |
| Retail Trade | 74 (100.0%) | 0 (0.0%) |
| Transportation & Warehousing | 0 (0.0%) | 0 (0.0%) |
| Utilities | 0 (0.0%) | 0 (0.0%) |
| Information | 0 (0.0%) | 0 (0.0%) |
| Finance & Insurance | 0 (0.0%) | 0 (0.0%) |
| Real Estate, Rental & Leasing | 24 (100.0%) | 0 (0.0%) |
| Professional & Scientific | 0 (0.0%) | 0 (0.0%) |
| Enterprise Management | 0 (0.0%) | 0 (0.0%) |
| Administrative & Support | 0 (0.0%) | 0 (0.0%) |
| Educational Services | 19 (51.3%) | 18 (48.6%) |
| Health Care & Social Assistance | 21 (15.0%) | 119 (85.0%) |
| Arts, Entertainment & Recreation | 0 (0.0%) | 0 (0.0%) |
| Accommodation & Food Services | 0 (0.0%) | 0 (0.0%) |
| Public Administration | 0 (0.0%) | 0 (0.0%) |
| Total | 180 (56.8%) | 137 (43.2%) |
Education in Anderson
School Enrollment in Anderson
The most common levels of schooling among the 98 students in Anderson are elementary school (56 | 57.1%), college / undergraduate (24 | 24.5%), and middle school (18 | 18.4%).
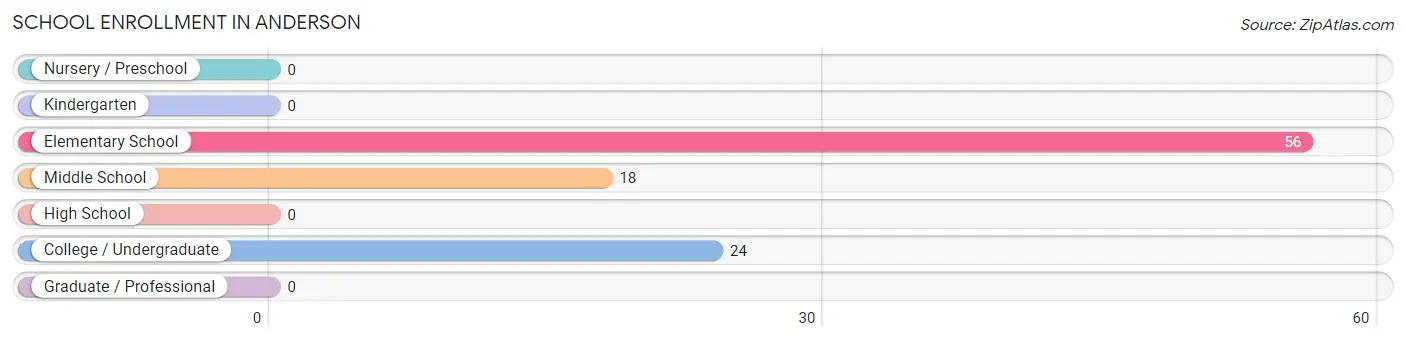
| School Level | # Students | % Students |
| Nursery / Preschool | 0 | 0.0% |
| Kindergarten | 0 | 0.0% |
| Elementary School | 56 | 57.1% |
| Middle School | 18 | 18.4% |
| High School | 0 | 0.0% |
| College / Undergraduate | 24 | 24.5% |
| Graduate / Professional | 0 | 0.0% |
| Total | 98 | 100.0% |
School Enrollment by Age by Funding Source in Anderson
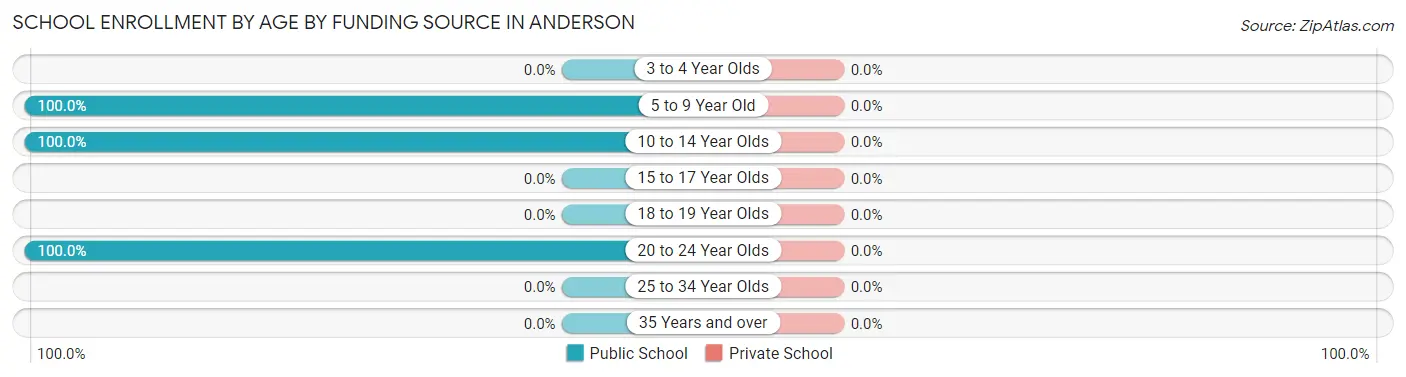
| Age Bracket | Public School | Private School |
| 3 to 4 Year Olds | 0 (0.0%) | 0 (0.0%) |
| 5 to 9 Year Old | 56 (100.0%) | 0 (0.0%) |
| 10 to 14 Year Olds | 18 (100.0%) | 0 (0.0%) |
| 15 to 17 Year Olds | 0 (0.0%) | 0 (0.0%) |
| 18 to 19 Year Olds | 0 (0.0%) | 0 (0.0%) |
| 20 to 24 Year Olds | 24 (100.0%) | 0 (0.0%) |
| 25 to 34 Year Olds | 0 (0.0%) | 0 (0.0%) |
| 35 Years and over | 0 (0.0%) | 0 (0.0%) |
| Total | 98 (100.0%) | 0 (0.0%) |
Educational Attainment by Field of Study in Anderson
Science & technology (41 | 56.2%), communications (19 | 26.0%), and liberal arts & history (13 | 17.8%) are the most common fields of study among 73 individuals in Anderson who have obtained a bachelor's degree or higher.
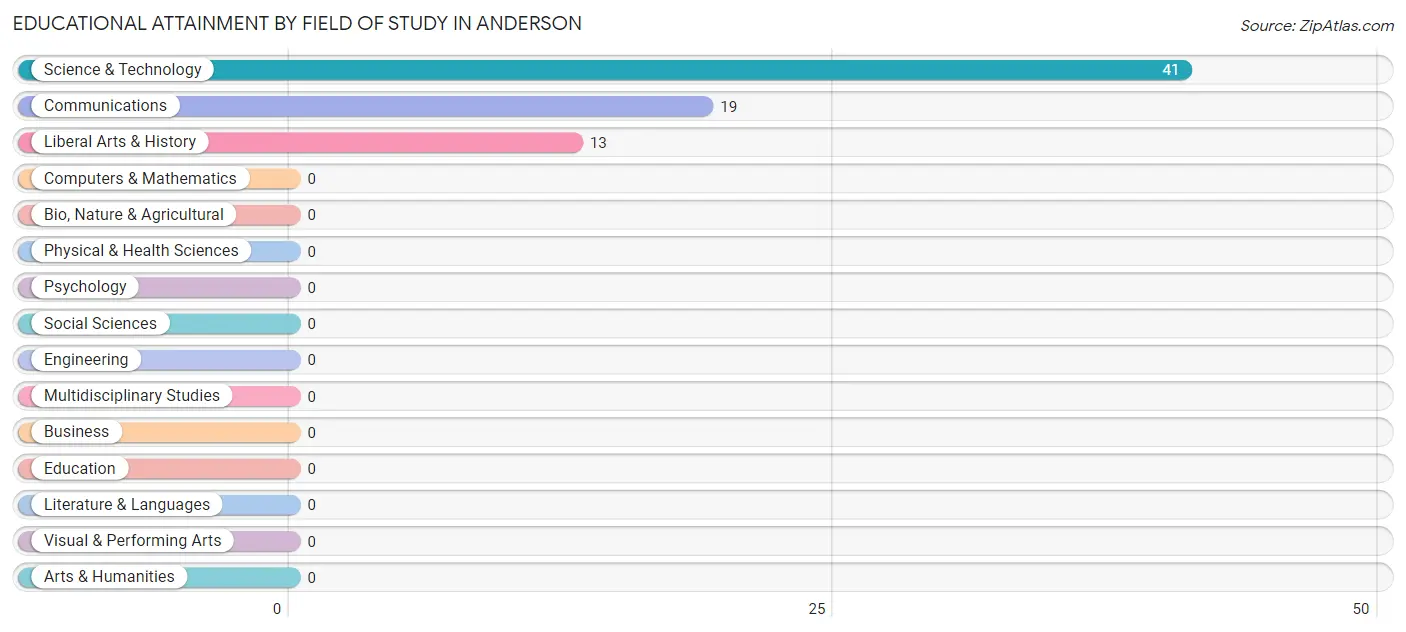
| Field of Study | # Graduates | % Graduates |
| Computers & Mathematics | 0 | 0.0% |
| Bio, Nature & Agricultural | 0 | 0.0% |
| Physical & Health Sciences | 0 | 0.0% |
| Psychology | 0 | 0.0% |
| Social Sciences | 0 | 0.0% |
| Engineering | 0 | 0.0% |
| Multidisciplinary Studies | 0 | 0.0% |
| Science & Technology | 41 | 56.2% |
| Business | 0 | 0.0% |
| Education | 0 | 0.0% |
| Literature & Languages | 0 | 0.0% |
| Liberal Arts & History | 13 | 17.8% |
| Visual & Performing Arts | 0 | 0.0% |
| Communications | 19 | 26.0% |
| Arts & Humanities | 0 | 0.0% |
| Total | 73 | 100.0% |
Transportation & Commute in Anderson
Vehicle Availability by Sex in Anderson
The most prevalent vehicle ownership categories in Anderson are males with 2 vehicles (97, accounting for 60.3%) and females with 2 vehicles (84, making up 70.8%).
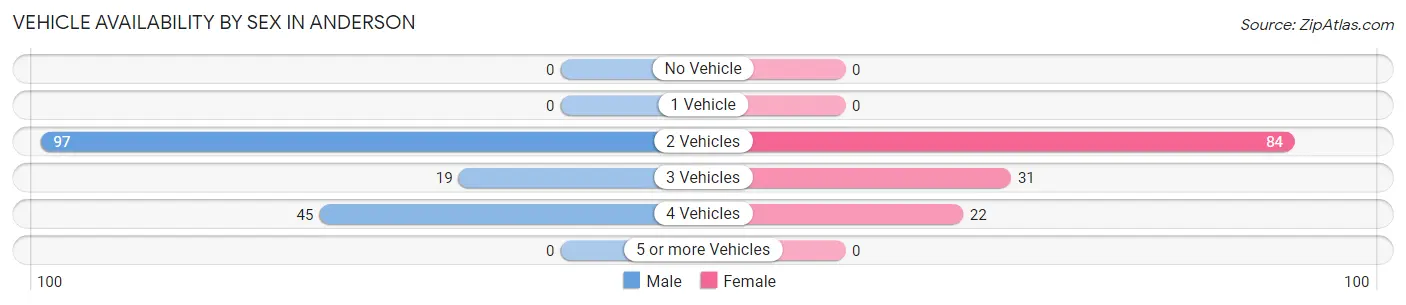
| Vehicles Available | Male | Female |
| No Vehicle | 0 (0.0%) | 0 (0.0%) |
| 1 Vehicle | 0 (0.0%) | 0 (0.0%) |
| 2 Vehicles | 97 (60.3%) | 84 (61.3%) |
| 3 Vehicles | 19 (11.8%) | 31 (22.6%) |
| 4 Vehicles | 45 (28.0%) | 22 (16.1%) |
| 5 or more Vehicles | 0 (0.0%) | 0 (0.0%) |
| Total | 161 (100.0%) | 137 (100.0%) |
Commute Time in Anderson
The most frequently occuring commute durations in Anderson are 15 to 19 minutes (105 commuters, 35.2%), 30 to 34 minutes (66 commuters, 22.2%), and 10 to 14 minutes (39 commuters, 13.1%).
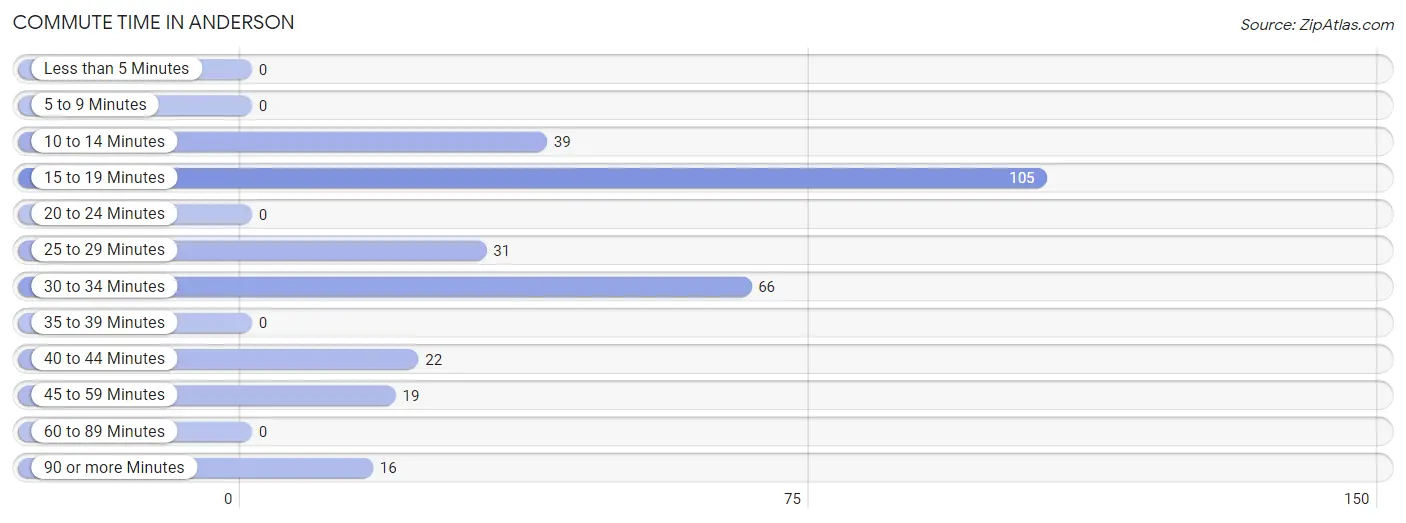
| Commute Time | # Commuters | % Commuters |
| Less than 5 Minutes | 0 | 0.0% |
| 5 to 9 Minutes | 0 | 0.0% |
| 10 to 14 Minutes | 39 | 13.1% |
| 15 to 19 Minutes | 105 | 35.2% |
| 20 to 24 Minutes | 0 | 0.0% |
| 25 to 29 Minutes | 31 | 10.4% |
| 30 to 34 Minutes | 66 | 22.2% |
| 35 to 39 Minutes | 0 | 0.0% |
| 40 to 44 Minutes | 22 | 7.4% |
| 45 to 59 Minutes | 19 | 6.4% |
| 60 to 89 Minutes | 0 | 0.0% |
| 90 or more Minutes | 16 | 5.4% |
Commute Time by Sex in Anderson
The most common commute times in Anderson are 15 to 19 minutes (105 commuters, 65.2%) for males and 30 to 34 minutes (66 commuters, 48.2%) for females.
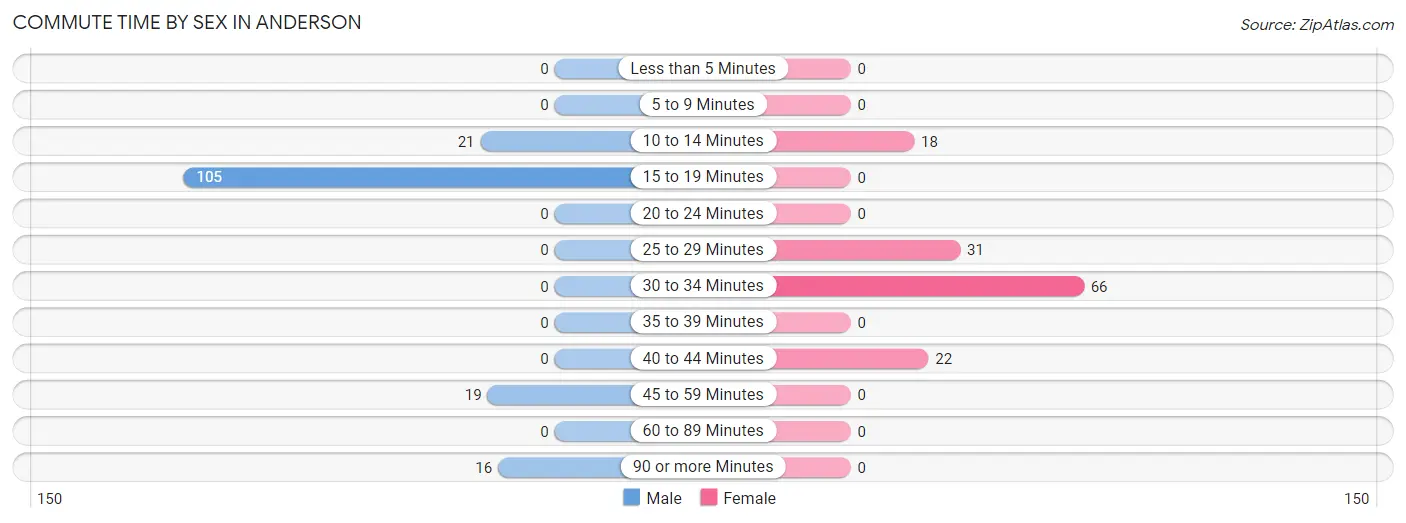
| Commute Time | Male | Female |
| Less than 5 Minutes | 0 (0.0%) | 0 (0.0%) |
| 5 to 9 Minutes | 0 (0.0%) | 0 (0.0%) |
| 10 to 14 Minutes | 21 (13.0%) | 18 (13.1%) |
| 15 to 19 Minutes | 105 (65.2%) | 0 (0.0%) |
| 20 to 24 Minutes | 0 (0.0%) | 0 (0.0%) |
| 25 to 29 Minutes | 0 (0.0%) | 31 (22.6%) |
| 30 to 34 Minutes | 0 (0.0%) | 66 (48.2%) |
| 35 to 39 Minutes | 0 (0.0%) | 0 (0.0%) |
| 40 to 44 Minutes | 0 (0.0%) | 22 (16.1%) |
| 45 to 59 Minutes | 19 (11.8%) | 0 (0.0%) |
| 60 to 89 Minutes | 0 (0.0%) | 0 (0.0%) |
| 90 or more Minutes | 16 (9.9%) | 0 (0.0%) |
Time of Departure to Work by Sex in Anderson
The most frequent times of departure to work in Anderson are 9:00 AM to 9:59 AM (79, 49.1%) for males and 4:00 PM to 11:59 PM (66, 48.2%) for females.
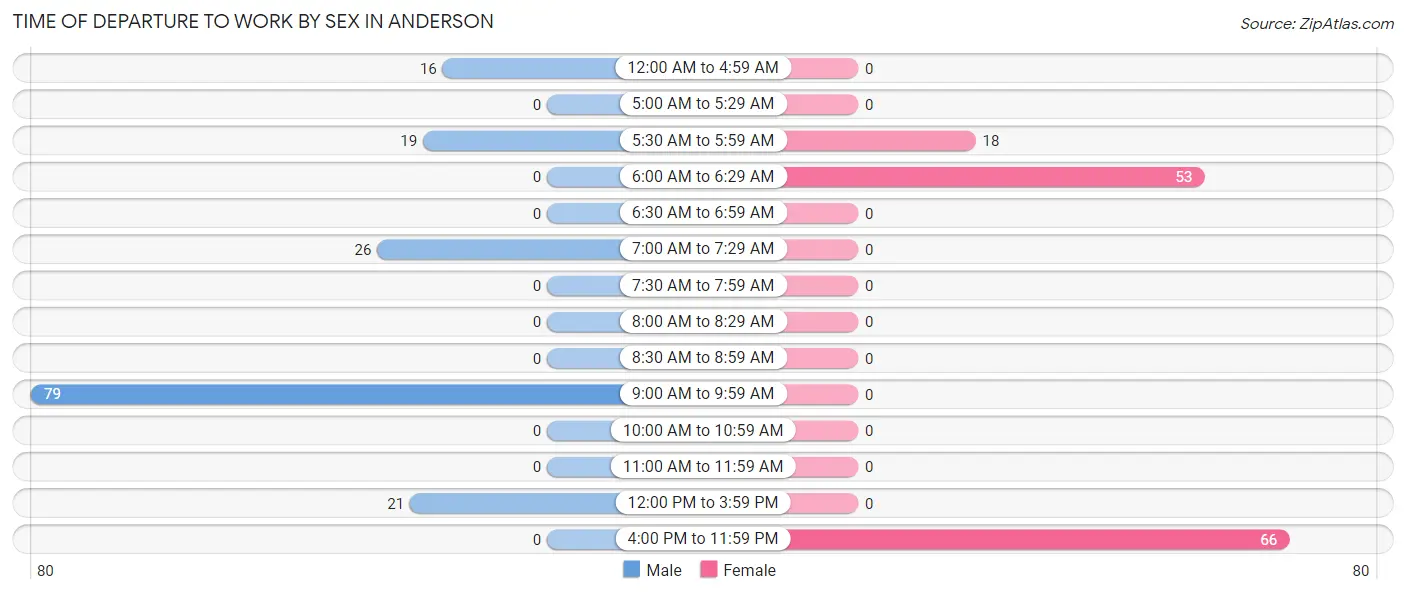
| Time of Departure | Male | Female |
| 12:00 AM to 4:59 AM | 16 (9.9%) | 0 (0.0%) |
| 5:00 AM to 5:29 AM | 0 (0.0%) | 0 (0.0%) |
| 5:30 AM to 5:59 AM | 19 (11.8%) | 18 (13.1%) |
| 6:00 AM to 6:29 AM | 0 (0.0%) | 53 (38.7%) |
| 6:30 AM to 6:59 AM | 0 (0.0%) | 0 (0.0%) |
| 7:00 AM to 7:29 AM | 26 (16.2%) | 0 (0.0%) |
| 7:30 AM to 7:59 AM | 0 (0.0%) | 0 (0.0%) |
| 8:00 AM to 8:29 AM | 0 (0.0%) | 0 (0.0%) |
| 8:30 AM to 8:59 AM | 0 (0.0%) | 0 (0.0%) |
| 9:00 AM to 9:59 AM | 79 (49.1%) | 0 (0.0%) |
| 10:00 AM to 10:59 AM | 0 (0.0%) | 0 (0.0%) |
| 11:00 AM to 11:59 AM | 0 (0.0%) | 0 (0.0%) |
| 12:00 PM to 3:59 PM | 21 (13.0%) | 0 (0.0%) |
| 4:00 PM to 11:59 PM | 0 (0.0%) | 66 (48.2%) |
| Total | 161 (100.0%) | 137 (100.0%) |
Housing Occupancy in Anderson
Occupancy by Ownership in Anderson
Of the total 205 dwellings in Anderson, owner-occupied units account for 139 (67.8%), while renter-occupied units make up 66 (32.2%).
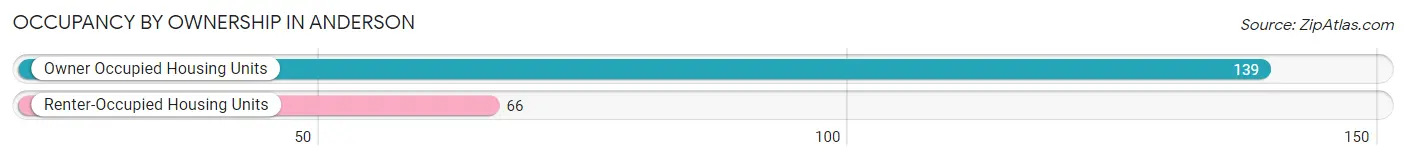
| Occupancy | # Housing Units | % Housing Units |
| Owner Occupied Housing Units | 139 | 67.8% |
| Renter-Occupied Housing Units | 66 | 32.2% |
| Total Occupied Housing Units | 205 | 100.0% |
Occupancy by Household Size in Anderson
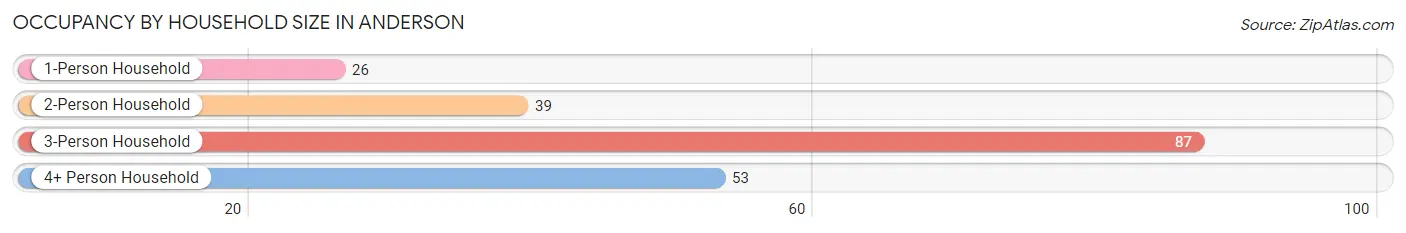
| Household Size | # Housing Units | % Housing Units |
| 1-Person Household | 26 | 12.7% |
| 2-Person Household | 39 | 19.0% |
| 3-Person Household | 87 | 42.4% |
| 4+ Person Household | 53 | 25.9% |
| Total Housing Units | 205 | 100.0% |
Occupancy by Ownership by Household Size in Anderson
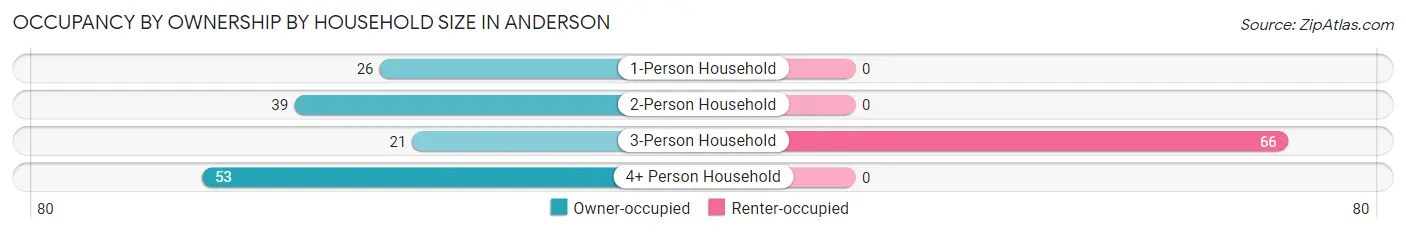
| Household Size | Owner-occupied | Renter-occupied |
| 1-Person Household | 26 (100.0%) | 0 (0.0%) |
| 2-Person Household | 39 (100.0%) | 0 (0.0%) |
| 3-Person Household | 21 (24.1%) | 66 (75.9%) |
| 4+ Person Household | 53 (100.0%) | 0 (0.0%) |
| Total Housing Units | 139 (67.8%) | 66 (32.2%) |
Occupancy by Educational Attainment in Anderson
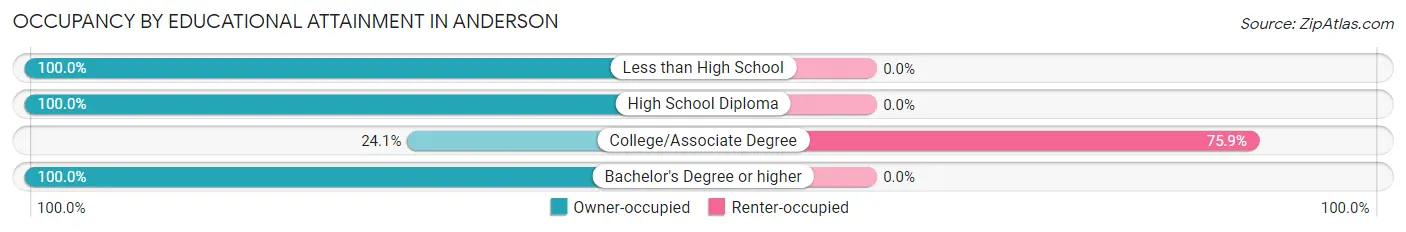
| Household Size | Owner-occupied | Renter-occupied |
| Less than High School | 61 (100.0%) | 0 (0.0%) |
| High School Diploma | 44 (100.0%) | 0 (0.0%) |
| College/Associate Degree | 21 (24.1%) | 66 (75.9%) |
| Bachelor's Degree or higher | 13 (100.0%) | 0 (0.0%) |
Occupancy by Age of Householder in Anderson
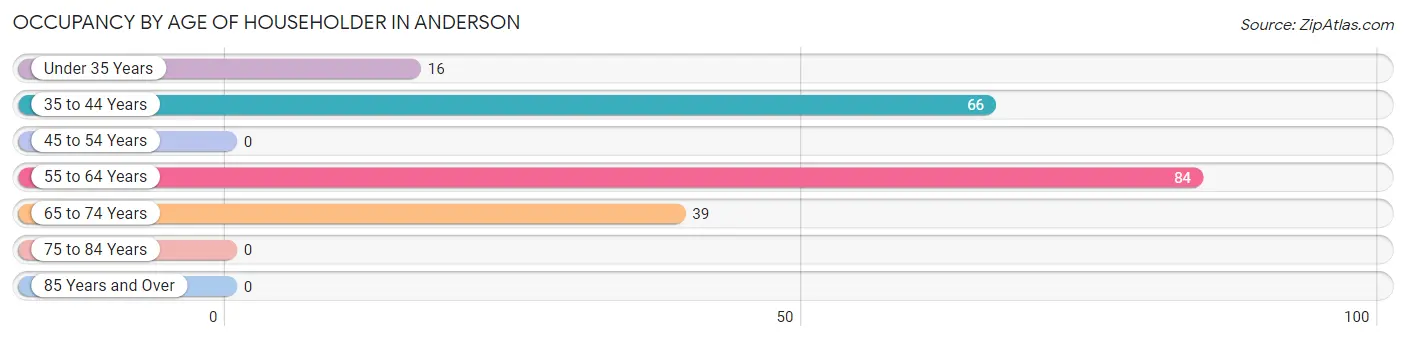
| Age Bracket | # Households | % Households |
| Under 35 Years | 16 | 7.8% |
| 35 to 44 Years | 66 | 32.2% |
| 45 to 54 Years | 0 | 0.0% |
| 55 to 64 Years | 84 | 41.0% |
| 65 to 74 Years | 39 | 19.0% |
| 75 to 84 Years | 0 | 0.0% |
| 85 Years and Over | 0 | 0.0% |
| Total | 205 | 100.0% |
Housing Finances in Anderson
Median Income by Occupancy in Anderson
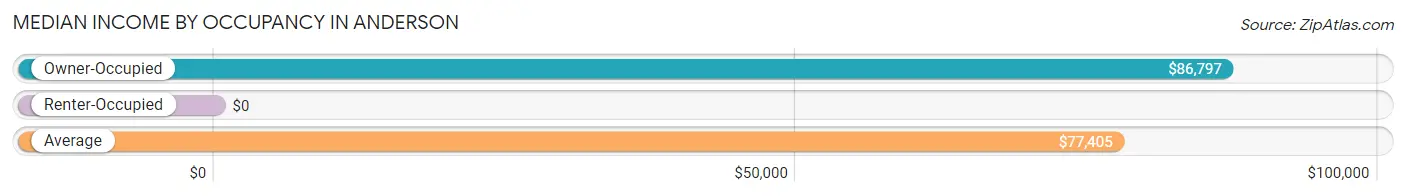
| Occupancy Type | # Households | Median Income |
| Owner-Occupied | 139 (67.8%) | $86,797 |
| Renter-Occupied | 66 (32.2%) | $0 |
| Average | 205 (100.0%) | $77,405 |
Occupancy by Householder Income Bracket in Anderson
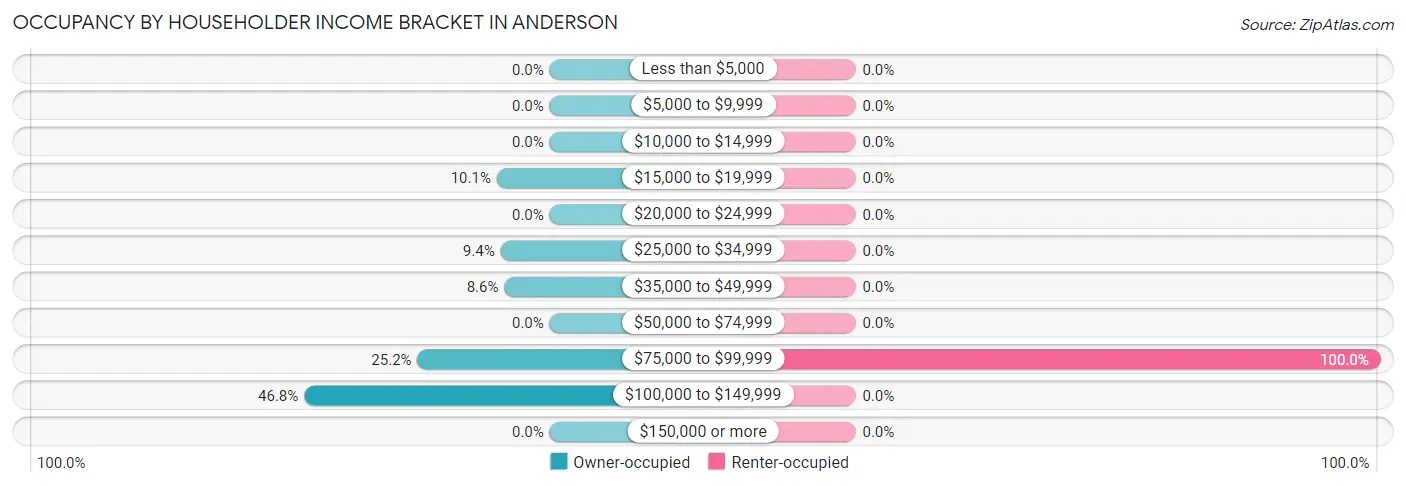
| Income Bracket | Owner-occupied | Renter-occupied |
| Less than $5,000 | 0 (0.0%) | 0 (0.0%) |
| $5,000 to $9,999 | 0 (0.0%) | 0 (0.0%) |
| $10,000 to $14,999 | 0 (0.0%) | 0 (0.0%) |
| $15,000 to $19,999 | 14 (10.1%) | 0 (0.0%) |
| $20,000 to $24,999 | 0 (0.0%) | 0 (0.0%) |
| $25,000 to $34,999 | 13 (9.3%) | 0 (0.0%) |
| $35,000 to $49,999 | 12 (8.6%) | 0 (0.0%) |
| $50,000 to $74,999 | 0 (0.0%) | 0 (0.0%) |
| $75,000 to $99,999 | 35 (25.2%) | 66 (100.0%) |
| $100,000 to $149,999 | 65 (46.8%) | 0 (0.0%) |
| $150,000 or more | 0 (0.0%) | 0 (0.0%) |
| Total | 139 (100.0%) | 66 (100.0%) |
Monthly Housing Cost Tiers in Anderson
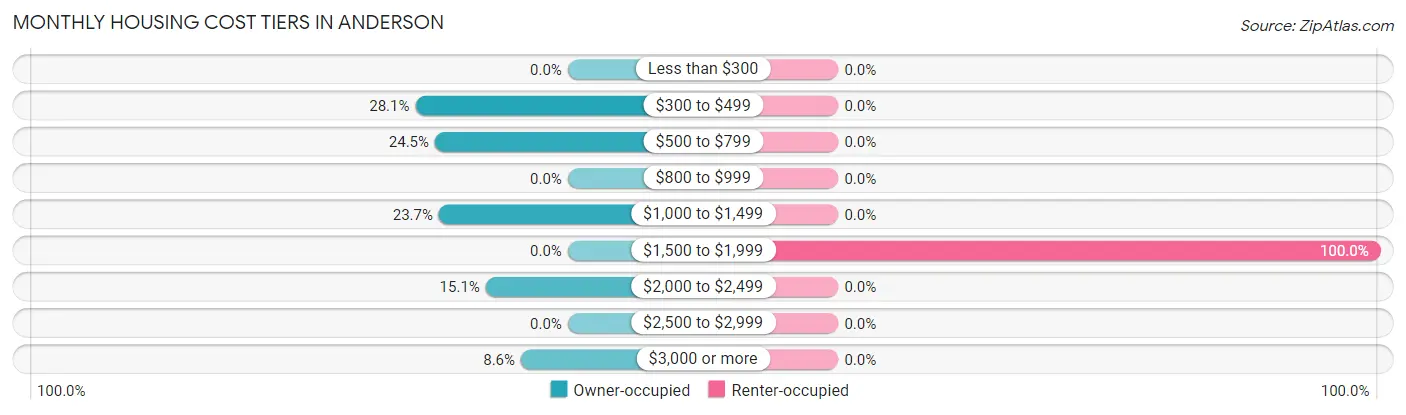
| Monthly Cost | Owner-occupied | Renter-occupied |
| Less than $300 | 0 (0.0%) | 0 (0.0%) |
| $300 to $499 | 39 (28.1%) | 0 (0.0%) |
| $500 to $799 | 34 (24.5%) | 0 (0.0%) |
| $800 to $999 | 0 (0.0%) | 0 (0.0%) |
| $1,000 to $1,499 | 33 (23.7%) | 0 (0.0%) |
| $1,500 to $1,999 | 0 (0.0%) | 66 (100.0%) |
| $2,000 to $2,499 | 21 (15.1%) | 0 (0.0%) |
| $2,500 to $2,999 | 0 (0.0%) | 0 (0.0%) |
| $3,000 or more | 12 (8.6%) | 0 (0.0%) |
| Total | 139 (100.0%) | 66 (100.0%) |
Physical Housing Characteristics in Anderson
Housing Structures in Anderson
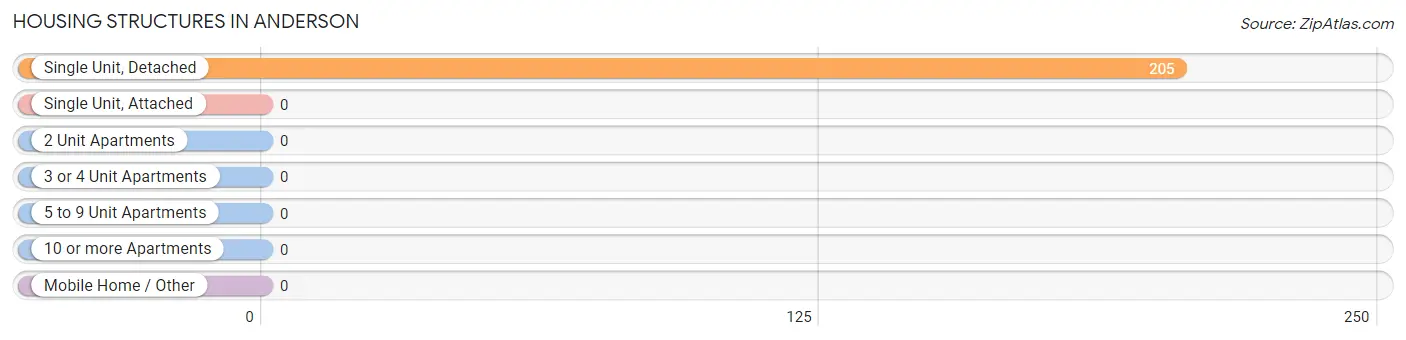
| Structure Type | # Housing Units | % Housing Units |
| Single Unit, Detached | 205 | 100.0% |
| Single Unit, Attached | 0 | 0.0% |
| 2 Unit Apartments | 0 | 0.0% |
| 3 or 4 Unit Apartments | 0 | 0.0% |
| 5 to 9 Unit Apartments | 0 | 0.0% |
| 10 or more Apartments | 0 | 0.0% |
| Mobile Home / Other | 0 | 0.0% |
| Total | 205 | 100.0% |
Housing Structures by Occupancy in Anderson
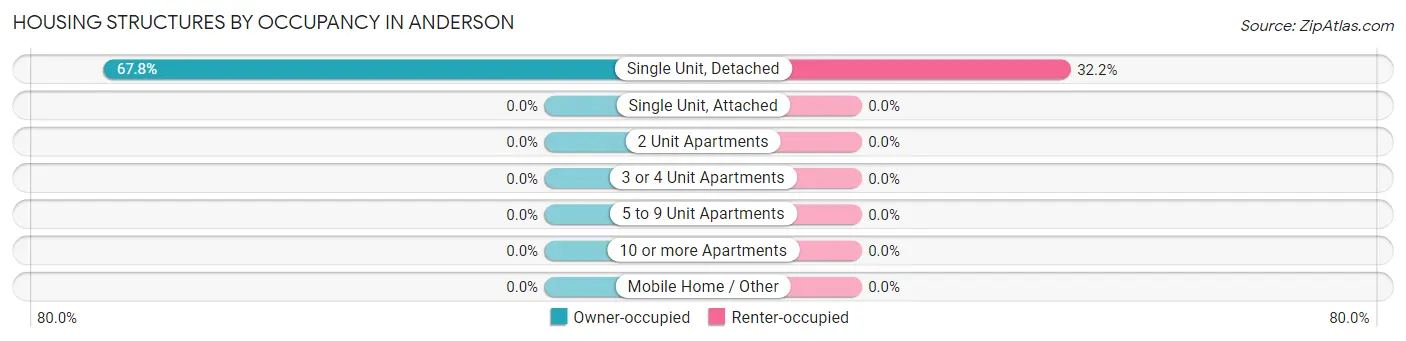
| Structure Type | Owner-occupied | Renter-occupied |
| Single Unit, Detached | 139 (67.8%) | 66 (32.2%) |
| Single Unit, Attached | 0 (0.0%) | 0 (0.0%) |
| 2 Unit Apartments | 0 (0.0%) | 0 (0.0%) |
| 3 or 4 Unit Apartments | 0 (0.0%) | 0 (0.0%) |
| 5 to 9 Unit Apartments | 0 (0.0%) | 0 (0.0%) |
| 10 or more Apartments | 0 (0.0%) | 0 (0.0%) |
| Mobile Home / Other | 0 (0.0%) | 0 (0.0%) |
| Total | 139 (67.8%) | 66 (32.2%) |
Housing Structures by Number of Rooms in Anderson
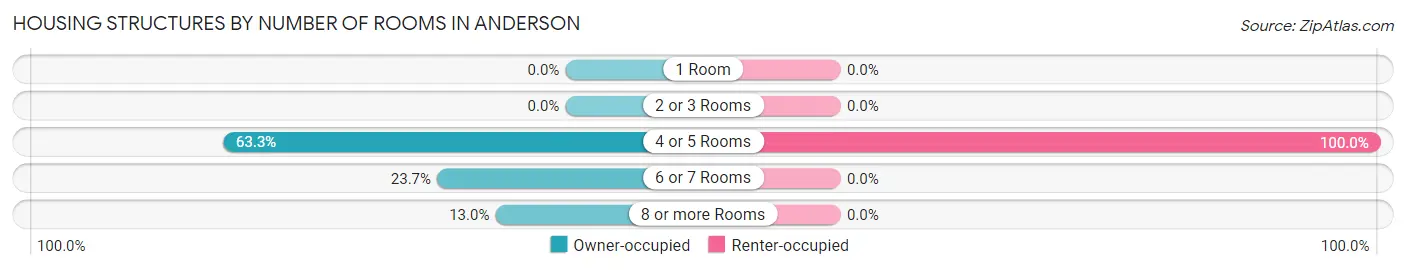
| Number of Rooms | Owner-occupied | Renter-occupied |
| 1 Room | 0 (0.0%) | 0 (0.0%) |
| 2 or 3 Rooms | 0 (0.0%) | 0 (0.0%) |
| 4 or 5 Rooms | 88 (63.3%) | 66 (100.0%) |
| 6 or 7 Rooms | 33 (23.7%) | 0 (0.0%) |
| 8 or more Rooms | 18 (13.0%) | 0 (0.0%) |
| Total | 139 (100.0%) | 66 (100.0%) |
Housing Structure by Heating Type in Anderson
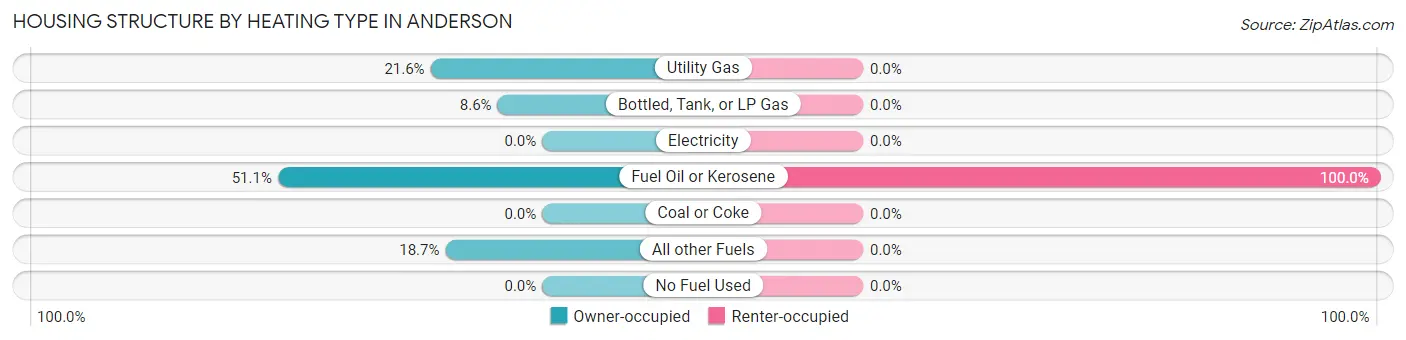
| Heating Type | Owner-occupied | Renter-occupied |
| Utility Gas | 30 (21.6%) | 0 (0.0%) |
| Bottled, Tank, or LP Gas | 12 (8.6%) | 0 (0.0%) |
| Electricity | 0 (0.0%) | 0 (0.0%) |
| Fuel Oil or Kerosene | 71 (51.1%) | 66 (100.0%) |
| Coal or Coke | 0 (0.0%) | 0 (0.0%) |
| All other Fuels | 26 (18.7%) | 0 (0.0%) |
| No Fuel Used | 0 (0.0%) | 0 (0.0%) |
| Total | 139 (100.0%) | 66 (100.0%) |
Household Vehicle Usage in Anderson
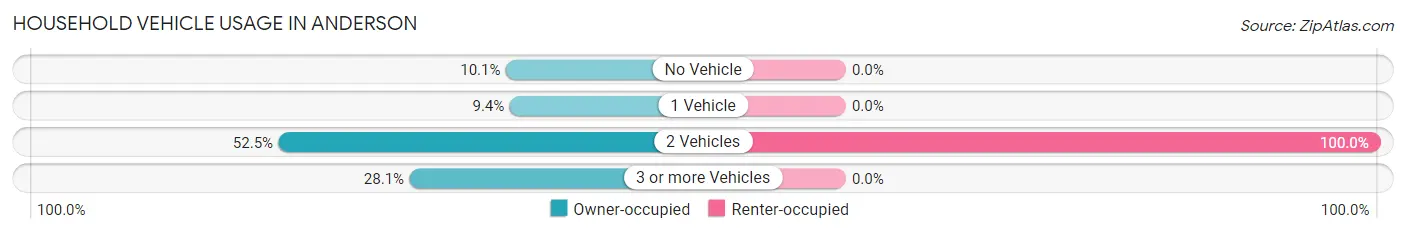
| Vehicles per Household | Owner-occupied | Renter-occupied |
| No Vehicle | 14 (10.1%) | 0 (0.0%) |
| 1 Vehicle | 13 (9.3%) | 0 (0.0%) |
| 2 Vehicles | 73 (52.5%) | 66 (100.0%) |
| 3 or more Vehicles | 39 (28.1%) | 0 (0.0%) |
| Total | 139 (100.0%) | 66 (100.0%) |
Real Estate & Mortgages in Anderson
Real Estate and Mortgage Overview in Anderson
| Characteristic | Without Mortgage | With Mortgage |
| Housing Units | 87 | 52 |
| Median Property Value | $181,300 | $333,300 |
| Median Household Income | $100,048 | $0 |
| Monthly Housing Costs | $528 | $12 |
| Real Estate Taxes | $3,693 | $0 |
Property Value by Mortgage Status in Anderson
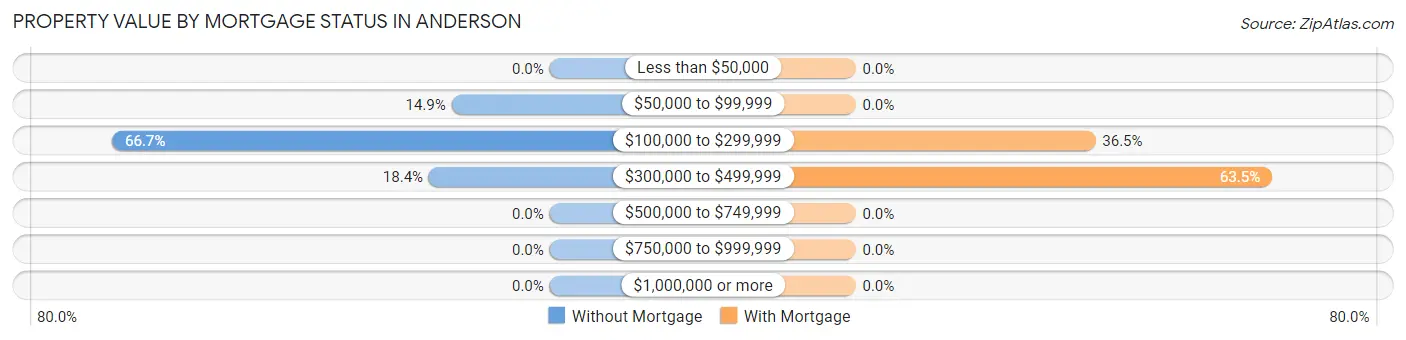
| Property Value | Without Mortgage | With Mortgage |
| Less than $50,000 | 0 (0.0%) | 0 (0.0%) |
| $50,000 to $99,999 | 13 (14.9%) | 0 (0.0%) |
| $100,000 to $299,999 | 58 (66.7%) | 19 (36.5%) |
| $300,000 to $499,999 | 16 (18.4%) | 33 (63.5%) |
| $500,000 to $749,999 | 0 (0.0%) | 0 (0.0%) |
| $750,000 to $999,999 | 0 (0.0%) | 0 (0.0%) |
| $1,000,000 or more | 0 (0.0%) | 0 (0.0%) |
| Total | 87 (100.0%) | 52 (100.0%) |
Household Income by Mortgage Status in Anderson
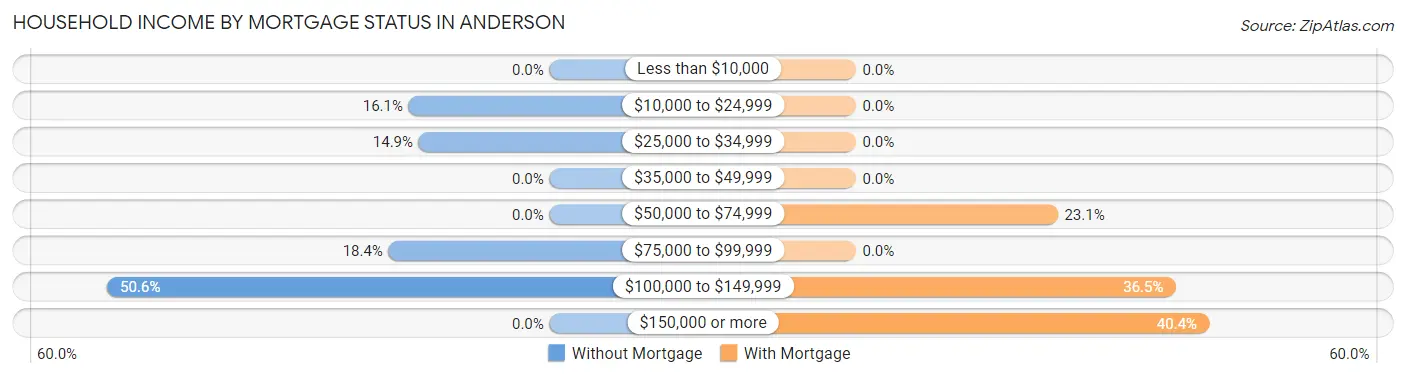
| Household Income | Without Mortgage | With Mortgage |
| Less than $10,000 | 0 (0.0%) | 0 (0.0%) |
| $10,000 to $24,999 | 14 (16.1%) | 0 (0.0%) |
| $25,000 to $34,999 | 13 (14.9%) | 0 (0.0%) |
| $35,000 to $49,999 | 0 (0.0%) | 0 (0.0%) |
| $50,000 to $74,999 | 0 (0.0%) | 12 (23.1%) |
| $75,000 to $99,999 | 16 (18.4%) | 0 (0.0%) |
| $100,000 to $149,999 | 44 (50.6%) | 19 (36.5%) |
| $150,000 or more | 0 (0.0%) | 21 (40.4%) |
| Total | 87 (100.0%) | 52 (100.0%) |
Property Value to Household Income Ratio in Anderson
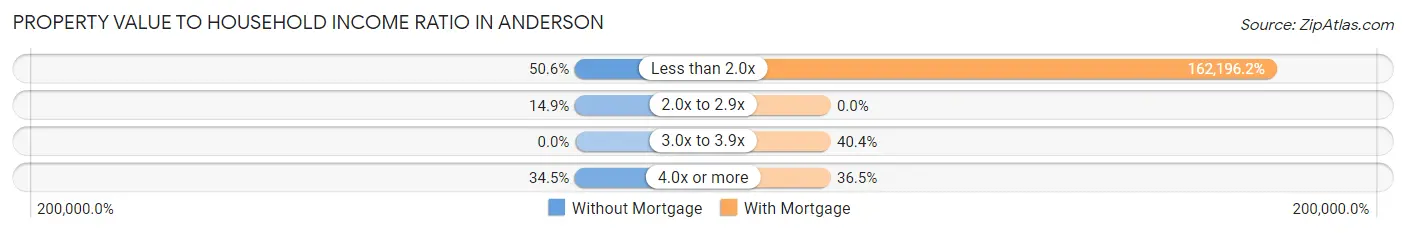
| Value-to-Income Ratio | Without Mortgage | With Mortgage |
| Less than 2.0x | 44 (50.6%) | 84,342 (162,196.1%) |
| 2.0x to 2.9x | 13 (14.9%) | 0 (0.0%) |
| 3.0x to 3.9x | 0 (0.0%) | 21 (40.4%) |
| 4.0x or more | 30 (34.5%) | 19 (36.5%) |
| Total | 87 (100.0%) | 52 (100.0%) |
Real Estate Taxes by Mortgage Status in Anderson
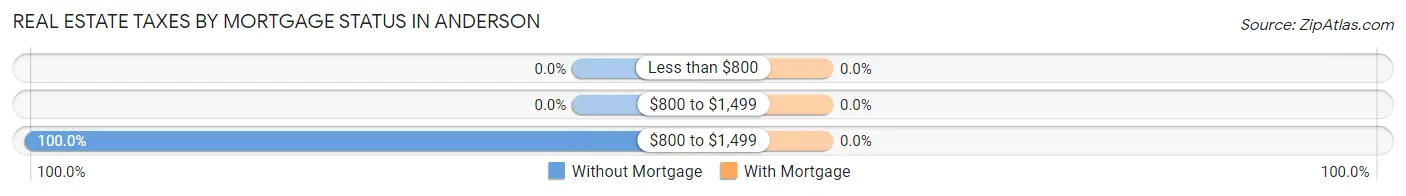
| Property Taxes | Without Mortgage | With Mortgage |
| Less than $800 | 0 (0.0%) | 0 (0.0%) |
| $800 to $1,499 | 0 (0.0%) | 0 (0.0%) |
| $800 to $1,499 | 87 (100.0%) | 0 (0.0%) |
| Total | 87 (100.0%) | 52 (100.0%) |
Health & Disability in Anderson
Health Insurance Coverage by Age in Anderson
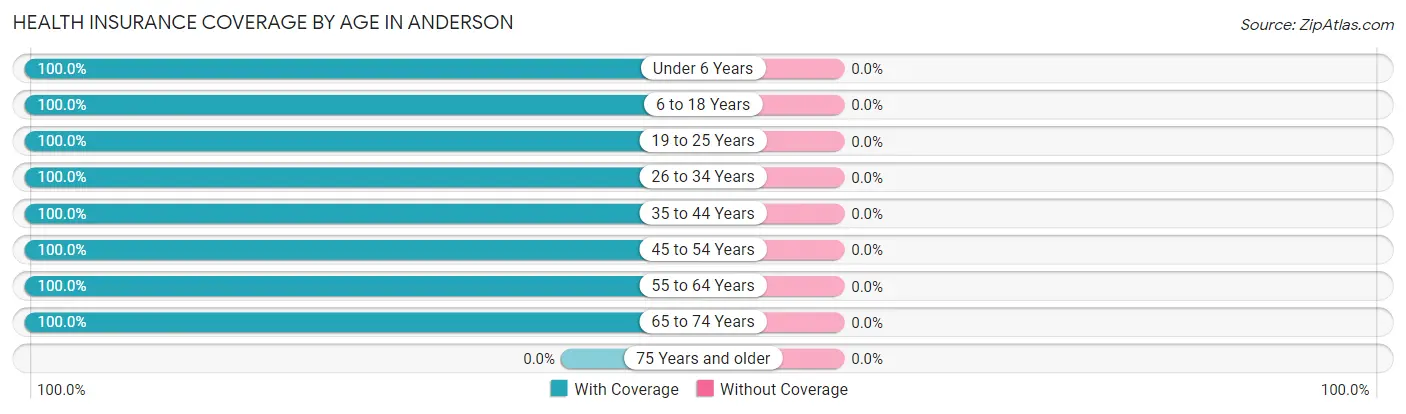
| Age Bracket | With Coverage | Without Coverage |
| Under 6 Years | 31 (100.0%) | 0 (0.0%) |
| 6 to 18 Years | 152 (100.0%) | 0 (0.0%) |
| 19 to 25 Years | 55 (100.0%) | 0 (0.0%) |
| 26 to 34 Years | 121 (100.0%) | 0 (0.0%) |
| 35 to 44 Years | 84 (100.0%) | 0 (0.0%) |
| 45 to 54 Years | 22 (100.0%) | 0 (0.0%) |
| 55 to 64 Years | 120 (100.0%) | 0 (0.0%) |
| 65 to 74 Years | 79 (100.0%) | 0 (0.0%) |
| 75 Years and older | 0 (0.0%) | 0 (0.0%) |
| Total | 664 (100.0%) | 0 (0.0%) |
Health Insurance Coverage by Citizenship Status in Anderson
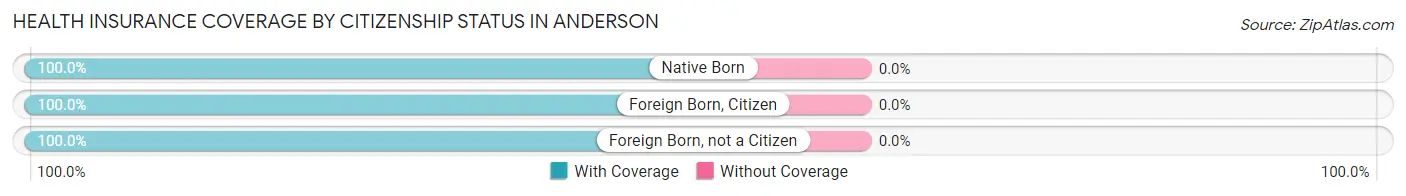
| Citizenship Status | With Coverage | Without Coverage |
| Native Born | 31 (100.0%) | 0 (0.0%) |
| Foreign Born, Citizen | 152 (100.0%) | 0 (0.0%) |
| Foreign Born, not a Citizen | 55 (100.0%) | 0 (0.0%) |
Health Insurance Coverage by Household Income in Anderson
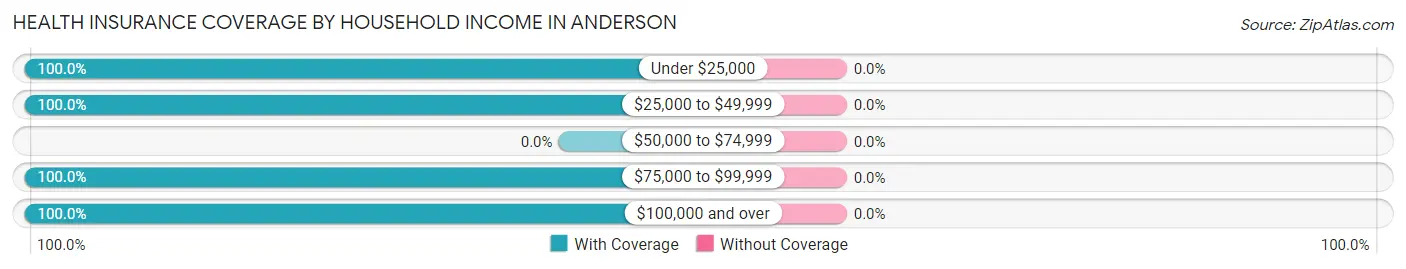
| Household Income | With Coverage | Without Coverage |
| Under $25,000 | 23 (100.0%) | 0 (0.0%) |
| $25,000 to $49,999 | 56 (100.0%) | 0 (0.0%) |
| $50,000 to $74,999 | 0 (0.0%) | 0 (0.0%) |
| $75,000 to $99,999 | 369 (100.0%) | 0 (0.0%) |
| $100,000 and over | 216 (100.0%) | 0 (0.0%) |
Public vs Private Health Insurance Coverage by Age in Anderson
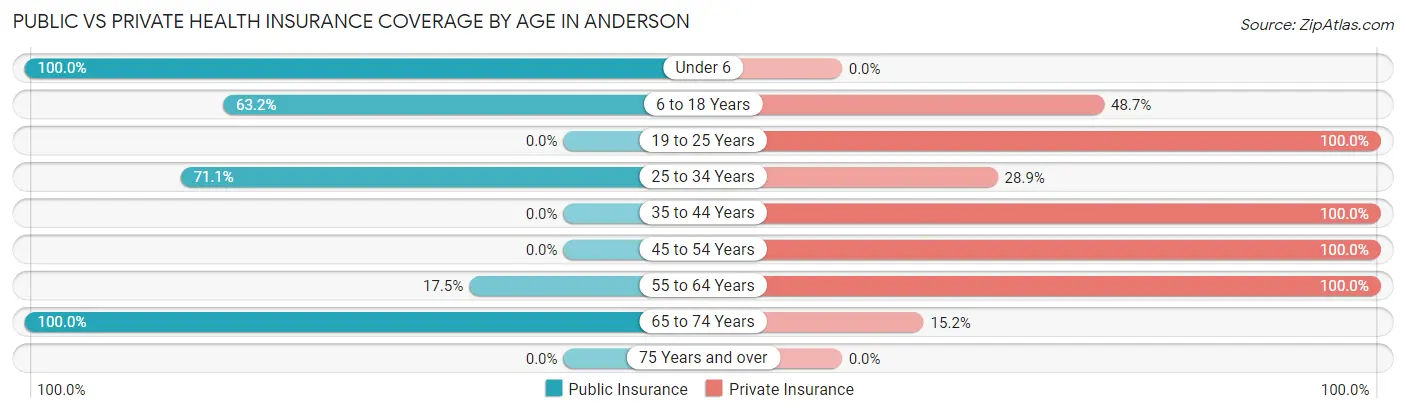
| Age Bracket | Public Insurance | Private Insurance |
| Under 6 | 31 (100.0%) | 0 (0.0%) |
| 6 to 18 Years | 96 (63.2%) | 74 (48.7%) |
| 19 to 25 Years | 0 (0.0%) | 55 (100.0%) |
| 25 to 34 Years | 86 (71.1%) | 35 (28.9%) |
| 35 to 44 Years | 0 (0.0%) | 84 (100.0%) |
| 45 to 54 Years | 0 (0.0%) | 22 (100.0%) |
| 55 to 64 Years | 21 (17.5%) | 120 (100.0%) |
| 65 to 74 Years | 79 (100.0%) | 12 (15.2%) |
| 75 Years and over | 0 (0.0%) | 0 (0.0%) |
| Total | 313 (47.1%) | 402 (60.5%) |
Disability Status by Sex by Age in Anderson
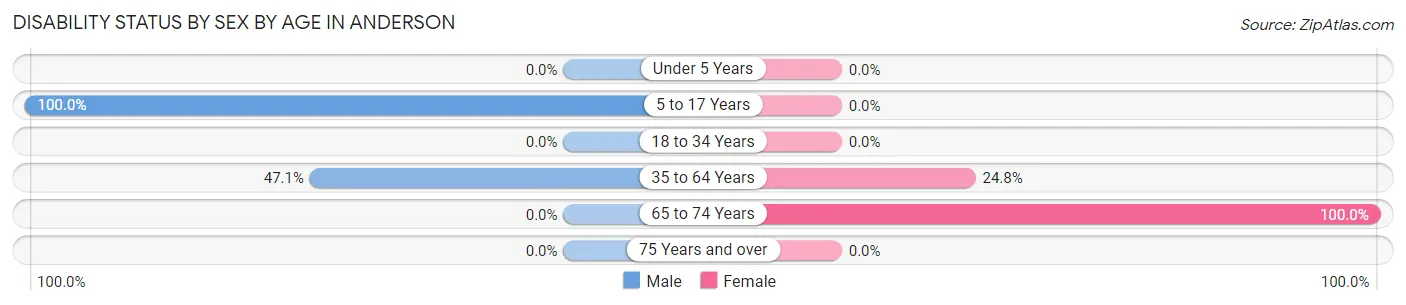
| Age Bracket | Male | Female |
| Under 5 Years | 0 (0.0%) | 0 (0.0%) |
| 5 to 17 Years | 78 (100.0%) | 0 (0.0%) |
| 18 to 34 Years | 0 (0.0%) | 0 (0.0%) |
| 35 to 64 Years | 40 (47.1%) | 35 (24.8%) |
| 65 to 74 Years | 0 (0.0%) | 40 (100.0%) |
| 75 Years and over | 0 (0.0%) | 0 (0.0%) |
Disability Class by Sex by Age in Anderson
Disability Class: Hearing Difficulty
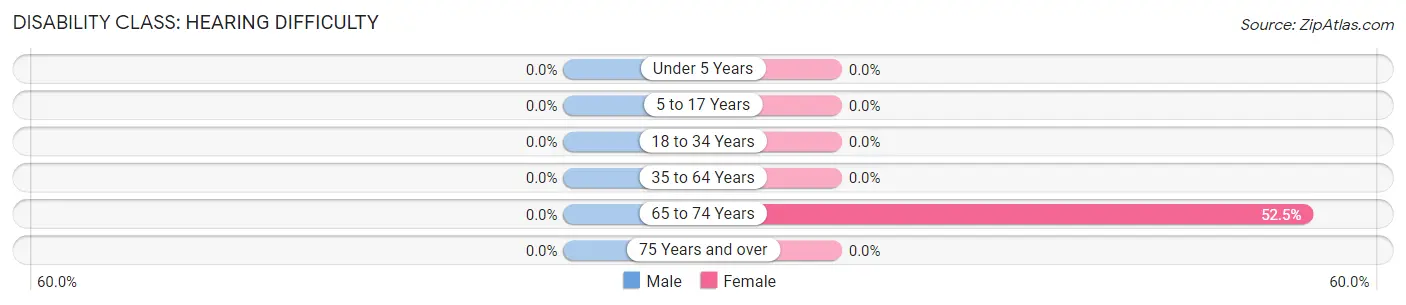
| Age Bracket | Male | Female |
| Under 5 Years | 0 (0.0%) | 0 (0.0%) |
| 5 to 17 Years | 0 (0.0%) | 0 (0.0%) |
| 18 to 34 Years | 0 (0.0%) | 0 (0.0%) |
| 35 to 64 Years | 0 (0.0%) | 0 (0.0%) |
| 65 to 74 Years | 0 (0.0%) | 21 (52.5%) |
| 75 Years and over | 0 (0.0%) | 0 (0.0%) |
Disability Class: Vision Difficulty
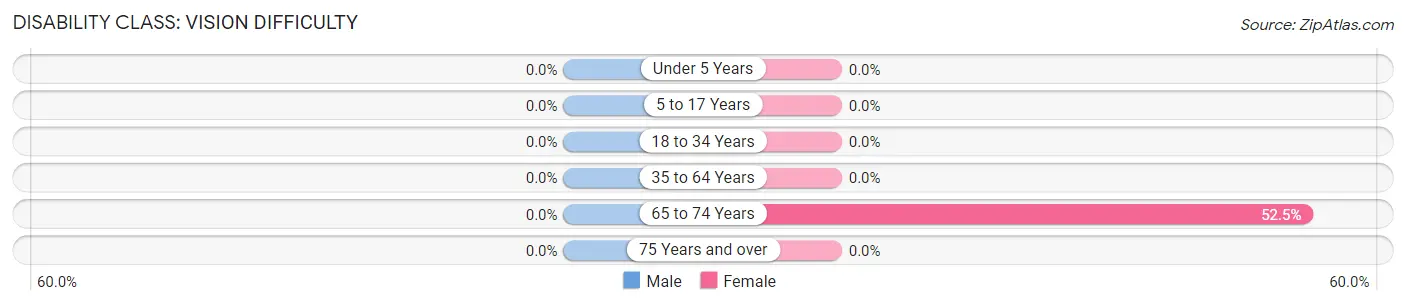
| Age Bracket | Male | Female |
| Under 5 Years | 0 (0.0%) | 0 (0.0%) |
| 5 to 17 Years | 0 (0.0%) | 0 (0.0%) |
| 18 to 34 Years | 0 (0.0%) | 0 (0.0%) |
| 35 to 64 Years | 0 (0.0%) | 0 (0.0%) |
| 65 to 74 Years | 0 (0.0%) | 21 (52.5%) |
| 75 Years and over | 0 (0.0%) | 0 (0.0%) |
Disability Class: Cognitive Difficulty
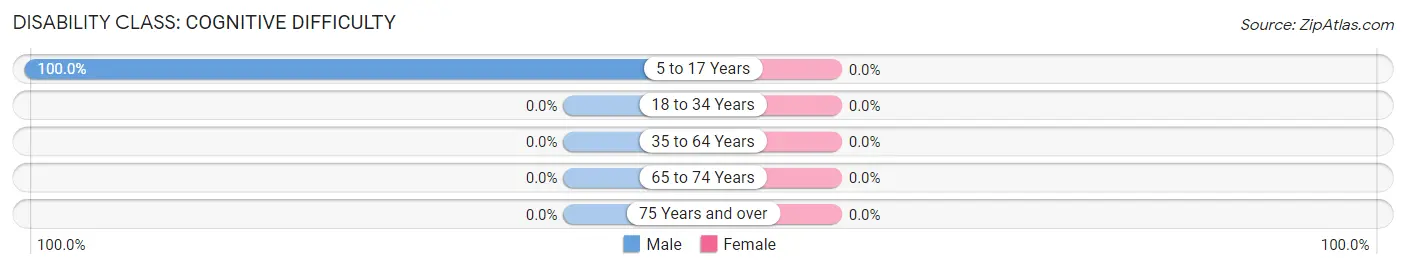
| Age Bracket | Male | Female |
| 5 to 17 Years | 78 (100.0%) | 0 (0.0%) |
| 18 to 34 Years | 0 (0.0%) | 0 (0.0%) |
| 35 to 64 Years | 0 (0.0%) | 0 (0.0%) |
| 65 to 74 Years | 0 (0.0%) | 0 (0.0%) |
| 75 Years and over | 0 (0.0%) | 0 (0.0%) |
Disability Class: Ambulatory Difficulty
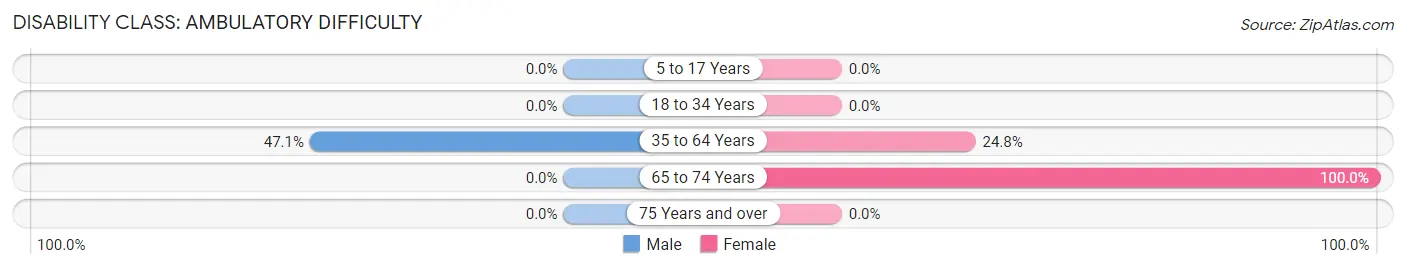
| Age Bracket | Male | Female |
| 5 to 17 Years | 0 (0.0%) | 0 (0.0%) |
| 18 to 34 Years | 0 (0.0%) | 0 (0.0%) |
| 35 to 64 Years | 40 (47.1%) | 35 (24.8%) |
| 65 to 74 Years | 0 (0.0%) | 40 (100.0%) |
| 75 Years and over | 0 (0.0%) | 0 (0.0%) |
Disability Class: Self-Care Difficulty
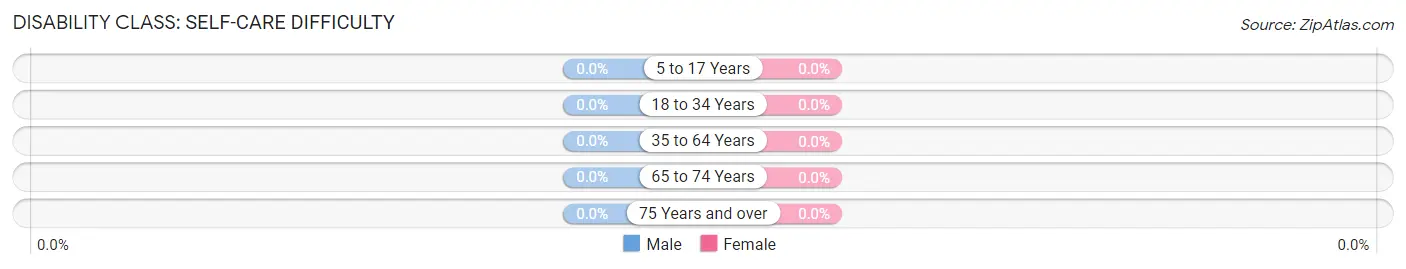
| Age Bracket | Male | Female |
| 5 to 17 Years | 0 (0.0%) | 0 (0.0%) |
| 18 to 34 Years | 0 (0.0%) | 0 (0.0%) |
| 35 to 64 Years | 0 (0.0%) | 0 (0.0%) |
| 65 to 74 Years | 0 (0.0%) | 0 (0.0%) |
| 75 Years and over | 0 (0.0%) | 0 (0.0%) |
Technology Access in Anderson
Computing Device Access in Anderson
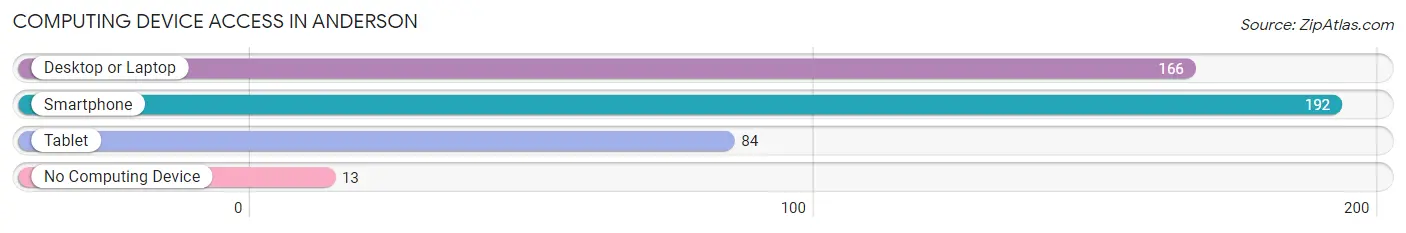
| Device Type | # Households | % Households |
| Desktop or Laptop | 166 | 81.0% |
| Smartphone | 192 | 93.7% |
| Tablet | 84 | 41.0% |
| No Computing Device | 13 | 6.3% |
| Total | 205 | 100.0% |
Internet Access in Anderson
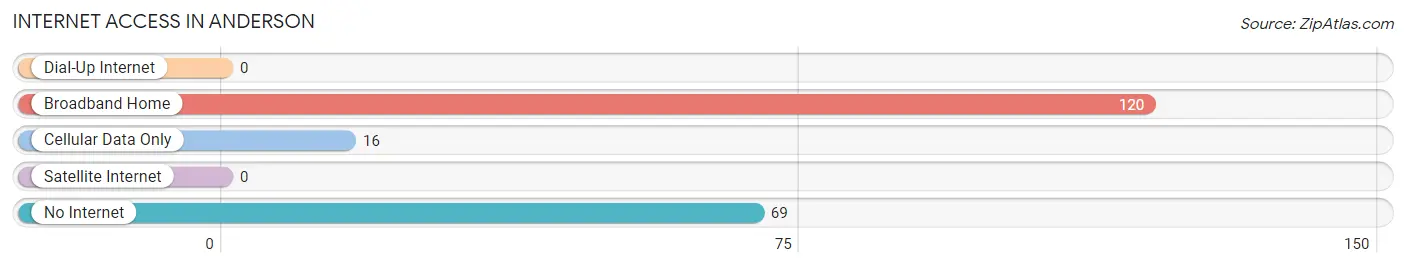
| Internet Type | # Households | % Households |
| Dial-Up Internet | 0 | 0.0% |
| Broadband Home | 120 | 58.5% |
| Cellular Data Only | 16 | 7.8% |
| Satellite Internet | 0 | 0.0% |
| No Internet | 69 | 33.7% |
| Total | 205 | 100.0% |
Anderson Summary
Anderson, NJ is a small city located in the state of New Jersey. It is situated in the northern part of the state, in the county of Hudson. The city is bordered by the cities of Bayonne, Jersey City, and Hoboken. Anderson is a small city with a population of just over 8,000 people, according to the 2010 census.
The city of Anderson was founded in 1871 by William Anderson, a Scottish immigrant. Anderson was a successful businessman who owned a large amount of land in the area. He named the city after himself and it quickly grew into a thriving community.
The geography of Anderson is mostly flat, with some hills in the northern part of the city. The city is located on the Hackensack River, which provides a natural border between Anderson and the neighboring cities of Bayonne and Jersey City. The city is also home to several parks, including Anderson Park, which is located on the banks of the Hackensack River.
The economy of Anderson is largely based on the service industry. The city is home to several small businesses, including restaurants, retail stores, and professional services. The city also has a large number of manufacturing companies, including a large paper mill.
The demographics of Anderson are diverse. The city is home to a large number of immigrants, including those from Latin America, Asia, and Europe. The city also has a large African American population, as well as a significant number of people of Hispanic and Asian descent.
Anderson is a small city with a rich history and a diverse population. The city is home to a variety of businesses, parks, and cultural attractions. The city is also home to a number of educational institutions, including a community college and a public library. Anderson is a great place to live and work, and it is a great place to visit.
Common Questions
What is Per Capita Income in Anderson?
Per Capita income in Anderson is $26,616.
What is the Median Family Income in Anderson?
Median Family Income in Anderson is $76,913.
What is the Median Household income in Anderson?
Median Household Income in Anderson is $77,405.
What is Inequality or Gini Index in Anderson?
Inequality or Gini Index in Anderson is 0.21.
What is the Total Population of Anderson?
Total Population of Anderson is 664.
What is the Total Male Population of Anderson?
Total Male Population of Anderson is 297.
What is the Total Female Population of Anderson?
Total Female Population of Anderson is 367.
What is the Ratio of Males per 100 Females in Anderson?
There are 80.93 Males per 100 Females in Anderson.
What is the Ratio of Females per 100 Males in Anderson?
There are 123.57 Females per 100 Males in Anderson.
What is the Median Population Age in Anderson?
Median Population Age in Anderson is 28.6 Years.
What is the Average Family Size in Anderson
Average Family Size in Anderson is 3.4 People.
What is the Average Household Size in Anderson
Average Household Size in Anderson is 3.2 People.
How Large is the Labor Force in Anderson?
There are 336 People in the Labor Forcein in Anderson.
What is the Percentage of People in the Labor Force in Anderson?
60.1% of People are in the Labor Force in Anderson.
What is the Unemployment Rate in Anderson?
Unemployment Rate in Anderson is 5.7%.