Raritan borough, NJ Map & Demographics
Raritan borough Overview
$56,129
PER CAPITA INCOME
$127,528
AVG FAMILY INCOME
$99,928
AVG HOUSEHOLD INCOME
2.6%
WAGE / INCOME GAP [ % ]
97.4¢/ $1
WAGE / INCOME GAP [ $ ]
$8,356
FAMILY INCOME DEFICIT
0.44
INEQUALITY / GINI INDEX
8,301
TOTAL POPULATION
4,224
MALE POPULATION
4,077
FEMALE POPULATION
103.61
MALES / 100 FEMALES
96.52
FEMALES / 100 MALES
43.2
MEDIAN AGE
3.2
AVG FAMILY SIZE
2.5
AVG HOUSEHOLD SIZE
5,514
LABOR FORCE [ PEOPLE ]
76.6%
PERCENT IN LABOR FORCE
5.5%
UNEMPLOYMENT RATE
Income in Raritan borough
Income Overview in Raritan borough
Per Capita Income in Raritan borough is $56,129, while median incomes of families and households are $127,528 and $99,928 respectively.
| Characteristic | Number | Measure |
| Per Capita Income | 8,301 | $56,129 |
| Median Family Income | 2,051 | $127,528 |
| Mean Family Income | 2,051 | $145,326 |
| Median Household Income | 3,262 | $99,928 |
| Mean Household Income | 3,262 | $138,842 |
| Income Deficit | 2,051 | $8,356 |
| Wage / Income Gap (%) | 8,301 | 2.59% |
| Wage / Income Gap ($) | 8,301 | 97.41¢ per $1 |
| Gini / Inequality Index | 8,301 | 0.44 |
Earnings by Sex in Raritan borough
Average Earnings in Raritan borough are $50,931, $51,111 for men and $49,789 for women, a difference of 2.6%.
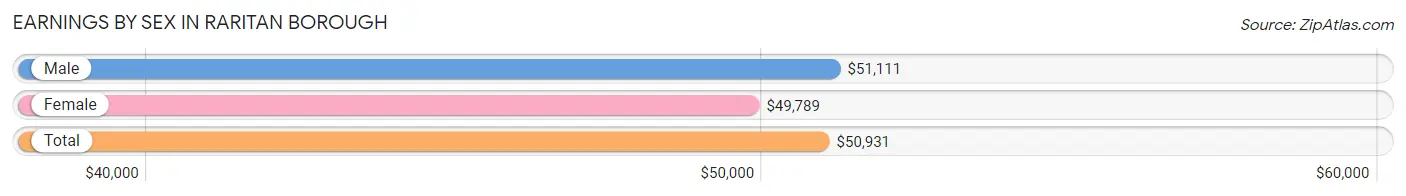
| Sex | Number | Average Earnings |
| Male | 2,978 (54.6%) | $51,111 |
| Female | 2,475 (45.4%) | $49,789 |
| Total | 5,453 (100.0%) | $50,931 |
Earnings by Sex by Income Bracket in Raritan borough
The most common earnings brackets in Raritan borough are $100,000+ for men (776 | 26.1%) and $75,000 to $99,999 for women (446 | 18.0%).
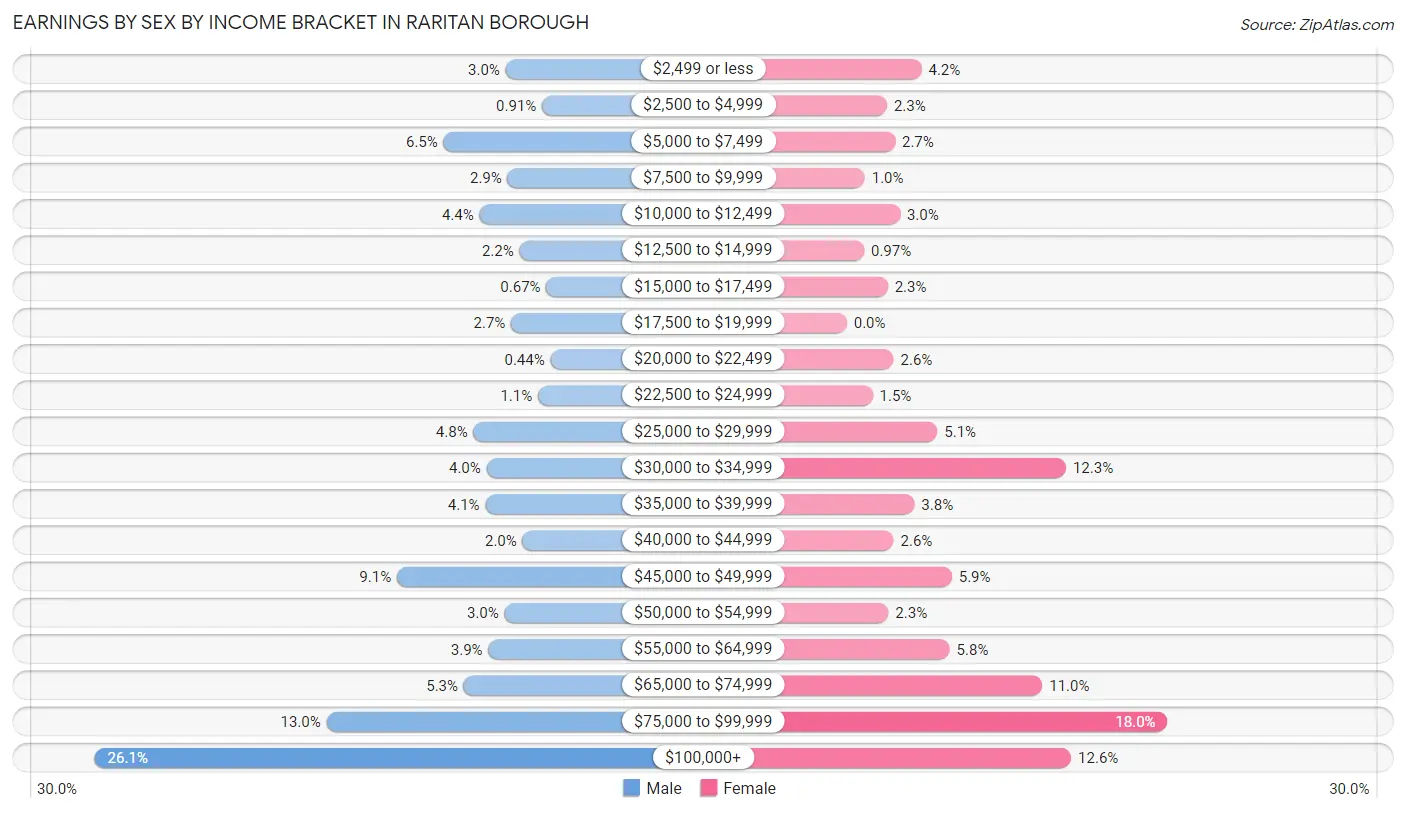
| Income | Male | Female |
| $2,499 or less | 88 (3.0%) | 104 (4.2%) |
| $2,500 to $4,999 | 27 (0.9%) | 56 (2.3%) |
| $5,000 to $7,499 | 192 (6.5%) | 67 (2.7%) |
| $7,500 to $9,999 | 85 (2.9%) | 25 (1.0%) |
| $10,000 to $12,499 | 132 (4.4%) | 74 (3.0%) |
| $12,500 to $14,999 | 65 (2.2%) | 24 (1.0%) |
| $15,000 to $17,499 | 20 (0.7%) | 57 (2.3%) |
| $17,500 to $19,999 | 79 (2.6%) | 0 (0.0%) |
| $20,000 to $22,499 | 13 (0.4%) | 65 (2.6%) |
| $22,500 to $24,999 | 34 (1.1%) | 36 (1.5%) |
| $25,000 to $29,999 | 142 (4.8%) | 126 (5.1%) |
| $30,000 to $34,999 | 120 (4.0%) | 305 (12.3%) |
| $35,000 to $39,999 | 122 (4.1%) | 94 (3.8%) |
| $40,000 to $44,999 | 60 (2.0%) | 65 (2.6%) |
| $45,000 to $49,999 | 270 (9.1%) | 146 (5.9%) |
| $50,000 to $54,999 | 90 (3.0%) | 58 (2.3%) |
| $55,000 to $64,999 | 117 (3.9%) | 143 (5.8%) |
| $65,000 to $74,999 | 158 (5.3%) | 272 (11.0%) |
| $75,000 to $99,999 | 388 (13.0%) | 446 (18.0%) |
| $100,000+ | 776 (26.1%) | 312 (12.6%) |
| Total | 2,978 (100.0%) | 2,475 (100.0%) |
Earnings by Sex by Educational Attainment in Raritan borough
Average earnings in Raritan borough are $68,011 for men and $60,547 for women, a difference of 11.0%. Men with an educational attainment of graduate degree enjoy the highest average annual earnings of $140,714, while those with less than high school education earn the least with $46,685. Women with an educational attainment of graduate degree earn the most with the average annual earnings of $79,864, while those with less than high school education have the smallest earnings of $32,850.
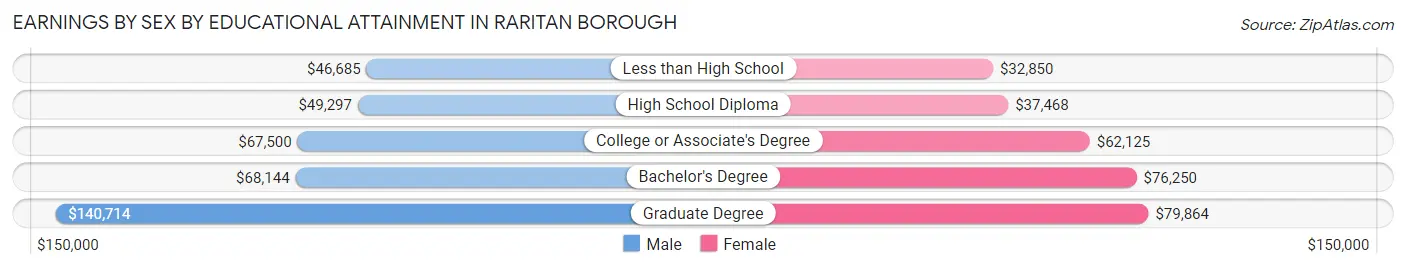
| Educational Attainment | Male Income | Female Income |
| Less than High School | $46,685 | $32,850 |
| High School Diploma | $49,297 | $37,468 |
| College or Associate's Degree | $67,500 | $62,125 |
| Bachelor's Degree | $68,144 | $76,250 |
| Graduate Degree | $140,714 | $79,864 |
| Total | $68,011 | $60,547 |
Family Income in Raritan borough
Family Income Brackets in Raritan borough
According to the Raritan borough family income data, there are 431 families falling into the $200,000+ income range, which is the most common income bracket and makes up 21.0% of all families. Conversely, the $10,000 to $14,999 income bracket is the least frequent group with only 29 families (1.4%) belonging to this category.
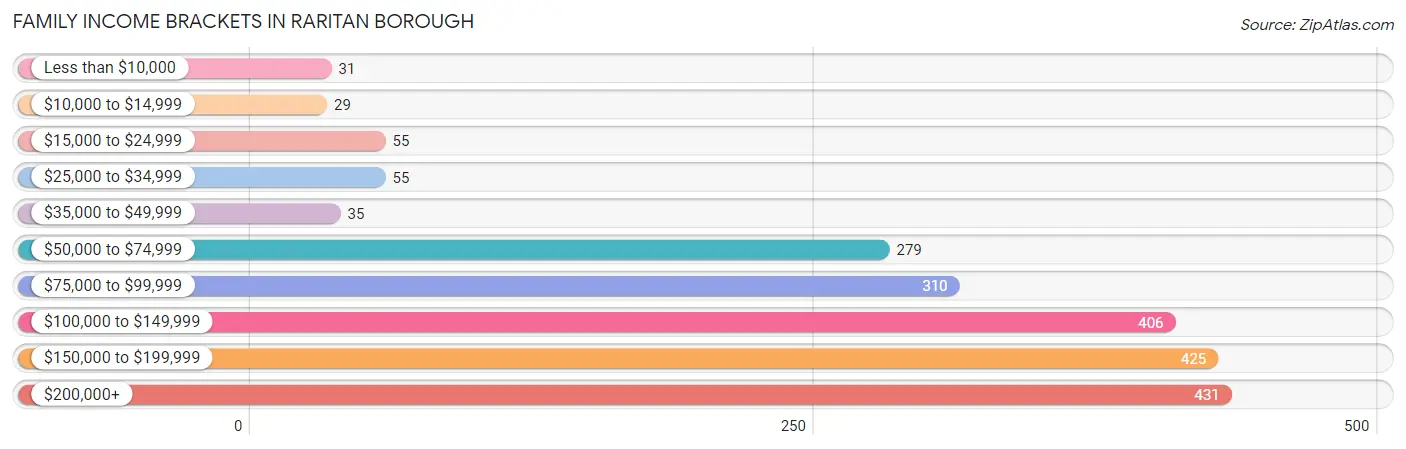
| Income Bracket | # Families | % Families |
| Less than $10,000 | 31 | 1.5% |
| $10,000 to $14,999 | 29 | 1.4% |
| $15,000 to $24,999 | 55 | 2.7% |
| $25,000 to $34,999 | 55 | 2.7% |
| $35,000 to $49,999 | 35 | 1.7% |
| $50,000 to $74,999 | 279 | 13.6% |
| $75,000 to $99,999 | 310 | 15.1% |
| $100,000 to $149,999 | 406 | 19.8% |
| $150,000 to $199,999 | 425 | 20.7% |
| $200,000+ | 431 | 21.0% |
Family Income by Famaliy Size in Raritan borough
6-person families (55 | 2.7%) account for the highest median family income in Raritan borough with $250,001 per family, while 2-person families (879 | 42.9%) have the highest median income of $50,860 per family member.
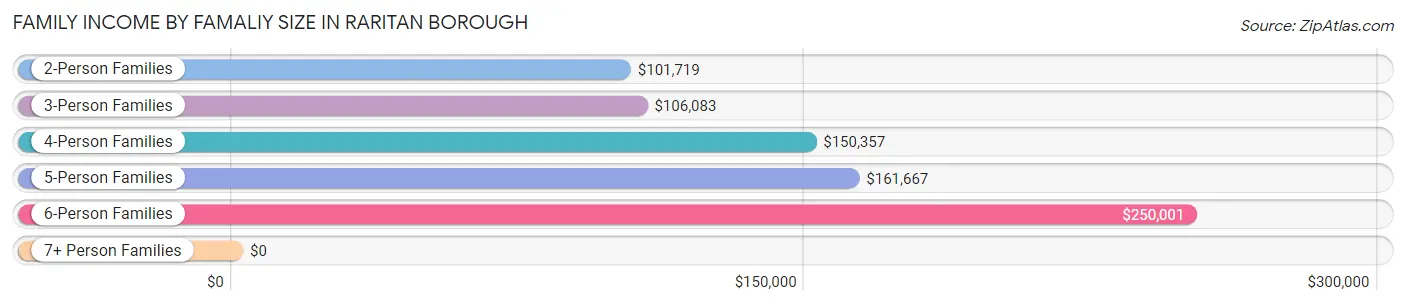
| Income Bracket | # Families | Median Income |
| 2-Person Families | 879 (42.9%) | $101,719 |
| 3-Person Families | 533 (26.0%) | $106,083 |
| 4-Person Families | 420 (20.5%) | $150,357 |
| 5-Person Families | 152 (7.4%) | $161,667 |
| 6-Person Families | 55 (2.7%) | $250,001 |
| 7+ Person Families | 12 (0.6%) | $0 |
| Total | 2,051 (100.0%) | $127,528 |
Family Income by Number of Earners in Raritan borough
The median family income in Raritan borough is $127,528, with families comprising 2 earners (1,019) having the highest median family income of $158,750, while families with no earners (159) have the lowest median family income of $52,396, accounting for 49.7% and 7.7% of families, respectively.
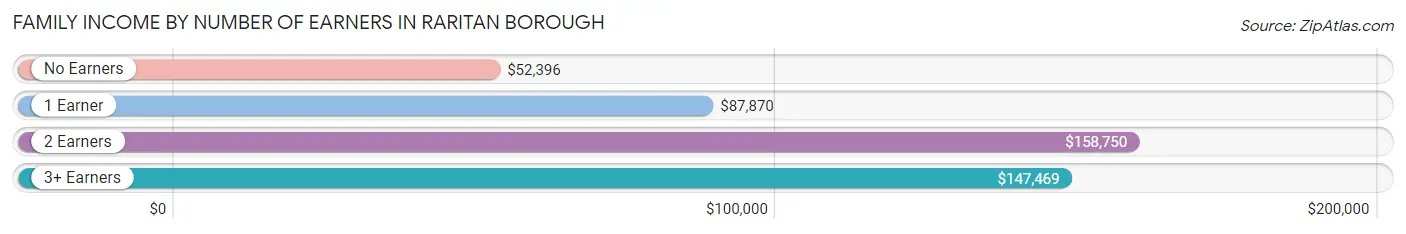
| Number of Earners | # Families | Median Income |
| No Earners | 159 (7.7%) | $52,396 |
| 1 Earner | 488 (23.8%) | $87,870 |
| 2 Earners | 1,019 (49.7%) | $158,750 |
| 3+ Earners | 385 (18.8%) | $147,469 |
| Total | 2,051 (100.0%) | $127,528 |
Household Income in Raritan borough
Household Income Brackets in Raritan borough
With 603 households falling in the category, the $100,000 to $149,999 income range is the most frequent in Raritan borough, accounting for 18.5% of all households. In contrast, only 42 households (1.3%) fall into the less than $10,000 income bracket, making it the least populous group.
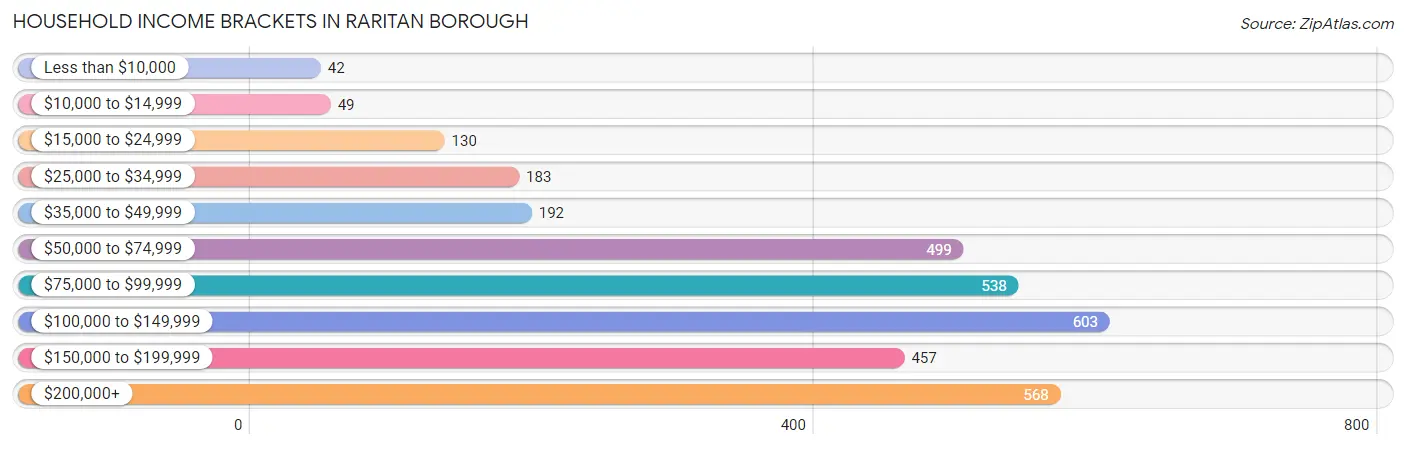
| Income Bracket | # Households | % Households |
| Less than $10,000 | 42 | 1.3% |
| $10,000 to $14,999 | 49 | 1.5% |
| $15,000 to $24,999 | 130 | 4.0% |
| $25,000 to $34,999 | 183 | 5.6% |
| $35,000 to $49,999 | 192 | 5.9% |
| $50,000 to $74,999 | 499 | 15.3% |
| $75,000 to $99,999 | 538 | 16.5% |
| $100,000 to $149,999 | 603 | 18.5% |
| $150,000 to $199,999 | 457 | 14.0% |
| $200,000+ | 568 | 17.4% |
Household Income by Householder Age in Raritan borough
The median household income in Raritan borough is $99,928, with the highest median household income of $134,423 found in the 25 to 44 years age bracket for the primary householder. A total of 1,012 households (31.0%) fall into this category. Meanwhile, the 65+ years age bracket for the primary householder has the lowest median household income of $51,771, with 621 households (19.0%) in this group.
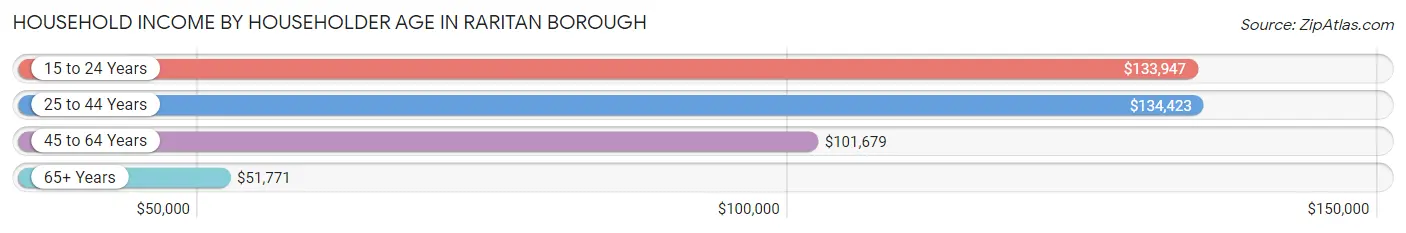
| Income Bracket | # Households | Median Income |
| 15 to 24 Years | 62 (1.9%) | $133,947 |
| 25 to 44 Years | 1,012 (31.0%) | $134,423 |
| 45 to 64 Years | 1,567 (48.0%) | $101,679 |
| 65+ Years | 621 (19.0%) | $51,771 |
| Total | 3,262 (100.0%) | $99,928 |
Poverty in Raritan borough
Income Below Poverty by Sex and Age in Raritan borough
With 3.7% poverty level for males and 6.9% for females among the residents of Raritan borough, 35 to 44 year old males and 12 to 14 year old females are the most vulnerable to poverty, with 49 males (9.4%) and 19 females (26.8%) in their respective age groups living below the poverty level.
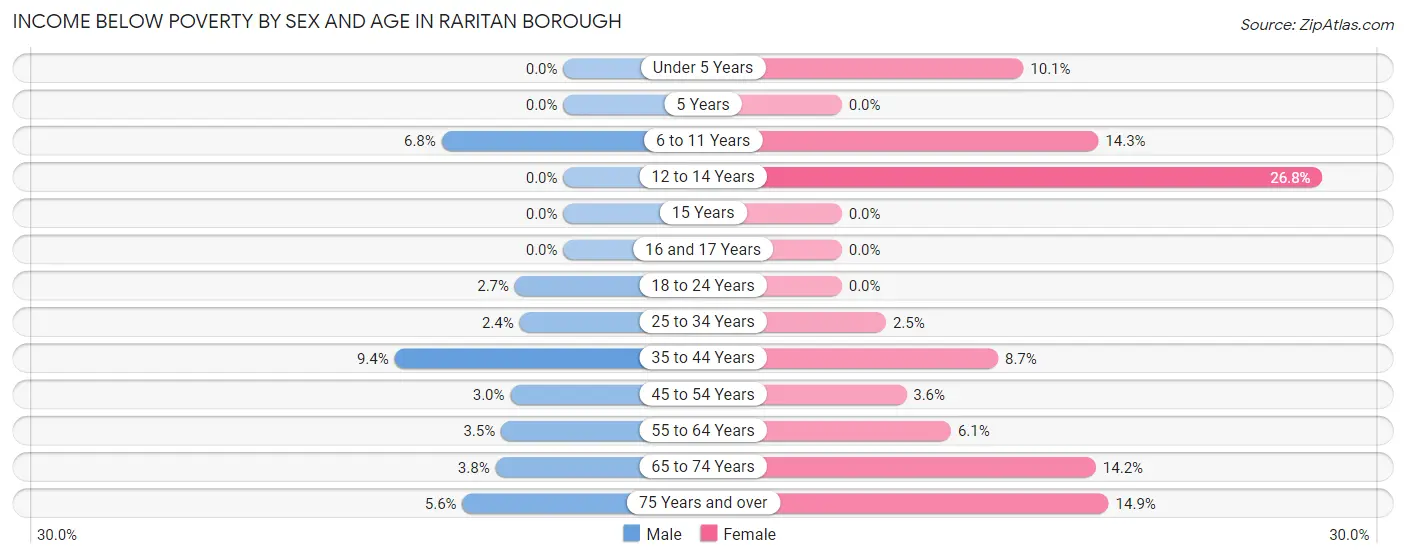
| Age Bracket | Male | Female |
| Under 5 Years | 0 (0.0%) | 9 (10.1%) |
| 5 Years | 0 (0.0%) | 0 (0.0%) |
| 6 to 11 Years | 12 (6.8%) | 41 (14.3%) |
| 12 to 14 Years | 0 (0.0%) | 19 (26.8%) |
| 15 Years | 0 (0.0%) | 0 (0.0%) |
| 16 and 17 Years | 0 (0.0%) | 0 (0.0%) |
| 18 to 24 Years | 15 (2.7%) | 0 (0.0%) |
| 25 to 34 Years | 15 (2.4%) | 12 (2.5%) |
| 35 to 44 Years | 49 (9.4%) | 46 (8.7%) |
| 45 to 54 Years | 18 (2.9%) | 30 (3.6%) |
| 55 to 64 Years | 25 (3.5%) | 41 (6.1%) |
| 65 to 74 Years | 15 (3.8%) | 61 (14.1%) |
| 75 Years and over | 9 (5.6%) | 22 (14.9%) |
| Total | 158 (3.7%) | 281 (6.9%) |
Income Above Poverty by Sex and Age in Raritan borough
According to the poverty statistics in Raritan borough, males aged under 5 years and females aged 5 years are the age groups that are most secure financially, with 100.0% of males and 100.0% of females in these age groups living above the poverty line.
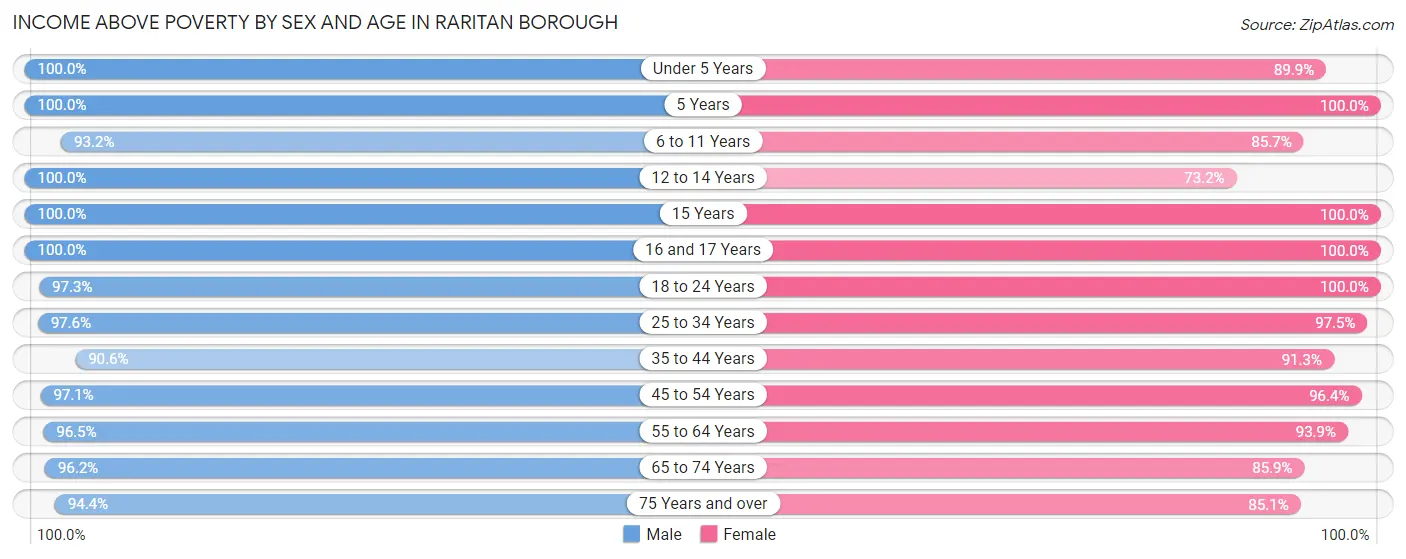
| Age Bracket | Male | Female |
| Under 5 Years | 197 (100.0%) | 80 (89.9%) |
| 5 Years | 7 (100.0%) | 13 (100.0%) |
| 6 to 11 Years | 165 (93.2%) | 246 (85.7%) |
| 12 to 14 Years | 181 (100.0%) | 52 (73.2%) |
| 15 Years | 21 (100.0%) | 47 (100.0%) |
| 16 and 17 Years | 49 (100.0%) | 80 (100.0%) |
| 18 to 24 Years | 540 (97.3%) | 373 (100.0%) |
| 25 to 34 Years | 599 (97.6%) | 475 (97.5%) |
| 35 to 44 Years | 472 (90.6%) | 483 (91.3%) |
| 45 to 54 Years | 593 (97.1%) | 805 (96.4%) |
| 55 to 64 Years | 695 (96.5%) | 633 (93.9%) |
| 65 to 74 Years | 382 (96.2%) | 370 (85.9%) |
| 75 Years and over | 151 (94.4%) | 126 (85.1%) |
| Total | 4,052 (96.3%) | 3,783 (93.1%) |
Income Below Poverty Among Married-Couple Families in Raritan borough
The poverty statistics for married-couple families in Raritan borough show that 5.9% or 106 of the total 1,810 families live below the poverty line. Families with 1 or 2 children have the highest poverty rate of 6.9%, comprising of 48 families. On the other hand, families with 3 or 4 children have the lowest poverty rate of 0.0%, which includes 0 families.
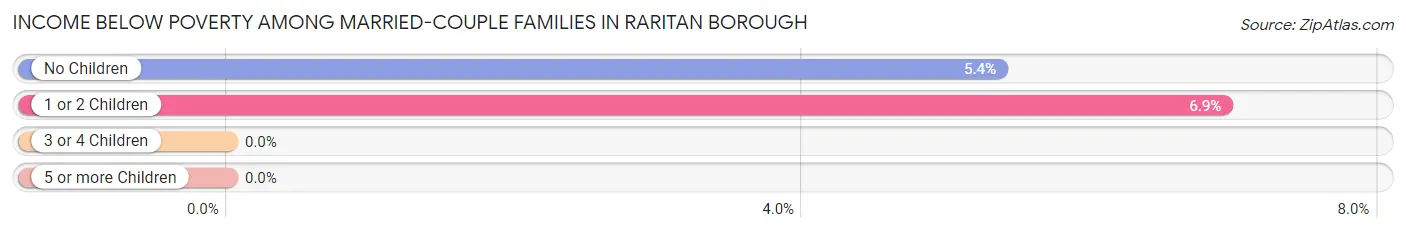
| Children | Above Poverty | Below Poverty |
| No Children | 1,025 (94.6%) | 58 (5.4%) |
| 1 or 2 Children | 645 (93.1%) | 48 (6.9%) |
| 3 or 4 Children | 34 (100.0%) | 0 (0.0%) |
| 5 or more Children | 0 (0.0%) | 0 (0.0%) |
| Total | 1,704 (94.1%) | 106 (5.9%) |
Income Below Poverty Among Single-Parent Households in Raritan borough
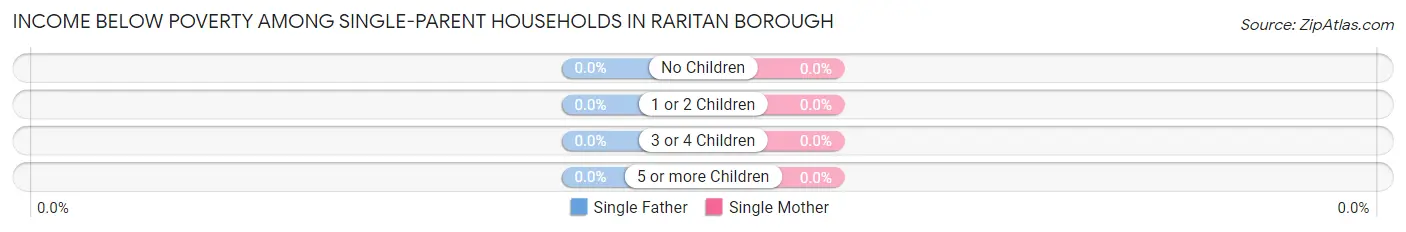
| Children | Single Father | Single Mother |
| No Children | 0 (0.0%) | 0 (0.0%) |
| 1 or 2 Children | 0 (0.0%) | 0 (0.0%) |
| 3 or 4 Children | 0 (0.0%) | 0 (0.0%) |
| 5 or more Children | 0 (0.0%) | 0 (0.0%) |
| Total | 0 (0.0%) | 0 (0.0%) |
Income Below Poverty Among Married-Couple vs Single-Parent Households in Raritan borough
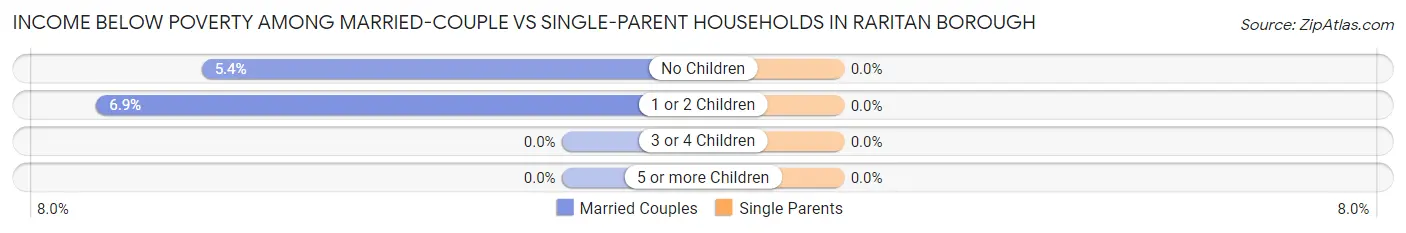
| Children | Married-Couple Families | Single-Parent Households |
| No Children | 58 (5.4%) | 0 (0.0%) |
| 1 or 2 Children | 48 (6.9%) | 0 (0.0%) |
| 3 or 4 Children | 0 (0.0%) | 0 (0.0%) |
| 5 or more Children | 0 (0.0%) | 0 (0.0%) |
| Total | 106 (5.9%) | 0 (0.0%) |
Race in Raritan borough
The most populous races in Raritan borough are White / Caucasian (4,834 | 58.2%), Hispanic or Latino (1,742 | 21.0%), and Asian (1,396 | 16.8%).
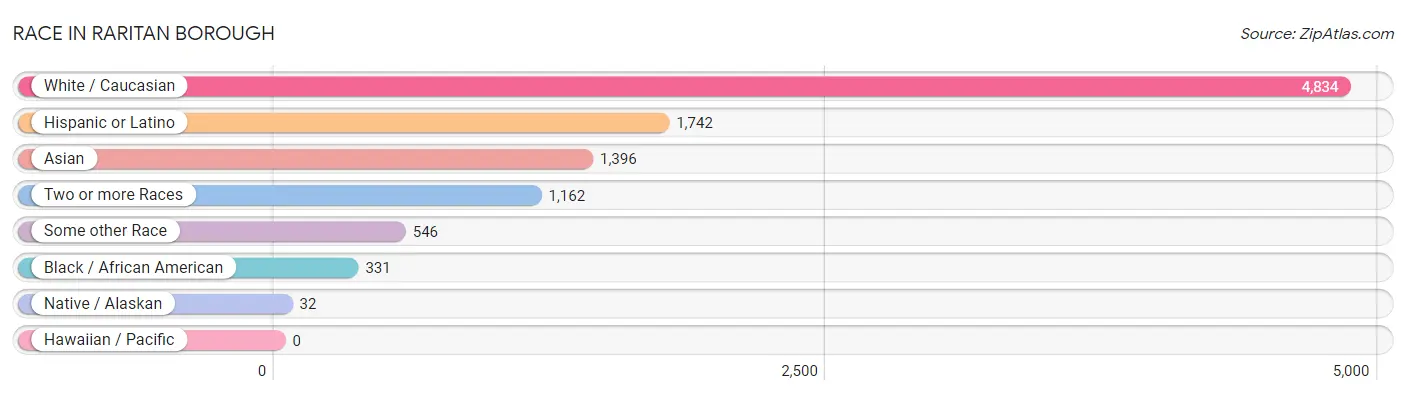
| Race | # Population | % Population |
| Asian | 1,396 | 16.8% |
| Black / African American | 331 | 4.0% |
| Hawaiian / Pacific | 0 | 0.0% |
| Hispanic or Latino | 1,742 | 21.0% |
| Native / Alaskan | 32 | 0.4% |
| White / Caucasian | 4,834 | 58.2% |
| Two or more Races | 1,162 | 14.0% |
| Some other Race | 546 | 6.6% |
| Total | 8,301 | 100.0% |
Ancestry in Raritan borough
The most populous ancestries reported in Raritan borough are Italian (1,101 | 13.3%), South American (845 | 10.2%), German (749 | 9.0%), Irish (721 | 8.7%), and Korean (673 | 8.1%), together accounting for 49.3% of all Raritan borough residents.
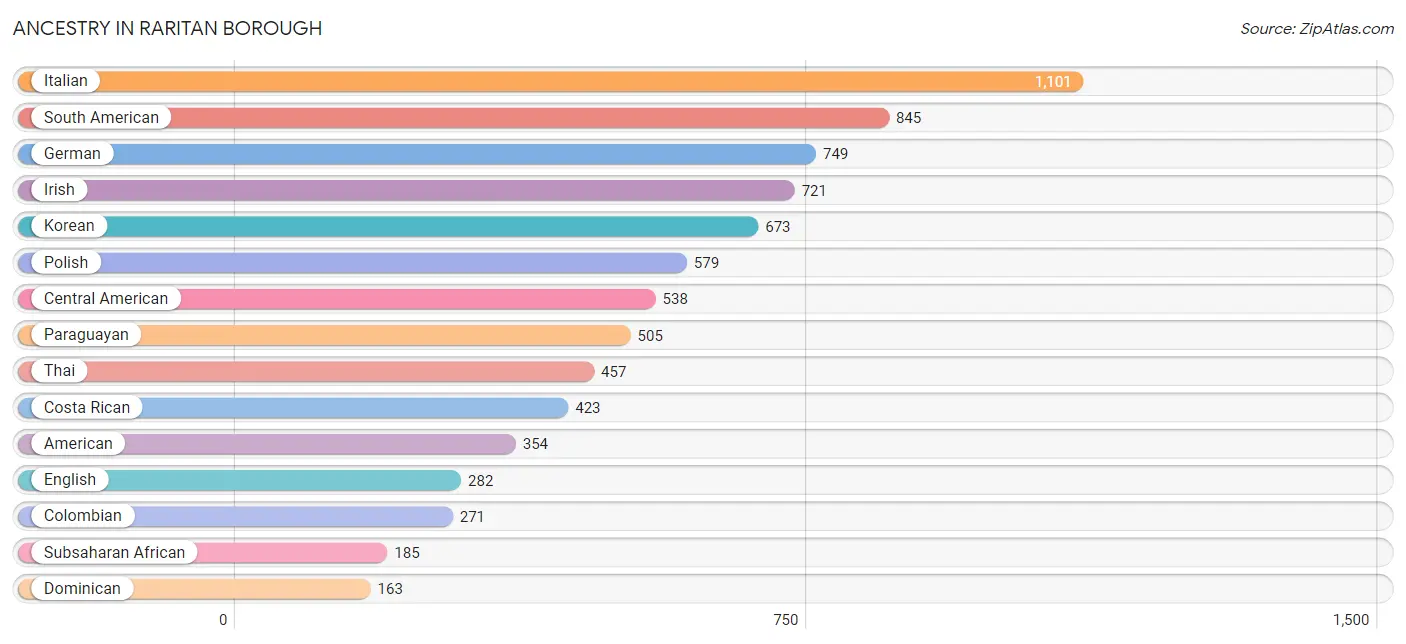
| Ancestry | # Population | % Population |
| African | 72 | 0.9% |
| Albanian | 26 | 0.3% |
| American | 354 | 4.3% |
| Arab | 42 | 0.5% |
| Austrian | 41 | 0.5% |
| Bhutanese | 33 | 0.4% |
| Brazilian | 134 | 1.6% |
| Burmese | 14 | 0.2% |
| Central American | 538 | 6.5% |
| Central American Indian | 53 | 0.6% |
| Colombian | 271 | 3.3% |
| Costa Rican | 423 | 5.1% |
| Cuban | 7 | 0.1% |
| Czech | 18 | 0.2% |
| Czechoslovakian | 16 | 0.2% |
| Danish | 18 | 0.2% |
| Dominican | 163 | 2.0% |
| Dutch | 21 | 0.3% |
| Eastern European | 11 | 0.1% |
| Ecuadorian | 59 | 0.7% |
| English | 282 | 3.4% |
| European | 96 | 1.2% |
| Filipino | 19 | 0.2% |
| French | 50 | 0.6% |
| French Canadian | 48 | 0.6% |
| German | 749 | 9.0% |
| Ghanaian | 113 | 1.4% |
| Greek | 48 | 0.6% |
| Guatemalan | 98 | 1.2% |
| Guyanese | 28 | 0.3% |
| Hungarian | 53 | 0.6% |
| Indian (Asian) | 149 | 1.8% |
| Iranian | 39 | 0.5% |
| Irish | 721 | 8.7% |
| Italian | 1,101 | 13.3% |
| Jordanian | 11 | 0.1% |
| Korean | 673 | 8.1% |
| Laotian | 1 | 0.0% |
| Lebanese | 15 | 0.2% |
| Lithuanian | 52 | 0.6% |
| Lumbee | 12 | 0.1% |
| Mexican | 31 | 0.4% |
| Moroccan | 15 | 0.2% |
| Norwegian | 86 | 1.0% |
| Panamanian | 17 | 0.2% |
| Paraguayan | 505 | 6.1% |
| Peruvian | 10 | 0.1% |
| Polish | 579 | 7.0% |
| Portuguese | 126 | 1.5% |
| Puerto Rican | 141 | 1.7% |
| Romanian | 22 | 0.3% |
| Russian | 152 | 1.8% |
| Scotch-Irish | 23 | 0.3% |
| Scottish | 23 | 0.3% |
| Slovak | 52 | 0.6% |
| South American | 845 | 10.2% |
| South American Indian | 19 | 0.2% |
| Spanish | 17 | 0.2% |
| Sri Lankan | 73 | 0.9% |
| Subsaharan African | 185 | 2.2% |
| Swedish | 18 | 0.2% |
| Swiss | 9 | 0.1% |
| Thai | 457 | 5.5% |
| Ukrainian | 32 | 0.4% | View All 64 Rows |
Immigrants in Raritan borough
The most numerous immigrant groups reported in Raritan borough came from Asia (1,259 | 15.2%), Latin America (1,083 | 13.1%), South Eastern Asia (650 | 7.8%), South America (642 | 7.7%), and Philippines (558 | 6.7%), together accounting for 50.5% of all Raritan borough residents.
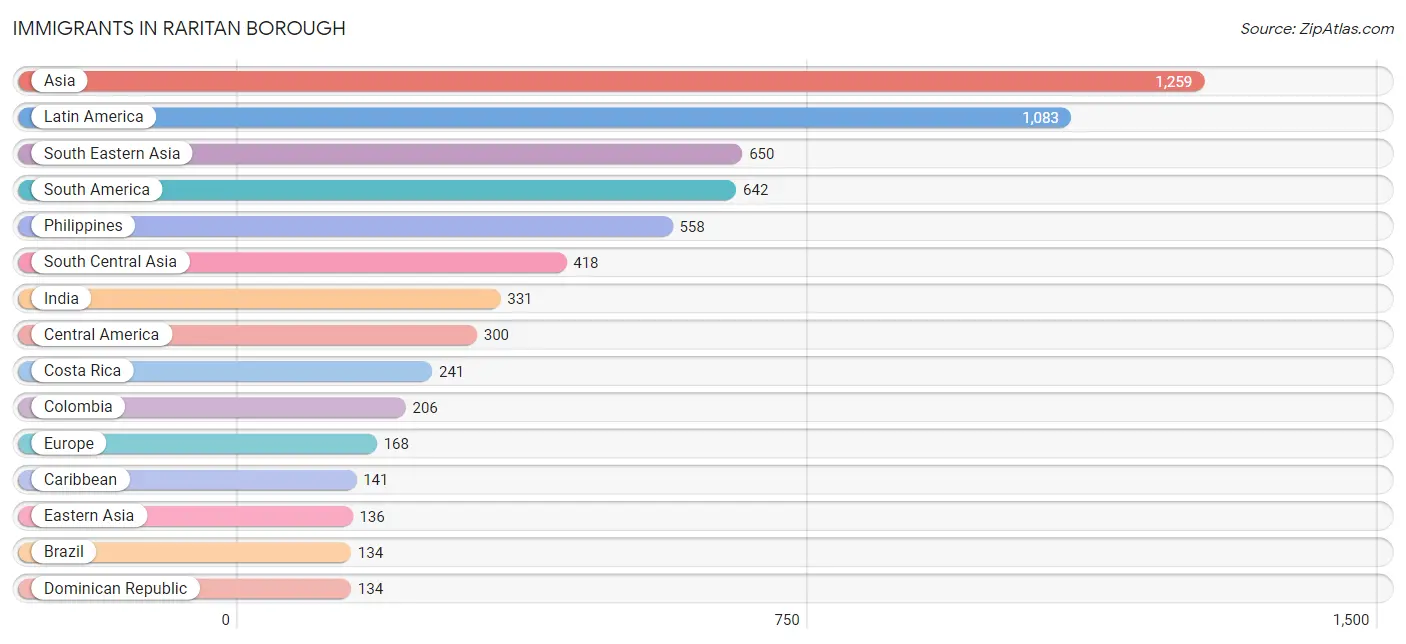
| Immigration Origin | # Population | % Population |
| Africa | 72 | 0.9% |
| Asia | 1,259 | 15.2% |
| Brazil | 134 | 1.6% |
| Canada | 60 | 0.7% |
| Caribbean | 141 | 1.7% |
| Central America | 300 | 3.6% |
| China | 113 | 1.4% |
| Colombia | 206 | 2.5% |
| Costa Rica | 241 | 2.9% |
| Cuba | 7 | 0.1% |
| Dominican Republic | 134 | 1.6% |
| Eastern Asia | 136 | 1.6% |
| Eastern Europe | 59 | 0.7% |
| Ecuador | 19 | 0.2% |
| England | 25 | 0.3% |
| Europe | 168 | 2.0% |
| Germany | 23 | 0.3% |
| Ghana | 57 | 0.7% |
| Guatemala | 49 | 0.6% |
| Guyana | 18 | 0.2% |
| Hong Kong | 12 | 0.1% |
| India | 331 | 4.0% |
| Indonesia | 1 | 0.0% |
| Iran | 39 | 0.5% |
| Italy | 42 | 0.5% |
| Japan | 23 | 0.3% |
| Kuwait | 11 | 0.1% |
| Latin America | 1,083 | 13.1% |
| Lebanon | 15 | 0.2% |
| Lithuania | 1 | 0.0% |
| Morocco | 15 | 0.2% |
| Northern Africa | 15 | 0.2% |
| Northern Europe | 33 | 0.4% |
| Pakistan | 26 | 0.3% |
| Panama | 10 | 0.1% |
| Philippines | 558 | 6.7% |
| Portugal | 11 | 0.1% |
| Romania | 22 | 0.3% |
| Scotland | 8 | 0.1% |
| South America | 642 | 7.7% |
| South Central Asia | 418 | 5.0% |
| South Eastern Asia | 650 | 7.8% |
| Southern Europe | 53 | 0.6% |
| Sri Lanka | 22 | 0.3% |
| Taiwan | 48 | 0.6% |
| Ukraine | 13 | 0.2% |
| Vietnam | 91 | 1.1% |
| Western Africa | 57 | 0.7% |
| Western Asia | 55 | 0.7% |
| Western Europe | 23 | 0.3% | View All 50 Rows |
Sex and Age in Raritan borough
Sex and Age in Raritan borough
The most populous age groups in Raritan borough are 20 to 24 Years (481 | 11.4%) for men and 50 to 54 Years (495 | 12.1%) for women.
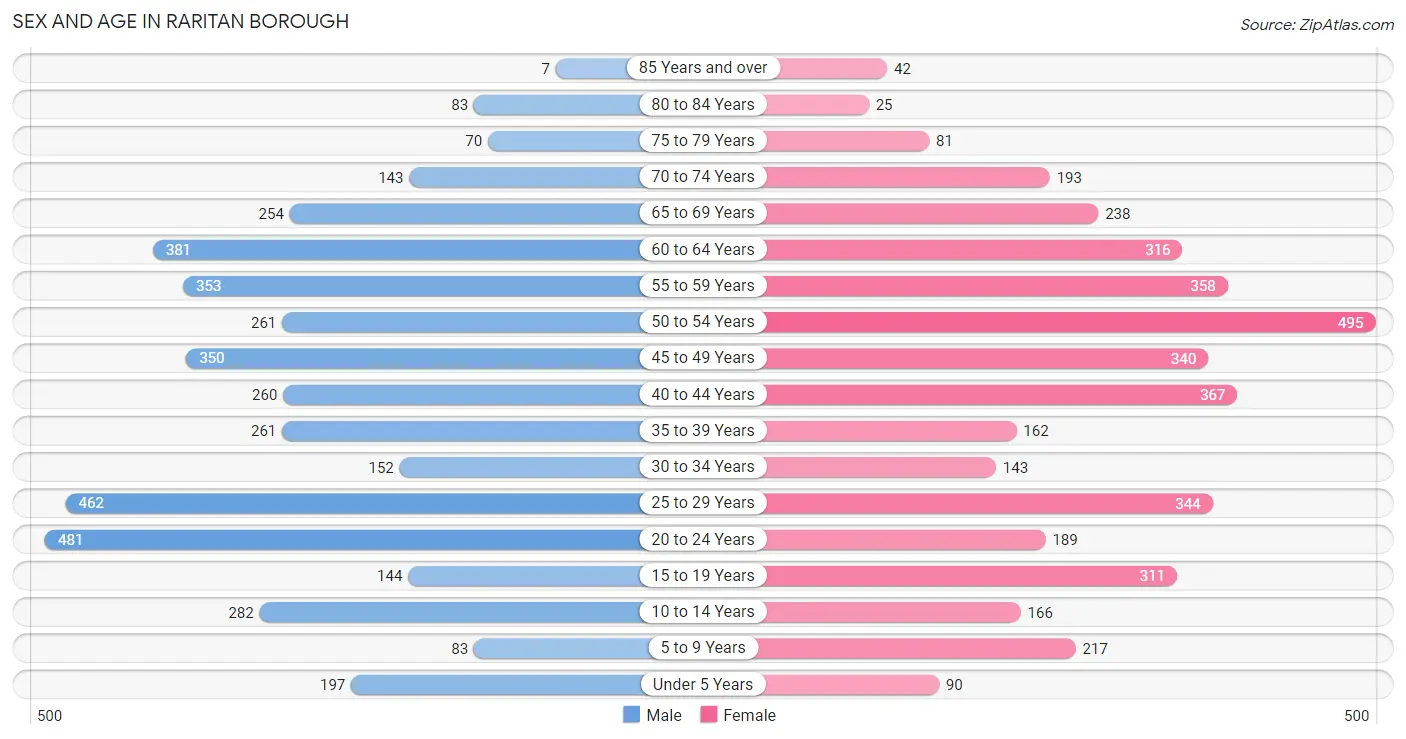
| Age Bracket | Male | Female |
| Under 5 Years | 197 (4.7%) | 90 (2.2%) |
| 5 to 9 Years | 83 (2.0%) | 217 (5.3%) |
| 10 to 14 Years | 282 (6.7%) | 166 (4.1%) |
| 15 to 19 Years | 144 (3.4%) | 311 (7.6%) |
| 20 to 24 Years | 481 (11.4%) | 189 (4.6%) |
| 25 to 29 Years | 462 (10.9%) | 344 (8.4%) |
| 30 to 34 Years | 152 (3.6%) | 143 (3.5%) |
| 35 to 39 Years | 261 (6.2%) | 162 (4.0%) |
| 40 to 44 Years | 260 (6.2%) | 367 (9.0%) |
| 45 to 49 Years | 350 (8.3%) | 340 (8.3%) |
| 50 to 54 Years | 261 (6.2%) | 495 (12.1%) |
| 55 to 59 Years | 353 (8.4%) | 358 (8.8%) |
| 60 to 64 Years | 381 (9.0%) | 316 (7.7%) |
| 65 to 69 Years | 254 (6.0%) | 238 (5.8%) |
| 70 to 74 Years | 143 (3.4%) | 193 (4.7%) |
| 75 to 79 Years | 70 (1.7%) | 81 (2.0%) |
| 80 to 84 Years | 83 (2.0%) | 25 (0.6%) |
| 85 Years and over | 7 (0.2%) | 42 (1.0%) |
| Total | 4,224 (100.0%) | 4,077 (100.0%) |
Families and Households in Raritan borough
Median Family Size in Raritan borough
The median family size in Raritan borough is 3.23 persons per family, with single male/father families (48 | 2.3%) accounting for the largest median family size of 3.44 persons per family. On the other hand, single female/mother families (193 | 9.4%) represent the smallest median family size with 3.10 persons per family.
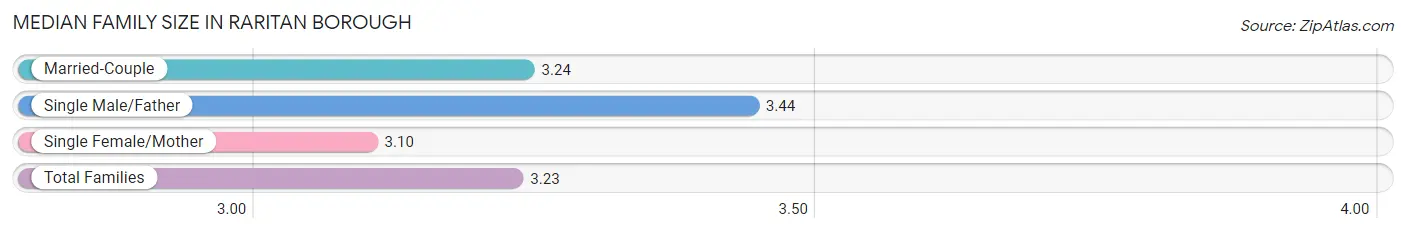
| Family Type | # Families | Family Size |
| Married-Couple | 1,810 (88.2%) | 3.24 |
| Single Male/Father | 48 (2.3%) | 3.44 |
| Single Female/Mother | 193 (9.4%) | 3.10 |
| Total Families | 2,051 (100.0%) | 3.23 |
Median Household Size in Raritan borough
The median household size in Raritan borough is 2.54 persons per household, with single male/father households (48 | 1.5%) accounting for the largest median household size of 3.83 persons per household. non-family households (1,211 | 37.1%) represent the smallest median household size with 1.33 persons per household.
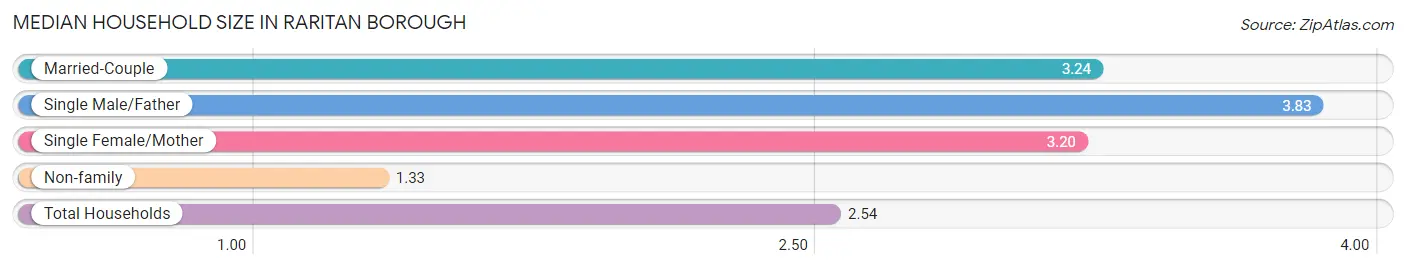
| Household Type | # Households | Household Size |
| Married-Couple | 1,810 (55.5%) | 3.24 |
| Single Male/Father | 48 (1.5%) | 3.83 |
| Single Female/Mother | 193 (5.9%) | 3.20 |
| Non-family | 1,211 (37.1%) | 1.33 |
| Total Households | 3,262 (100.0%) | 2.54 |
Household Size by Marriage Status in Raritan borough
Out of a total of 3,262 households in Raritan borough, 2,051 (62.9%) are family households, while 1,211 (37.1%) are nonfamily households. The most numerous type of family households are 2-person households, comprising 879, and the most common type of nonfamily households are 1-person households, comprising 769.
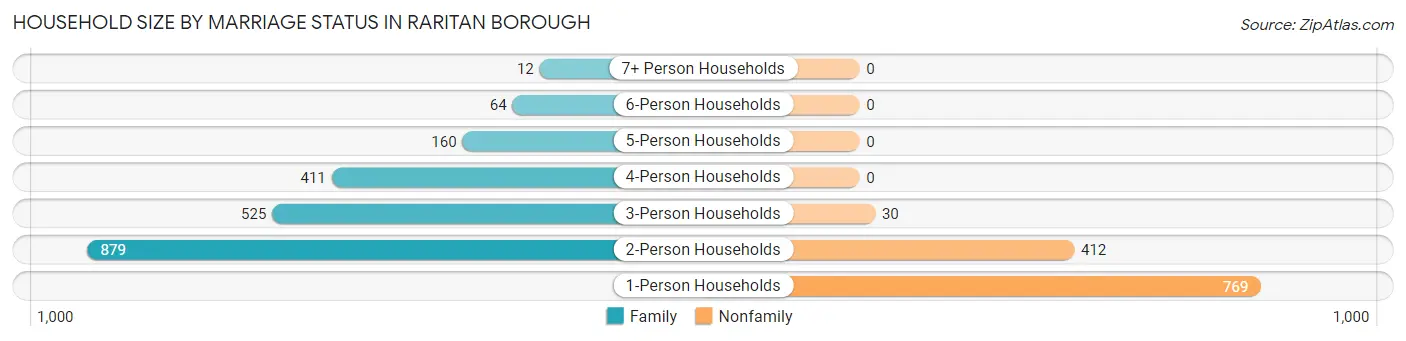
| Household Size | Family Households | Nonfamily Households |
| 1-Person Households | - | 769 (23.6%) |
| 2-Person Households | 879 (27.0%) | 412 (12.6%) |
| 3-Person Households | 525 (16.1%) | 30 (0.9%) |
| 4-Person Households | 411 (12.6%) | 0 (0.0%) |
| 5-Person Households | 160 (4.9%) | 0 (0.0%) |
| 6-Person Households | 64 (2.0%) | 0 (0.0%) |
| 7+ Person Households | 12 (0.4%) | 0 (0.0%) |
| Total | 2,051 (62.9%) | 1,211 (37.1%) |
Female Fertility in Raritan borough
Fertility by Age in Raritan borough
Average fertility rate in Raritan borough is 34.0 births per 1,000 women. Women in the age bracket of 20 to 34 years have the highest fertility rate with 86.0 births per 1,000 women. Women in the age bracket of 20 to 34 years acount for 85.3% of all women with births.
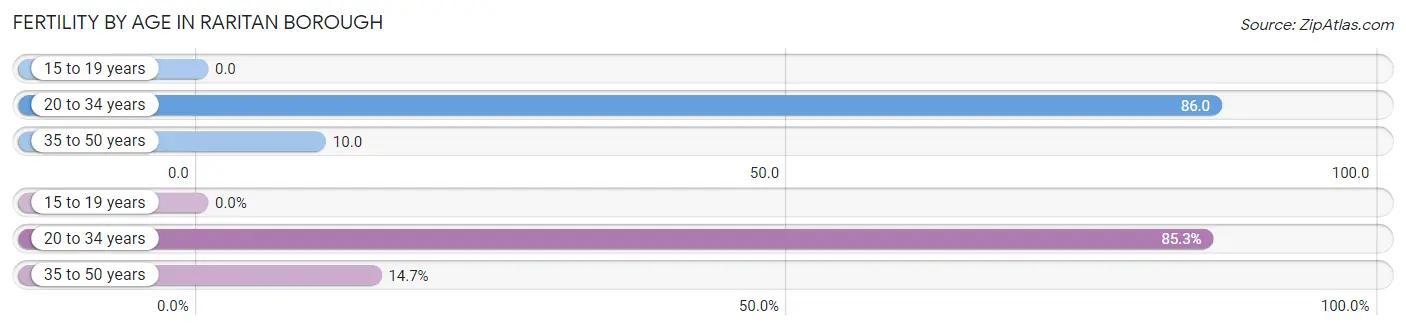
| Age Bracket | Women with Births | Births / 1,000 Women |
| 15 to 19 years | 0 (0.0%) | 0.0 |
| 20 to 34 years | 58 (85.3%) | 86.0 |
| 35 to 50 years | 10 (14.7%) | 10.0 |
| Total | 68 (100.0%) | 34.0 |
Fertility by Age by Marriage Status in Raritan borough
83.8% of women with births (68) in Raritan borough are married. The highest percentage of unmarried women with births falls into 20 to 34 years age bracket with 19.0% of them unmarried at the time of birth, while the lowest percentage of unmarried women with births belong to 35 to 50 years age bracket with 0.0% of them unmarried.
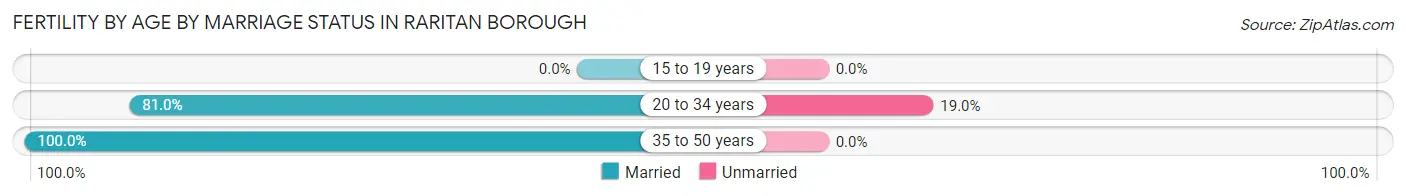
| Age Bracket | Married | Unmarried |
| 15 to 19 years | 0 (0.0%) | 0 (0.0%) |
| 20 to 34 years | 47 (81.0%) | 11 (19.0%) |
| 35 to 50 years | 10 (100.0%) | 0 (0.0%) |
| Total | 57 (83.8%) | 11 (16.2%) |
Fertility by Education in Raritan borough
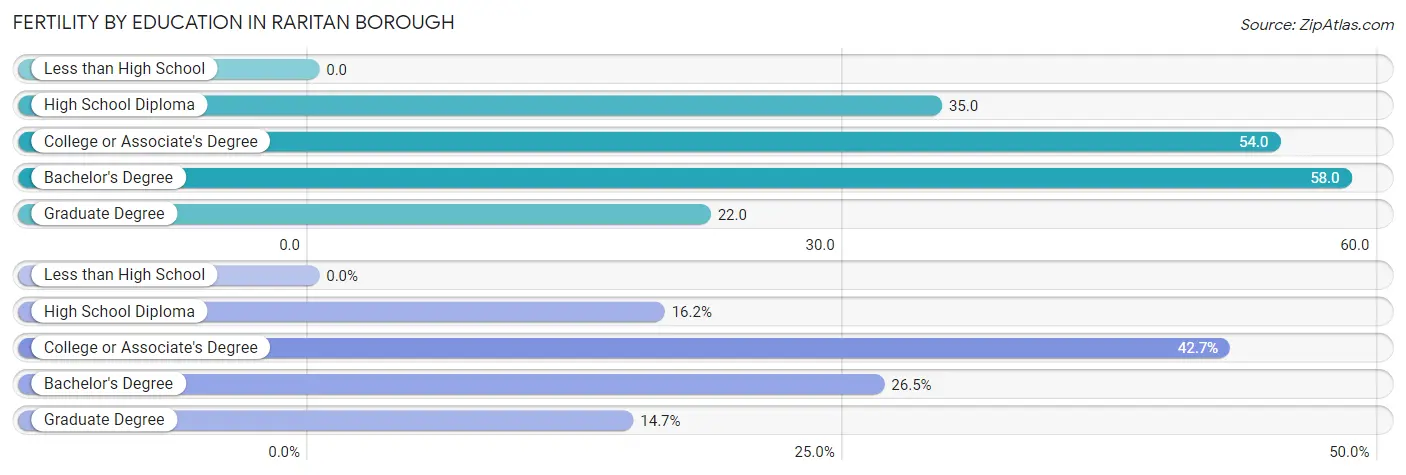
| Educational Attainment | Women with Births | Births / 1,000 Women |
| Less than High School | 0 (0.0%) | 0.0 |
| High School Diploma | 11 (16.2%) | 35.0 |
| College or Associate's Degree | 29 (42.6%) | 54.0 |
| Bachelor's Degree | 18 (26.5%) | 58.0 |
| Graduate Degree | 10 (14.7%) | 22.0 |
| Total | 68 (100.0%) | 34.0 |
Fertility by Education by Marriage Status in Raritan borough
16.2% of women with births in Raritan borough are unmarried. Women with the educational attainment of college or associate's degree are most likely to be married with 100.0% of them married at childbirth, while women with the educational attainment of high school diploma are least likely to be married with 100.0% of them unmarried at childbirth.
| Educational Attainment | Married | Unmarried |
| Less than High School | 0 (0.0%) | 0 (0.0%) |
| High School Diploma | 0 (0.0%) | 11 (100.0%) |
| College or Associate's Degree | 29 (100.0%) | 0 (0.0%) |
| Bachelor's Degree | 18 (100.0%) | 0 (0.0%) |
| Graduate Degree | 10 (100.0%) | 0 (0.0%) |
| Total | 57 (83.8%) | 11 (16.2%) |
Employment Characteristics in Raritan borough
Employment by Class of Employer in Raritan borough
Among the 4,708 employed individuals in Raritan borough, private company employees (3,622 | 76.9%), not-for-profit organizations (316 | 6.7%), and local government employees (235 | 5.0%) make up the most common classes of employment.
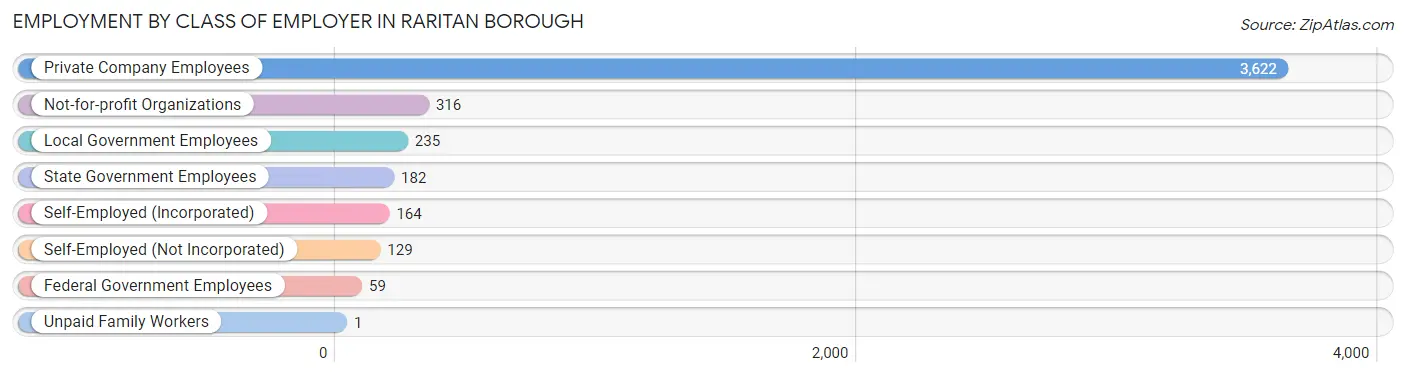
| Employer Class | # Employees | % Employees |
| Private Company Employees | 3,622 | 76.9% |
| Self-Employed (Incorporated) | 164 | 3.5% |
| Self-Employed (Not Incorporated) | 129 | 2.7% |
| Not-for-profit Organizations | 316 | 6.7% |
| Local Government Employees | 235 | 5.0% |
| State Government Employees | 182 | 3.9% |
| Federal Government Employees | 59 | 1.3% |
| Unpaid Family Workers | 1 | 0.0% |
| Total | 4,708 | 100.0% |
Employment Status by Age in Raritan borough
According to the labor force statistics for Raritan borough, out of the total population over 16 years of age (7,198), 76.6% or 5,514 individuals are in the labor force, with 5.5% or 303 of them unemployed. The age group with the highest labor force participation rate is 20 to 24 years, with 97.5% or 653 individuals in the labor force. Within the labor force, the 16 to 19 years age range has the highest percentage of unemployed individuals, with 26.6% or 79 of them being unemployed.
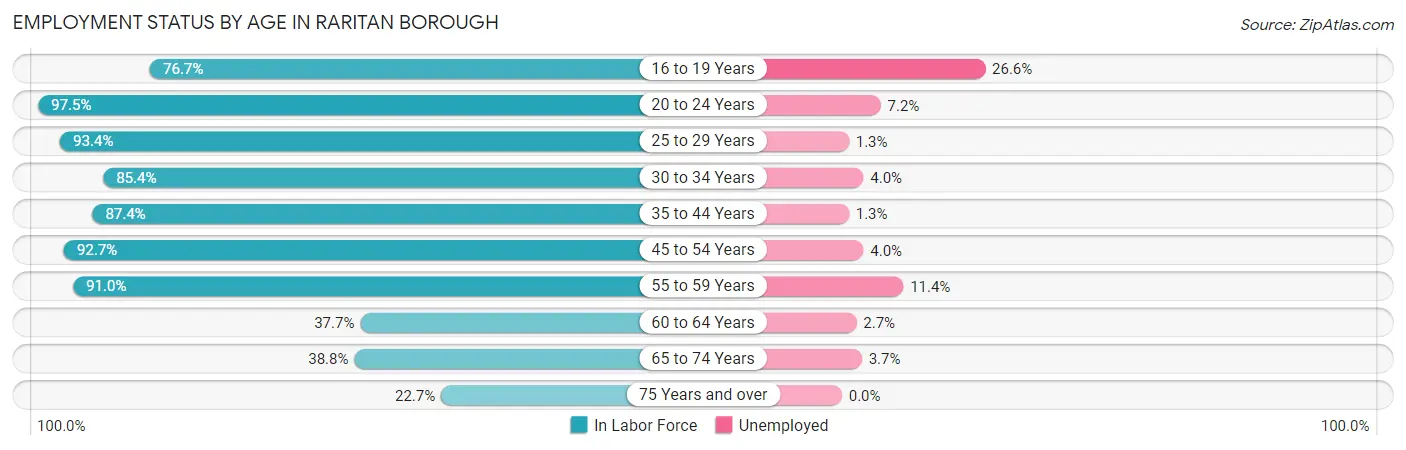
| Age Bracket | In Labor Force | Unemployed |
| 16 to 19 Years | 297 (76.7%) | 79 (26.6%) |
| 20 to 24 Years | 653 (97.5%) | 47 (7.2%) |
| 25 to 29 Years | 753 (93.4%) | 10 (1.3%) |
| 30 to 34 Years | 252 (85.4%) | 10 (4.0%) |
| 35 to 44 Years | 918 (87.4%) | 12 (1.3%) |
| 45 to 54 Years | 1,340 (92.7%) | 54 (4.0%) |
| 55 to 59 Years | 647 (91.0%) | 74 (11.4%) |
| 60 to 64 Years | 263 (37.7%) | 7 (2.7%) |
| 65 to 74 Years | 321 (38.8%) | 12 (3.7%) |
| 75 Years and over | 70 (22.7%) | 0 (0.0%) |
| Total | 5,514 (76.6%) | 303 (5.5%) |
Employment Status by Educational Attainment in Raritan borough
According to labor force statistics for Raritan borough, 83.4% of individuals (4,174) out of the total population between 25 and 64 years of age (5,005) are in the labor force, with 4.0% or 167 of them being unemployed. The group with the highest labor force participation rate are those with the educational attainment of bachelor's degree or higher, with 92.2% or 1,811 individuals in the labor force. Within the labor force, individuals with bachelor's degree or higher education have the highest percentage of unemployment, with 5.1% or 92 of them being unemployed.
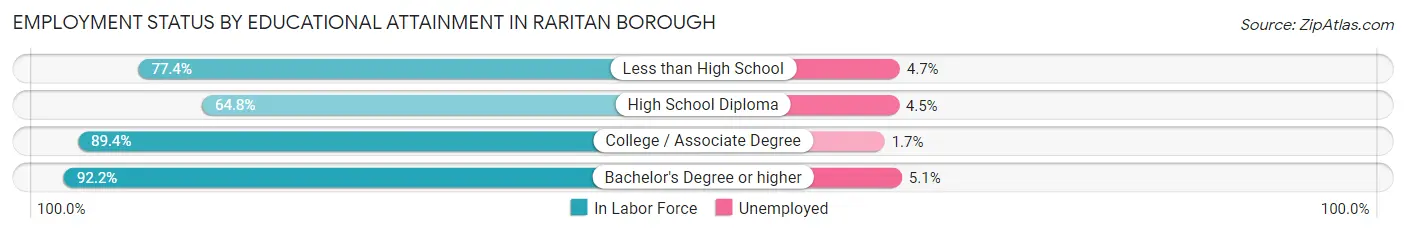
| Educational Attainment | In Labor Force | Unemployed |
| Less than High School | 380 (77.4%) | 23 (4.7%) |
| High School Diploma | 781 (64.8%) | 54 (4.5%) |
| College / Associate Degree | 1,202 (89.4%) | 23 (1.7%) |
| Bachelor's Degree or higher | 1,811 (92.2%) | 100 (5.1%) |
| Total | 4,174 (83.4%) | 200 (4.0%) |
Employment Occupations by Sex in Raritan borough
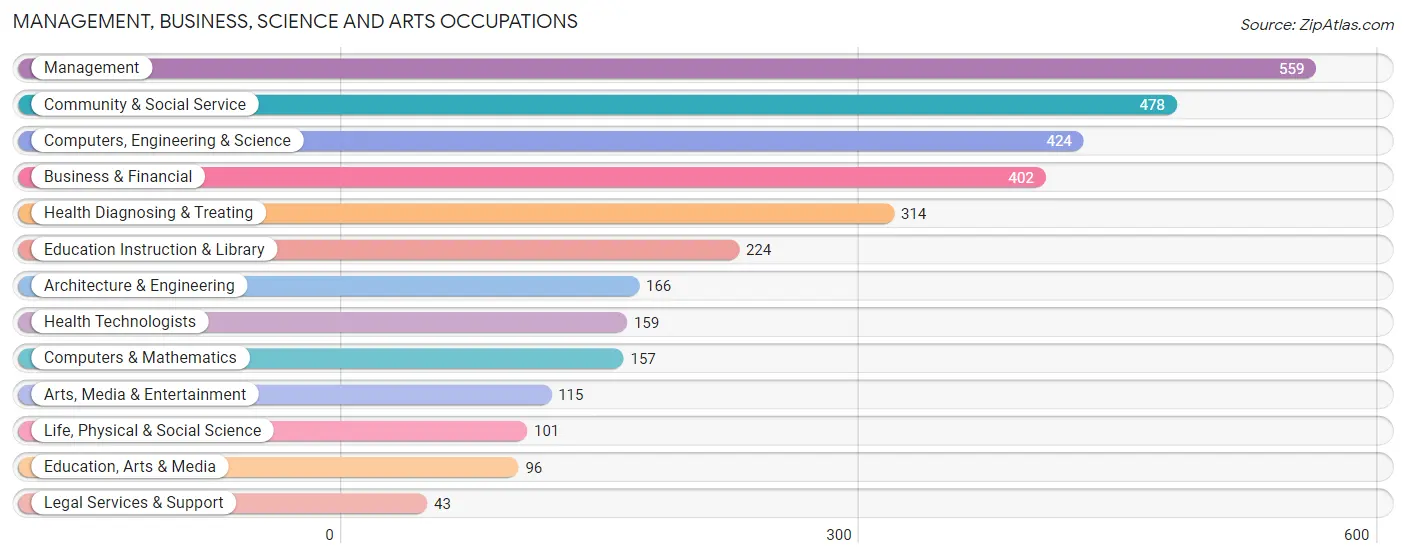
Management, Business, Science and Arts Occupations
The most common Management, Business, Science and Arts occupations in Raritan borough are Management (559 | 10.7%), Community & Social Service (478 | 9.2%), Computers, Engineering & Science (424 | 8.1%), Business & Financial (402 | 7.7%), and Health Diagnosing & Treating (314 | 6.0%).
Management, Business, Science and Arts Occupations by Sex
Within the Management, Business, Science and Arts occupations in Raritan borough, the most male-oriented occupations are Computers & Mathematics (82.8%), Computers, Engineering & Science (68.4%), and Architecture & Engineering (61.5%), while the most female-oriented occupations are Legal Services & Support (100.0%), Education, Arts & Media (94.8%), and Health Technologists (89.9%).
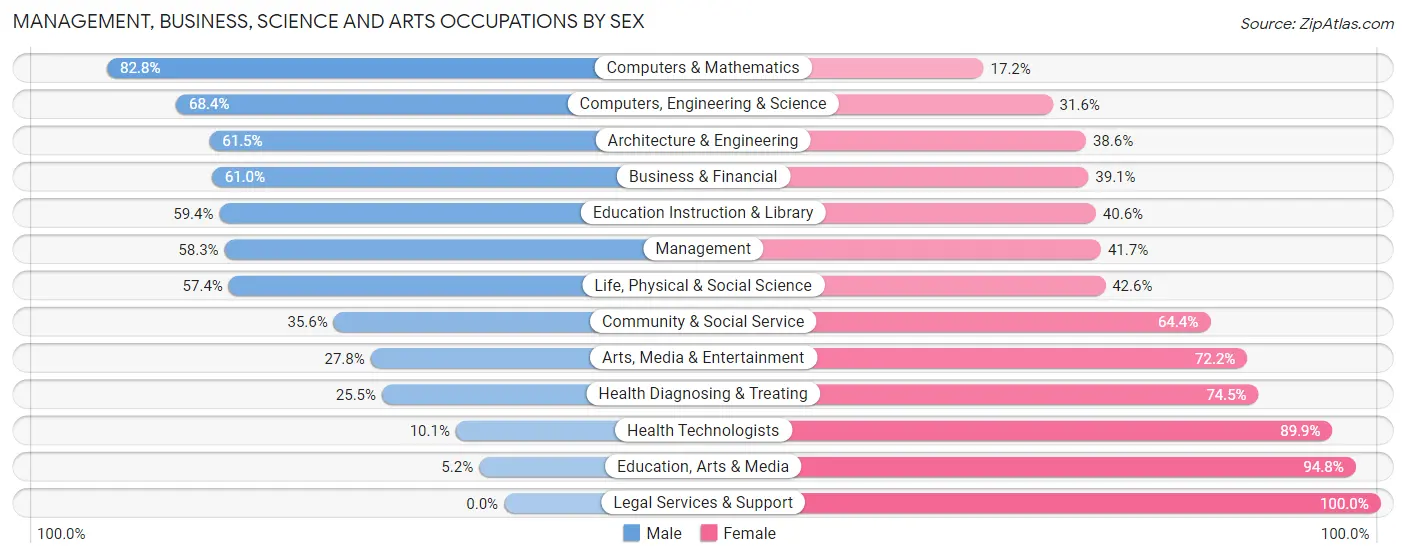
| Occupation | Male | Female |
| Management | 326 (58.3%) | 233 (41.7%) |
| Business & Financial | 245 (61.0%) | 157 (39.1%) |
| Computers, Engineering & Science | 290 (68.4%) | 134 (31.6%) |
| Computers & Mathematics | 130 (82.8%) | 27 (17.2%) |
| Architecture & Engineering | 102 (61.5%) | 64 (38.6%) |
| Life, Physical & Social Science | 58 (57.4%) | 43 (42.6%) |
| Community & Social Service | 170 (35.6%) | 308 (64.4%) |
| Education, Arts & Media | 5 (5.2%) | 91 (94.8%) |
| Legal Services & Support | 0 (0.0%) | 43 (100.0%) |
| Education Instruction & Library | 133 (59.4%) | 91 (40.6%) |
| Arts, Media & Entertainment | 32 (27.8%) | 83 (72.2%) |
| Health Diagnosing & Treating | 80 (25.5%) | 234 (74.5%) |
| Health Technologists | 16 (10.1%) | 143 (89.9%) |
| Total (Category) | 1,111 (51.0%) | 1,066 (49.0%) |
| Total (Overall) | 2,816 (54.0%) | 2,394 (46.0%) |
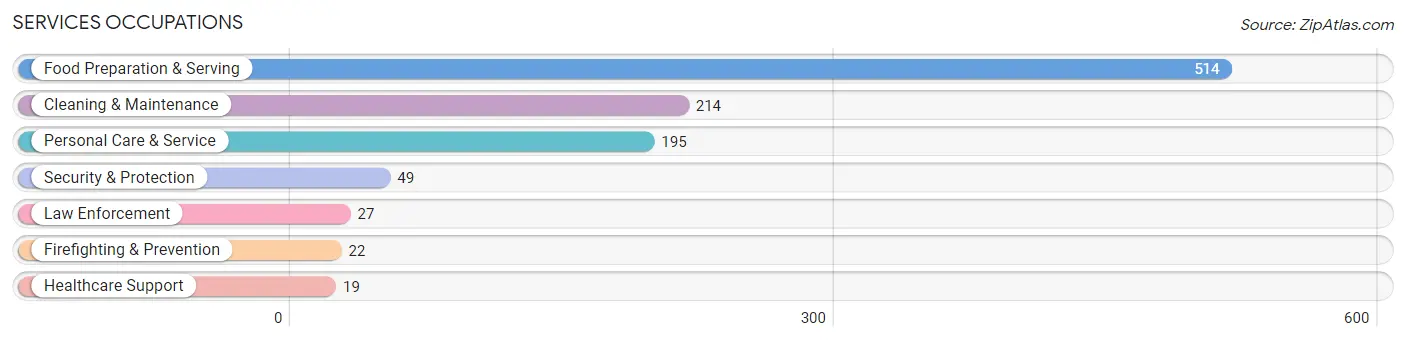
Services Occupations
The most common Services occupations in Raritan borough are Food Preparation & Serving (514 | 9.9%), Cleaning & Maintenance (214 | 4.1%), Personal Care & Service (195 | 3.7%), Security & Protection (49 | 0.9%), and Law Enforcement (27 | 0.5%).
Services Occupations by Sex
Within the Services occupations in Raritan borough, the most male-oriented occupations are Law Enforcement (70.4%), Security & Protection (63.3%), and Food Preparation & Serving (62.8%), while the most female-oriented occupations are Healthcare Support (100.0%), Personal Care & Service (72.3%), and Cleaning & Maintenance (60.3%).
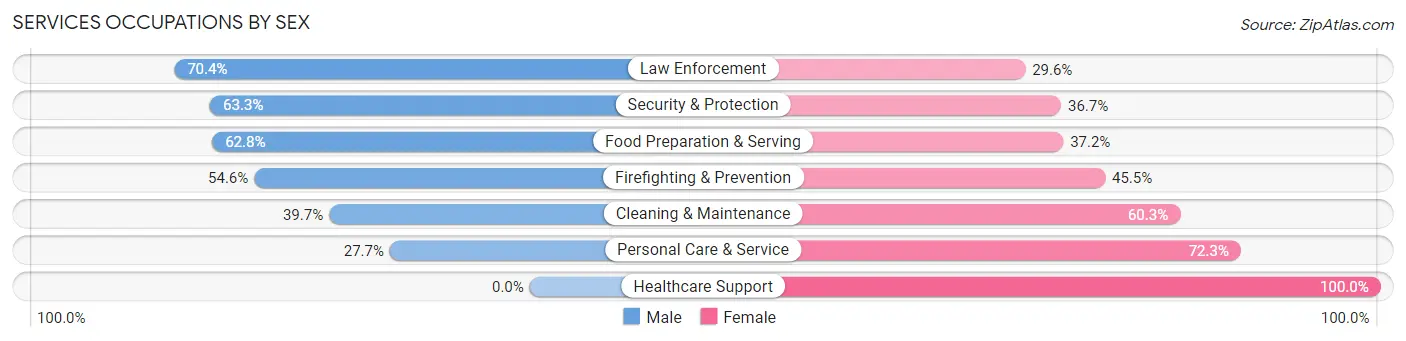
| Occupation | Male | Female |
| Healthcare Support | 0 (0.0%) | 19 (100.0%) |
| Security & Protection | 31 (63.3%) | 18 (36.7%) |
| Firefighting & Prevention | 12 (54.5%) | 10 (45.5%) |
| Law Enforcement | 19 (70.4%) | 8 (29.6%) |
| Food Preparation & Serving | 323 (62.8%) | 191 (37.2%) |
| Cleaning & Maintenance | 85 (39.7%) | 129 (60.3%) |
| Personal Care & Service | 54 (27.7%) | 141 (72.3%) |
| Total (Category) | 493 (49.7%) | 498 (50.2%) |
| Total (Overall) | 2,816 (54.0%) | 2,394 (46.0%) |
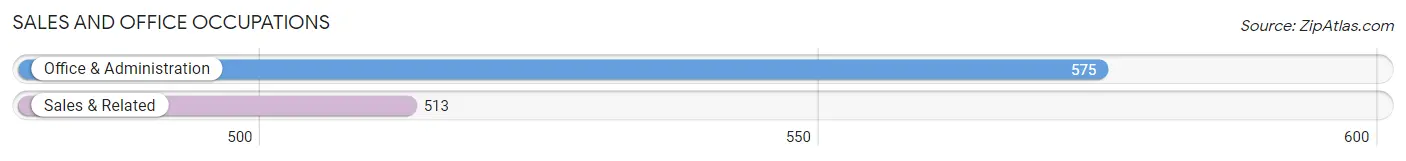
Sales and Office Occupations
The most common Sales and Office occupations in Raritan borough are Office & Administration (575 | 11.0%), and Sales & Related (513 | 9.9%).
Sales and Office Occupations by Sex
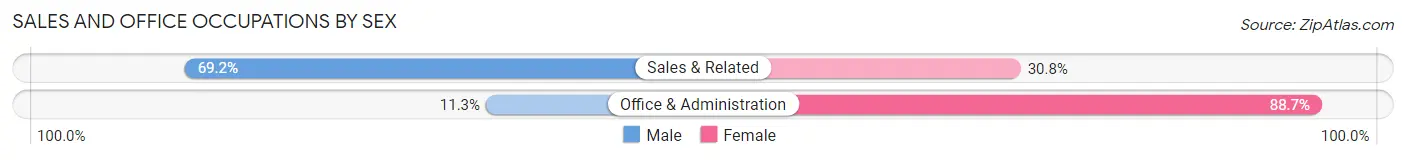
| Occupation | Male | Female |
| Sales & Related | 355 (69.2%) | 158 (30.8%) |
| Office & Administration | 65 (11.3%) | 510 (88.7%) |
| Total (Category) | 420 (38.6%) | 668 (61.4%) |
| Total (Overall) | 2,816 (54.0%) | 2,394 (46.0%) |
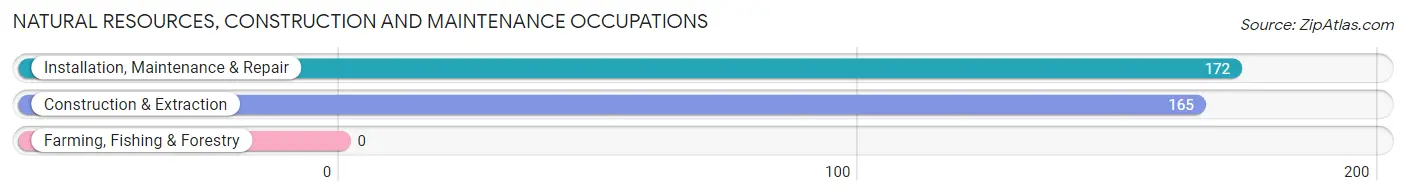
Natural Resources, Construction and Maintenance Occupations
The most common Natural Resources, Construction and Maintenance occupations in Raritan borough are Installation, Maintenance & Repair (172 | 3.3%), and Construction & Extraction (165 | 3.2%).
Natural Resources, Construction and Maintenance Occupations by Sex
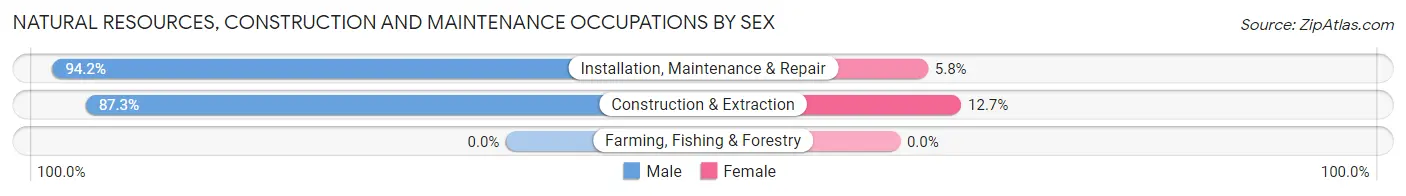
| Occupation | Male | Female |
| Farming, Fishing & Forestry | 0 (0.0%) | 0 (0.0%) |
| Construction & Extraction | 144 (87.3%) | 21 (12.7%) |
| Installation, Maintenance & Repair | 162 (94.2%) | 10 (5.8%) |
| Total (Category) | 306 (90.8%) | 31 (9.2%) |
| Total (Overall) | 2,816 (54.0%) | 2,394 (46.0%) |
Production, Transportation and Moving Occupations
The most common Production, Transportation and Moving occupations in Raritan borough are Transportation (213 | 4.1%), Material Moving (204 | 3.9%), and Production (200 | 3.8%).
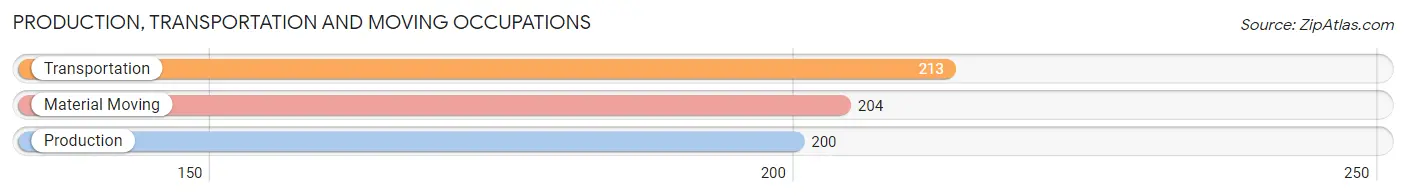
Production, Transportation and Moving Occupations by Sex
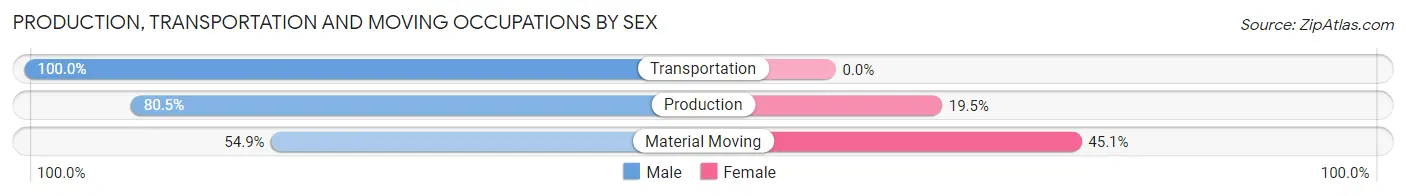
| Occupation | Male | Female |
| Production | 161 (80.5%) | 39 (19.5%) |
| Transportation | 213 (100.0%) | 0 (0.0%) |
| Material Moving | 112 (54.9%) | 92 (45.1%) |
| Total (Category) | 486 (78.8%) | 131 (21.2%) |
| Total (Overall) | 2,816 (54.0%) | 2,394 (46.0%) |
Employment Industries by Sex in Raritan borough
Employment Industries in Raritan borough
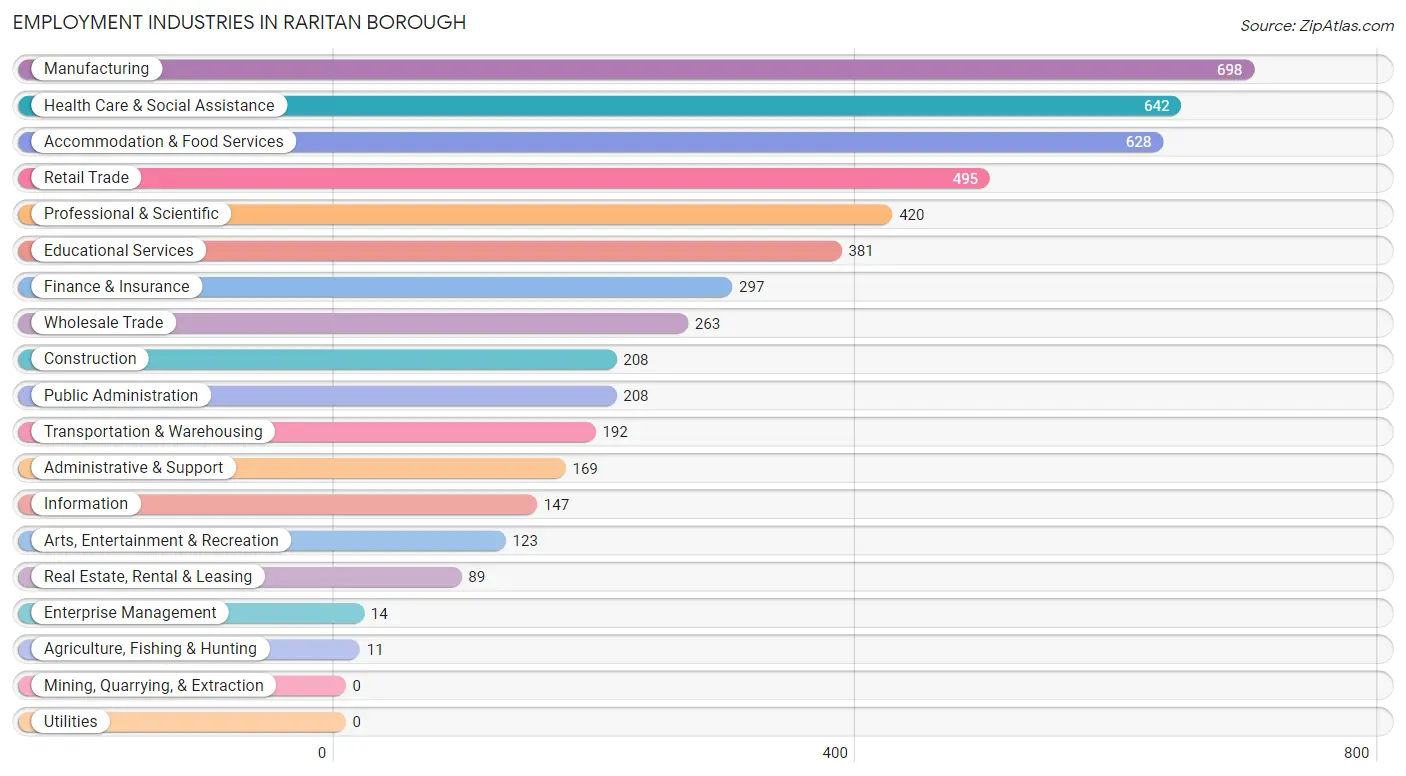
The major employment industries in Raritan borough include Manufacturing (698 | 13.4%), Health Care & Social Assistance (642 | 12.3%), Accommodation & Food Services (628 | 12.0%), Retail Trade (495 | 9.5%), and Professional & Scientific (420 | 8.1%).
Employment Industries by Sex in Raritan borough
The Raritan borough industries that see more men than women are Agriculture, Fishing & Hunting (100.0%), Real Estate, Rental & Leasing (100.0%), and Enterprise Management (100.0%), whereas the industries that tend to have a higher number of women are Administrative & Support (84.0%), Health Care & Social Assistance (80.5%), and Public Administration (68.8%).
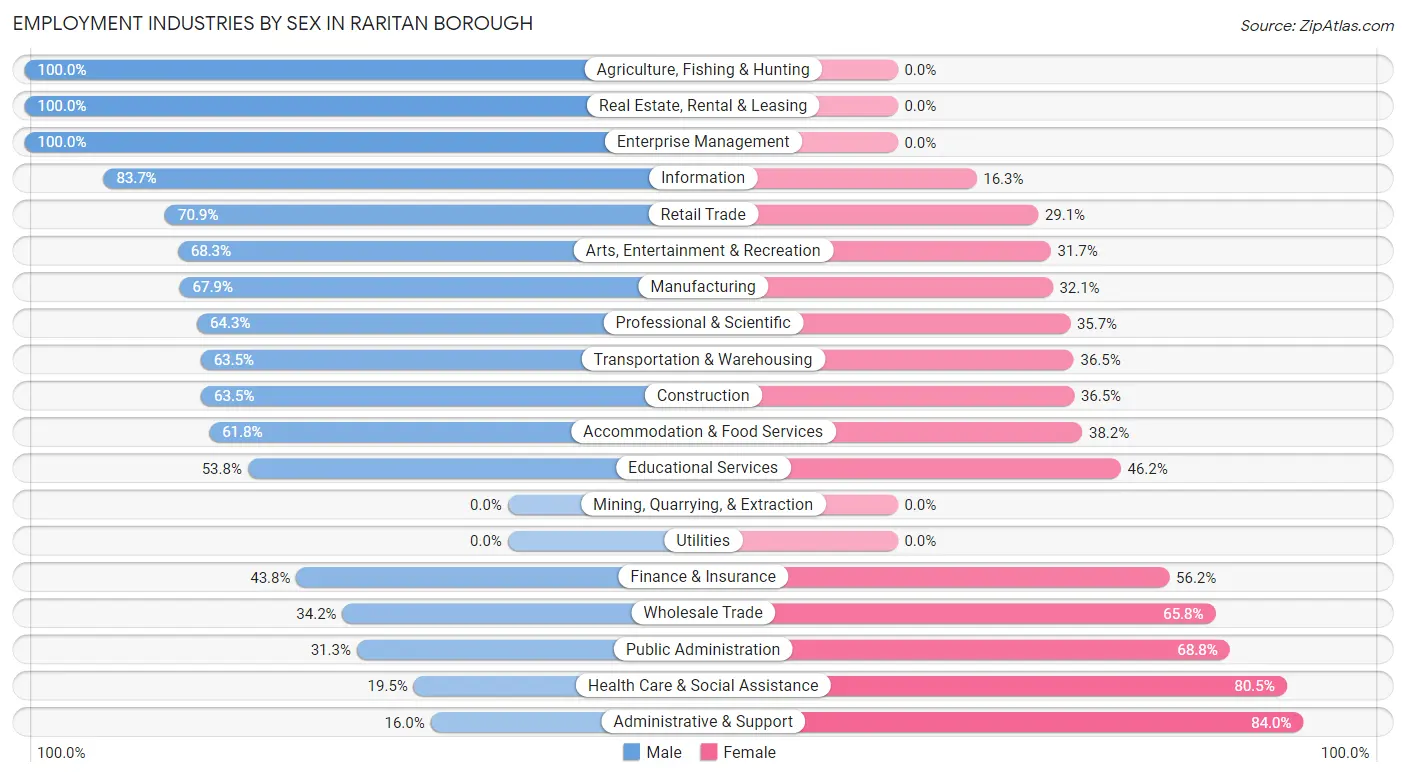
| Industry | Male | Female |
| Agriculture, Fishing & Hunting | 11 (100.0%) | 0 (0.0%) |
| Mining, Quarrying, & Extraction | 0 (0.0%) | 0 (0.0%) |
| Construction | 132 (63.5%) | 76 (36.5%) |
| Manufacturing | 474 (67.9%) | 224 (32.1%) |
| Wholesale Trade | 90 (34.2%) | 173 (65.8%) |
| Retail Trade | 351 (70.9%) | 144 (29.1%) |
| Transportation & Warehousing | 122 (63.5%) | 70 (36.5%) |
| Utilities | 0 (0.0%) | 0 (0.0%) |
| Information | 123 (83.7%) | 24 (16.3%) |
| Finance & Insurance | 130 (43.8%) | 167 (56.2%) |
| Real Estate, Rental & Leasing | 89 (100.0%) | 0 (0.0%) |
| Professional & Scientific | 270 (64.3%) | 150 (35.7%) |
| Enterprise Management | 14 (100.0%) | 0 (0.0%) |
| Administrative & Support | 27 (16.0%) | 142 (84.0%) |
| Educational Services | 205 (53.8%) | 176 (46.2%) |
| Health Care & Social Assistance | 125 (19.5%) | 517 (80.5%) |
| Arts, Entertainment & Recreation | 84 (68.3%) | 39 (31.7%) |
| Accommodation & Food Services | 388 (61.8%) | 240 (38.2%) |
| Public Administration | 65 (31.2%) | 143 (68.8%) |
| Total | 2,816 (54.0%) | 2,394 (46.0%) |
Education in Raritan borough
School Enrollment in Raritan borough
The most common levels of schooling among the 1,924 students in Raritan borough are college / undergraduate (679 | 35.3%), middle school (342 | 17.8%), and high school (337 | 17.5%).
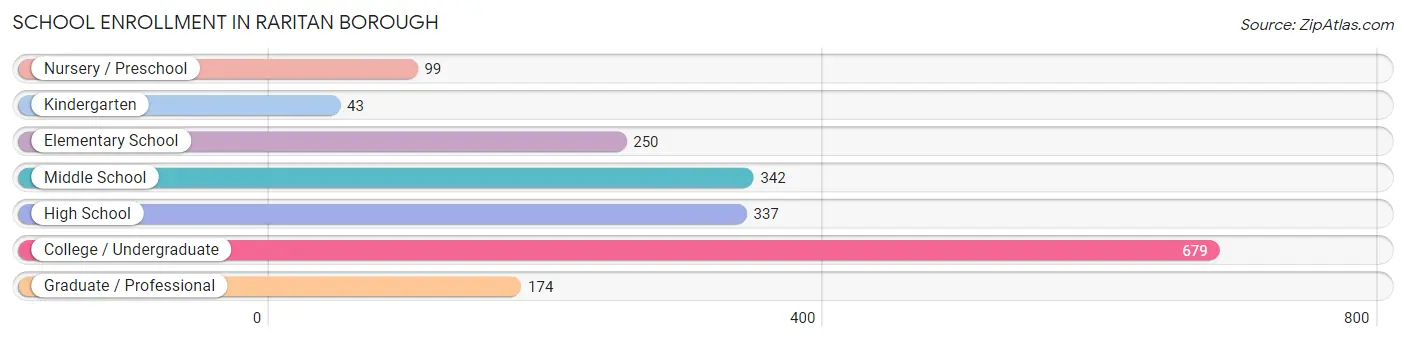
| School Level | # Students | % Students |
| Nursery / Preschool | 99 | 5.1% |
| Kindergarten | 43 | 2.2% |
| Elementary School | 250 | 13.0% |
| Middle School | 342 | 17.8% |
| High School | 337 | 17.5% |
| College / Undergraduate | 679 | 35.3% |
| Graduate / Professional | 174 | 9.0% |
| Total | 1,924 | 100.0% |
School Enrollment by Age by Funding Source in Raritan borough
Out of a total of 1,924 students who are enrolled in schools in Raritan borough, 196 (10.2%) attend a private institution, while the remaining 1,728 (89.8%) are enrolled in public schools. The age group of 3 to 4 year olds has the highest likelihood of being enrolled in private schools, with 70 (81.4% in the age bracket) enrolled. Conversely, the age group of 18 to 19 year olds has the lowest likelihood of being enrolled in a private school, with 258 (100.0% in the age bracket) attending a public institution.
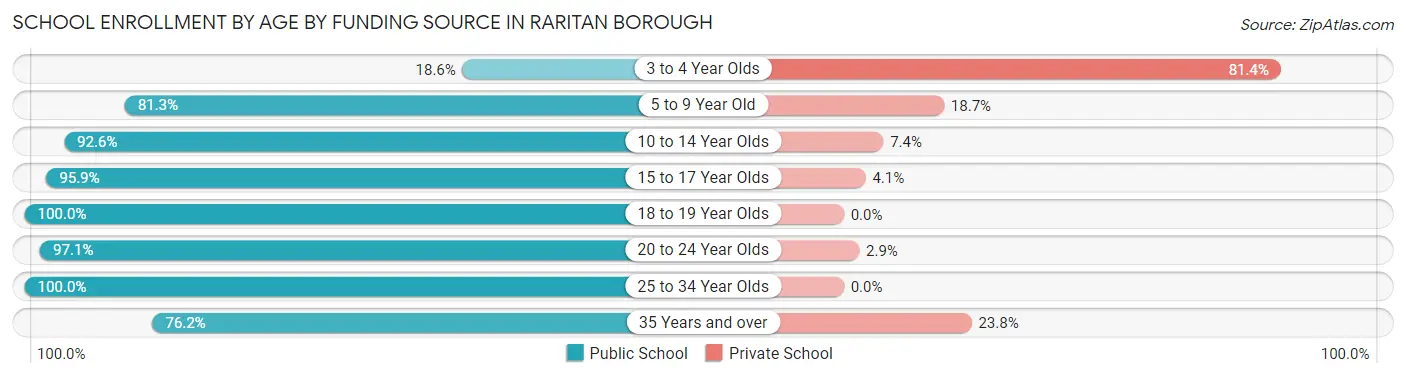
| Age Bracket | Public School | Private School |
| 3 to 4 Year Olds | 16 (18.6%) | 70 (81.4%) |
| 5 to 9 Year Old | 244 (81.3%) | 56 (18.7%) |
| 10 to 14 Year Olds | 415 (92.6%) | 33 (7.4%) |
| 15 to 17 Year Olds | 189 (95.9%) | 8 (4.1%) |
| 18 to 19 Year Olds | 258 (100.0%) | 0 (0.0%) |
| 20 to 24 Year Olds | 472 (97.1%) | 14 (2.9%) |
| 25 to 34 Year Olds | 86 (100.0%) | 0 (0.0%) |
| 35 Years and over | 48 (76.2%) | 15 (23.8%) |
| Total | 1,728 (89.8%) | 196 (10.2%) |
Educational Attainment by Field of Study in Raritan borough
Business (452 | 18.0%), engineering (351 | 14.0%), computers & mathematics (273 | 10.9%), communications (234 | 9.3%), and social sciences (191 | 7.6%) are the most common fields of study among 2,507 individuals in Raritan borough who have obtained a bachelor's degree or higher.
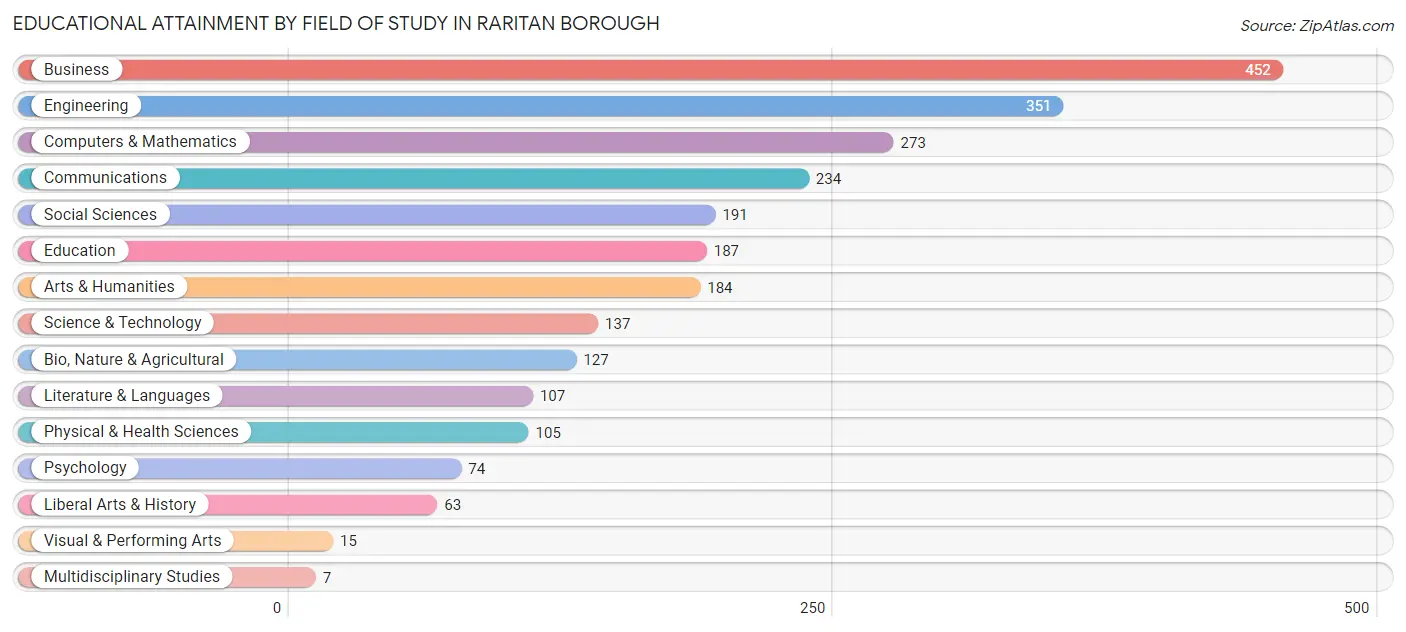
| Field of Study | # Graduates | % Graduates |
| Computers & Mathematics | 273 | 10.9% |
| Bio, Nature & Agricultural | 127 | 5.1% |
| Physical & Health Sciences | 105 | 4.2% |
| Psychology | 74 | 2.9% |
| Social Sciences | 191 | 7.6% |
| Engineering | 351 | 14.0% |
| Multidisciplinary Studies | 7 | 0.3% |
| Science & Technology | 137 | 5.5% |
| Business | 452 | 18.0% |
| Education | 187 | 7.5% |
| Literature & Languages | 107 | 4.3% |
| Liberal Arts & History | 63 | 2.5% |
| Visual & Performing Arts | 15 | 0.6% |
| Communications | 234 | 9.3% |
| Arts & Humanities | 184 | 7.3% |
| Total | 2,507 | 100.0% |
Transportation & Commute in Raritan borough
Vehicle Availability by Sex in Raritan borough
The most prevalent vehicle ownership categories in Raritan borough are males with 2 vehicles (1,088, accounting for 43.0%) and females with 2 vehicles (820, making up 50.1%).
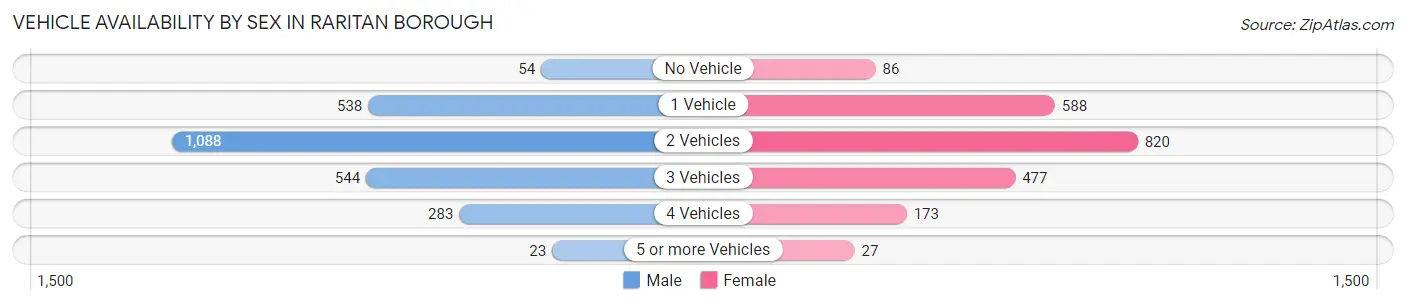
| Vehicles Available | Male | Female |
| No Vehicle | 54 (2.1%) | 86 (4.0%) |
| 1 Vehicle | 538 (21.3%) | 588 (27.1%) |
| 2 Vehicles | 1,088 (43.0%) | 820 (37.8%) |
| 3 Vehicles | 544 (21.5%) | 477 (22.0%) |
| 4 Vehicles | 283 (11.2%) | 173 (8.0%) |
| 5 or more Vehicles | 23 (0.9%) | 27 (1.2%) |
| Total | 2,530 (100.0%) | 2,171 (100.0%) |
Commute Time in Raritan borough
The most frequently occuring commute durations in Raritan borough are 10 to 14 minutes (748 commuters, 18.4%), 20 to 24 minutes (620 commuters, 15.3%), and 30 to 34 minutes (529 commuters, 13.0%).
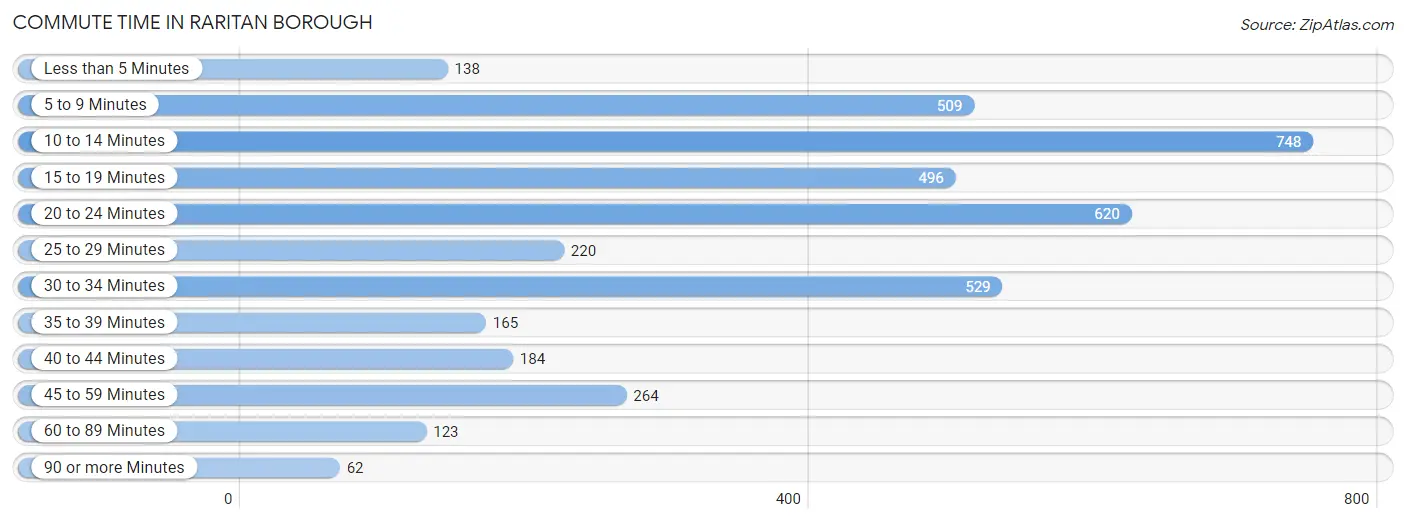
| Commute Time | # Commuters | % Commuters |
| Less than 5 Minutes | 138 | 3.4% |
| 5 to 9 Minutes | 509 | 12.5% |
| 10 to 14 Minutes | 748 | 18.4% |
| 15 to 19 Minutes | 496 | 12.2% |
| 20 to 24 Minutes | 620 | 15.3% |
| 25 to 29 Minutes | 220 | 5.4% |
| 30 to 34 Minutes | 529 | 13.0% |
| 35 to 39 Minutes | 165 | 4.1% |
| 40 to 44 Minutes | 184 | 4.5% |
| 45 to 59 Minutes | 264 | 6.5% |
| 60 to 89 Minutes | 123 | 3.0% |
| 90 or more Minutes | 62 | 1.5% |
Commute Time by Sex in Raritan borough
The most common commute times in Raritan borough are 30 to 34 minutes (460 commuters, 21.7%) for males and 10 to 14 minutes (492 commuters, 25.4%) for females.
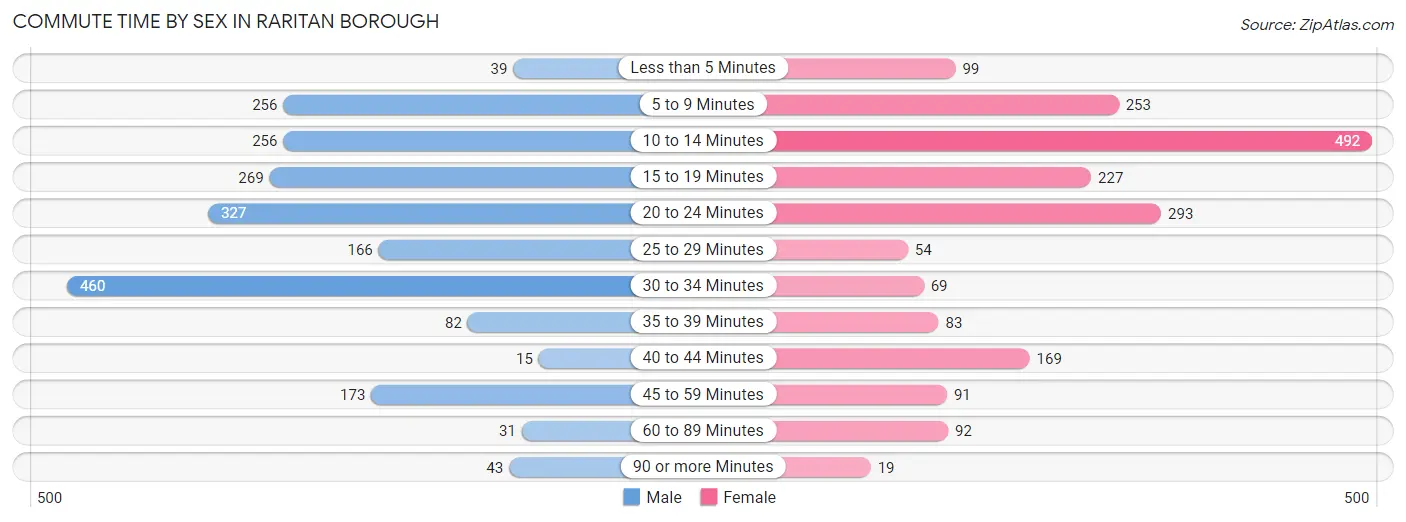
| Commute Time | Male | Female |
| Less than 5 Minutes | 39 (1.8%) | 99 (5.1%) |
| 5 to 9 Minutes | 256 (12.1%) | 253 (13.0%) |
| 10 to 14 Minutes | 256 (12.1%) | 492 (25.4%) |
| 15 to 19 Minutes | 269 (12.7%) | 227 (11.7%) |
| 20 to 24 Minutes | 327 (15.4%) | 293 (15.1%) |
| 25 to 29 Minutes | 166 (7.8%) | 54 (2.8%) |
| 30 to 34 Minutes | 460 (21.7%) | 69 (3.5%) |
| 35 to 39 Minutes | 82 (3.9%) | 83 (4.3%) |
| 40 to 44 Minutes | 15 (0.7%) | 169 (8.7%) |
| 45 to 59 Minutes | 173 (8.2%) | 91 (4.7%) |
| 60 to 89 Minutes | 31 (1.5%) | 92 (4.7%) |
| 90 or more Minutes | 43 (2.0%) | 19 (1.0%) |
Time of Departure to Work by Sex in Raritan borough
The most frequent times of departure to work in Raritan borough are 6:00 AM to 6:29 AM (292, 13.8%) for males and 8:00 AM to 8:29 AM (741, 38.2%) for females.
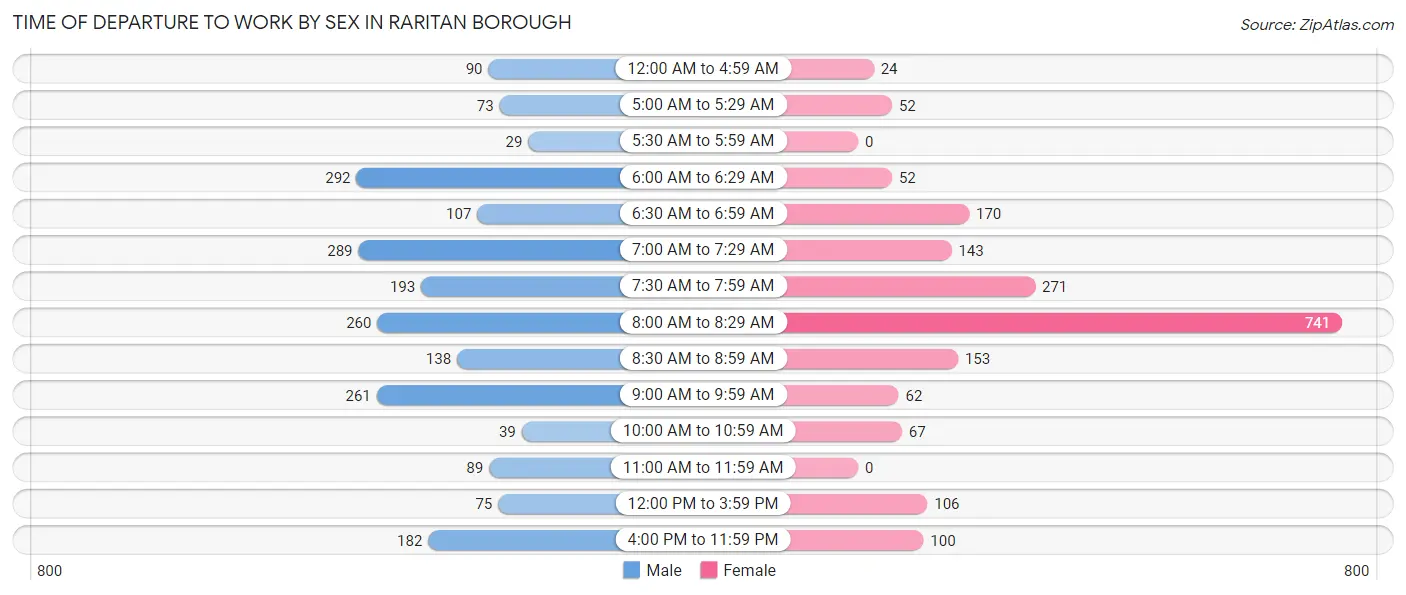
| Time of Departure | Male | Female |
| 12:00 AM to 4:59 AM | 90 (4.3%) | 24 (1.2%) |
| 5:00 AM to 5:29 AM | 73 (3.5%) | 52 (2.7%) |
| 5:30 AM to 5:59 AM | 29 (1.4%) | 0 (0.0%) |
| 6:00 AM to 6:29 AM | 292 (13.8%) | 52 (2.7%) |
| 6:30 AM to 6:59 AM | 107 (5.1%) | 170 (8.8%) |
| 7:00 AM to 7:29 AM | 289 (13.7%) | 143 (7.4%) |
| 7:30 AM to 7:59 AM | 193 (9.1%) | 271 (14.0%) |
| 8:00 AM to 8:29 AM | 260 (12.3%) | 741 (38.2%) |
| 8:30 AM to 8:59 AM | 138 (6.5%) | 153 (7.9%) |
| 9:00 AM to 9:59 AM | 261 (12.3%) | 62 (3.2%) |
| 10:00 AM to 10:59 AM | 39 (1.8%) | 67 (3.5%) |
| 11:00 AM to 11:59 AM | 89 (4.2%) | 0 (0.0%) |
| 12:00 PM to 3:59 PM | 75 (3.5%) | 106 (5.5%) |
| 4:00 PM to 11:59 PM | 182 (8.6%) | 100 (5.1%) |
| Total | 2,117 (100.0%) | 1,941 (100.0%) |
Housing Occupancy in Raritan borough
Occupancy by Ownership in Raritan borough
Of the total 3,262 dwellings in Raritan borough, owner-occupied units account for 1,857 (56.9%), while renter-occupied units make up 1,405 (43.1%).
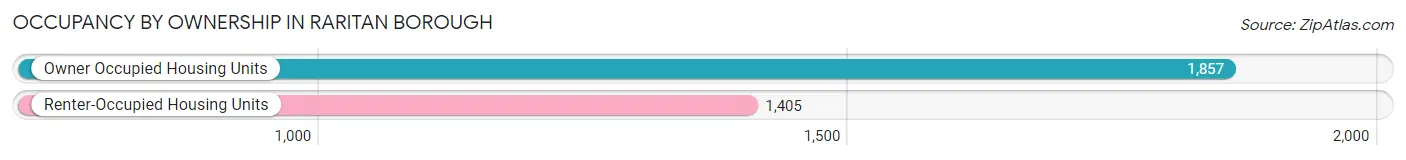
| Occupancy | # Housing Units | % Housing Units |
| Owner Occupied Housing Units | 1,857 | 56.9% |
| Renter-Occupied Housing Units | 1,405 | 43.1% |
| Total Occupied Housing Units | 3,262 | 100.0% |
Occupancy by Household Size in Raritan borough
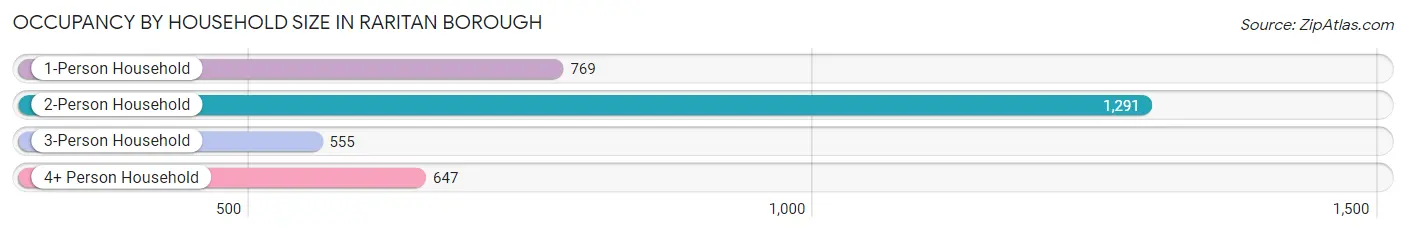
| Household Size | # Housing Units | % Housing Units |
| 1-Person Household | 769 | 23.6% |
| 2-Person Household | 1,291 | 39.6% |
| 3-Person Household | 555 | 17.0% |
| 4+ Person Household | 647 | 19.8% |
| Total Housing Units | 3,262 | 100.0% |
Occupancy by Ownership by Household Size in Raritan borough
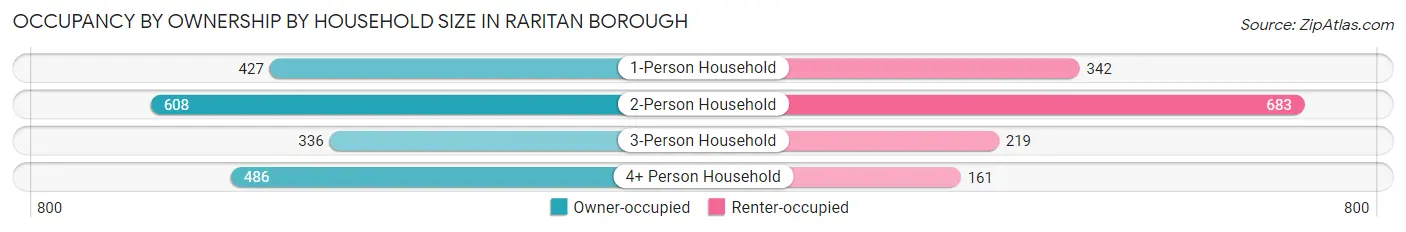
| Household Size | Owner-occupied | Renter-occupied |
| 1-Person Household | 427 (55.5%) | 342 (44.5%) |
| 2-Person Household | 608 (47.1%) | 683 (52.9%) |
| 3-Person Household | 336 (60.5%) | 219 (39.5%) |
| 4+ Person Household | 486 (75.1%) | 161 (24.9%) |
| Total Housing Units | 1,857 (56.9%) | 1,405 (43.1%) |
Occupancy by Educational Attainment in Raritan borough
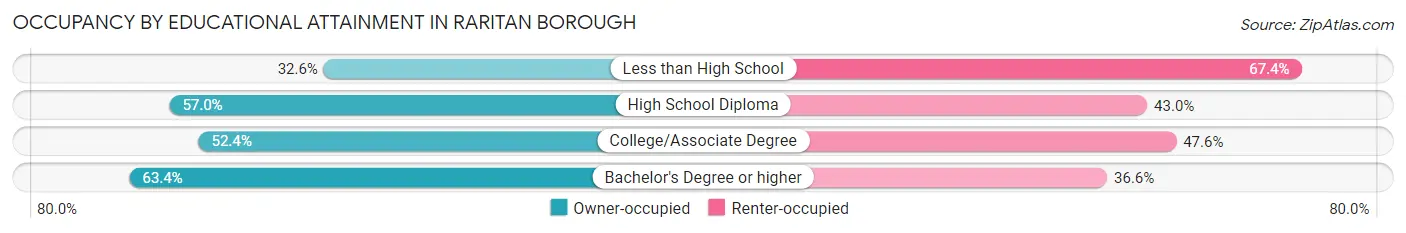
| Household Size | Owner-occupied | Renter-occupied |
| Less than High School | 56 (32.6%) | 116 (67.4%) |
| High School Diploma | 451 (57.0%) | 340 (43.0%) |
| College/Associate Degree | 511 (52.4%) | 464 (47.6%) |
| Bachelor's Degree or higher | 839 (63.4%) | 485 (36.6%) |
Occupancy by Age of Householder in Raritan borough
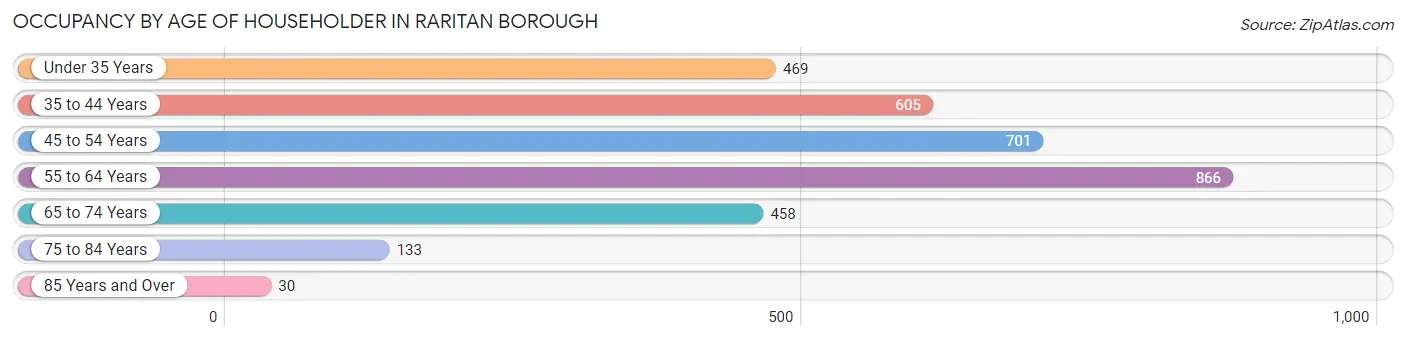
| Age Bracket | # Households | % Households |
| Under 35 Years | 469 | 14.4% |
| 35 to 44 Years | 605 | 18.5% |
| 45 to 54 Years | 701 | 21.5% |
| 55 to 64 Years | 866 | 26.6% |
| 65 to 74 Years | 458 | 14.0% |
| 75 to 84 Years | 133 | 4.1% |
| 85 Years and Over | 30 | 0.9% |
| Total | 3,262 | 100.0% |
Housing Finances in Raritan borough
Median Income by Occupancy in Raritan borough
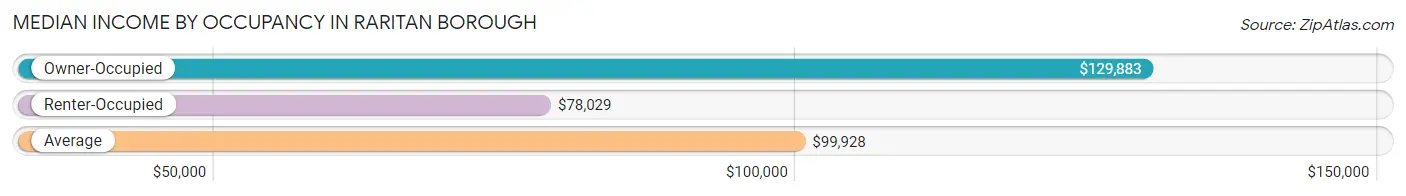
| Occupancy Type | # Households | Median Income |
| Owner-Occupied | 1,857 (56.9%) | $129,883 |
| Renter-Occupied | 1,405 (43.1%) | $78,029 |
| Average | 3,262 (100.0%) | $99,928 |
Occupancy by Householder Income Bracket in Raritan borough
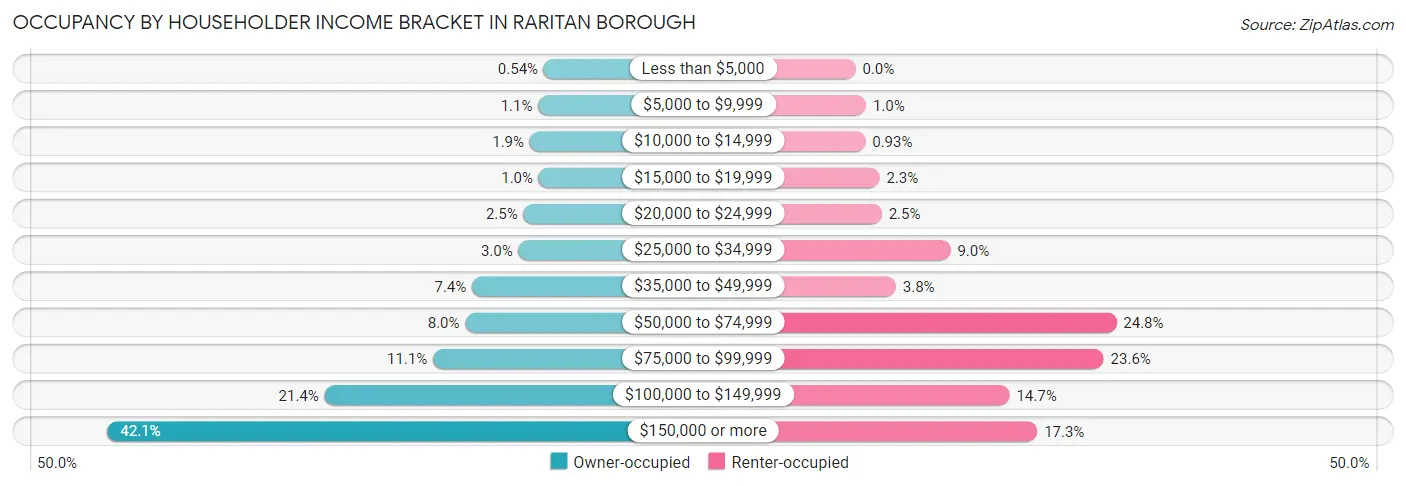
| Income Bracket | Owner-occupied | Renter-occupied |
| Less than $5,000 | 10 (0.5%) | 0 (0.0%) |
| $5,000 to $9,999 | 20 (1.1%) | 14 (1.0%) |
| $10,000 to $14,999 | 35 (1.9%) | 13 (0.9%) |
| $15,000 to $19,999 | 19 (1.0%) | 32 (2.3%) |
| $20,000 to $24,999 | 46 (2.5%) | 35 (2.5%) |
| $25,000 to $34,999 | 55 (3.0%) | 127 (9.0%) |
| $35,000 to $49,999 | 137 (7.4%) | 54 (3.8%) |
| $50,000 to $74,999 | 149 (8.0%) | 349 (24.8%) |
| $75,000 to $99,999 | 206 (11.1%) | 332 (23.6%) |
| $100,000 to $149,999 | 398 (21.4%) | 206 (14.7%) |
| $150,000 or more | 782 (42.1%) | 243 (17.3%) |
| Total | 1,857 (100.0%) | 1,405 (100.0%) |
Monthly Housing Cost Tiers in Raritan borough
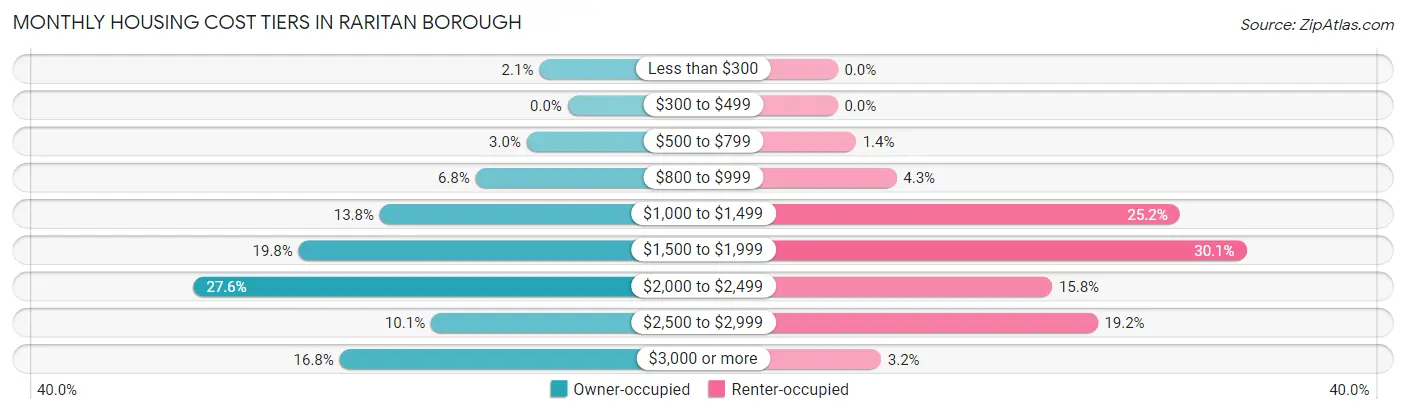
| Monthly Cost | Owner-occupied | Renter-occupied |
| Less than $300 | 39 (2.1%) | 0 (0.0%) |
| $300 to $499 | 0 (0.0%) | 0 (0.0%) |
| $500 to $799 | 56 (3.0%) | 19 (1.3%) |
| $800 to $999 | 126 (6.8%) | 61 (4.3%) |
| $1,000 to $1,499 | 257 (13.8%) | 354 (25.2%) |
| $1,500 to $1,999 | 368 (19.8%) | 423 (30.1%) |
| $2,000 to $2,499 | 512 (27.6%) | 222 (15.8%) |
| $2,500 to $2,999 | 187 (10.1%) | 269 (19.2%) |
| $3,000 or more | 312 (16.8%) | 45 (3.2%) |
| Total | 1,857 (100.0%) | 1,405 (100.0%) |
Physical Housing Characteristics in Raritan borough
Housing Structures in Raritan borough
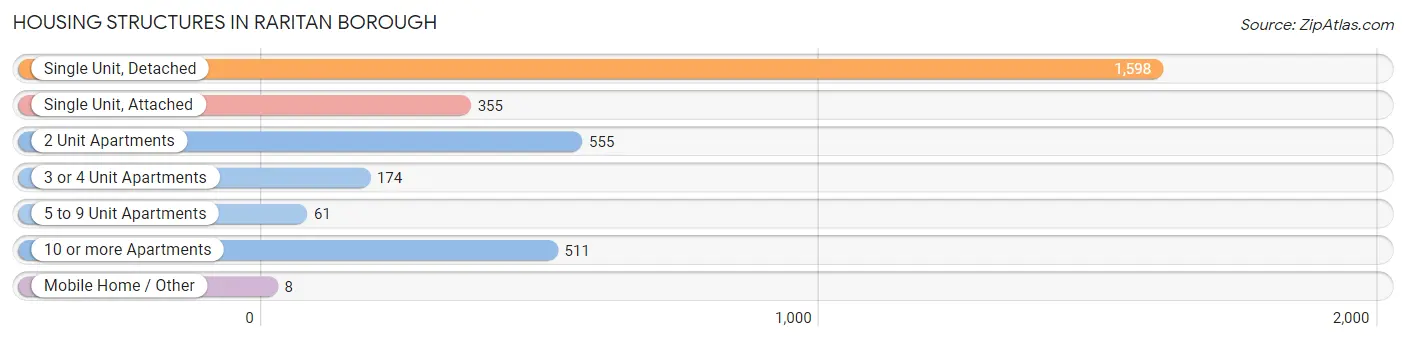
| Structure Type | # Housing Units | % Housing Units |
| Single Unit, Detached | 1,598 | 49.0% |
| Single Unit, Attached | 355 | 10.9% |
| 2 Unit Apartments | 555 | 17.0% |
| 3 or 4 Unit Apartments | 174 | 5.3% |
| 5 to 9 Unit Apartments | 61 | 1.9% |
| 10 or more Apartments | 511 | 15.7% |
| Mobile Home / Other | 8 | 0.3% |
| Total | 3,262 | 100.0% |
Housing Structures by Occupancy in Raritan borough
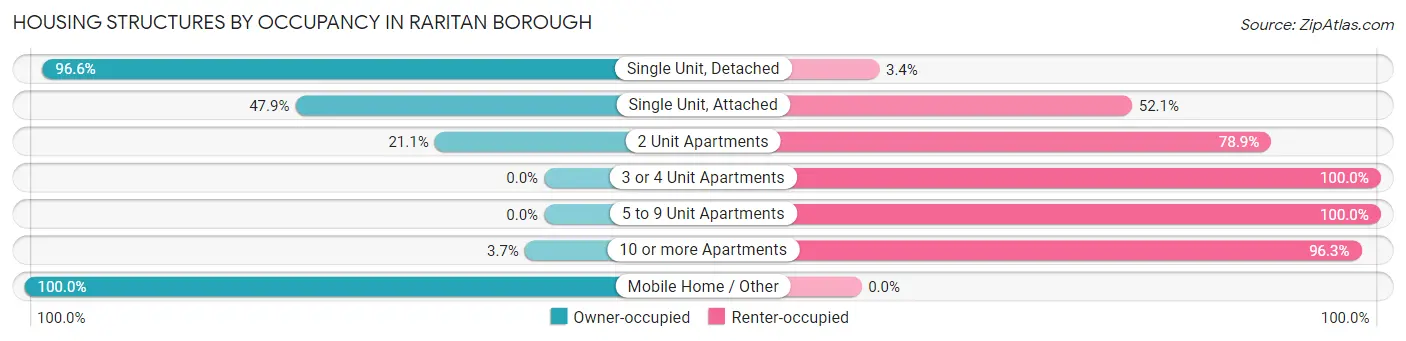
| Structure Type | Owner-occupied | Renter-occupied |
| Single Unit, Detached | 1,543 (96.6%) | 55 (3.4%) |
| Single Unit, Attached | 170 (47.9%) | 185 (52.1%) |
| 2 Unit Apartments | 117 (21.1%) | 438 (78.9%) |
| 3 or 4 Unit Apartments | 0 (0.0%) | 174 (100.0%) |
| 5 to 9 Unit Apartments | 0 (0.0%) | 61 (100.0%) |
| 10 or more Apartments | 19 (3.7%) | 492 (96.3%) |
| Mobile Home / Other | 8 (100.0%) | 0 (0.0%) |
| Total | 1,857 (56.9%) | 1,405 (43.1%) |
Housing Structures by Number of Rooms in Raritan borough
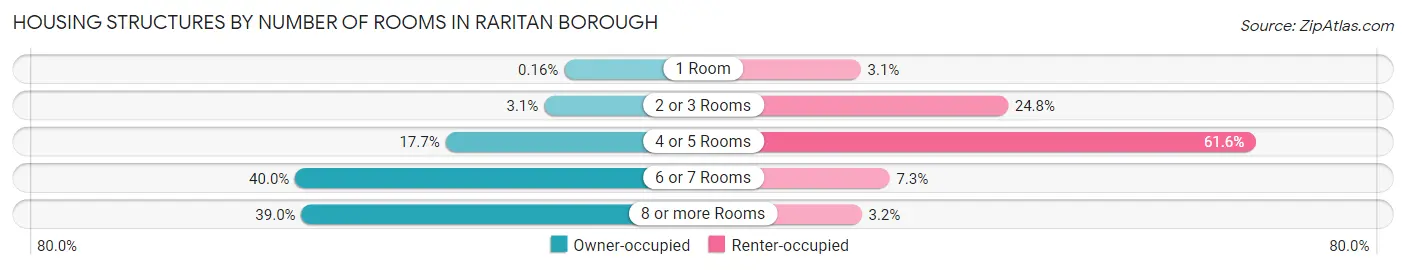
| Number of Rooms | Owner-occupied | Renter-occupied |
| 1 Room | 3 (0.2%) | 43 (3.1%) |
| 2 or 3 Rooms | 58 (3.1%) | 349 (24.8%) |
| 4 or 5 Rooms | 329 (17.7%) | 865 (61.6%) |
| 6 or 7 Rooms | 742 (40.0%) | 103 (7.3%) |
| 8 or more Rooms | 725 (39.0%) | 45 (3.2%) |
| Total | 1,857 (100.0%) | 1,405 (100.0%) |
Housing Structure by Heating Type in Raritan borough
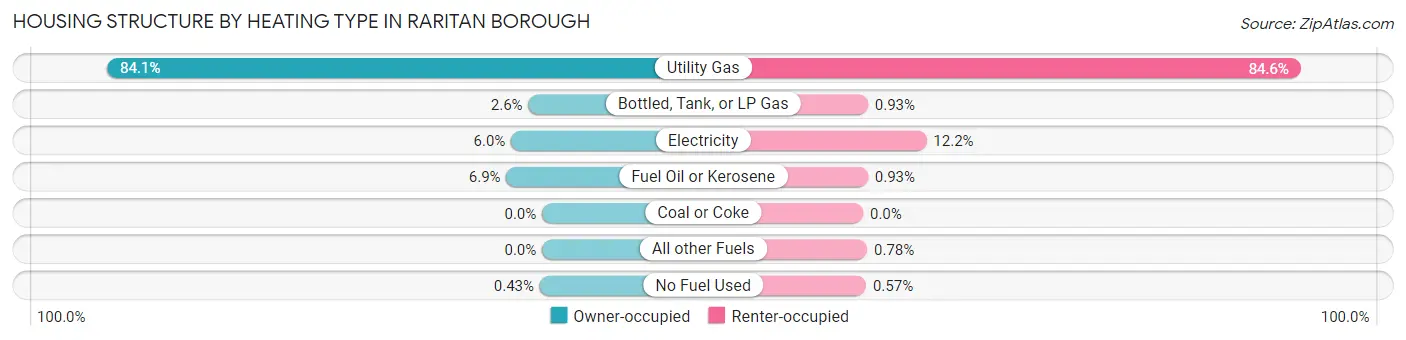
| Heating Type | Owner-occupied | Renter-occupied |
| Utility Gas | 1,561 (84.1%) | 1,188 (84.6%) |
| Bottled, Tank, or LP Gas | 49 (2.6%) | 13 (0.9%) |
| Electricity | 111 (6.0%) | 172 (12.2%) |
| Fuel Oil or Kerosene | 128 (6.9%) | 13 (0.9%) |
| Coal or Coke | 0 (0.0%) | 0 (0.0%) |
| All other Fuels | 0 (0.0%) | 11 (0.8%) |
| No Fuel Used | 8 (0.4%) | 8 (0.6%) |
| Total | 1,857 (100.0%) | 1,405 (100.0%) |
Household Vehicle Usage in Raritan borough
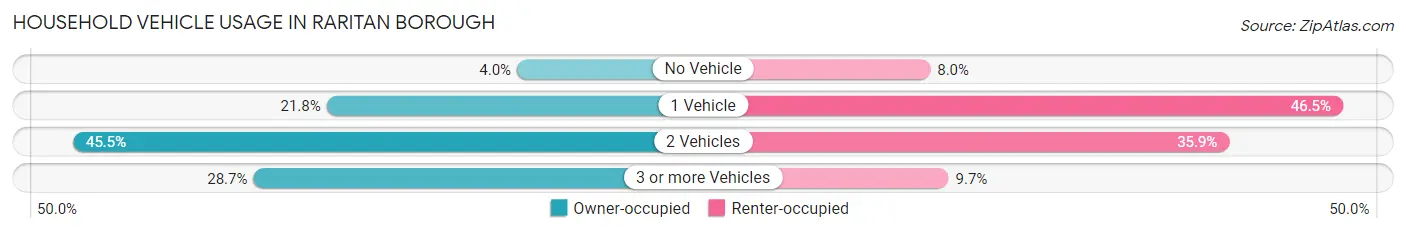
| Vehicles per Household | Owner-occupied | Renter-occupied |
| No Vehicle | 75 (4.0%) | 112 (8.0%) |
| 1 Vehicle | 405 (21.8%) | 653 (46.5%) |
| 2 Vehicles | 845 (45.5%) | 504 (35.9%) |
| 3 or more Vehicles | 532 (28.6%) | 136 (9.7%) |
| Total | 1,857 (100.0%) | 1,405 (100.0%) |
Real Estate & Mortgages in Raritan borough
Real Estate and Mortgage Overview in Raritan borough
| Characteristic | Without Mortgage | With Mortgage |
| Housing Units | 677 | 1,180 |
| Median Property Value | $453,700 | $429,500 |
| Median Household Income | $84,063 | $651 |
| Monthly Housing Costs | $1,309 | $305 |
| Real Estate Taxes | $9,554 | $0 |
Property Value by Mortgage Status in Raritan borough
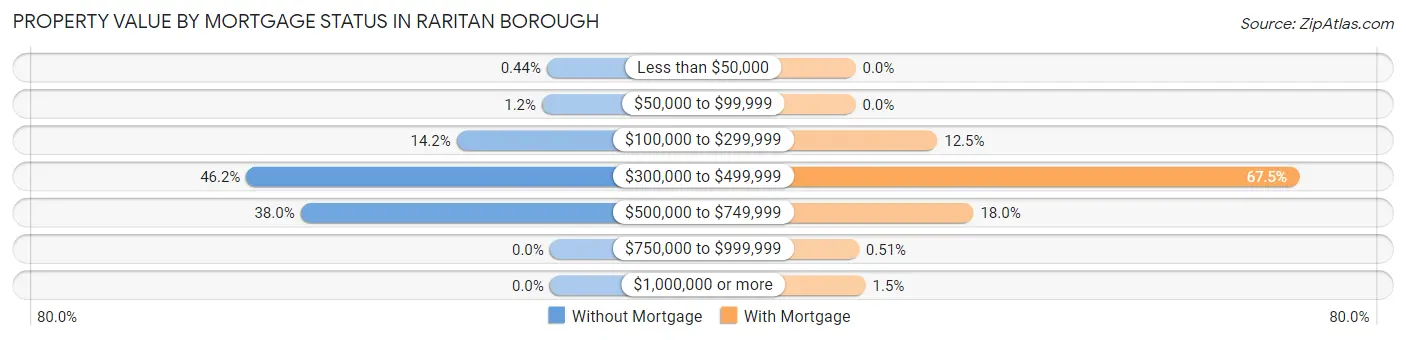
| Property Value | Without Mortgage | With Mortgage |
| Less than $50,000 | 3 (0.4%) | 0 (0.0%) |
| $50,000 to $99,999 | 8 (1.2%) | 0 (0.0%) |
| $100,000 to $299,999 | 96 (14.2%) | 147 (12.5%) |
| $300,000 to $499,999 | 313 (46.2%) | 797 (67.5%) |
| $500,000 to $749,999 | 257 (38.0%) | 212 (18.0%) |
| $750,000 to $999,999 | 0 (0.0%) | 6 (0.5%) |
| $1,000,000 or more | 0 (0.0%) | 18 (1.5%) |
| Total | 677 (100.0%) | 1,180 (100.0%) |
Household Income by Mortgage Status in Raritan borough
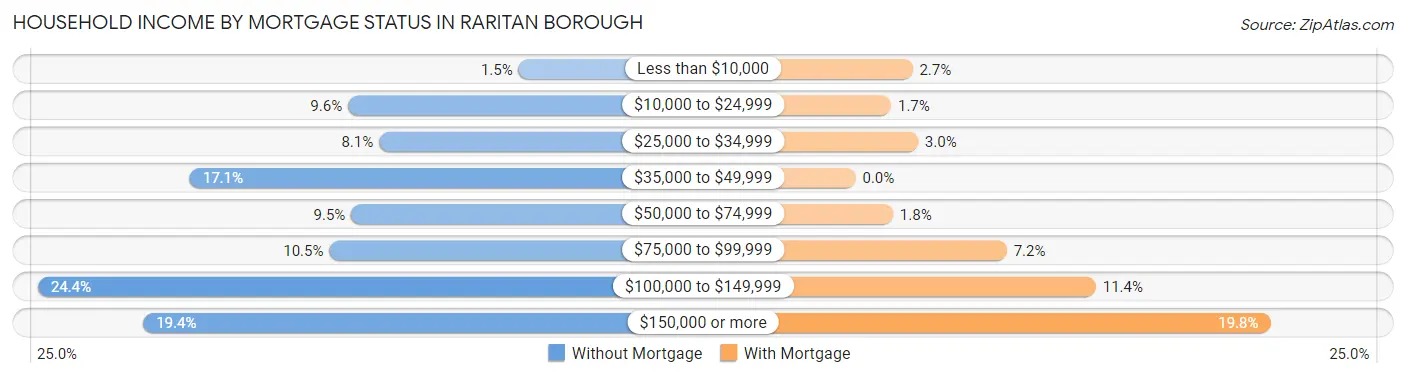
| Household Income | Without Mortgage | With Mortgage |
| Less than $10,000 | 10 (1.5%) | 32 (2.7%) |
| $10,000 to $24,999 | 65 (9.6%) | 20 (1.7%) |
| $25,000 to $34,999 | 55 (8.1%) | 35 (3.0%) |
| $35,000 to $49,999 | 116 (17.1%) | 0 (0.0%) |
| $50,000 to $74,999 | 64 (9.5%) | 21 (1.8%) |
| $75,000 to $99,999 | 71 (10.5%) | 85 (7.2%) |
| $100,000 to $149,999 | 165 (24.4%) | 135 (11.4%) |
| $150,000 or more | 131 (19.4%) | 233 (19.8%) |
| Total | 677 (100.0%) | 1,180 (100.0%) |
Property Value to Household Income Ratio in Raritan borough
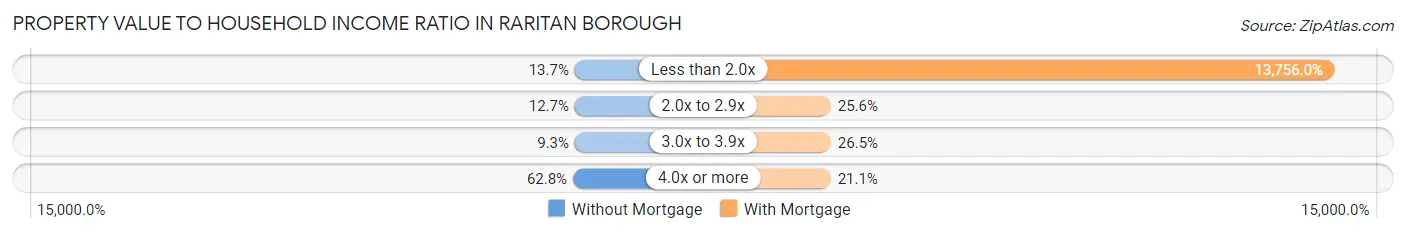
| Value-to-Income Ratio | Without Mortgage | With Mortgage |
| Less than 2.0x | 93 (13.7%) | 162,321 (13,756.0%) |
| 2.0x to 2.9x | 86 (12.7%) | 302 (25.6%) |
| 3.0x to 3.9x | 63 (9.3%) | 313 (26.5%) |
| 4.0x or more | 425 (62.8%) | 249 (21.1%) |
| Total | 677 (100.0%) | 1,180 (100.0%) |
Real Estate Taxes by Mortgage Status in Raritan borough
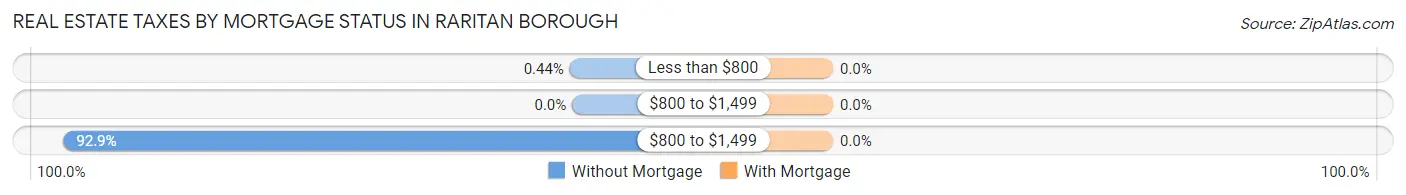
| Property Taxes | Without Mortgage | With Mortgage |
| Less than $800 | 3 (0.4%) | 0 (0.0%) |
| $800 to $1,499 | 0 (0.0%) | 0 (0.0%) |
| $800 to $1,499 | 629 (92.9%) | 0 (0.0%) |
| Total | 677 (100.0%) | 1,180 (100.0%) |
Health & Disability in Raritan borough
Health Insurance Coverage by Age in Raritan borough
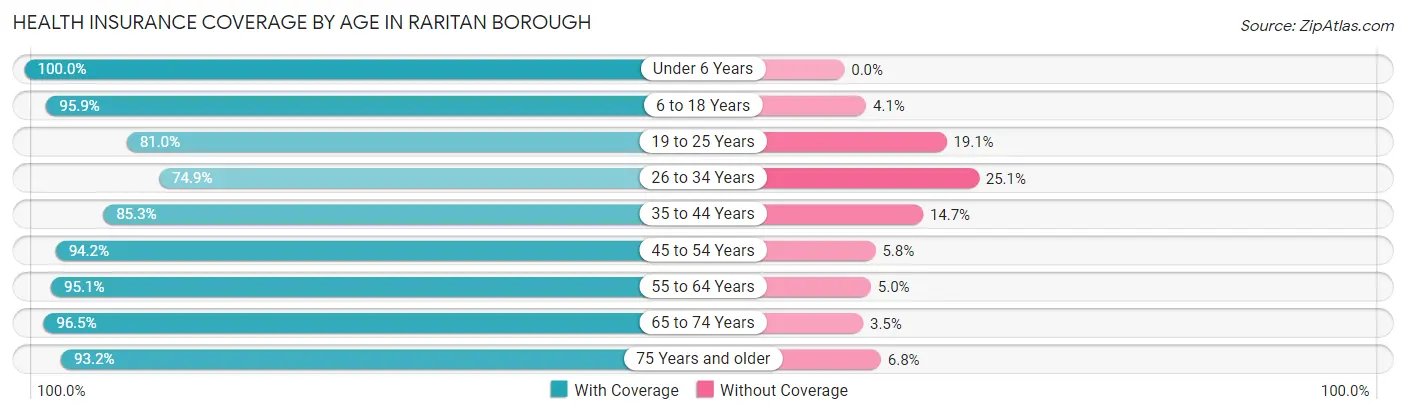
| Age Bracket | With Coverage | Without Coverage |
| Under 6 Years | 307 (100.0%) | 0 (0.0%) |
| 6 to 18 Years | 989 (95.9%) | 42 (4.1%) |
| 19 to 25 Years | 837 (80.9%) | 197 (19.1%) |
| 26 to 34 Years | 666 (74.9%) | 223 (25.1%) |
| 35 to 44 Years | 896 (85.3%) | 154 (14.7%) |
| 45 to 54 Years | 1,362 (94.2%) | 84 (5.8%) |
| 55 to 64 Years | 1,325 (95.1%) | 69 (5.0%) |
| 65 to 74 Years | 799 (96.5%) | 29 (3.5%) |
| 75 Years and older | 287 (93.2%) | 21 (6.8%) |
| Total | 7,468 (90.1%) | 819 (9.9%) |
Health Insurance Coverage by Citizenship Status in Raritan borough
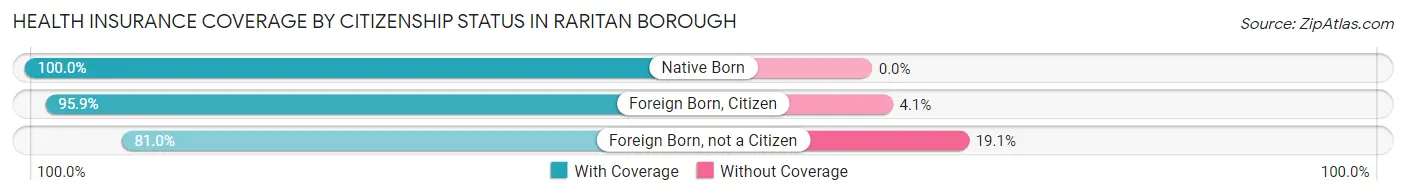
| Citizenship Status | With Coverage | Without Coverage |
| Native Born | 307 (100.0%) | 0 (0.0%) |
| Foreign Born, Citizen | 989 (95.9%) | 42 (4.1%) |
| Foreign Born, not a Citizen | 837 (80.9%) | 197 (19.1%) |
Health Insurance Coverage by Household Income in Raritan borough
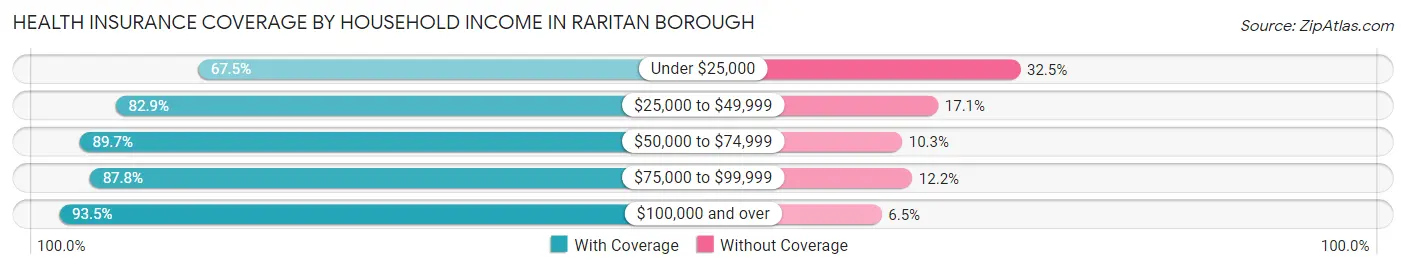
| Household Income | With Coverage | Without Coverage |
| Under $25,000 | 308 (67.5%) | 148 (32.5%) |
| $25,000 to $49,999 | 423 (82.9%) | 87 (17.1%) |
| $50,000 to $74,999 | 1,036 (89.7%) | 119 (10.3%) |
| $75,000 to $99,999 | 1,000 (87.8%) | 139 (12.2%) |
| $100,000 and over | 4,688 (93.5%) | 325 (6.5%) |
Public vs Private Health Insurance Coverage by Age in Raritan borough
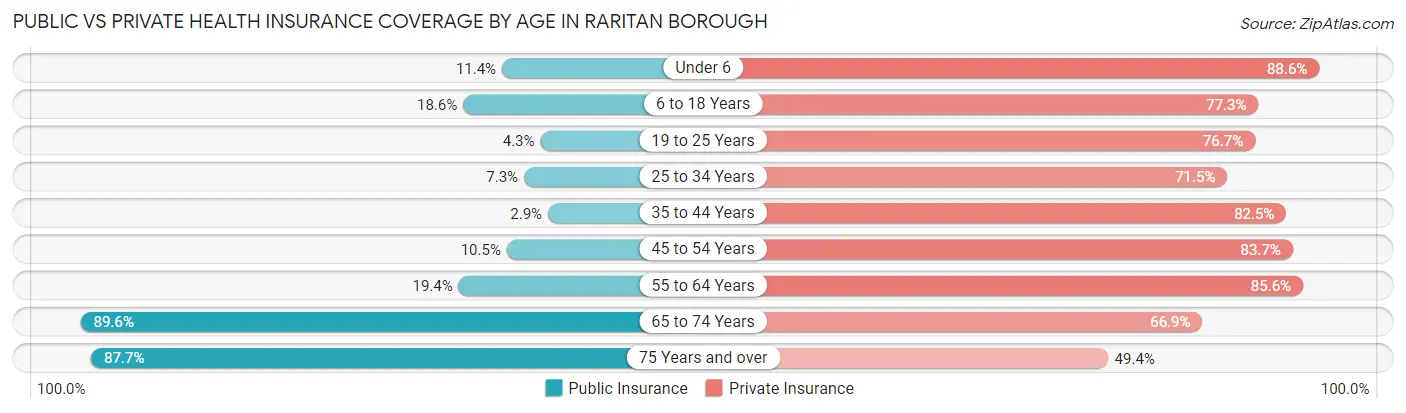
| Age Bracket | Public Insurance | Private Insurance |
| Under 6 | 35 (11.4%) | 272 (88.6%) |
| 6 to 18 Years | 192 (18.6%) | 797 (77.3%) |
| 19 to 25 Years | 44 (4.3%) | 793 (76.7%) |
| 25 to 34 Years | 65 (7.3%) | 636 (71.5%) |
| 35 to 44 Years | 30 (2.9%) | 866 (82.5%) |
| 45 to 54 Years | 152 (10.5%) | 1,210 (83.7%) |
| 55 to 64 Years | 271 (19.4%) | 1,193 (85.6%) |
| 65 to 74 Years | 742 (89.6%) | 554 (66.9%) |
| 75 Years and over | 270 (87.7%) | 152 (49.3%) |
| Total | 1,801 (21.7%) | 6,473 (78.1%) |
Disability Status by Sex by Age in Raritan borough
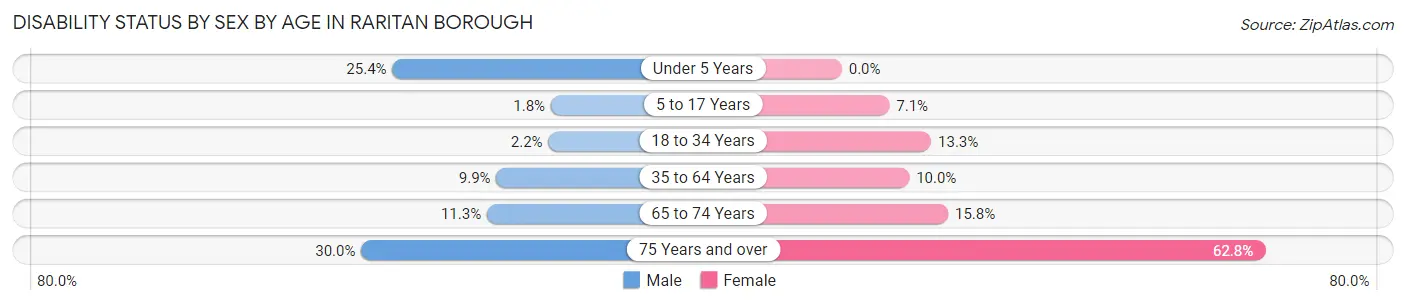
| Age Bracket | Male | Female |
| Under 5 Years | 50 (25.4%) | 0 (0.0%) |
| 5 to 17 Years | 8 (1.8%) | 36 (7.1%) |
| 18 to 34 Years | 26 (2.2%) | 114 (13.3%) |
| 35 to 64 Years | 184 (9.9%) | 204 (10.0%) |
| 65 to 74 Years | 45 (11.3%) | 68 (15.8%) |
| 75 Years and over | 48 (30.0%) | 93 (62.8%) |
Disability Class by Sex by Age in Raritan borough
Disability Class: Hearing Difficulty
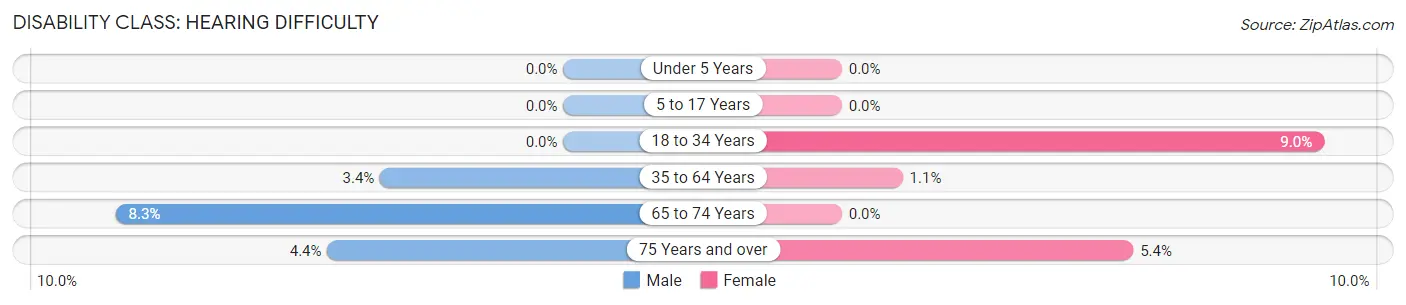
| Age Bracket | Male | Female |
| Under 5 Years | 0 (0.0%) | 0 (0.0%) |
| 5 to 17 Years | 0 (0.0%) | 0 (0.0%) |
| 18 to 34 Years | 0 (0.0%) | 77 (8.9%) |
| 35 to 64 Years | 63 (3.4%) | 23 (1.1%) |
| 65 to 74 Years | 33 (8.3%) | 0 (0.0%) |
| 75 Years and over | 7 (4.4%) | 8 (5.4%) |
Disability Class: Vision Difficulty
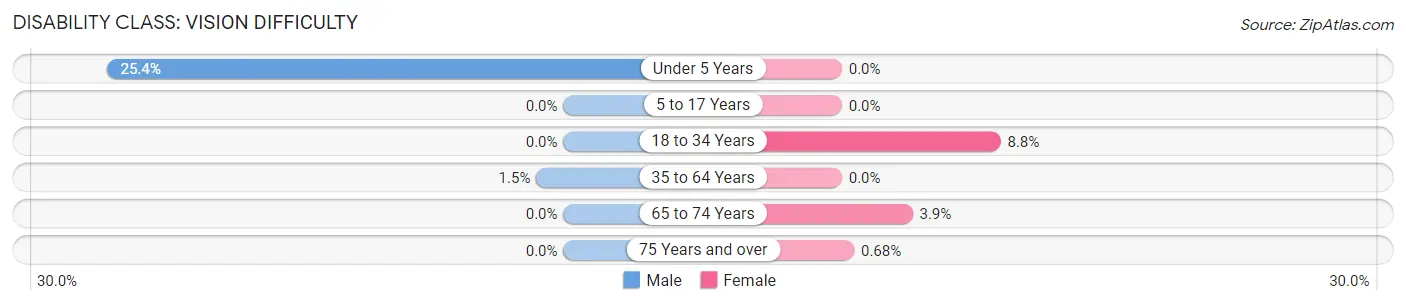
| Age Bracket | Male | Female |
| Under 5 Years | 50 (25.4%) | 0 (0.0%) |
| 5 to 17 Years | 0 (0.0%) | 0 (0.0%) |
| 18 to 34 Years | 0 (0.0%) | 76 (8.8%) |
| 35 to 64 Years | 28 (1.5%) | 0 (0.0%) |
| 65 to 74 Years | 0 (0.0%) | 17 (3.9%) |
| 75 Years and over | 0 (0.0%) | 1 (0.7%) |
Disability Class: Cognitive Difficulty
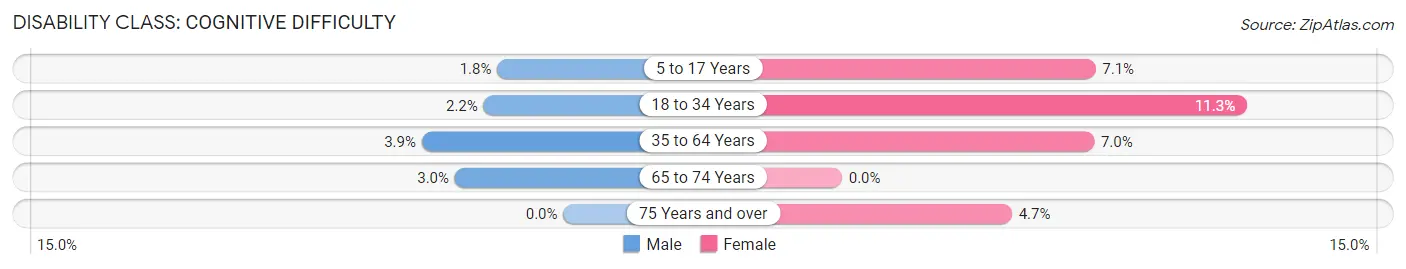
| Age Bracket | Male | Female |
| 5 to 17 Years | 8 (1.8%) | 36 (7.1%) |
| 18 to 34 Years | 26 (2.2%) | 97 (11.3%) |
| 35 to 64 Years | 73 (3.9%) | 143 (7.0%) |
| 65 to 74 Years | 12 (3.0%) | 0 (0.0%) |
| 75 Years and over | 0 (0.0%) | 7 (4.7%) |
Disability Class: Ambulatory Difficulty
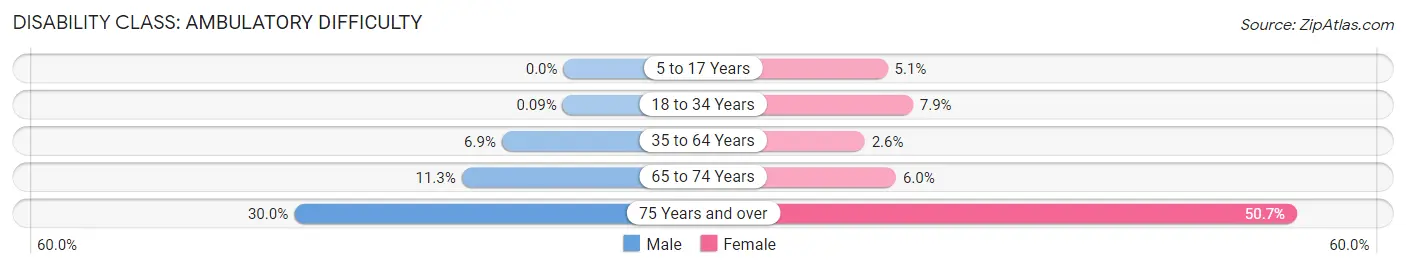
| Age Bracket | Male | Female |
| 5 to 17 Years | 0 (0.0%) | 26 (5.1%) |
| 18 to 34 Years | 1 (0.1%) | 68 (7.9%) |
| 35 to 64 Years | 127 (6.9%) | 52 (2.5%) |
| 65 to 74 Years | 45 (11.3%) | 26 (6.0%) |
| 75 Years and over | 48 (30.0%) | 75 (50.7%) |
Disability Class: Self-Care Difficulty
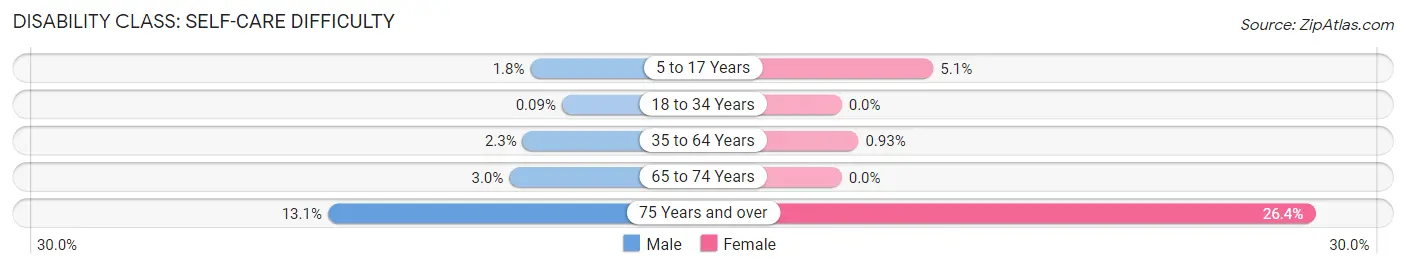
| Age Bracket | Male | Female |
| 5 to 17 Years | 8 (1.8%) | 26 (5.1%) |
| 18 to 34 Years | 1 (0.1%) | 0 (0.0%) |
| 35 to 64 Years | 42 (2.3%) | 19 (0.9%) |
| 65 to 74 Years | 12 (3.0%) | 0 (0.0%) |
| 75 Years and over | 21 (13.1%) | 39 (26.4%) |
Technology Access in Raritan borough
Computing Device Access in Raritan borough
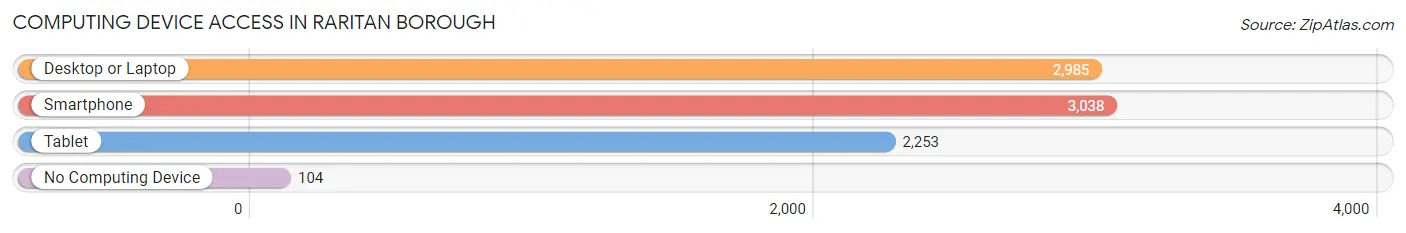
| Device Type | # Households | % Households |
| Desktop or Laptop | 2,985 | 91.5% |
| Smartphone | 3,038 | 93.1% |
| Tablet | 2,253 | 69.1% |
| No Computing Device | 104 | 3.2% |
| Total | 3,262 | 100.0% |
Internet Access in Raritan borough
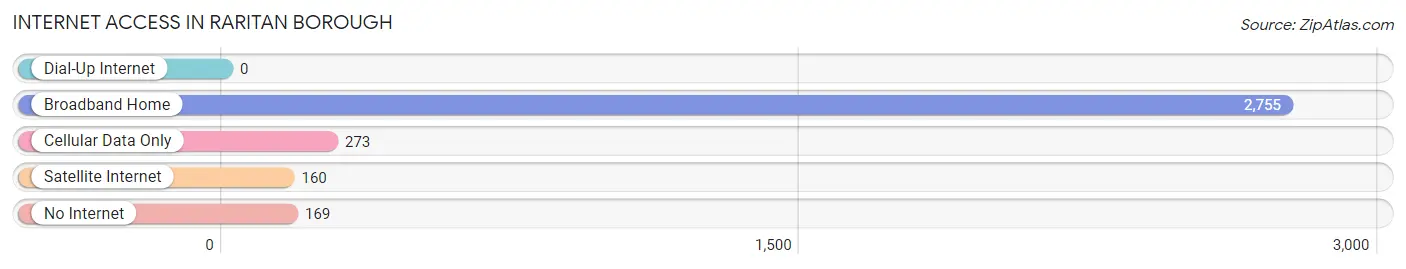
| Internet Type | # Households | % Households |
| Dial-Up Internet | 0 | 0.0% |
| Broadband Home | 2,755 | 84.5% |
| Cellular Data Only | 273 | 8.4% |
| Satellite Internet | 160 | 4.9% |
| No Internet | 169 | 5.2% |
| Total | 3,262 | 100.0% |
Raritan borough Summary
Raritan Borough is a small borough located in Somerset County, New Jersey. It is situated in the Raritan Valley region of Central New Jersey, and is part of the larger New York metropolitan area. The borough is bordered by Bridgewater Township to the north, Hillsborough Township to the west, and Franklin Township to the south. The borough has a total area of 2.2 square miles, all of which is land.
History
Raritan Borough was originally part of Bridgewater Township, which was established in 1749. In 1870, the area that is now Raritan Borough was incorporated as a separate municipality. The borough was named after the Raritan River, which runs through the area.
The borough was originally a farming community, but in the late 19th century, it began to develop into a residential community. The borough was home to several factories, including a silk mill, a paper mill, and a brickyard. The borough also had a railroad station, which was used to transport goods to and from the borough.
In the early 20th century, the borough began to experience rapid growth. The population increased from 1,000 in 1900 to over 5,000 by 1950. The borough also experienced an influx of immigrants from Italy, Poland, and other European countries.
Geography
Raritan Borough is located in the Raritan Valley region of Central New Jersey. The borough is bordered by Bridgewater Township to the north, Hillsborough Township to the west, and Franklin Township to the south. The borough has a total area of 2.2 square miles, all of which is land.
The borough is located on the Raritan River, which runs through the area. The river is a major source of recreation for the borough, and is home to several parks and trails. The borough is also home to several small lakes, including Lake Nelson and Lake Raritan.
Economy
Raritan Borough has a diverse economy. The borough is home to several small businesses, including restaurants, retail stores, and professional services. The borough is also home to several large employers, including Johnson & Johnson, Merck, and Novartis.
The borough is also home to several industrial parks, which are home to a variety of manufacturing and distribution companies. The borough is also home to several corporate headquarters, including those of Johnson & Johnson and Merck.
Demographics
As of the 2010 census, the borough had a population of 6,881. The racial makeup of the borough was 79.2% White, 8.3% African American, 0.3% Native American, 6.2% Asian, and 4.9% from other races. Hispanic or Latino of any race were 15.2% of the population.
The median household income in the borough was $76,944, and the median family income was $90,917. The per capita income in the borough was $35,945. About 4.2% of families and 5.7% of the population were below the poverty line.
Raritan Borough is a small borough with a diverse population and a strong economy. The borough is home to several large employers, and is a popular destination for recreation and leisure activities. The borough is also home to several parks and trails, making it a great place to live and work.
Common Questions
What is Per Capita Income in Raritan borough?
Per Capita income in Raritan borough is $56,129.
What is the Median Family Income in Raritan borough?
Median Family Income in Raritan borough is $127,528.
What is the Median Household income in Raritan borough?
Median Household Income in Raritan borough is $99,928.
What is Income or Wage Gap in Raritan borough?
Income or Wage Gap in Raritan borough is 2.6%.
Women in Raritan borough earn 97.4 cents for every dollar earned by a man.
What is Family Income Deficit in Raritan borough?
Family Income Deficit in Raritan borough is $8,356.
Families that are below poverty line in Raritan borough earn $8,356 less on average than the poverty threshold level.
What is Inequality or Gini Index in Raritan borough?
Inequality or Gini Index in Raritan borough is 0.44.
What is the Total Population of Raritan borough?
Total Population of Raritan borough is 8,301.
What is the Total Male Population of Raritan borough?
Total Male Population of Raritan borough is 4,224.
What is the Total Female Population of Raritan borough?
Total Female Population of Raritan borough is 4,077.
What is the Ratio of Males per 100 Females in Raritan borough?
There are 103.61 Males per 100 Females in Raritan borough.
What is the Ratio of Females per 100 Males in Raritan borough?
There are 96.52 Females per 100 Males in Raritan borough.
What is the Median Population Age in Raritan borough?
Median Population Age in Raritan borough is 43.2 Years.
What is the Average Family Size in Raritan borough
Average Family Size in Raritan borough is 3.2 People.
What is the Average Household Size in Raritan borough
Average Household Size in Raritan borough is 2.5 People.
How Large is the Labor Force in Raritan borough?
There are 5,514 People in the Labor Forcein in Raritan borough.
What is the Percentage of People in the Labor Force in Raritan borough?
76.6% of People are in the Labor Force in Raritan borough.
What is the Unemployment Rate in Raritan borough?
Unemployment Rate in Raritan borough is 5.5%.