Trenton, NJ Map & Demographics
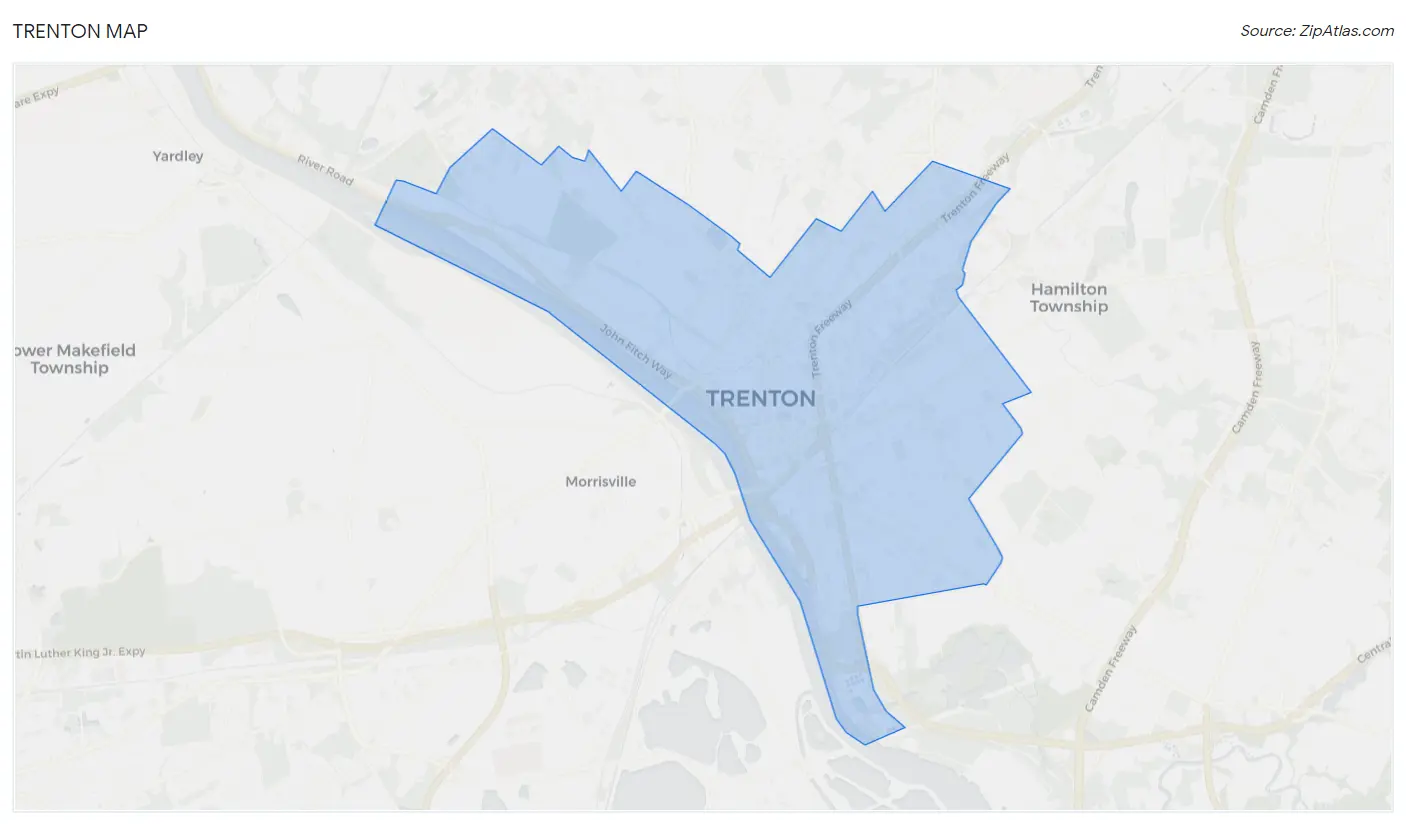
Trenton Map
Trenton Overview
$27,565
PER CAPITA INCOME
$59,042
AVG FAMILY INCOME
$44,444
AVG HOUSEHOLD INCOME
3.6%
WAGE / INCOME GAP [ % ]
96.4¢/ $1
WAGE / INCOME GAP [ $ ]
$11,546
FAMILY INCOME DEFICIT
0.56
INEQUALITY / GINI INDEX
90,055
TOTAL POPULATION
43,248
MALE POPULATION
46,807
FEMALE POPULATION
92.40
MALES / 100 FEMALES
108.23
FEMALES / 100 MALES
35.8
MEDIAN AGE
3.6
AVG FAMILY SIZE
2.7
AVG HOUSEHOLD SIZE
40,447
LABOR FORCE [ PEOPLE ]
59.1%
PERCENT IN LABOR FORCE
10.2%
UNEMPLOYMENT RATE
Trenton Area Codes
Income in Trenton
Income Overview in Trenton
Per Capita Income in Trenton is $27,565, while median incomes of families and households are $59,042 and $44,444 respectively.
| Characteristic | Number | Measure |
| Per Capita Income | 90,055 | $27,565 |
| Median Family Income | 18,055 | $59,042 |
| Mean Family Income | 18,055 | $93,061 |
| Median Household Income | 32,165 | $44,444 |
| Mean Household Income | 32,165 | $73,045 |
| Income Deficit | 18,055 | $11,546 |
| Wage / Income Gap (%) | 90,055 | 3.62% |
| Wage / Income Gap ($) | 90,055 | 96.38¢ per $1 |
| Gini / Inequality Index | 90,055 | 0.56 |
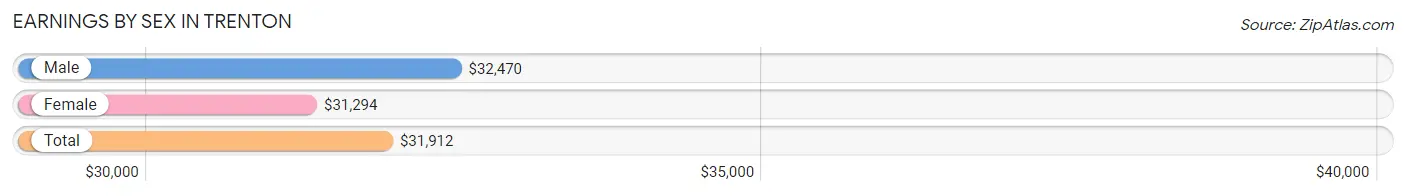
Earnings by Sex in Trenton
Average Earnings in Trenton are $31,912, $32,470 for men and $31,294 for women, a difference of 3.6%.
| Sex | Number | Average Earnings |
| Male | 21,407 (52.6%) | $32,470 |
| Female | 19,308 (47.4%) | $31,294 |
| Total | 40,715 (100.0%) | $31,912 |
Earnings by Sex by Income Bracket in Trenton
The most common earnings brackets in Trenton are $25,000 to $29,999 for men (1,744 | 8.2%) and $30,000 to $34,999 for women (1,781 | 9.2%).
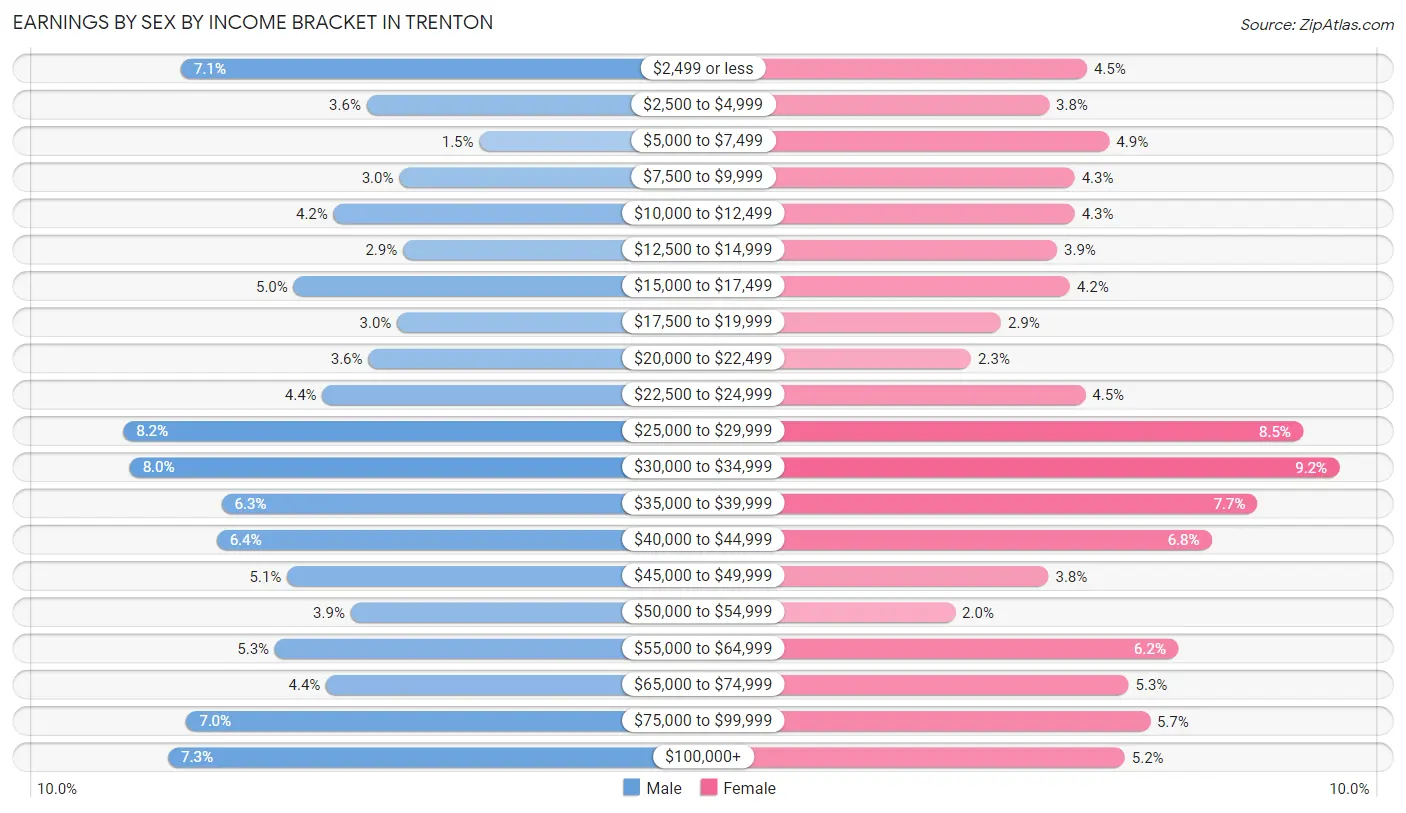
| Income | Male | Female |
| $2,499 or less | 1,513 (7.1%) | 868 (4.5%) |
| $2,500 to $4,999 | 769 (3.6%) | 732 (3.8%) |
| $5,000 to $7,499 | 317 (1.5%) | 949 (4.9%) |
| $7,500 to $9,999 | 638 (3.0%) | 825 (4.3%) |
| $10,000 to $12,499 | 901 (4.2%) | 824 (4.3%) |
| $12,500 to $14,999 | 623 (2.9%) | 760 (3.9%) |
| $15,000 to $17,499 | 1,061 (5.0%) | 808 (4.2%) |
| $17,500 to $19,999 | 647 (3.0%) | 558 (2.9%) |
| $20,000 to $22,499 | 762 (3.6%) | 449 (2.3%) |
| $22,500 to $24,999 | 947 (4.4%) | 863 (4.5%) |
| $25,000 to $29,999 | 1,744 (8.2%) | 1,648 (8.5%) |
| $30,000 to $34,999 | 1,720 (8.0%) | 1,781 (9.2%) |
| $35,000 to $39,999 | 1,350 (6.3%) | 1,484 (7.7%) |
| $40,000 to $44,999 | 1,370 (6.4%) | 1,318 (6.8%) |
| $45,000 to $49,999 | 1,087 (5.1%) | 729 (3.8%) |
| $50,000 to $54,999 | 833 (3.9%) | 392 (2.0%) |
| $55,000 to $64,999 | 1,137 (5.3%) | 1,198 (6.2%) |
| $65,000 to $74,999 | 931 (4.3%) | 1,020 (5.3%) |
| $75,000 to $99,999 | 1,493 (7.0%) | 1,097 (5.7%) |
| $100,000+ | 1,564 (7.3%) | 1,005 (5.2%) |
| Total | 21,407 (100.0%) | 19,308 (100.0%) |
Earnings by Sex by Educational Attainment in Trenton
Average earnings in Trenton are $35,093 for men and $33,270 for women, a difference of 5.2%. Men with an educational attainment of graduate degree enjoy the highest average annual earnings of $71,875, while those with less than high school education earn the least with $30,936. Women with an educational attainment of graduate degree earn the most with the average annual earnings of $70,025, while those with less than high school education have the smallest earnings of $22,988.
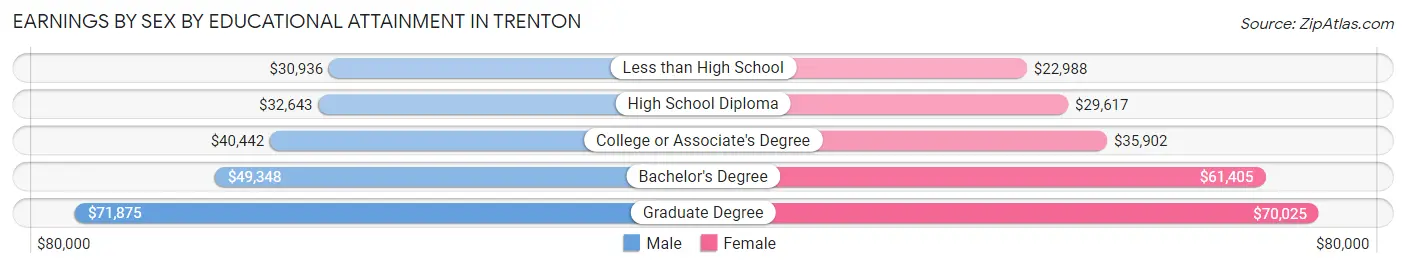
| Educational Attainment | Male Income | Female Income |
| Less than High School | $30,936 | $22,988 |
| High School Diploma | $32,643 | $29,617 |
| College or Associate's Degree | $40,442 | $35,902 |
| Bachelor's Degree | $49,348 | $61,405 |
| Graduate Degree | $71,875 | $70,025 |
| Total | $35,093 | $33,270 |
Family Income in Trenton
Family Income Brackets in Trenton
According to the Trenton family income data, there are 3,196 families falling into the $50,000 to $74,999 income range, which is the most common income bracket and makes up 17.7% of all families. Conversely, the $150,000 to $199,999 income bracket is the least frequent group with only 1,029 families (5.7%) belonging to this category.
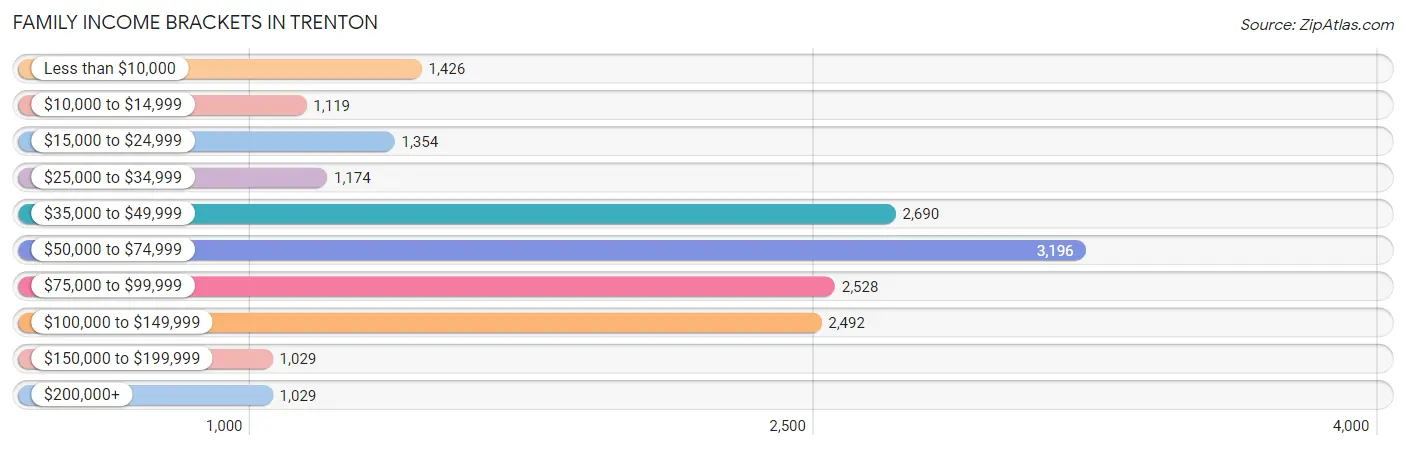
| Income Bracket | # Families | % Families |
| Less than $10,000 | 1,426 | 7.9% |
| $10,000 to $14,999 | 1,119 | 6.2% |
| $15,000 to $24,999 | 1,354 | 7.5% |
| $25,000 to $34,999 | 1,174 | 6.5% |
| $35,000 to $49,999 | 2,690 | 14.9% |
| $50,000 to $74,999 | 3,196 | 17.7% |
| $75,000 to $99,999 | 2,528 | 14.0% |
| $100,000 to $149,999 | 2,492 | 13.8% |
| $150,000 to $199,999 | 1,029 | 5.7% |
| $200,000+ | 1,029 | 5.7% |
Family Income by Famaliy Size in Trenton
7+ person families (693 | 3.8%) account for the highest median family income in Trenton with $84,795 per family, while 2-person families (6,808 | 37.7%) have the highest median income of $23,639 per family member.
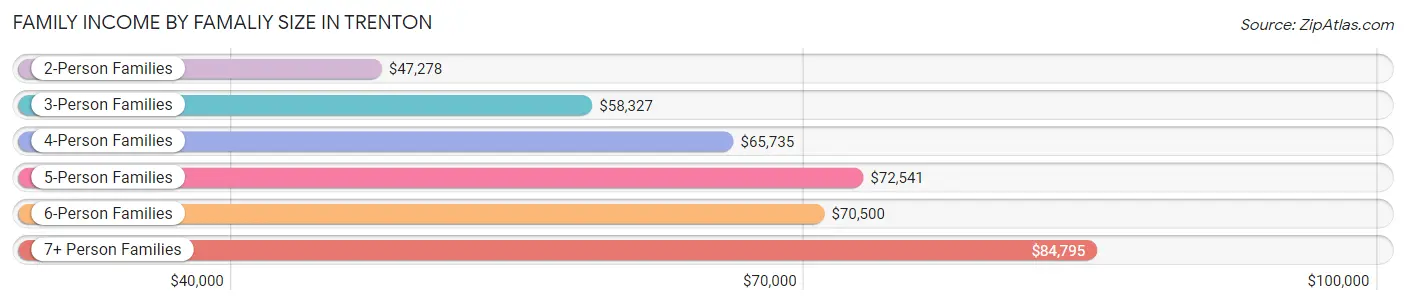
| Income Bracket | # Families | Median Income |
| 2-Person Families | 6,808 (37.7%) | $47,278 |
| 3-Person Families | 4,381 (24.3%) | $58,327 |
| 4-Person Families | 3,608 (20.0%) | $65,735 |
| 5-Person Families | 1,621 (9.0%) | $72,541 |
| 6-Person Families | 944 (5.2%) | $70,500 |
| 7+ Person Families | 693 (3.8%) | $84,795 |
| Total | 18,055 (100.0%) | $59,042 |
Family Income by Number of Earners in Trenton
The median family income in Trenton is $59,042, with families comprising 3+ earners (2,561) having the highest median family income of $114,093, while families with no earners (2,867) have the lowest median family income of $17,883, accounting for 14.2% and 15.9% of families, respectively.
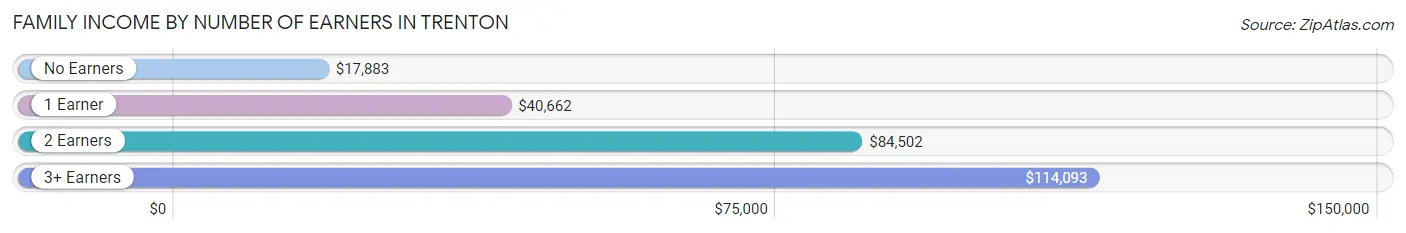
| Number of Earners | # Families | Median Income |
| No Earners | 2,867 (15.9%) | $17,883 |
| 1 Earner | 6,948 (38.5%) | $40,662 |
| 2 Earners | 5,679 (31.5%) | $84,502 |
| 3+ Earners | 2,561 (14.2%) | $114,093 |
| Total | 18,055 (100.0%) | $59,042 |
Household Income in Trenton
Household Income Brackets in Trenton
With 4,407 households falling in the category, the $50,000 to $74,999 income range is the most frequent in Trenton, accounting for 13.7% of all households. In contrast, only 1,319 households (4.1%) fall into the $150,000 to $199,999 income bracket, making it the least populous group.
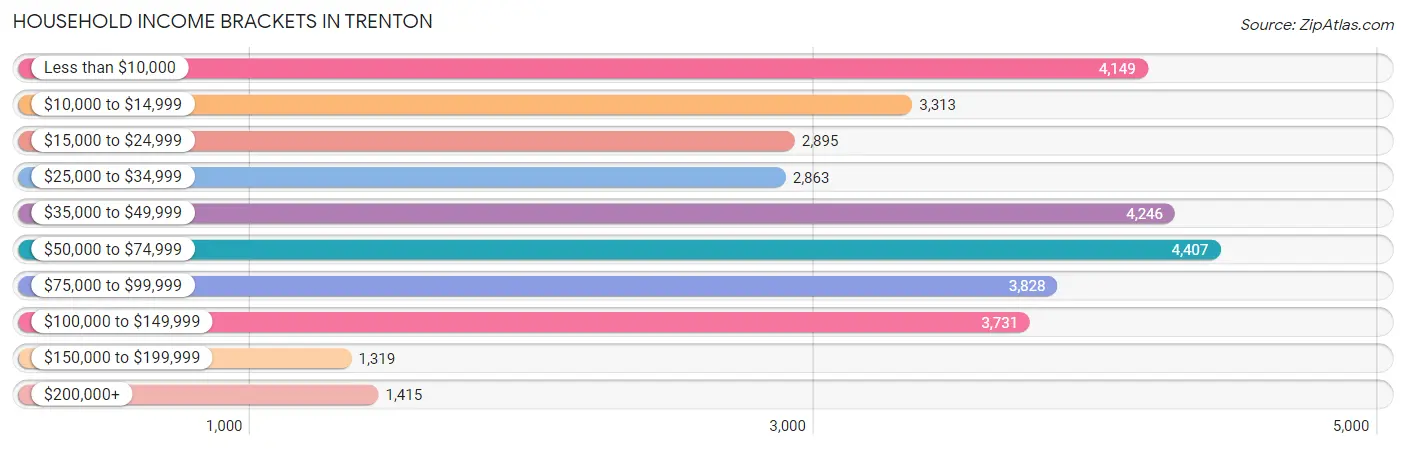
| Income Bracket | # Households | % Households |
| Less than $10,000 | 4,149 | 12.9% |
| $10,000 to $14,999 | 3,313 | 10.3% |
| $15,000 to $24,999 | 2,895 | 9.0% |
| $25,000 to $34,999 | 2,863 | 8.9% |
| $35,000 to $49,999 | 4,246 | 13.2% |
| $50,000 to $74,999 | 4,407 | 13.7% |
| $75,000 to $99,999 | 3,828 | 11.9% |
| $100,000 to $149,999 | 3,731 | 11.6% |
| $150,000 to $199,999 | 1,319 | 4.1% |
| $200,000+ | 1,415 | 4.4% |
Household Income by Householder Age in Trenton
The median household income in Trenton is $44,444, with the highest median household income of $50,659 found in the 45 to 64 years age bracket for the primary householder. A total of 13,078 households (40.7%) fall into this category. Meanwhile, the 65+ years age bracket for the primary householder has the lowest median household income of $35,745, with 7,885 households (24.5%) in this group.
| Income Bracket | # Households | Median Income |
| 15 to 24 Years | 1,104 (3.4%) | $37,624 |
| 25 to 44 Years | 10,098 (31.4%) | $44,324 |
| 45 to 64 Years | 13,078 (40.7%) | $50,659 |
| 65+ Years | 7,885 (24.5%) | $35,745 |
| Total | 32,165 (100.0%) | $44,444 |
Poverty in Trenton
Income Below Poverty by Sex and Age in Trenton
With 21.7% poverty level for males and 30.1% for females among the residents of Trenton, 15 year old males and 12 to 14 year old females are the most vulnerable to poverty, with 134 males (46.2%) and 882 females (41.0%) in their respective age groups living below the poverty level.
| Age Bracket | Male | Female |
| Under 5 Years | 670 (22.7%) | 1,494 (37.0%) |
| 5 Years | 213 (28.6%) | 249 (30.1%) |
| 6 to 11 Years | 1,361 (32.5%) | 1,675 (40.2%) |
| 12 to 14 Years | 222 (16.8%) | 882 (41.0%) |
| 15 Years | 134 (46.2%) | 122 (21.1%) |
| 16 and 17 Years | 231 (27.2%) | 219 (26.4%) |
| 18 to 24 Years | 536 (17.2%) | 1,015 (26.8%) |
| 25 to 34 Years | 1,533 (25.3%) | 1,977 (27.6%) |
| 35 to 44 Years | 1,066 (18.0%) | 1,750 (30.1%) |
| 45 to 54 Years | 996 (17.8%) | 1,485 (28.2%) |
| 55 to 64 Years | 1,165 (21.5%) | 1,425 (24.8%) |
| 65 to 74 Years | 664 (21.5%) | 1,100 (30.7%) |
| 75 Years and over | 125 (8.9%) | 582 (23.4%) |
| Total | 8,916 (21.7%) | 13,975 (30.1%) |
Income Above Poverty by Sex and Age in Trenton
According to the poverty statistics in Trenton, males aged 75 years and over and females aged 15 years are the age groups that are most secure financially, with 91.1% of males and 78.9% of females in these age groups living above the poverty line.
| Age Bracket | Male | Female |
| Under 5 Years | 2,288 (77.3%) | 2,542 (63.0%) |
| 5 Years | 531 (71.4%) | 578 (69.9%) |
| 6 to 11 Years | 2,831 (67.5%) | 2,490 (59.8%) |
| 12 to 14 Years | 1,101 (83.2%) | 1,267 (59.0%) |
| 15 Years | 156 (53.8%) | 457 (78.9%) |
| 16 and 17 Years | 617 (72.8%) | 611 (73.6%) |
| 18 to 24 Years | 2,590 (82.9%) | 2,766 (73.2%) |
| 25 to 34 Years | 4,539 (74.8%) | 5,193 (72.4%) |
| 35 to 44 Years | 4,857 (82.0%) | 4,060 (69.9%) |
| 45 to 54 Years | 4,604 (82.2%) | 3,780 (71.8%) |
| 55 to 64 Years | 4,264 (78.5%) | 4,320 (75.2%) |
| 65 to 74 Years | 2,424 (78.5%) | 2,482 (69.3%) |
| 75 Years and over | 1,274 (91.1%) | 1,908 (76.6%) |
| Total | 32,076 (78.2%) | 32,454 (69.9%) |
Income Below Poverty Among Married-Couple Families in Trenton
The poverty statistics for married-couple families in Trenton show that 9.9% or 830 of the total 8,364 families live below the poverty line. Families with 5 or more children have the highest poverty rate of 38.1%, comprising of 74 families. On the other hand, families with no children have the lowest poverty rate of 6.8%, which includes 304 families.
| Children | Above Poverty | Below Poverty |
| No Children | 4,182 (93.2%) | 304 (6.8%) |
| 1 or 2 Children | 2,451 (92.0%) | 212 (8.0%) |
| 3 or 4 Children | 781 (76.5%) | 240 (23.5%) |
| 5 or more Children | 120 (61.9%) | 74 (38.1%) |
| Total | 7,534 (90.1%) | 830 (9.9%) |
Income Below Poverty Among Single-Parent Households in Trenton
According to the poverty data in Trenton, 9.4% or 210 single-father households and 38.9% or 2,895 single-mother households are living below the poverty line. Among single-father households, those with 3 or 4 children have the highest poverty rate, with 26 households (20.8%) experiencing poverty. Likewise, among single-mother households, those with 1 or 2 children have the highest poverty rate, with 1,810 households (50.0%) falling below the poverty line.
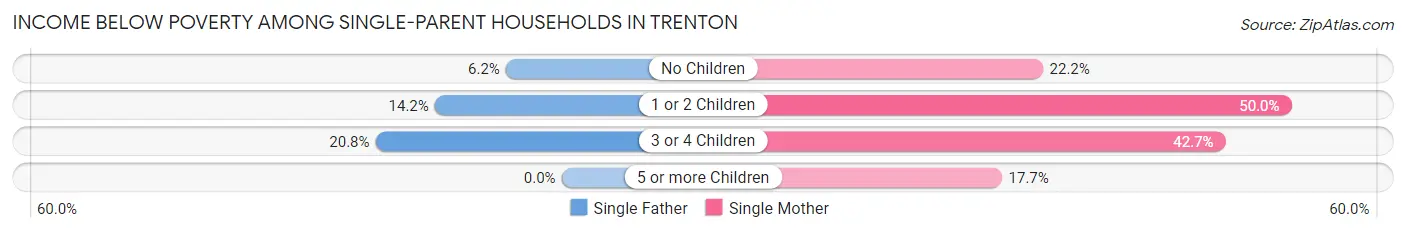
| Children | Single Father | Single Mother |
| No Children | 87 (6.2%) | 576 (22.2%) |
| 1 or 2 Children | 97 (14.2%) | 1,810 (50.0%) |
| 3 or 4 Children | 26 (20.8%) | 494 (42.7%) |
| 5 or more Children | 0 (0.0%) | 15 (17.6%) |
| Total | 210 (9.4%) | 2,895 (38.9%) |
Income Below Poverty Among Married-Couple vs Single-Parent Households in Trenton
The poverty data for Trenton shows that 830 of the married-couple family households (9.9%) and 3,105 of the single-parent households (32.0%) are living below the poverty level. Within the married-couple family households, those with 5 or more children have the highest poverty rate, with 74 households (38.1%) falling below the poverty line. Among the single-parent households, those with 1 or 2 children have the highest poverty rate, with 1,907 household (44.3%) living below poverty.
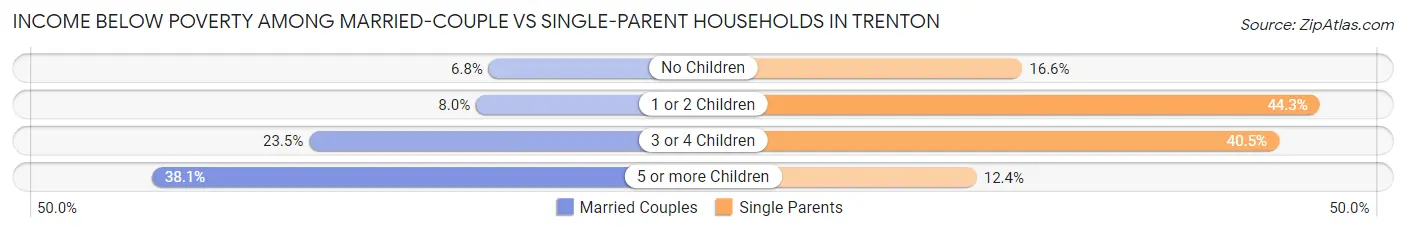
| Children | Married-Couple Families | Single-Parent Households |
| No Children | 304 (6.8%) | 663 (16.6%) |
| 1 or 2 Children | 212 (8.0%) | 1,907 (44.3%) |
| 3 or 4 Children | 240 (23.5%) | 520 (40.5%) |
| 5 or more Children | 74 (38.1%) | 15 (12.4%) |
| Total | 830 (9.9%) | 3,105 (32.0%) |
Race in Trenton
The most populous races in Trenton are Black / African American (40,971 | 45.5%), Hispanic or Latino (34,866 | 38.7%), and White / Caucasian (22,216 | 24.7%).
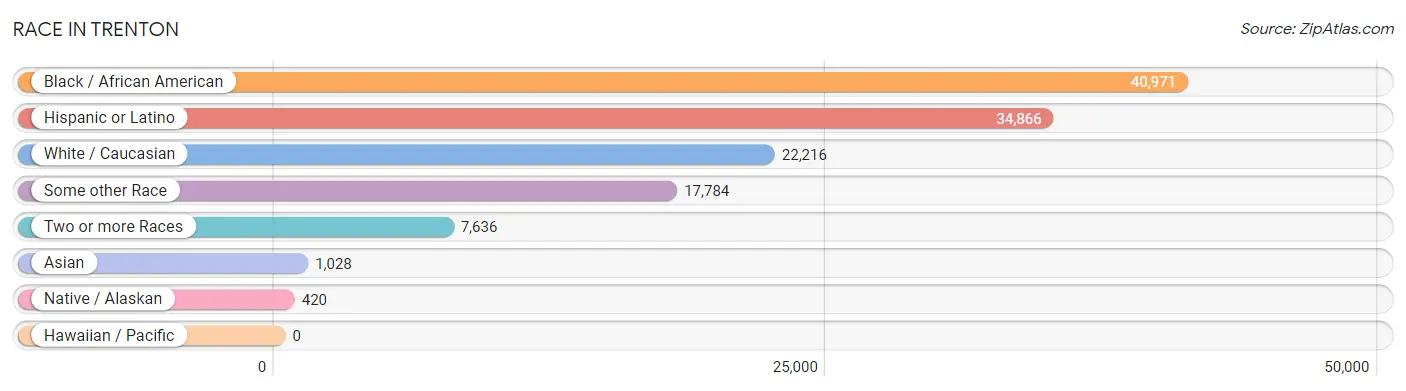
| Race | # Population | % Population |
| Asian | 1,028 | 1.1% |
| Black / African American | 40,971 | 45.5% |
| Hawaiian / Pacific | 0 | 0.0% |
| Hispanic or Latino | 34,866 | 38.7% |
| Native / Alaskan | 420 | 0.5% |
| White / Caucasian | 22,216 | 24.7% |
| Two or more Races | 7,636 | 8.5% |
| Some other Race | 17,784 | 19.8% |
| Total | 90,055 | 100.0% |
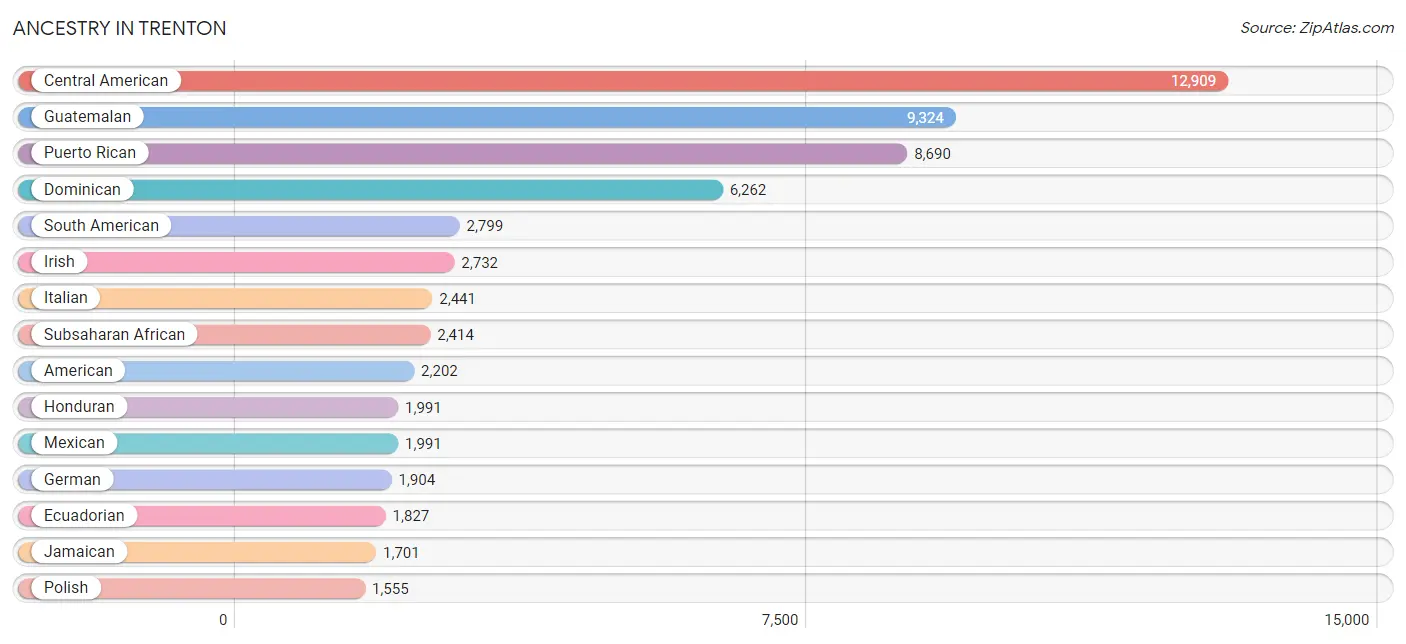
Ancestry in Trenton
The most populous ancestries reported in Trenton are Central American (12,909 | 14.3%), Guatemalan (9,324 | 10.3%), Puerto Rican (8,690 | 9.7%), Dominican (6,262 | 7.0%), and South American (2,799 | 3.1%), together accounting for 44.4% of all Trenton residents.
| Ancestry | # Population | % Population |
| African | 1,093 | 1.2% |
| Alaska Native | 16 | 0.0% |
| American | 2,202 | 2.5% |
| Arab | 349 | 0.4% |
| Argentinean | 17 | 0.0% |
| Belgian | 23 | 0.0% |
| Belizean | 146 | 0.2% |
| Bhutanese | 264 | 0.3% |
| Brazilian | 148 | 0.2% |
| British | 36 | 0.0% |
| British West Indian | 67 | 0.1% |
| Bulgarian | 9 | 0.0% |
| Burmese | 81 | 0.1% |
| Canadian | 73 | 0.1% |
| Celtic | 9 | 0.0% |
| Central American | 12,909 | 14.3% |
| Central American Indian | 316 | 0.4% |
| Cherokee | 62 | 0.1% |
| Chilean | 78 | 0.1% |
| Colombian | 609 | 0.7% |
| Costa Rican | 891 | 1.0% |
| Cuban | 265 | 0.3% |
| Czech | 70 | 0.1% |
| Delaware | 5 | 0.0% |
| Dominican | 6,262 | 7.0% |
| Dutch | 55 | 0.1% |
| Eastern European | 20 | 0.0% |
| Ecuadorian | 1,827 | 2.0% |
| English | 1,044 | 1.2% |
| Estonian | 3 | 0.0% |
| Ethiopian | 82 | 0.1% |
| European | 294 | 0.3% |
| Filipino | 26 | 0.0% |
| French | 206 | 0.2% |
| French Canadian | 7 | 0.0% |
| German | 1,904 | 2.1% |
| Ghanaian | 37 | 0.0% |
| Greek | 168 | 0.2% |
| Guatemalan | 9,324 | 10.3% |
| Guyanese | 310 | 0.3% |
| Haitian | 1,087 | 1.2% |
| Honduran | 1,991 | 2.2% |
| Hungarian | 400 | 0.4% |
| Indian (Asian) | 343 | 0.4% |
| Indonesian | 290 | 0.3% |
| Irish | 2,732 | 3.0% |
| Iroquois | 43 | 0.1% |
| Italian | 2,441 | 2.7% |
| Jamaican | 1,701 | 1.9% |
| Kenyan | 132 | 0.2% |
| Korean | 272 | 0.3% |
| Laotian | 10 | 0.0% |
| Liberian | 726 | 0.8% |
| Lithuanian | 108 | 0.1% |
| Macedonian | 57 | 0.1% |
| Mexican | 1,991 | 2.2% |
| Mexican American Indian | 12 | 0.0% |
| Moroccan | 231 | 0.3% |
| Native Hawaiian | 133 | 0.2% |
| Nicaraguan | 78 | 0.1% |
| Nigerian | 257 | 0.3% |
| Northern European | 13 | 0.0% |
| Norwegian | 4 | 0.0% |
| Pakistani | 14 | 0.0% |
| Panamanian | 124 | 0.1% |
| Peruvian | 229 | 0.3% |
| Polish | 1,555 | 1.7% |
| Portuguese | 66 | 0.1% |
| Puerto Rican | 8,690 | 9.7% |
| Russian | 262 | 0.3% |
| Salvadoran | 370 | 0.4% |
| Scandinavian | 91 | 0.1% |
| Scotch-Irish | 106 | 0.1% |
| Scottish | 109 | 0.1% |
| Serbian | 71 | 0.1% |
| Slavic | 11 | 0.0% |
| Slovak | 37 | 0.0% |
| South American | 2,799 | 3.1% |
| South American Indian | 24 | 0.0% |
| Spaniard | 156 | 0.2% |
| Spanish | 86 | 0.1% |
| Subsaharan African | 2,414 | 2.7% |
| Sudanese | 55 | 0.1% |
| Swedish | 30 | 0.0% |
| Thai | 360 | 0.4% |
| Trinidadian and Tobagonian | 91 | 0.1% |
| Turkish | 60 | 0.1% |
| U.S. Virgin Islander | 36 | 0.0% |
| Ukrainian | 302 | 0.3% |
| Venezuelan | 38 | 0.0% |
| Welsh | 168 | 0.2% |
| West Indian | 108 | 0.1% | View All 92 Rows |
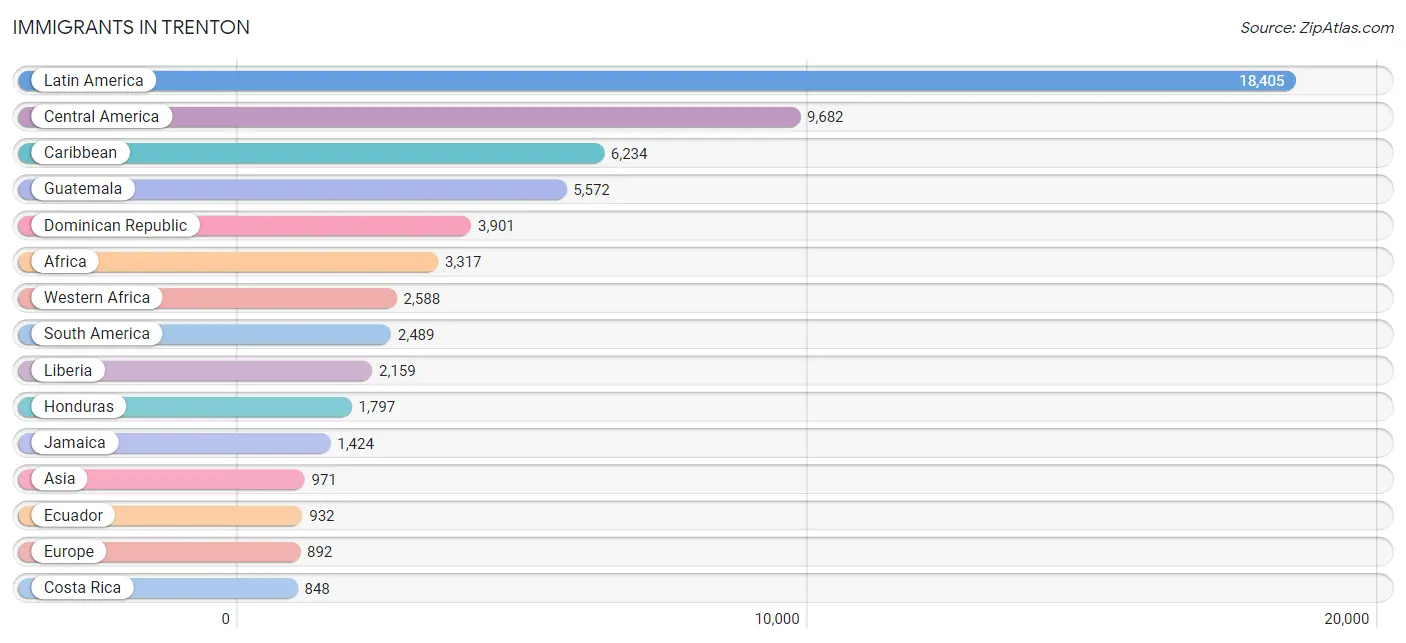
Immigrants in Trenton
The most numerous immigrant groups reported in Trenton came from Latin America (18,405 | 20.4%), Central America (9,682 | 10.7%), Caribbean (6,234 | 6.9%), Guatemala (5,572 | 6.2%), and Dominican Republic (3,901 | 4.3%), together accounting for 48.6% of all Trenton residents.
| Immigration Origin | # Population | % Population |
| Africa | 3,317 | 3.7% |
| Argentina | 17 | 0.0% |
| Asia | 971 | 1.1% |
| Belarus | 14 | 0.0% |
| Belize | 39 | 0.0% |
| Brazil | 137 | 0.2% |
| Bulgaria | 9 | 0.0% |
| Canada | 15 | 0.0% |
| Caribbean | 6,234 | 6.9% |
| Central America | 9,682 | 10.7% |
| Chile | 78 | 0.1% |
| China | 240 | 0.3% |
| Colombia | 837 | 0.9% |
| Costa Rica | 848 | 0.9% |
| Cuba | 81 | 0.1% |
| Czechoslovakia | 19 | 0.0% |
| Dominican Republic | 3,901 | 4.3% |
| Eastern Africa | 522 | 0.6% |
| Eastern Asia | 298 | 0.3% |
| Eastern Europe | 578 | 0.6% |
| Ecuador | 932 | 1.0% |
| Egypt | 16 | 0.0% |
| El Salvador | 389 | 0.4% |
| England | 7 | 0.0% |
| Eritrea | 136 | 0.2% |
| Europe | 892 | 1.0% |
| Germany | 159 | 0.2% |
| Ghana | 135 | 0.2% |
| Guatemala | 5,572 | 6.2% |
| Guyana | 204 | 0.2% |
| Haiti | 569 | 0.6% |
| Honduras | 1,797 | 2.0% |
| Hungary | 9 | 0.0% |
| India | 88 | 0.1% |
| Indonesia | 10 | 0.0% |
| Israel | 77 | 0.1% |
| Italy | 26 | 0.0% |
| Jamaica | 1,424 | 1.6% |
| Kenya | 215 | 0.2% |
| Korea | 58 | 0.1% |
| Latin America | 18,405 | 20.4% |
| Liberia | 2,159 | 2.4% |
| Mexico | 756 | 0.8% |
| Netherlands | 8 | 0.0% |
| Nicaragua | 78 | 0.1% |
| Nigeria | 186 | 0.2% |
| Northern Africa | 162 | 0.2% |
| Northern Europe | 55 | 0.1% |
| Panama | 72 | 0.1% |
| Peru | 259 | 0.3% |
| Philippines | 148 | 0.2% |
| Poland | 428 | 0.5% |
| Portugal | 29 | 0.0% |
| Russia | 41 | 0.1% |
| South America | 2,489 | 2.8% |
| South Central Asia | 88 | 0.1% |
| South Eastern Asia | 448 | 0.5% |
| Southern Europe | 92 | 0.1% |
| Spain | 37 | 0.0% |
| Sudan | 146 | 0.2% |
| Trinidad and Tobago | 192 | 0.2% |
| Turkey | 60 | 0.1% |
| Ukraine | 58 | 0.1% |
| Venezuela | 25 | 0.0% |
| Western Africa | 2,588 | 2.9% |
| Western Asia | 137 | 0.2% |
| Western Europe | 167 | 0.2% | View All 67 Rows |
Sex and Age in Trenton
Sex and Age in Trenton
The most populous age groups in Trenton are 5 to 9 Years (3,659 | 8.5%) for men and Under 5 Years (4,076 | 8.7%) for women.
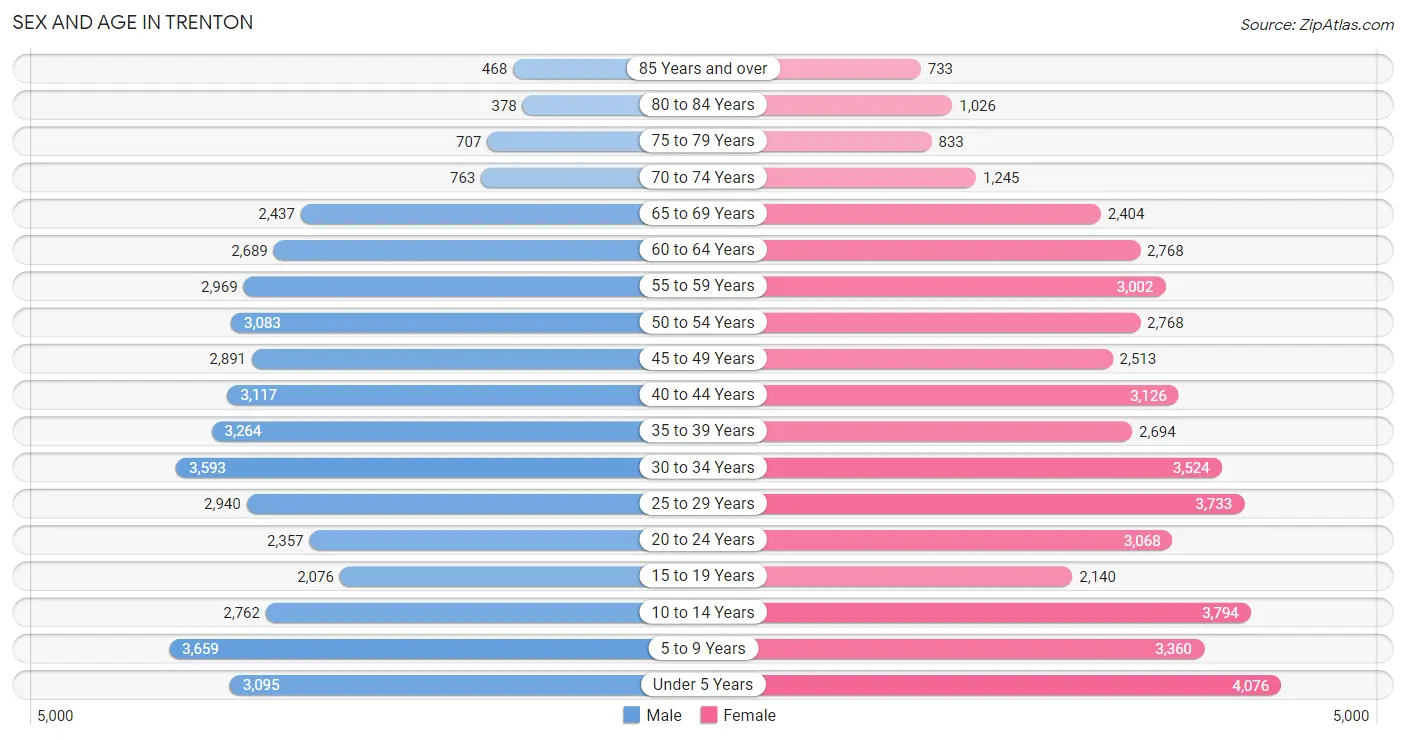
| Age Bracket | Male | Female |
| Under 5 Years | 3,095 (7.2%) | 4,076 (8.7%) |
| 5 to 9 Years | 3,659 (8.5%) | 3,360 (7.2%) |
| 10 to 14 Years | 2,762 (6.4%) | 3,794 (8.1%) |
| 15 to 19 Years | 2,076 (4.8%) | 2,140 (4.6%) |
| 20 to 24 Years | 2,357 (5.4%) | 3,068 (6.6%) |
| 25 to 29 Years | 2,940 (6.8%) | 3,733 (8.0%) |
| 30 to 34 Years | 3,593 (8.3%) | 3,524 (7.5%) |
| 35 to 39 Years | 3,264 (7.5%) | 2,694 (5.8%) |
| 40 to 44 Years | 3,117 (7.2%) | 3,126 (6.7%) |
| 45 to 49 Years | 2,891 (6.7%) | 2,513 (5.4%) |
| 50 to 54 Years | 3,083 (7.1%) | 2,768 (5.9%) |
| 55 to 59 Years | 2,969 (6.9%) | 3,002 (6.4%) |
| 60 to 64 Years | 2,689 (6.2%) | 2,768 (5.9%) |
| 65 to 69 Years | 2,437 (5.6%) | 2,404 (5.1%) |
| 70 to 74 Years | 763 (1.8%) | 1,245 (2.7%) |
| 75 to 79 Years | 707 (1.6%) | 833 (1.8%) |
| 80 to 84 Years | 378 (0.9%) | 1,026 (2.2%) |
| 85 Years and over | 468 (1.1%) | 733 (1.6%) |
| Total | 43,248 (100.0%) | 46,807 (100.0%) |
Families and Households in Trenton
Median Family Size in Trenton
The median family size in Trenton is 3.65 persons per family, with married-couple families (8,364 | 46.3%) accounting for the largest median family size of 3.94 persons per family. On the other hand, single male/father families (2,239 | 12.4%) represent the smallest median family size with 3.11 persons per family.
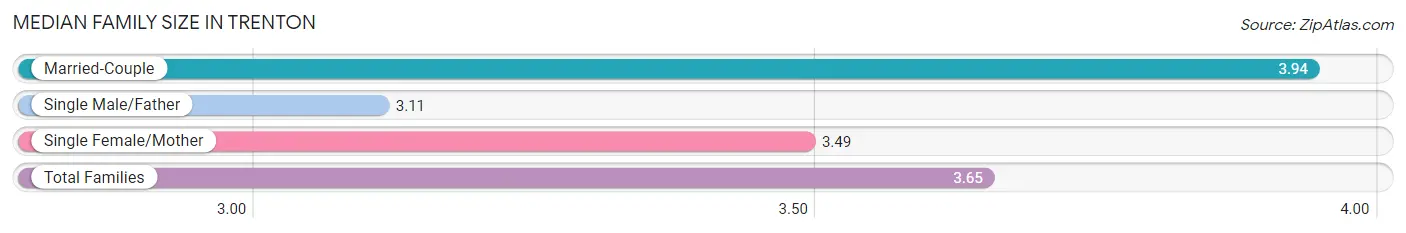
| Family Type | # Families | Family Size |
| Married-Couple | 8,364 (46.3%) | 3.94 |
| Single Male/Father | 2,239 (12.4%) | 3.11 |
| Single Female/Mother | 7,452 (41.3%) | 3.49 |
| Total Families | 18,055 (100.0%) | 3.65 |
Median Household Size in Trenton
The median household size in Trenton is 2.70 persons per household, with married-couple households (8,364 | 26.0%) accounting for the largest median household size of 4.04 persons per household. non-family households (14,110 | 43.9%) represent the smallest median household size with 1.24 persons per household.
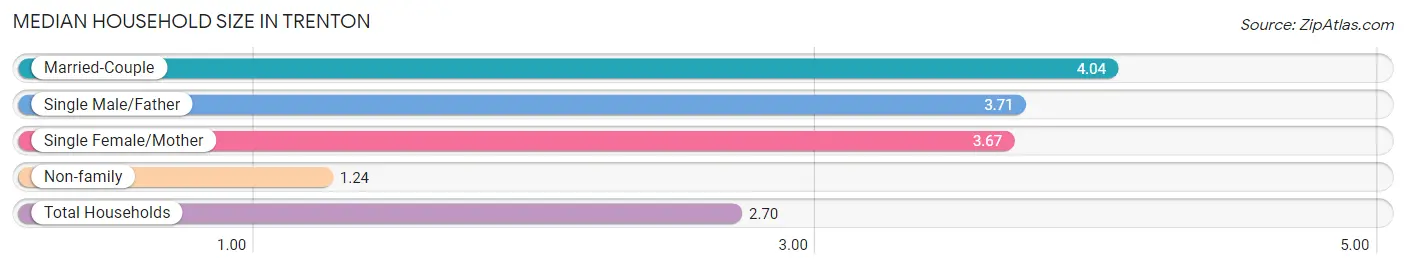
| Household Type | # Households | Household Size |
| Married-Couple | 8,364 (26.0%) | 4.04 |
| Single Male/Father | 2,239 (7.0%) | 3.71 |
| Single Female/Mother | 7,452 (23.2%) | 3.67 |
| Non-family | 14,110 (43.9%) | 1.24 |
| Total Households | 32,165 (100.0%) | 2.70 |
Household Size by Marriage Status in Trenton
Out of a total of 32,165 households in Trenton, 18,055 (56.1%) are family households, while 14,110 (43.9%) are nonfamily households. The most numerous type of family households are 2-person households, comprising 6,111, and the most common type of nonfamily households are 1-person households, comprising 11,930.
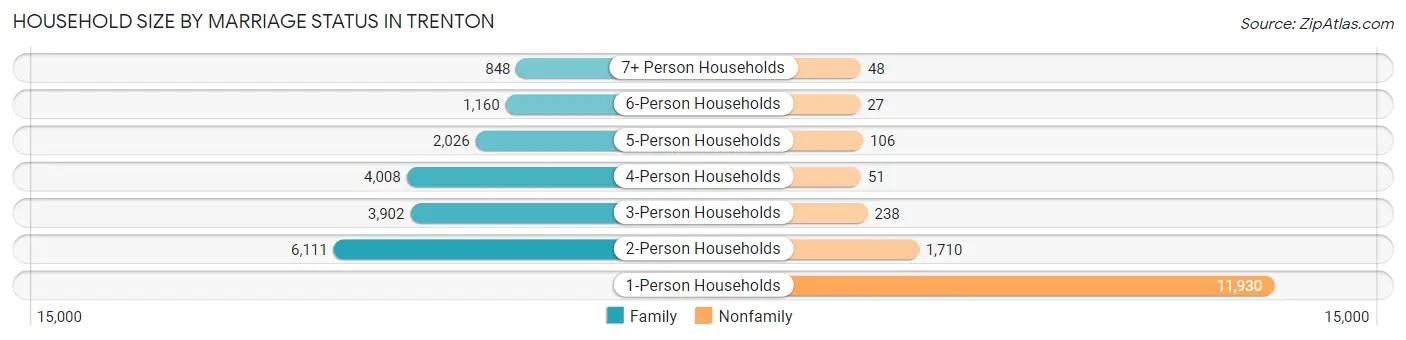
| Household Size | Family Households | Nonfamily Households |
| 1-Person Households | - | 11,930 (37.1%) |
| 2-Person Households | 6,111 (19.0%) | 1,710 (5.3%) |
| 3-Person Households | 3,902 (12.1%) | 238 (0.7%) |
| 4-Person Households | 4,008 (12.5%) | 51 (0.2%) |
| 5-Person Households | 2,026 (6.3%) | 106 (0.3%) |
| 6-Person Households | 1,160 (3.6%) | 27 (0.1%) |
| 7+ Person Households | 848 (2.6%) | 48 (0.2%) |
| Total | 18,055 (56.1%) | 14,110 (43.9%) |
Female Fertility in Trenton
Fertility by Age in Trenton
Average fertility rate in Trenton is 64.0 births per 1,000 women. Women in the age bracket of 20 to 34 years have the highest fertility rate with 102.0 births per 1,000 women. Women in the age bracket of 20 to 34 years acount for 76.6% of all women with births.
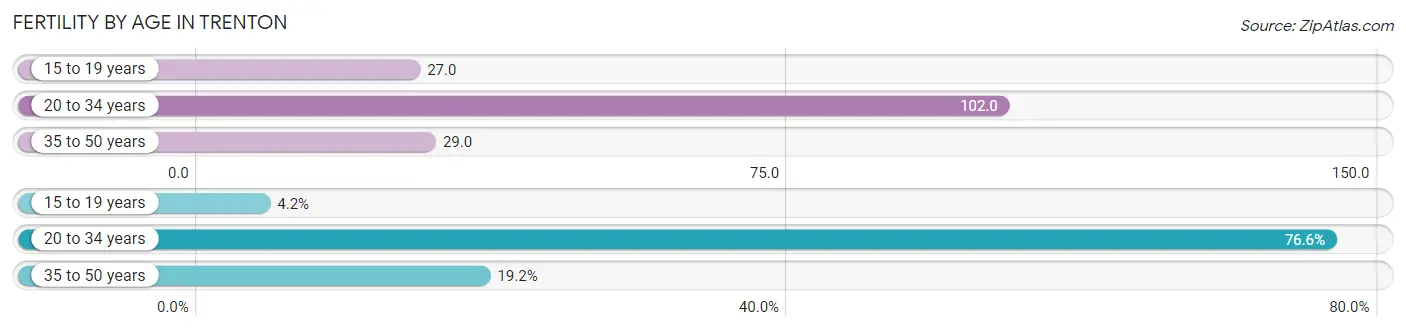
| Age Bracket | Women with Births | Births / 1,000 Women |
| 15 to 19 years | 58 (4.2%) | 27.0 |
| 20 to 34 years | 1,051 (76.6%) | 102.0 |
| 35 to 50 years | 263 (19.2%) | 29.0 |
| Total | 1,372 (100.0%) | 64.0 |
Fertility by Age by Marriage Status in Trenton
46.5% of women with births (1,372) in Trenton are married. The highest percentage of unmarried women with births falls into 15 to 19 years age bracket with 100.0% of them unmarried at the time of birth, while the lowest percentage of unmarried women with births belong to 35 to 50 years age bracket with 43.3% of them unmarried.
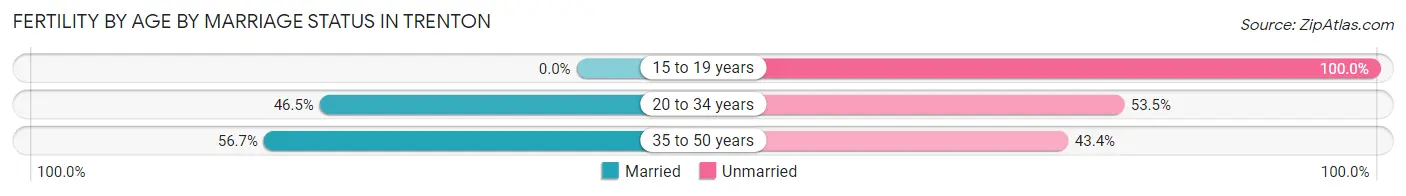
| Age Bracket | Married | Unmarried |
| 15 to 19 years | 0 (0.0%) | 58 (100.0%) |
| 20 to 34 years | 489 (46.5%) | 562 (53.5%) |
| 35 to 50 years | 149 (56.7%) | 114 (43.3%) |
| Total | 638 (46.5%) | 734 (53.5%) |
Fertility by Education in Trenton
Average fertility rate in Trenton is 64.0 births per 1,000 women. Women with the education attainment of high school diploma have the highest fertility rate of 80.0 births per 1,000 women, while women with the education attainment of bachelor's degree have the lowest fertility at 14.0 births per 1,000 women. Women with the education attainment of high school diploma represent 42.6% of all women with births.
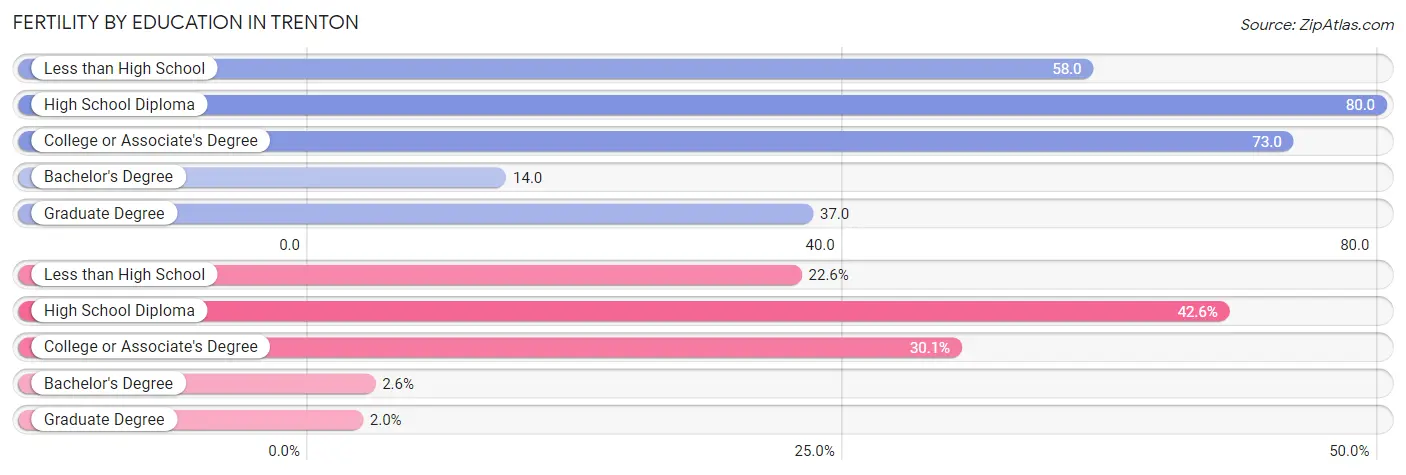
| Educational Attainment | Women with Births | Births / 1,000 Women |
| Less than High School | 310 (22.6%) | 58.0 |
| High School Diploma | 585 (42.6%) | 80.0 |
| College or Associate's Degree | 413 (30.1%) | 73.0 |
| Bachelor's Degree | 36 (2.6%) | 14.0 |
| Graduate Degree | 28 (2.0%) | 37.0 |
| Total | 1,372 (100.0%) | 64.0 |
Fertility by Education by Marriage Status in Trenton
53.5% of women with births in Trenton are unmarried. Women with the educational attainment of bachelor's degree are most likely to be married with 100.0% of them married at childbirth, while women with the educational attainment of college or associate's degree are least likely to be married with 70.7% of them unmarried at childbirth.
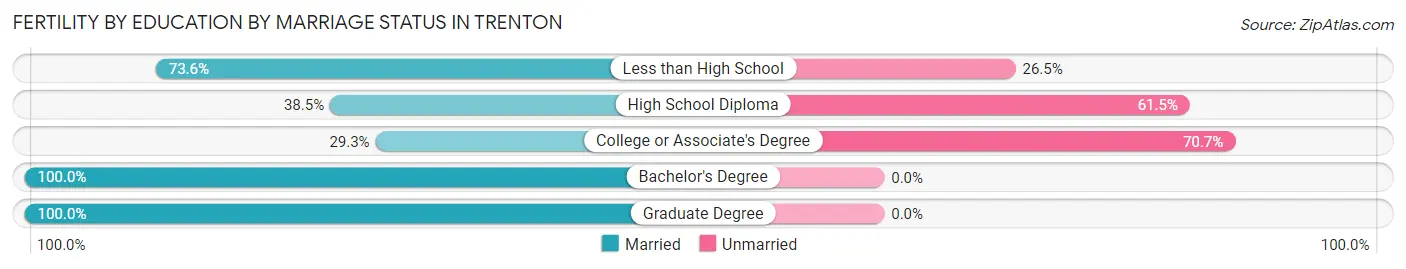
| Educational Attainment | Married | Unmarried |
| Less than High School | 228 (73.6%) | 82 (26.5%) |
| High School Diploma | 225 (38.5%) | 360 (61.5%) |
| College or Associate's Degree | 121 (29.3%) | 292 (70.7%) |
| Bachelor's Degree | 36 (100.0%) | 0 (0.0%) |
| Graduate Degree | 28 (100.0%) | 0 (0.0%) |
| Total | 638 (46.5%) | 734 (53.5%) |
Employment Characteristics in Trenton
Employment by Class of Employer in Trenton
Among the 35,035 employed individuals in Trenton, private company employees (23,789 | 67.9%), state government employees (3,177 | 9.1%), and local government employees (2,782 | 7.9%) make up the most common classes of employment.
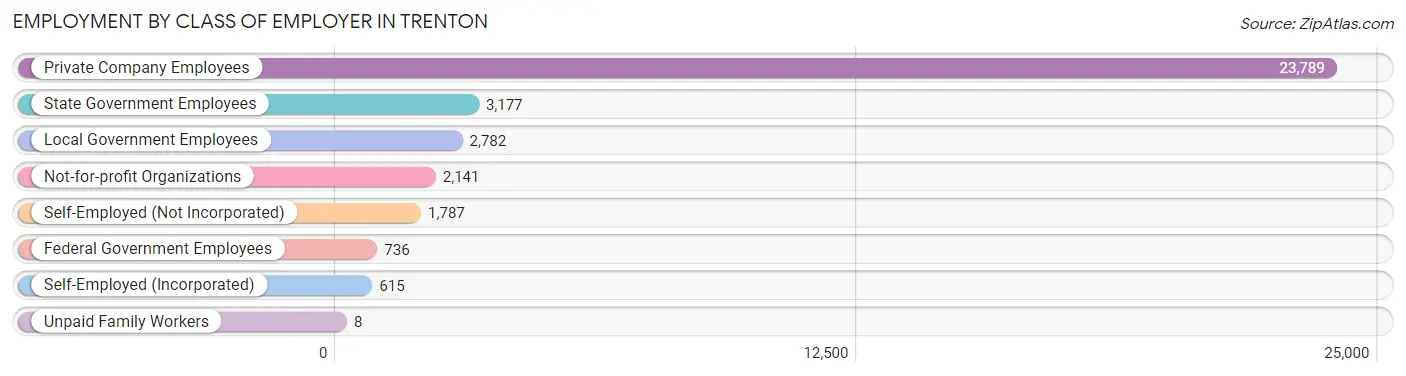
| Employer Class | # Employees | % Employees |
| Private Company Employees | 23,789 | 67.9% |
| Self-Employed (Incorporated) | 615 | 1.8% |
| Self-Employed (Not Incorporated) | 1,787 | 5.1% |
| Not-for-profit Organizations | 2,141 | 6.1% |
| Local Government Employees | 2,782 | 7.9% |
| State Government Employees | 3,177 | 9.1% |
| Federal Government Employees | 736 | 2.1% |
| Unpaid Family Workers | 8 | 0.0% |
| Total | 35,035 | 100.0% |
Employment Status by Age in Trenton
According to the labor force statistics for Trenton, out of the total population over 16 years of age (68,438), 59.1% or 40,447 individuals are in the labor force, with 10.2% or 4,126 of them unemployed. The age group with the highest labor force participation rate is 25 to 29 years, with 75.1% or 5,011 individuals in the labor force. Within the labor force, the 20 to 24 years age range has the highest percentage of unemployed individuals, with 23.2% or 827 of them being unemployed.
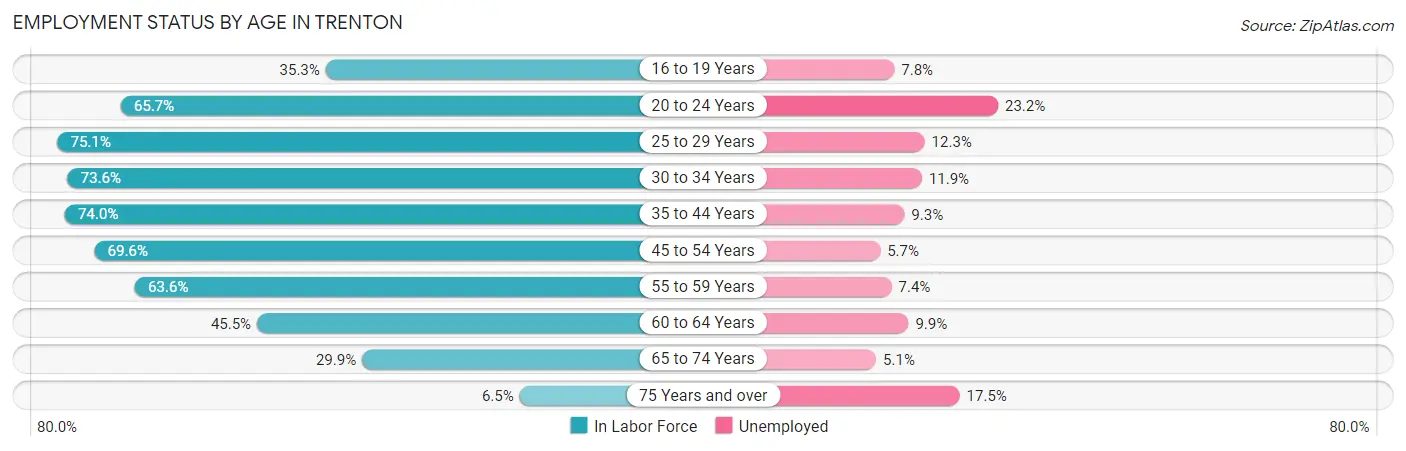
| Age Bracket | In Labor Force | Unemployed |
| 16 to 19 Years | 1,181 (35.3%) | 92 (7.8%) |
| 20 to 24 Years | 3,564 (65.7%) | 827 (23.2%) |
| 25 to 29 Years | 5,011 (75.1%) | 616 (12.3%) |
| 30 to 34 Years | 5,238 (73.6%) | 623 (11.9%) |
| 35 to 44 Years | 9,029 (74.0%) | 840 (9.3%) |
| 45 to 54 Years | 7,833 (69.6%) | 446 (5.7%) |
| 55 to 59 Years | 3,798 (63.6%) | 281 (7.4%) |
| 60 to 64 Years | 2,483 (45.5%) | 246 (9.9%) |
| 65 to 74 Years | 2,048 (29.9%) | 104 (5.1%) |
| 75 Years and over | 269 (6.5%) | 47 (17.5%) |
| Total | 40,447 (59.1%) | 4,126 (10.2%) |
Employment Status by Educational Attainment in Trenton
According to labor force statistics for Trenton, 68.6% of individuals (33,390) out of the total population between 25 and 64 years of age (48,674) are in the labor force, with 9.1% or 3,038 of them being unemployed. The group with the highest labor force participation rate are those with the educational attainment of bachelor's degree or higher, with 85.8% or 6,431 individuals in the labor force. Within the labor force, individuals with college / associate degree education have the highest percentage of unemployment, with 11.1% or 899 of them being unemployed.
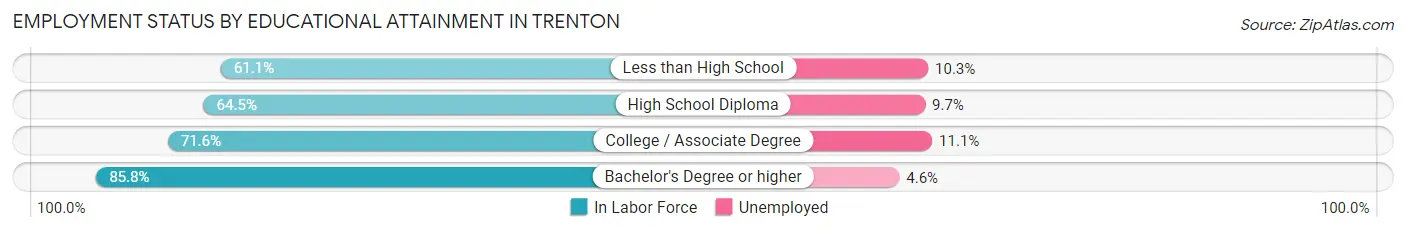
| Educational Attainment | In Labor Force | Unemployed |
| Less than High School | 6,983 (61.1%) | 1,177 (10.3%) |
| High School Diploma | 11,890 (64.5%) | 1,788 (9.7%) |
| College / Associate Degree | 8,102 (71.6%) | 1,256 (11.1%) |
| Bachelor's Degree or higher | 6,431 (85.8%) | 345 (4.6%) |
| Total | 33,390 (68.6%) | 4,429 (9.1%) |
Employment Occupations by Sex in Trenton
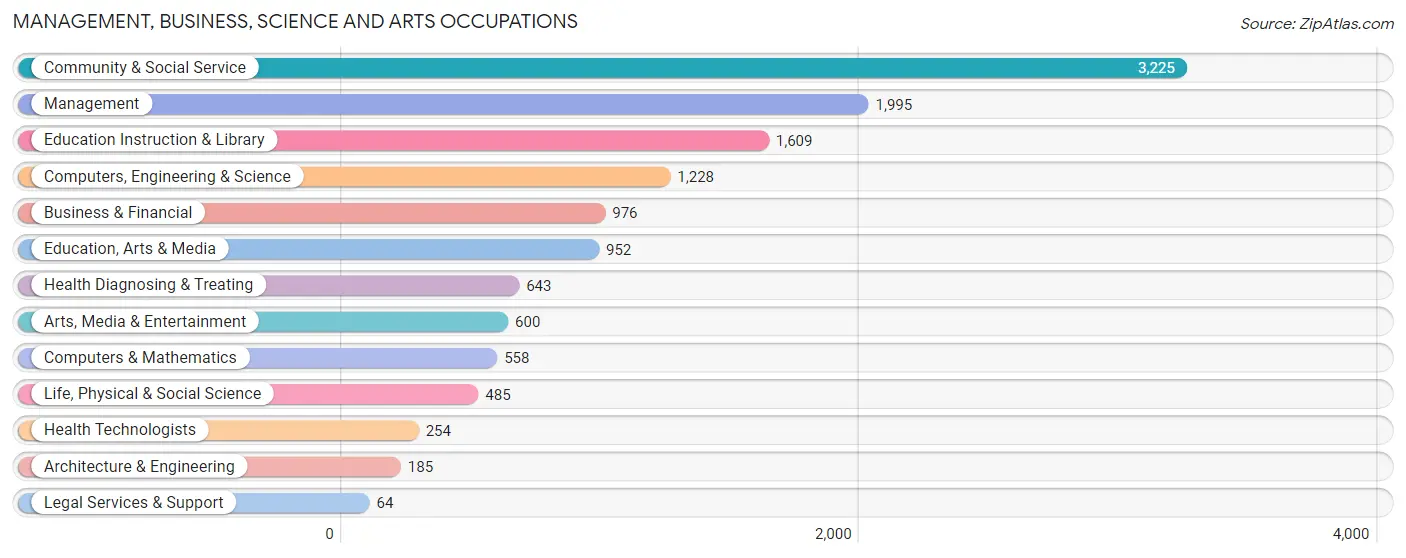
Management, Business, Science and Arts Occupations
The most common Management, Business, Science and Arts occupations in Trenton are Community & Social Service (3,225 | 8.9%), Management (1,995 | 5.5%), Education Instruction & Library (1,609 | 4.4%), Computers, Engineering & Science (1,228 | 3.4%), and Business & Financial (976 | 2.7%).
Management, Business, Science and Arts Occupations by Sex
Within the Management, Business, Science and Arts occupations in Trenton, the most male-oriented occupations are Architecture & Engineering (100.0%), Legal Services & Support (78.1%), and Management (55.1%), while the most female-oriented occupations are Life, Physical & Social Science (90.7%), Education Instruction & Library (71.1%), and Health Diagnosing & Treating (70.1%).
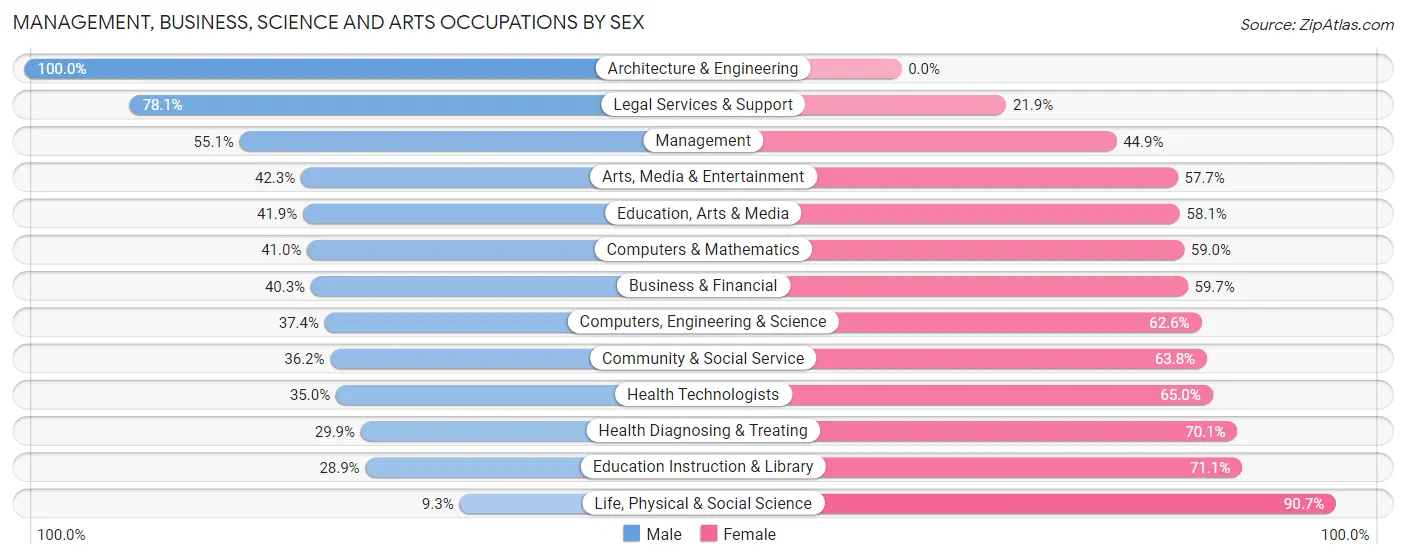
| Occupation | Male | Female |
| Management | 1,100 (55.1%) | 895 (44.9%) |
| Business & Financial | 393 (40.3%) | 583 (59.7%) |
| Computers, Engineering & Science | 459 (37.4%) | 769 (62.6%) |
| Computers & Mathematics | 229 (41.0%) | 329 (59.0%) |
| Architecture & Engineering | 185 (100.0%) | 0 (0.0%) |
| Life, Physical & Social Science | 45 (9.3%) | 440 (90.7%) |
| Community & Social Service | 1,168 (36.2%) | 2,057 (63.8%) |
| Education, Arts & Media | 399 (41.9%) | 553 (58.1%) |
| Legal Services & Support | 50 (78.1%) | 14 (21.9%) |
| Education Instruction & Library | 465 (28.9%) | 1,144 (71.1%) |
| Arts, Media & Entertainment | 254 (42.3%) | 346 (57.7%) |
| Health Diagnosing & Treating | 192 (29.9%) | 451 (70.1%) |
| Health Technologists | 89 (35.0%) | 165 (65.0%) |
| Total (Category) | 3,312 (41.1%) | 4,755 (58.9%) |
| Total (Overall) | 18,916 (52.1%) | 17,411 (47.9%) |
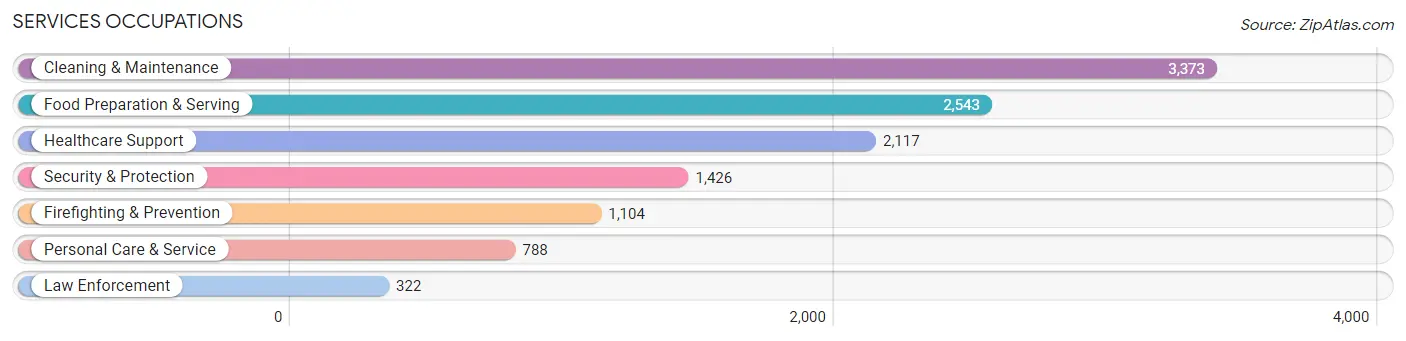
Services Occupations
The most common Services occupations in Trenton are Cleaning & Maintenance (3,373 | 9.3%), Food Preparation & Serving (2,543 | 7.0%), Healthcare Support (2,117 | 5.8%), Security & Protection (1,426 | 3.9%), and Firefighting & Prevention (1,104 | 3.0%).
Services Occupations by Sex
Within the Services occupations in Trenton, the most male-oriented occupations are Law Enforcement (89.7%), Food Preparation & Serving (70.9%), and Cleaning & Maintenance (53.5%), while the most female-oriented occupations are Personal Care & Service (82.9%), Healthcare Support (74.9%), and Firefighting & Prevention (61.4%).
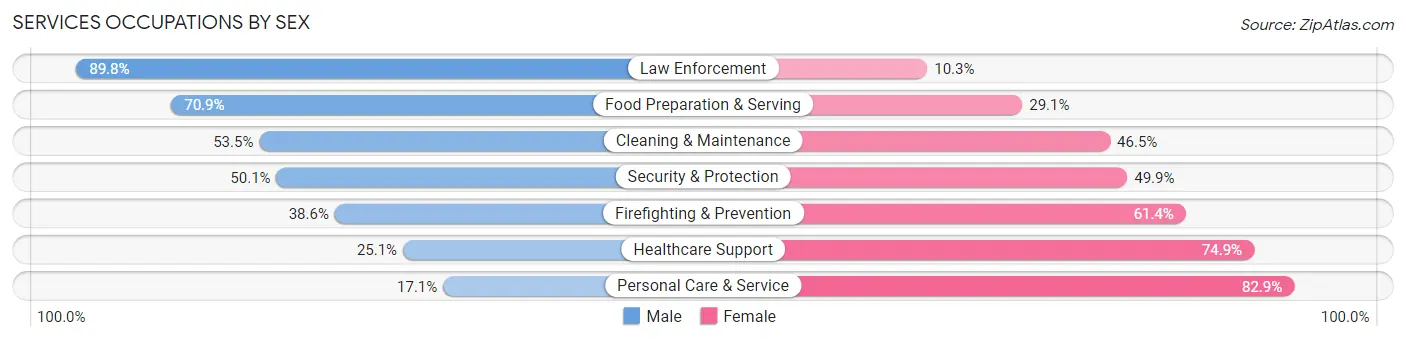
| Occupation | Male | Female |
| Healthcare Support | 531 (25.1%) | 1,586 (74.9%) |
| Security & Protection | 715 (50.1%) | 711 (49.9%) |
| Firefighting & Prevention | 426 (38.6%) | 678 (61.4%) |
| Law Enforcement | 289 (89.7%) | 33 (10.2%) |
| Food Preparation & Serving | 1,804 (70.9%) | 739 (29.1%) |
| Cleaning & Maintenance | 1,806 (53.5%) | 1,567 (46.5%) |
| Personal Care & Service | 135 (17.1%) | 653 (82.9%) |
| Total (Category) | 4,991 (48.7%) | 5,256 (51.3%) |
| Total (Overall) | 18,916 (52.1%) | 17,411 (47.9%) |
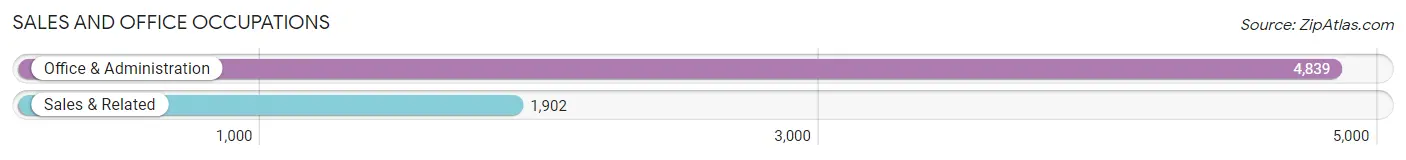
Sales and Office Occupations
The most common Sales and Office occupations in Trenton are Office & Administration (4,839 | 13.3%), and Sales & Related (1,902 | 5.2%).
Sales and Office Occupations by Sex
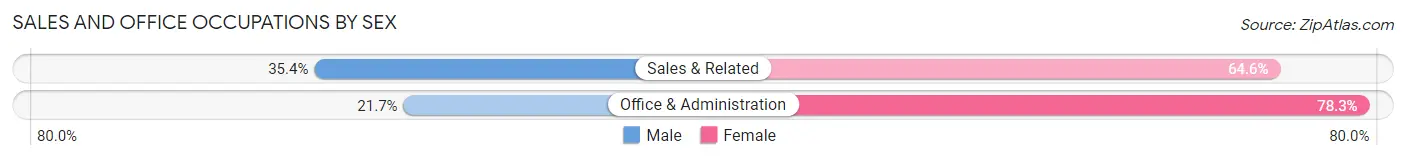
| Occupation | Male | Female |
| Sales & Related | 674 (35.4%) | 1,228 (64.6%) |
| Office & Administration | 1,051 (21.7%) | 3,788 (78.3%) |
| Total (Category) | 1,725 (25.6%) | 5,016 (74.4%) |
| Total (Overall) | 18,916 (52.1%) | 17,411 (47.9%) |
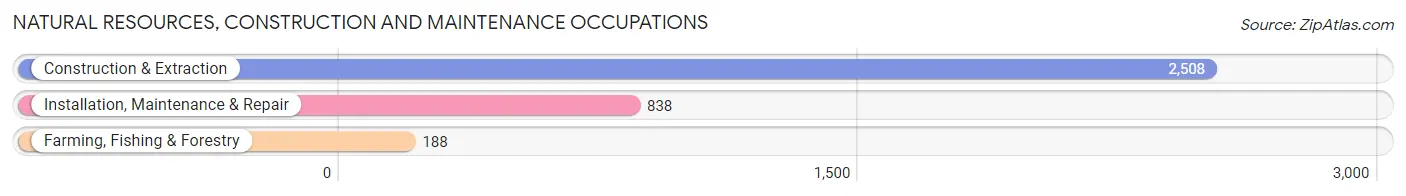
Natural Resources, Construction and Maintenance Occupations
The most common Natural Resources, Construction and Maintenance occupations in Trenton are Construction & Extraction (2,508 | 6.9%), Installation, Maintenance & Repair (838 | 2.3%), and Farming, Fishing & Forestry (188 | 0.5%).
Natural Resources, Construction and Maintenance Occupations by Sex
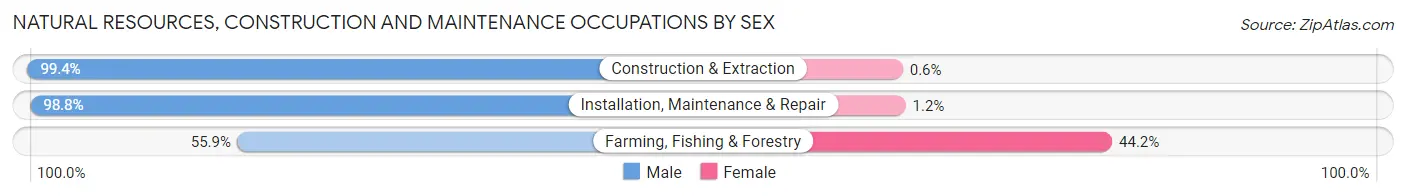
| Occupation | Male | Female |
| Farming, Fishing & Forestry | 105 (55.8%) | 83 (44.2%) |
| Construction & Extraction | 2,493 (99.4%) | 15 (0.6%) |
| Installation, Maintenance & Repair | 828 (98.8%) | 10 (1.2%) |
| Total (Category) | 3,426 (96.9%) | 108 (3.1%) |
| Total (Overall) | 18,916 (52.1%) | 17,411 (47.9%) |
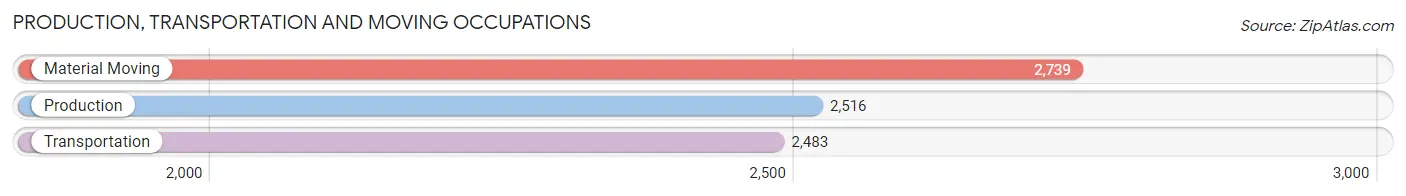
Production, Transportation and Moving Occupations
The most common Production, Transportation and Moving occupations in Trenton are Material Moving (2,739 | 7.5%), Production (2,516 | 6.9%), and Transportation (2,483 | 6.8%).
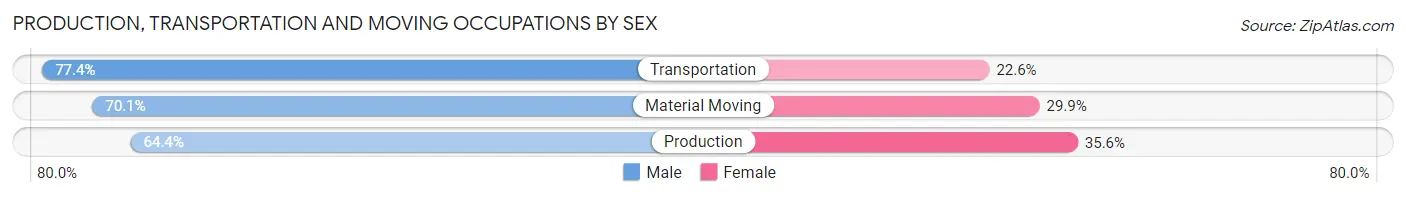
Production, Transportation and Moving Occupations by Sex
| Occupation | Male | Female |
| Production | 1,621 (64.4%) | 895 (35.6%) |
| Transportation | 1,922 (77.4%) | 561 (22.6%) |
| Material Moving | 1,919 (70.1%) | 820 (29.9%) |
| Total (Category) | 5,462 (70.6%) | 2,276 (29.4%) |
| Total (Overall) | 18,916 (52.1%) | 17,411 (47.9%) |
Employment Industries by Sex in Trenton
Employment Industries in Trenton
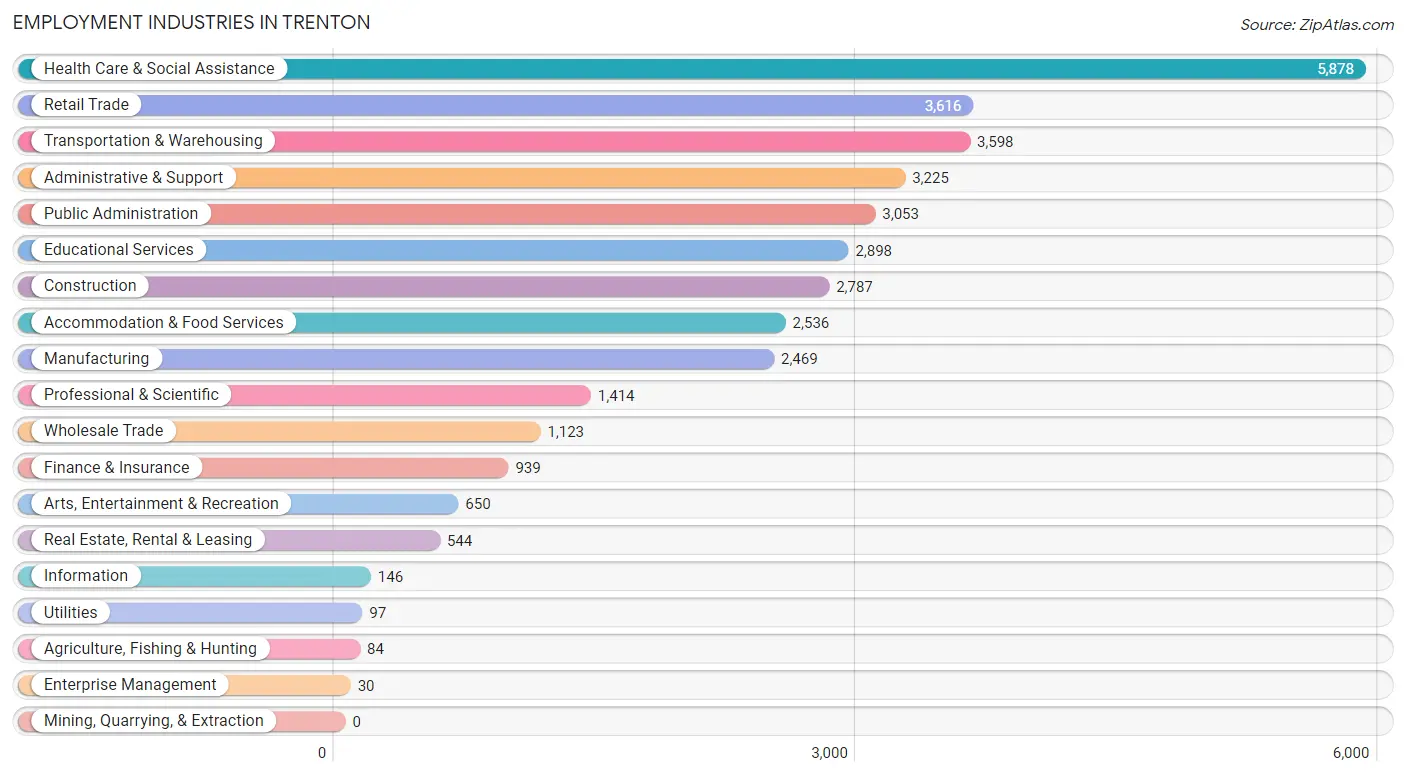
The major employment industries in Trenton include Health Care & Social Assistance (5,878 | 16.2%), Retail Trade (3,616 | 10.0%), Transportation & Warehousing (3,598 | 9.9%), Administrative & Support (3,225 | 8.9%), and Public Administration (3,053 | 8.4%).
Employment Industries by Sex in Trenton
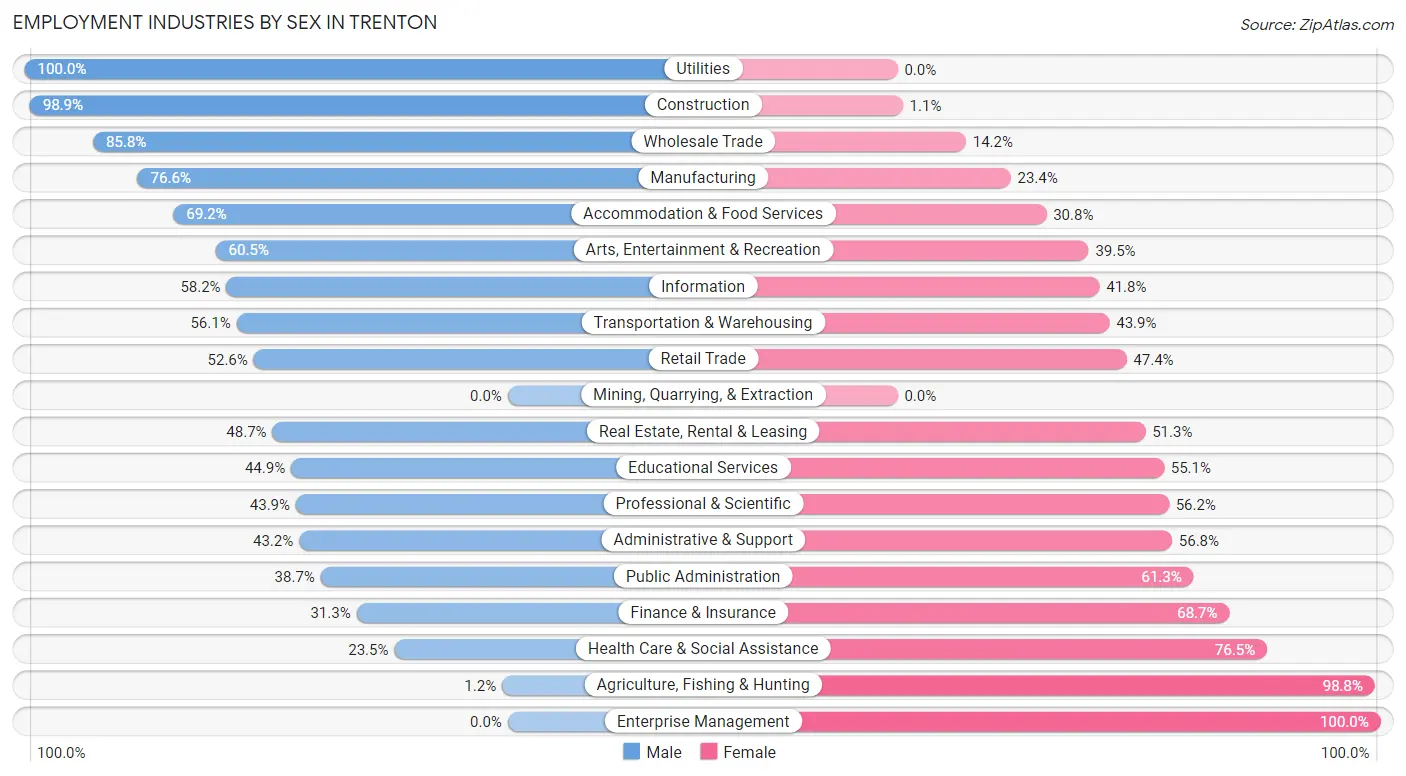
The Trenton industries that see more men than women are Utilities (100.0%), Construction (98.9%), and Wholesale Trade (85.8%), whereas the industries that tend to have a higher number of women are Enterprise Management (100.0%), Agriculture, Fishing & Hunting (98.8%), and Health Care & Social Assistance (76.5%).
| Industry | Male | Female |
| Agriculture, Fishing & Hunting | 1 (1.2%) | 83 (98.8%) |
| Mining, Quarrying, & Extraction | 0 (0.0%) | 0 (0.0%) |
| Construction | 2,757 (98.9%) | 30 (1.1%) |
| Manufacturing | 1,891 (76.6%) | 578 (23.4%) |
| Wholesale Trade | 964 (85.8%) | 159 (14.2%) |
| Retail Trade | 1,902 (52.6%) | 1,714 (47.4%) |
| Transportation & Warehousing | 2,020 (56.1%) | 1,578 (43.9%) |
| Utilities | 97 (100.0%) | 0 (0.0%) |
| Information | 85 (58.2%) | 61 (41.8%) |
| Finance & Insurance | 294 (31.3%) | 645 (68.7%) |
| Real Estate, Rental & Leasing | 265 (48.7%) | 279 (51.3%) |
| Professional & Scientific | 620 (43.9%) | 794 (56.1%) |
| Enterprise Management | 0 (0.0%) | 30 (100.0%) |
| Administrative & Support | 1,393 (43.2%) | 1,832 (56.8%) |
| Educational Services | 1,300 (44.9%) | 1,598 (55.1%) |
| Health Care & Social Assistance | 1,380 (23.5%) | 4,498 (76.5%) |
| Arts, Entertainment & Recreation | 393 (60.5%) | 257 (39.5%) |
| Accommodation & Food Services | 1,755 (69.2%) | 781 (30.8%) |
| Public Administration | 1,182 (38.7%) | 1,871 (61.3%) |
| Total | 18,916 (52.1%) | 17,411 (47.9%) |
Education in Trenton
School Enrollment in Trenton
The most common levels of schooling among the 21,408 students in Trenton are elementary school (5,398 | 25.2%), middle school (5,220 | 24.4%), and high school (4,064 | 19.0%).
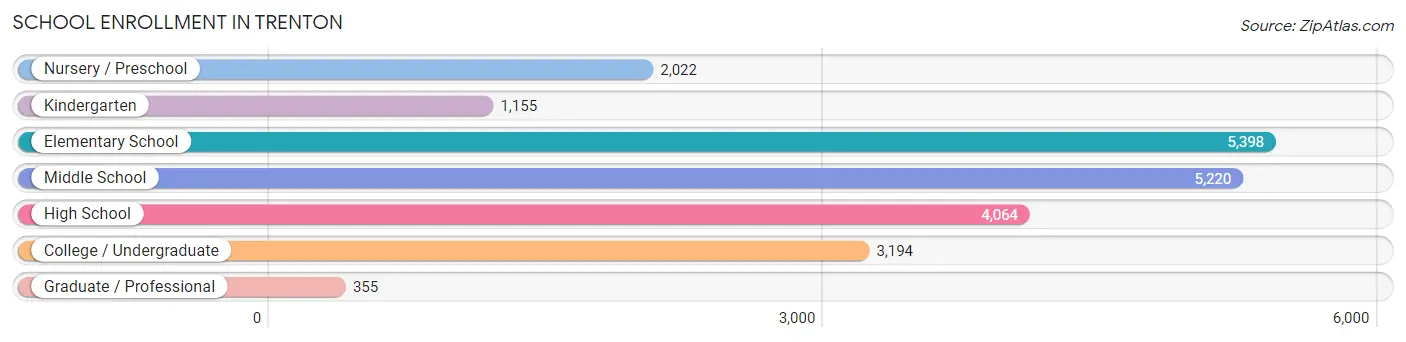
| School Level | # Students | % Students |
| Nursery / Preschool | 2,022 | 9.5% |
| Kindergarten | 1,155 | 5.4% |
| Elementary School | 5,398 | 25.2% |
| Middle School | 5,220 | 24.4% |
| High School | 4,064 | 19.0% |
| College / Undergraduate | 3,194 | 14.9% |
| Graduate / Professional | 355 | 1.7% |
| Total | 21,408 | 100.0% |
School Enrollment by Age by Funding Source in Trenton
Out of a total of 21,408 students who are enrolled in schools in Trenton, 2,077 (9.7%) attend a private institution, while the remaining 19,331 (90.3%) are enrolled in public schools. The age group of 35 years and over has the highest likelihood of being enrolled in private schools, with 310 (29.8% in the age bracket) enrolled. Conversely, the age group of 10 to 14 year olds has the lowest likelihood of being enrolled in a private school, with 6,017 (95.2% in the age bracket) attending a public institution.
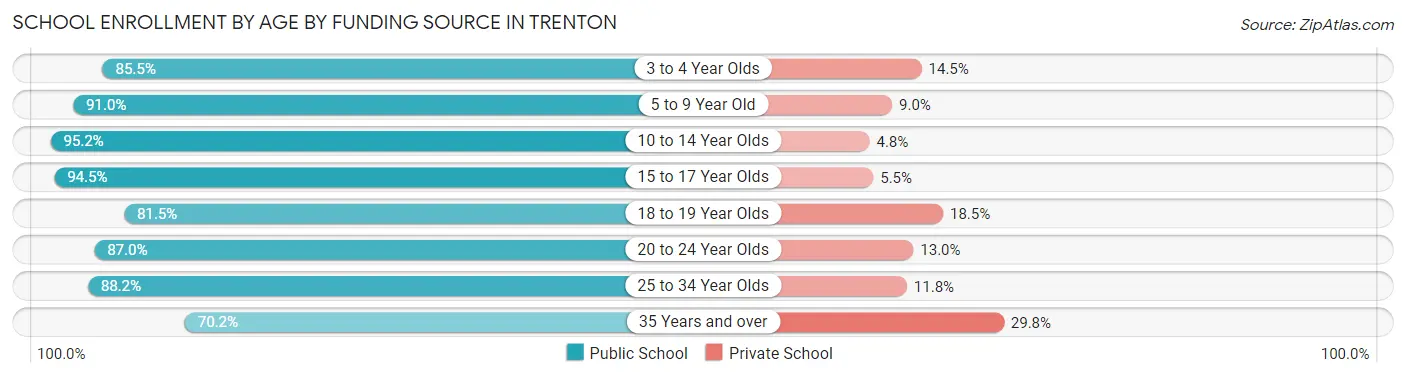
| Age Bracket | Public School | Private School |
| 3 to 4 Year Olds | 1,330 (85.5%) | 226 (14.5%) |
| 5 to 9 Year Old | 5,858 (91.0%) | 581 (9.0%) |
| 10 to 14 Year Olds | 6,017 (95.2%) | 305 (4.8%) |
| 15 to 17 Year Olds | 2,412 (94.5%) | 141 (5.5%) |
| 18 to 19 Year Olds | 1,083 (81.5%) | 246 (18.5%) |
| 20 to 24 Year Olds | 1,482 (87.0%) | 221 (13.0%) |
| 25 to 34 Year Olds | 412 (88.2%) | 55 (11.8%) |
| 35 Years and over | 729 (70.2%) | 310 (29.8%) |
| Total | 19,331 (90.3%) | 2,077 (9.7%) |
Educational Attainment by Field of Study in Trenton
Business (2,144 | 21.3%), arts & humanities (1,047 | 10.4%), psychology (1,000 | 10.0%), visual & performing arts (803 | 8.0%), and education (766 | 7.6%) are the most common fields of study among 10,049 individuals in Trenton who have obtained a bachelor's degree or higher.
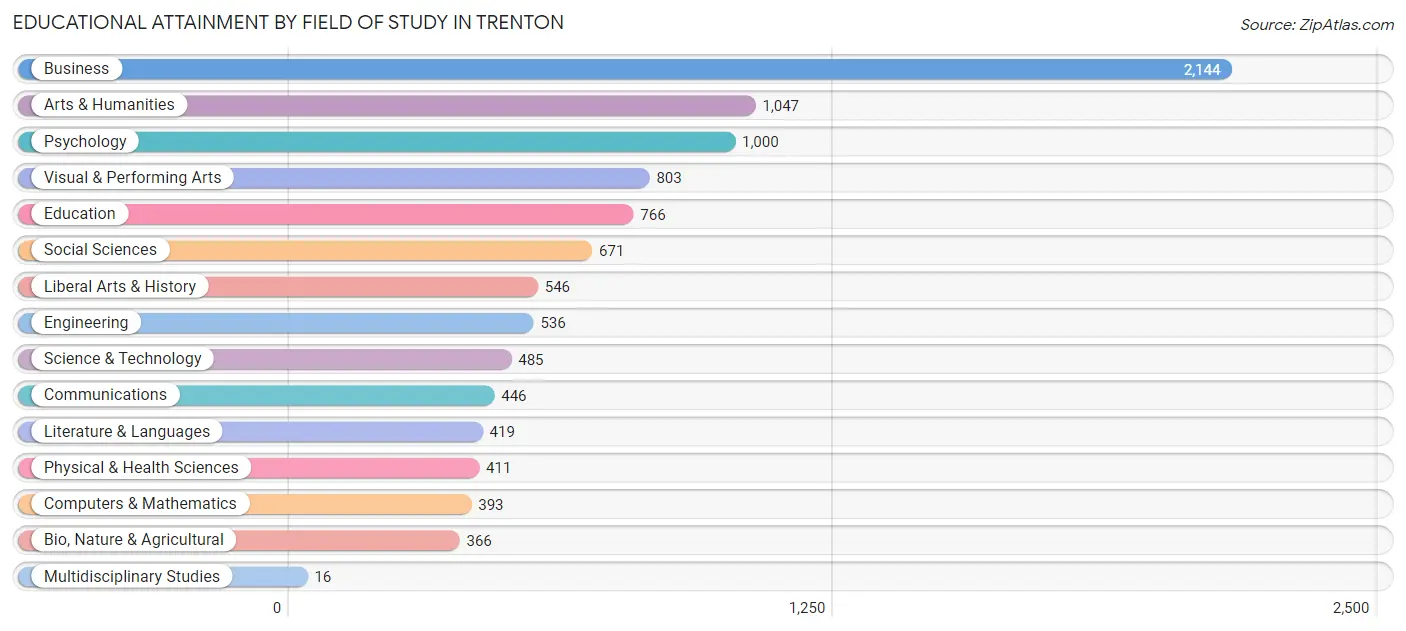
| Field of Study | # Graduates | % Graduates |
| Computers & Mathematics | 393 | 3.9% |
| Bio, Nature & Agricultural | 366 | 3.6% |
| Physical & Health Sciences | 411 | 4.1% |
| Psychology | 1,000 | 10.0% |
| Social Sciences | 671 | 6.7% |
| Engineering | 536 | 5.3% |
| Multidisciplinary Studies | 16 | 0.2% |
| Science & Technology | 485 | 4.8% |
| Business | 2,144 | 21.3% |
| Education | 766 | 7.6% |
| Literature & Languages | 419 | 4.2% |
| Liberal Arts & History | 546 | 5.4% |
| Visual & Performing Arts | 803 | 8.0% |
| Communications | 446 | 4.4% |
| Arts & Humanities | 1,047 | 10.4% |
| Total | 10,049 | 100.0% |
Transportation & Commute in Trenton
Vehicle Availability by Sex in Trenton
The most prevalent vehicle ownership categories in Trenton are males with 1 vehicle (6,390, accounting for 34.9%) and females with 1 vehicle (6,025, making up 38.5%).
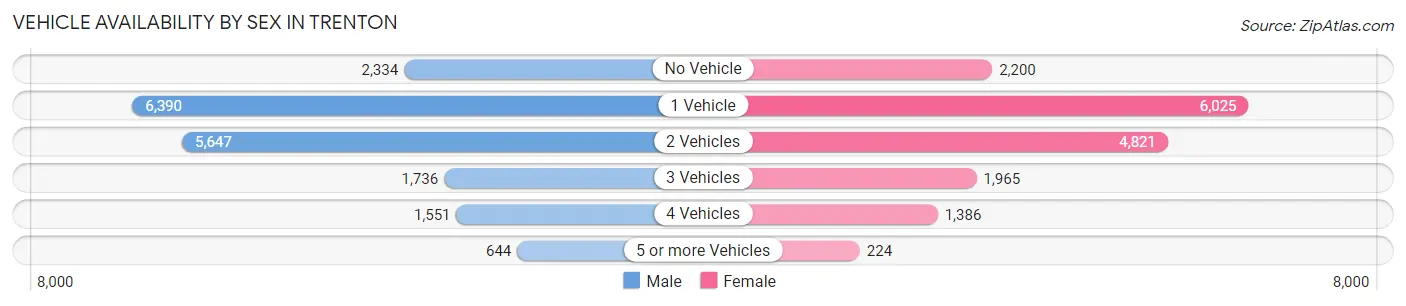
| Vehicles Available | Male | Female |
| No Vehicle | 2,334 (12.8%) | 2,200 (13.2%) |
| 1 Vehicle | 6,390 (34.9%) | 6,025 (36.2%) |
| 2 Vehicles | 5,647 (30.8%) | 4,821 (29.0%) |
| 3 Vehicles | 1,736 (9.5%) | 1,965 (11.8%) |
| 4 Vehicles | 1,551 (8.5%) | 1,386 (8.3%) |
| 5 or more Vehicles | 644 (3.5%) | 224 (1.3%) |
| Total | 18,302 (100.0%) | 16,621 (100.0%) |
Commute Time in Trenton
The most frequently occuring commute durations in Trenton are 15 to 19 minutes (8,187 commuters, 24.7%), 20 to 24 minutes (5,876 commuters, 17.7%), and 10 to 14 minutes (4,177 commuters, 12.6%).
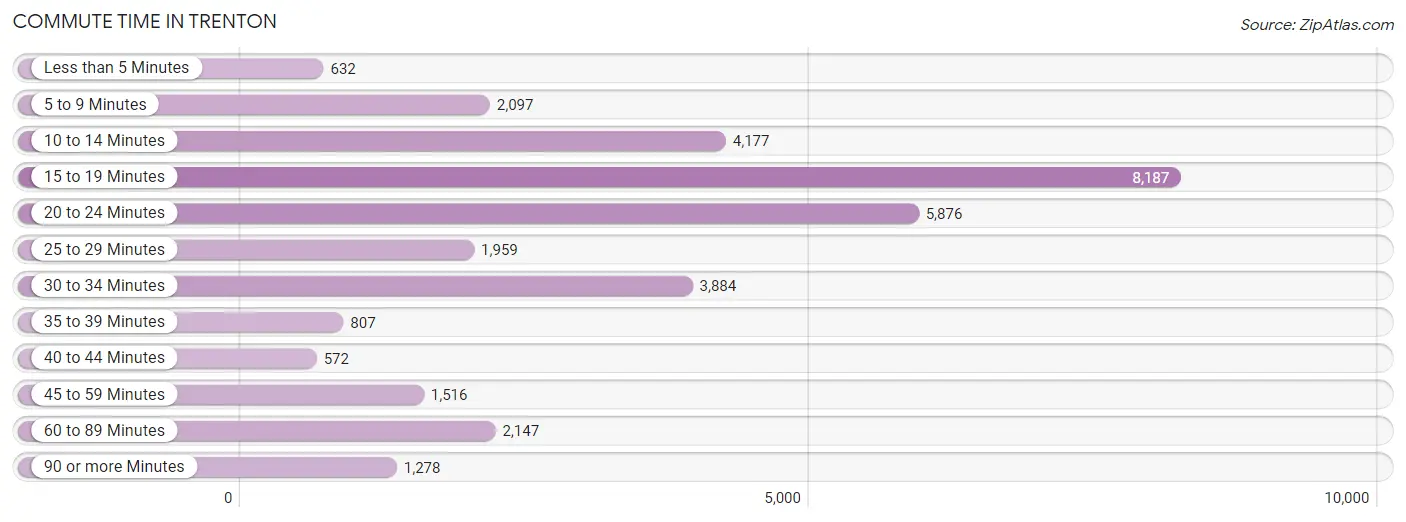
| Commute Time | # Commuters | % Commuters |
| Less than 5 Minutes | 632 | 1.9% |
| 5 to 9 Minutes | 2,097 | 6.3% |
| 10 to 14 Minutes | 4,177 | 12.6% |
| 15 to 19 Minutes | 8,187 | 24.7% |
| 20 to 24 Minutes | 5,876 | 17.7% |
| 25 to 29 Minutes | 1,959 | 5.9% |
| 30 to 34 Minutes | 3,884 | 11.7% |
| 35 to 39 Minutes | 807 | 2.4% |
| 40 to 44 Minutes | 572 | 1.7% |
| 45 to 59 Minutes | 1,516 | 4.6% |
| 60 to 89 Minutes | 2,147 | 6.5% |
| 90 or more Minutes | 1,278 | 3.9% |
Commute Time by Sex in Trenton
The most common commute times in Trenton are 15 to 19 minutes (4,079 commuters, 23.3%) for males and 15 to 19 minutes (4,108 commuters, 26.3%) for females.
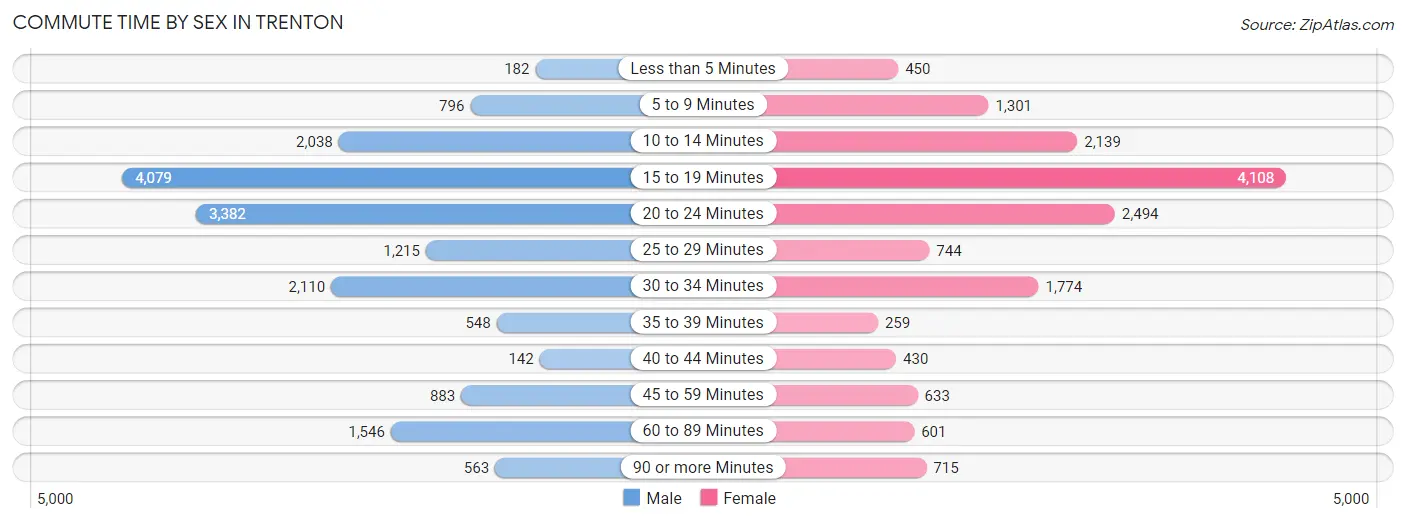
| Commute Time | Male | Female |
| Less than 5 Minutes | 182 (1.0%) | 450 (2.9%) |
| 5 to 9 Minutes | 796 (4.5%) | 1,301 (8.3%) |
| 10 to 14 Minutes | 2,038 (11.7%) | 2,139 (13.7%) |
| 15 to 19 Minutes | 4,079 (23.3%) | 4,108 (26.3%) |
| 20 to 24 Minutes | 3,382 (19.3%) | 2,494 (15.9%) |
| 25 to 29 Minutes | 1,215 (7.0%) | 744 (4.8%) |
| 30 to 34 Minutes | 2,110 (12.1%) | 1,774 (11.3%) |
| 35 to 39 Minutes | 548 (3.1%) | 259 (1.7%) |
| 40 to 44 Minutes | 142 (0.8%) | 430 (2.8%) |
| 45 to 59 Minutes | 883 (5.1%) | 633 (4.1%) |
| 60 to 89 Minutes | 1,546 (8.8%) | 601 (3.8%) |
| 90 or more Minutes | 563 (3.2%) | 715 (4.6%) |
Time of Departure to Work by Sex in Trenton
The most frequent times of departure to work in Trenton are 7:00 AM to 7:29 AM (2,958, 16.9%) for males and 8:00 AM to 8:29 AM (2,795, 17.9%) for females.
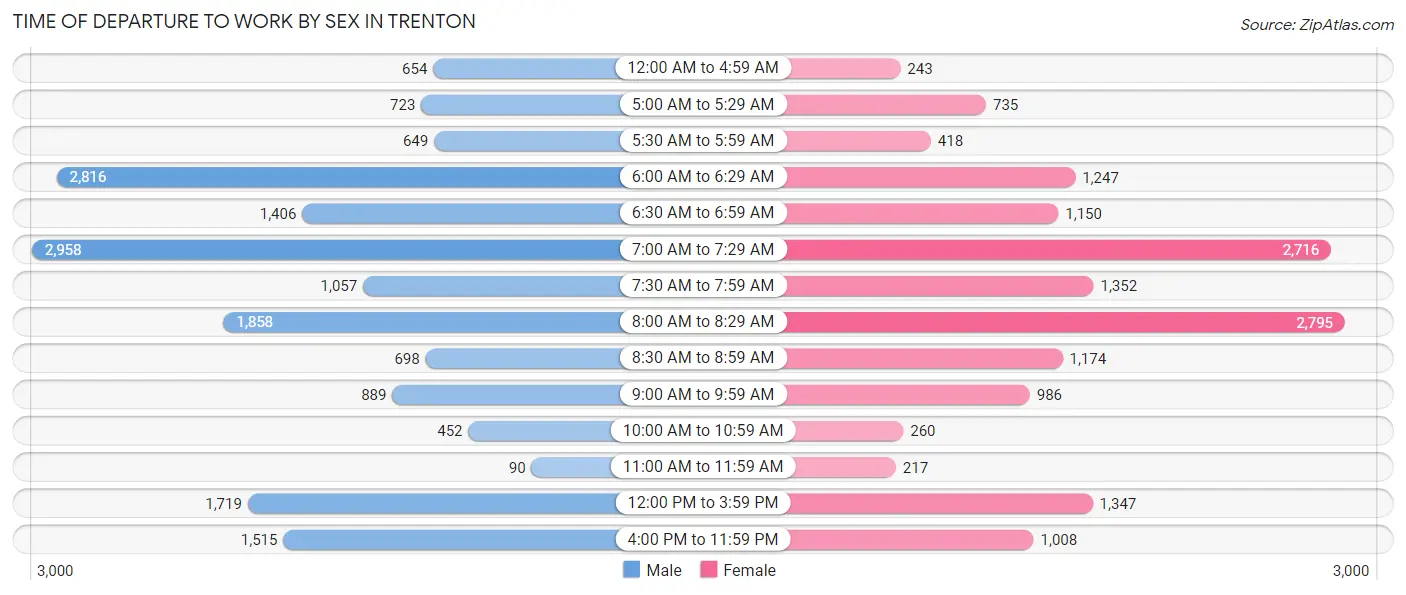
| Time of Departure | Male | Female |
| 12:00 AM to 4:59 AM | 654 (3.7%) | 243 (1.5%) |
| 5:00 AM to 5:29 AM | 723 (4.1%) | 735 (4.7%) |
| 5:30 AM to 5:59 AM | 649 (3.7%) | 418 (2.7%) |
| 6:00 AM to 6:29 AM | 2,816 (16.1%) | 1,247 (8.0%) |
| 6:30 AM to 6:59 AM | 1,406 (8.0%) | 1,150 (7.3%) |
| 7:00 AM to 7:29 AM | 2,958 (16.9%) | 2,716 (17.4%) |
| 7:30 AM to 7:59 AM | 1,057 (6.0%) | 1,352 (8.6%) |
| 8:00 AM to 8:29 AM | 1,858 (10.6%) | 2,795 (17.9%) |
| 8:30 AM to 8:59 AM | 698 (4.0%) | 1,174 (7.5%) |
| 9:00 AM to 9:59 AM | 889 (5.1%) | 986 (6.3%) |
| 10:00 AM to 10:59 AM | 452 (2.6%) | 260 (1.7%) |
| 11:00 AM to 11:59 AM | 90 (0.5%) | 217 (1.4%) |
| 12:00 PM to 3:59 PM | 1,719 (9.8%) | 1,347 (8.6%) |
| 4:00 PM to 11:59 PM | 1,515 (8.7%) | 1,008 (6.4%) |
| Total | 17,484 (100.0%) | 15,648 (100.0%) |
Housing Occupancy in Trenton
Occupancy by Ownership in Trenton
Of the total 32,165 dwellings in Trenton, owner-occupied units account for 12,313 (38.3%), while renter-occupied units make up 19,852 (61.7%).
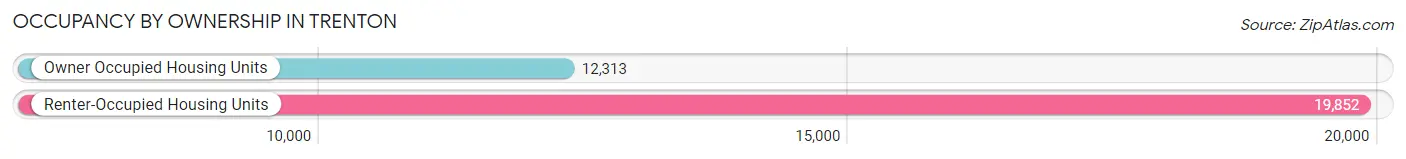
| Occupancy | # Housing Units | % Housing Units |
| Owner Occupied Housing Units | 12,313 | 38.3% |
| Renter-Occupied Housing Units | 19,852 | 61.7% |
| Total Occupied Housing Units | 32,165 | 100.0% |
Occupancy by Household Size in Trenton
| Household Size | # Housing Units | % Housing Units |
| 1-Person Household | 11,930 | 37.1% |
| 2-Person Household | 7,821 | 24.3% |
| 3-Person Household | 4,140 | 12.9% |
| 4+ Person Household | 8,274 | 25.7% |
| Total Housing Units | 32,165 | 100.0% |
Occupancy by Ownership by Household Size in Trenton
| Household Size | Owner-occupied | Renter-occupied |
| 1-Person Household | 3,521 (29.5%) | 8,409 (70.5%) |
| 2-Person Household | 3,740 (47.8%) | 4,081 (52.2%) |
| 3-Person Household | 1,551 (37.5%) | 2,589 (62.5%) |
| 4+ Person Household | 3,501 (42.3%) | 4,773 (57.7%) |
| Total Housing Units | 12,313 (38.3%) | 19,852 (61.7%) |
Occupancy by Educational Attainment in Trenton
| Household Size | Owner-occupied | Renter-occupied |
| Less than High School | 1,976 (28.3%) | 5,017 (71.7%) |
| High School Diploma | 4,121 (34.6%) | 7,785 (65.4%) |
| College/Associate Degree | 3,039 (38.7%) | 4,806 (61.3%) |
| Bachelor's Degree or higher | 3,177 (58.6%) | 2,244 (41.4%) |
Occupancy by Age of Householder in Trenton
| Age Bracket | # Households | % Households |
| Under 35 Years | 6,402 | 19.9% |
| 35 to 44 Years | 4,800 | 14.9% |
| 45 to 54 Years | 6,184 | 19.2% |
| 55 to 64 Years | 6,894 | 21.4% |
| 65 to 74 Years | 5,123 | 15.9% |
| 75 to 84 Years | 1,960 | 6.1% |
| 85 Years and Over | 802 | 2.5% |
| Total | 32,165 | 100.0% |
Housing Finances in Trenton
Median Income by Occupancy in Trenton
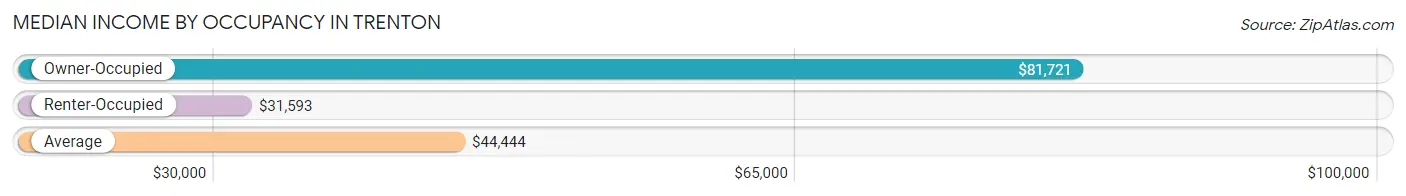
| Occupancy Type | # Households | Median Income |
| Owner-Occupied | 12,313 (38.3%) | $81,721 |
| Renter-Occupied | 19,852 (61.7%) | $31,593 |
| Average | 32,165 (100.0%) | $44,444 |
Occupancy by Householder Income Bracket in Trenton
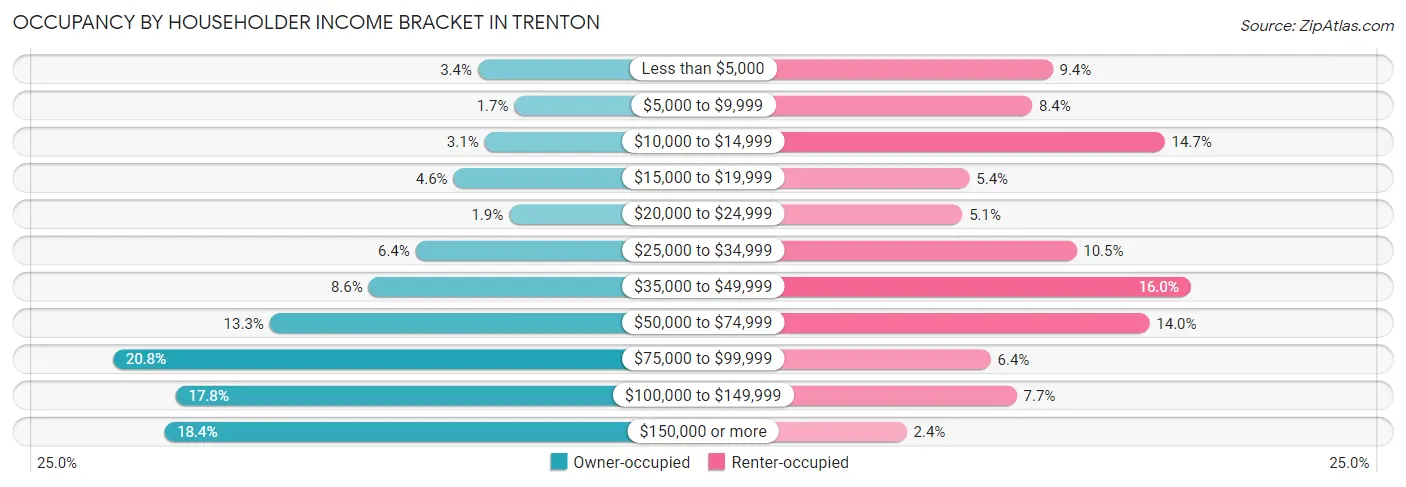
| Income Bracket | Owner-occupied | Renter-occupied |
| Less than $5,000 | 421 (3.4%) | 1,863 (9.4%) |
| $5,000 to $9,999 | 207 (1.7%) | 1,667 (8.4%) |
| $10,000 to $14,999 | 382 (3.1%) | 2,923 (14.7%) |
| $15,000 to $19,999 | 564 (4.6%) | 1,076 (5.4%) |
| $20,000 to $24,999 | 238 (1.9%) | 1,008 (5.1%) |
| $25,000 to $34,999 | 786 (6.4%) | 2,086 (10.5%) |
| $35,000 to $49,999 | 1,061 (8.6%) | 3,169 (16.0%) |
| $50,000 to $74,999 | 1,641 (13.3%) | 2,778 (14.0%) |
| $75,000 to $99,999 | 2,561 (20.8%) | 1,276 (6.4%) |
| $100,000 to $149,999 | 2,193 (17.8%) | 1,523 (7.7%) |
| $150,000 or more | 2,259 (18.3%) | 483 (2.4%) |
| Total | 12,313 (100.0%) | 19,852 (100.0%) |
Monthly Housing Cost Tiers in Trenton
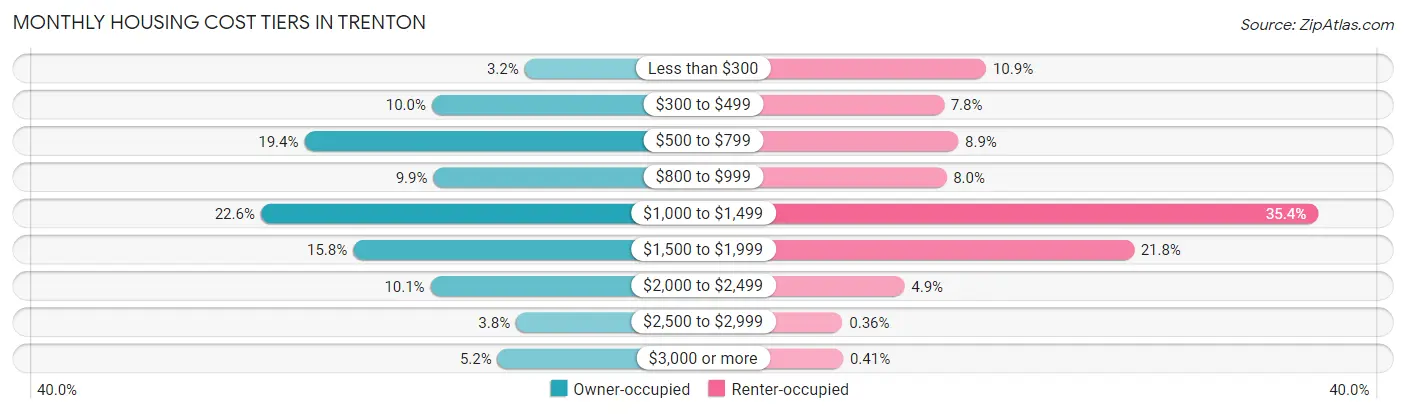
| Monthly Cost | Owner-occupied | Renter-occupied |
| Less than $300 | 392 (3.2%) | 2,171 (10.9%) |
| $300 to $499 | 1,232 (10.0%) | 1,554 (7.8%) |
| $500 to $799 | 2,389 (19.4%) | 1,764 (8.9%) |
| $800 to $999 | 1,219 (9.9%) | 1,591 (8.0%) |
| $1,000 to $1,499 | 2,784 (22.6%) | 7,026 (35.4%) |
| $1,500 to $1,999 | 1,947 (15.8%) | 4,331 (21.8%) |
| $2,000 to $2,499 | 1,245 (10.1%) | 979 (4.9%) |
| $2,500 to $2,999 | 469 (3.8%) | 71 (0.4%) |
| $3,000 or more | 636 (5.2%) | 82 (0.4%) |
| Total | 12,313 (100.0%) | 19,852 (100.0%) |
Physical Housing Characteristics in Trenton
Housing Structures in Trenton
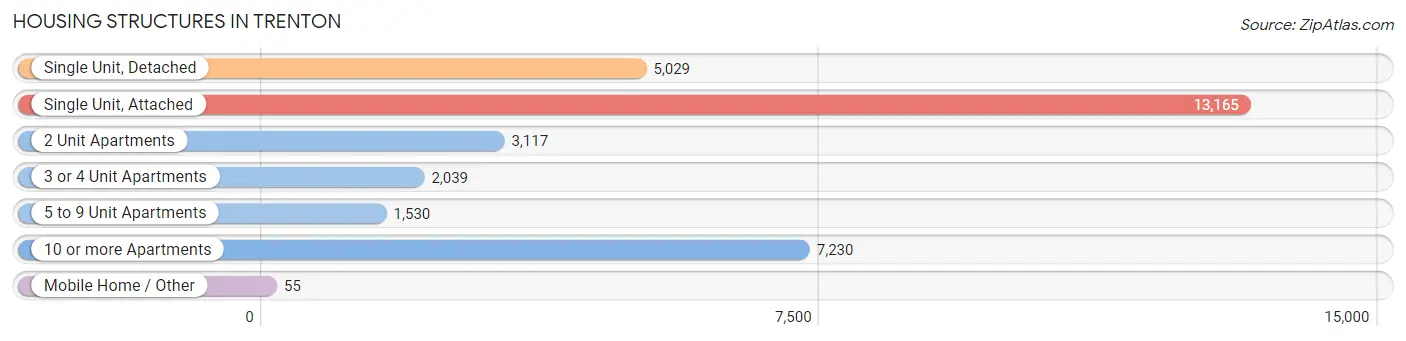
| Structure Type | # Housing Units | % Housing Units |
| Single Unit, Detached | 5,029 | 15.6% |
| Single Unit, Attached | 13,165 | 40.9% |
| 2 Unit Apartments | 3,117 | 9.7% |
| 3 or 4 Unit Apartments | 2,039 | 6.3% |
| 5 to 9 Unit Apartments | 1,530 | 4.8% |
| 10 or more Apartments | 7,230 | 22.5% |
| Mobile Home / Other | 55 | 0.2% |
| Total | 32,165 | 100.0% |
Housing Structures by Occupancy in Trenton
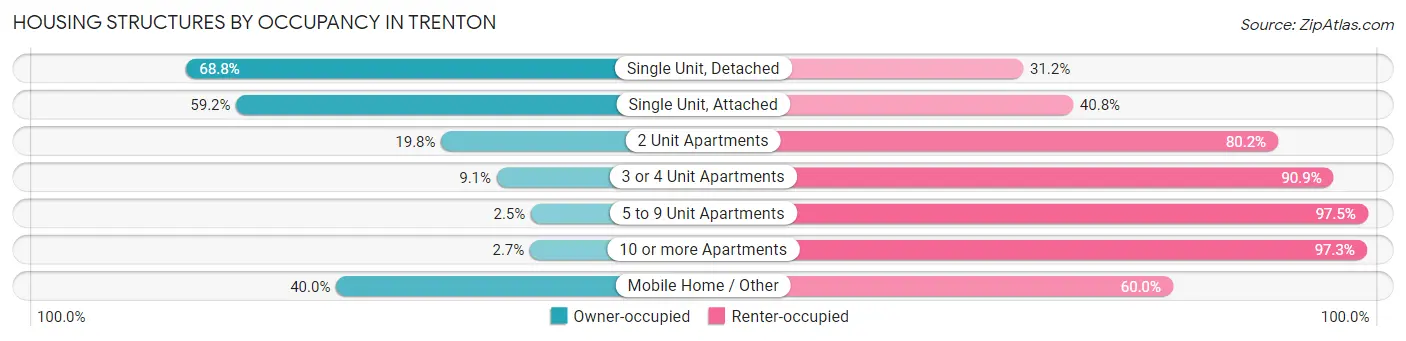
| Structure Type | Owner-occupied | Renter-occupied |
| Single Unit, Detached | 3,462 (68.8%) | 1,567 (31.2%) |
| Single Unit, Attached | 7,797 (59.2%) | 5,368 (40.8%) |
| 2 Unit Apartments | 616 (19.8%) | 2,501 (80.2%) |
| 3 or 4 Unit Apartments | 185 (9.1%) | 1,854 (90.9%) |
| 5 to 9 Unit Apartments | 38 (2.5%) | 1,492 (97.5%) |
| 10 or more Apartments | 193 (2.7%) | 7,037 (97.3%) |
| Mobile Home / Other | 22 (40.0%) | 33 (60.0%) |
| Total | 12,313 (38.3%) | 19,852 (61.7%) |
Housing Structures by Number of Rooms in Trenton
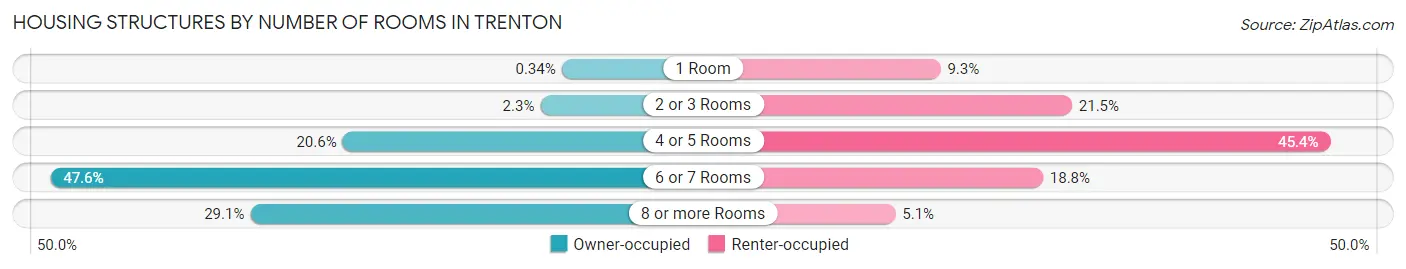
| Number of Rooms | Owner-occupied | Renter-occupied |
| 1 Room | 42 (0.3%) | 1,846 (9.3%) |
| 2 or 3 Rooms | 284 (2.3%) | 4,259 (21.4%) |
| 4 or 5 Rooms | 2,536 (20.6%) | 9,002 (45.4%) |
| 6 or 7 Rooms | 5,864 (47.6%) | 3,726 (18.8%) |
| 8 or more Rooms | 3,587 (29.1%) | 1,019 (5.1%) |
| Total | 12,313 (100.0%) | 19,852 (100.0%) |
Housing Structure by Heating Type in Trenton
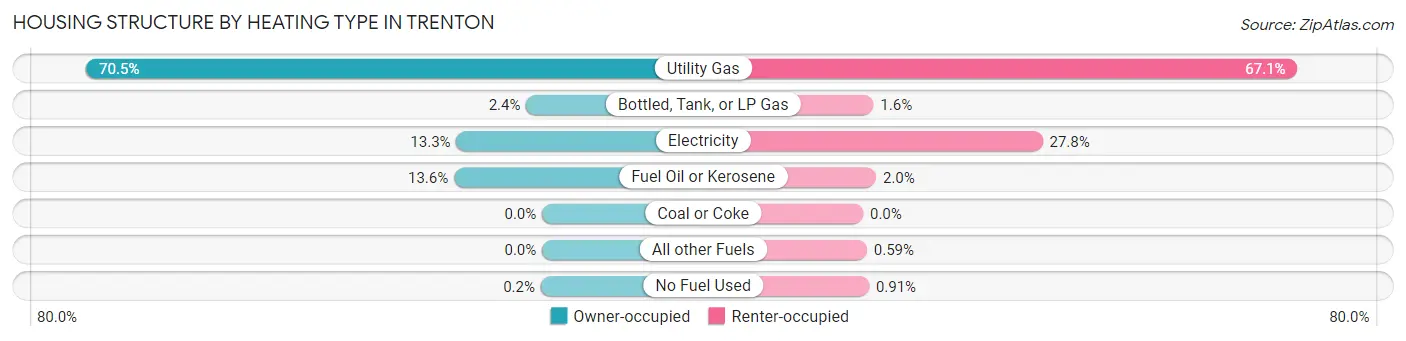
| Heating Type | Owner-occupied | Renter-occupied |
| Utility Gas | 8,679 (70.5%) | 13,328 (67.1%) |
| Bottled, Tank, or LP Gas | 301 (2.4%) | 318 (1.6%) |
| Electricity | 1,632 (13.3%) | 5,508 (27.8%) |
| Fuel Oil or Kerosene | 1,676 (13.6%) | 399 (2.0%) |
| Coal or Coke | 0 (0.0%) | 0 (0.0%) |
| All other Fuels | 0 (0.0%) | 118 (0.6%) |
| No Fuel Used | 25 (0.2%) | 181 (0.9%) |
| Total | 12,313 (100.0%) | 19,852 (100.0%) |
Household Vehicle Usage in Trenton
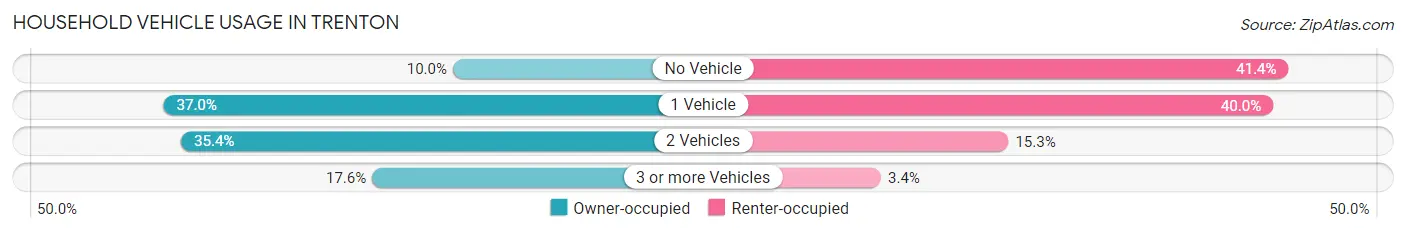
| Vehicles per Household | Owner-occupied | Renter-occupied |
| No Vehicle | 1,235 (10.0%) | 8,217 (41.4%) |
| 1 Vehicle | 4,558 (37.0%) | 7,932 (40.0%) |
| 2 Vehicles | 4,356 (35.4%) | 3,032 (15.3%) |
| 3 or more Vehicles | 2,164 (17.6%) | 671 (3.4%) |
| Total | 12,313 (100.0%) | 19,852 (100.0%) |
Real Estate & Mortgages in Trenton
Real Estate and Mortgage Overview in Trenton
| Characteristic | Without Mortgage | With Mortgage |
| Housing Units | 5,687 | 6,626 |
| Median Property Value | $89,100 | $132,600 |
| Median Household Income | $74,684 | $1,300 |
| Monthly Housing Costs | $669 | $577 |
| Real Estate Taxes | $3,338 | $219 |
Property Value by Mortgage Status in Trenton
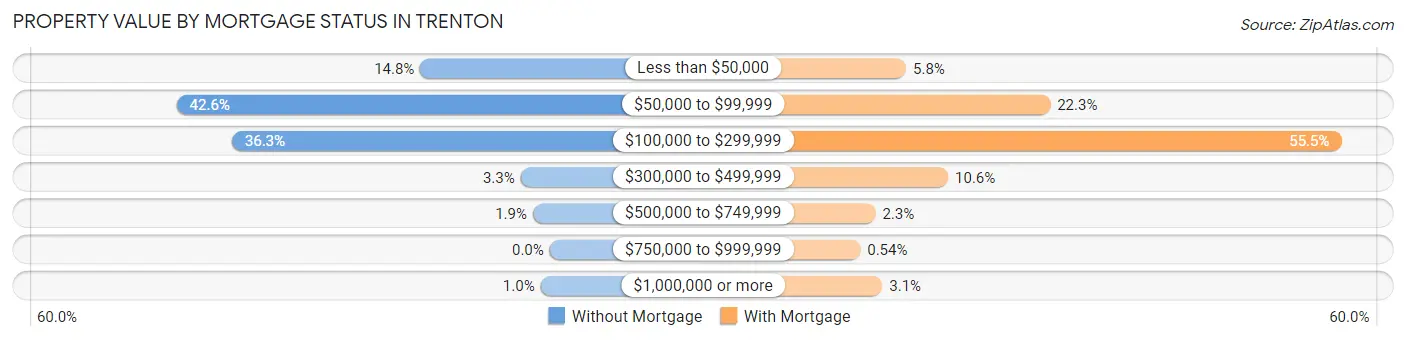
| Property Value | Without Mortgage | With Mortgage |
| Less than $50,000 | 841 (14.8%) | 383 (5.8%) |
| $50,000 to $99,999 | 2,424 (42.6%) | 1,474 (22.3%) |
| $100,000 to $299,999 | 2,065 (36.3%) | 3,678 (55.5%) |
| $300,000 to $499,999 | 189 (3.3%) | 701 (10.6%) |
| $500,000 to $749,999 | 109 (1.9%) | 151 (2.3%) |
| $750,000 to $999,999 | 0 (0.0%) | 36 (0.5%) |
| $1,000,000 or more | 59 (1.0%) | 203 (3.1%) |
| Total | 5,687 (100.0%) | 6,626 (100.0%) |
Household Income by Mortgage Status in Trenton
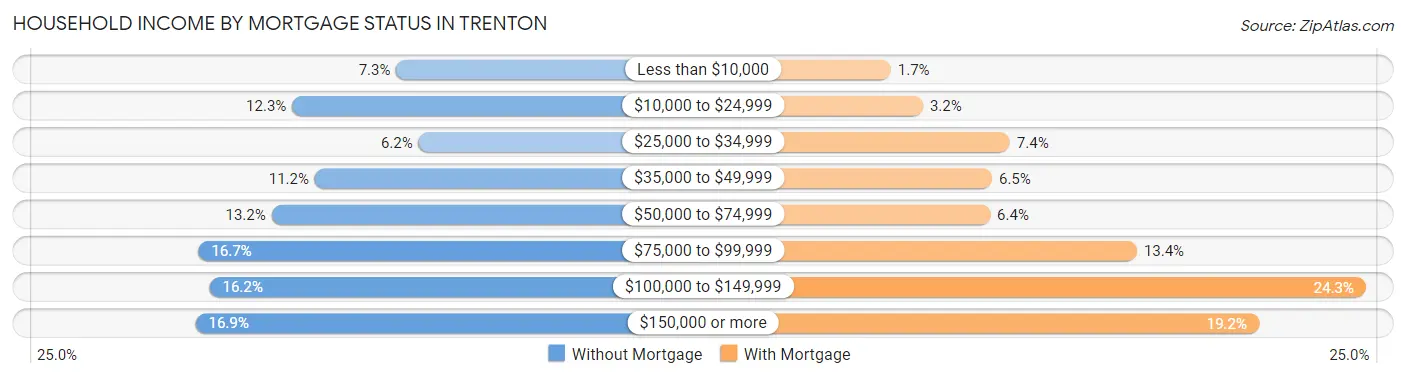
| Household Income | Without Mortgage | With Mortgage |
| Less than $10,000 | 415 (7.3%) | 111 (1.7%) |
| $10,000 to $24,999 | 697 (12.3%) | 213 (3.2%) |
| $25,000 to $34,999 | 355 (6.2%) | 487 (7.3%) |
| $35,000 to $49,999 | 636 (11.2%) | 431 (6.5%) |
| $50,000 to $74,999 | 753 (13.2%) | 425 (6.4%) |
| $75,000 to $99,999 | 951 (16.7%) | 888 (13.4%) |
| $100,000 to $149,999 | 921 (16.2%) | 1,610 (24.3%) |
| $150,000 or more | 959 (16.9%) | 1,272 (19.2%) |
| Total | 5,687 (100.0%) | 6,626 (100.0%) |
Property Value to Household Income Ratio in Trenton
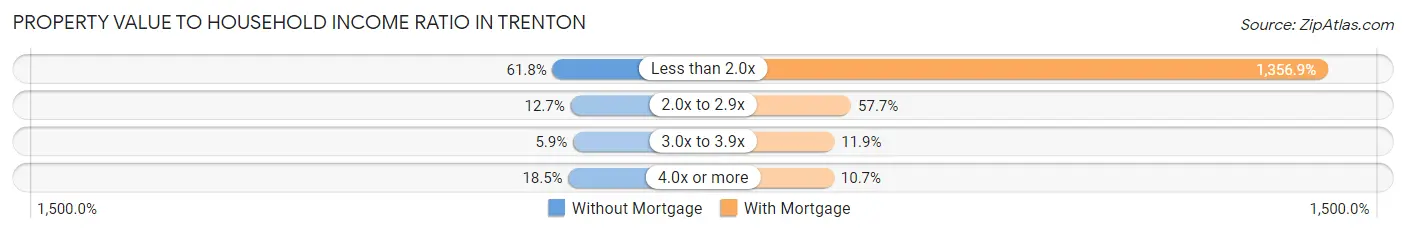
| Value-to-Income Ratio | Without Mortgage | With Mortgage |
| Less than 2.0x | 3,517 (61.8%) | 89,906 (1,356.9%) |
| 2.0x to 2.9x | 723 (12.7%) | 3,825 (57.7%) |
| 3.0x to 3.9x | 334 (5.9%) | 786 (11.9%) |
| 4.0x or more | 1,051 (18.5%) | 707 (10.7%) |
| Total | 5,687 (100.0%) | 6,626 (100.0%) |
Real Estate Taxes by Mortgage Status in Trenton
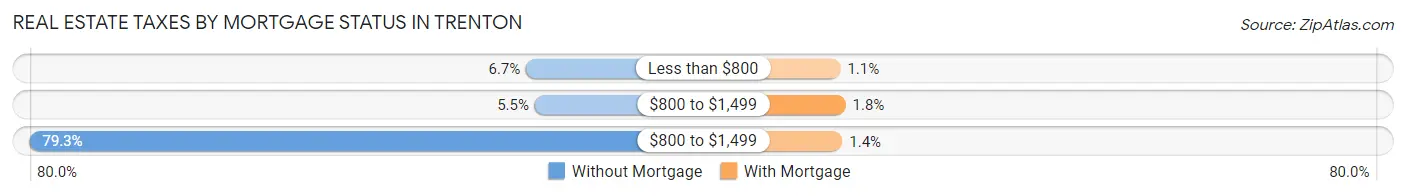
| Property Taxes | Without Mortgage | With Mortgage |
| Less than $800 | 382 (6.7%) | 72 (1.1%) |
| $800 to $1,499 | 310 (5.4%) | 122 (1.8%) |
| $800 to $1,499 | 4,510 (79.3%) | 90 (1.4%) |
| Total | 5,687 (100.0%) | 6,626 (100.0%) |
Health & Disability in Trenton
Health Insurance Coverage by Age in Trenton
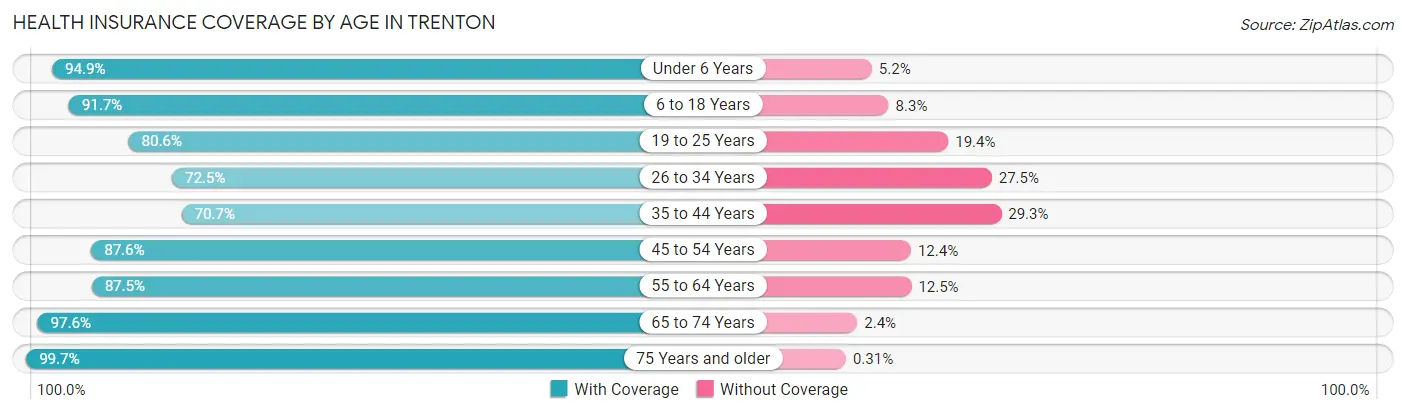
| Age Bracket | With Coverage | Without Coverage |
| Under 6 Years | 8,296 (94.9%) | 450 (5.1%) |
| 6 to 18 Years | 14,166 (91.7%) | 1,277 (8.3%) |
| 19 to 25 Years | 6,154 (80.6%) | 1,481 (19.4%) |
| 26 to 34 Years | 8,434 (72.5%) | 3,201 (27.5%) |
| 35 to 44 Years | 8,299 (70.7%) | 3,434 (29.3%) |
| 45 to 54 Years | 9,513 (87.6%) | 1,352 (12.4%) |
| 55 to 64 Years | 9,775 (87.5%) | 1,399 (12.5%) |
| 65 to 74 Years | 6,507 (97.6%) | 163 (2.4%) |
| 75 Years and older | 3,877 (99.7%) | 12 (0.3%) |
| Total | 75,021 (85.5%) | 12,769 (14.5%) |
Health Insurance Coverage by Citizenship Status in Trenton
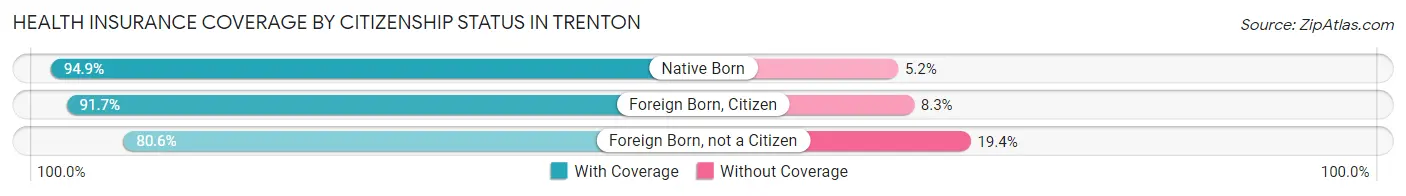
| Citizenship Status | With Coverage | Without Coverage |
| Native Born | 8,296 (94.9%) | 450 (5.1%) |
| Foreign Born, Citizen | 14,166 (91.7%) | 1,277 (8.3%) |
| Foreign Born, not a Citizen | 6,154 (80.6%) | 1,481 (19.4%) |
Health Insurance Coverage by Household Income in Trenton
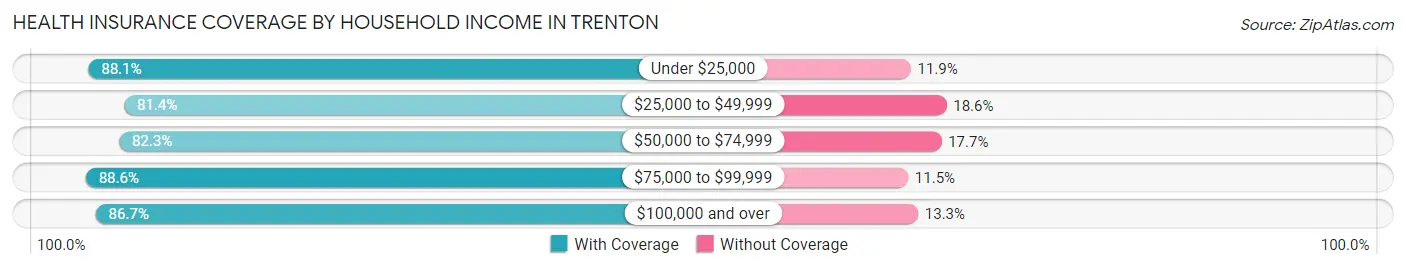
| Household Income | With Coverage | Without Coverage |
| Under $25,000 | 16,529 (88.1%) | 2,241 (11.9%) |
| $25,000 to $49,999 | 14,158 (81.4%) | 3,244 (18.6%) |
| $50,000 to $74,999 | 11,487 (82.3%) | 2,468 (17.7%) |
| $75,000 to $99,999 | 9,767 (88.5%) | 1,263 (11.5%) |
| $100,000 and over | 22,349 (86.7%) | 3,431 (13.3%) |
Public vs Private Health Insurance Coverage by Age in Trenton
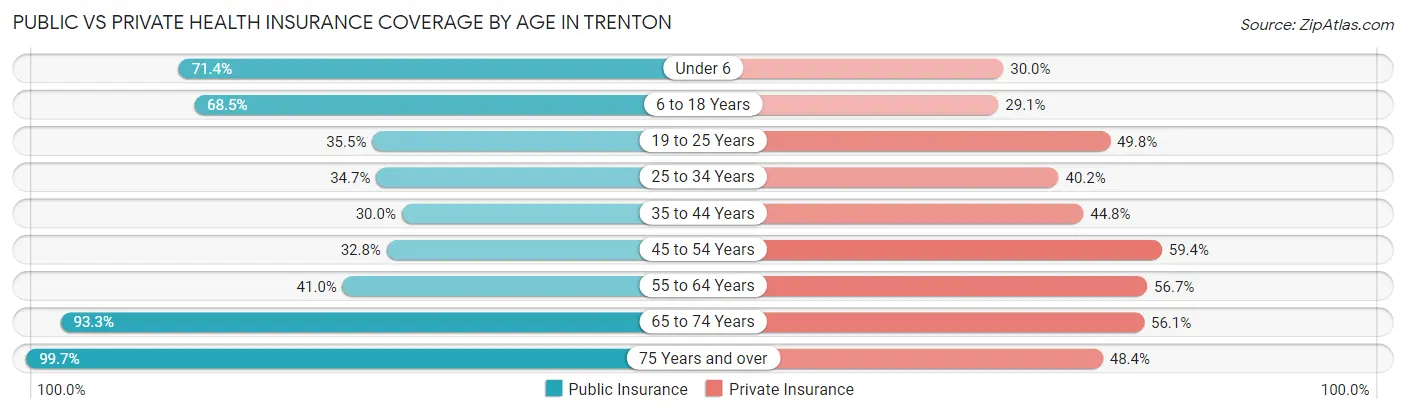
| Age Bracket | Public Insurance | Private Insurance |
| Under 6 | 6,242 (71.4%) | 2,622 (30.0%) |
| 6 to 18 Years | 10,582 (68.5%) | 4,488 (29.1%) |
| 19 to 25 Years | 2,708 (35.5%) | 3,801 (49.8%) |
| 25 to 34 Years | 4,041 (34.7%) | 4,681 (40.2%) |
| 35 to 44 Years | 3,520 (30.0%) | 5,261 (44.8%) |
| 45 to 54 Years | 3,563 (32.8%) | 6,453 (59.4%) |
| 55 to 64 Years | 4,577 (41.0%) | 6,333 (56.7%) |
| 65 to 74 Years | 6,225 (93.3%) | 3,742 (56.1%) |
| 75 Years and over | 3,877 (99.7%) | 1,884 (48.4%) |
| Total | 45,335 (51.6%) | 39,265 (44.7%) |
Disability Status by Sex by Age in Trenton
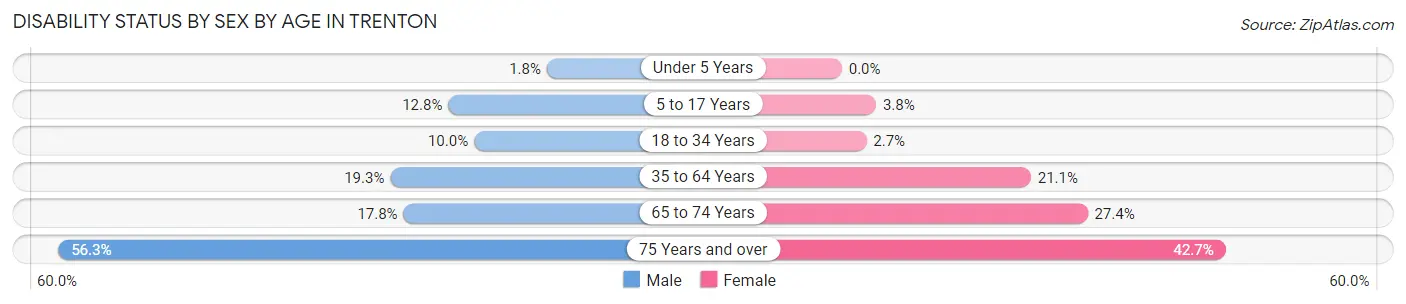
| Age Bracket | Male | Female |
| Under 5 Years | 57 (1.8%) | 0 (0.0%) |
| 5 to 17 Years | 969 (12.8%) | 326 (3.8%) |
| 18 to 34 Years | 917 (10.0%) | 299 (2.7%) |
| 35 to 64 Years | 3,268 (19.3%) | 3,540 (21.0%) |
| 65 to 74 Years | 550 (17.8%) | 980 (27.4%) |
| 75 Years and over | 787 (56.2%) | 1,064 (42.7%) |
Disability Class by Sex by Age in Trenton
Disability Class: Hearing Difficulty
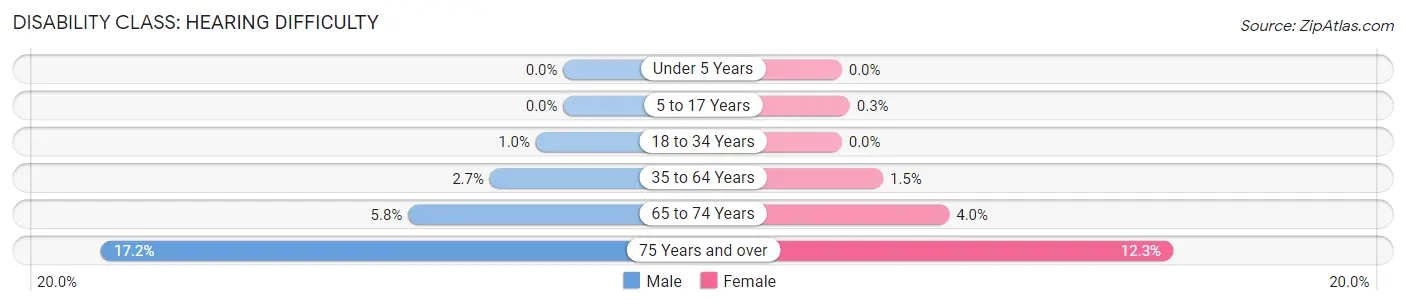
| Age Bracket | Male | Female |
| Under 5 Years | 0 (0.0%) | 0 (0.0%) |
| 5 to 17 Years | 0 (0.0%) | 26 (0.3%) |
| 18 to 34 Years | 94 (1.0%) | 0 (0.0%) |
| 35 to 64 Years | 462 (2.7%) | 258 (1.5%) |
| 65 to 74 Years | 178 (5.8%) | 143 (4.0%) |
| 75 Years and over | 240 (17.2%) | 306 (12.3%) |
Disability Class: Vision Difficulty
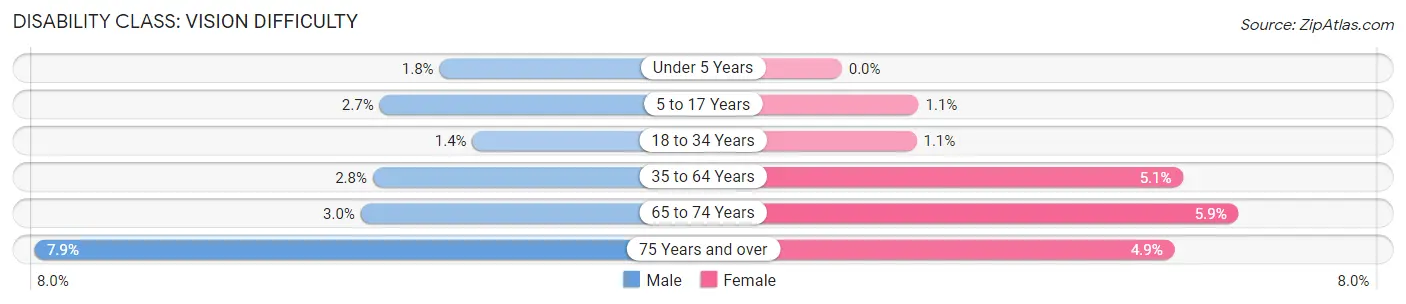
| Age Bracket | Male | Female |
| Under 5 Years | 57 (1.8%) | 0 (0.0%) |
| 5 to 17 Years | 206 (2.7%) | 98 (1.1%) |
| 18 to 34 Years | 124 (1.3%) | 122 (1.1%) |
| 35 to 64 Years | 479 (2.8%) | 853 (5.1%) |
| 65 to 74 Years | 93 (3.0%) | 211 (5.9%) |
| 75 Years and over | 110 (7.9%) | 123 (4.9%) |
Disability Class: Cognitive Difficulty
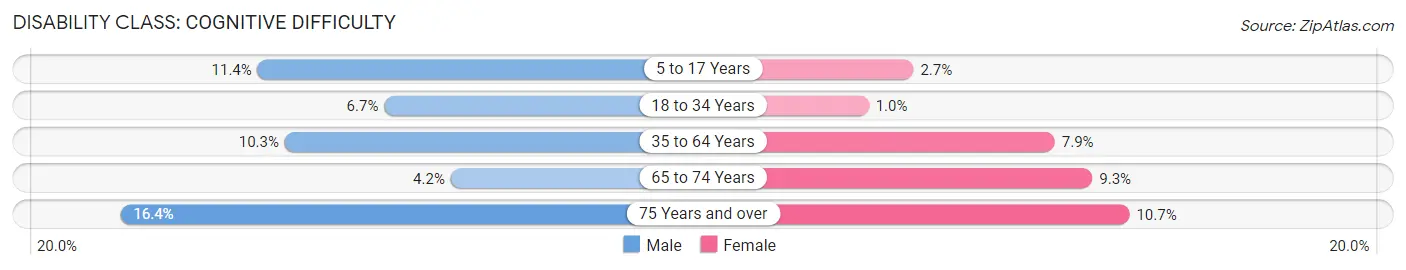
| Age Bracket | Male | Female |
| 5 to 17 Years | 858 (11.4%) | 228 (2.7%) |
| 18 to 34 Years | 613 (6.7%) | 110 (1.0%) |
| 35 to 64 Years | 1,752 (10.3%) | 1,330 (7.9%) |
| 65 to 74 Years | 129 (4.2%) | 333 (9.3%) |
| 75 Years and over | 230 (16.4%) | 266 (10.7%) |
Disability Class: Ambulatory Difficulty
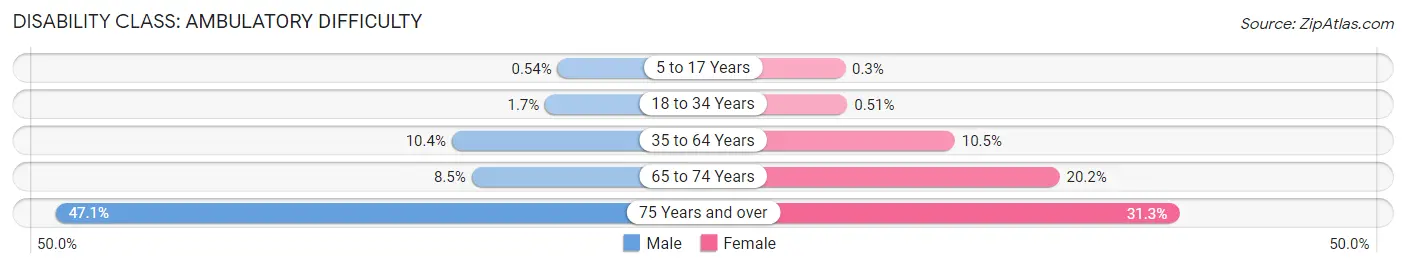
| Age Bracket | Male | Female |
| 5 to 17 Years | 41 (0.5%) | 26 (0.3%) |
| 18 to 34 Years | 156 (1.7%) | 56 (0.5%) |
| 35 to 64 Years | 1,756 (10.4%) | 1,764 (10.5%) |
| 65 to 74 Years | 263 (8.5%) | 724 (20.2%) |
| 75 Years and over | 659 (47.1%) | 779 (31.3%) |
Disability Class: Self-Care Difficulty
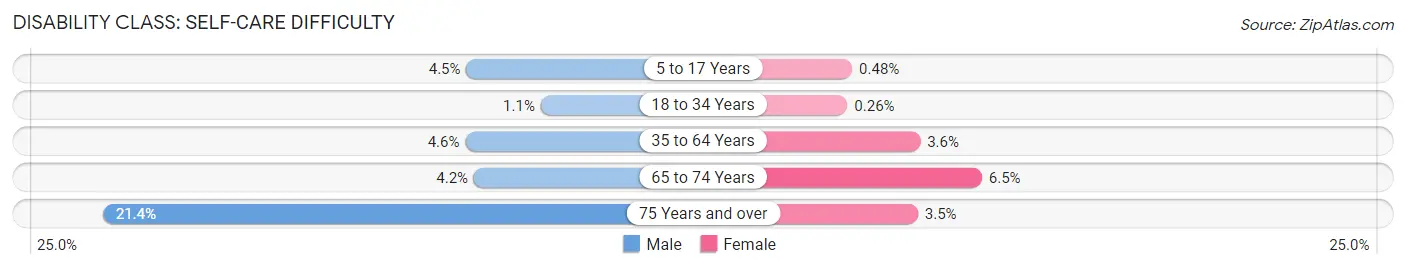
| Age Bracket | Male | Female |
| 5 to 17 Years | 340 (4.5%) | 41 (0.5%) |
| 18 to 34 Years | 97 (1.1%) | 28 (0.3%) |
| 35 to 64 Years | 772 (4.5%) | 613 (3.6%) |
| 65 to 74 Years | 128 (4.2%) | 233 (6.5%) |
| 75 Years and over | 299 (21.4%) | 88 (3.5%) |
Technology Access in Trenton
Computing Device Access in Trenton
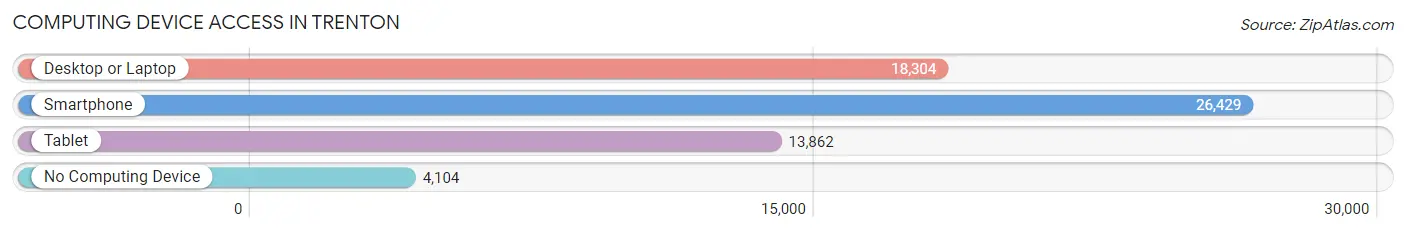
| Device Type | # Households | % Households |
| Desktop or Laptop | 18,304 | 56.9% |
| Smartphone | 26,429 | 82.2% |
| Tablet | 13,862 | 43.1% |
| No Computing Device | 4,104 | 12.8% |
| Total | 32,165 | 100.0% |
Internet Access in Trenton
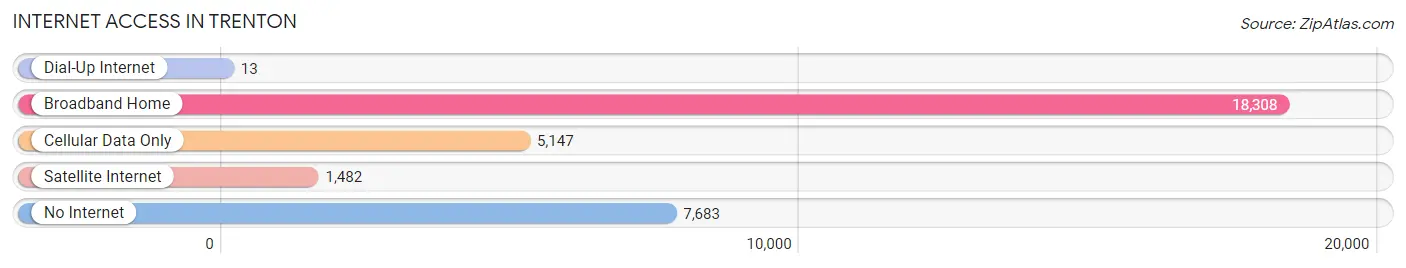
| Internet Type | # Households | % Households |
| Dial-Up Internet | 13 | 0.0% |
| Broadband Home | 18,308 | 56.9% |
| Cellular Data Only | 5,147 | 16.0% |
| Satellite Internet | 1,482 | 4.6% |
| No Internet | 7,683 | 23.9% |
| Total | 32,165 | 100.0% |
Trenton Summary
Trenton is the capital of the U.S. state of New Jersey and the county seat of Mercer County. It is located near the Delaware River and is part of the Delaware Valley metropolitan area. As of the 2010 United States Census, Trenton had a population of 84,913, making it the state's tenth-largest municipality. The Census Bureau estimated that the city's population was 84,034 in 2019.
History
Trenton was founded in 1719 by William Trent, a merchant from Philadelphia. The city was originally called "Trent-towne" and was incorporated in 1792. During the American Revolutionary War, Trenton was the site of the Battle of Trenton in 1776, which was a major victory for the Continental Army. The city was also the site of the Battle of Trenton in 1777, which was a major victory for the British.
Trenton was an important industrial center in the 19th century, with several ironworks, paper mills, and textile mills. The city was also a major transportation hub, with several railroads and canals connecting it to other cities in the region.
Trenton was the site of the first public library in the United States, established in 1750. The city was also the site of the first free public school in the United States, established in 1790.
Geography
Trenton is located in central New Jersey, at the confluence of the Delaware and Raritan rivers. The city has a total area of 8.3 square miles, of which 8.2 square miles is land and 0.1 square miles is water.
Trenton is located in the humid subtropical climate zone, with hot, humid summers and cold, wet winters. The average annual temperature is 57°F, and the average annual precipitation is 44 inches.
Economy
Trenton's economy is largely based on government and manufacturing. The city is home to several state government offices, including the New Jersey State House and the New Jersey State Library. The city is also home to several manufacturing companies, including the Trenton Steel Company and the Trenton Ceramics Company.
Trenton is also home to several educational institutions, including the College of New Jersey, Thomas Edison State University, and Mercer County Community College.
Demographics
As of the 2010 United States Census, there were 84,913 people, 33,845 households, and 19,845 families residing in Trenton. The population density was 10,323.3 people per square mile. The racial makeup of the city was 44.3% White, 39.3% African American, 0.4% Native American, 4.2% Asian, 0.1% Pacific Islander, 8.7% from other races, and 2.9% from two or more races. Hispanic or Latino of any race were 20.2% of the population.
The median income for a household in Trenton was $33,941, and the median income for a family was $41,845. The per capita income for the city was $19,845. About 22.2% of families and 25.7% of the population were below the poverty line, including 36.2% of those under age 18 and 15.2% of those age 65 or over.
Common Questions
What is Per Capita Income in Trenton?
Per Capita income in Trenton is $27,565.
What is the Median Family Income in Trenton?
Median Family Income in Trenton is $59,042.
What is the Median Household income in Trenton?
Median Household Income in Trenton is $44,444.
What is Income or Wage Gap in Trenton?
Income or Wage Gap in Trenton is 3.6%.
Women in Trenton earn 96.4 cents for every dollar earned by a man.
What is Family Income Deficit in Trenton?
Family Income Deficit in Trenton is $11,546.
Families that are below poverty line in Trenton earn $11,546 less on average than the poverty threshold level.
What is Inequality or Gini Index in Trenton?
Inequality or Gini Index in Trenton is 0.56.
What is the Total Population of Trenton?
Total Population of Trenton is 90,055.
What is the Total Male Population of Trenton?
Total Male Population of Trenton is 43,248.
What is the Total Female Population of Trenton?
Total Female Population of Trenton is 46,807.
What is the Ratio of Males per 100 Females in Trenton?
There are 92.40 Males per 100 Females in Trenton.
What is the Ratio of Females per 100 Males in Trenton?
There are 108.23 Females per 100 Males in Trenton.
What is the Median Population Age in Trenton?
Median Population Age in Trenton is 35.8 Years.
What is the Average Family Size in Trenton
Average Family Size in Trenton is 3.6 People.
What is the Average Household Size in Trenton
Average Household Size in Trenton is 2.7 People.
How Large is the Labor Force in Trenton?
There are 40,447 People in the Labor Forcein in Trenton.
What is the Percentage of People in the Labor Force in Trenton?
59.1% of People are in the Labor Force in Trenton.
What is the Unemployment Rate in Trenton?
Unemployment Rate in Trenton is 10.2%.