Pine Ridge at Crestwood, NJ Map & Demographics
Pine Ridge at Crestwood Map
Pine Ridge at Crestwood Overview
$37,744
PER CAPITA INCOME
$62,140
AVG FAMILY INCOME
$56,750
AVG HOUSEHOLD INCOME
5.9%
WAGE / INCOME GAP [ % ]
94.1¢/ $1
WAGE / INCOME GAP [ $ ]
0.37
INEQUALITY / GINI INDEX
2,674
TOTAL POPULATION
1,312
MALE POPULATION
1,362
FEMALE POPULATION
96.33
MALES / 100 FEMALES
103.81
FEMALES / 100 MALES
67.6
MEDIAN AGE
2.1
AVG FAMILY SIZE
1.6
AVG HOUSEHOLD SIZE
909
LABOR FORCE [ PEOPLE ]
34.0%
PERCENT IN LABOR FORCE
9.9%
UNEMPLOYMENT RATE
Income in Pine Ridge at Crestwood
Income Overview in Pine Ridge at Crestwood
Per Capita Income in Pine Ridge at Crestwood is $37,744, while median incomes of families and households are $62,140 and $56,750 respectively.
| Characteristic | Number | Measure |
| Per Capita Income | 2,674 | $37,744 |
| Median Family Income | 831 | $62,140 |
| Mean Family Income | 831 | $76,573 |
| Median Household Income | 1,643 | $56,750 |
| Mean Household Income | 1,643 | $60,183 |
| Income Deficit | 831 | $0 |
| Wage / Income Gap (%) | 2,674 | 5.87% |
| Wage / Income Gap ($) | 2,674 | 94.13¢ per $1 |
| Gini / Inequality Index | 2,674 | 0.37 |
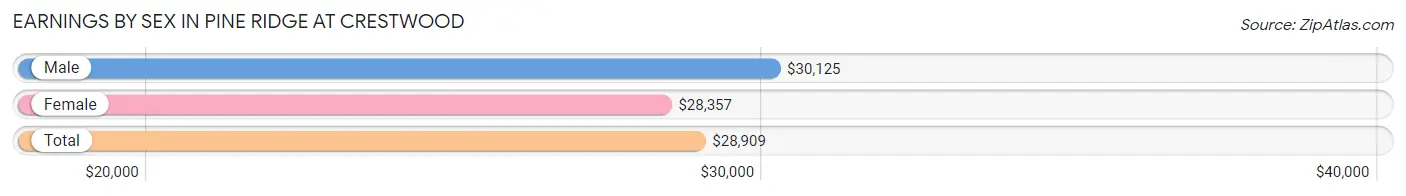
Earnings by Sex in Pine Ridge at Crestwood
Average Earnings in Pine Ridge at Crestwood are $28,909, $30,125 for men and $28,357 for women, a difference of 5.9%.
| Sex | Number | Average Earnings |
| Male | 487 (47.0%) | $30,125 |
| Female | 549 (53.0%) | $28,357 |
| Total | 1,036 (100.0%) | $28,909 |
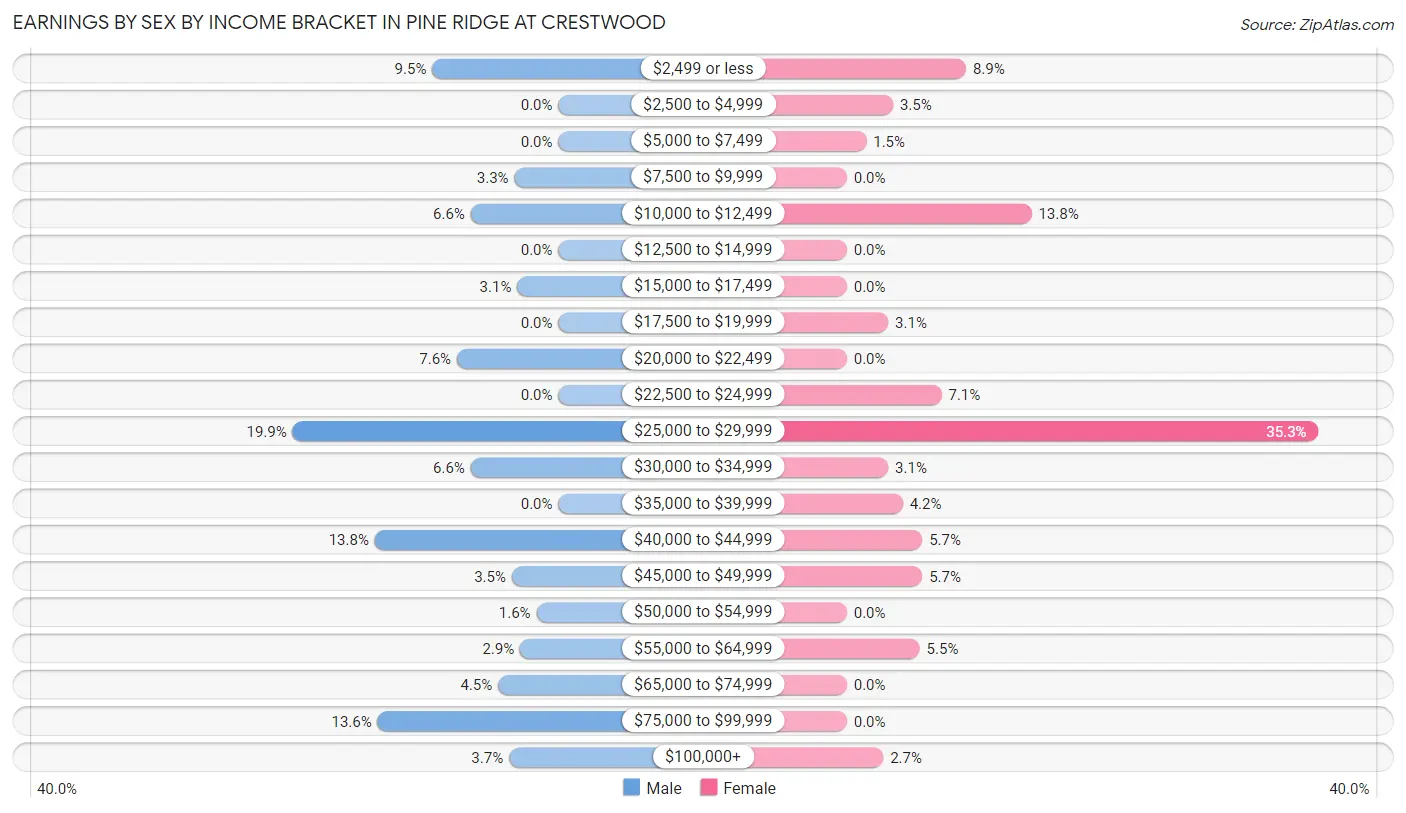
Earnings by Sex by Income Bracket in Pine Ridge at Crestwood
The most common earnings brackets in Pine Ridge at Crestwood are $25,000 to $29,999 for men (97 | 19.9%) and $25,000 to $29,999 for women (194 | 35.3%).
| Income | Male | Female |
| $2,499 or less | 46 (9.5%) | 49 (8.9%) |
| $2,500 to $4,999 | 0 (0.0%) | 19 (3.5%) |
| $5,000 to $7,499 | 0 (0.0%) | 8 (1.5%) |
| $7,500 to $9,999 | 16 (3.3%) | 0 (0.0%) |
| $10,000 to $12,499 | 32 (6.6%) | 76 (13.8%) |
| $12,500 to $14,999 | 0 (0.0%) | 0 (0.0%) |
| $15,000 to $17,499 | 15 (3.1%) | 0 (0.0%) |
| $17,500 to $19,999 | 0 (0.0%) | 17 (3.1%) |
| $20,000 to $22,499 | 37 (7.6%) | 0 (0.0%) |
| $22,500 to $24,999 | 0 (0.0%) | 39 (7.1%) |
| $25,000 to $29,999 | 97 (19.9%) | 194 (35.3%) |
| $30,000 to $34,999 | 32 (6.6%) | 17 (3.1%) |
| $35,000 to $39,999 | 0 (0.0%) | 23 (4.2%) |
| $40,000 to $44,999 | 67 (13.8%) | 31 (5.7%) |
| $45,000 to $49,999 | 17 (3.5%) | 31 (5.7%) |
| $50,000 to $54,999 | 8 (1.6%) | 0 (0.0%) |
| $55,000 to $64,999 | 14 (2.9%) | 30 (5.5%) |
| $65,000 to $74,999 | 22 (4.5%) | 0 (0.0%) |
| $75,000 to $99,999 | 66 (13.6%) | 0 (0.0%) |
| $100,000+ | 18 (3.7%) | 15 (2.7%) |
| Total | 487 (100.0%) | 549 (100.0%) |
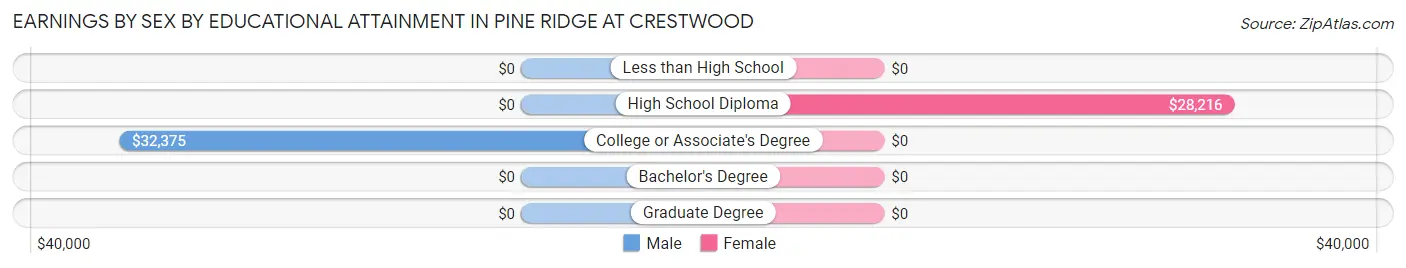
Earnings by Sex by Educational Attainment in Pine Ridge at Crestwood
Average earnings in Pine Ridge at Crestwood are $30,125 for men and $28,357 for women, a difference of 5.9%. Men with an educational attainment of college or associate's degree enjoy the highest average annual earnings of $32,375, while those with college or associate's degree education earn the least with $32,375. Women with an educational attainment of high school diploma earn the most with the average annual earnings of $28,216, while those with high school diploma education have the smallest earnings of $28,216.
| Educational Attainment | Male Income | Female Income |
| Less than High School | - | - |
| High School Diploma | - | - |
| College or Associate's Degree | $32,375 | $0 |
| Bachelor's Degree | - | - |
| Graduate Degree | - | - |
| Total | $30,125 | $28,357 |
Family Income in Pine Ridge at Crestwood
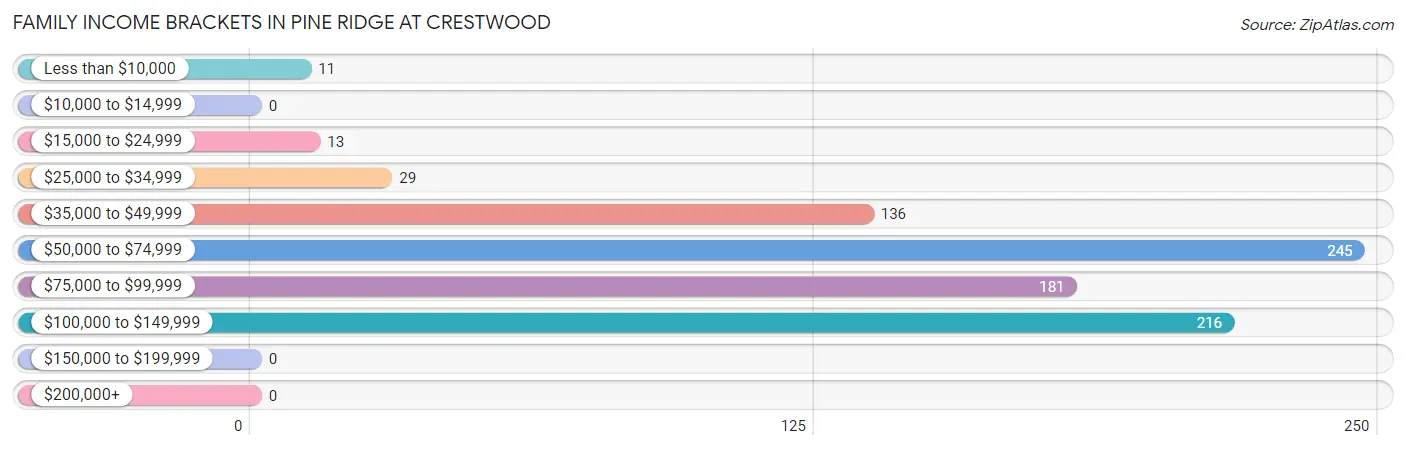
Family Income Brackets in Pine Ridge at Crestwood
According to the Pine Ridge at Crestwood family income data, there are 245 families falling into the $50,000 to $74,999 income range, which is the most common income bracket and makes up 29.5% of all families.
| Income Bracket | # Families | % Families |
| Less than $10,000 | 11 | 1.3% |
| $10,000 to $14,999 | 0 | 0.0% |
| $15,000 to $24,999 | 13 | 1.6% |
| $25,000 to $34,999 | 29 | 3.5% |
| $35,000 to $49,999 | 136 | 16.4% |
| $50,000 to $74,999 | 245 | 29.5% |
| $75,000 to $99,999 | 181 | 21.8% |
| $100,000 to $149,999 | 216 | 26.0% |
| $150,000 to $199,999 | 0 | 0.0% |
| $200,000+ | 0 | 0.0% |
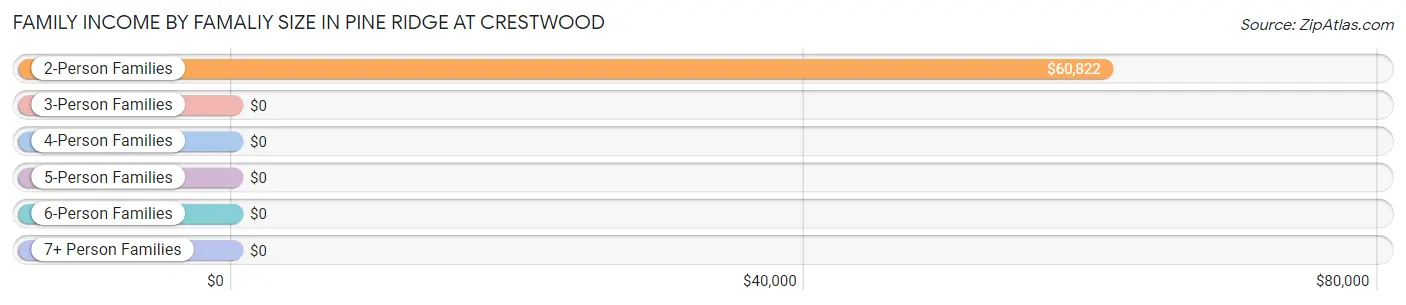
Family Income by Famaliy Size in Pine Ridge at Crestwood
2-person families (754 | 90.7%) account for the highest median family income in Pine Ridge at Crestwood with $60,822 per family, while 2-person families (754 | 90.7%) have the highest median income of $30,411 per family member.
| Income Bracket | # Families | Median Income |
| 2-Person Families | 754 (90.7%) | $60,822 |
| 3-Person Families | 77 (9.3%) | $0 |
| 4-Person Families | 0 (0.0%) | $0 |
| 5-Person Families | 0 (0.0%) | $0 |
| 6-Person Families | 0 (0.0%) | $0 |
| 7+ Person Families | 0 (0.0%) | $0 |
| Total | 831 (100.0%) | $62,140 |
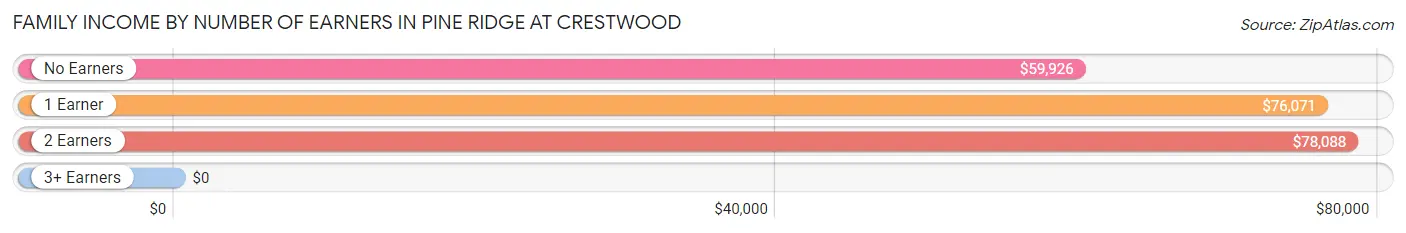
Family Income by Number of Earners in Pine Ridge at Crestwood
| Number of Earners | # Families | Median Income |
| No Earners | 419 (50.4%) | $59,926 |
| 1 Earner | 284 (34.2%) | $76,071 |
| 2 Earners | 64 (7.7%) | $78,088 |
| 3+ Earners | 64 (7.7%) | $0 |
| Total | 831 (100.0%) | $62,140 |
Household Income in Pine Ridge at Crestwood
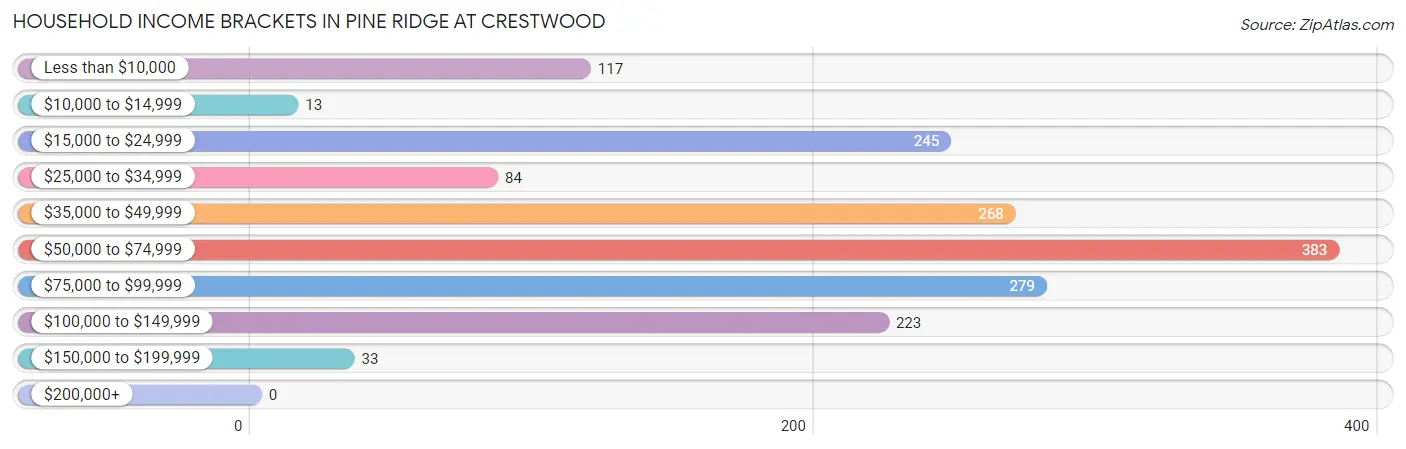
Household Income Brackets in Pine Ridge at Crestwood
With 383 households falling in the category, the $50,000 to $74,999 income range is the most frequent in Pine Ridge at Crestwood, accounting for 23.3% of all households.
| Income Bracket | # Households | % Households |
| Less than $10,000 | 117 | 7.1% |
| $10,000 to $14,999 | 13 | 0.8% |
| $15,000 to $24,999 | 245 | 14.9% |
| $25,000 to $34,999 | 84 | 5.1% |
| $35,000 to $49,999 | 268 | 16.3% |
| $50,000 to $74,999 | 383 | 23.3% |
| $75,000 to $99,999 | 279 | 17.0% |
| $100,000 to $149,999 | 223 | 13.6% |
| $150,000 to $199,999 | 33 | 2.0% |
| $200,000+ | 0 | 0.0% |
Household Income by Householder Age in Pine Ridge at Crestwood
The median household income in Pine Ridge at Crestwood is $56,750, with the highest median household income of $60,875 found in the 65+ years age bracket for the primary householder. A total of 1,032 households (62.8%) fall into this category.
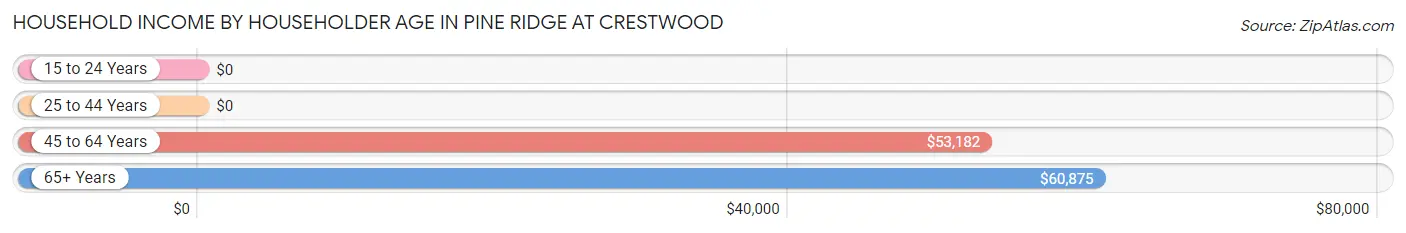
| Income Bracket | # Households | Median Income |
| 15 to 24 Years | 0 (0.0%) | $0 |
| 25 to 44 Years | 19 (1.2%) | $0 |
| 45 to 64 Years | 592 (36.0%) | $53,182 |
| 65+ Years | 1,032 (62.8%) | $60,875 |
| Total | 1,643 (100.0%) | $56,750 |
Poverty in Pine Ridge at Crestwood
Income Below Poverty by Sex and Age in Pine Ridge at Crestwood
With 10.7% poverty level for males and 7.0% for females among the residents of Pine Ridge at Crestwood, 55 to 64 year old males and 45 to 54 year old females are the most vulnerable to poverty, with 92 males (18.7%) and 12 females (41.4%) in their respective age groups living below the poverty level.
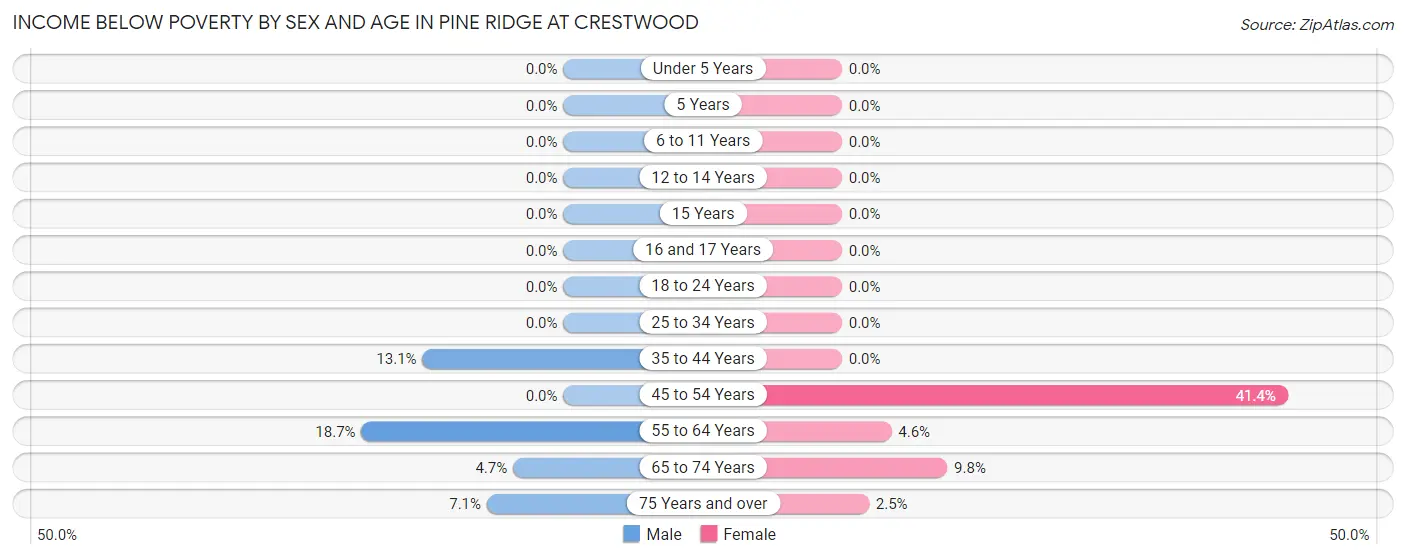
| Age Bracket | Male | Female |
| Under 5 Years | 0 (0.0%) | 0 (0.0%) |
| 5 Years | 0 (0.0%) | 0 (0.0%) |
| 6 to 11 Years | 0 (0.0%) | 0 (0.0%) |
| 12 to 14 Years | 0 (0.0%) | 0 (0.0%) |
| 15 Years | 0 (0.0%) | 0 (0.0%) |
| 16 and 17 Years | 0 (0.0%) | 0 (0.0%) |
| 18 to 24 Years | 0 (0.0%) | 0 (0.0%) |
| 25 to 34 Years | 0 (0.0%) | 0 (0.0%) |
| 35 to 44 Years | 14 (13.1%) | 0 (0.0%) |
| 45 to 54 Years | 0 (0.0%) | 12 (41.4%) |
| 55 to 64 Years | 92 (18.7%) | 18 (4.6%) |
| 65 to 74 Years | 22 (4.7%) | 57 (9.8%) |
| 75 Years and over | 13 (7.1%) | 9 (2.5%) |
| Total | 141 (10.7%) | 96 (7.0%) |
Income Above Poverty by Sex and Age in Pine Ridge at Crestwood
According to the poverty statistics in Pine Ridge at Crestwood, males aged 25 to 34 years and females aged 75 years and over are the age groups that are most secure financially, with 100.0% of males and 97.5% of females in these age groups living above the poverty line.
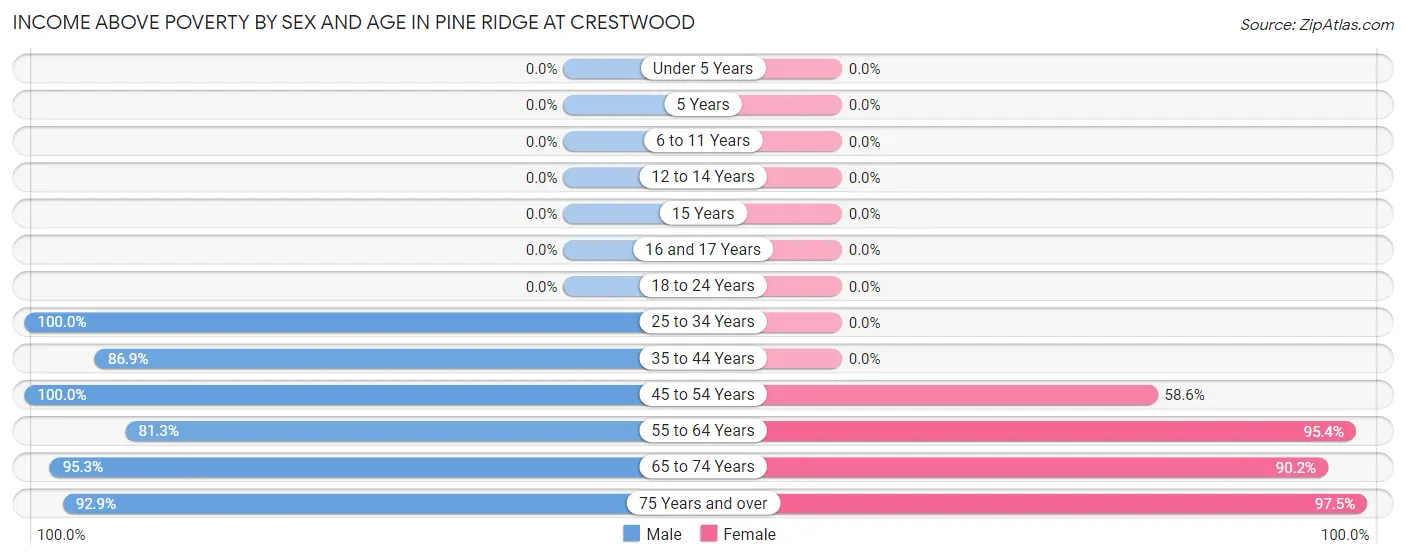
| Age Bracket | Male | Female |
| Under 5 Years | 0 (0.0%) | 0 (0.0%) |
| 5 Years | 0 (0.0%) | 0 (0.0%) |
| 6 to 11 Years | 0 (0.0%) | 0 (0.0%) |
| 12 to 14 Years | 0 (0.0%) | 0 (0.0%) |
| 15 Years | 0 (0.0%) | 0 (0.0%) |
| 16 and 17 Years | 0 (0.0%) | 0 (0.0%) |
| 18 to 24 Years | 0 (0.0%) | 0 (0.0%) |
| 25 to 34 Years | 47 (100.0%) | 0 (0.0%) |
| 35 to 44 Years | 93 (86.9%) | 0 (0.0%) |
| 45 to 54 Years | 13 (100.0%) | 17 (58.6%) |
| 55 to 64 Years | 399 (81.3%) | 373 (95.4%) |
| 65 to 74 Years | 449 (95.3%) | 526 (90.2%) |
| 75 Years and over | 170 (92.9%) | 350 (97.5%) |
| Total | 1,171 (89.2%) | 1,266 (92.9%) |
Income Below Poverty Among Married-Couple Families in Pine Ridge at Crestwood
The poverty statistics for married-couple families in Pine Ridge at Crestwood show that 1.8% or 11 of the total 597 families live below the poverty line. Families with no children have the highest poverty rate of 1.8%, comprising of 11 families. On the other hand, families with no children have the lowest poverty rate of 1.8%, which includes 11 families.
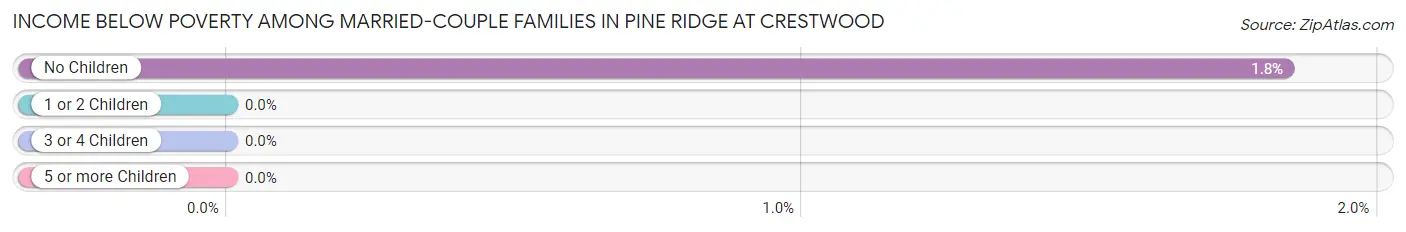
| Children | Above Poverty | Below Poverty |
| No Children | 586 (98.2%) | 11 (1.8%) |
| 1 or 2 Children | 0 (0.0%) | 0 (0.0%) |
| 3 or 4 Children | 0 (0.0%) | 0 (0.0%) |
| 5 or more Children | 0 (0.0%) | 0 (0.0%) |
| Total | 586 (98.2%) | 11 (1.8%) |
Income Below Poverty Among Single-Parent Households in Pine Ridge at Crestwood
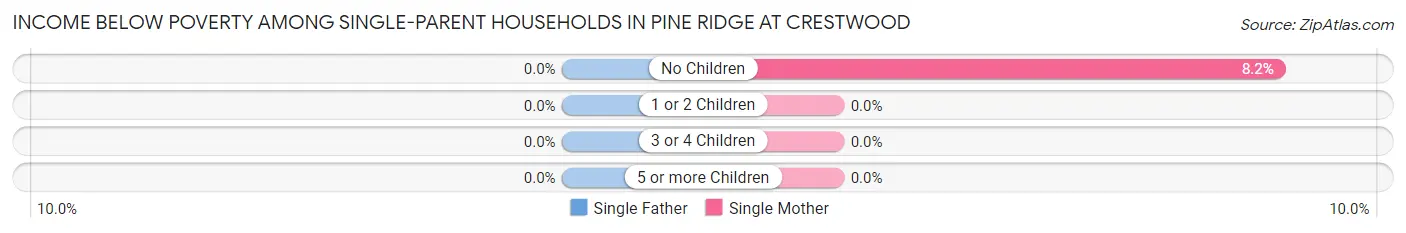
| Children | Single Father | Single Mother |
| No Children | 0 (0.0%) | 13 (8.2%) |
| 1 or 2 Children | 0 (0.0%) | 0 (0.0%) |
| 3 or 4 Children | 0 (0.0%) | 0 (0.0%) |
| 5 or more Children | 0 (0.0%) | 0 (0.0%) |
| Total | 0 (0.0%) | 13 (8.2%) |
Income Below Poverty Among Married-Couple vs Single-Parent Households in Pine Ridge at Crestwood
The poverty data for Pine Ridge at Crestwood shows that 11 of the married-couple family households (1.8%) and 13 of the single-parent households (5.6%) are living below the poverty level. Within the married-couple family households, those with no children have the highest poverty rate, with 11 households (1.8%) falling below the poverty line. Among the single-parent households, those with no children have the highest poverty rate, with 13 household (5.6%) living below poverty.
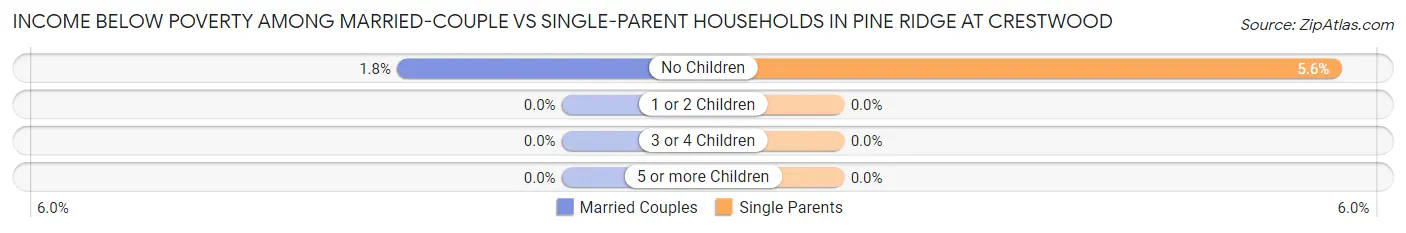
| Children | Married-Couple Families | Single-Parent Households |
| No Children | 11 (1.8%) | 13 (5.6%) |
| 1 or 2 Children | 0 (0.0%) | 0 (0.0%) |
| 3 or 4 Children | 0 (0.0%) | 0 (0.0%) |
| 5 or more Children | 0 (0.0%) | 0 (0.0%) |
| Total | 11 (1.8%) | 13 (5.6%) |
Race in Pine Ridge at Crestwood
The most populous races in Pine Ridge at Crestwood are White / Caucasian (2,550 | 95.4%), Asian (72 | 2.7%), and Hispanic or Latino (41 | 1.5%).
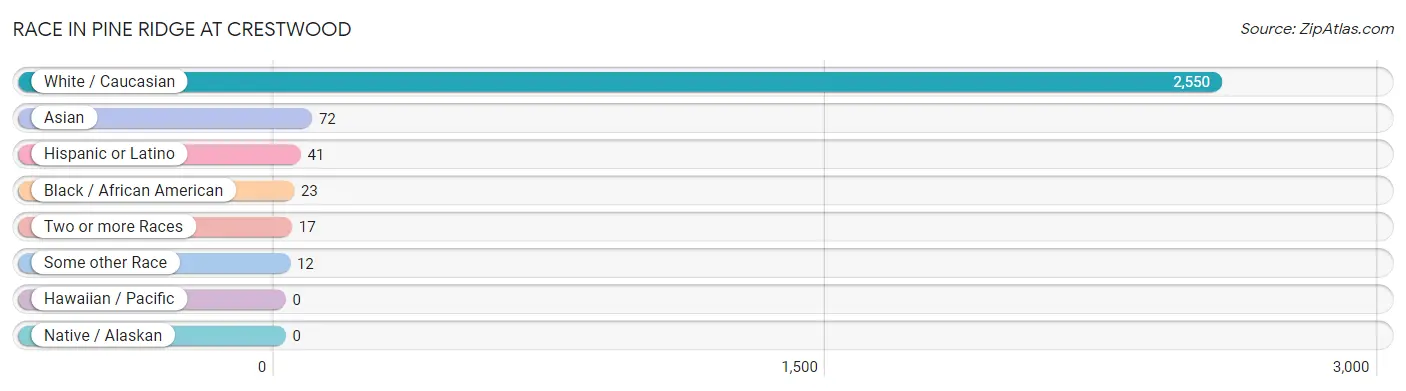
| Race | # Population | % Population |
| Asian | 72 | 2.7% |
| Black / African American | 23 | 0.9% |
| Hawaiian / Pacific | 0 | 0.0% |
| Hispanic or Latino | 41 | 1.5% |
| Native / Alaskan | 0 | 0.0% |
| White / Caucasian | 2,550 | 95.4% |
| Two or more Races | 17 | 0.6% |
| Some other Race | 12 | 0.4% |
| Total | 2,674 | 100.0% |
Ancestry in Pine Ridge at Crestwood
The most populous ancestries reported in Pine Ridge at Crestwood are German (791 | 29.6%), Irish (679 | 25.4%), Italian (539 | 20.2%), American (262 | 9.8%), and English (253 | 9.5%), together accounting for 94.4% of all Pine Ridge at Crestwood residents.
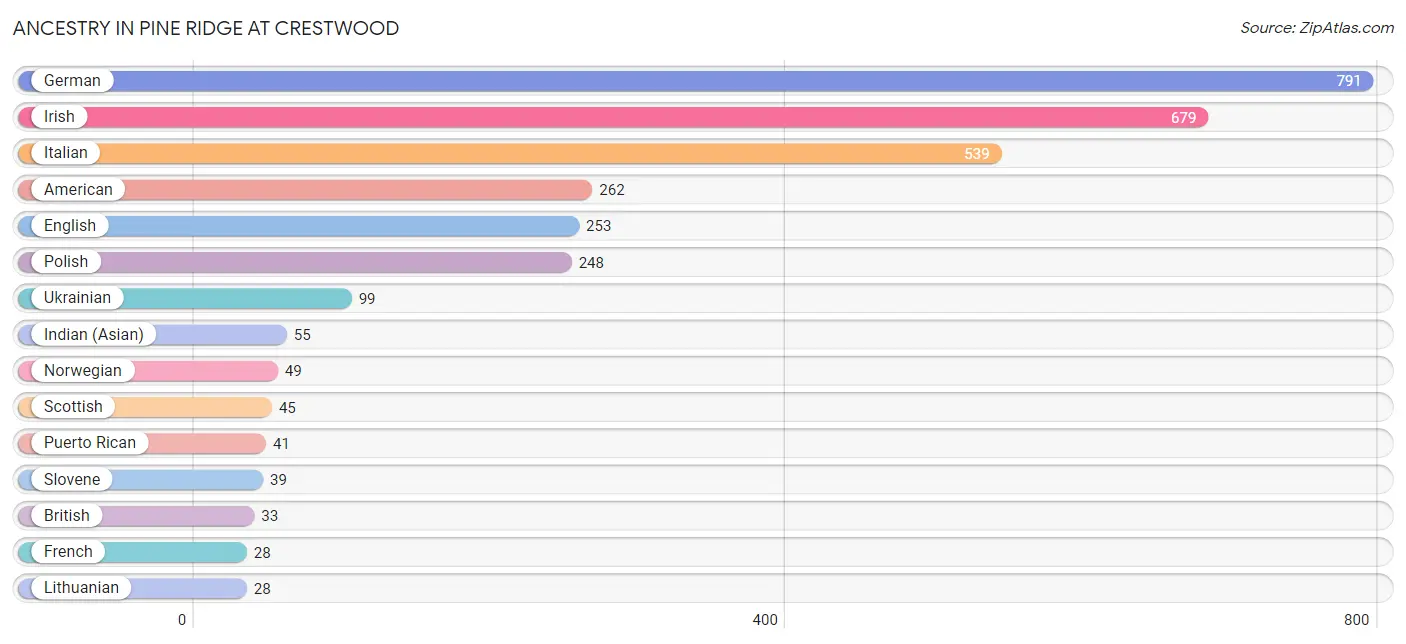
| Ancestry | # Population | % Population |
| Alsatian | 15 | 0.6% |
| American | 262 | 9.8% |
| Austrian | 26 | 1.0% |
| Bhutanese | 17 | 0.6% |
| British | 33 | 1.2% |
| Canadian | 9 | 0.3% |
| Czech | 12 | 0.4% |
| Dutch | 17 | 0.6% |
| Eastern European | 13 | 0.5% |
| English | 253 | 9.5% |
| European | 17 | 0.6% |
| French | 28 | 1.1% |
| French Canadian | 19 | 0.7% |
| German | 791 | 29.6% |
| Greek | 11 | 0.4% |
| Hungarian | 19 | 0.7% |
| Indian (Asian) | 55 | 2.1% |
| Irish | 679 | 25.4% |
| Italian | 539 | 20.2% |
| Lithuanian | 28 | 1.1% |
| Norwegian | 49 | 1.8% |
| Pennsylvania German | 9 | 0.3% |
| Polish | 248 | 9.3% |
| Portuguese | 15 | 0.6% |
| Puerto Rican | 41 | 1.5% |
| Romanian | 8 | 0.3% |
| Russian | 8 | 0.3% |
| Scottish | 45 | 1.7% |
| Slovak | 25 | 0.9% |
| Slovene | 39 | 1.5% |
| Ukrainian | 99 | 3.7% |
| Welsh | 15 | 0.6% | View All 32 Rows |
Immigrants in Pine Ridge at Crestwood
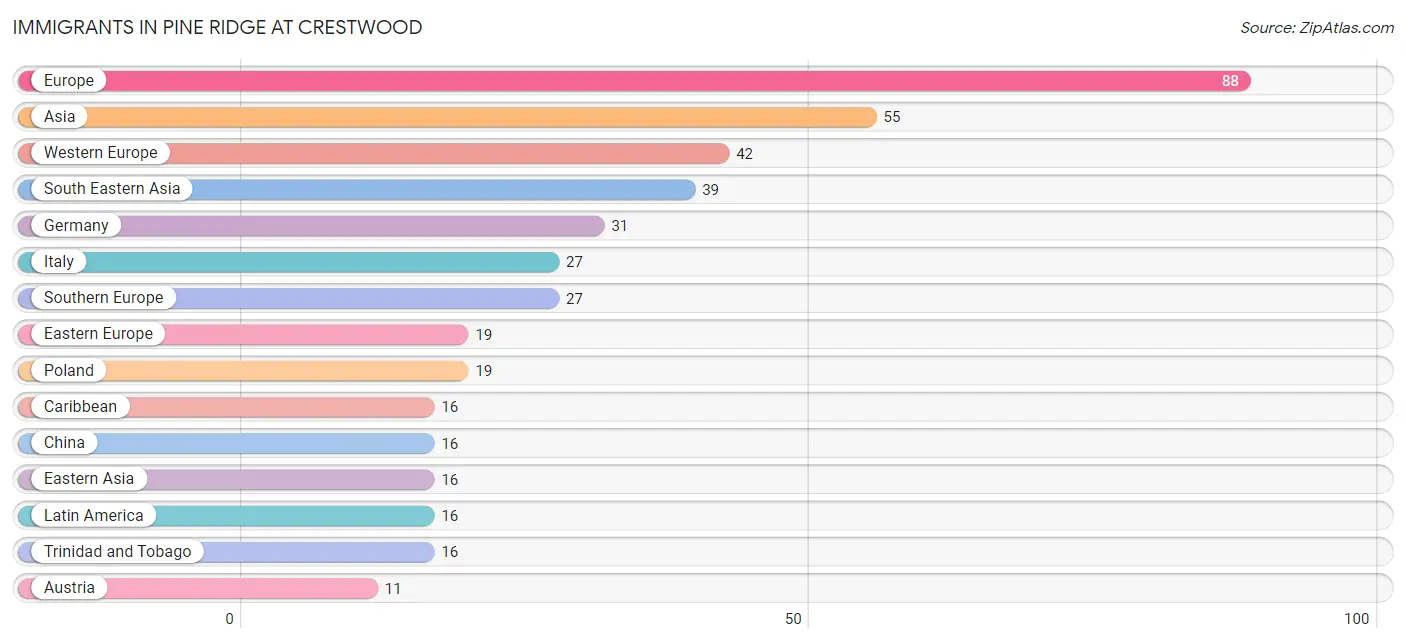
The most numerous immigrant groups reported in Pine Ridge at Crestwood came from Europe (88 | 3.3%), Asia (55 | 2.1%), Western Europe (42 | 1.6%), South Eastern Asia (39 | 1.5%), and Germany (31 | 1.2%), together accounting for 9.5% of all Pine Ridge at Crestwood residents.
| Immigration Origin | # Population | % Population |
| Asia | 55 | 2.1% |
| Austria | 11 | 0.4% |
| Caribbean | 16 | 0.6% |
| China | 16 | 0.6% |
| Eastern Asia | 16 | 0.6% |
| Eastern Europe | 19 | 0.7% |
| Europe | 88 | 3.3% |
| Germany | 31 | 1.2% |
| Italy | 27 | 1.0% |
| Latin America | 16 | 0.6% |
| Poland | 19 | 0.7% |
| South Eastern Asia | 39 | 1.5% |
| Southern Europe | 27 | 1.0% |
| Trinidad and Tobago | 16 | 0.6% |
| Western Europe | 42 | 1.6% | View All 15 Rows |
Sex and Age in Pine Ridge at Crestwood
Sex and Age in Pine Ridge at Crestwood
The most populous age groups in Pine Ridge at Crestwood are 55 to 59 Years (292 | 22.3%) for men and 65 to 69 Years (360 | 26.4%) for women.
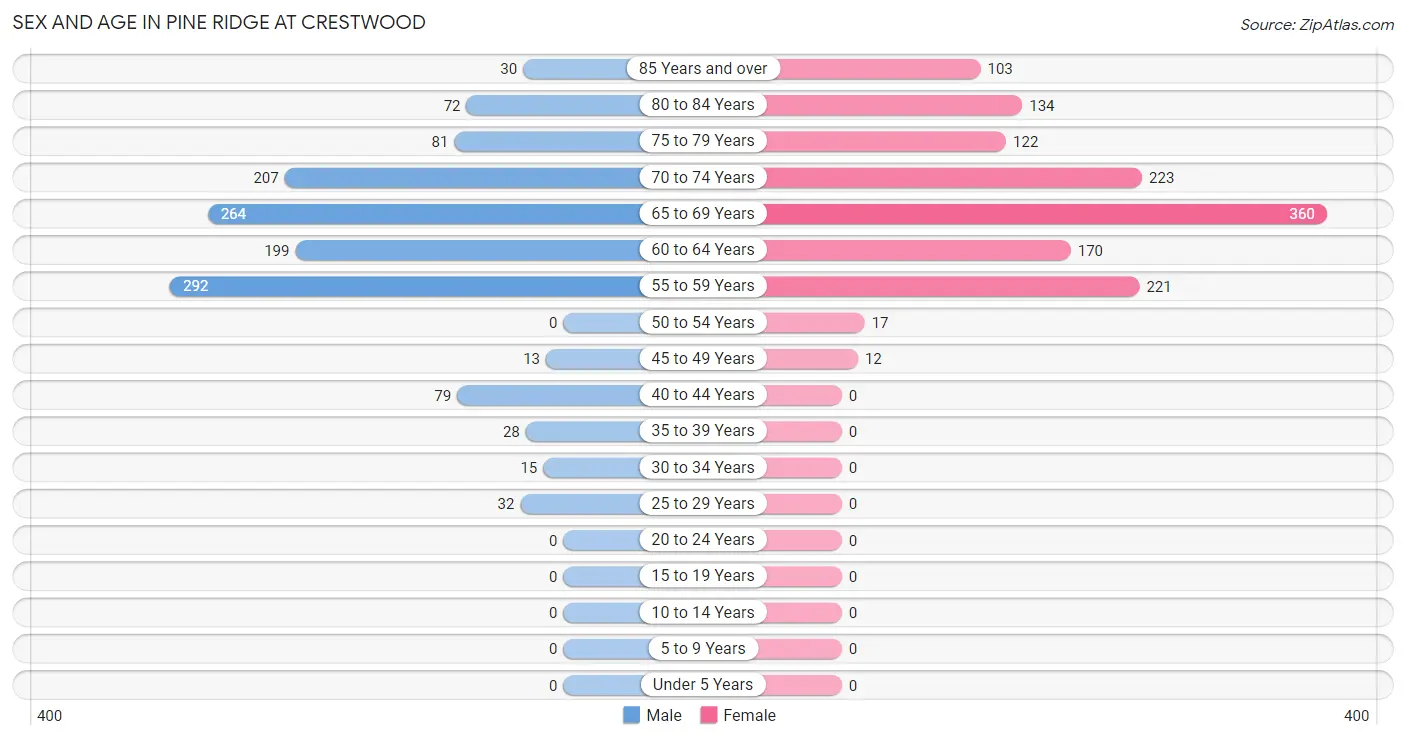
| Age Bracket | Male | Female |
| Under 5 Years | 0 (0.0%) | 0 (0.0%) |
| 5 to 9 Years | 0 (0.0%) | 0 (0.0%) |
| 10 to 14 Years | 0 (0.0%) | 0 (0.0%) |
| 15 to 19 Years | 0 (0.0%) | 0 (0.0%) |
| 20 to 24 Years | 0 (0.0%) | 0 (0.0%) |
| 25 to 29 Years | 32 (2.4%) | 0 (0.0%) |
| 30 to 34 Years | 15 (1.1%) | 0 (0.0%) |
| 35 to 39 Years | 28 (2.1%) | 0 (0.0%) |
| 40 to 44 Years | 79 (6.0%) | 0 (0.0%) |
| 45 to 49 Years | 13 (1.0%) | 12 (0.9%) |
| 50 to 54 Years | 0 (0.0%) | 17 (1.3%) |
| 55 to 59 Years | 292 (22.3%) | 221 (16.2%) |
| 60 to 64 Years | 199 (15.2%) | 170 (12.5%) |
| 65 to 69 Years | 264 (20.1%) | 360 (26.4%) |
| 70 to 74 Years | 207 (15.8%) | 223 (16.4%) |
| 75 to 79 Years | 81 (6.2%) | 122 (9.0%) |
| 80 to 84 Years | 72 (5.5%) | 134 (9.8%) |
| 85 Years and over | 30 (2.3%) | 103 (7.6%) |
| Total | 1,312 (100.0%) | 1,362 (100.0%) |
Families and Households in Pine Ridge at Crestwood
Median Family Size in Pine Ridge at Crestwood
The median family size in Pine Ridge at Crestwood is 2.13 persons per family, with single male/father families (76 | 9.1%) accounting for the largest median family size of 2.18 persons per family. On the other hand, married-couple families (597 | 71.8%) represent the smallest median family size with 2.11 persons per family.
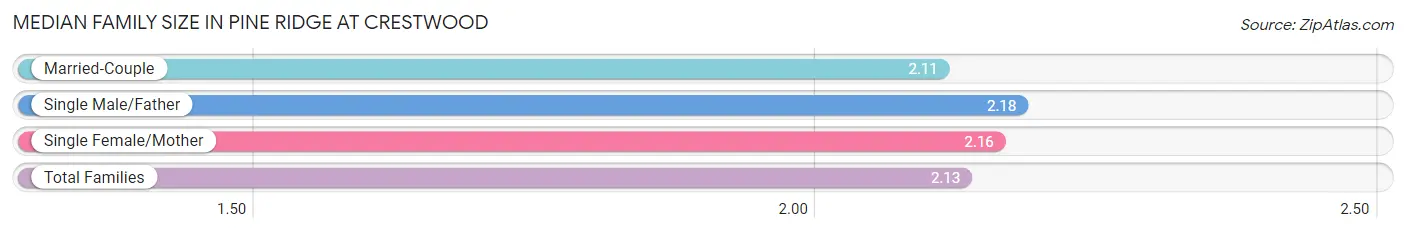
| Family Type | # Families | Family Size |
| Married-Couple | 597 (71.8%) | 2.11 |
| Single Male/Father | 76 (9.1%) | 2.18 |
| Single Female/Mother | 158 (19.0%) | 2.16 |
| Total Families | 831 (100.0%) | 2.13 |
Median Household Size in Pine Ridge at Crestwood
The median household size in Pine Ridge at Crestwood is 1.63 persons per household, with single male/father households (76 | 4.6%) accounting for the largest median household size of 2.18 persons per household. non-family households (812 | 49.4%) represent the smallest median household size with 1.12 persons per household.
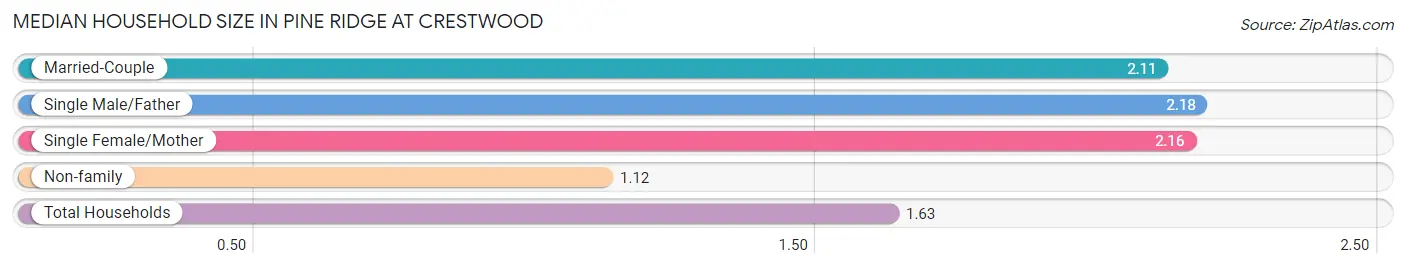
| Household Type | # Households | Household Size |
| Married-Couple | 597 (36.3%) | 2.11 |
| Single Male/Father | 76 (4.6%) | 2.18 |
| Single Female/Mother | 158 (9.6%) | 2.16 |
| Non-family | 812 (49.4%) | 1.12 |
| Total Households | 1,643 (100.0%) | 1.63 |
Household Size by Marriage Status in Pine Ridge at Crestwood
Out of a total of 1,643 households in Pine Ridge at Crestwood, 831 (50.6%) are family households, while 812 (49.4%) are nonfamily households. The most numerous type of family households are 2-person households, comprising 754, and the most common type of nonfamily households are 1-person households, comprising 719.
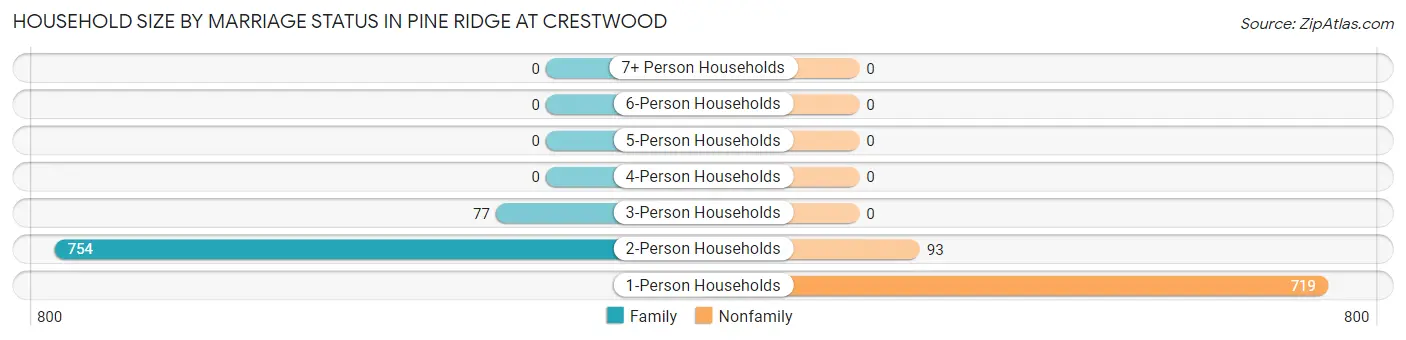
| Household Size | Family Households | Nonfamily Households |
| 1-Person Households | - | 719 (43.8%) |
| 2-Person Households | 754 (45.9%) | 93 (5.7%) |
| 3-Person Households | 77 (4.7%) | 0 (0.0%) |
| 4-Person Households | 0 (0.0%) | 0 (0.0%) |
| 5-Person Households | 0 (0.0%) | 0 (0.0%) |
| 6-Person Households | 0 (0.0%) | 0 (0.0%) |
| 7+ Person Households | 0 (0.0%) | 0 (0.0%) |
| Total | 831 (50.6%) | 812 (49.4%) |
Female Fertility in Pine Ridge at Crestwood
Fertility by Age in Pine Ridge at Crestwood
| Age Bracket | Women with Births | Births / 1,000 Women |
| 15 to 19 years | 0 (0.0%) | 0.0 |
| 20 to 34 years | 0 (0.0%) | 0.0 |
| 35 to 50 years | 0 (0.0%) | 0.0 |
| Total | 0 (0.0%) | 0.0 |
Fertility by Age by Marriage Status in Pine Ridge at Crestwood
| Age Bracket | Married | Unmarried |
| 15 to 19 years | 0 (0.0%) | 0 (0.0%) |
| 20 to 34 years | 0 (0.0%) | 0 (0.0%) |
| 35 to 50 years | 0 (0.0%) | 0 (0.0%) |
| Total | 0 (0.0%) | 0 (0.0%) |
Fertility by Education in Pine Ridge at Crestwood
| Educational Attainment | Women with Births | Births / 1,000 Women |
| Less than High School | 0 (0.0%) | 0.0 |
| High School Diploma | 0 (0.0%) | 0.0 |
| College or Associate's Degree | 0 (0.0%) | 0.0 |
| Bachelor's Degree | 0 (0.0%) | 0.0 |
| Graduate Degree | 0 (0.0%) | 0.0 |
| Total | 0 (0.0%) | 0.0 |
Fertility by Education by Marriage Status in Pine Ridge at Crestwood
| Educational Attainment | Married | Unmarried |
| Less than High School | 0 (0.0%) | 0 (0.0%) |
| High School Diploma | 0 (0.0%) | 0 (0.0%) |
| College or Associate's Degree | 0 (0.0%) | 0 (0.0%) |
| Bachelor's Degree | 0 (0.0%) | 0 (0.0%) |
| Graduate Degree | 0 (0.0%) | 0 (0.0%) |
| Total | 0 (0.0%) | 0 (0.0%) |
Employment Characteristics in Pine Ridge at Crestwood
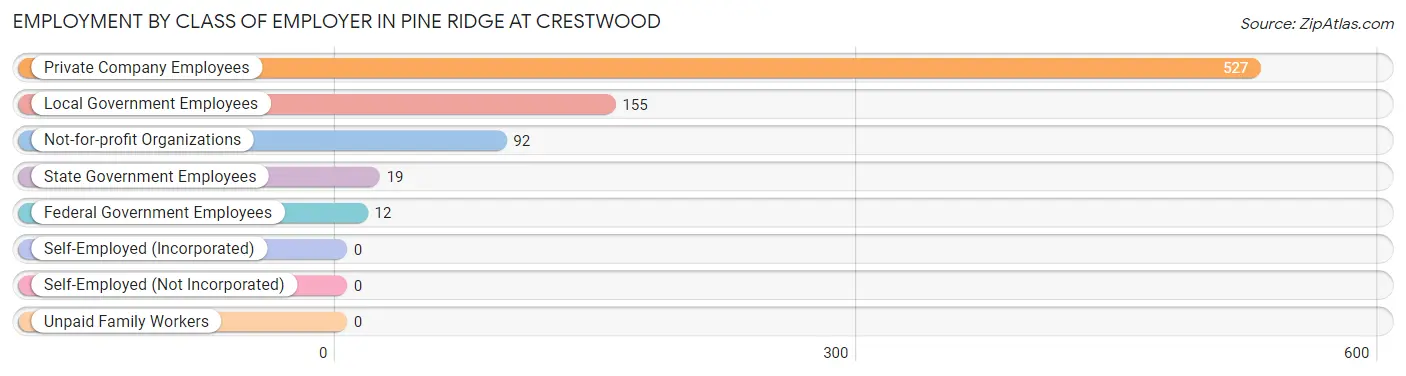
Employment by Class of Employer in Pine Ridge at Crestwood
Among the 805 employed individuals in Pine Ridge at Crestwood, private company employees (527 | 65.5%), local government employees (155 | 19.3%), and not-for-profit organizations (92 | 11.4%) make up the most common classes of employment.
| Employer Class | # Employees | % Employees |
| Private Company Employees | 527 | 65.5% |
| Self-Employed (Incorporated) | 0 | 0.0% |
| Self-Employed (Not Incorporated) | 0 | 0.0% |
| Not-for-profit Organizations | 92 | 11.4% |
| Local Government Employees | 155 | 19.3% |
| State Government Employees | 19 | 2.4% |
| Federal Government Employees | 12 | 1.5% |
| Unpaid Family Workers | 0 | 0.0% |
| Total | 805 | 100.0% |
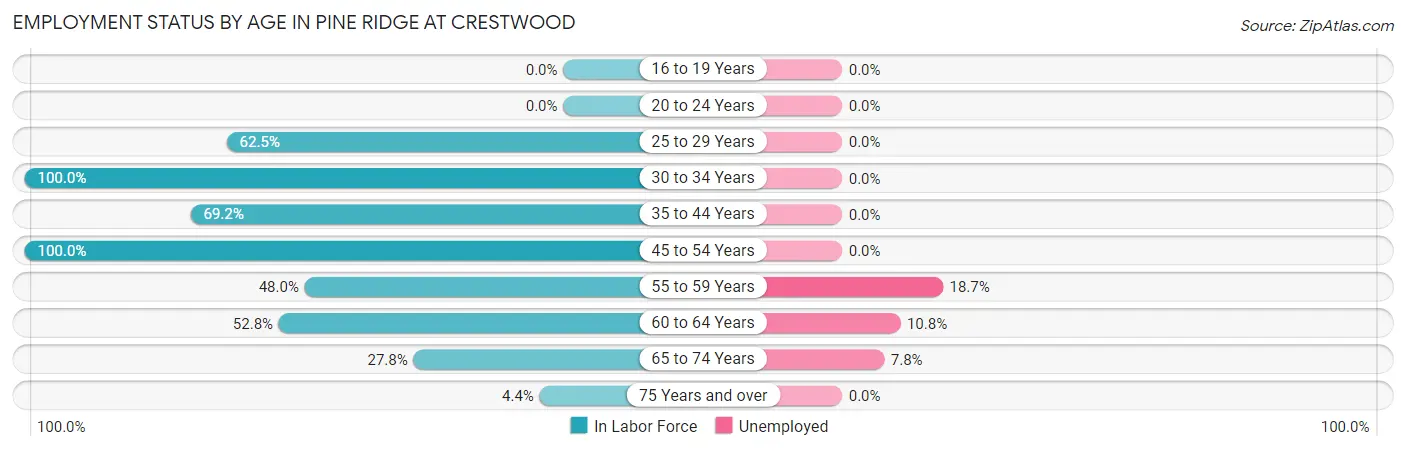
Employment Status by Age in Pine Ridge at Crestwood
According to the labor force statistics for Pine Ridge at Crestwood, out of the total population over 16 years of age (2,674), 34.0% or 909 individuals are in the labor force, with 9.9% or 90 of them unemployed. The age group with the highest labor force participation rate is 30 to 34 years, with 100.0% or 15 individuals in the labor force. Within the labor force, the 55 to 59 years age range has the highest percentage of unemployed individuals, with 18.7% or 46 of them being unemployed.
| Age Bracket | In Labor Force | Unemployed |
| 16 to 19 Years | 0 (0.0%) | 0 (0.0%) |
| 20 to 24 Years | 0 (0.0%) | 0 (0.0%) |
| 25 to 29 Years | 20 (62.5%) | 0 (0.0%) |
| 30 to 34 Years | 15 (100.0%) | 0 (0.0%) |
| 35 to 44 Years | 74 (69.2%) | 0 (0.0%) |
| 45 to 54 Years | 42 (100.0%) | 0 (0.0%) |
| 55 to 59 Years | 246 (48.0%) | 46 (18.7%) |
| 60 to 64 Years | 195 (52.8%) | 21 (10.8%) |
| 65 to 74 Years | 293 (27.8%) | 23 (7.8%) |
| 75 Years and over | 24 (4.4%) | 0 (0.0%) |
| Total | 909 (34.0%) | 90 (9.9%) |
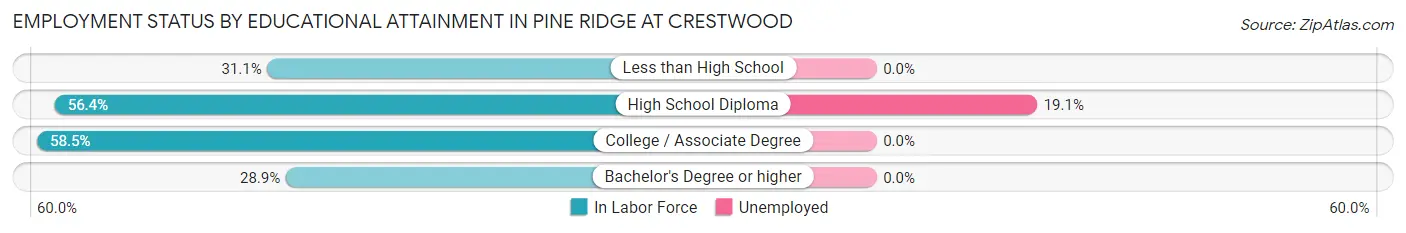
Employment Status by Educational Attainment in Pine Ridge at Crestwood
According to labor force statistics for Pine Ridge at Crestwood, 54.9% of individuals (592) out of the total population between 25 and 64 years of age (1,078) are in the labor force, with 11.3% or 67 of them being unemployed. The group with the highest labor force participation rate are those with the educational attainment of college / associate degree, with 58.5% or 214 individuals in the labor force. Within the labor force, individuals with high school diploma education have the highest percentage of unemployment, with 19.1% or 67 of them being unemployed.
| Educational Attainment | In Labor Force | Unemployed |
| Less than High School | 14 (31.1%) | 0 (0.0%) |
| High School Diploma | 351 (56.4%) | 119 (19.1%) |
| College / Associate Degree | 214 (58.5%) | 0 (0.0%) |
| Bachelor's Degree or higher | 13 (28.9%) | 0 (0.0%) |
| Total | 592 (54.9%) | 122 (11.3%) |
Employment Occupations by Sex in Pine Ridge at Crestwood
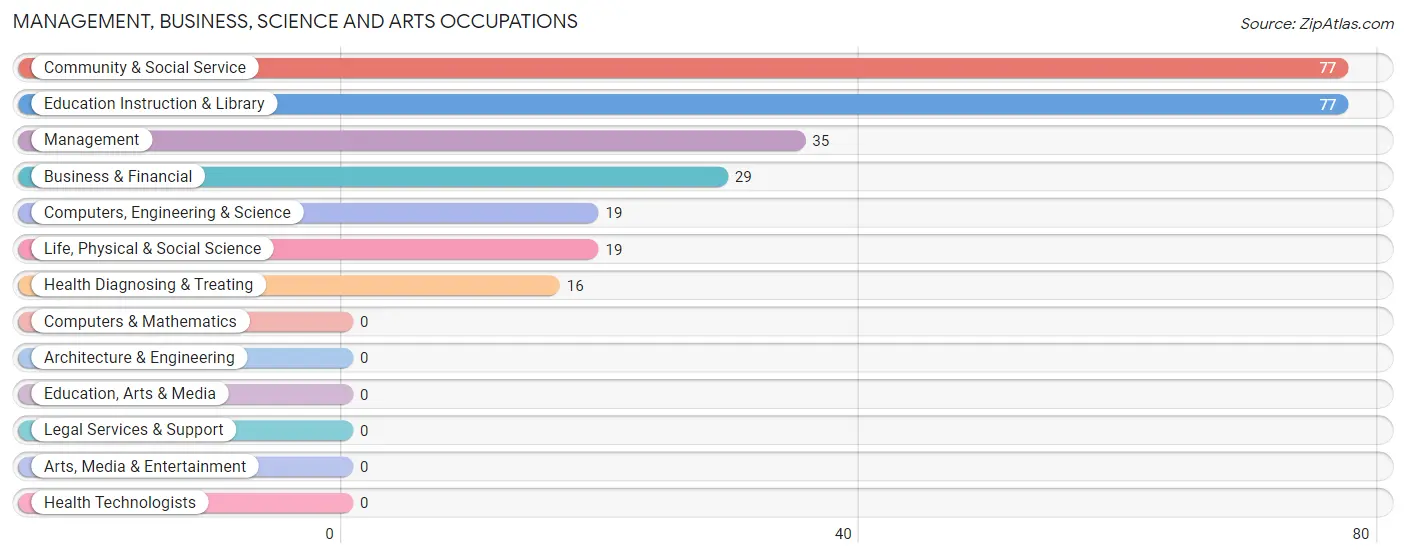
Management, Business, Science and Arts Occupations
The most common Management, Business, Science and Arts occupations in Pine Ridge at Crestwood are Community & Social Service (77 | 9.4%), Education Instruction & Library (77 | 9.4%), Management (35 | 4.3%), Business & Financial (29 | 3.5%), and Computers, Engineering & Science (19 | 2.3%).
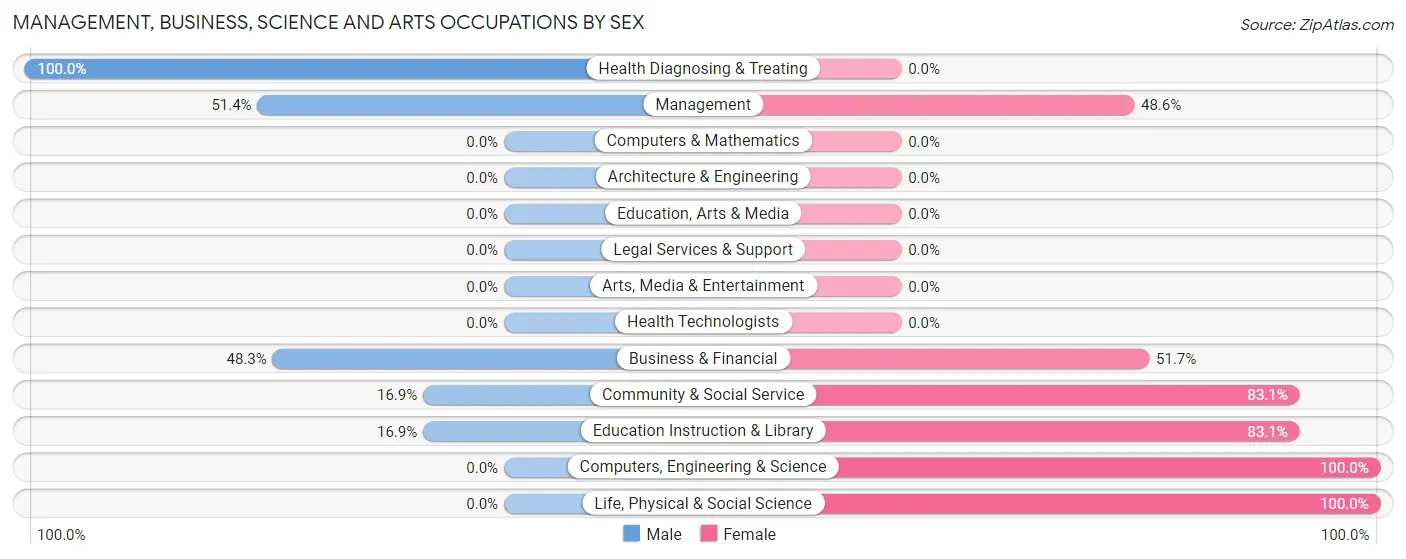
Management, Business, Science and Arts Occupations by Sex
Within the Management, Business, Science and Arts occupations in Pine Ridge at Crestwood, the most male-oriented occupations are Health Diagnosing & Treating (100.0%), Management (51.4%), and Business & Financial (48.3%), while the most female-oriented occupations are Computers, Engineering & Science (100.0%), Life, Physical & Social Science (100.0%), and Community & Social Service (83.1%).
| Occupation | Male | Female |
| Management | 18 (51.4%) | 17 (48.6%) |
| Business & Financial | 14 (48.3%) | 15 (51.7%) |
| Computers, Engineering & Science | 0 (0.0%) | 19 (100.0%) |
| Computers & Mathematics | 0 (0.0%) | 0 (0.0%) |
| Architecture & Engineering | 0 (0.0%) | 0 (0.0%) |
| Life, Physical & Social Science | 0 (0.0%) | 19 (100.0%) |
| Community & Social Service | 13 (16.9%) | 64 (83.1%) |
| Education, Arts & Media | 0 (0.0%) | 0 (0.0%) |
| Legal Services & Support | 0 (0.0%) | 0 (0.0%) |
| Education Instruction & Library | 13 (16.9%) | 64 (83.1%) |
| Arts, Media & Entertainment | 0 (0.0%) | 0 (0.0%) |
| Health Diagnosing & Treating | 16 (100.0%) | 0 (0.0%) |
| Health Technologists | 0 (0.0%) | 0 (0.0%) |
| Total (Category) | 61 (34.7%) | 115 (65.3%) |
| Total (Overall) | 402 (49.1%) | 417 (50.9%) |
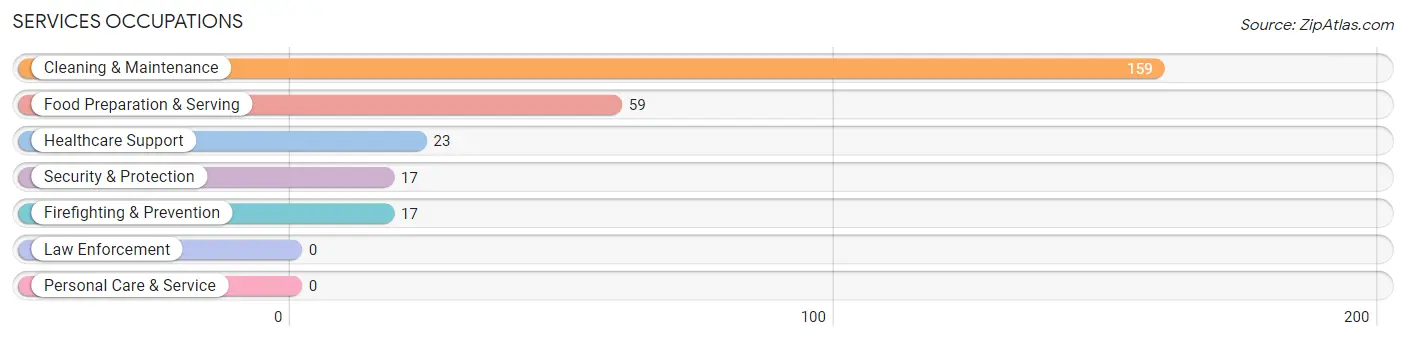
Services Occupations
The most common Services occupations in Pine Ridge at Crestwood are Cleaning & Maintenance (159 | 19.4%), Food Preparation & Serving (59 | 7.2%), Healthcare Support (23 | 2.8%), Security & Protection (17 | 2.1%), and Firefighting & Prevention (17 | 2.1%).
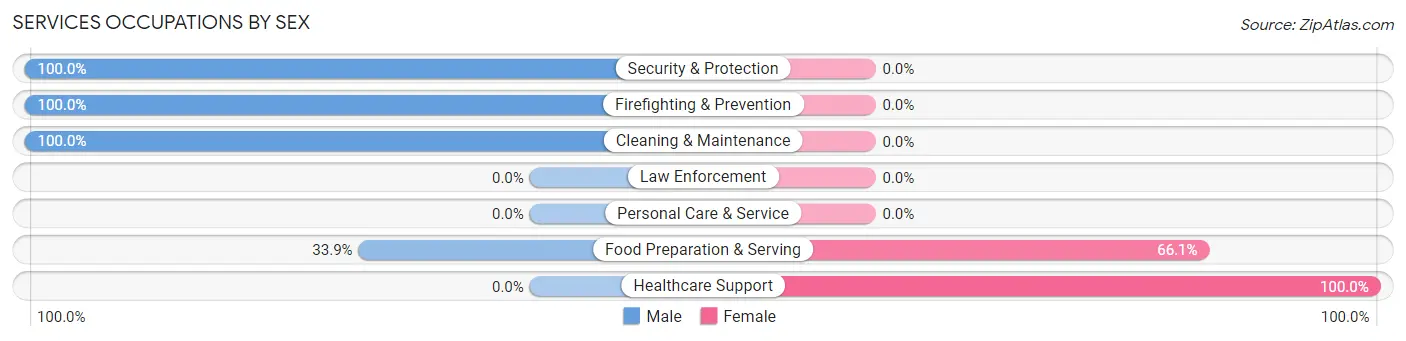
Services Occupations by Sex
Within the Services occupations in Pine Ridge at Crestwood, the most male-oriented occupations are Security & Protection (100.0%), Firefighting & Prevention (100.0%), and Cleaning & Maintenance (100.0%), while the most female-oriented occupations are Healthcare Support (100.0%), and Food Preparation & Serving (66.1%).
| Occupation | Male | Female |
| Healthcare Support | 0 (0.0%) | 23 (100.0%) |
| Security & Protection | 17 (100.0%) | 0 (0.0%) |
| Firefighting & Prevention | 17 (100.0%) | 0 (0.0%) |
| Law Enforcement | 0 (0.0%) | 0 (0.0%) |
| Food Preparation & Serving | 20 (33.9%) | 39 (66.1%) |
| Cleaning & Maintenance | 159 (100.0%) | 0 (0.0%) |
| Personal Care & Service | 0 (0.0%) | 0 (0.0%) |
| Total (Category) | 196 (76.0%) | 62 (24.0%) |
| Total (Overall) | 402 (49.1%) | 417 (50.9%) |
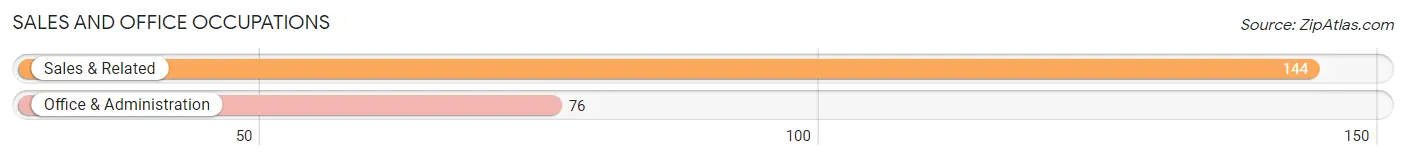
Sales and Office Occupations
The most common Sales and Office occupations in Pine Ridge at Crestwood are Sales & Related (144 | 17.6%), and Office & Administration (76 | 9.3%).
Sales and Office Occupations by Sex
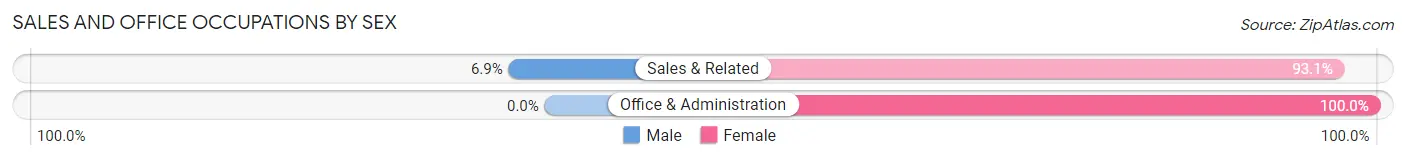
| Occupation | Male | Female |
| Sales & Related | 10 (6.9%) | 134 (93.1%) |
| Office & Administration | 0 (0.0%) | 76 (100.0%) |
| Total (Category) | 10 (4.5%) | 210 (95.5%) |
| Total (Overall) | 402 (49.1%) | 417 (50.9%) |
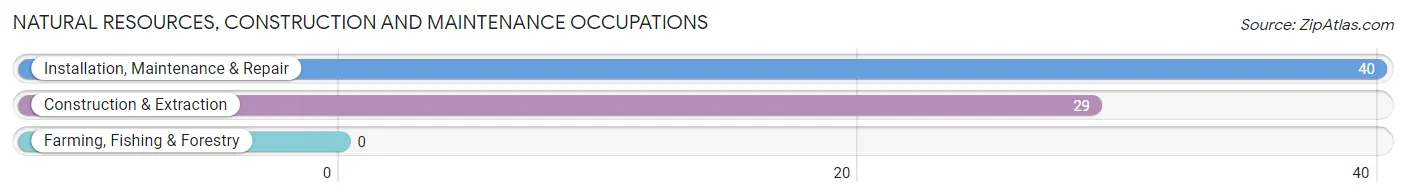
Natural Resources, Construction and Maintenance Occupations
The most common Natural Resources, Construction and Maintenance occupations in Pine Ridge at Crestwood are Installation, Maintenance & Repair (40 | 4.9%), and Construction & Extraction (29 | 3.5%).
Natural Resources, Construction and Maintenance Occupations by Sex

| Occupation | Male | Female |
| Farming, Fishing & Forestry | 0 (0.0%) | 0 (0.0%) |
| Construction & Extraction | 29 (100.0%) | 0 (0.0%) |
| Installation, Maintenance & Repair | 40 (100.0%) | 0 (0.0%) |
| Total (Category) | 69 (100.0%) | 0 (0.0%) |
| Total (Overall) | 402 (49.1%) | 417 (50.9%) |
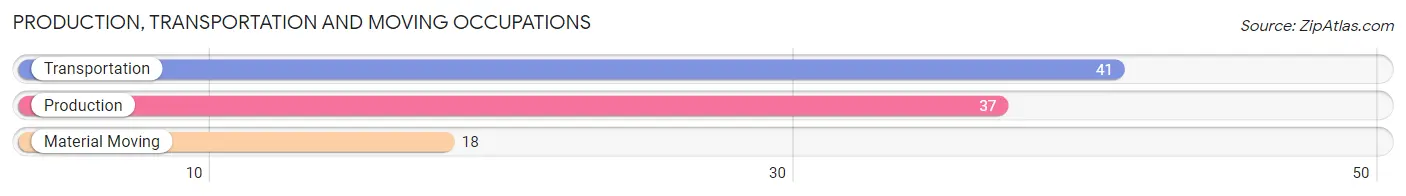
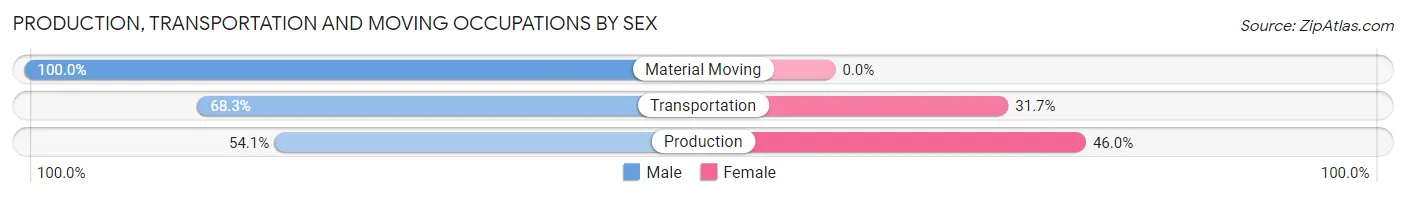
Production, Transportation and Moving Occupations
The most common Production, Transportation and Moving occupations in Pine Ridge at Crestwood are Transportation (41 | 5.0%), Production (37 | 4.5%), and Material Moving (18 | 2.2%).
Production, Transportation and Moving Occupations by Sex
| Occupation | Male | Female |
| Production | 20 (54.0%) | 17 (46.0%) |
| Transportation | 28 (68.3%) | 13 (31.7%) |
| Material Moving | 18 (100.0%) | 0 (0.0%) |
| Total (Category) | 66 (68.8%) | 30 (31.2%) |
| Total (Overall) | 402 (49.1%) | 417 (50.9%) |
Employment Industries by Sex in Pine Ridge at Crestwood
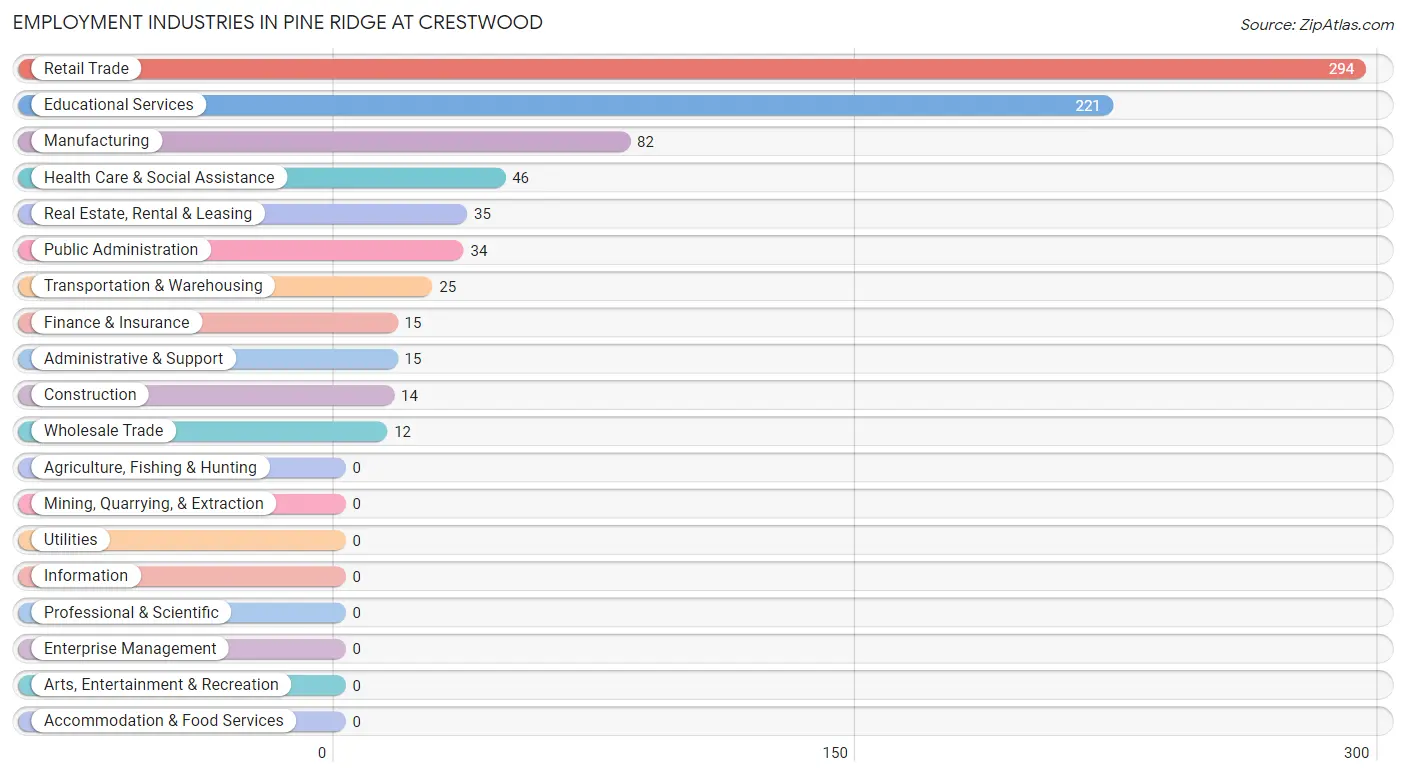
Employment Industries in Pine Ridge at Crestwood
The major employment industries in Pine Ridge at Crestwood include Retail Trade (294 | 35.9%), Educational Services (221 | 27.0%), Manufacturing (82 | 10.0%), Health Care & Social Assistance (46 | 5.6%), and Real Estate, Rental & Leasing (35 | 4.3%).
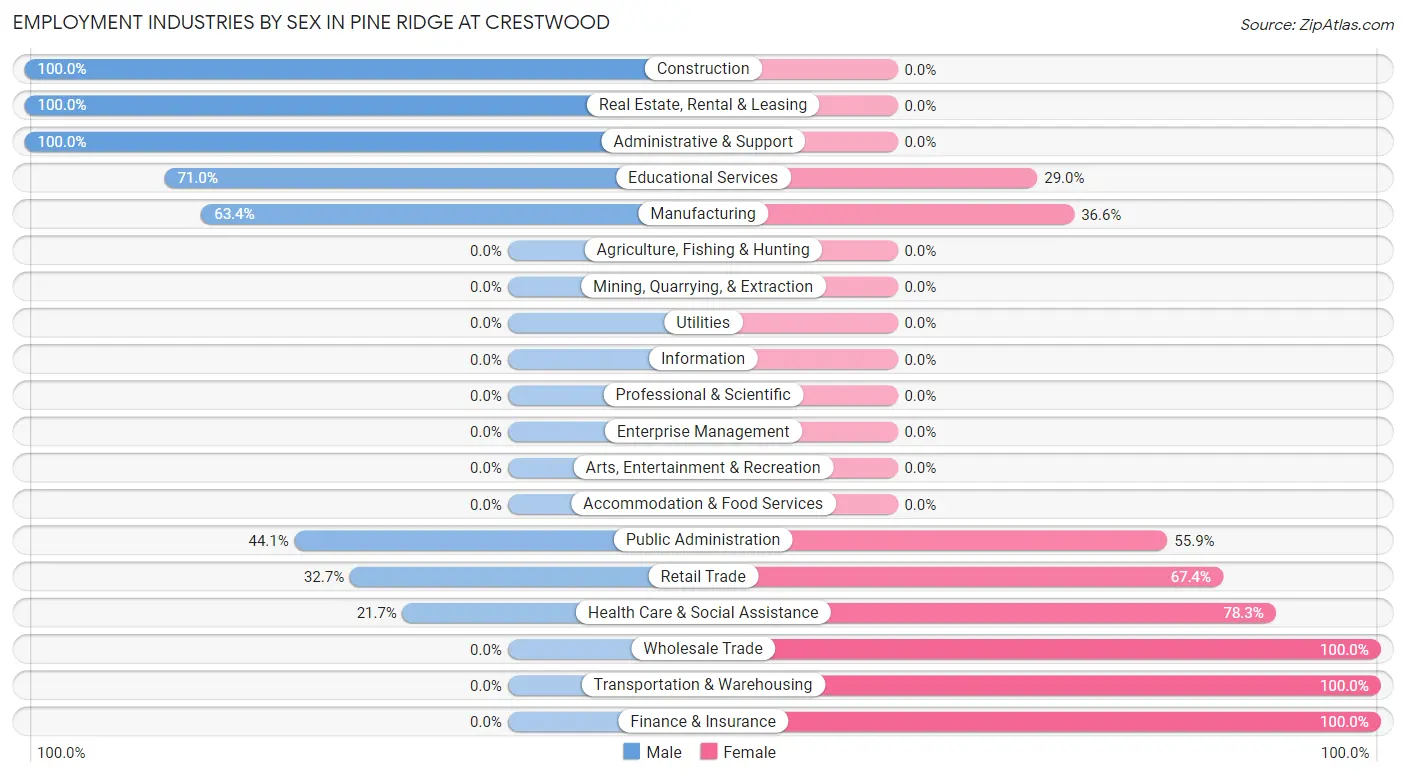
Employment Industries by Sex in Pine Ridge at Crestwood
The Pine Ridge at Crestwood industries that see more men than women are Construction (100.0%), Real Estate, Rental & Leasing (100.0%), and Administrative & Support (100.0%), whereas the industries that tend to have a higher number of women are Wholesale Trade (100.0%), Transportation & Warehousing (100.0%), and Finance & Insurance (100.0%).
| Industry | Male | Female |
| Agriculture, Fishing & Hunting | 0 (0.0%) | 0 (0.0%) |
| Mining, Quarrying, & Extraction | 0 (0.0%) | 0 (0.0%) |
| Construction | 14 (100.0%) | 0 (0.0%) |
| Manufacturing | 52 (63.4%) | 30 (36.6%) |
| Wholesale Trade | 0 (0.0%) | 12 (100.0%) |
| Retail Trade | 96 (32.7%) | 198 (67.3%) |
| Transportation & Warehousing | 0 (0.0%) | 25 (100.0%) |
| Utilities | 0 (0.0%) | 0 (0.0%) |
| Information | 0 (0.0%) | 0 (0.0%) |
| Finance & Insurance | 0 (0.0%) | 15 (100.0%) |
| Real Estate, Rental & Leasing | 35 (100.0%) | 0 (0.0%) |
| Professional & Scientific | 0 (0.0%) | 0 (0.0%) |
| Enterprise Management | 0 (0.0%) | 0 (0.0%) |
| Administrative & Support | 15 (100.0%) | 0 (0.0%) |
| Educational Services | 157 (71.0%) | 64 (29.0%) |
| Health Care & Social Assistance | 10 (21.7%) | 36 (78.3%) |
| Arts, Entertainment & Recreation | 0 (0.0%) | 0 (0.0%) |
| Accommodation & Food Services | 0 (0.0%) | 0 (0.0%) |
| Public Administration | 15 (44.1%) | 19 (55.9%) |
| Total | 402 (49.1%) | 417 (50.9%) |
Education in Pine Ridge at Crestwood
School Enrollment in Pine Ridge at Crestwood
| School Level | # Students | % Students |
| Nursery / Preschool | 0 | 0.0% |
| Kindergarten | 0 | 0.0% |
| Elementary School | 0 | 0.0% |
| Middle School | 0 | 0.0% |
| High School | 0 | 0.0% |
| College / Undergraduate | 0 | 0.0% |
| Graduate / Professional | 0 | 0.0% |
| Total | 0 | 0.0% |
School Enrollment by Age by Funding Source in Pine Ridge at Crestwood
| Age Bracket | Public School | Private School |
| 3 to 4 Year Olds | 0 (0.0%) | 0 (0.0%) |
| 5 to 9 Year Old | 0 (0.0%) | 0 (0.0%) |
| 10 to 14 Year Olds | 0 (0.0%) | 0 (0.0%) |
| 15 to 17 Year Olds | 0 (0.0%) | 0 (0.0%) |
| 18 to 19 Year Olds | 0 (0.0%) | 0 (0.0%) |
| 20 to 24 Year Olds | 0 (0.0%) | 0 (0.0%) |
| 25 to 34 Year Olds | 0 (0.0%) | 0 (0.0%) |
| 35 Years and over | 0 (0.0%) | 0 (0.0%) |
| Total | 0 (0.0%) | 0 (0.0%) |
Educational Attainment by Field of Study in Pine Ridge at Crestwood
Education (86 | 27.8%), physical & health sciences (41 | 13.3%), psychology (38 | 12.3%), bio, nature & agricultural (36 | 11.7%), and social sciences (25 | 8.1%) are the most common fields of study among 309 individuals in Pine Ridge at Crestwood who have obtained a bachelor's degree or higher.
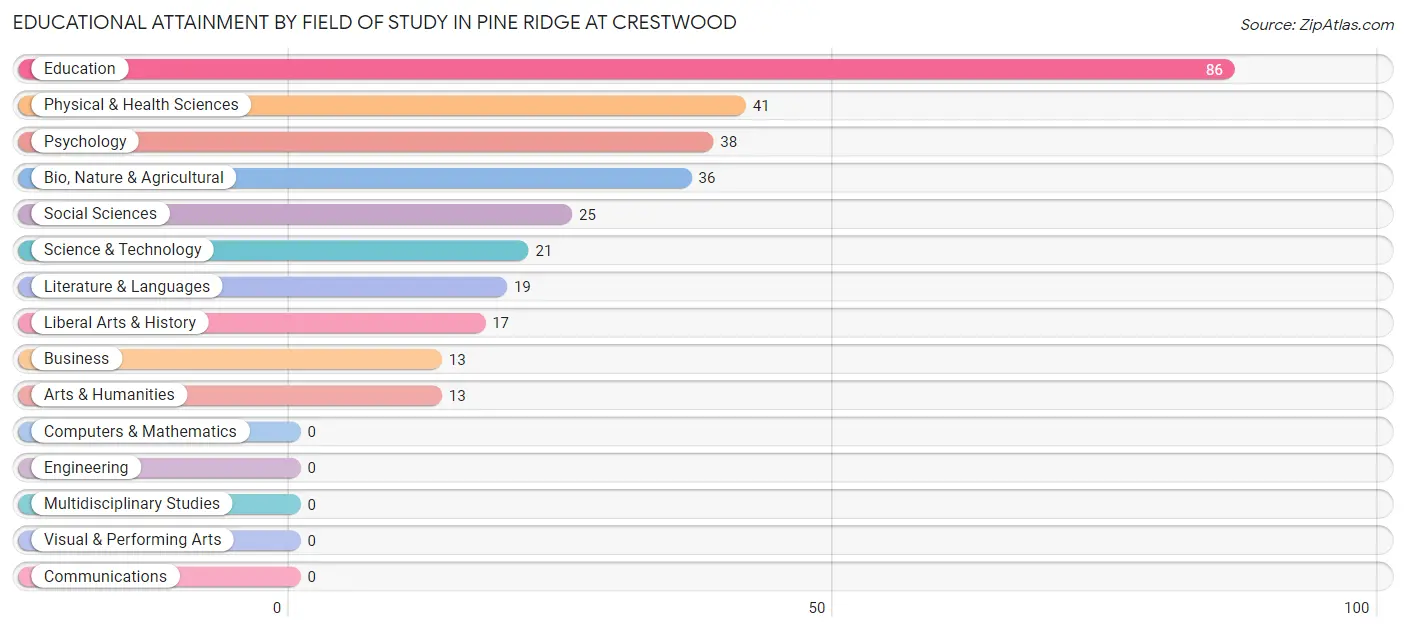
| Field of Study | # Graduates | % Graduates |
| Computers & Mathematics | 0 | 0.0% |
| Bio, Nature & Agricultural | 36 | 11.7% |
| Physical & Health Sciences | 41 | 13.3% |
| Psychology | 38 | 12.3% |
| Social Sciences | 25 | 8.1% |
| Engineering | 0 | 0.0% |
| Multidisciplinary Studies | 0 | 0.0% |
| Science & Technology | 21 | 6.8% |
| Business | 13 | 4.2% |
| Education | 86 | 27.8% |
| Literature & Languages | 19 | 6.1% |
| Liberal Arts & History | 17 | 5.5% |
| Visual & Performing Arts | 0 | 0.0% |
| Communications | 0 | 0.0% |
| Arts & Humanities | 13 | 4.2% |
| Total | 309 | 100.0% |
Transportation & Commute in Pine Ridge at Crestwood
Vehicle Availability by Sex in Pine Ridge at Crestwood
The most prevalent vehicle ownership categories in Pine Ridge at Crestwood are males with 3 vehicles (140, accounting for 36.1%) and females with 3 vehicles (64, making up 33.6%).
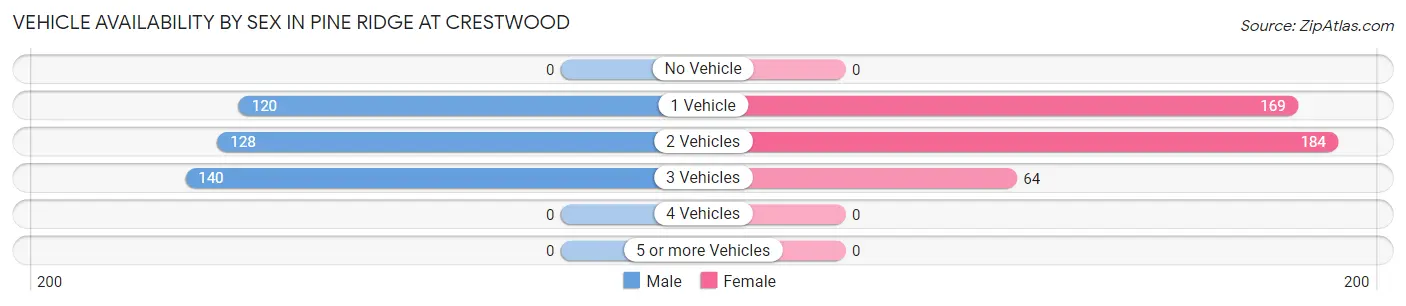
| Vehicles Available | Male | Female |
| No Vehicle | 0 (0.0%) | 0 (0.0%) |
| 1 Vehicle | 120 (30.9%) | 169 (40.5%) |
| 2 Vehicles | 128 (33.0%) | 184 (44.1%) |
| 3 Vehicles | 140 (36.1%) | 64 (15.3%) |
| 4 Vehicles | 0 (0.0%) | 0 (0.0%) |
| 5 or more Vehicles | 0 (0.0%) | 0 (0.0%) |
| Total | 388 (100.0%) | 417 (100.0%) |
Commute Time in Pine Ridge at Crestwood
The most frequently occuring commute durations in Pine Ridge at Crestwood are 20 to 24 minutes (176 commuters, 21.9%), 25 to 29 minutes (158 commuters, 19.6%), and 40 to 44 minutes (144 commuters, 17.9%).
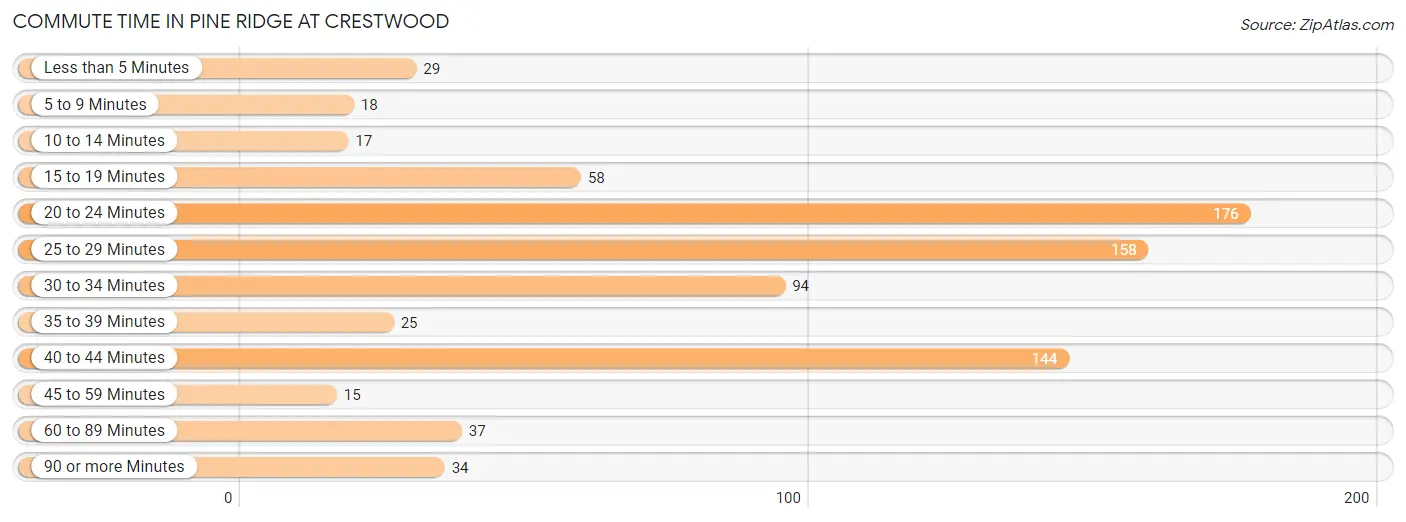
| Commute Time | # Commuters | % Commuters |
| Less than 5 Minutes | 29 | 3.6% |
| 5 to 9 Minutes | 18 | 2.2% |
| 10 to 14 Minutes | 17 | 2.1% |
| 15 to 19 Minutes | 58 | 7.2% |
| 20 to 24 Minutes | 176 | 21.9% |
| 25 to 29 Minutes | 158 | 19.6% |
| 30 to 34 Minutes | 94 | 11.7% |
| 35 to 39 Minutes | 25 | 3.1% |
| 40 to 44 Minutes | 144 | 17.9% |
| 45 to 59 Minutes | 15 | 1.9% |
| 60 to 89 Minutes | 37 | 4.6% |
| 90 or more Minutes | 34 | 4.2% |
Commute Time by Sex in Pine Ridge at Crestwood
The most common commute times in Pine Ridge at Crestwood are 25 to 29 minutes (141 commuters, 36.3%) for males and 20 to 24 minutes (176 commuters, 42.2%) for females.
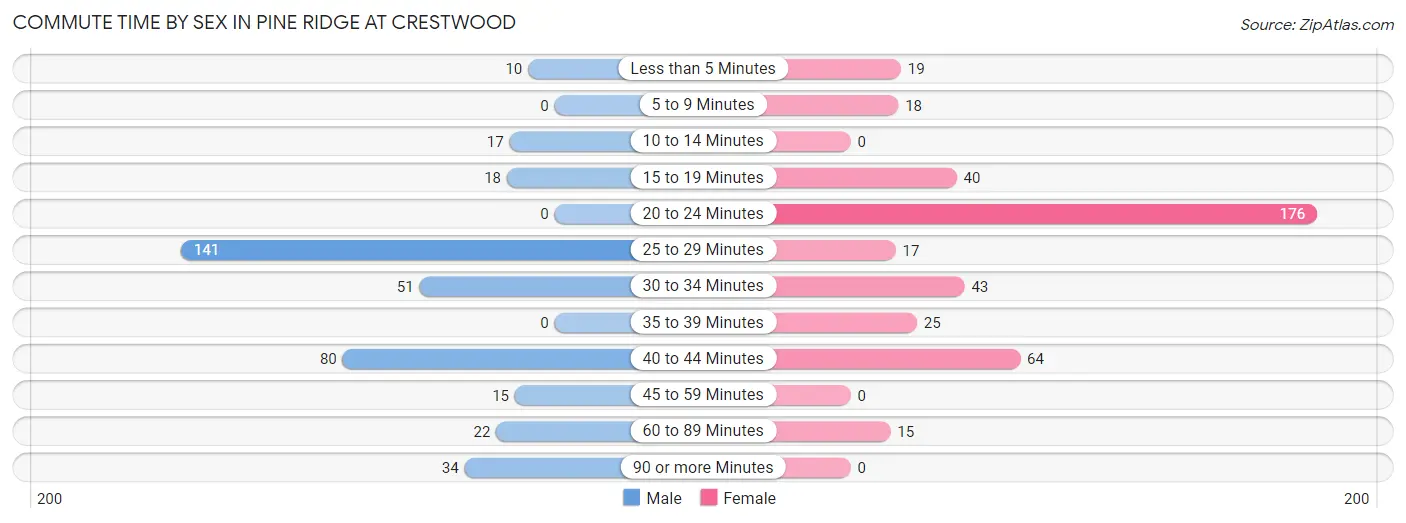
| Commute Time | Male | Female |
| Less than 5 Minutes | 10 (2.6%) | 19 (4.6%) |
| 5 to 9 Minutes | 0 (0.0%) | 18 (4.3%) |
| 10 to 14 Minutes | 17 (4.4%) | 0 (0.0%) |
| 15 to 19 Minutes | 18 (4.6%) | 40 (9.6%) |
| 20 to 24 Minutes | 0 (0.0%) | 176 (42.2%) |
| 25 to 29 Minutes | 141 (36.3%) | 17 (4.1%) |
| 30 to 34 Minutes | 51 (13.1%) | 43 (10.3%) |
| 35 to 39 Minutes | 0 (0.0%) | 25 (6.0%) |
| 40 to 44 Minutes | 80 (20.6%) | 64 (15.3%) |
| 45 to 59 Minutes | 15 (3.9%) | 0 (0.0%) |
| 60 to 89 Minutes | 22 (5.7%) | 15 (3.6%) |
| 90 or more Minutes | 34 (8.8%) | 0 (0.0%) |
Time of Departure to Work by Sex in Pine Ridge at Crestwood
The most frequent times of departure to work in Pine Ridge at Crestwood are 12:00 PM to 3:59 PM (144, 37.1%) for males and 6:00 AM to 6:29 AM (147, 35.2%) for females.
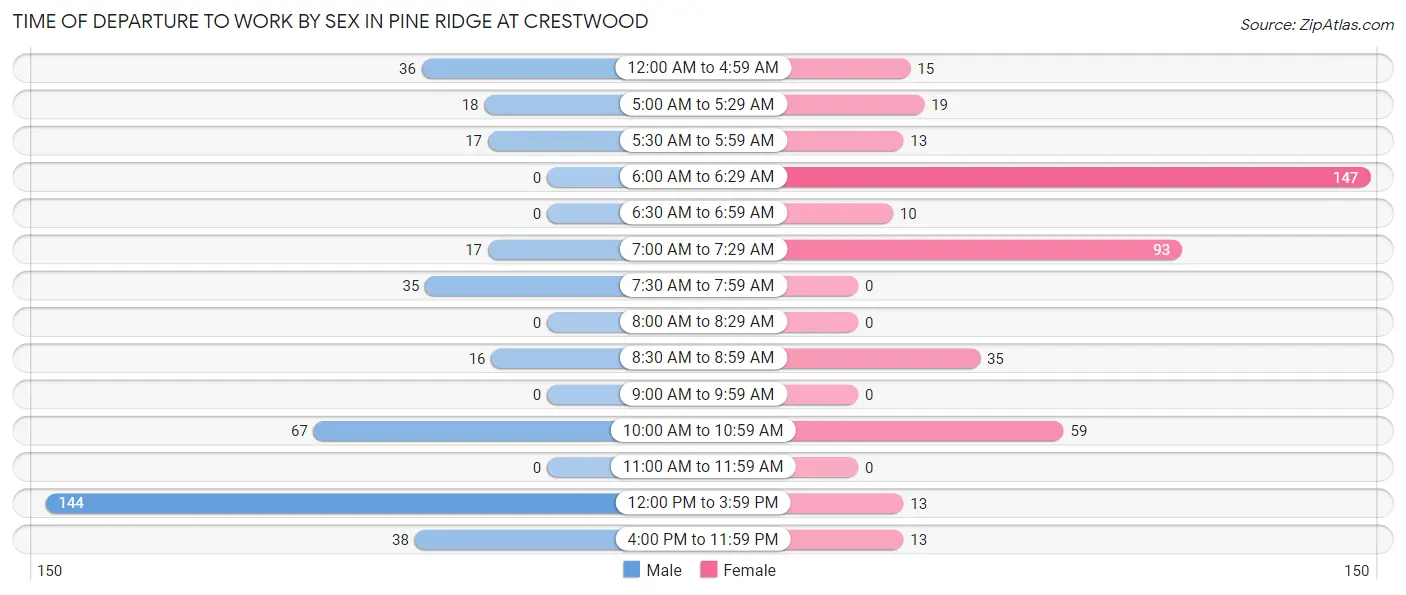
| Time of Departure | Male | Female |
| 12:00 AM to 4:59 AM | 36 (9.3%) | 15 (3.6%) |
| 5:00 AM to 5:29 AM | 18 (4.6%) | 19 (4.6%) |
| 5:30 AM to 5:59 AM | 17 (4.4%) | 13 (3.1%) |
| 6:00 AM to 6:29 AM | 0 (0.0%) | 147 (35.2%) |
| 6:30 AM to 6:59 AM | 0 (0.0%) | 10 (2.4%) |
| 7:00 AM to 7:29 AM | 17 (4.4%) | 93 (22.3%) |
| 7:30 AM to 7:59 AM | 35 (9.0%) | 0 (0.0%) |
| 8:00 AM to 8:29 AM | 0 (0.0%) | 0 (0.0%) |
| 8:30 AM to 8:59 AM | 16 (4.1%) | 35 (8.4%) |
| 9:00 AM to 9:59 AM | 0 (0.0%) | 0 (0.0%) |
| 10:00 AM to 10:59 AM | 67 (17.3%) | 59 (14.1%) |
| 11:00 AM to 11:59 AM | 0 (0.0%) | 0 (0.0%) |
| 12:00 PM to 3:59 PM | 144 (37.1%) | 13 (3.1%) |
| 4:00 PM to 11:59 PM | 38 (9.8%) | 13 (3.1%) |
| Total | 388 (100.0%) | 417 (100.0%) |
Housing Occupancy in Pine Ridge at Crestwood
Occupancy by Ownership in Pine Ridge at Crestwood
Of the total 1,643 dwellings in Pine Ridge at Crestwood, owner-occupied units account for 1,558 (94.8%), while renter-occupied units make up 85 (5.2%).
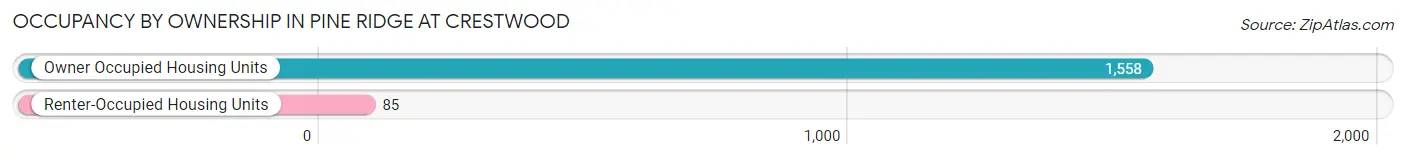
| Occupancy | # Housing Units | % Housing Units |
| Owner Occupied Housing Units | 1,558 | 94.8% |
| Renter-Occupied Housing Units | 85 | 5.2% |
| Total Occupied Housing Units | 1,643 | 100.0% |
Occupancy by Household Size in Pine Ridge at Crestwood
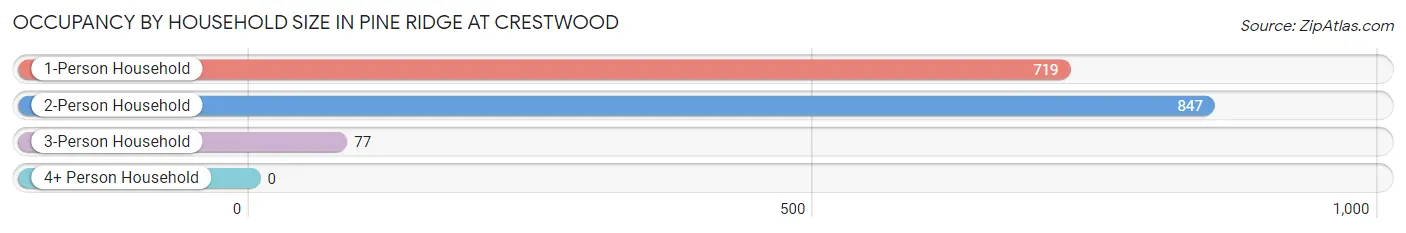
| Household Size | # Housing Units | % Housing Units |
| 1-Person Household | 719 | 43.8% |
| 2-Person Household | 847 | 51.5% |
| 3-Person Household | 77 | 4.7% |
| 4+ Person Household | 0 | 0.0% |
| Total Housing Units | 1,643 | 100.0% |
Occupancy by Ownership by Household Size in Pine Ridge at Crestwood
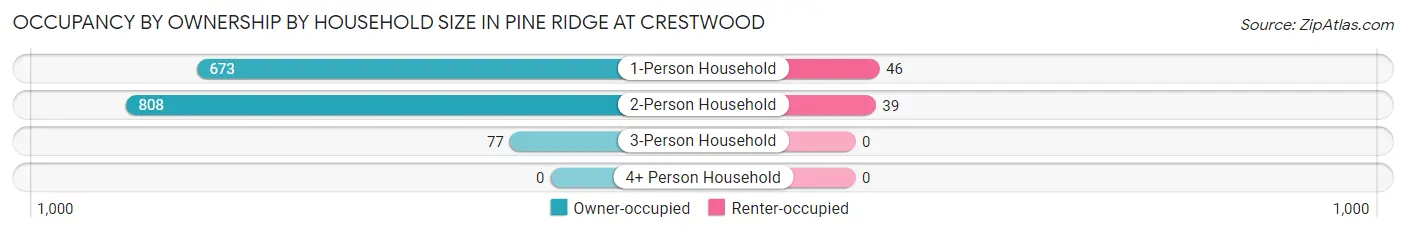
| Household Size | Owner-occupied | Renter-occupied |
| 1-Person Household | 673 (93.6%) | 46 (6.4%) |
| 2-Person Household | 808 (95.4%) | 39 (4.6%) |
| 3-Person Household | 77 (100.0%) | 0 (0.0%) |
| 4+ Person Household | 0 (0.0%) | 0 (0.0%) |
| Total Housing Units | 1,558 (94.8%) | 85 (5.2%) |
Occupancy by Educational Attainment in Pine Ridge at Crestwood
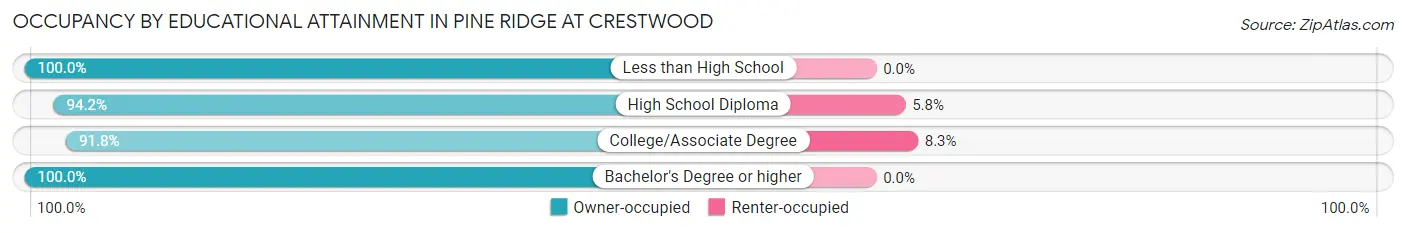
| Household Size | Owner-occupied | Renter-occupied |
| Less than High School | 128 (100.0%) | 0 (0.0%) |
| High School Diploma | 752 (94.2%) | 46 (5.8%) |
| College/Associate Degree | 434 (91.7%) | 39 (8.3%) |
| Bachelor's Degree or higher | 244 (100.0%) | 0 (0.0%) |
Occupancy by Age of Householder in Pine Ridge at Crestwood
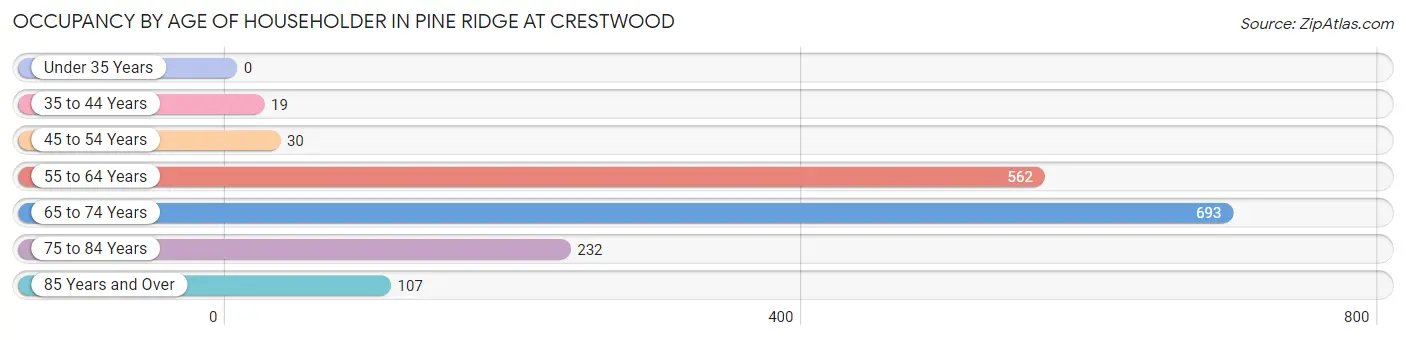
| Age Bracket | # Households | % Households |
| Under 35 Years | 0 | 0.0% |
| 35 to 44 Years | 19 | 1.2% |
| 45 to 54 Years | 30 | 1.8% |
| 55 to 64 Years | 562 | 34.2% |
| 65 to 74 Years | 693 | 42.2% |
| 75 to 84 Years | 232 | 14.1% |
| 85 Years and Over | 107 | 6.5% |
| Total | 1,643 | 100.0% |
Housing Finances in Pine Ridge at Crestwood
Median Income by Occupancy in Pine Ridge at Crestwood
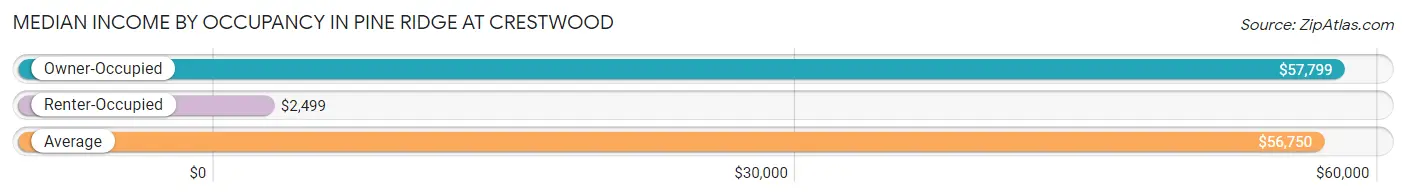
| Occupancy Type | # Households | Median Income |
| Owner-Occupied | 1,558 (94.8%) | $57,799 |
| Renter-Occupied | 85 (5.2%) | $2,499 |
| Average | 1,643 (100.0%) | $56,750 |
Occupancy by Householder Income Bracket in Pine Ridge at Crestwood
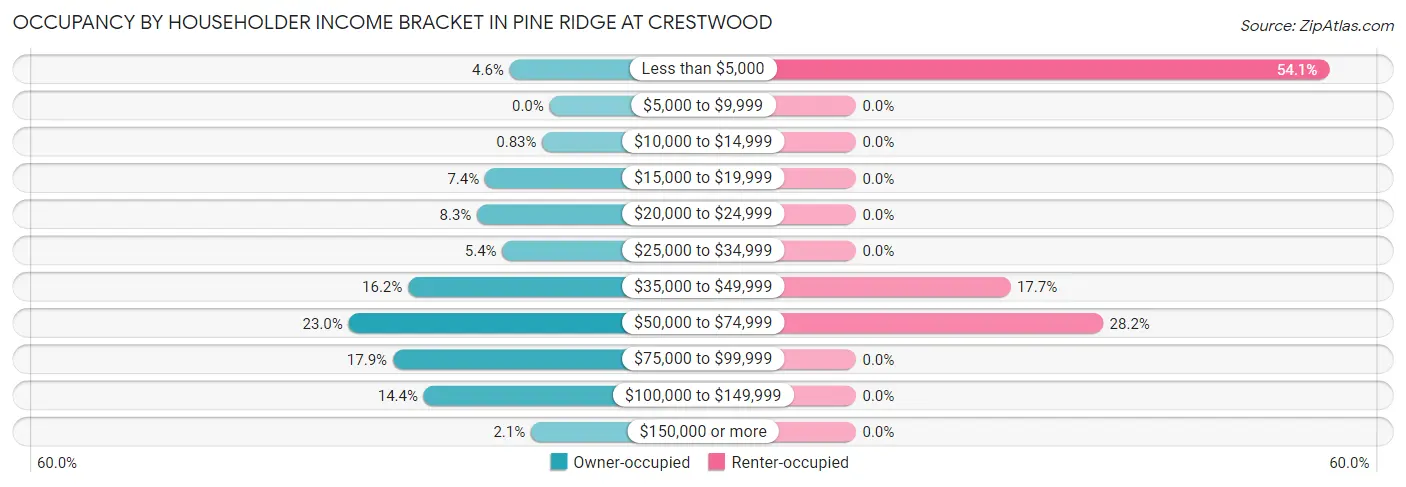
| Income Bracket | Owner-occupied | Renter-occupied |
| Less than $5,000 | 71 (4.6%) | 46 (54.1%) |
| $5,000 to $9,999 | 0 (0.0%) | 0 (0.0%) |
| $10,000 to $14,999 | 13 (0.8%) | 0 (0.0%) |
| $15,000 to $19,999 | 115 (7.4%) | 0 (0.0%) |
| $20,000 to $24,999 | 129 (8.3%) | 0 (0.0%) |
| $25,000 to $34,999 | 84 (5.4%) | 0 (0.0%) |
| $35,000 to $49,999 | 252 (16.2%) | 15 (17.6%) |
| $50,000 to $74,999 | 358 (23.0%) | 24 (28.2%) |
| $75,000 to $99,999 | 279 (17.9%) | 0 (0.0%) |
| $100,000 to $149,999 | 224 (14.4%) | 0 (0.0%) |
| $150,000 or more | 33 (2.1%) | 0 (0.0%) |
| Total | 1,558 (100.0%) | 85 (100.0%) |
Monthly Housing Cost Tiers in Pine Ridge at Crestwood
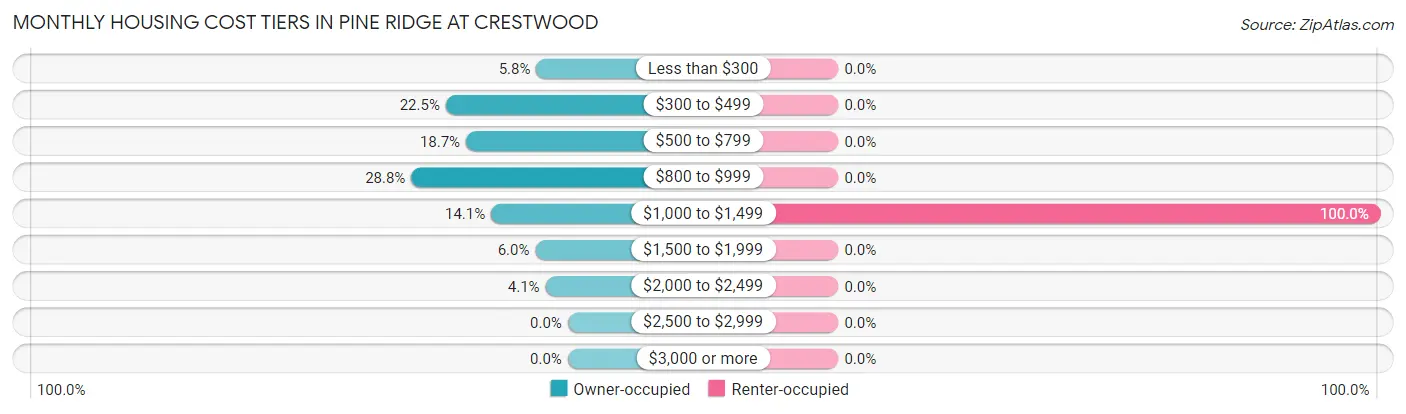
| Monthly Cost | Owner-occupied | Renter-occupied |
| Less than $300 | 90 (5.8%) | 0 (0.0%) |
| $300 to $499 | 350 (22.5%) | 0 (0.0%) |
| $500 to $799 | 292 (18.7%) | 0 (0.0%) |
| $800 to $999 | 449 (28.8%) | 0 (0.0%) |
| $1,000 to $1,499 | 220 (14.1%) | 85 (100.0%) |
| $1,500 to $1,999 | 93 (6.0%) | 0 (0.0%) |
| $2,000 to $2,499 | 64 (4.1%) | 0 (0.0%) |
| $2,500 to $2,999 | 0 (0.0%) | 0 (0.0%) |
| $3,000 or more | 0 (0.0%) | 0 (0.0%) |
| Total | 1,558 (100.0%) | 85 (100.0%) |
Physical Housing Characteristics in Pine Ridge at Crestwood
Housing Structures in Pine Ridge at Crestwood
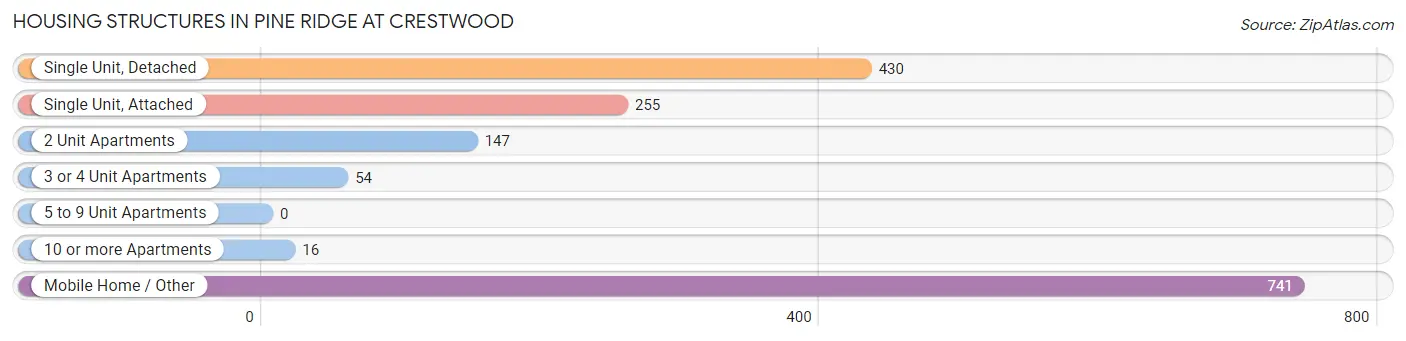
| Structure Type | # Housing Units | % Housing Units |
| Single Unit, Detached | 430 | 26.2% |
| Single Unit, Attached | 255 | 15.5% |
| 2 Unit Apartments | 147 | 8.9% |
| 3 or 4 Unit Apartments | 54 | 3.3% |
| 5 to 9 Unit Apartments | 0 | 0.0% |
| 10 or more Apartments | 16 | 1.0% |
| Mobile Home / Other | 741 | 45.1% |
| Total | 1,643 | 100.0% |
Housing Structures by Occupancy in Pine Ridge at Crestwood
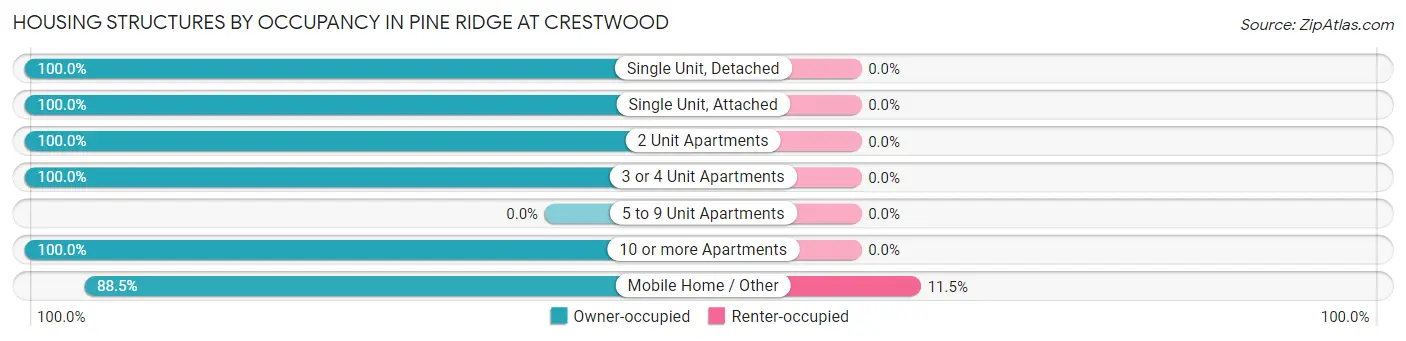
| Structure Type | Owner-occupied | Renter-occupied |
| Single Unit, Detached | 430 (100.0%) | 0 (0.0%) |
| Single Unit, Attached | 255 (100.0%) | 0 (0.0%) |
| 2 Unit Apartments | 147 (100.0%) | 0 (0.0%) |
| 3 or 4 Unit Apartments | 54 (100.0%) | 0 (0.0%) |
| 5 to 9 Unit Apartments | 0 (0.0%) | 0 (0.0%) |
| 10 or more Apartments | 16 (100.0%) | 0 (0.0%) |
| Mobile Home / Other | 656 (88.5%) | 85 (11.5%) |
| Total | 1,558 (94.8%) | 85 (5.2%) |
Housing Structures by Number of Rooms in Pine Ridge at Crestwood
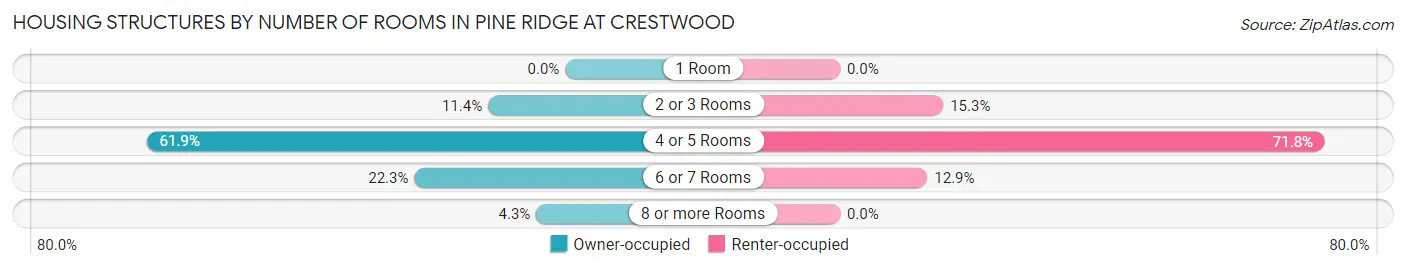
| Number of Rooms | Owner-occupied | Renter-occupied |
| 1 Room | 0 (0.0%) | 0 (0.0%) |
| 2 or 3 Rooms | 178 (11.4%) | 13 (15.3%) |
| 4 or 5 Rooms | 965 (61.9%) | 61 (71.8%) |
| 6 or 7 Rooms | 348 (22.3%) | 11 (12.9%) |
| 8 or more Rooms | 67 (4.3%) | 0 (0.0%) |
| Total | 1,558 (100.0%) | 85 (100.0%) |
Housing Structure by Heating Type in Pine Ridge at Crestwood
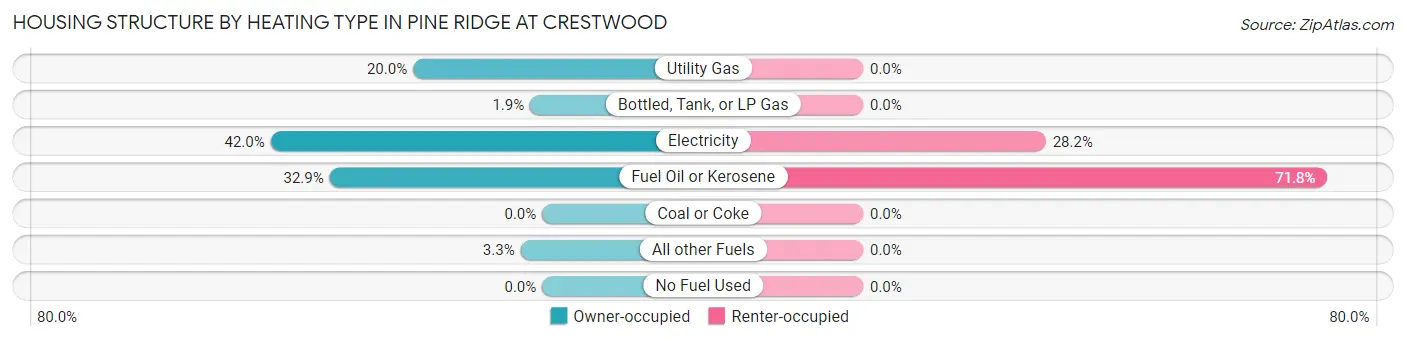
| Heating Type | Owner-occupied | Renter-occupied |
| Utility Gas | 311 (20.0%) | 0 (0.0%) |
| Bottled, Tank, or LP Gas | 29 (1.9%) | 0 (0.0%) |
| Electricity | 654 (42.0%) | 24 (28.2%) |
| Fuel Oil or Kerosene | 512 (32.9%) | 61 (71.8%) |
| Coal or Coke | 0 (0.0%) | 0 (0.0%) |
| All other Fuels | 52 (3.3%) | 0 (0.0%) |
| No Fuel Used | 0 (0.0%) | 0 (0.0%) |
| Total | 1,558 (100.0%) | 85 (100.0%) |
Household Vehicle Usage in Pine Ridge at Crestwood
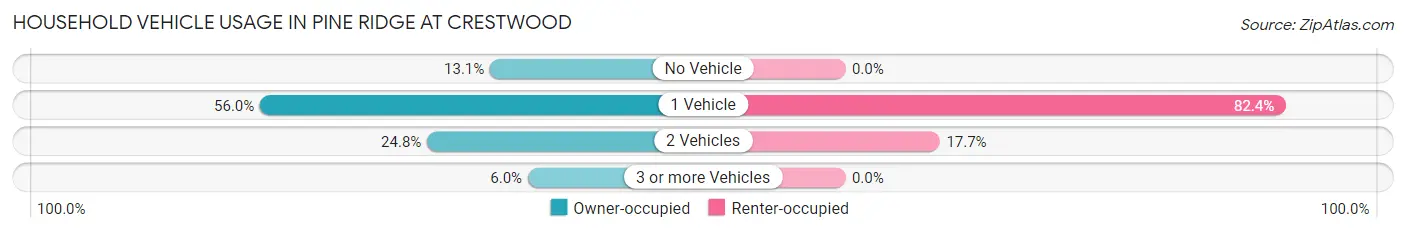
| Vehicles per Household | Owner-occupied | Renter-occupied |
| No Vehicle | 204 (13.1%) | 0 (0.0%) |
| 1 Vehicle | 873 (56.0%) | 70 (82.4%) |
| 2 Vehicles | 387 (24.8%) | 15 (17.6%) |
| 3 or more Vehicles | 94 (6.0%) | 0 (0.0%) |
| Total | 1,558 (100.0%) | 85 (100.0%) |
Real Estate & Mortgages in Pine Ridge at Crestwood
Real Estate and Mortgage Overview in Pine Ridge at Crestwood
| Characteristic | Without Mortgage | With Mortgage |
| Housing Units | 1,039 | 519 |
| Median Property Value | - | - |
| Median Household Income | $50,625 | $15 |
| Monthly Housing Costs | $725 | $0 |
| Real Estate Taxes | $3,637 | $17 |
Property Value by Mortgage Status in Pine Ridge at Crestwood
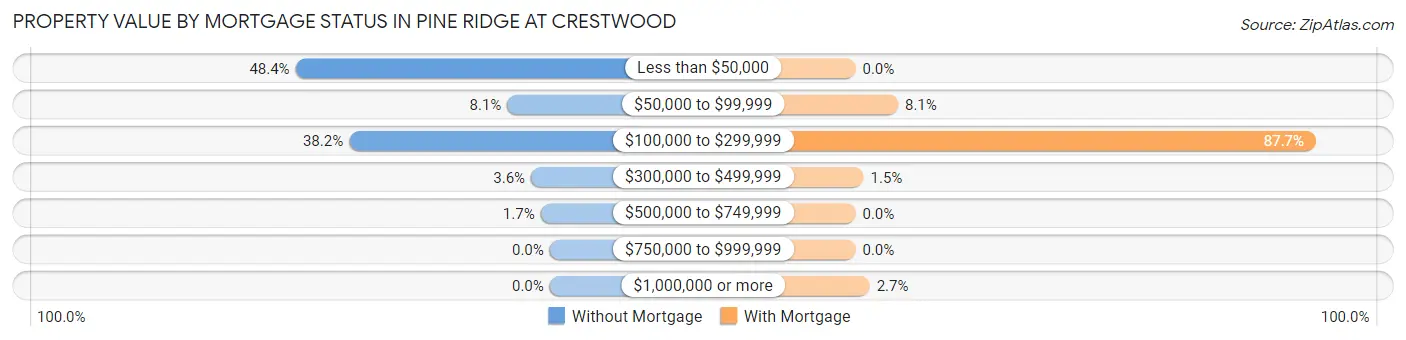
| Property Value | Without Mortgage | With Mortgage |
| Less than $50,000 | 503 (48.4%) | 0 (0.0%) |
| $50,000 to $99,999 | 84 (8.1%) | 42 (8.1%) |
| $100,000 to $299,999 | 397 (38.2%) | 455 (87.7%) |
| $300,000 to $499,999 | 37 (3.6%) | 8 (1.5%) |
| $500,000 to $749,999 | 18 (1.7%) | 0 (0.0%) |
| $750,000 to $999,999 | 0 (0.0%) | 0 (0.0%) |
| $1,000,000 or more | 0 (0.0%) | 14 (2.7%) |
| Total | 1,039 (100.0%) | 519 (100.0%) |
Household Income by Mortgage Status in Pine Ridge at Crestwood
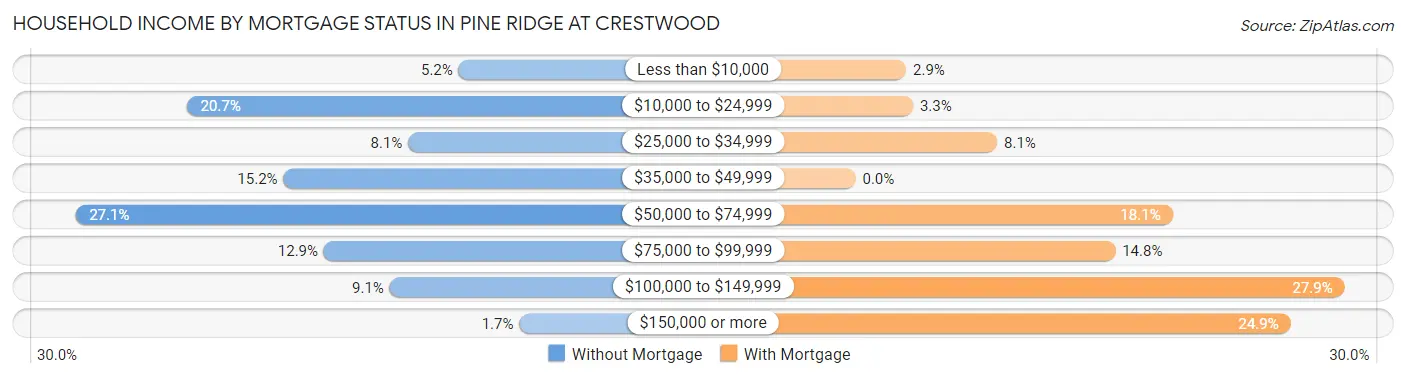
| Household Income | Without Mortgage | With Mortgage |
| Less than $10,000 | 54 (5.2%) | 15 (2.9%) |
| $10,000 to $24,999 | 215 (20.7%) | 17 (3.3%) |
| $25,000 to $34,999 | 84 (8.1%) | 42 (8.1%) |
| $35,000 to $49,999 | 158 (15.2%) | 0 (0.0%) |
| $50,000 to $74,999 | 281 (27.1%) | 94 (18.1%) |
| $75,000 to $99,999 | 134 (12.9%) | 77 (14.8%) |
| $100,000 to $149,999 | 95 (9.1%) | 145 (27.9%) |
| $150,000 or more | 18 (1.7%) | 129 (24.9%) |
| Total | 1,039 (100.0%) | 519 (100.0%) |
Property Value to Household Income Ratio in Pine Ridge at Crestwood
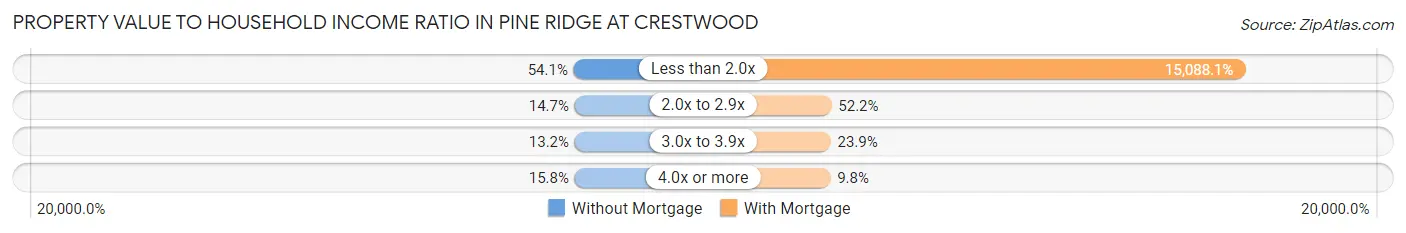
| Value-to-Income Ratio | Without Mortgage | With Mortgage |
| Less than 2.0x | 562 (54.1%) | 78,307 (15,088.1%) |
| 2.0x to 2.9x | 153 (14.7%) | 271 (52.2%) |
| 3.0x to 3.9x | 137 (13.2%) | 124 (23.9%) |
| 4.0x or more | 164 (15.8%) | 51 (9.8%) |
| Total | 1,039 (100.0%) | 519 (100.0%) |
Real Estate Taxes by Mortgage Status in Pine Ridge at Crestwood
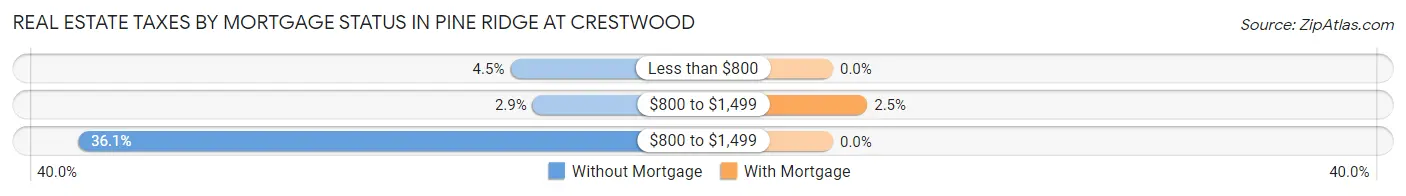
| Property Taxes | Without Mortgage | With Mortgage |
| Less than $800 | 47 (4.5%) | 0 (0.0%) |
| $800 to $1,499 | 30 (2.9%) | 13 (2.5%) |
| $800 to $1,499 | 375 (36.1%) | 0 (0.0%) |
| Total | 1,039 (100.0%) | 519 (100.0%) |
Health & Disability in Pine Ridge at Crestwood
Health Insurance Coverage by Age in Pine Ridge at Crestwood
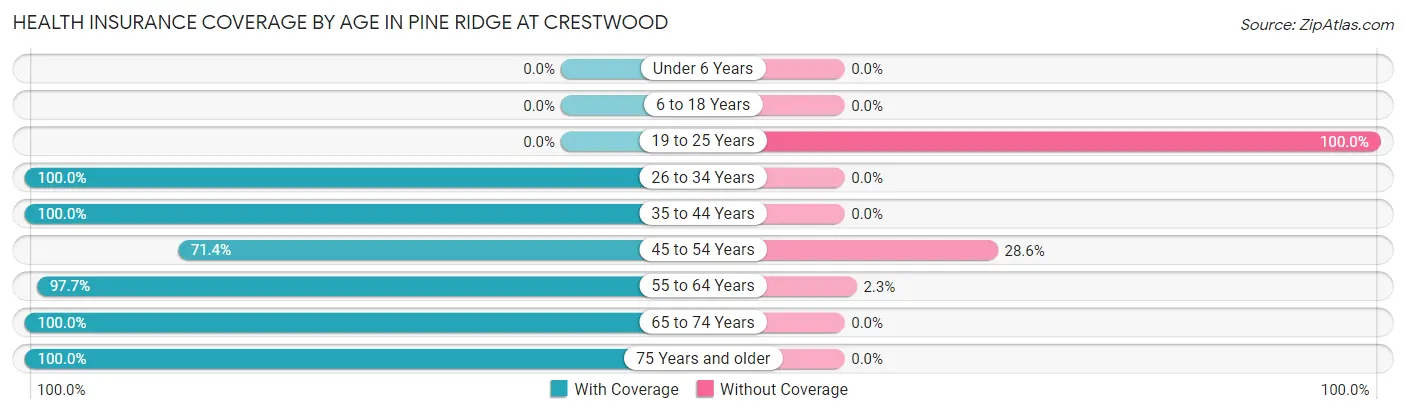
| Age Bracket | With Coverage | Without Coverage |
| Under 6 Years | 0 (0.0%) | 0 (0.0%) |
| 6 to 18 Years | 0 (0.0%) | 0 (0.0%) |
| 19 to 25 Years | 0 (0.0%) | 20 (100.0%) |
| 26 to 34 Years | 27 (100.0%) | 0 (0.0%) |
| 35 to 44 Years | 107 (100.0%) | 0 (0.0%) |
| 45 to 54 Years | 30 (71.4%) | 12 (28.6%) |
| 55 to 64 Years | 862 (97.7%) | 20 (2.3%) |
| 65 to 74 Years | 1,054 (100.0%) | 0 (0.0%) |
| 75 Years and older | 542 (100.0%) | 0 (0.0%) |
| Total | 2,622 (98.1%) | 52 (1.9%) |
Health Insurance Coverage by Citizenship Status in Pine Ridge at Crestwood
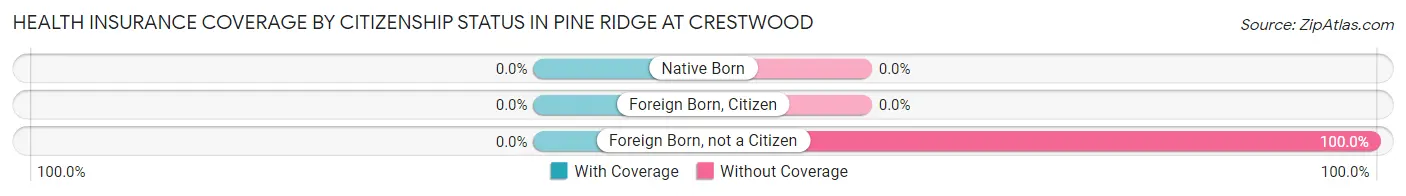
| Citizenship Status | With Coverage | Without Coverage |
| Native Born | 0 (0.0%) | 0 (0.0%) |
| Foreign Born, Citizen | 0 (0.0%) | 0 (0.0%) |
| Foreign Born, not a Citizen | 0 (0.0%) | 20 (100.0%) |
Health Insurance Coverage by Household Income in Pine Ridge at Crestwood
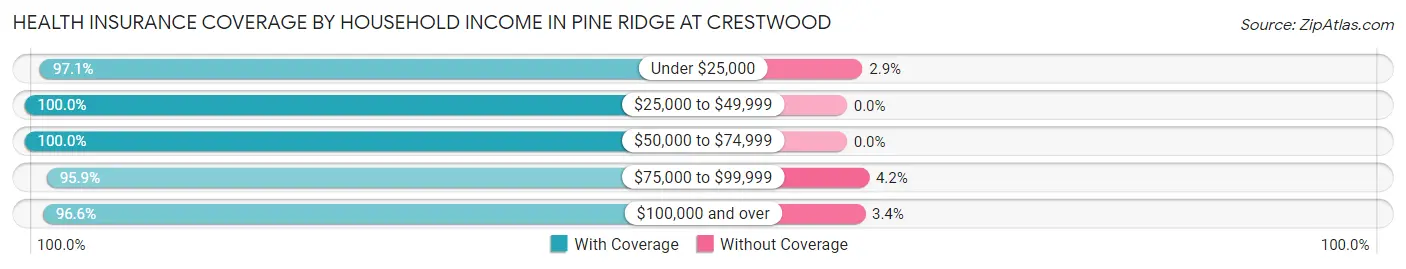
| Household Income | With Coverage | Without Coverage |
| Under $25,000 | 399 (97.1%) | 12 (2.9%) |
| $25,000 to $49,999 | 541 (100.0%) | 0 (0.0%) |
| $50,000 to $74,999 | 655 (100.0%) | 0 (0.0%) |
| $75,000 to $99,999 | 462 (95.9%) | 20 (4.2%) |
| $100,000 and over | 565 (96.6%) | 20 (3.4%) |
Public vs Private Health Insurance Coverage by Age in Pine Ridge at Crestwood
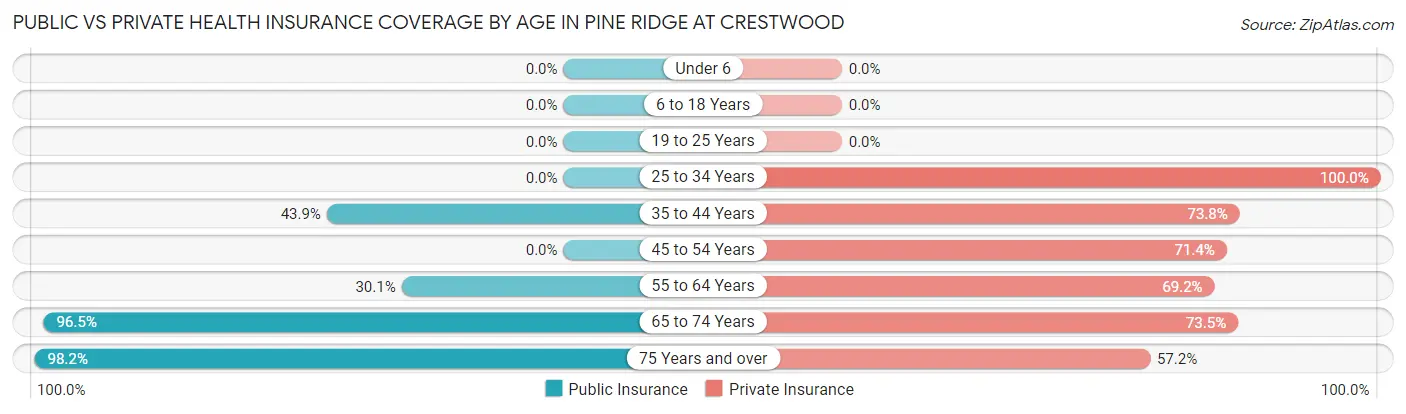
| Age Bracket | Public Insurance | Private Insurance |
| Under 6 | 0 (0.0%) | 0 (0.0%) |
| 6 to 18 Years | 0 (0.0%) | 0 (0.0%) |
| 19 to 25 Years | 0 (0.0%) | 0 (0.0%) |
| 25 to 34 Years | 0 (0.0%) | 27 (100.0%) |
| 35 to 44 Years | 47 (43.9%) | 79 (73.8%) |
| 45 to 54 Years | 0 (0.0%) | 30 (71.4%) |
| 55 to 64 Years | 265 (30.0%) | 610 (69.2%) |
| 65 to 74 Years | 1,017 (96.5%) | 775 (73.5%) |
| 75 Years and over | 532 (98.2%) | 310 (57.2%) |
| Total | 1,861 (69.6%) | 1,831 (68.5%) |
Disability Status by Sex by Age in Pine Ridge at Crestwood
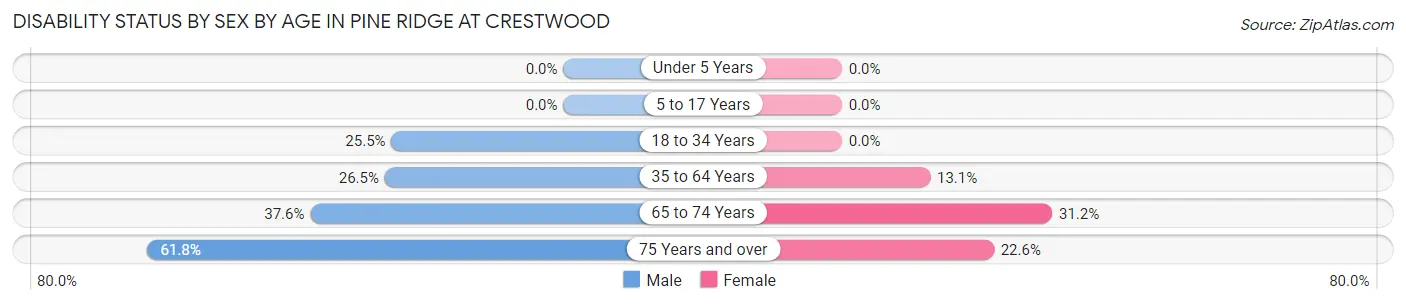
| Age Bracket | Male | Female |
| Under 5 Years | 0 (0.0%) | 0 (0.0%) |
| 5 to 17 Years | 0 (0.0%) | 0 (0.0%) |
| 18 to 34 Years | 12 (25.5%) | 0 (0.0%) |
| 35 to 64 Years | 162 (26.5%) | 55 (13.1%) |
| 65 to 74 Years | 177 (37.6%) | 182 (31.2%) |
| 75 Years and over | 113 (61.8%) | 81 (22.6%) |
Disability Class by Sex by Age in Pine Ridge at Crestwood
Disability Class: Hearing Difficulty
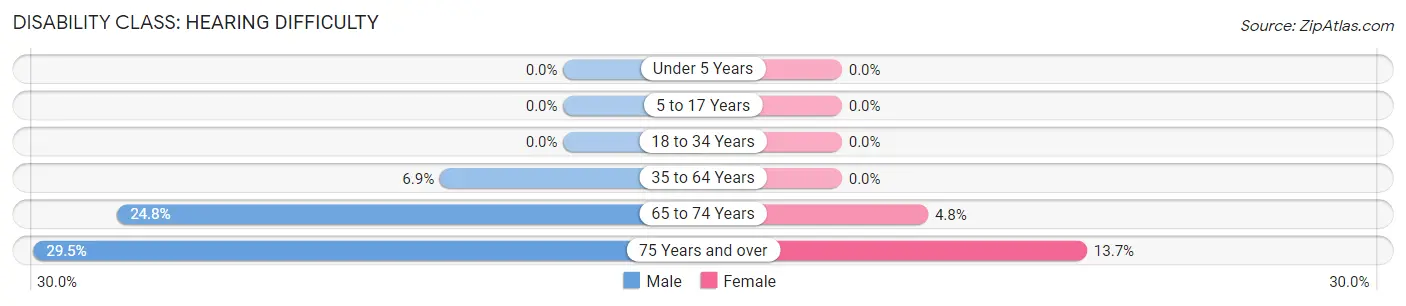
| Age Bracket | Male | Female |
| Under 5 Years | 0 (0.0%) | 0 (0.0%) |
| 5 to 17 Years | 0 (0.0%) | 0 (0.0%) |
| 18 to 34 Years | 0 (0.0%) | 0 (0.0%) |
| 35 to 64 Years | 42 (6.9%) | 0 (0.0%) |
| 65 to 74 Years | 117 (24.8%) | 28 (4.8%) |
| 75 Years and over | 54 (29.5%) | 49 (13.7%) |
Disability Class: Vision Difficulty
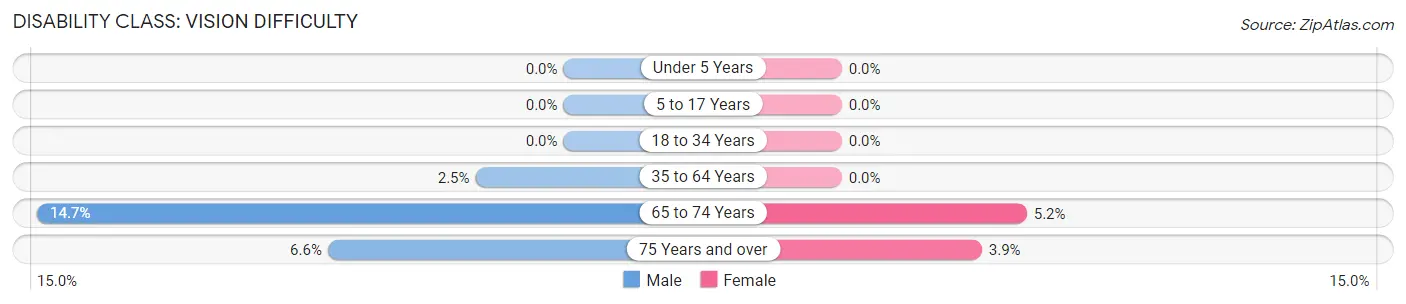
| Age Bracket | Male | Female |
| Under 5 Years | 0 (0.0%) | 0 (0.0%) |
| 5 to 17 Years | 0 (0.0%) | 0 (0.0%) |
| 18 to 34 Years | 0 (0.0%) | 0 (0.0%) |
| 35 to 64 Years | 15 (2.5%) | 0 (0.0%) |
| 65 to 74 Years | 69 (14.6%) | 30 (5.1%) |
| 75 Years and over | 12 (6.6%) | 14 (3.9%) |
Disability Class: Cognitive Difficulty
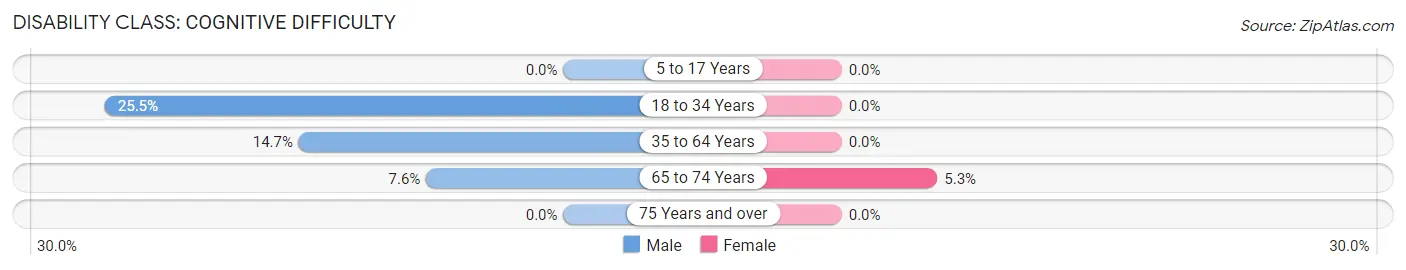
| Age Bracket | Male | Female |
| 5 to 17 Years | 0 (0.0%) | 0 (0.0%) |
| 18 to 34 Years | 12 (25.5%) | 0 (0.0%) |
| 35 to 64 Years | 90 (14.7%) | 0 (0.0%) |
| 65 to 74 Years | 36 (7.6%) | 31 (5.3%) |
| 75 Years and over | 0 (0.0%) | 0 (0.0%) |
Disability Class: Ambulatory Difficulty
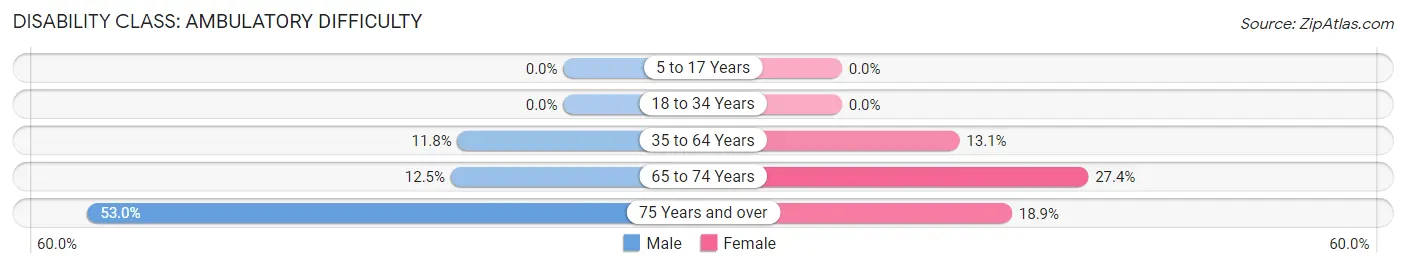
| Age Bracket | Male | Female |
| 5 to 17 Years | 0 (0.0%) | 0 (0.0%) |
| 18 to 34 Years | 0 (0.0%) | 0 (0.0%) |
| 35 to 64 Years | 72 (11.8%) | 55 (13.1%) |
| 65 to 74 Years | 59 (12.5%) | 160 (27.4%) |
| 75 Years and over | 97 (53.0%) | 68 (18.9%) |
Disability Class: Self-Care Difficulty
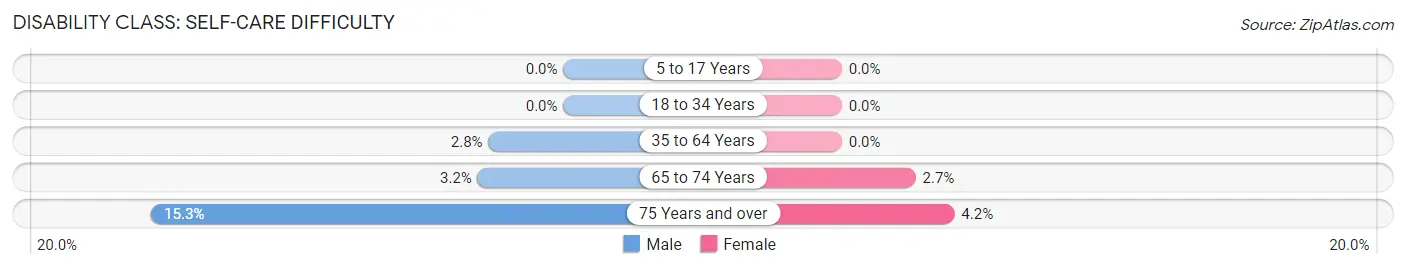
| Age Bracket | Male | Female |
| 5 to 17 Years | 0 (0.0%) | 0 (0.0%) |
| 18 to 34 Years | 0 (0.0%) | 0 (0.0%) |
| 35 to 64 Years | 17 (2.8%) | 0 (0.0%) |
| 65 to 74 Years | 15 (3.2%) | 16 (2.7%) |
| 75 Years and over | 28 (15.3%) | 15 (4.2%) |
Technology Access in Pine Ridge at Crestwood
Computing Device Access in Pine Ridge at Crestwood
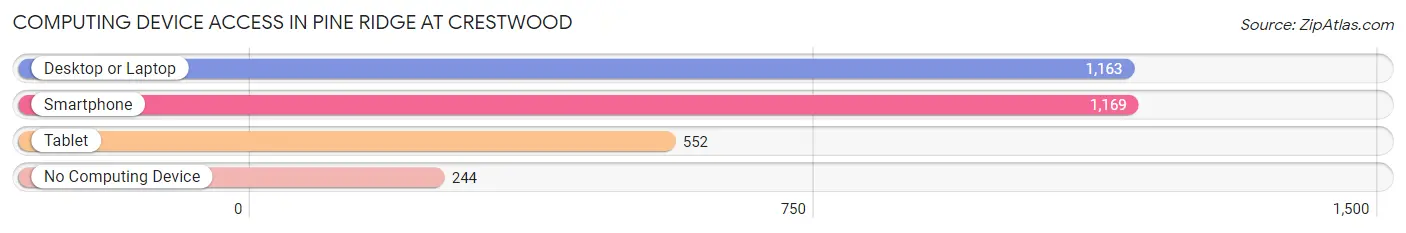
| Device Type | # Households | % Households |
| Desktop or Laptop | 1,163 | 70.8% |
| Smartphone | 1,169 | 71.2% |
| Tablet | 552 | 33.6% |
| No Computing Device | 244 | 14.8% |
| Total | 1,643 | 100.0% |
Internet Access in Pine Ridge at Crestwood
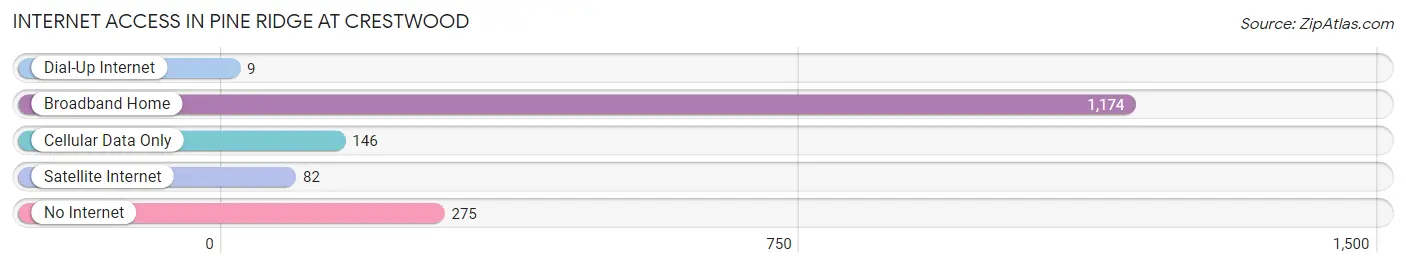
| Internet Type | # Households | % Households |
| Dial-Up Internet | 9 | 0.5% |
| Broadband Home | 1,174 | 71.5% |
| Cellular Data Only | 146 | 8.9% |
| Satellite Internet | 82 | 5.0% |
| No Internet | 275 | 16.7% |
| Total | 1,643 | 100.0% |
Pine Ridge at Crestwood Summary
Pine Ridge at Crestwood is a census-designated place (CDP) located in Morris County, New Jersey. It is situated within the township of Washington, and is part of the New York metropolitan area. As of the 2010 United States Census, the CDP had a population of 4,845.
History
The area now known as Pine Ridge at Crestwood was originally inhabited by the Lenni Lenape Native Americans. The first European settlers arrived in the area in the late 17th century, and the area was part of the Province of New Jersey until the American Revolution. After the Revolution, the area was part of the newly formed Morris County.
In the late 19th century, the area was developed as a summer resort community, and was known as Crestwood. The area was home to several large estates, and was a popular destination for wealthy New Yorkers. In the early 20th century, the area began to be developed as a residential community, and the name was changed to Pine Ridge at Crestwood.
Geography
Pine Ridge at Crestwood is located at 40°51'17" North, 74°35'17" West (40.854722, -74.588333). According to the United States Census Bureau, the CDP has a total area of 2.2 square miles (5.7 km2), all of which is land.
The CDP is located in the western part of Morris County, and is bordered to the north by the township of Washington, to the east by the township of Mount Olive, to the south by the township of Roxbury, and to the west by the township of Jefferson.
Economy
The economy of Pine Ridge at Crestwood is largely based on the service industry. The area is home to several small businesses, including restaurants, retail stores, and professional services. The area is also home to several corporate offices, including those of AT&T, Verizon, and Prudential Financial.
Demographics
As of the 2010 United States Census, there were 4,845 people, 1,845 households, and 1,323 families residing in the CDP. The population density was 2,179.5 people per square mile (841.3/km2). There were 1,945 housing units at an average density of 872.7 per square mile (337.2/km2). The racial makeup of the CDP was 87.2% White, 4.2% African American, 0.2% Native American, 5.2% Asian, 0.1% Pacific Islander, 1.3% from other races, and 1.9% from two or more races. Hispanic or Latino of any race were 6.7% of the population.
There were 1,845 households, out of which 33.2% had children under the age of 18 living with them, 57.2% were married couples living together, 9.2% had a female householder with no husband present, and 29.7% were non-families. 24.2% of all households were made up of individuals, and 9.2% had someone living alone who was 65 years of age or older. The average household size was 2.63 and the average family size was 3.17.
In the CDP, the population was spread out, with 24.2% under the age of 18, 6.2% from 18 to 24, 28.2% from 25 to 44, 28.2% from 45 to 64, and 13.2% who were 65 years of age or older. The median age was 40 years. For every 100 females, there were 94.2 males. For every 100 females age 18 and over, there were 91.2 males.
The median income for a household in the CDP was $76,944, and the median income for a family was $90,938. Males had a median income of $60,000 versus $41,250 for females. The per capita income for the CDP was $35,945. About 2.2% of families and 3.2% of the population were below the poverty line, including 3.2% of those under age 18 and 4.2% of those age 65 or over.
Common Questions
What is Per Capita Income in Pine Ridge at Crestwood?
Per Capita income in Pine Ridge at Crestwood is $37,744.
What is the Median Family Income in Pine Ridge at Crestwood?
Median Family Income in Pine Ridge at Crestwood is $62,140.
What is the Median Household income in Pine Ridge at Crestwood?
Median Household Income in Pine Ridge at Crestwood is $56,750.
What is Income or Wage Gap in Pine Ridge at Crestwood?
Income or Wage Gap in Pine Ridge at Crestwood is 5.9%.
Women in Pine Ridge at Crestwood earn 94.1 cents for every dollar earned by a man.
What is Inequality or Gini Index in Pine Ridge at Crestwood?
Inequality or Gini Index in Pine Ridge at Crestwood is 0.37.
What is the Total Population of Pine Ridge at Crestwood?
Total Population of Pine Ridge at Crestwood is 2,674.
What is the Total Male Population of Pine Ridge at Crestwood?
Total Male Population of Pine Ridge at Crestwood is 1,312.
What is the Total Female Population of Pine Ridge at Crestwood?
Total Female Population of Pine Ridge at Crestwood is 1,362.
What is the Ratio of Males per 100 Females in Pine Ridge at Crestwood?
There are 96.33 Males per 100 Females in Pine Ridge at Crestwood.
What is the Ratio of Females per 100 Males in Pine Ridge at Crestwood?
There are 103.81 Females per 100 Males in Pine Ridge at Crestwood.
What is the Median Population Age in Pine Ridge at Crestwood?
Median Population Age in Pine Ridge at Crestwood is 67.6 Years.
What is the Average Family Size in Pine Ridge at Crestwood
Average Family Size in Pine Ridge at Crestwood is 2.1 People.
What is the Average Household Size in Pine Ridge at Crestwood
Average Household Size in Pine Ridge at Crestwood is 1.6 People.
How Large is the Labor Force in Pine Ridge at Crestwood?
There are 909 People in the Labor Forcein in Pine Ridge at Crestwood.
What is the Percentage of People in the Labor Force in Pine Ridge at Crestwood?
34.0% of People are in the Labor Force in Pine Ridge at Crestwood.
What is the Unemployment Rate in Pine Ridge at Crestwood?
Unemployment Rate in Pine Ridge at Crestwood is 9.9%.