Elwood, NJ Map & Demographics
Elwood Map
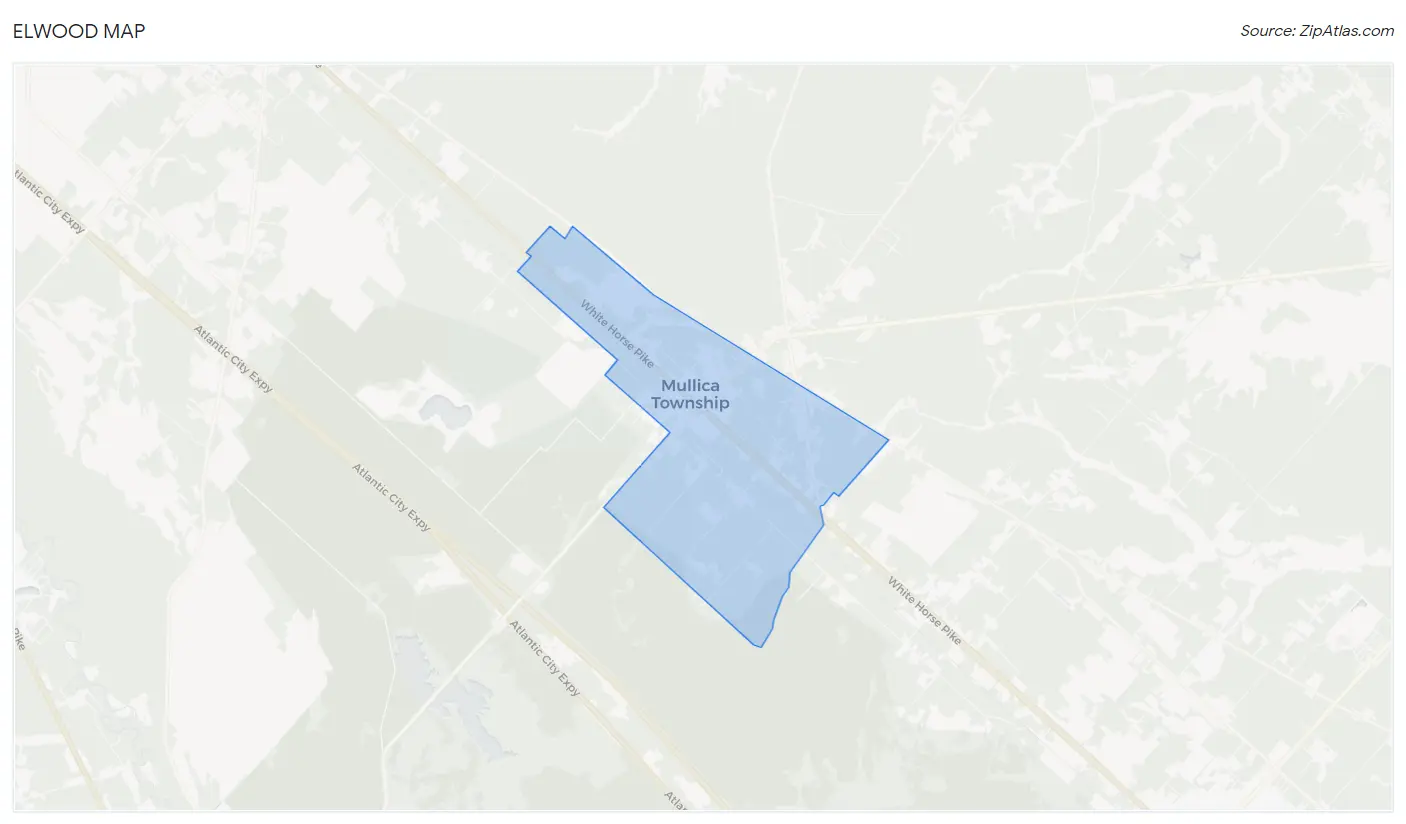
Elwood Overview
$34,478
PER CAPITA INCOME
$78,034
AVG FAMILY INCOME
$68,043
AVG HOUSEHOLD INCOME
63.2%
WAGE / INCOME GAP [ % ]
36.8¢/ $1
WAGE / INCOME GAP [ $ ]
0.33
INEQUALITY / GINI INDEX
919
TOTAL POPULATION
380
MALE POPULATION
539
FEMALE POPULATION
70.50
MALES / 100 FEMALES
141.84
FEMALES / 100 MALES
58.4
MEDIAN AGE
2.4
AVG FAMILY SIZE
2.2
AVG HOUSEHOLD SIZE
465
LABOR FORCE [ PEOPLE ]
54.9%
PERCENT IN LABOR FORCE
11.2%
UNEMPLOYMENT RATE
Income in Elwood
Income Overview in Elwood
Per Capita Income in Elwood is $34,478, while median incomes of families and households are $78,034 and $68,043 respectively.
| Characteristic | Number | Measure |
| Per Capita Income | 919 | $34,478 |
| Median Family Income | 246 | $78,034 |
| Mean Family Income | 246 | $88,211 |
| Median Household Income | 372 | $68,043 |
| Mean Household Income | 372 | $76,705 |
| Income Deficit | 246 | $0 |
| Wage / Income Gap (%) | 919 | 63.22% |
| Wage / Income Gap ($) | 919 | 36.78¢ per $1 |
| Gini / Inequality Index | 919 | 0.33 |
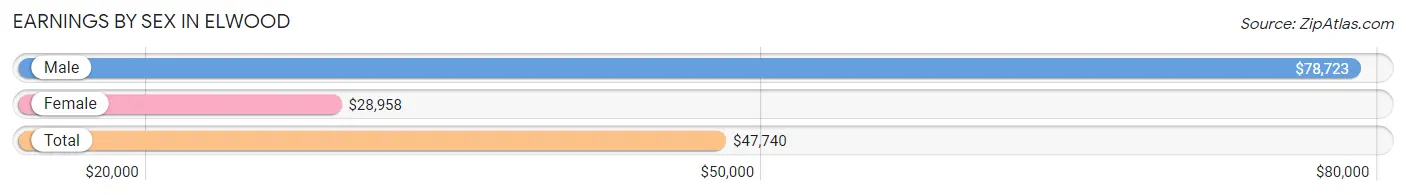
Earnings by Sex in Elwood
Average Earnings in Elwood are $47,740, $78,723 for men and $28,958 for women, a difference of 63.2%.
| Sex | Number | Average Earnings |
| Male | 192 (46.5%) | $78,723 |
| Female | 221 (53.5%) | $28,958 |
| Total | 413 (100.0%) | $47,740 |
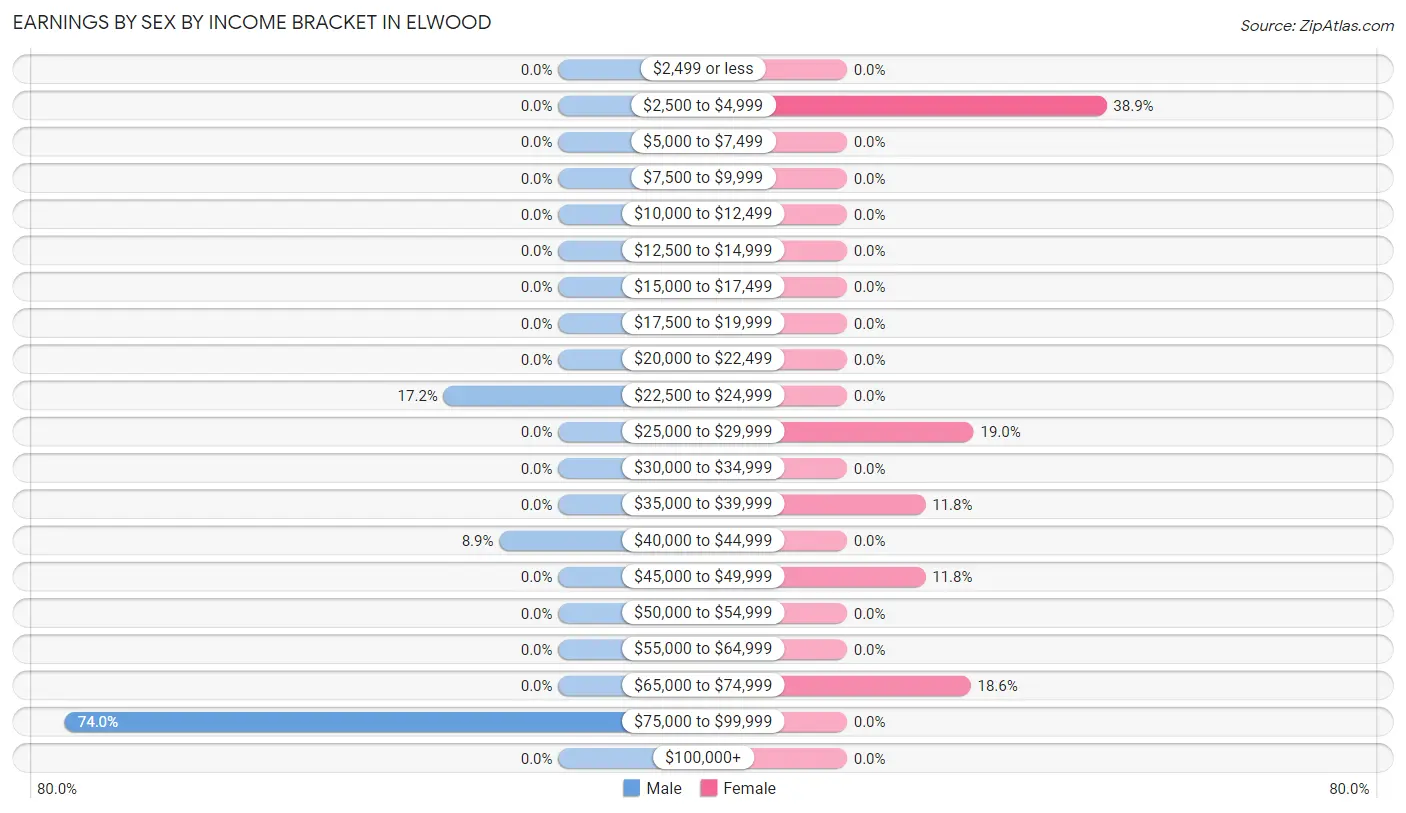
Earnings by Sex by Income Bracket in Elwood
The most common earnings brackets in Elwood are $75,000 to $99,999 for men (142 | 74.0%) and $2,500 to $4,999 for women (86 | 38.9%).
| Income | Male | Female |
| $2,499 or less | 0 (0.0%) | 0 (0.0%) |
| $2,500 to $4,999 | 0 (0.0%) | 86 (38.9%) |
| $5,000 to $7,499 | 0 (0.0%) | 0 (0.0%) |
| $7,500 to $9,999 | 0 (0.0%) | 0 (0.0%) |
| $10,000 to $12,499 | 0 (0.0%) | 0 (0.0%) |
| $12,500 to $14,999 | 0 (0.0%) | 0 (0.0%) |
| $15,000 to $17,499 | 0 (0.0%) | 0 (0.0%) |
| $17,500 to $19,999 | 0 (0.0%) | 0 (0.0%) |
| $20,000 to $22,499 | 0 (0.0%) | 0 (0.0%) |
| $22,500 to $24,999 | 33 (17.2%) | 0 (0.0%) |
| $25,000 to $29,999 | 0 (0.0%) | 42 (19.0%) |
| $30,000 to $34,999 | 0 (0.0%) | 0 (0.0%) |
| $35,000 to $39,999 | 0 (0.0%) | 26 (11.8%) |
| $40,000 to $44,999 | 17 (8.8%) | 0 (0.0%) |
| $45,000 to $49,999 | 0 (0.0%) | 26 (11.8%) |
| $50,000 to $54,999 | 0 (0.0%) | 0 (0.0%) |
| $55,000 to $64,999 | 0 (0.0%) | 0 (0.0%) |
| $65,000 to $74,999 | 0 (0.0%) | 41 (18.5%) |
| $75,000 to $99,999 | 142 (74.0%) | 0 (0.0%) |
| $100,000+ | 0 (0.0%) | 0 (0.0%) |
| Total | 192 (100.0%) | 221 (100.0%) |
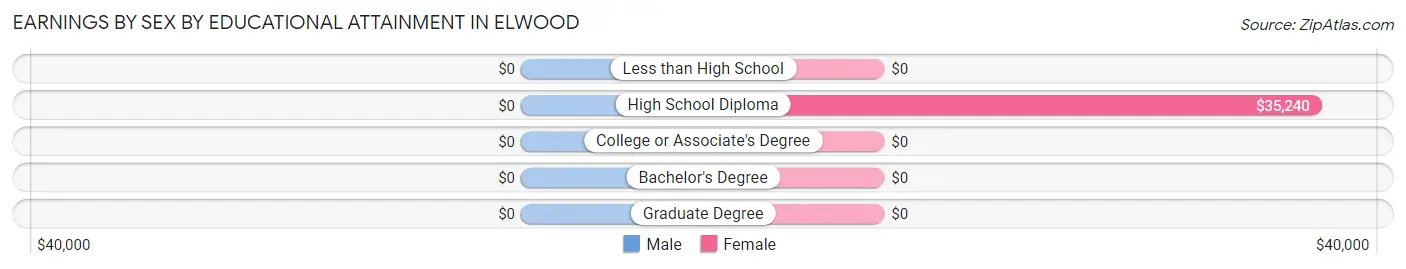
Earnings by Sex by Educational Attainment in Elwood
| Educational Attainment | Male Income | Female Income |
| Less than High School | - | - |
| High School Diploma | - | - |
| College or Associate's Degree | - | - |
| Bachelor's Degree | - | - |
| Graduate Degree | - | - |
| Total | $79,162 | $28,958 |
Family Income in Elwood
Family Income Brackets in Elwood
According to the Elwood family income data, there are 101 families falling into the $75,000 to $99,999 income range, which is the most common income bracket and makes up 41.1% of all families.
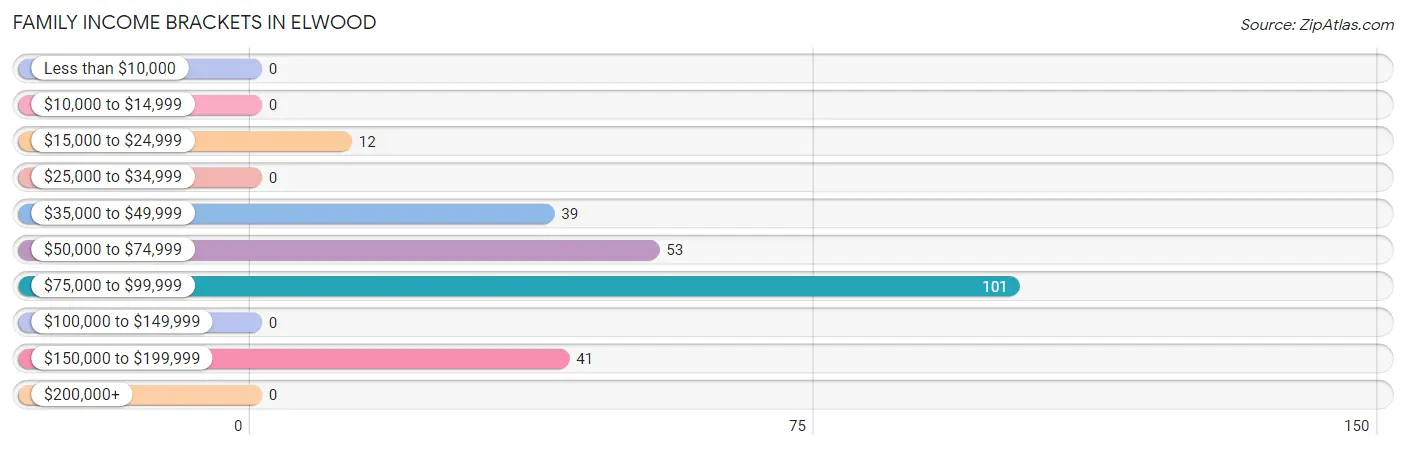
| Income Bracket | # Families | % Families |
| Less than $10,000 | 0 | 0.0% |
| $10,000 to $14,999 | 0 | 0.0% |
| $15,000 to $24,999 | 12 | 4.9% |
| $25,000 to $34,999 | 0 | 0.0% |
| $35,000 to $49,999 | 39 | 15.9% |
| $50,000 to $74,999 | 53 | 21.5% |
| $75,000 to $99,999 | 101 | 41.1% |
| $100,000 to $149,999 | 0 | 0.0% |
| $150,000 to $199,999 | 41 | 16.7% |
| $200,000+ | 0 | 0.0% |
Family Income by Famaliy Size in Elwood
2-person families (210 | 85.4%) account for the highest median family income in Elwood with $78,539 per family, while 2-person families (210 | 85.4%) have the highest median income of $39,270 per family member.
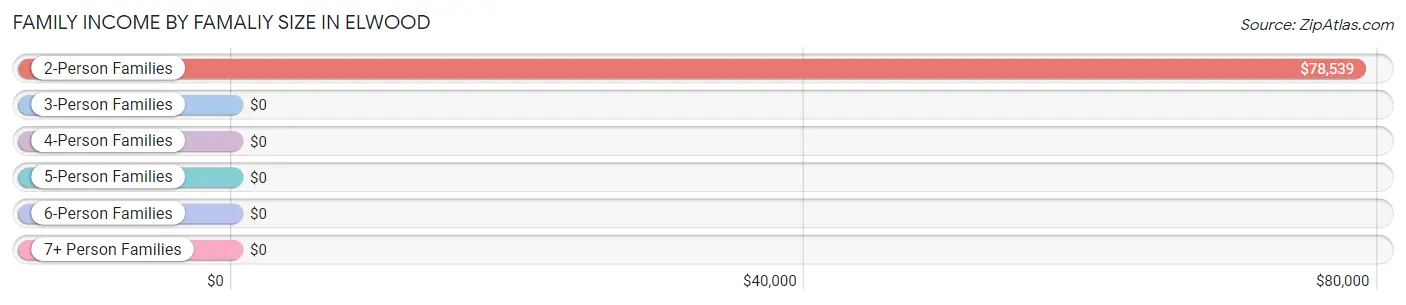
| Income Bracket | # Families | Median Income |
| 2-Person Families | 210 (85.4%) | $78,539 |
| 3-Person Families | 23 (9.3%) | $0 |
| 4-Person Families | 13 (5.3%) | $0 |
| 5-Person Families | 0 (0.0%) | $0 |
| 6-Person Families | 0 (0.0%) | $0 |
| 7+ Person Families | 0 (0.0%) | $0 |
| Total | 246 (100.0%) | $78,034 |
Family Income by Number of Earners in Elwood
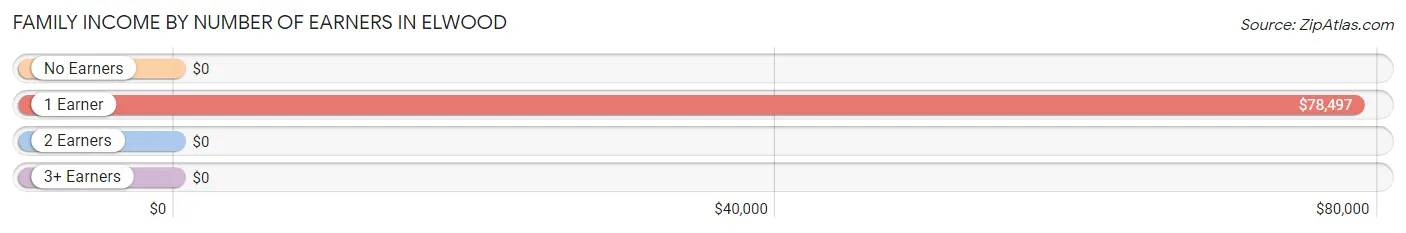
| Number of Earners | # Families | Median Income |
| No Earners | 51 (20.7%) | $0 |
| 1 Earner | 131 (53.2%) | $78,497 |
| 2 Earners | 64 (26.0%) | $0 |
| 3+ Earners | 0 (0.0%) | $0 |
| Total | 246 (100.0%) | $78,034 |
Household Income in Elwood
Household Income Brackets in Elwood
With 115 households falling in the category, the $75,000 to $99,999 income range is the most frequent in Elwood, accounting for 30.9% of all households.
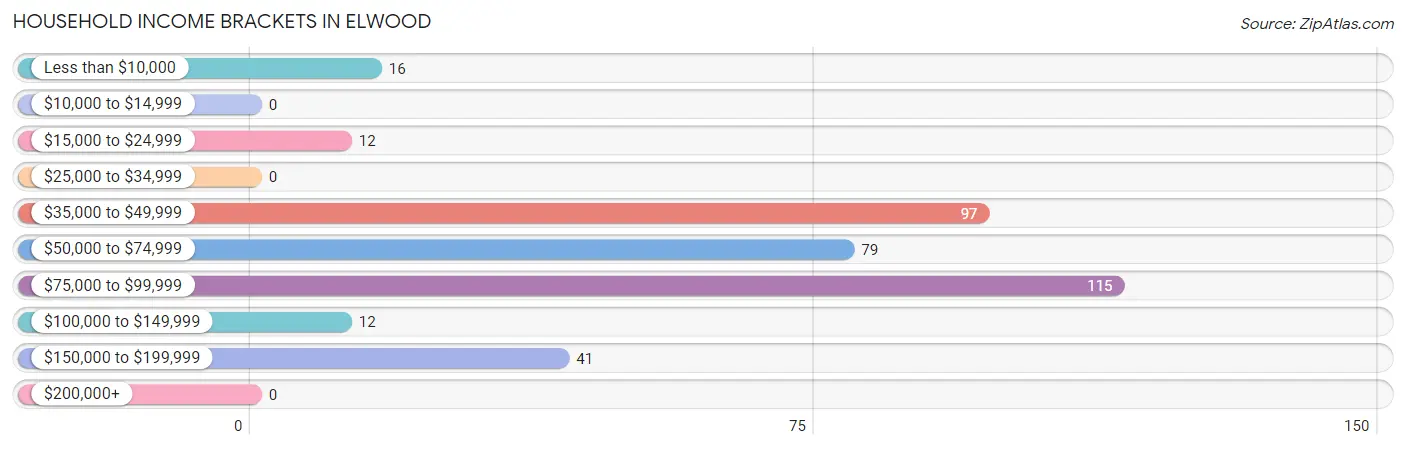
| Income Bracket | # Households | % Households |
| Less than $10,000 | 16 | 4.3% |
| $10,000 to $14,999 | 0 | 0.0% |
| $15,000 to $24,999 | 12 | 3.2% |
| $25,000 to $34,999 | 0 | 0.0% |
| $35,000 to $49,999 | 97 | 26.1% |
| $50,000 to $74,999 | 79 | 21.2% |
| $75,000 to $99,999 | 115 | 30.9% |
| $100,000 to $149,999 | 12 | 3.2% |
| $150,000 to $199,999 | 41 | 11.0% |
| $200,000+ | 0 | 0.0% |
Household Income by Householder Age in Elwood
The median household income in Elwood is $68,043, with the highest median household income of $78,539 found in the 45 to 64 years age bracket for the primary householder. A total of 186 households (50.0%) fall into this category.
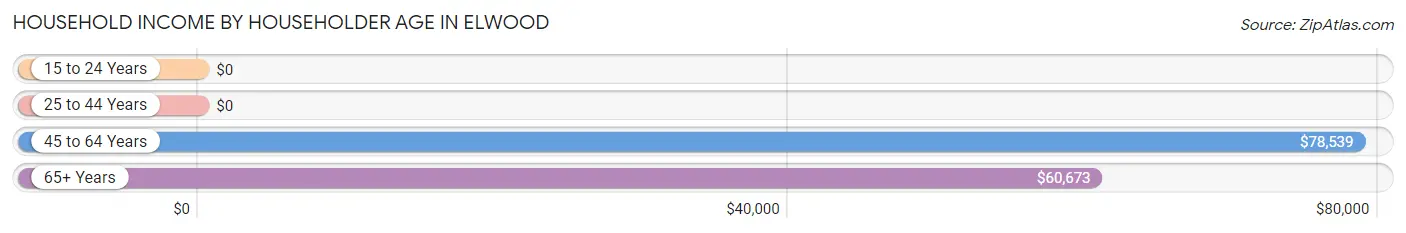
| Income Bracket | # Households | Median Income |
| 15 to 24 Years | 0 (0.0%) | $0 |
| 25 to 44 Years | 0 (0.0%) | $0 |
| 45 to 64 Years | 186 (50.0%) | $78,539 |
| 65+ Years | 186 (50.0%) | $60,673 |
| Total | 372 (100.0%) | $68,043 |
Poverty in Elwood
Income Below Poverty by Sex and Age in Elwood
With 7.8% poverty level for males and 14.0% for females among the residents of Elwood, 45 to 54 year old males and 35 to 44 year old females are the most vulnerable to poverty, with 29 males (23.6%) and 28 females (100.0%) in their respective age groups living below the poverty level.
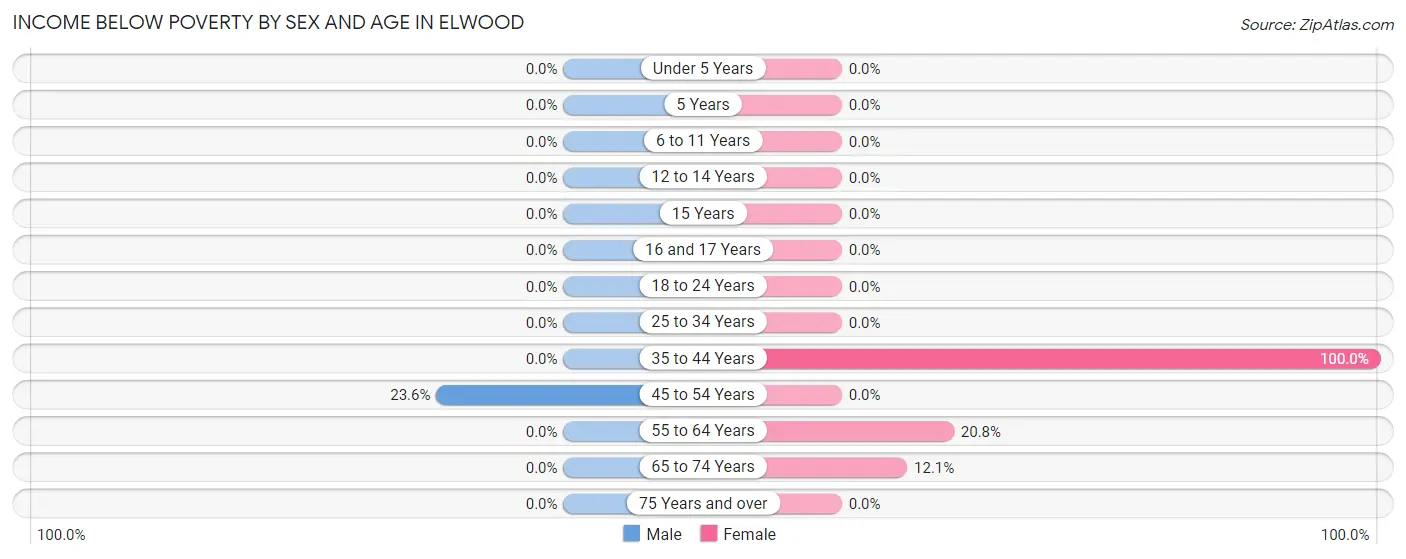
| Age Bracket | Male | Female |
| Under 5 Years | 0 (0.0%) | 0 (0.0%) |
| 5 Years | 0 (0.0%) | 0 (0.0%) |
| 6 to 11 Years | 0 (0.0%) | 0 (0.0%) |
| 12 to 14 Years | 0 (0.0%) | 0 (0.0%) |
| 15 Years | 0 (0.0%) | 0 (0.0%) |
| 16 and 17 Years | 0 (0.0%) | 0 (0.0%) |
| 18 to 24 Years | 0 (0.0%) | 0 (0.0%) |
| 25 to 34 Years | 0 (0.0%) | 0 (0.0%) |
| 35 to 44 Years | 0 (0.0%) | 28 (100.0%) |
| 45 to 54 Years | 29 (23.6%) | 0 (0.0%) |
| 55 to 64 Years | 0 (0.0%) | 26 (20.8%) |
| 65 to 74 Years | 0 (0.0%) | 16 (12.1%) |
| 75 Years and over | 0 (0.0%) | 0 (0.0%) |
| Total | 29 (7.8%) | 70 (14.0%) |
Income Above Poverty by Sex and Age in Elwood
According to the poverty statistics in Elwood, males aged 6 to 11 years and females aged under 5 years are the age groups that are most secure financially, with 100.0% of males and 100.0% of females in these age groups living above the poverty line.
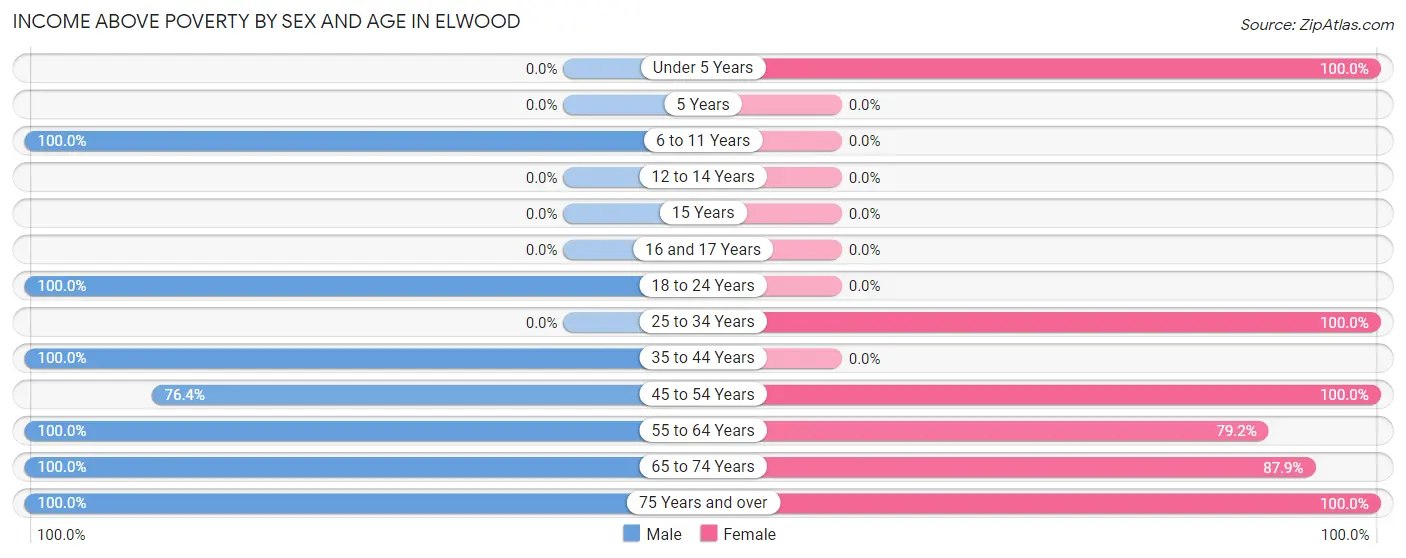
| Age Bracket | Male | Female |
| Under 5 Years | 0 (0.0%) | 28 (100.0%) |
| 5 Years | 0 (0.0%) | 0 (0.0%) |
| 6 to 11 Years | 20 (100.0%) | 0 (0.0%) |
| 12 to 14 Years | 0 (0.0%) | 0 (0.0%) |
| 15 Years | 0 (0.0%) | 0 (0.0%) |
| 16 and 17 Years | 0 (0.0%) | 0 (0.0%) |
| 18 to 24 Years | 33 (100.0%) | 0 (0.0%) |
| 25 to 34 Years | 0 (0.0%) | 49 (100.0%) |
| 35 to 44 Years | 48 (100.0%) | 0 (0.0%) |
| 45 to 54 Years | 94 (76.4%) | 89 (100.0%) |
| 55 to 64 Years | 17 (100.0%) | 99 (79.2%) |
| 65 to 74 Years | 123 (100.0%) | 116 (87.9%) |
| 75 Years and over | 9 (100.0%) | 48 (100.0%) |
| Total | 344 (92.2%) | 429 (86.0%) |
Income Below Poverty Among Married-Couple Families in Elwood
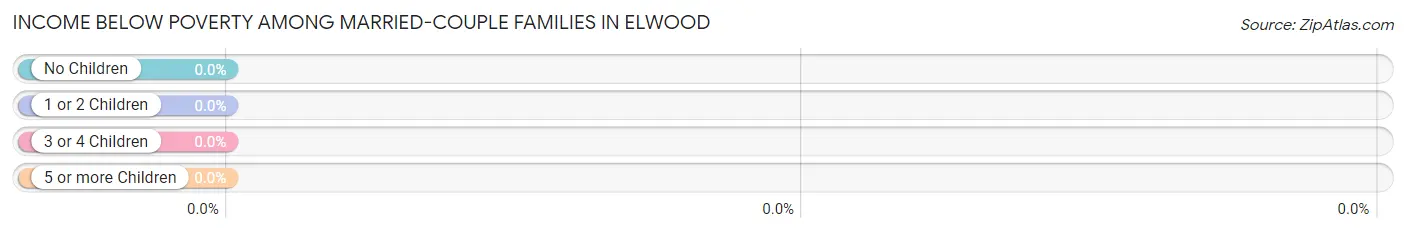
| Children | Above Poverty | Below Poverty |
| No Children | 169 (100.0%) | 0 (0.0%) |
| 1 or 2 Children | 0 (0.0%) | 0 (0.0%) |
| 3 or 4 Children | 0 (0.0%) | 0 (0.0%) |
| 5 or more Children | 0 (0.0%) | 0 (0.0%) |
| Total | 169 (100.0%) | 0 (0.0%) |
Income Below Poverty Among Single-Parent Households in Elwood
| Children | Single Father | Single Mother |
| No Children | 0 (0.0%) | 0 (0.0%) |
| 1 or 2 Children | 0 (0.0%) | 0 (0.0%) |
| 3 or 4 Children | 0 (0.0%) | 0 (0.0%) |
| 5 or more Children | 0 (0.0%) | 0 (0.0%) |
| Total | 0 (0.0%) | 0 (0.0%) |
Income Below Poverty Among Married-Couple vs Single-Parent Households in Elwood
| Children | Married-Couple Families | Single-Parent Households |
| No Children | 0 (0.0%) | 0 (0.0%) |
| 1 or 2 Children | 0 (0.0%) | 0 (0.0%) |
| 3 or 4 Children | 0 (0.0%) | 0 (0.0%) |
| 5 or more Children | 0 (0.0%) | 0 (0.0%) |
| Total | 0 (0.0%) | 0 (0.0%) |
Race in Elwood
The most populous races in Elwood are White / Caucasian (415 | 45.2%), Black / African American (315 | 34.3%), and Hispanic or Latino (258 | 28.1%).
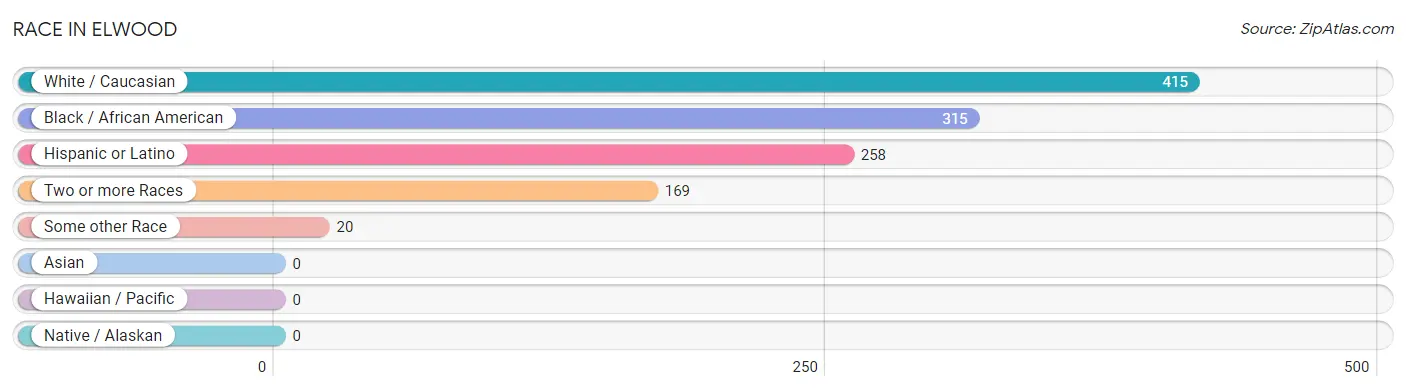
| Race | # Population | % Population |
| Asian | 0 | 0.0% |
| Black / African American | 315 | 34.3% |
| Hawaiian / Pacific | 0 | 0.0% |
| Hispanic or Latino | 258 | 28.1% |
| Native / Alaskan | 0 | 0.0% |
| White / Caucasian | 415 | 45.2% |
| Two or more Races | 169 | 18.4% |
| Some other Race | 20 | 2.2% |
| Total | 919 | 100.0% |
Ancestry in Elwood
The most populous ancestries reported in Elwood are Puerto Rican (209 | 22.7%), Italian (177 | 19.3%), English (112 | 12.2%), Polish (109 | 11.9%), and German (59 | 6.4%), together accounting for 72.5% of all Elwood residents.
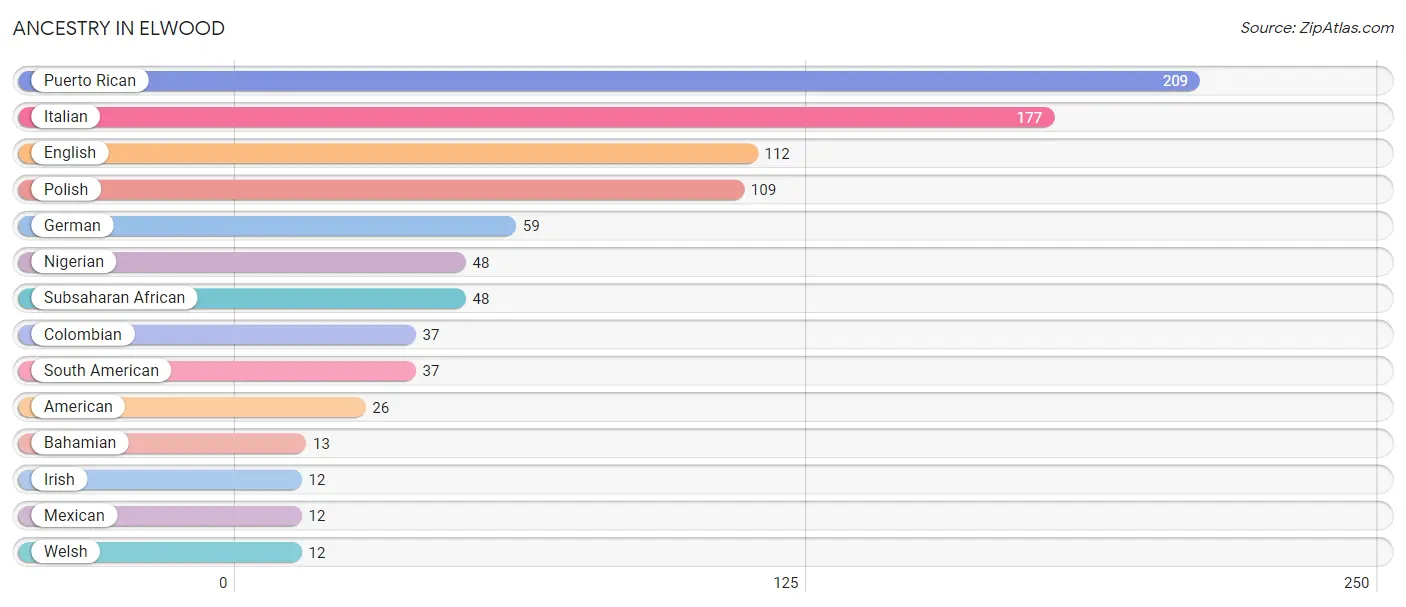
| Ancestry | # Population | % Population |
| American | 26 | 2.8% |
| Bahamian | 13 | 1.4% |
| Colombian | 37 | 4.0% |
| English | 112 | 12.2% |
| German | 59 | 6.4% |
| Irish | 12 | 1.3% |
| Italian | 177 | 19.3% |
| Mexican | 12 | 1.3% |
| Nigerian | 48 | 5.2% |
| Polish | 109 | 11.9% |
| Puerto Rican | 209 | 22.7% |
| South American | 37 | 4.0% |
| Subsaharan African | 48 | 5.2% |
| Welsh | 12 | 1.3% | View All 14 Rows |
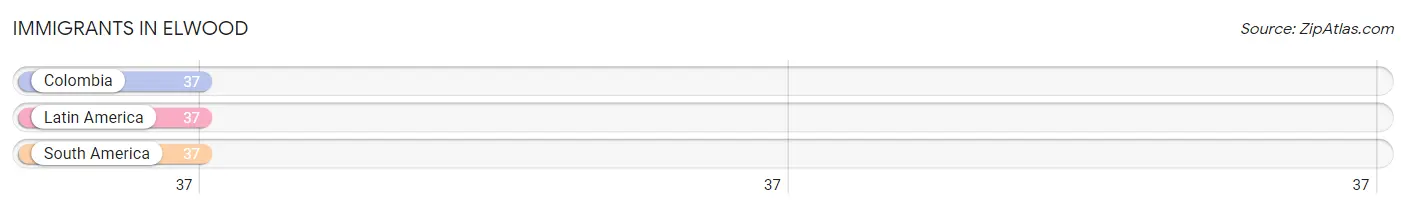
Immigrants in Elwood
The most numerous immigrant groups reported in Elwood came from Colombia (37 | 4.0%), Latin America (37 | 4.0%), and South America (37 | 4.0%), together accounting for 12.1% of all Elwood residents.
| Immigration Origin | # Population | % Population |
| Colombia | 37 | 4.0% |
| Latin America | 37 | 4.0% |
| South America | 37 | 4.0% | View All 3 Rows |
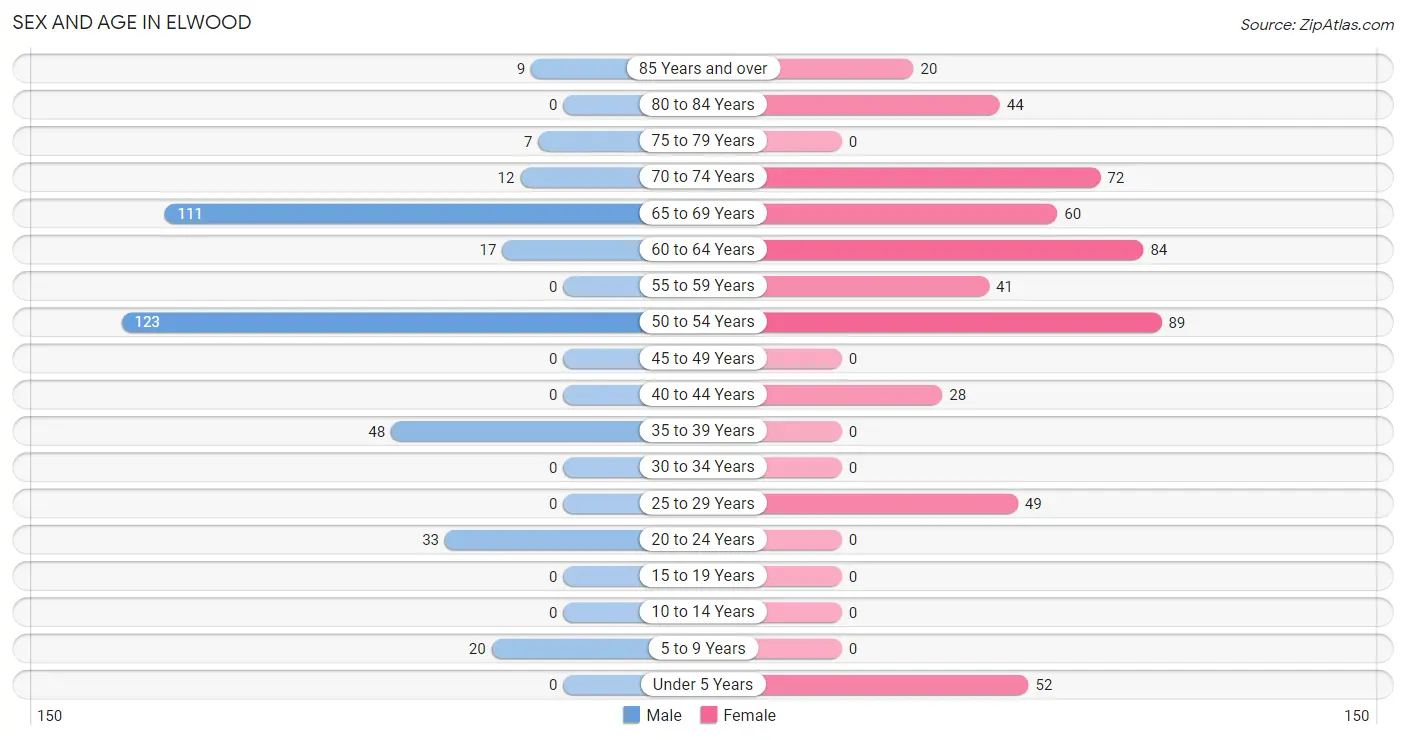
Sex and Age in Elwood
Sex and Age in Elwood
The most populous age groups in Elwood are 50 to 54 Years (123 | 32.4%) for men and 50 to 54 Years (89 | 16.5%) for women.
| Age Bracket | Male | Female |
| Under 5 Years | 0 (0.0%) | 52 (9.7%) |
| 5 to 9 Years | 20 (5.3%) | 0 (0.0%) |
| 10 to 14 Years | 0 (0.0%) | 0 (0.0%) |
| 15 to 19 Years | 0 (0.0%) | 0 (0.0%) |
| 20 to 24 Years | 33 (8.7%) | 0 (0.0%) |
| 25 to 29 Years | 0 (0.0%) | 49 (9.1%) |
| 30 to 34 Years | 0 (0.0%) | 0 (0.0%) |
| 35 to 39 Years | 48 (12.6%) | 0 (0.0%) |
| 40 to 44 Years | 0 (0.0%) | 28 (5.2%) |
| 45 to 49 Years | 0 (0.0%) | 0 (0.0%) |
| 50 to 54 Years | 123 (32.4%) | 89 (16.5%) |
| 55 to 59 Years | 0 (0.0%) | 41 (7.6%) |
| 60 to 64 Years | 17 (4.5%) | 84 (15.6%) |
| 65 to 69 Years | 111 (29.2%) | 60 (11.1%) |
| 70 to 74 Years | 12 (3.2%) | 72 (13.4%) |
| 75 to 79 Years | 7 (1.8%) | 0 (0.0%) |
| 80 to 84 Years | 0 (0.0%) | 44 (8.2%) |
| 85 Years and over | 9 (2.4%) | 20 (3.7%) |
| Total | 380 (100.0%) | 539 (100.0%) |
Families and Households in Elwood
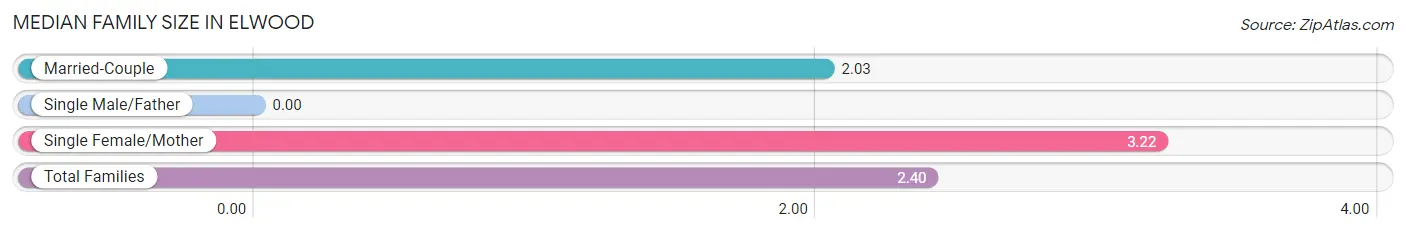
Median Family Size in Elwood
| Family Type | # Families | Family Size |
| Married-Couple | 169 (68.7%) | 2.03 |
| Single Male/Father | 0 (0.0%) | - |
| Single Female/Mother | 77 (31.3%) | 3.22 |
| Total Families | 246 (100.0%) | 2.40 |
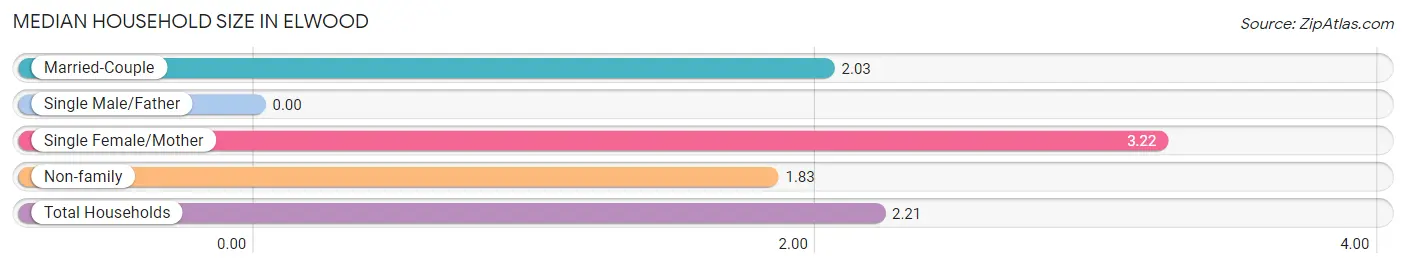
Median Household Size in Elwood
| Household Type | # Households | Household Size |
| Married-Couple | 169 (45.4%) | 2.03 |
| Single Male/Father | 0 (0.0%) | - |
| Single Female/Mother | 77 (20.7%) | 3.22 |
| Non-family | 126 (33.9%) | 1.83 |
| Total Households | 372 (100.0%) | 2.21 |
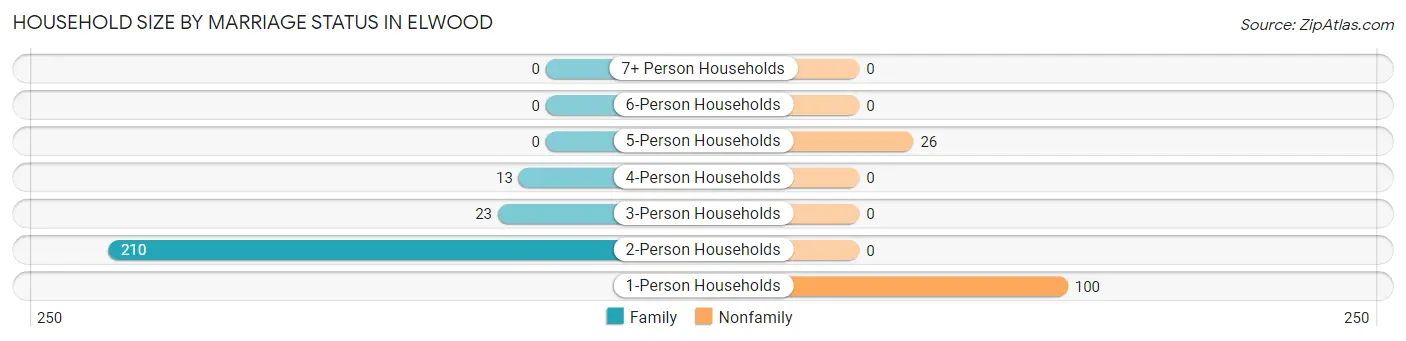
Household Size by Marriage Status in Elwood
Out of a total of 372 households in Elwood, 246 (66.1%) are family households, while 126 (33.9%) are nonfamily households. The most numerous type of family households are 2-person households, comprising 210, and the most common type of nonfamily households are 1-person households, comprising 100.
| Household Size | Family Households | Nonfamily Households |
| 1-Person Households | - | 100 (26.9%) |
| 2-Person Households | 210 (56.5%) | 0 (0.0%) |
| 3-Person Households | 23 (6.2%) | 0 (0.0%) |
| 4-Person Households | 13 (3.5%) | 0 (0.0%) |
| 5-Person Households | 0 (0.0%) | 26 (7.0%) |
| 6-Person Households | 0 (0.0%) | 0 (0.0%) |
| 7+ Person Households | 0 (0.0%) | 0 (0.0%) |
| Total | 246 (66.1%) | 126 (33.9%) |
Female Fertility in Elwood
Fertility by Age in Elwood
| Age Bracket | Women with Births | Births / 1,000 Women |
| 15 to 19 years | 0 (0.0%) | 0.0 |
| 20 to 34 years | 0 (0.0%) | 0.0 |
| 35 to 50 years | 0 (0.0%) | 0.0 |
| Total | 0 (0.0%) | 0.0 |
Fertility by Age by Marriage Status in Elwood
| Age Bracket | Married | Unmarried |
| 15 to 19 years | 0 (0.0%) | 0 (0.0%) |
| 20 to 34 years | 0 (0.0%) | 0 (0.0%) |
| 35 to 50 years | 0 (0.0%) | 0 (0.0%) |
| Total | 0 (0.0%) | 0 (0.0%) |
Fertility by Education in Elwood
| Educational Attainment | Women with Births | Births / 1,000 Women |
| Less than High School | 0 (0.0%) | 0.0 |
| High School Diploma | 0 (0.0%) | 0.0 |
| College or Associate's Degree | 0 (0.0%) | 0.0 |
| Bachelor's Degree | 0 (0.0%) | 0.0 |
| Graduate Degree | 0 (0.0%) | 0.0 |
| Total | 0 (0.0%) | 0.0 |
Fertility by Education by Marriage Status in Elwood
| Educational Attainment | Married | Unmarried |
| Less than High School | 0 (0.0%) | 0 (0.0%) |
| High School Diploma | 0 (0.0%) | 0 (0.0%) |
| College or Associate's Degree | 0 (0.0%) | 0 (0.0%) |
| Bachelor's Degree | 0 (0.0%) | 0 (0.0%) |
| Graduate Degree | 0 (0.0%) | 0 (0.0%) |
| Total | 0 (0.0%) | 0 (0.0%) |
Employment Characteristics in Elwood
Employment by Class of Employer in Elwood
Among the 413 employed individuals in Elwood, , and private company employees (413 | 100.0%) make up the most common classes of employment.
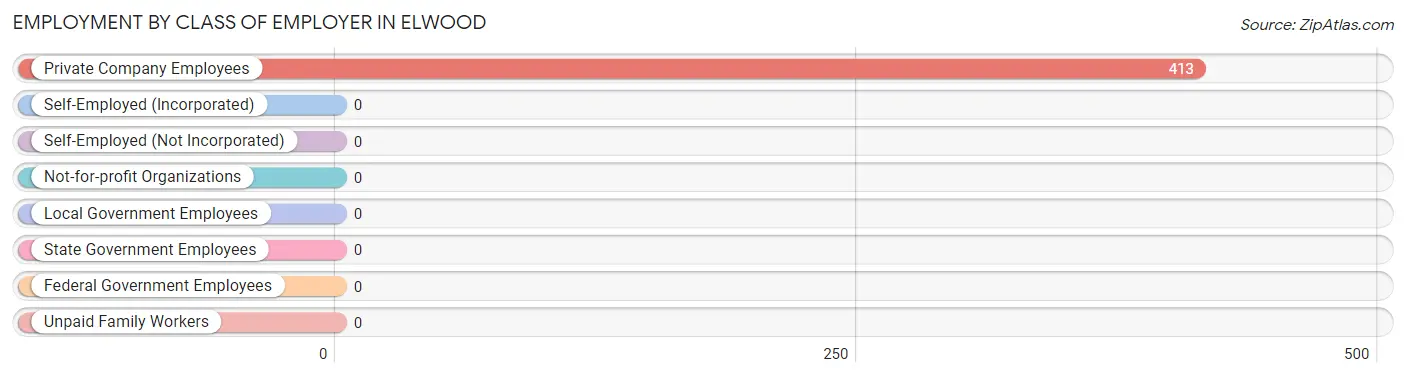
| Employer Class | # Employees | % Employees |
| Private Company Employees | 413 | 100.0% |
| Self-Employed (Incorporated) | 0 | 0.0% |
| Self-Employed (Not Incorporated) | 0 | 0.0% |
| Not-for-profit Organizations | 0 | 0.0% |
| Local Government Employees | 0 | 0.0% |
| State Government Employees | 0 | 0.0% |
| Federal Government Employees | 0 | 0.0% |
| Unpaid Family Workers | 0 | 0.0% |
| Total | 413 | 100.0% |
Employment Status by Age in Elwood
According to the labor force statistics for Elwood, out of the total population over 16 years of age (847), 54.9% or 465 individuals are in the labor force, with 11.2% or 52 of them unemployed. The age group with the highest labor force participation rate is 20 to 24 years, with 100.0% or 33 individuals in the labor force. Within the labor force, the 60 to 64 years age range has the highest percentage of unemployed individuals, with 41.9% or 26 of them being unemployed.
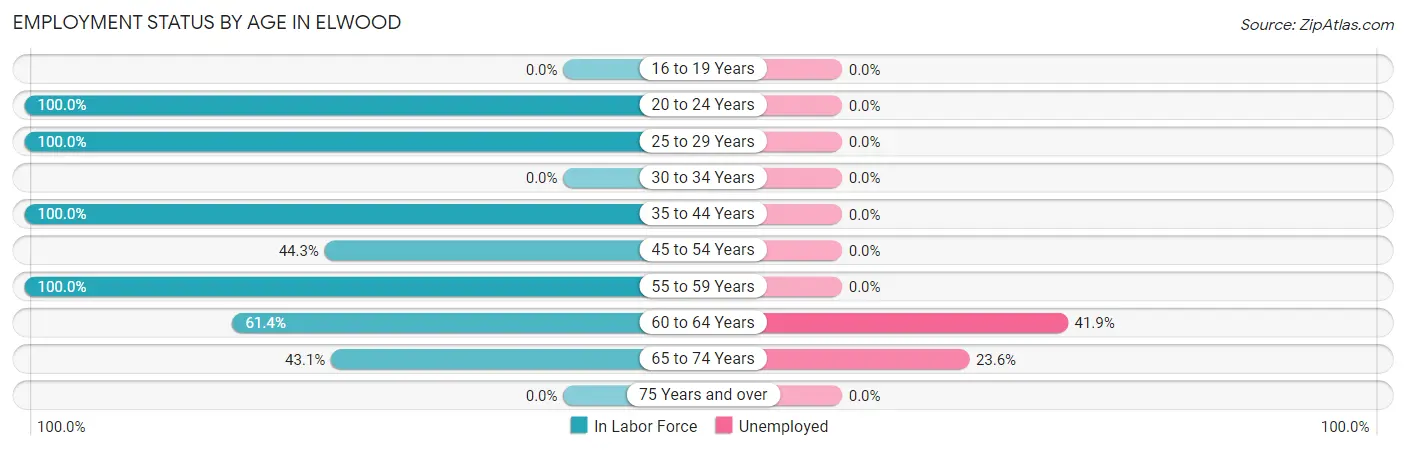
| Age Bracket | In Labor Force | Unemployed |
| 16 to 19 Years | 0 (0.0%) | 0 (0.0%) |
| 20 to 24 Years | 33 (100.0%) | 0 (0.0%) |
| 25 to 29 Years | 49 (100.0%) | 0 (0.0%) |
| 30 to 34 Years | 0 (0.0%) | 0 (0.0%) |
| 35 to 44 Years | 76 (100.0%) | 0 (0.0%) |
| 45 to 54 Years | 94 (44.3%) | 0 (0.0%) |
| 55 to 59 Years | 41 (100.0%) | 0 (0.0%) |
| 60 to 64 Years | 62 (61.4%) | 26 (41.9%) |
| 65 to 74 Years | 110 (43.1%) | 26 (23.6%) |
| 75 Years and over | 0 (0.0%) | 0 (0.0%) |
| Total | 465 (54.9%) | 52 (11.2%) |
Employment Status by Educational Attainment in Elwood
According to labor force statistics for Elwood, 67.2% of individuals (322) out of the total population between 25 and 64 years of age (479) are in the labor force, with 8.1% or 26 of them being unemployed. The group with the highest labor force participation rate are those with the educational attainment of less than high school, with 76.4% or 94 individuals in the labor force. Within the labor force, individuals with high school diploma education have the highest percentage of unemployment, with 17.7% or 26 of them being unemployed.
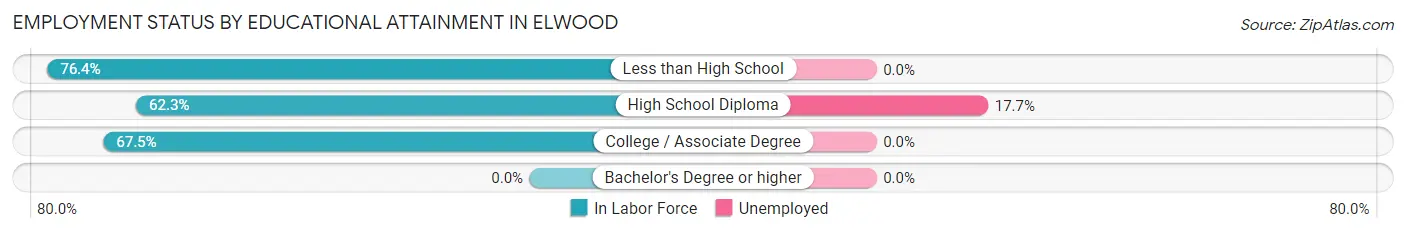
| Educational Attainment | In Labor Force | Unemployed |
| Less than High School | 94 (76.4%) | 0 (0.0%) |
| High School Diploma | 147 (62.3%) | 42 (17.7%) |
| College / Associate Degree | 81 (67.5%) | 0 (0.0%) |
| Bachelor's Degree or higher | 0 (0.0%) | 0 (0.0%) |
| Total | 322 (67.2%) | 39 (8.1%) |
Employment Occupations by Sex in Elwood
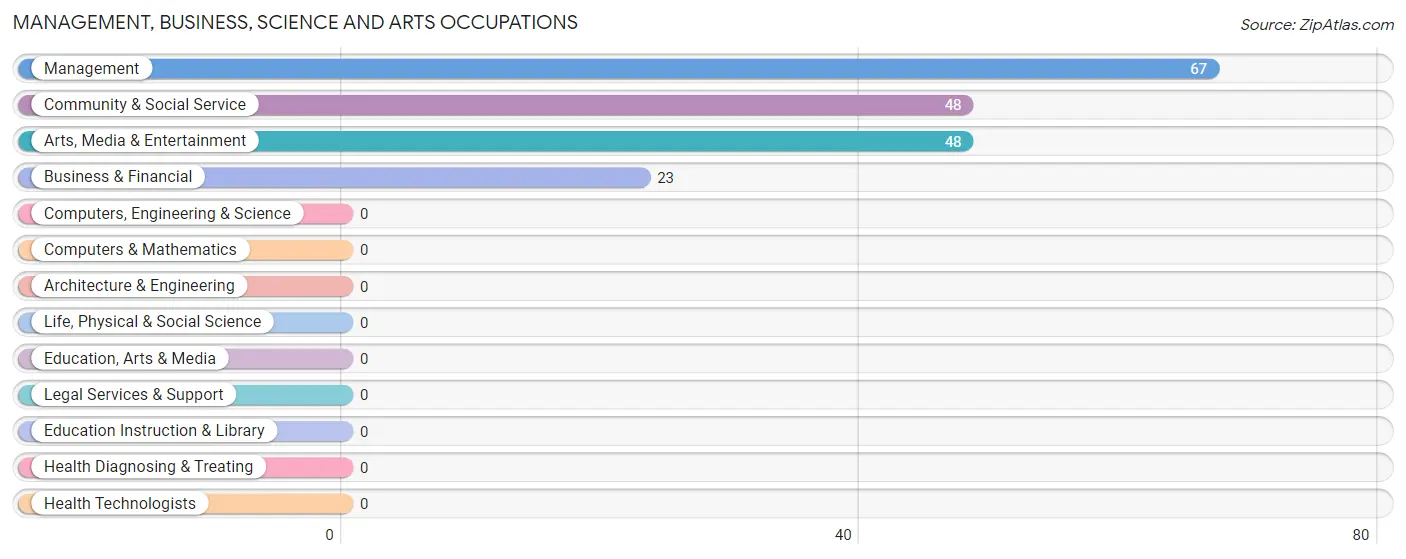
Management, Business, Science and Arts Occupations
The most common Management, Business, Science and Arts occupations in Elwood are Management (67 | 16.2%), Community & Social Service (48 | 11.6%), Arts, Media & Entertainment (48 | 11.6%), and Business & Financial (23 | 5.6%).
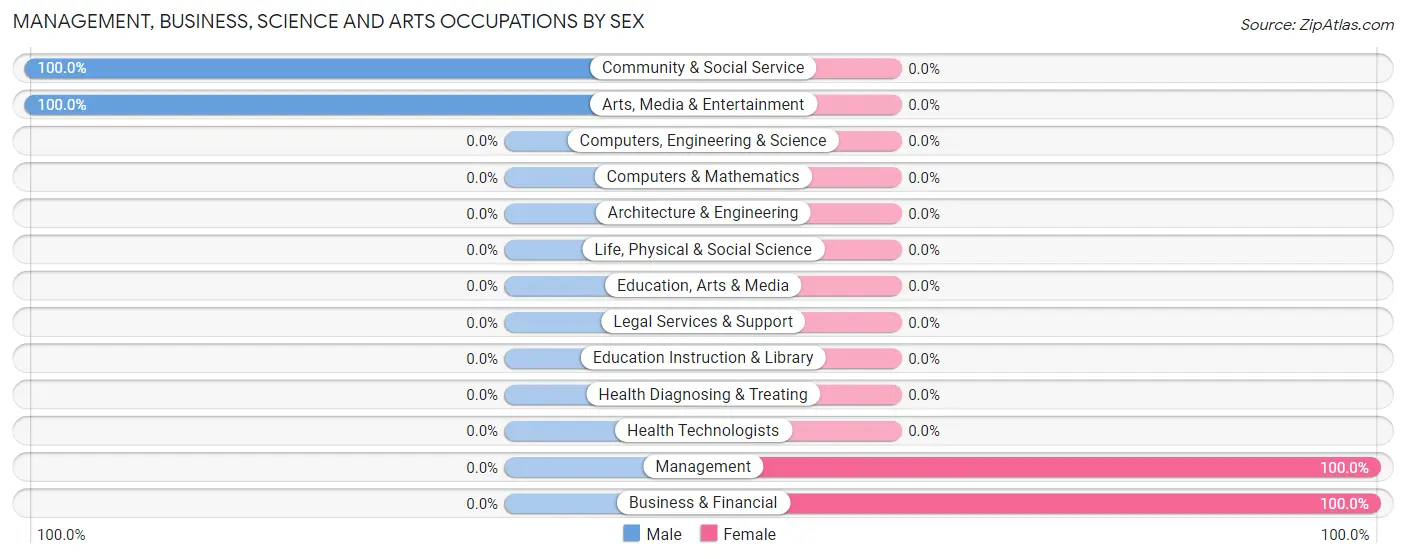
Management, Business, Science and Arts Occupations by Sex
Within the Management, Business, Science and Arts occupations in Elwood, the most male-oriented occupations are Community & Social Service (100.0%), and Arts, Media & Entertainment (100.0%), while the most female-oriented occupations are Management (100.0%), and Business & Financial (100.0%).
| Occupation | Male | Female |
| Management | 0 (0.0%) | 67 (100.0%) |
| Business & Financial | 0 (0.0%) | 23 (100.0%) |
| Computers, Engineering & Science | 0 (0.0%) | 0 (0.0%) |
| Computers & Mathematics | 0 (0.0%) | 0 (0.0%) |
| Architecture & Engineering | 0 (0.0%) | 0 (0.0%) |
| Life, Physical & Social Science | 0 (0.0%) | 0 (0.0%) |
| Community & Social Service | 48 (100.0%) | 0 (0.0%) |
| Education, Arts & Media | 0 (0.0%) | 0 (0.0%) |
| Legal Services & Support | 0 (0.0%) | 0 (0.0%) |
| Education Instruction & Library | 0 (0.0%) | 0 (0.0%) |
| Arts, Media & Entertainment | 48 (100.0%) | 0 (0.0%) |
| Health Diagnosing & Treating | 0 (0.0%) | 0 (0.0%) |
| Health Technologists | 0 (0.0%) | 0 (0.0%) |
| Total (Category) | 48 (34.8%) | 90 (65.2%) |
| Total (Overall) | 192 (46.5%) | 221 (53.5%) |
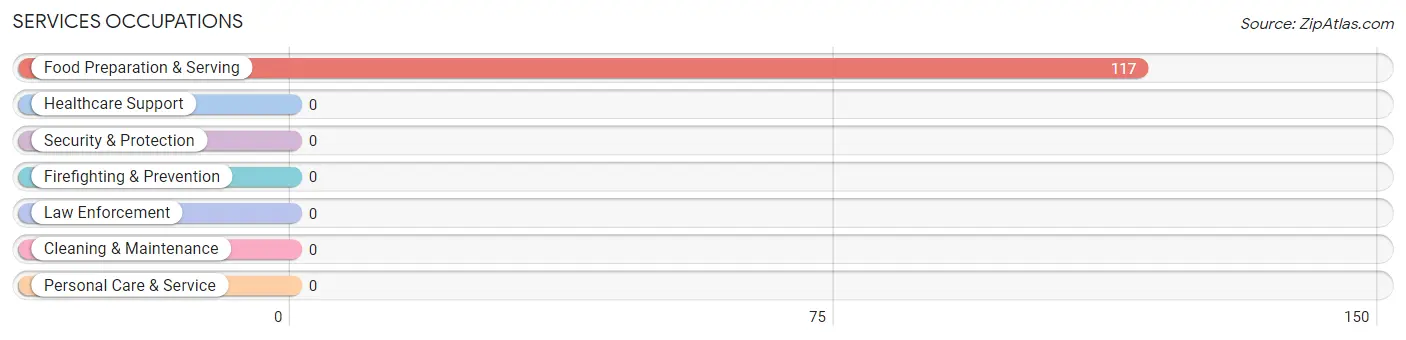
Services Occupations
The most common Services occupations in Elwood are , and Food Preparation & Serving (117 | 28.3%).
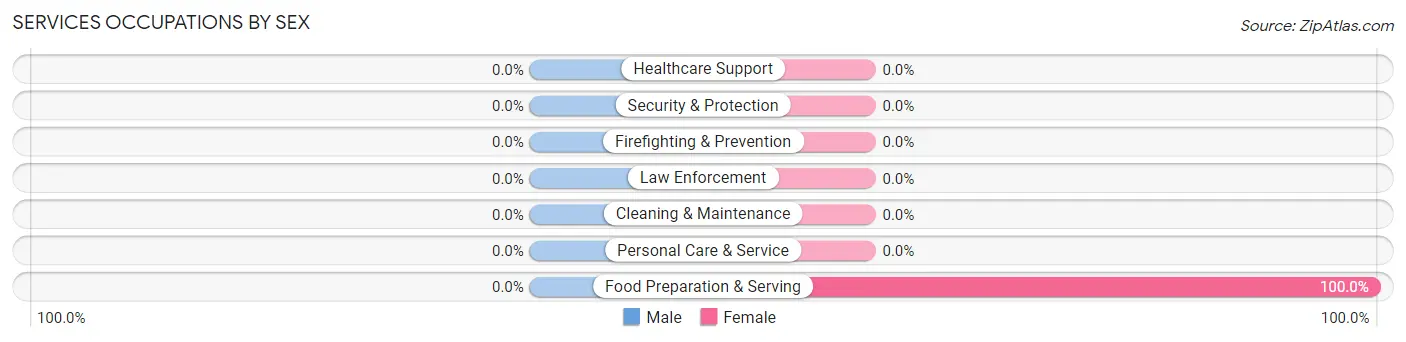
Services Occupations by Sex
| Occupation | Male | Female |
| Healthcare Support | 0 (0.0%) | 0 (0.0%) |
| Security & Protection | 0 (0.0%) | 0 (0.0%) |
| Firefighting & Prevention | 0 (0.0%) | 0 (0.0%) |
| Law Enforcement | 0 (0.0%) | 0 (0.0%) |
| Food Preparation & Serving | 0 (0.0%) | 117 (100.0%) |
| Cleaning & Maintenance | 0 (0.0%) | 0 (0.0%) |
| Personal Care & Service | 0 (0.0%) | 0 (0.0%) |
| Total (Category) | 0 (0.0%) | 117 (100.0%) |
| Total (Overall) | 192 (46.5%) | 221 (53.5%) |
Sales and Office Occupations
The most common Sales and Office occupations in Elwood are Sales & Related (17 | 4.1%), and Office & Administration (14 | 3.4%).
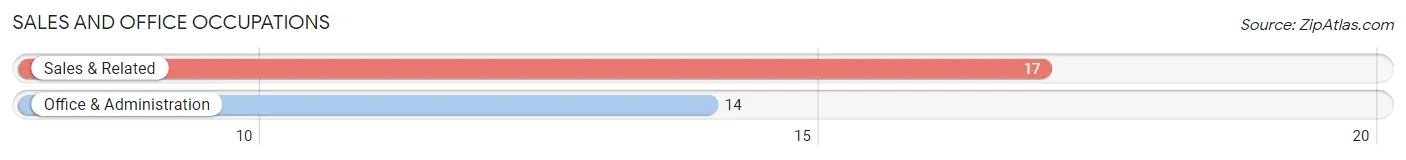
Sales and Office Occupations by Sex

| Occupation | Male | Female |
| Sales & Related | 17 (100.0%) | 0 (0.0%) |
| Office & Administration | 0 (0.0%) | 14 (100.0%) |
| Total (Category) | 17 (54.8%) | 14 (45.2%) |
| Total (Overall) | 192 (46.5%) | 221 (53.5%) |
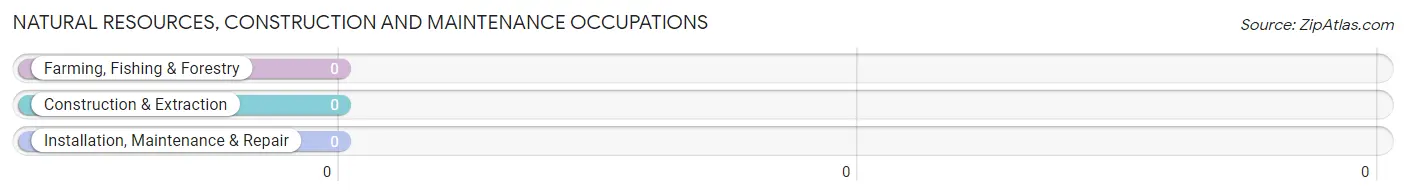
Natural Resources, Construction and Maintenance Occupations
Natural Resources, Construction and Maintenance Occupations by Sex
| Occupation | Male | Female |
| Farming, Fishing & Forestry | 0 (0.0%) | 0 (0.0%) |
| Construction & Extraction | 0 (0.0%) | 0 (0.0%) |
| Installation, Maintenance & Repair | 0 (0.0%) | 0 (0.0%) |
| Total (Category) | 0 (0.0%) | 0 (0.0%) |
| Total (Overall) | 192 (46.5%) | 221 (53.5%) |
Production, Transportation and Moving Occupations
The most common Production, Transportation and Moving occupations in Elwood are Transportation (94 | 22.8%), and Material Moving (33 | 8.0%).
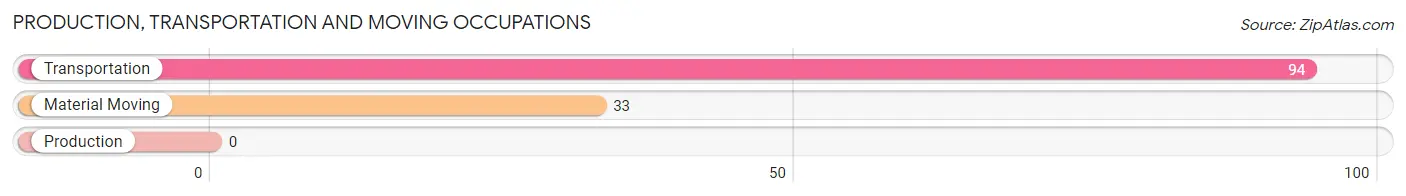
Production, Transportation and Moving Occupations by Sex
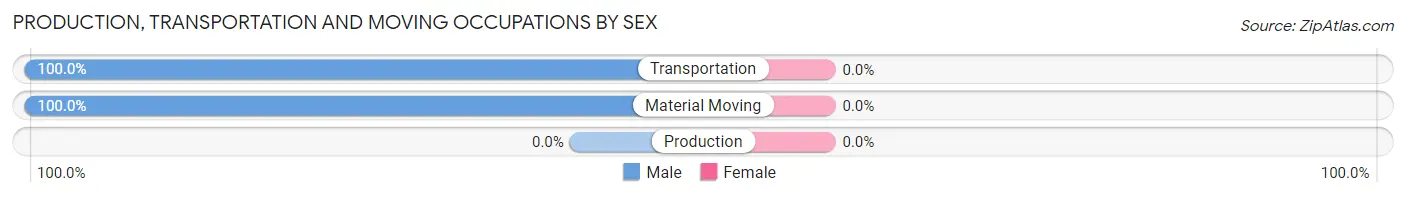
| Occupation | Male | Female |
| Production | 0 (0.0%) | 0 (0.0%) |
| Transportation | 94 (100.0%) | 0 (0.0%) |
| Material Moving | 33 (100.0%) | 0 (0.0%) |
| Total (Category) | 127 (100.0%) | 0 (0.0%) |
| Total (Overall) | 192 (46.5%) | 221 (53.5%) |
Employment Industries by Sex in Elwood
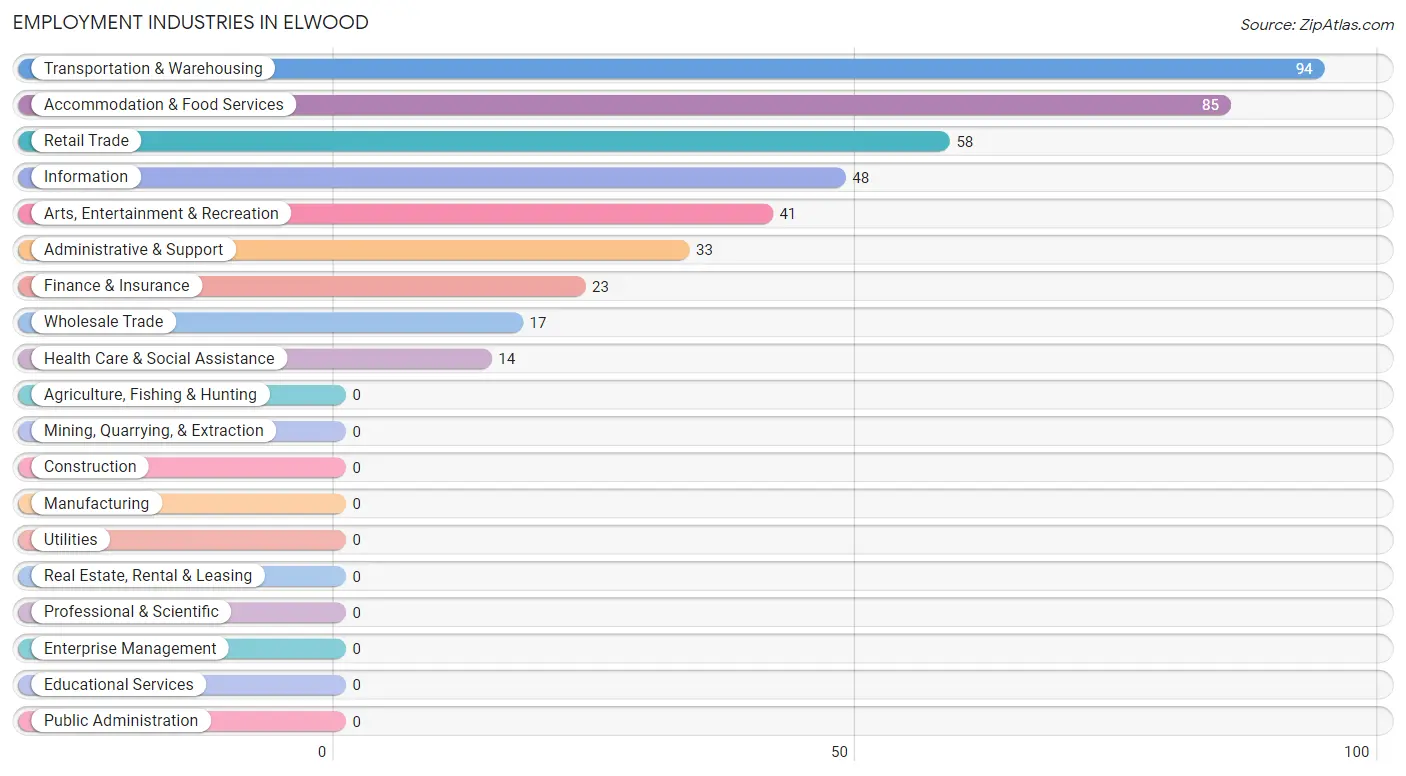
Employment Industries in Elwood
The major employment industries in Elwood include Transportation & Warehousing (94 | 22.8%), Accommodation & Food Services (85 | 20.6%), Retail Trade (58 | 14.0%), Information (48 | 11.6%), and Arts, Entertainment & Recreation (41 | 9.9%).
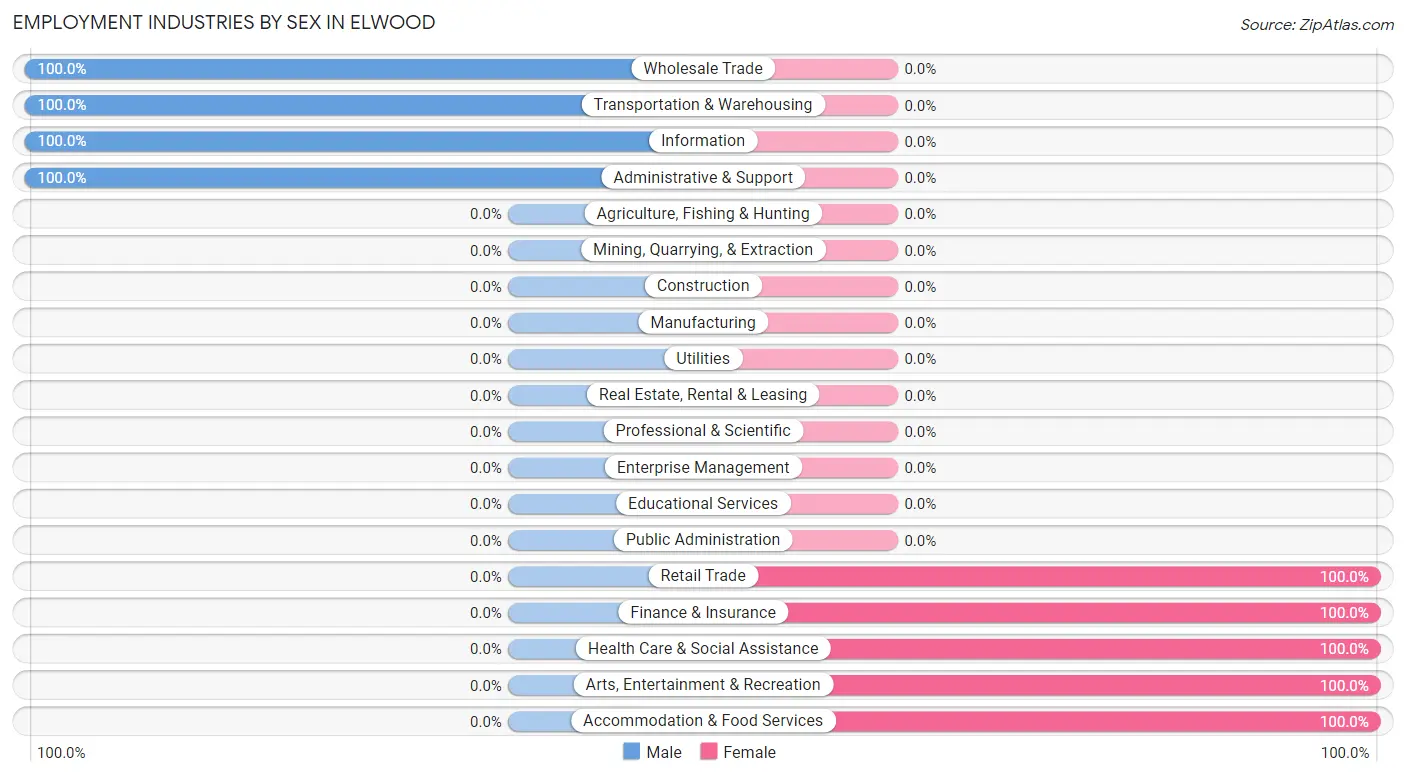
Employment Industries by Sex in Elwood
The Elwood industries that see more men than women are Wholesale Trade (100.0%), Transportation & Warehousing (100.0%), and Information (100.0%), whereas the industries that tend to have a higher number of women are Retail Trade (100.0%), Finance & Insurance (100.0%), and Health Care & Social Assistance (100.0%).
| Industry | Male | Female |
| Agriculture, Fishing & Hunting | 0 (0.0%) | 0 (0.0%) |
| Mining, Quarrying, & Extraction | 0 (0.0%) | 0 (0.0%) |
| Construction | 0 (0.0%) | 0 (0.0%) |
| Manufacturing | 0 (0.0%) | 0 (0.0%) |
| Wholesale Trade | 17 (100.0%) | 0 (0.0%) |
| Retail Trade | 0 (0.0%) | 58 (100.0%) |
| Transportation & Warehousing | 94 (100.0%) | 0 (0.0%) |
| Utilities | 0 (0.0%) | 0 (0.0%) |
| Information | 48 (100.0%) | 0 (0.0%) |
| Finance & Insurance | 0 (0.0%) | 23 (100.0%) |
| Real Estate, Rental & Leasing | 0 (0.0%) | 0 (0.0%) |
| Professional & Scientific | 0 (0.0%) | 0 (0.0%) |
| Enterprise Management | 0 (0.0%) | 0 (0.0%) |
| Administrative & Support | 33 (100.0%) | 0 (0.0%) |
| Educational Services | 0 (0.0%) | 0 (0.0%) |
| Health Care & Social Assistance | 0 (0.0%) | 14 (100.0%) |
| Arts, Entertainment & Recreation | 0 (0.0%) | 41 (100.0%) |
| Accommodation & Food Services | 0 (0.0%) | 85 (100.0%) |
| Public Administration | 0 (0.0%) | 0 (0.0%) |
| Total | 192 (46.5%) | 221 (53.5%) |
Education in Elwood
School Enrollment in Elwood
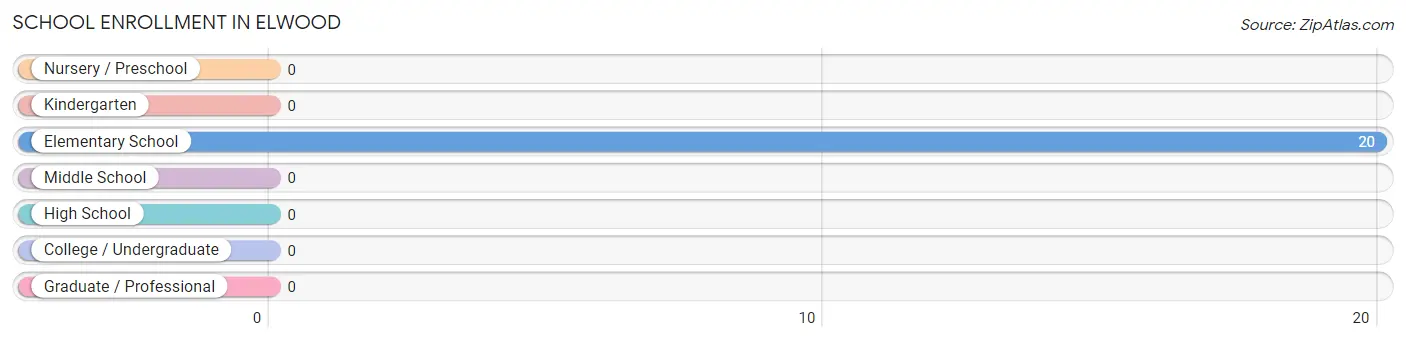
| School Level | # Students | % Students |
| Nursery / Preschool | 0 | 0.0% |
| Kindergarten | 0 | 0.0% |
| Elementary School | 20 | 100.0% |
| Middle School | 0 | 0.0% |
| High School | 0 | 0.0% |
| College / Undergraduate | 0 | 0.0% |
| Graduate / Professional | 0 | 0.0% |
| Total | 20 | 100.0% |
School Enrollment by Age by Funding Source in Elwood
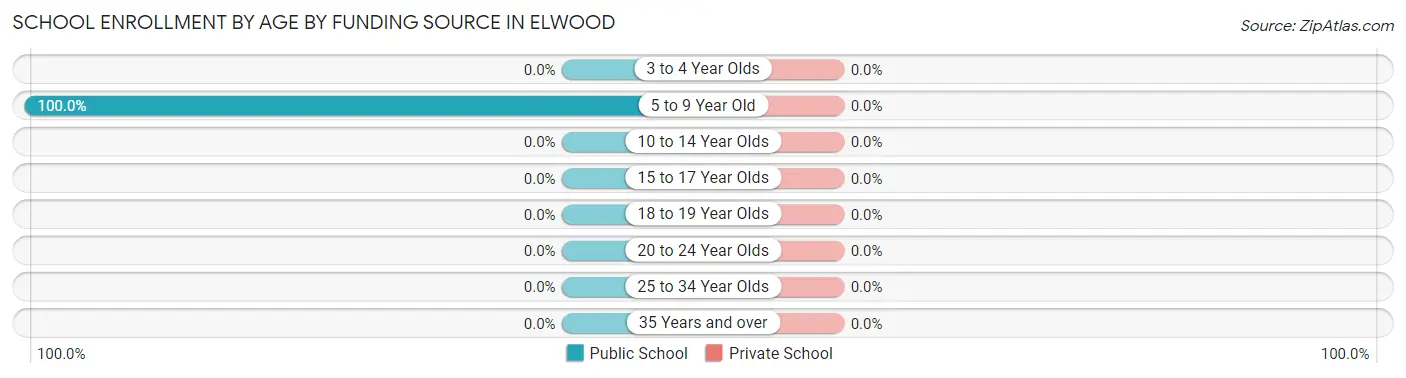
| Age Bracket | Public School | Private School |
| 3 to 4 Year Olds | 0 (0.0%) | 0 (0.0%) |
| 5 to 9 Year Old | 20 (100.0%) | 0 (0.0%) |
| 10 to 14 Year Olds | 0 (0.0%) | 0 (0.0%) |
| 15 to 17 Year Olds | 0 (0.0%) | 0 (0.0%) |
| 18 to 19 Year Olds | 0 (0.0%) | 0 (0.0%) |
| 20 to 24 Year Olds | 0 (0.0%) | 0 (0.0%) |
| 25 to 34 Year Olds | 0 (0.0%) | 0 (0.0%) |
| 35 Years and over | 0 (0.0%) | 0 (0.0%) |
| Total | 20 (100.0%) | 0 (0.0%) |
Educational Attainment by Field of Study in Elwood
Physical & health sciences (12 | 50.0%), and engineering (12 | 50.0%) are the most common fields of study among 24 individuals in Elwood who have obtained a bachelor's degree or higher.
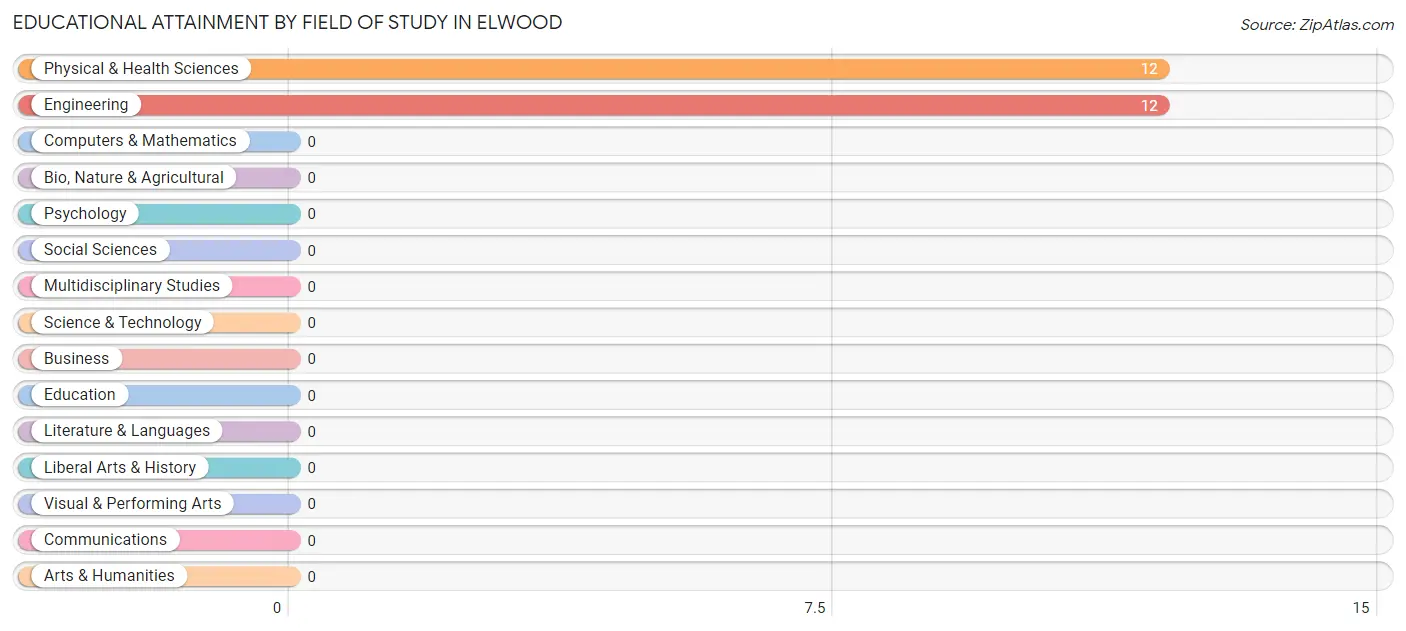
| Field of Study | # Graduates | % Graduates |
| Computers & Mathematics | 0 | 0.0% |
| Bio, Nature & Agricultural | 0 | 0.0% |
| Physical & Health Sciences | 12 | 50.0% |
| Psychology | 0 | 0.0% |
| Social Sciences | 0 | 0.0% |
| Engineering | 12 | 50.0% |
| Multidisciplinary Studies | 0 | 0.0% |
| Science & Technology | 0 | 0.0% |
| Business | 0 | 0.0% |
| Education | 0 | 0.0% |
| Literature & Languages | 0 | 0.0% |
| Liberal Arts & History | 0 | 0.0% |
| Visual & Performing Arts | 0 | 0.0% |
| Communications | 0 | 0.0% |
| Arts & Humanities | 0 | 0.0% |
| Total | 24 | 100.0% |
Transportation & Commute in Elwood
Vehicle Availability by Sex in Elwood
The most prevalent vehicle ownership categories in Elwood are males with 2 vehicles (144, accounting for 75.0%) and females with 2 vehicles (180, making up 65.2%).
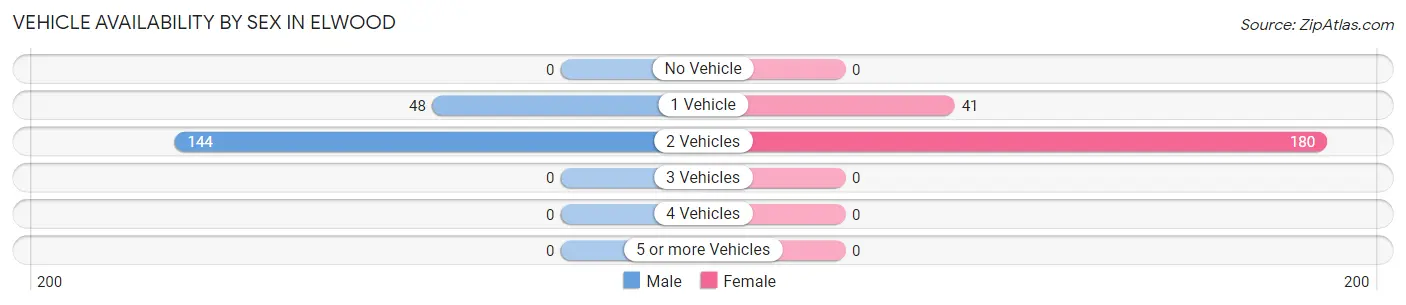
| Vehicles Available | Male | Female |
| No Vehicle | 0 (0.0%) | 0 (0.0%) |
| 1 Vehicle | 48 (25.0%) | 41 (18.5%) |
| 2 Vehicles | 144 (75.0%) | 180 (81.5%) |
| 3 Vehicles | 0 (0.0%) | 0 (0.0%) |
| 4 Vehicles | 0 (0.0%) | 0 (0.0%) |
| 5 or more Vehicles | 0 (0.0%) | 0 (0.0%) |
| Total | 192 (100.0%) | 221 (100.0%) |
Commute Time in Elwood
The most frequently occuring commute durations in Elwood are 20 to 24 minutes (125 commuters, 30.3%), 30 to 34 minutes (94 commuters, 22.8%), and 10 to 14 minutes (83 commuters, 20.1%).
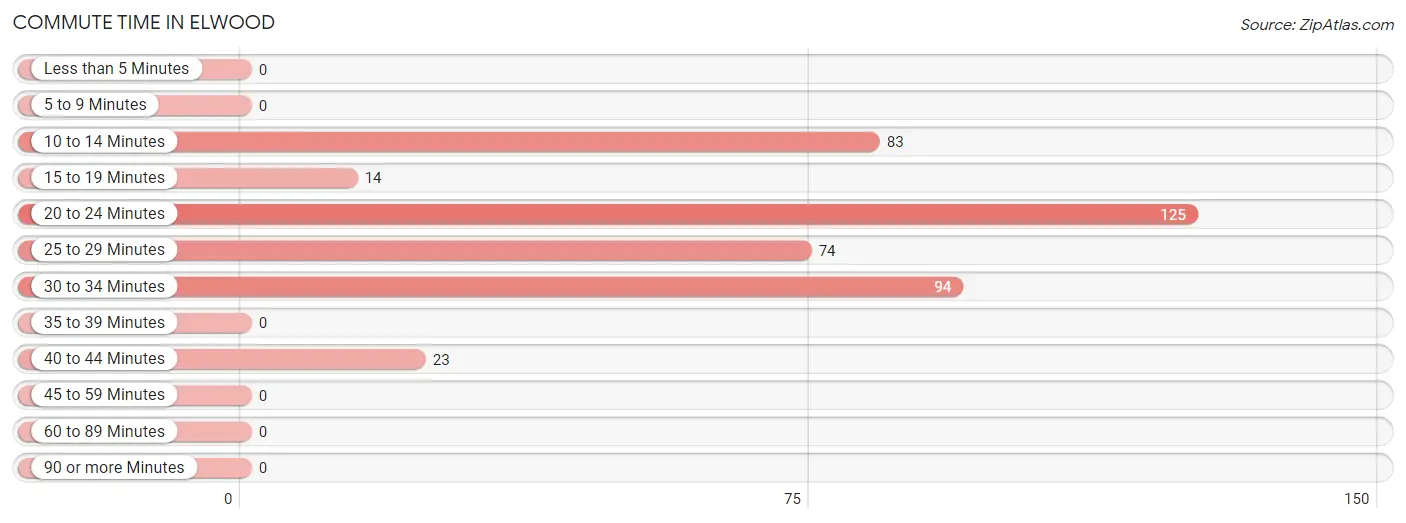
| Commute Time | # Commuters | % Commuters |
| Less than 5 Minutes | 0 | 0.0% |
| 5 to 9 Minutes | 0 | 0.0% |
| 10 to 14 Minutes | 83 | 20.1% |
| 15 to 19 Minutes | 14 | 3.4% |
| 20 to 24 Minutes | 125 | 30.3% |
| 25 to 29 Minutes | 74 | 17.9% |
| 30 to 34 Minutes | 94 | 22.8% |
| 35 to 39 Minutes | 0 | 0.0% |
| 40 to 44 Minutes | 23 | 5.6% |
| 45 to 59 Minutes | 0 | 0.0% |
| 60 to 89 Minutes | 0 | 0.0% |
| 90 or more Minutes | 0 | 0.0% |
Commute Time by Sex in Elwood
The most common commute times in Elwood are 30 to 34 minutes (94 commuters, 49.0%) for males and 20 to 24 minutes (77 commuters, 34.8%) for females.
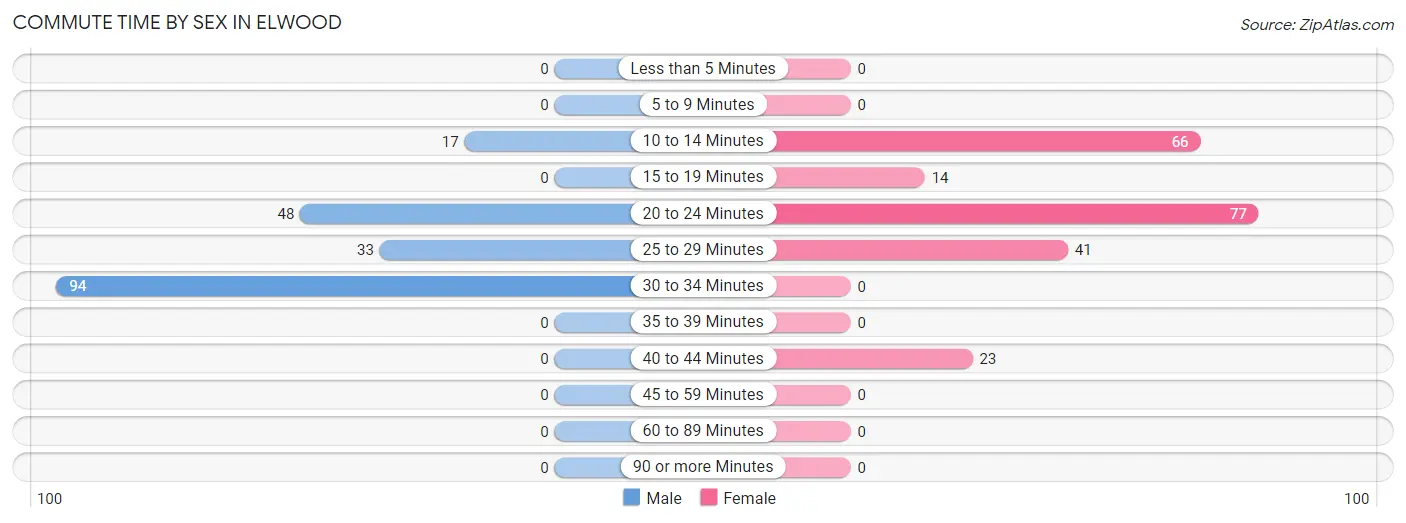
| Commute Time | Male | Female |
| Less than 5 Minutes | 0 (0.0%) | 0 (0.0%) |
| 5 to 9 Minutes | 0 (0.0%) | 0 (0.0%) |
| 10 to 14 Minutes | 17 (8.8%) | 66 (29.9%) |
| 15 to 19 Minutes | 0 (0.0%) | 14 (6.3%) |
| 20 to 24 Minutes | 48 (25.0%) | 77 (34.8%) |
| 25 to 29 Minutes | 33 (17.2%) | 41 (18.5%) |
| 30 to 34 Minutes | 94 (49.0%) | 0 (0.0%) |
| 35 to 39 Minutes | 0 (0.0%) | 0 (0.0%) |
| 40 to 44 Minutes | 0 (0.0%) | 23 (10.4%) |
| 45 to 59 Minutes | 0 (0.0%) | 0 (0.0%) |
| 60 to 89 Minutes | 0 (0.0%) | 0 (0.0%) |
| 90 or more Minutes | 0 (0.0%) | 0 (0.0%) |
Time of Departure to Work by Sex in Elwood
The most frequent times of departure to work in Elwood are 12:00 AM to 4:59 AM (94, 49.0%) for males and 8:00 AM to 8:29 AM (97, 43.9%) for females.
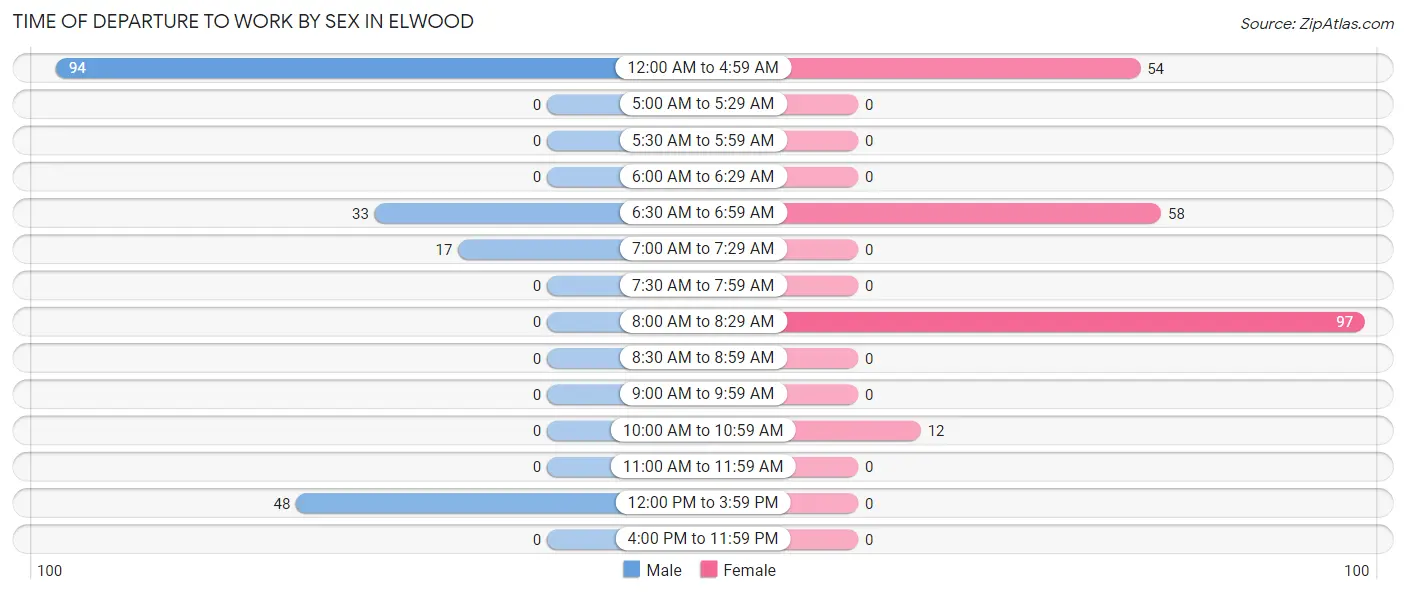
| Time of Departure | Male | Female |
| 12:00 AM to 4:59 AM | 94 (49.0%) | 54 (24.4%) |
| 5:00 AM to 5:29 AM | 0 (0.0%) | 0 (0.0%) |
| 5:30 AM to 5:59 AM | 0 (0.0%) | 0 (0.0%) |
| 6:00 AM to 6:29 AM | 0 (0.0%) | 0 (0.0%) |
| 6:30 AM to 6:59 AM | 33 (17.2%) | 58 (26.2%) |
| 7:00 AM to 7:29 AM | 17 (8.8%) | 0 (0.0%) |
| 7:30 AM to 7:59 AM | 0 (0.0%) | 0 (0.0%) |
| 8:00 AM to 8:29 AM | 0 (0.0%) | 97 (43.9%) |
| 8:30 AM to 8:59 AM | 0 (0.0%) | 0 (0.0%) |
| 9:00 AM to 9:59 AM | 0 (0.0%) | 0 (0.0%) |
| 10:00 AM to 10:59 AM | 0 (0.0%) | 12 (5.4%) |
| 11:00 AM to 11:59 AM | 0 (0.0%) | 0 (0.0%) |
| 12:00 PM to 3:59 PM | 48 (25.0%) | 0 (0.0%) |
| 4:00 PM to 11:59 PM | 0 (0.0%) | 0 (0.0%) |
| Total | 192 (100.0%) | 221 (100.0%) |
Housing Occupancy in Elwood
Occupancy by Ownership in Elwood
Of the total 372 dwellings in Elwood, owner-occupied units account for 372 (100.0%), while renter-occupied units make up 0 (0.0%).
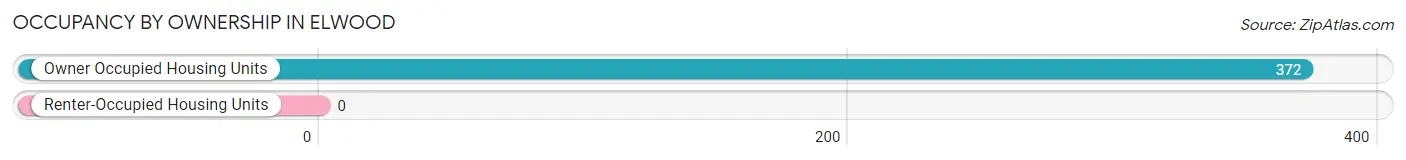
| Occupancy | # Housing Units | % Housing Units |
| Owner Occupied Housing Units | 372 | 100.0% |
| Renter-Occupied Housing Units | 0 | 0.0% |
| Total Occupied Housing Units | 372 | 100.0% |
Occupancy by Household Size in Elwood
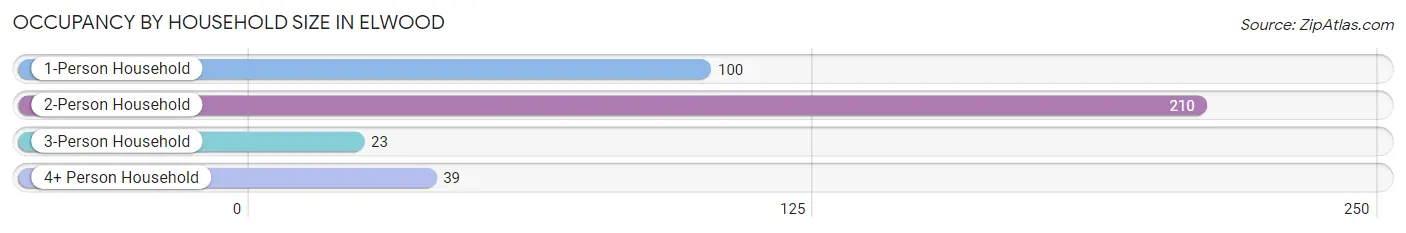
| Household Size | # Housing Units | % Housing Units |
| 1-Person Household | 100 | 26.9% |
| 2-Person Household | 210 | 56.5% |
| 3-Person Household | 23 | 6.2% |
| 4+ Person Household | 39 | 10.5% |
| Total Housing Units | 372 | 100.0% |
Occupancy by Ownership by Household Size in Elwood
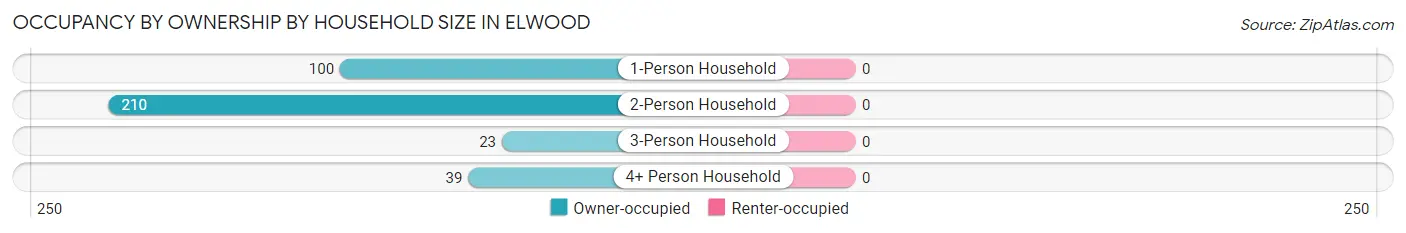
| Household Size | Owner-occupied | Renter-occupied |
| 1-Person Household | 100 (100.0%) | 0 (0.0%) |
| 2-Person Household | 210 (100.0%) | 0 (0.0%) |
| 3-Person Household | 23 (100.0%) | 0 (0.0%) |
| 4+ Person Household | 39 (100.0%) | 0 (0.0%) |
| Total Housing Units | 372 (100.0%) | 0 (0.0%) |
Occupancy by Educational Attainment in Elwood
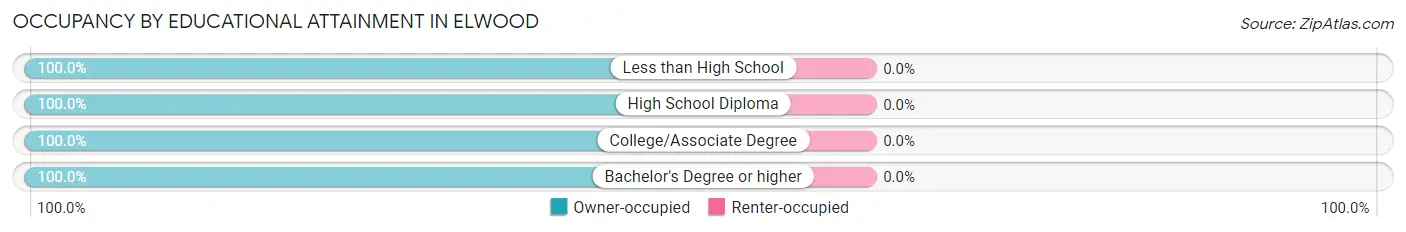
| Household Size | Owner-occupied | Renter-occupied |
| Less than High School | 70 (100.0%) | 0 (0.0%) |
| High School Diploma | 180 (100.0%) | 0 (0.0%) |
| College/Associate Degree | 110 (100.0%) | 0 (0.0%) |
| Bachelor's Degree or higher | 12 (100.0%) | 0 (0.0%) |
Occupancy by Age of Householder in Elwood
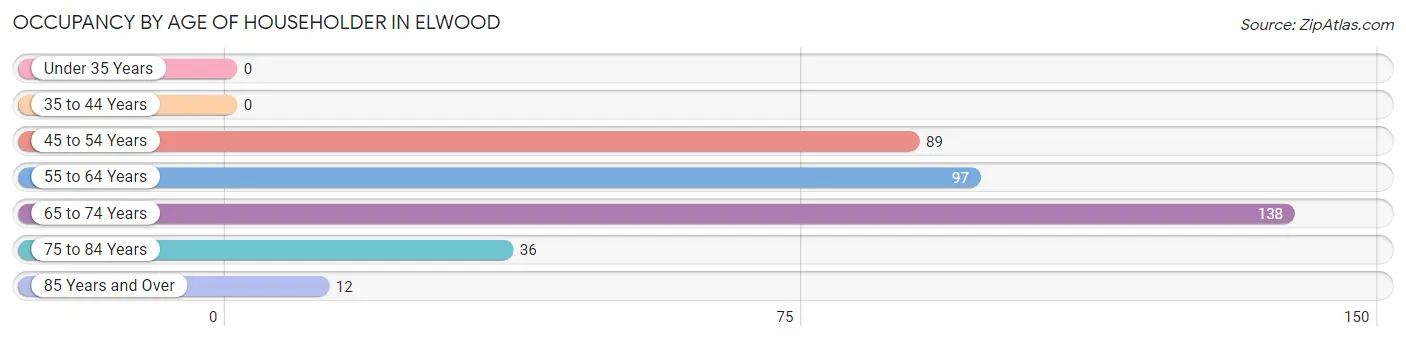
| Age Bracket | # Households | % Households |
| Under 35 Years | 0 | 0.0% |
| 35 to 44 Years | 0 | 0.0% |
| 45 to 54 Years | 89 | 23.9% |
| 55 to 64 Years | 97 | 26.1% |
| 65 to 74 Years | 138 | 37.1% |
| 75 to 84 Years | 36 | 9.7% |
| 85 Years and Over | 12 | 3.2% |
| Total | 372 | 100.0% |
Housing Finances in Elwood
Median Income by Occupancy in Elwood
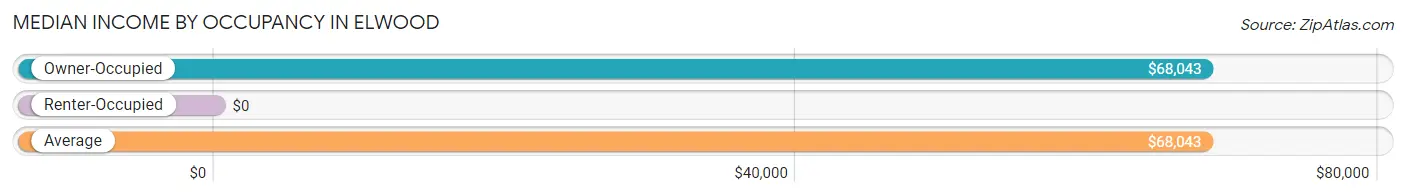
| Occupancy Type | # Households | Median Income |
| Owner-Occupied | 372 (100.0%) | $68,043 |
| Renter-Occupied | 0 (0.0%) | $0 |
| Average | 372 (100.0%) | $68,043 |
Occupancy by Householder Income Bracket in Elwood
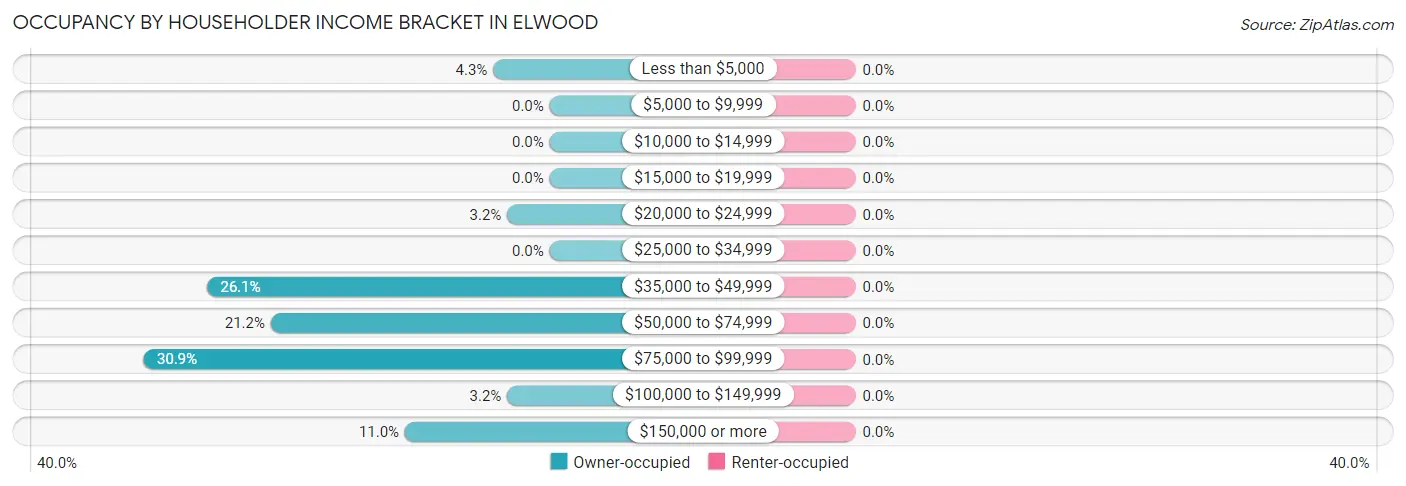
| Income Bracket | Owner-occupied | Renter-occupied |
| Less than $5,000 | 16 (4.3%) | 0 (0.0%) |
| $5,000 to $9,999 | 0 (0.0%) | 0 (0.0%) |
| $10,000 to $14,999 | 0 (0.0%) | 0 (0.0%) |
| $15,000 to $19,999 | 0 (0.0%) | 0 (0.0%) |
| $20,000 to $24,999 | 12 (3.2%) | 0 (0.0%) |
| $25,000 to $34,999 | 0 (0.0%) | 0 (0.0%) |
| $35,000 to $49,999 | 97 (26.1%) | 0 (0.0%) |
| $50,000 to $74,999 | 79 (21.2%) | 0 (0.0%) |
| $75,000 to $99,999 | 115 (30.9%) | 0 (0.0%) |
| $100,000 to $149,999 | 12 (3.2%) | 0 (0.0%) |
| $150,000 or more | 41 (11.0%) | 0 (0.0%) |
| Total | 372 (100.0%) | 0 (0.0%) |
Monthly Housing Cost Tiers in Elwood
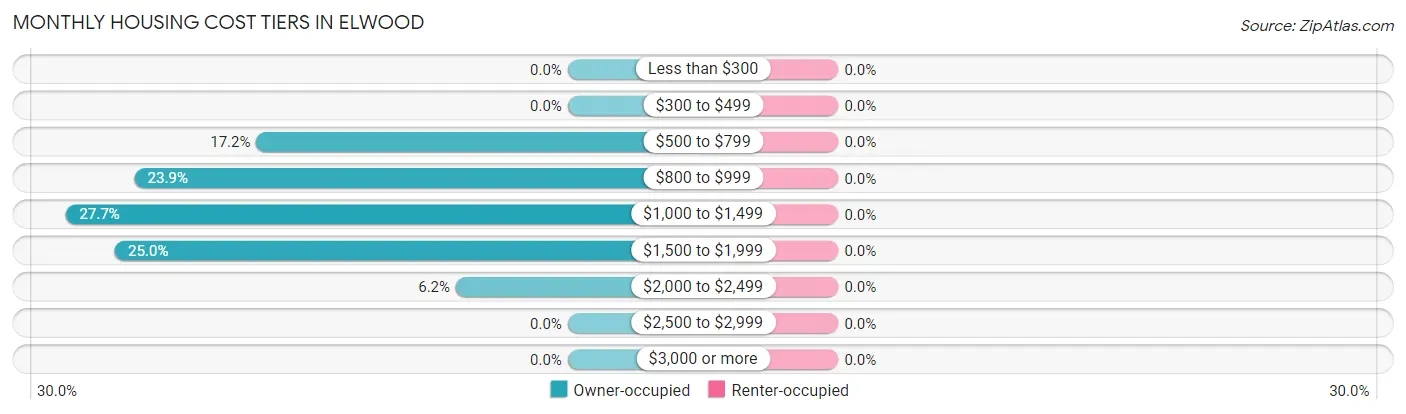
| Monthly Cost | Owner-occupied | Renter-occupied |
| Less than $300 | 0 (0.0%) | 0 (0.0%) |
| $300 to $499 | 0 (0.0%) | 0 (0.0%) |
| $500 to $799 | 64 (17.2%) | 0 (0.0%) |
| $800 to $999 | 89 (23.9%) | 0 (0.0%) |
| $1,000 to $1,499 | 103 (27.7%) | 0 (0.0%) |
| $1,500 to $1,999 | 93 (25.0%) | 0 (0.0%) |
| $2,000 to $2,499 | 23 (6.2%) | 0 (0.0%) |
| $2,500 to $2,999 | 0 (0.0%) | 0 (0.0%) |
| $3,000 or more | 0 (0.0%) | 0 (0.0%) |
| Total | 372 (100.0%) | 0 (0.0%) |
Physical Housing Characteristics in Elwood
Housing Structures in Elwood
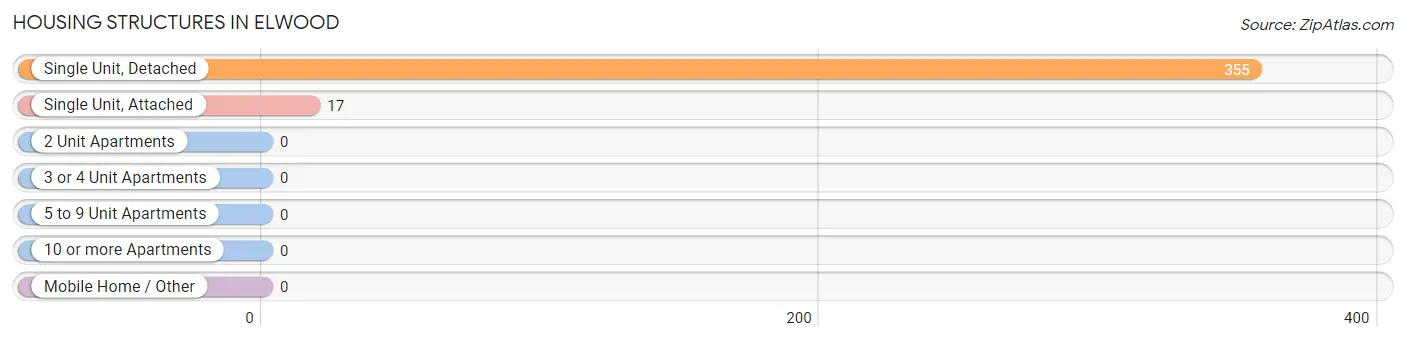
| Structure Type | # Housing Units | % Housing Units |
| Single Unit, Detached | 355 | 95.4% |
| Single Unit, Attached | 17 | 4.6% |
| 2 Unit Apartments | 0 | 0.0% |
| 3 or 4 Unit Apartments | 0 | 0.0% |
| 5 to 9 Unit Apartments | 0 | 0.0% |
| 10 or more Apartments | 0 | 0.0% |
| Mobile Home / Other | 0 | 0.0% |
| Total | 372 | 100.0% |
Housing Structures by Occupancy in Elwood
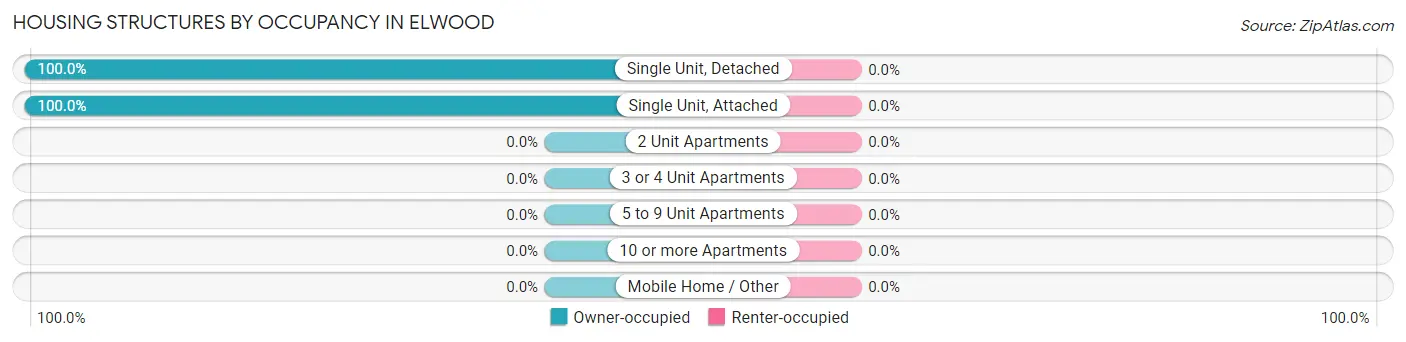
| Structure Type | Owner-occupied | Renter-occupied |
| Single Unit, Detached | 355 (100.0%) | 0 (0.0%) |
| Single Unit, Attached | 17 (100.0%) | 0 (0.0%) |
| 2 Unit Apartments | 0 (0.0%) | 0 (0.0%) |
| 3 or 4 Unit Apartments | 0 (0.0%) | 0 (0.0%) |
| 5 to 9 Unit Apartments | 0 (0.0%) | 0 (0.0%) |
| 10 or more Apartments | 0 (0.0%) | 0 (0.0%) |
| Mobile Home / Other | 0 (0.0%) | 0 (0.0%) |
| Total | 372 (100.0%) | 0 (0.0%) |
Housing Structures by Number of Rooms in Elwood
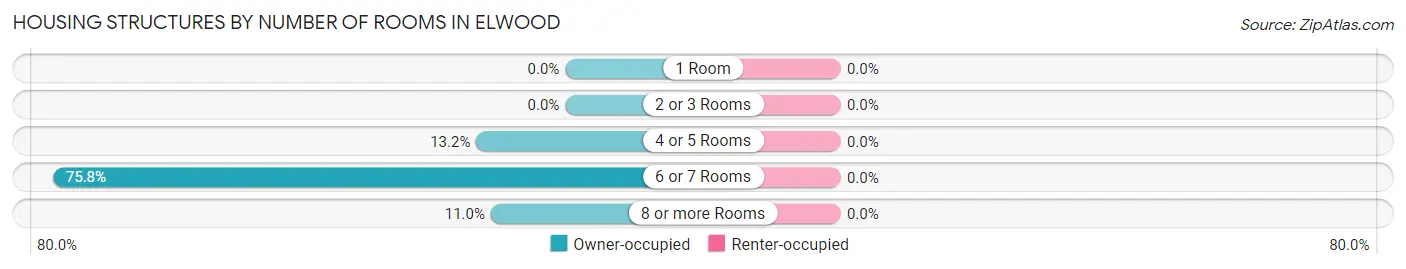
| Number of Rooms | Owner-occupied | Renter-occupied |
| 1 Room | 0 (0.0%) | 0 (0.0%) |
| 2 or 3 Rooms | 0 (0.0%) | 0 (0.0%) |
| 4 or 5 Rooms | 49 (13.2%) | 0 (0.0%) |
| 6 or 7 Rooms | 282 (75.8%) | 0 (0.0%) |
| 8 or more Rooms | 41 (11.0%) | 0 (0.0%) |
| Total | 372 (100.0%) | 0 (0.0%) |
Housing Structure by Heating Type in Elwood
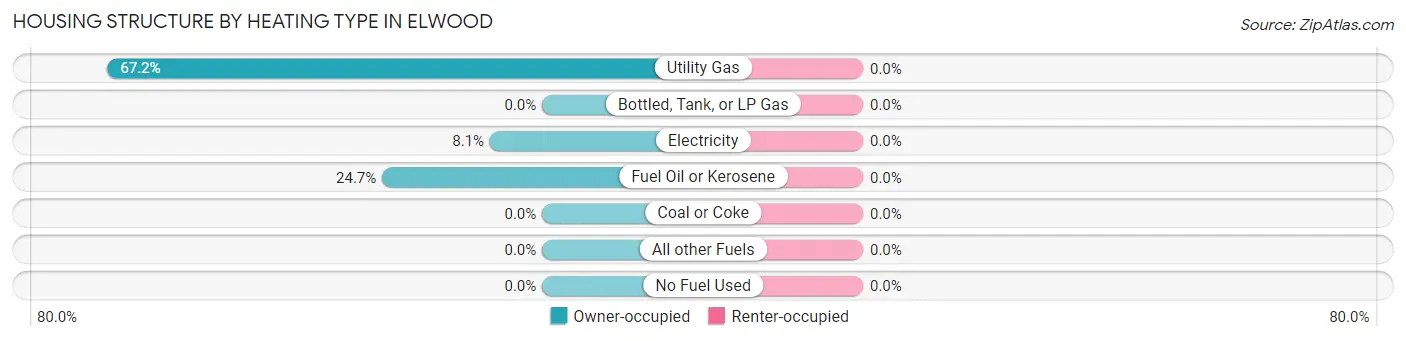
| Heating Type | Owner-occupied | Renter-occupied |
| Utility Gas | 250 (67.2%) | 0 (0.0%) |
| Bottled, Tank, or LP Gas | 0 (0.0%) | 0 (0.0%) |
| Electricity | 30 (8.1%) | 0 (0.0%) |
| Fuel Oil or Kerosene | 92 (24.7%) | 0 (0.0%) |
| Coal or Coke | 0 (0.0%) | 0 (0.0%) |
| All other Fuels | 0 (0.0%) | 0 (0.0%) |
| No Fuel Used | 0 (0.0%) | 0 (0.0%) |
| Total | 372 (100.0%) | 0 (0.0%) |
Household Vehicle Usage in Elwood
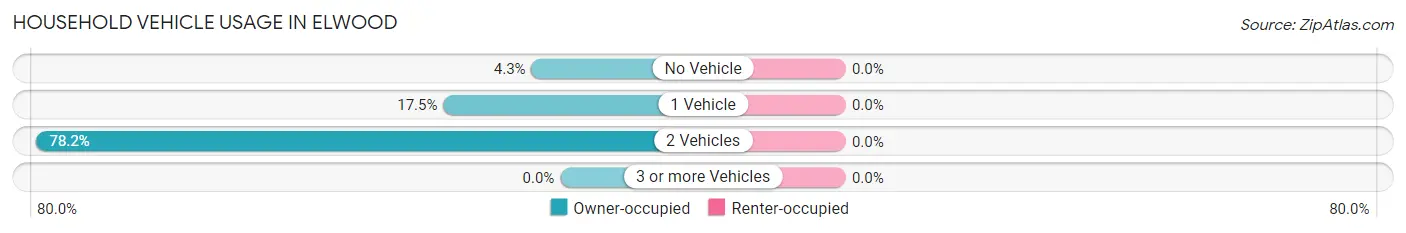
| Vehicles per Household | Owner-occupied | Renter-occupied |
| No Vehicle | 16 (4.3%) | 0 (0.0%) |
| 1 Vehicle | 65 (17.5%) | 0 (0.0%) |
| 2 Vehicles | 291 (78.2%) | 0 (0.0%) |
| 3 or more Vehicles | 0 (0.0%) | 0 (0.0%) |
| Total | 372 (100.0%) | 0 (0.0%) |
Real Estate & Mortgages in Elwood
Real Estate and Mortgage Overview in Elwood
| Characteristic | Without Mortgage | With Mortgage |
| Housing Units | 182 | 190 |
| Median Property Value | $161,200 | $210,400 |
| Median Household Income | $77,781 | $41 |
| Monthly Housing Costs | $830 | $0 |
| Real Estate Taxes | $5,668 | $0 |
Property Value by Mortgage Status in Elwood
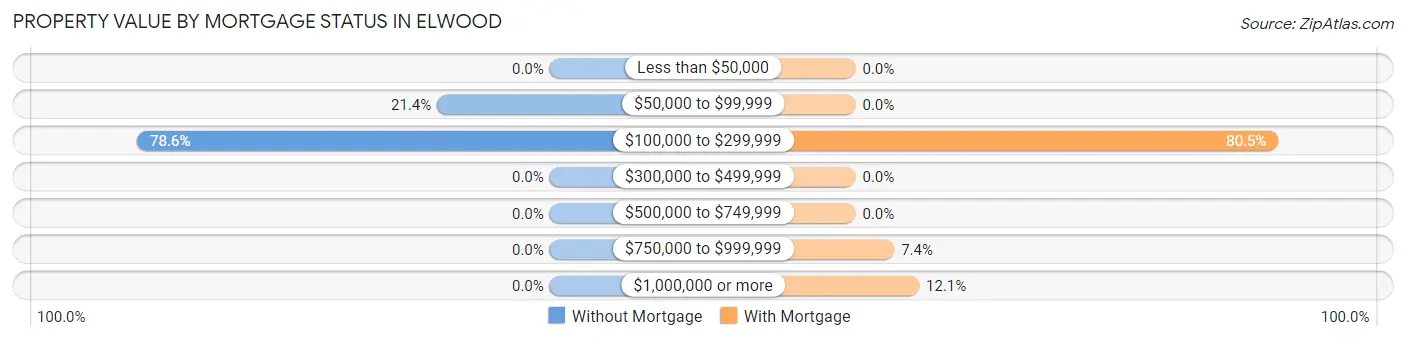
| Property Value | Without Mortgage | With Mortgage |
| Less than $50,000 | 0 (0.0%) | 0 (0.0%) |
| $50,000 to $99,999 | 39 (21.4%) | 0 (0.0%) |
| $100,000 to $299,999 | 143 (78.6%) | 153 (80.5%) |
| $300,000 to $499,999 | 0 (0.0%) | 0 (0.0%) |
| $500,000 to $749,999 | 0 (0.0%) | 0 (0.0%) |
| $750,000 to $999,999 | 0 (0.0%) | 14 (7.4%) |
| $1,000,000 or more | 0 (0.0%) | 23 (12.1%) |
| Total | 182 (100.0%) | 190 (100.0%) |
Household Income by Mortgage Status in Elwood
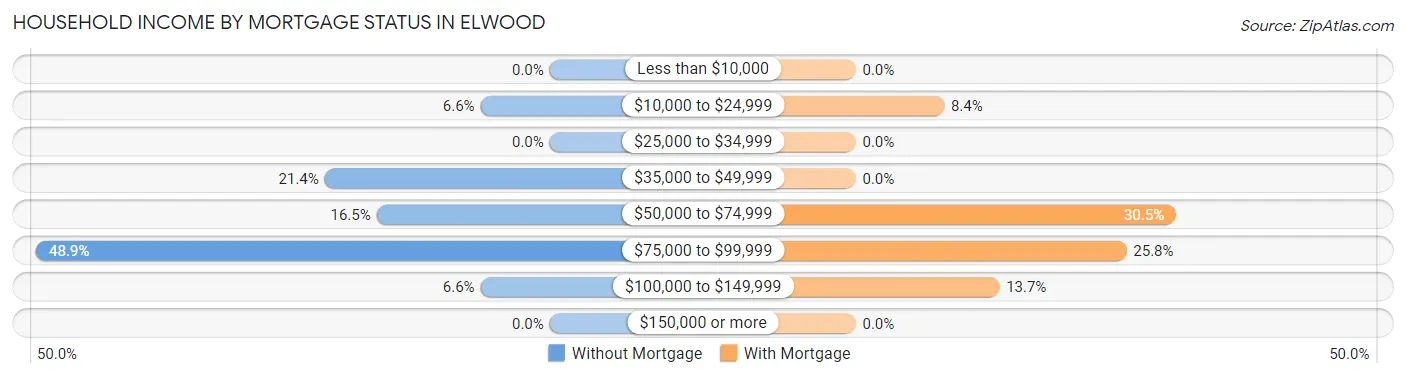
| Household Income | Without Mortgage | With Mortgage |
| Less than $10,000 | 0 (0.0%) | 0 (0.0%) |
| $10,000 to $24,999 | 12 (6.6%) | 16 (8.4%) |
| $25,000 to $34,999 | 0 (0.0%) | 0 (0.0%) |
| $35,000 to $49,999 | 39 (21.4%) | 0 (0.0%) |
| $50,000 to $74,999 | 30 (16.5%) | 58 (30.5%) |
| $75,000 to $99,999 | 89 (48.9%) | 49 (25.8%) |
| $100,000 to $149,999 | 12 (6.6%) | 26 (13.7%) |
| $150,000 or more | 0 (0.0%) | 0 (0.0%) |
| Total | 182 (100.0%) | 190 (100.0%) |
Property Value to Household Income Ratio in Elwood
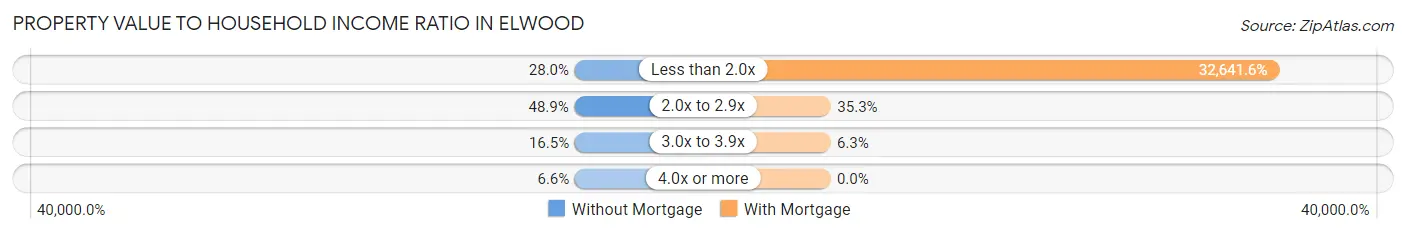
| Value-to-Income Ratio | Without Mortgage | With Mortgage |
| Less than 2.0x | 51 (28.0%) | 62,019 (32,641.6%) |
| 2.0x to 2.9x | 89 (48.9%) | 67 (35.3%) |
| 3.0x to 3.9x | 30 (16.5%) | 12 (6.3%) |
| 4.0x or more | 12 (6.6%) | 0 (0.0%) |
| Total | 182 (100.0%) | 190 (100.0%) |
Real Estate Taxes by Mortgage Status in Elwood
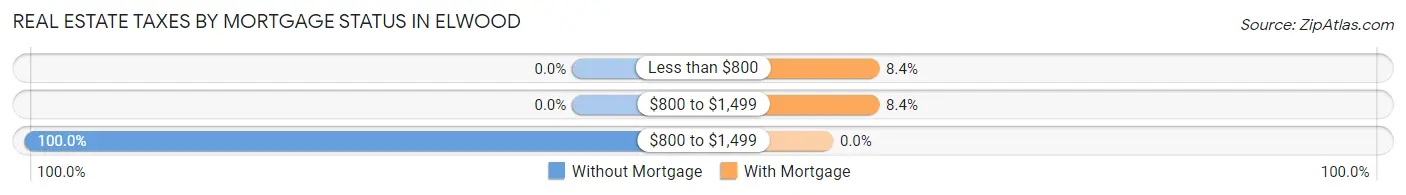
| Property Taxes | Without Mortgage | With Mortgage |
| Less than $800 | 0 (0.0%) | 16 (8.4%) |
| $800 to $1,499 | 0 (0.0%) | 16 (8.4%) |
| $800 to $1,499 | 182 (100.0%) | 0 (0.0%) |
| Total | 182 (100.0%) | 190 (100.0%) |
Health & Disability in Elwood
Health Insurance Coverage by Age in Elwood
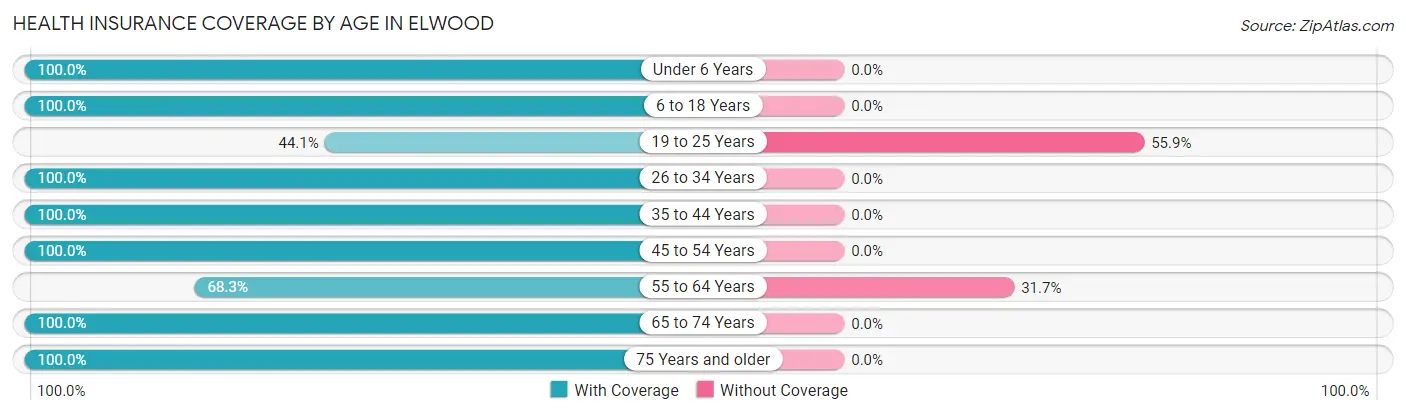
| Age Bracket | With Coverage | Without Coverage |
| Under 6 Years | 52 (100.0%) | 0 (0.0%) |
| 6 to 18 Years | 20 (100.0%) | 0 (0.0%) |
| 19 to 25 Years | 26 (44.1%) | 33 (55.9%) |
| 26 to 34 Years | 23 (100.0%) | 0 (0.0%) |
| 35 to 44 Years | 76 (100.0%) | 0 (0.0%) |
| 45 to 54 Years | 212 (100.0%) | 0 (0.0%) |
| 55 to 64 Years | 97 (68.3%) | 45 (31.7%) |
| 65 to 74 Years | 255 (100.0%) | 0 (0.0%) |
| 75 Years and older | 57 (100.0%) | 0 (0.0%) |
| Total | 818 (91.3%) | 78 (8.7%) |
Health Insurance Coverage by Citizenship Status in Elwood
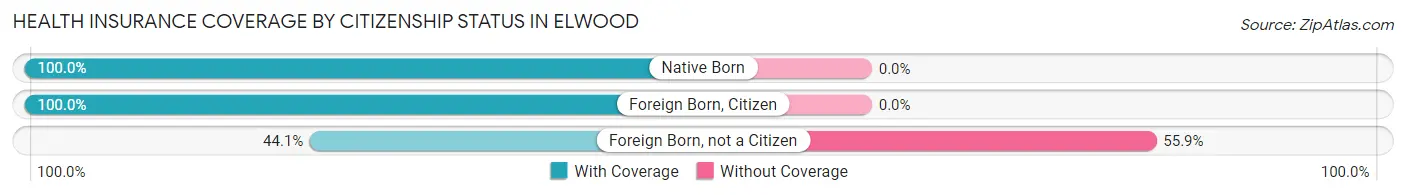
| Citizenship Status | With Coverage | Without Coverage |
| Native Born | 52 (100.0%) | 0 (0.0%) |
| Foreign Born, Citizen | 20 (100.0%) | 0 (0.0%) |
| Foreign Born, not a Citizen | 26 (44.1%) | 33 (55.9%) |
Health Insurance Coverage by Household Income in Elwood
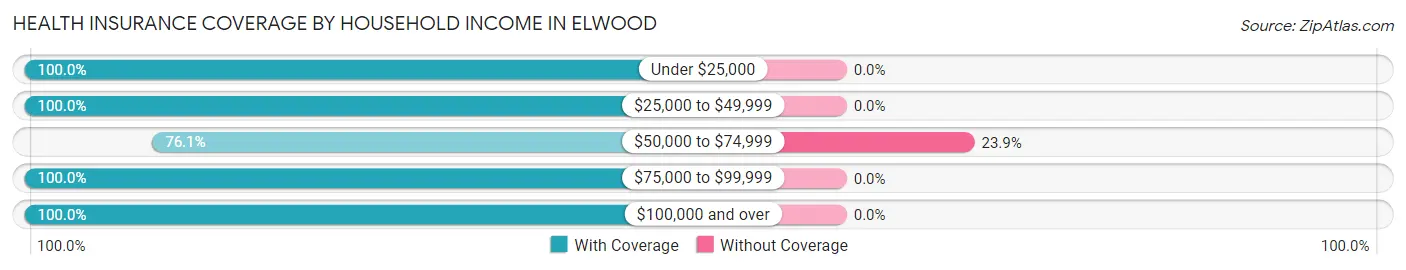
| Household Income | With Coverage | Without Coverage |
| Under $25,000 | 37 (100.0%) | 0 (0.0%) |
| $25,000 to $49,999 | 136 (100.0%) | 0 (0.0%) |
| $50,000 to $74,999 | 248 (76.1%) | 78 (23.9%) |
| $75,000 to $99,999 | 221 (100.0%) | 0 (0.0%) |
| $100,000 and over | 101 (100.0%) | 0 (0.0%) |
Public vs Private Health Insurance Coverage by Age in Elwood
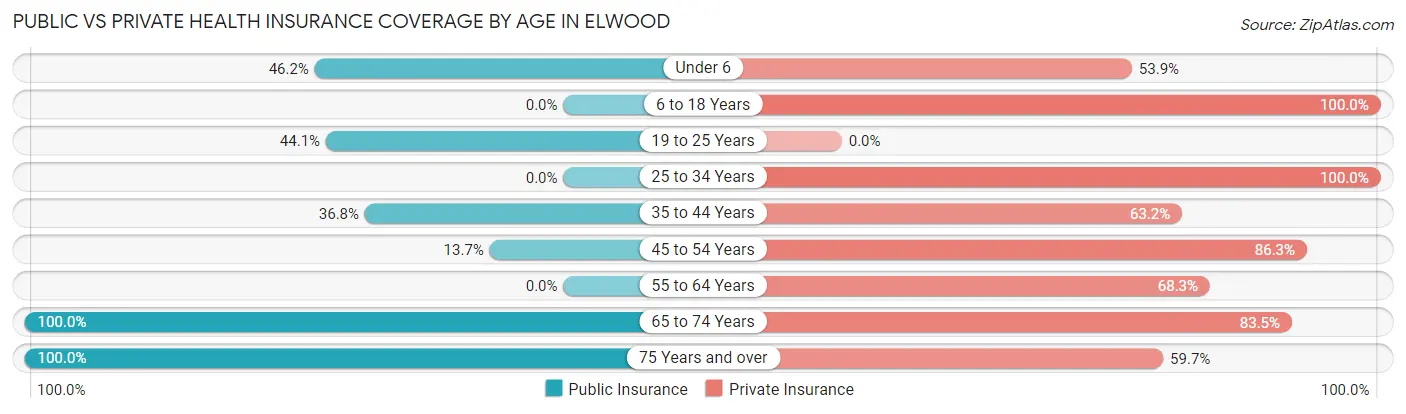
| Age Bracket | Public Insurance | Private Insurance |
| Under 6 | 24 (46.2%) | 28 (53.8%) |
| 6 to 18 Years | 0 (0.0%) | 20 (100.0%) |
| 19 to 25 Years | 26 (44.1%) | 0 (0.0%) |
| 25 to 34 Years | 0 (0.0%) | 23 (100.0%) |
| 35 to 44 Years | 28 (36.8%) | 48 (63.2%) |
| 45 to 54 Years | 29 (13.7%) | 183 (86.3%) |
| 55 to 64 Years | 0 (0.0%) | 97 (68.3%) |
| 65 to 74 Years | 255 (100.0%) | 213 (83.5%) |
| 75 Years and over | 57 (100.0%) | 34 (59.7%) |
| Total | 419 (46.8%) | 646 (72.1%) |
Disability Status by Sex by Age in Elwood
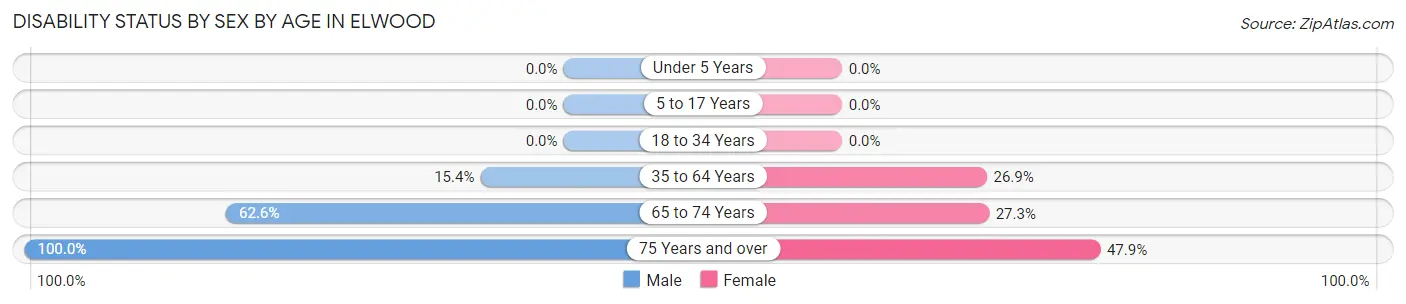
| Age Bracket | Male | Female |
| Under 5 Years | 0 (0.0%) | 0 (0.0%) |
| 5 to 17 Years | 0 (0.0%) | 0 (0.0%) |
| 18 to 34 Years | 0 (0.0%) | 0 (0.0%) |
| 35 to 64 Years | 29 (15.4%) | 65 (26.9%) |
| 65 to 74 Years | 77 (62.6%) | 36 (27.3%) |
| 75 Years and over | 9 (100.0%) | 23 (47.9%) |
Disability Class by Sex by Age in Elwood
Disability Class: Hearing Difficulty
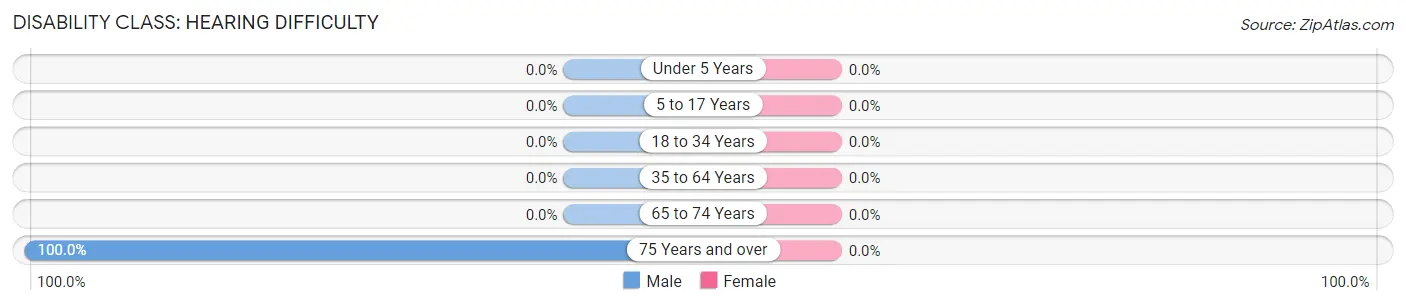
| Age Bracket | Male | Female |
| Under 5 Years | 0 (0.0%) | 0 (0.0%) |
| 5 to 17 Years | 0 (0.0%) | 0 (0.0%) |
| 18 to 34 Years | 0 (0.0%) | 0 (0.0%) |
| 35 to 64 Years | 0 (0.0%) | 0 (0.0%) |
| 65 to 74 Years | 0 (0.0%) | 0 (0.0%) |
| 75 Years and over | 9 (100.0%) | 0 (0.0%) |
Disability Class: Vision Difficulty
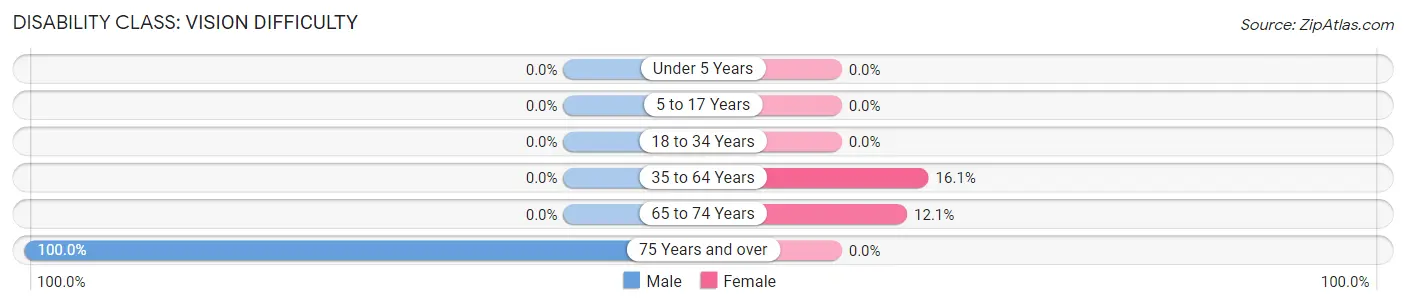
| Age Bracket | Male | Female |
| Under 5 Years | 0 (0.0%) | 0 (0.0%) |
| 5 to 17 Years | 0 (0.0%) | 0 (0.0%) |
| 18 to 34 Years | 0 (0.0%) | 0 (0.0%) |
| 35 to 64 Years | 0 (0.0%) | 39 (16.1%) |
| 65 to 74 Years | 0 (0.0%) | 16 (12.1%) |
| 75 Years and over | 9 (100.0%) | 0 (0.0%) |
Disability Class: Cognitive Difficulty
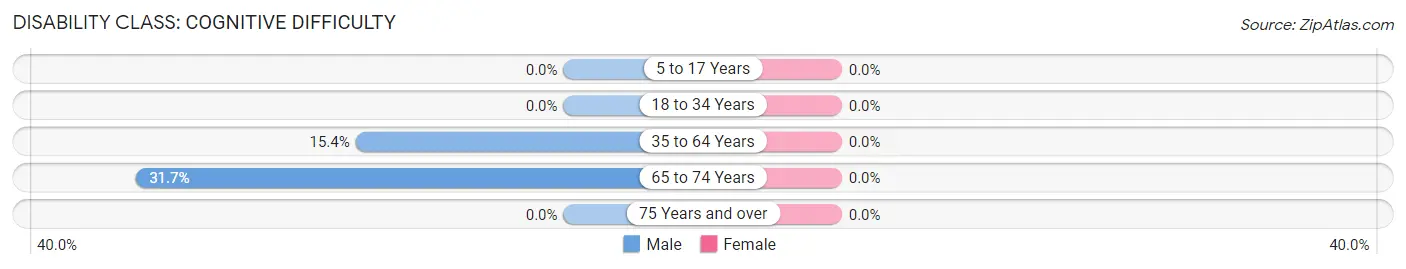
| Age Bracket | Male | Female |
| 5 to 17 Years | 0 (0.0%) | 0 (0.0%) |
| 18 to 34 Years | 0 (0.0%) | 0 (0.0%) |
| 35 to 64 Years | 29 (15.4%) | 0 (0.0%) |
| 65 to 74 Years | 39 (31.7%) | 0 (0.0%) |
| 75 Years and over | 0 (0.0%) | 0 (0.0%) |
Disability Class: Ambulatory Difficulty
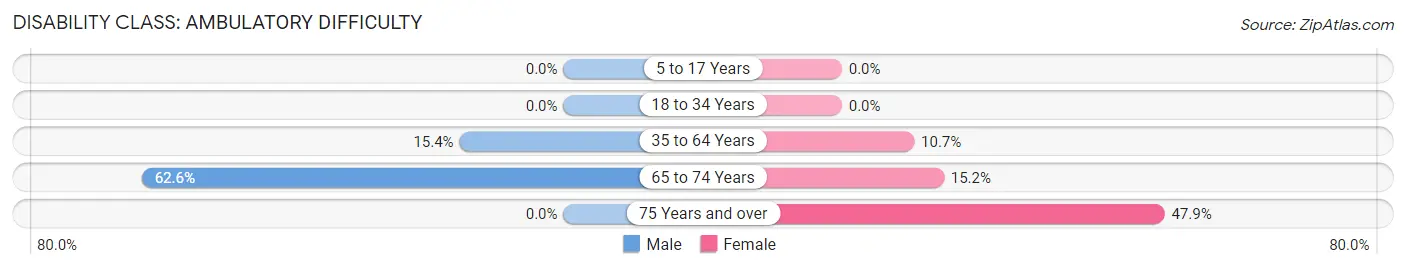
| Age Bracket | Male | Female |
| 5 to 17 Years | 0 (0.0%) | 0 (0.0%) |
| 18 to 34 Years | 0 (0.0%) | 0 (0.0%) |
| 35 to 64 Years | 29 (15.4%) | 26 (10.7%) |
| 65 to 74 Years | 77 (62.6%) | 20 (15.1%) |
| 75 Years and over | 0 (0.0%) | 23 (47.9%) |
Disability Class: Self-Care Difficulty
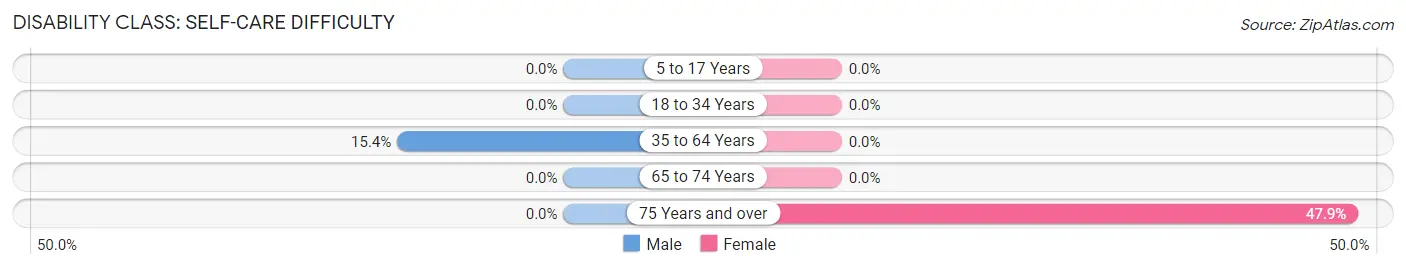
| Age Bracket | Male | Female |
| 5 to 17 Years | 0 (0.0%) | 0 (0.0%) |
| 18 to 34 Years | 0 (0.0%) | 0 (0.0%) |
| 35 to 64 Years | 29 (15.4%) | 0 (0.0%) |
| 65 to 74 Years | 0 (0.0%) | 0 (0.0%) |
| 75 Years and over | 0 (0.0%) | 23 (47.9%) |
Technology Access in Elwood
Computing Device Access in Elwood
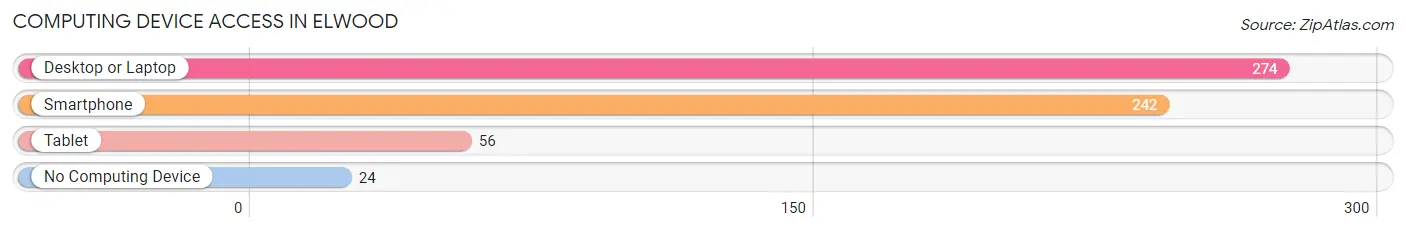
| Device Type | # Households | % Households |
| Desktop or Laptop | 274 | 73.7% |
| Smartphone | 242 | 65.0% |
| Tablet | 56 | 15.0% |
| No Computing Device | 24 | 6.5% |
| Total | 372 | 100.0% |
Internet Access in Elwood
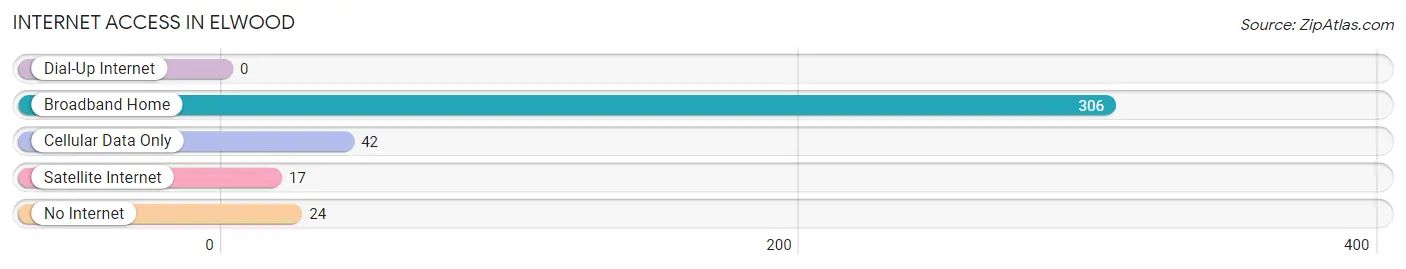
| Internet Type | # Households | % Households |
| Dial-Up Internet | 0 | 0.0% |
| Broadband Home | 306 | 82.3% |
| Cellular Data Only | 42 | 11.3% |
| Satellite Internet | 17 | 4.6% |
| No Internet | 24 | 6.5% |
| Total | 372 | 100.0% |
Elwood Summary
Elwood is a small borough located in Mercer County, New Jersey. It is situated in the heart of the state, just a few miles from the state capital of Trenton. The borough is bordered by Hamilton Township to the north, West Windsor Township to the east, and East Windsor Township to the south. Elwood is a small, rural community with a population of just over 1,000 people.
Geography
Elwood is located in the heart of Mercer County, New Jersey. It is situated in the center of the state, just a few miles from the state capital of Trenton. The borough is bordered by Hamilton Township to the north, West Windsor Township to the east, and East Windsor Township to the south. Elwood is a small, rural community with a population of just over 1,000 people. The borough is located in the Raritan Valley region of New Jersey, which is known for its rolling hills and lush farmland. The area is also home to several small lakes and ponds, as well as the Assunpink Creek, which runs through the borough.
History
Elwood was first settled in the late 1700s by a group of Quakers from Pennsylvania. The borough was originally known as “Quaker Bridge”, and was later renamed “Elwood” after a local landowner. The borough was officially incorporated in 1891.
In the early 1900s, Elwood was a thriving agricultural community. The borough was home to several farms, as well as a number of small businesses. The borough also had a thriving brick-making industry, which provided employment for many of the local residents.
Economy
Elwood is a small, rural community with a population of just over 1,000 people. The borough is home to several small businesses, including a few restaurants, a grocery store, and a few retail stores. The borough also has a few industrial businesses, including a printing company and a metal fabrication shop.
The borough is also home to several farms, which produce a variety of crops, including corn, soybeans, and hay. The farms also raise livestock, including cows, pigs, and chickens.
Demographics
As of the 2010 census, Elwood had a population of 1,072 people. The racial makeup of the borough was 94.3% White, 2.2% African American, 0.3% Native American, 0.7% Asian, and 2.5% from other races. Hispanic or Latino of any race were 5.2% of the population.
The median household income in Elwood was $68,750, and the median family income was $76,250. The per capita income for the borough was $30,945. About 4.3% of families and 5.7% of the population were below the poverty line, including 8.3% of those under age 18 and 4.2% of those age 65 or over.
Elwood is a small, rural community with a population of just over 1,000 people. The borough is home to a variety of businesses, farms, and other amenities. The borough is also home to a diverse population, with a variety of racial and ethnic backgrounds. Elwood is a great place to live, work, and raise a family.
Common Questions
What is Per Capita Income in Elwood?
Per Capita income in Elwood is $34,478.
What is the Median Family Income in Elwood?
Median Family Income in Elwood is $78,034.
What is the Median Household income in Elwood?
Median Household Income in Elwood is $68,043.
What is Income or Wage Gap in Elwood?
Income or Wage Gap in Elwood is 63.2%.
Women in Elwood earn 36.8 cents for every dollar earned by a man.
What is Inequality or Gini Index in Elwood?
Inequality or Gini Index in Elwood is 0.33.
What is the Total Population of Elwood?
Total Population of Elwood is 919.
What is the Total Male Population of Elwood?
Total Male Population of Elwood is 380.
What is the Total Female Population of Elwood?
Total Female Population of Elwood is 539.
What is the Ratio of Males per 100 Females in Elwood?
There are 70.50 Males per 100 Females in Elwood.
What is the Ratio of Females per 100 Males in Elwood?
There are 141.84 Females per 100 Males in Elwood.
What is the Median Population Age in Elwood?
Median Population Age in Elwood is 58.4 Years.
What is the Average Family Size in Elwood
Average Family Size in Elwood is 2.4 People.
What is the Average Household Size in Elwood
Average Household Size in Elwood is 2.2 People.
How Large is the Labor Force in Elwood?
There are 465 People in the Labor Forcein in Elwood.
What is the Percentage of People in the Labor Force in Elwood?
54.9% of People are in the Labor Force in Elwood.
What is the Unemployment Rate in Elwood?
Unemployment Rate in Elwood is 11.2%.