Zip Codes with the Highest Percentage of Population Employed in Food Preparation & Serving in Elizabeth, NJ
RELATED REPORTS & OPTIONS
Food Preparation & Serving
Elizabeth
Compare Zip Codes
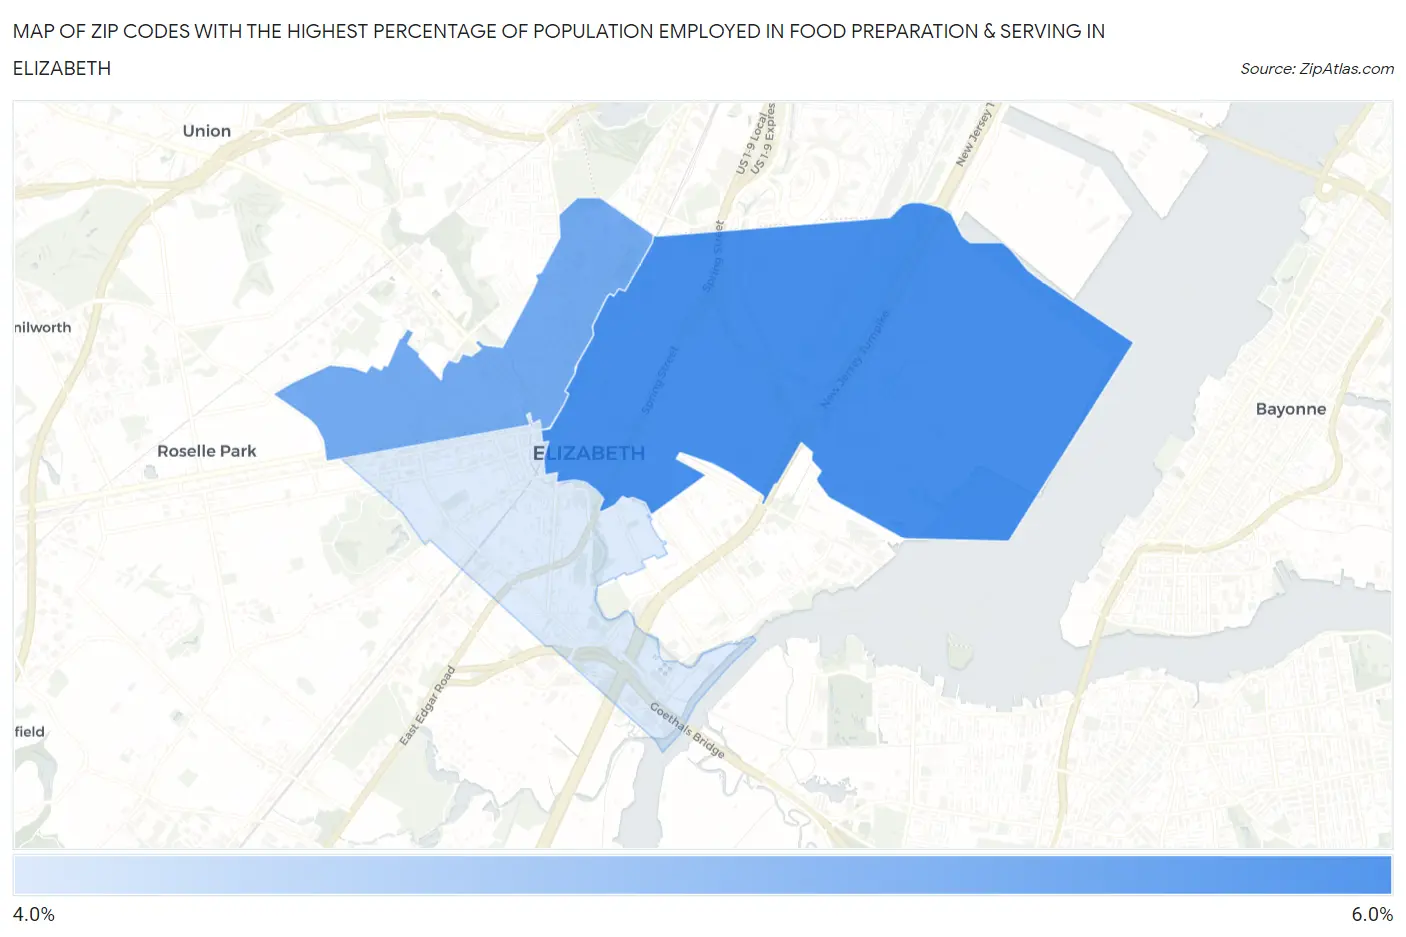
Map of Zip Codes with the Highest Percentage of Population Employed in Food Preparation & Serving in Elizabeth
4.6%
5.1%
Zip Codes with the Highest Percentage of Population Employed in Food Preparation & Serving in Elizabeth, NJ
| Zip Code | % Employed | vs State | vs National | |
| 1. | 07201 | 5.1% | 4.0%(+1.13)#131 | 5.3%(-0.196)#12,580 |
| 2. | 07208 | 4.9% | 4.0%(+0.981)#136 | 5.3%(-0.343)#13,174 |
| 3. | 07202 | 4.6% | 4.0%(+0.633)#164 | 5.3%(-0.691)#14,622 |
1
Common Questions
What are the Top Zip Codes with the Highest Percentage of Population Employed in Food Preparation & Serving in Elizabeth, NJ?
Top Zip Codes with the Highest Percentage of Population Employed in Food Preparation & Serving in Elizabeth, NJ are:
What zip code has the Highest Percentage of Population Employed in Food Preparation & Serving in Elizabeth, NJ?
07201 has the Highest Percentage of Population Employed in Food Preparation & Serving in Elizabeth, NJ with 5.1%.
What is the Percentage of Population Employed in Food Preparation & Serving in Elizabeth, NJ?
Percentage of Population Employed in Food Preparation & Serving in Elizabeth is 4.9%.
What is the Percentage of Population Employed in Food Preparation & Serving in New Jersey?
Percentage of Population Employed in Food Preparation & Serving in New Jersey is 4.0%.
What is the Percentage of Population Employed in Food Preparation & Serving in the United States?
Percentage of Population Employed in Food Preparation & Serving in the United States is 5.3%.