Victory Gardens borough, NJ Map & Demographics
Victory Gardens borough Overview
$25,474
PER CAPITA INCOME
$53,167
AVG FAMILY INCOME
$55,000
AVG HOUSEHOLD INCOME
34.2%
WAGE / INCOME GAP [ % ]
65.8¢/ $1
WAGE / INCOME GAP [ $ ]
$5,088
FAMILY INCOME DEFICIT
0.34
INEQUALITY / GINI INDEX
1,761
TOTAL POPULATION
894
MALE POPULATION
867
FEMALE POPULATION
103.11
MALES / 100 FEMALES
96.98
FEMALES / 100 MALES
40.9
MEDIAN AGE
2.8
AVG FAMILY SIZE
2.6
AVG HOUSEHOLD SIZE
1,057
LABOR FORCE [ PEOPLE ]
72.4%
PERCENT IN LABOR FORCE
8.2%
UNEMPLOYMENT RATE
Income in Victory Gardens borough
Income Overview in Victory Gardens borough
Per Capita Income in Victory Gardens borough is $25,474, while median incomes of families and households are $53,167 and $55,000 respectively.
| Characteristic | Number | Measure |
| Per Capita Income | 1,761 | $25,474 |
| Median Family Income | 544 | $53,167 |
| Mean Family Income | 544 | $63,732 |
| Median Household Income | 670 | $55,000 |
| Mean Household Income | 670 | $65,013 |
| Income Deficit | 544 | $5,088 |
| Wage / Income Gap (%) | 1,761 | 34.22% |
| Wage / Income Gap ($) | 1,761 | 65.78¢ per $1 |
| Gini / Inequality Index | 1,761 | 0.34 |
Earnings by Sex in Victory Gardens borough
Average Earnings in Victory Gardens borough are $29,535, $36,435 for men and $23,966 for women, a difference of 34.2%.
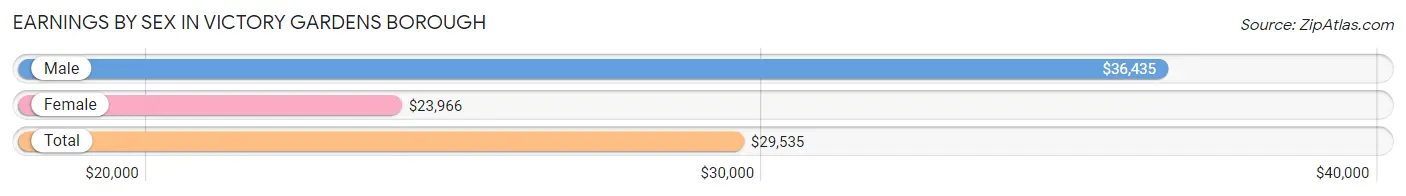
| Sex | Number | Average Earnings |
| Male | 625 (58.6%) | $36,435 |
| Female | 442 (41.4%) | $23,966 |
| Total | 1,067 (100.0%) | $29,535 |
Earnings by Sex by Income Bracket in Victory Gardens borough
The most common earnings brackets in Victory Gardens borough are $55,000 to $64,999 for men (113 | 18.1%) and $30,000 to $34,999 for women (74 | 16.7%).
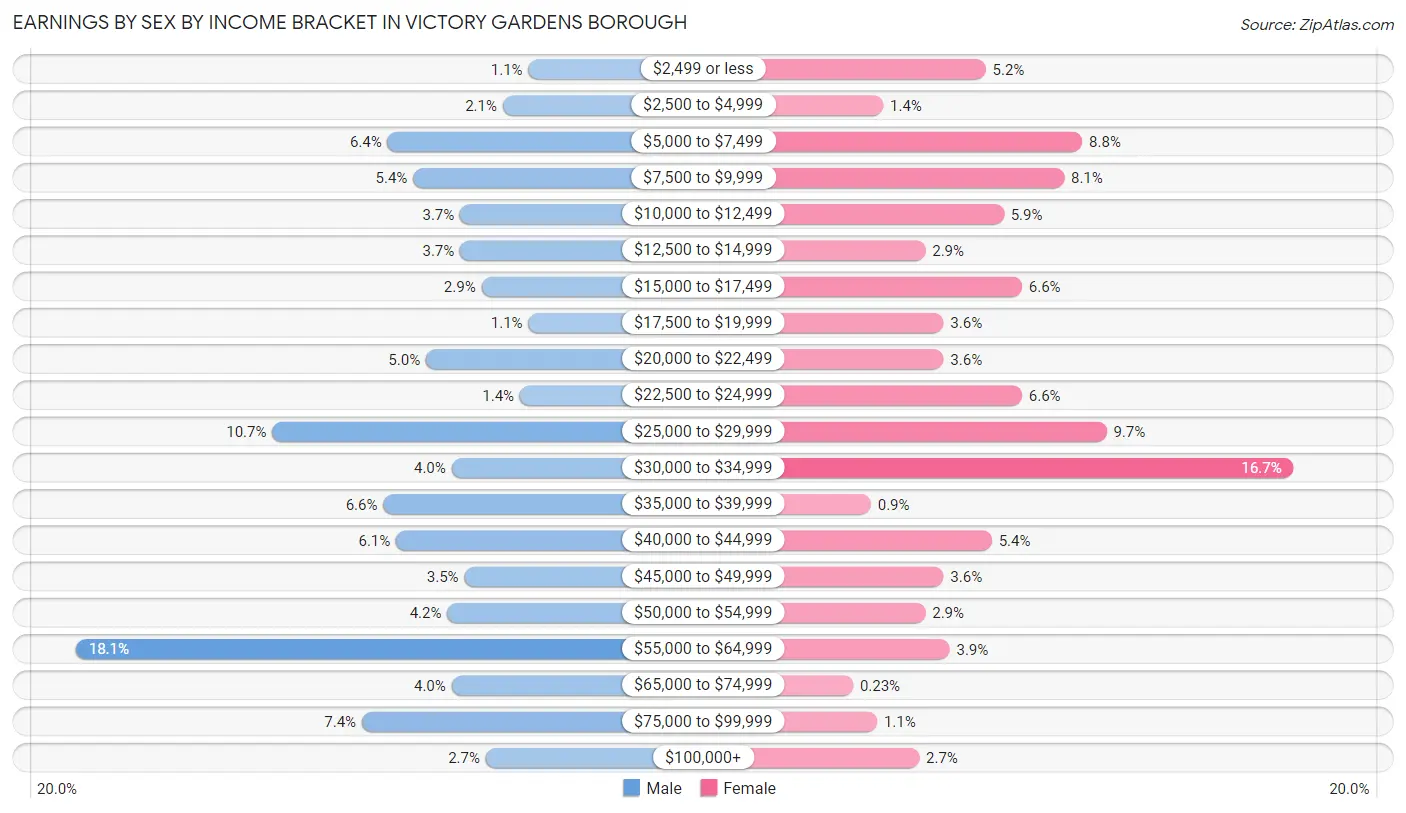
| Income | Male | Female |
| $2,499 or less | 7 (1.1%) | 23 (5.2%) |
| $2,500 to $4,999 | 13 (2.1%) | 6 (1.4%) |
| $5,000 to $7,499 | 40 (6.4%) | 39 (8.8%) |
| $7,500 to $9,999 | 34 (5.4%) | 36 (8.1%) |
| $10,000 to $12,499 | 23 (3.7%) | 26 (5.9%) |
| $12,500 to $14,999 | 23 (3.7%) | 13 (2.9%) |
| $15,000 to $17,499 | 18 (2.9%) | 29 (6.6%) |
| $17,500 to $19,999 | 7 (1.1%) | 16 (3.6%) |
| $20,000 to $22,499 | 31 (5.0%) | 16 (3.6%) |
| $22,500 to $24,999 | 9 (1.4%) | 29 (6.6%) |
| $25,000 to $29,999 | 67 (10.7%) | 43 (9.7%) |
| $30,000 to $34,999 | 25 (4.0%) | 74 (16.7%) |
| $35,000 to $39,999 | 41 (6.6%) | 4 (0.9%) |
| $40,000 to $44,999 | 38 (6.1%) | 24 (5.4%) |
| $45,000 to $49,999 | 22 (3.5%) | 16 (3.6%) |
| $50,000 to $54,999 | 26 (4.2%) | 13 (2.9%) |
| $55,000 to $64,999 | 113 (18.1%) | 17 (3.8%) |
| $65,000 to $74,999 | 25 (4.0%) | 1 (0.2%) |
| $75,000 to $99,999 | 46 (7.4%) | 5 (1.1%) |
| $100,000+ | 17 (2.7%) | 12 (2.7%) |
| Total | 625 (100.0%) | 442 (100.0%) |
Earnings by Sex by Educational Attainment in Victory Gardens borough
Average earnings in Victory Gardens borough are $39,643 for men and $29,063 for women, a difference of 26.7%. Men with an educational attainment of graduate degree enjoy the highest average annual earnings of $70,714, while those with high school diploma education earn the least with $26,190. Women with an educational attainment of college or associate's degree earn the most with the average annual earnings of $34,000, while those with high school diploma education have the smallest earnings of $23,641.
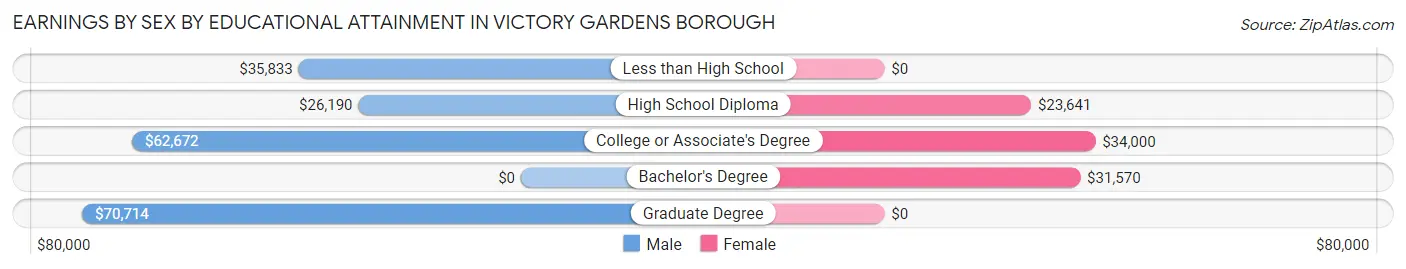
| Educational Attainment | Male Income | Female Income |
| Less than High School | $35,833 | $0 |
| High School Diploma | $26,190 | $23,641 |
| College or Associate's Degree | $62,672 | $34,000 |
| Bachelor's Degree | - | - |
| Graduate Degree | $70,714 | $0 |
| Total | $39,643 | $29,063 |
Family Income in Victory Gardens borough
Family Income Brackets in Victory Gardens borough
According to the Victory Gardens borough family income data, there are 143 families falling into the $50,000 to $74,999 income range, which is the most common income bracket and makes up 26.3% of all families. Conversely, the $200,000+ income bracket is the least frequent group with only 6 families (1.1%) belonging to this category.
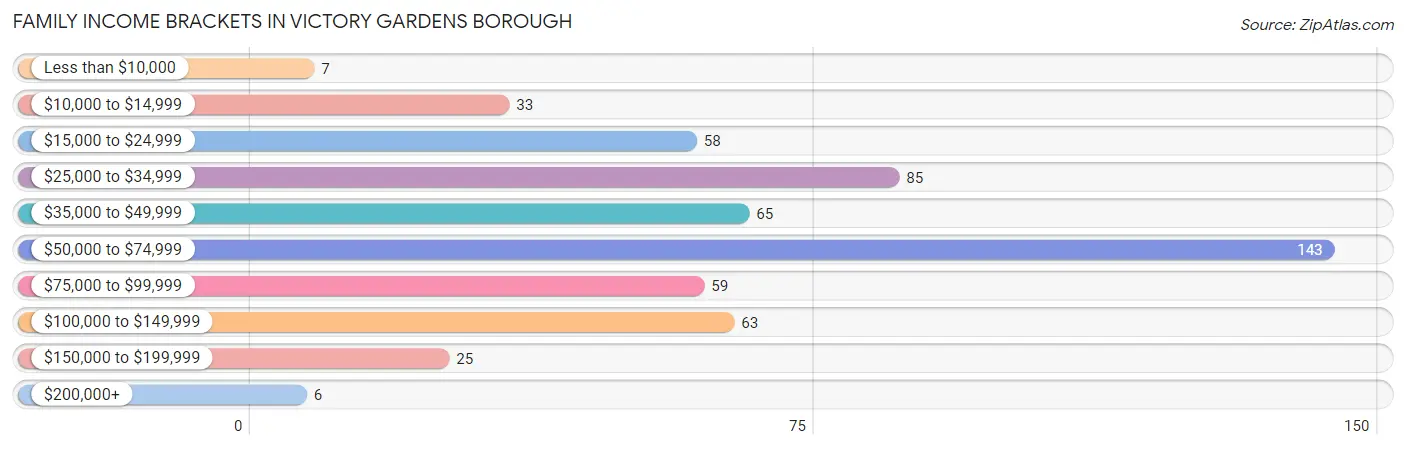
| Income Bracket | # Families | % Families |
| Less than $10,000 | 7 | 1.3% |
| $10,000 to $14,999 | 33 | 6.1% |
| $15,000 to $24,999 | 58 | 10.7% |
| $25,000 to $34,999 | 85 | 15.6% |
| $35,000 to $49,999 | 65 | 11.9% |
| $50,000 to $74,999 | 143 | 26.3% |
| $75,000 to $99,999 | 59 | 10.8% |
| $100,000 to $149,999 | 63 | 11.6% |
| $150,000 to $199,999 | 25 | 4.6% |
| $200,000+ | 6 | 1.1% |
Family Income by Famaliy Size in Victory Gardens borough
2-person families (273 | 50.2%) account for the highest median family income in Victory Gardens borough with $68,811 per family, while 2-person families (273 | 50.2%) have the highest median income of $34,406 per family member.
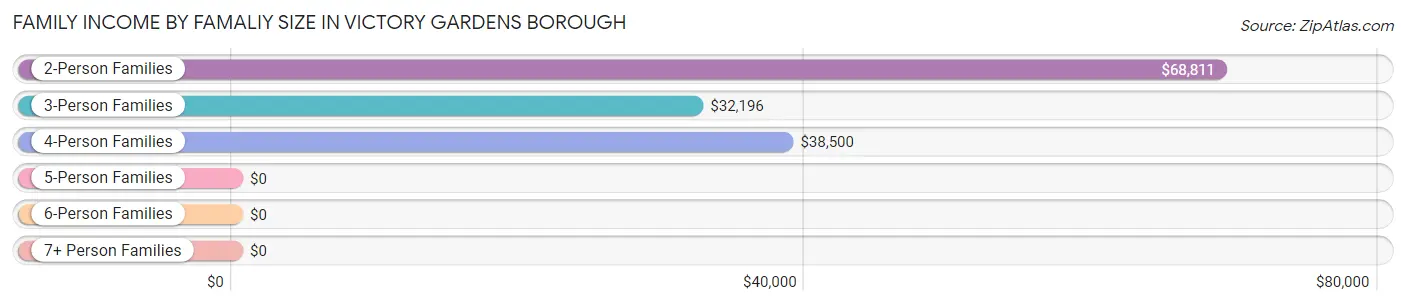
| Income Bracket | # Families | Median Income |
| 2-Person Families | 273 (50.2%) | $68,811 |
| 3-Person Families | 179 (32.9%) | $32,196 |
| 4-Person Families | 52 (9.6%) | $38,500 |
| 5-Person Families | 33 (6.1%) | $0 |
| 6-Person Families | 7 (1.3%) | $0 |
| 7+ Person Families | 0 (0.0%) | $0 |
| Total | 544 (100.0%) | $53,167 |
Family Income by Number of Earners in Victory Gardens borough
The median family income in Victory Gardens borough is $53,167, with families comprising 3+ earners (31) having the highest median family income of $141,250, while families with no earners (25) have the lowest median family income of $31,736, accounting for 5.7% and 4.6% of families, respectively.
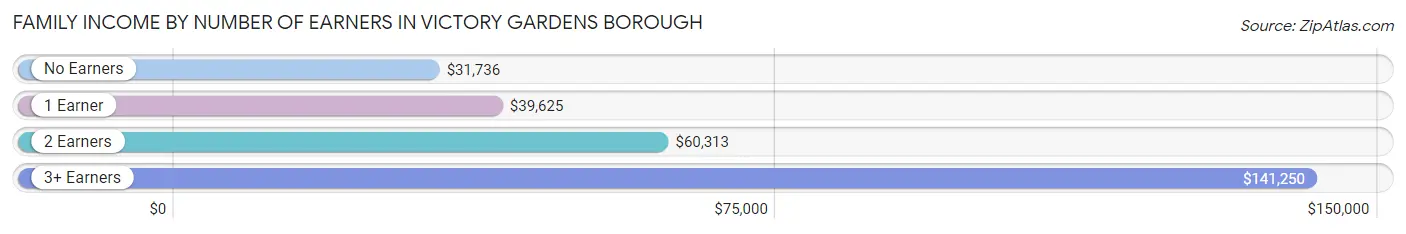
| Number of Earners | # Families | Median Income |
| No Earners | 25 (4.6%) | $31,736 |
| 1 Earner | 255 (46.9%) | $39,625 |
| 2 Earners | 233 (42.8%) | $60,313 |
| 3+ Earners | 31 (5.7%) | $141,250 |
| Total | 544 (100.0%) | $53,167 |
Household Income in Victory Gardens borough
Household Income Brackets in Victory Gardens borough
With 185 households falling in the category, the $50,000 to $74,999 income range is the most frequent in Victory Gardens borough, accounting for 27.6% of all households. In contrast, only 9 households (1.3%) fall into the $200,000+ income bracket, making it the least populous group.
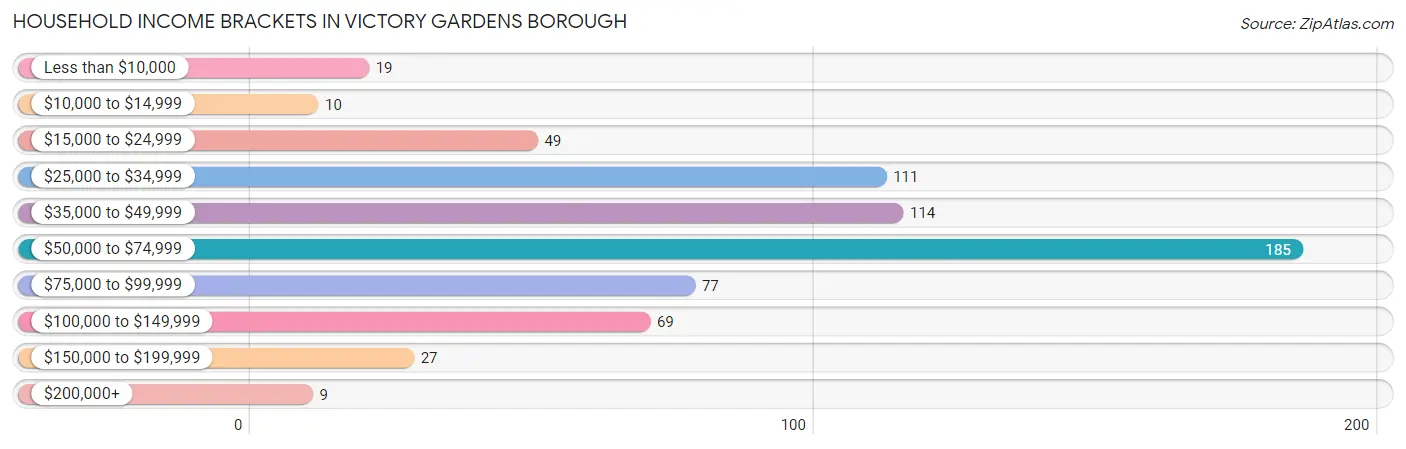
| Income Bracket | # Households | % Households |
| Less than $10,000 | 19 | 2.8% |
| $10,000 to $14,999 | 10 | 1.5% |
| $15,000 to $24,999 | 49 | 7.3% |
| $25,000 to $34,999 | 111 | 16.6% |
| $35,000 to $49,999 | 114 | 17.0% |
| $50,000 to $74,999 | 185 | 27.6% |
| $75,000 to $99,999 | 77 | 11.5% |
| $100,000 to $149,999 | 69 | 10.3% |
| $150,000 to $199,999 | 27 | 4.0% |
| $200,000+ | 9 | 1.3% |
Household Income by Householder Age in Victory Gardens borough
The median household income in Victory Gardens borough is $55,000, with the highest median household income of $70,282 found in the 65+ years age bracket for the primary householder. A total of 113 households (16.9%) fall into this category. Meanwhile, the 15 to 24 years age bracket for the primary householder has the lowest median household income of $0, with 35 households (5.2%) in this group.
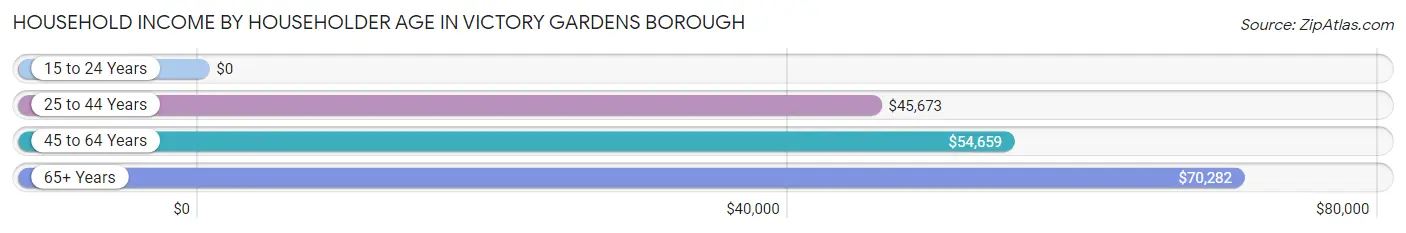
| Income Bracket | # Households | Median Income |
| 15 to 24 Years | 35 (5.2%) | $0 |
| 25 to 44 Years | 203 (30.3%) | $45,673 |
| 45 to 64 Years | 319 (47.6%) | $54,659 |
| 65+ Years | 113 (16.9%) | $70,282 |
| Total | 670 (100.0%) | $55,000 |
Poverty in Victory Gardens borough
Income Below Poverty by Sex and Age in Victory Gardens borough
With 21.0% poverty level for males and 24.7% for females among the residents of Victory Gardens borough, 15 year old males and 5 year old females are the most vulnerable to poverty, with 20 males (64.5%) and 8 females (100.0%) in their respective age groups living below the poverty level.
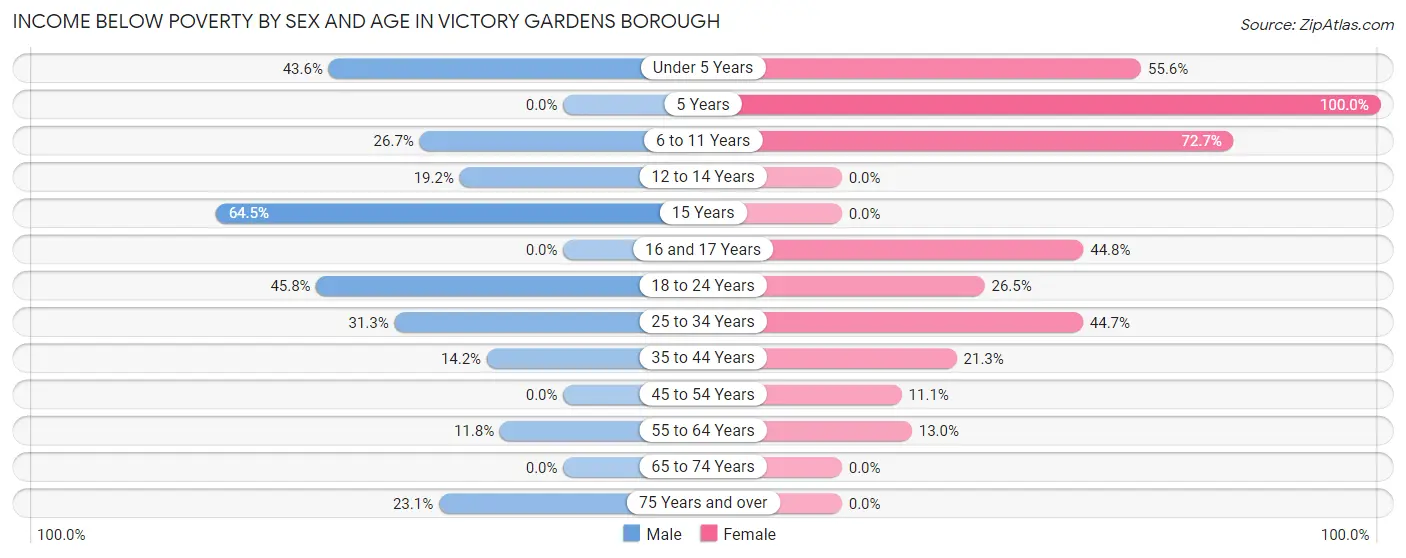
| Age Bracket | Male | Female |
| Under 5 Years | 27 (43.5%) | 25 (55.6%) |
| 5 Years | 0 (0.0%) | 8 (100.0%) |
| 6 to 11 Years | 12 (26.7%) | 32 (72.7%) |
| 12 to 14 Years | 10 (19.2%) | 0 (0.0%) |
| 15 Years | 20 (64.5%) | 0 (0.0%) |
| 16 and 17 Years | 0 (0.0%) | 13 (44.8%) |
| 18 to 24 Years | 44 (45.8%) | 31 (26.5%) |
| 25 to 34 Years | 42 (31.3%) | 34 (44.7%) |
| 35 to 44 Years | 20 (14.2%) | 39 (21.3%) |
| 45 to 54 Years | 0 (0.0%) | 12 (11.1%) |
| 55 to 64 Years | 10 (11.8%) | 20 (13.0%) |
| 65 to 74 Years | 0 (0.0%) | 0 (0.0%) |
| 75 Years and over | 3 (23.1%) | 0 (0.0%) |
| Total | 188 (21.0%) | 214 (24.7%) |
Income Above Poverty by Sex and Age in Victory Gardens borough
According to the poverty statistics in Victory Gardens borough, males aged 16 and 17 years and females aged 12 to 14 years are the age groups that are most secure financially, with 100.0% of males and 100.0% of females in these age groups living above the poverty line.
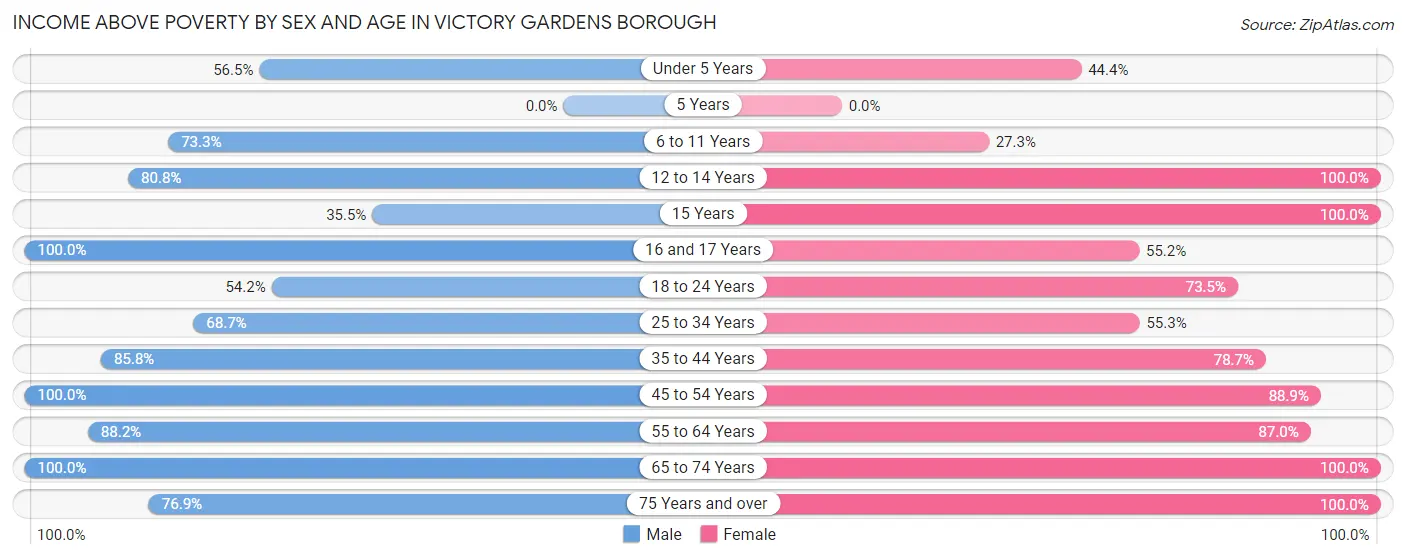
| Age Bracket | Male | Female |
| Under 5 Years | 35 (56.5%) | 20 (44.4%) |
| 5 Years | 0 (0.0%) | 0 (0.0%) |
| 6 to 11 Years | 33 (73.3%) | 12 (27.3%) |
| 12 to 14 Years | 42 (80.8%) | 10 (100.0%) |
| 15 Years | 11 (35.5%) | 4 (100.0%) |
| 16 and 17 Years | 5 (100.0%) | 16 (55.2%) |
| 18 to 24 Years | 52 (54.2%) | 86 (73.5%) |
| 25 to 34 Years | 92 (68.7%) | 42 (55.3%) |
| 35 to 44 Years | 121 (85.8%) | 144 (78.7%) |
| 45 to 54 Years | 197 (100.0%) | 96 (88.9%) |
| 55 to 64 Years | 75 (88.2%) | 134 (87.0%) |
| 65 to 74 Years | 33 (100.0%) | 41 (100.0%) |
| 75 Years and over | 10 (76.9%) | 48 (100.0%) |
| Total | 706 (79.0%) | 653 (75.3%) |
Income Below Poverty Among Married-Couple Families in Victory Gardens borough
The poverty statistics for married-couple families in Victory Gardens borough show that 13.0% or 37 of the total 285 families live below the poverty line. Families with 3 or 4 children have the highest poverty rate of 58.3%, comprising of 14 families. On the other hand, families with no children have the lowest poverty rate of 4.0%, which includes 6 families.
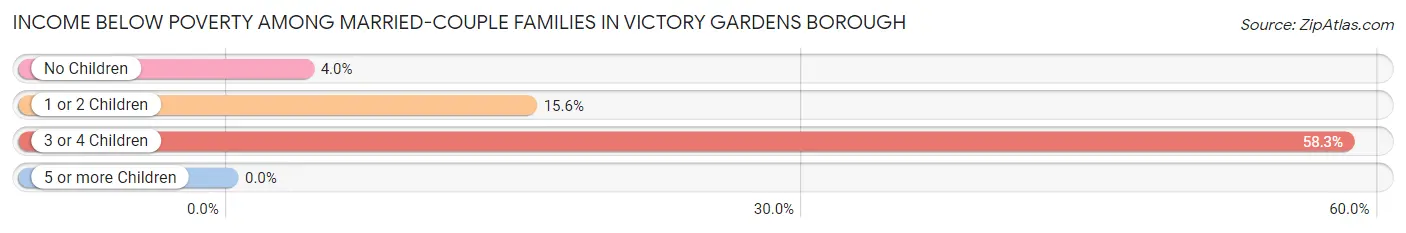
| Children | Above Poverty | Below Poverty |
| No Children | 146 (96.1%) | 6 (4.0%) |
| 1 or 2 Children | 92 (84.4%) | 17 (15.6%) |
| 3 or 4 Children | 10 (41.7%) | 14 (58.3%) |
| 5 or more Children | 0 (0.0%) | 0 (0.0%) |
| Total | 248 (87.0%) | 37 (13.0%) |
Income Below Poverty Among Single-Parent Households in Victory Gardens borough
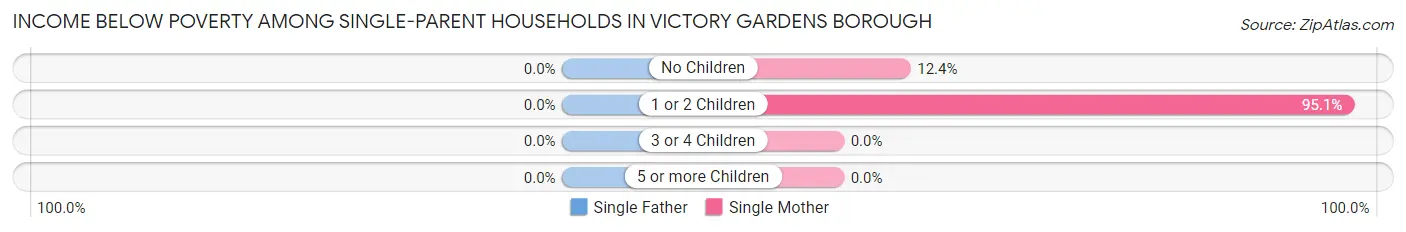
| Children | Single Father | Single Mother |
| No Children | 0 (0.0%) | 17 (12.4%) |
| 1 or 2 Children | 0 (0.0%) | 58 (95.1%) |
| 3 or 4 Children | 0 (0.0%) | 0 (0.0%) |
| 5 or more Children | 0 (0.0%) | 0 (0.0%) |
| Total | 0 (0.0%) | 75 (37.9%) |
Income Below Poverty Among Married-Couple vs Single-Parent Households in Victory Gardens borough
The poverty data for Victory Gardens borough shows that 37 of the married-couple family households (13.0%) and 75 of the single-parent households (29.0%) are living below the poverty level. Within the married-couple family households, those with 3 or 4 children have the highest poverty rate, with 14 households (58.3%) falling below the poverty line. Among the single-parent households, those with 1 or 2 children have the highest poverty rate, with 58 household (79.4%) living below poverty.
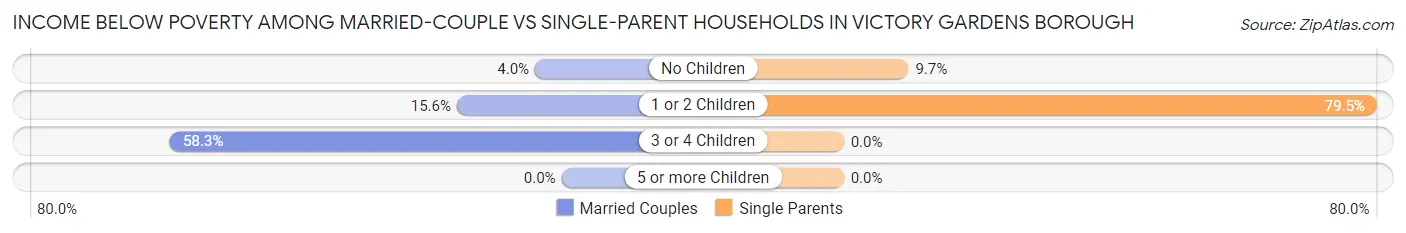
| Children | Married-Couple Families | Single-Parent Households |
| No Children | 6 (4.0%) | 17 (9.7%) |
| 1 or 2 Children | 17 (15.6%) | 58 (79.4%) |
| 3 or 4 Children | 14 (58.3%) | 0 (0.0%) |
| 5 or more Children | 0 (0.0%) | 0 (0.0%) |
| Total | 37 (13.0%) | 75 (29.0%) |
Race in Victory Gardens borough
The most populous races in Victory Gardens borough are Hispanic or Latino (1,302 | 73.9%), Some other Race (756 | 42.9%), and White / Caucasian (589 | 33.5%).
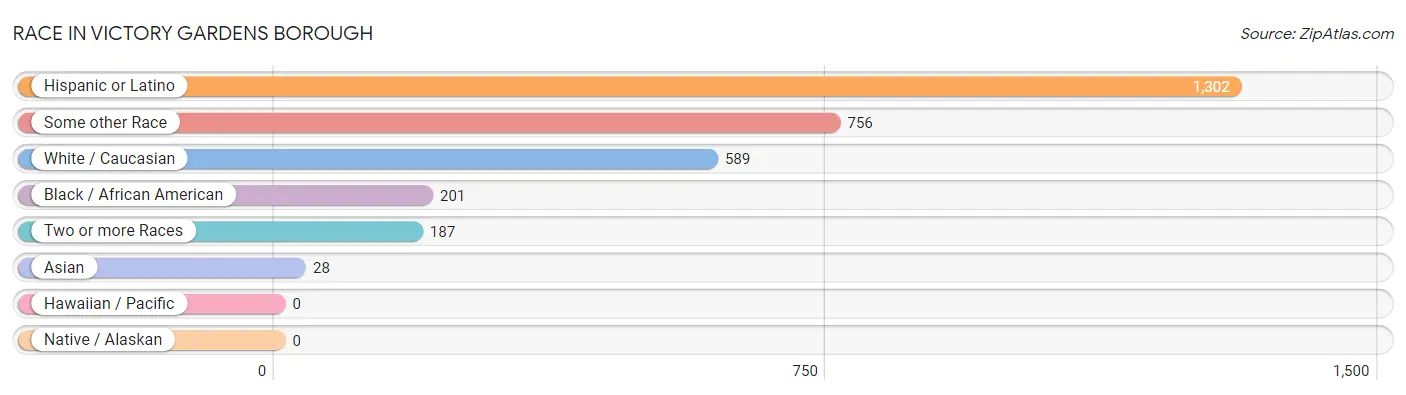
| Race | # Population | % Population |
| Asian | 28 | 1.6% |
| Black / African American | 201 | 11.4% |
| Hawaiian / Pacific | 0 | 0.0% |
| Hispanic or Latino | 1,302 | 73.9% |
| Native / Alaskan | 0 | 0.0% |
| White / Caucasian | 589 | 33.5% |
| Two or more Races | 187 | 10.6% |
| Some other Race | 756 | 42.9% |
| Total | 1,761 | 100.0% |
Ancestry in Victory Gardens borough
The most populous ancestries reported in Victory Gardens borough are South American (682 | 38.7%), Colombian (558 | 31.7%), Central American (216 | 12.3%), Puerto Rican (167 | 9.5%), and Honduran (155 | 8.8%), together accounting for 101.0% of all Victory Gardens borough residents.
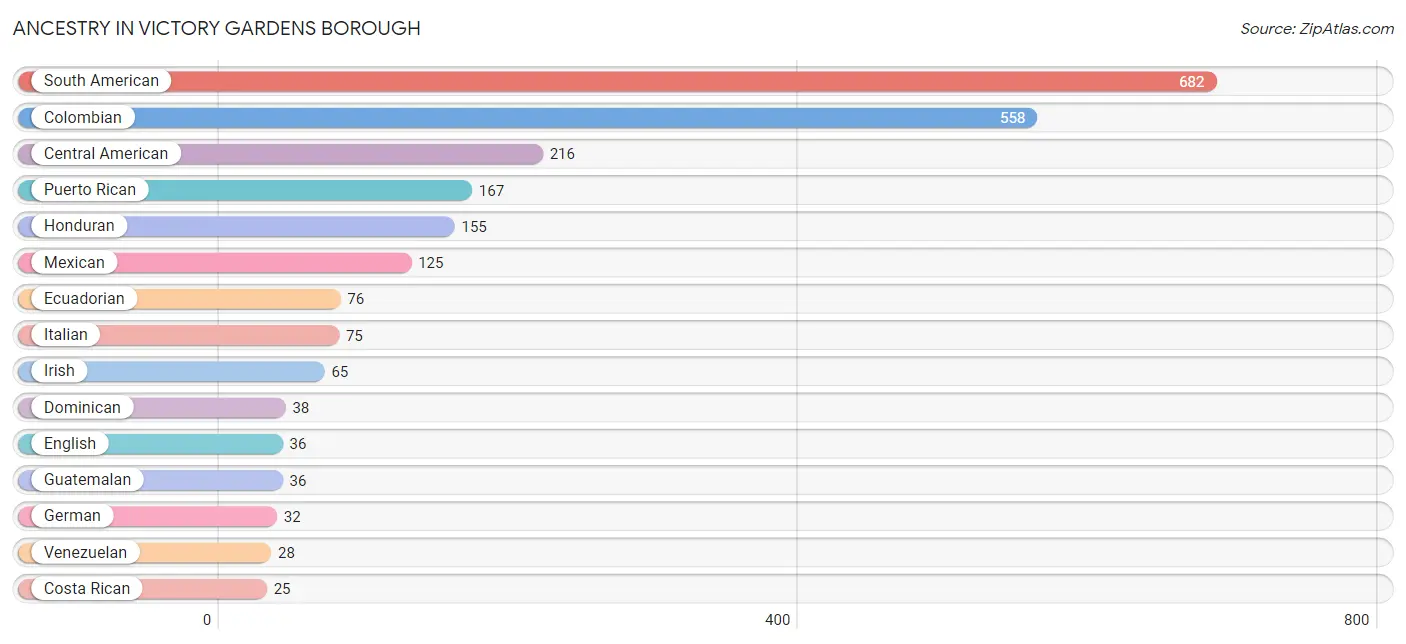
| Ancestry | # Population | % Population |
| African | 21 | 1.2% |
| American | 7 | 0.4% |
| Armenian | 3 | 0.2% |
| Belgian | 3 | 0.2% |
| British | 3 | 0.2% |
| Burmese | 2 | 0.1% |
| Central American | 216 | 12.3% |
| Cherokee | 9 | 0.5% |
| Chilean | 16 | 0.9% |
| Colombian | 558 | 31.7% |
| Costa Rican | 25 | 1.4% |
| Cuban | 4 | 0.2% |
| Dominican | 38 | 2.2% |
| Dutch | 10 | 0.6% |
| Ecuadorian | 76 | 4.3% |
| English | 36 | 2.0% |
| Ethiopian | 3 | 0.2% |
| French | 7 | 0.4% |
| German | 32 | 1.8% |
| Guatemalan | 36 | 2.0% |
| Honduran | 155 | 8.8% |
| Hungarian | 15 | 0.9% |
| Irish | 65 | 3.7% |
| Italian | 75 | 4.3% |
| Korean | 3 | 0.2% |
| Mexican | 125 | 7.1% |
| Peruvian | 4 | 0.2% |
| Polish | 16 | 0.9% |
| Puerto Rican | 167 | 9.5% |
| Russian | 5 | 0.3% |
| Scottish | 19 | 1.1% |
| South American | 682 | 38.7% |
| Sri Lankan | 5 | 0.3% |
| Subsaharan African | 24 | 1.4% |
| Thai | 18 | 1.0% |
| Ukrainian | 5 | 0.3% |
| Venezuelan | 28 | 1.6% |
| Welsh | 9 | 0.5% | View All 38 Rows |
Immigrants in Victory Gardens borough
The most numerous immigrant groups reported in Victory Gardens borough came from Latin America (897 | 50.9%), South America (570 | 32.4%), Colombia (463 | 26.3%), Central America (281 | 16.0%), and Honduras (122 | 6.9%), together accounting for 132.5% of all Victory Gardens borough residents.
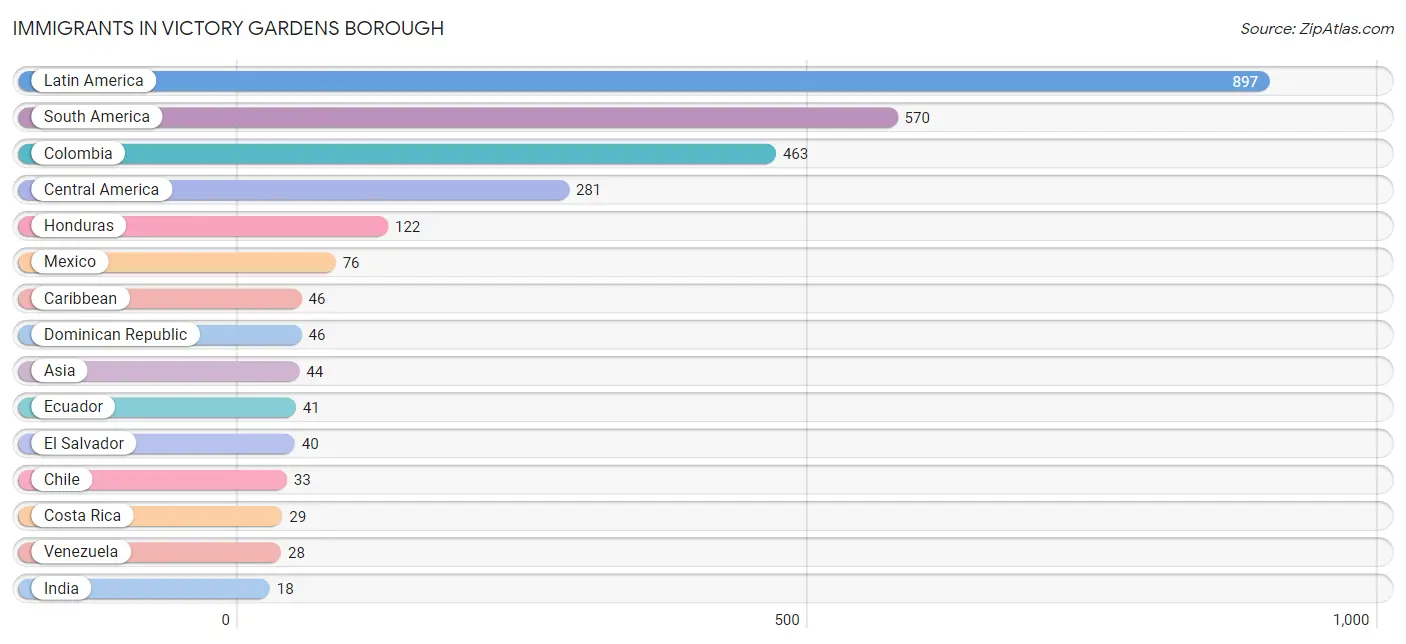
| Immigration Origin | # Population | % Population |
| Africa | 6 | 0.3% |
| Asia | 44 | 2.5% |
| Caribbean | 46 | 2.6% |
| Central America | 281 | 16.0% |
| Chile | 33 | 1.9% |
| Colombia | 463 | 26.3% |
| Costa Rica | 29 | 1.7% |
| Dominican Republic | 46 | 2.6% |
| Eastern Africa | 6 | 0.3% |
| Eastern Europe | 6 | 0.3% |
| Ecuador | 41 | 2.3% |
| El Salvador | 40 | 2.3% |
| Eritrea | 3 | 0.2% |
| Europe | 9 | 0.5% |
| Guatemala | 14 | 0.8% |
| Honduras | 122 | 6.9% |
| India | 18 | 1.0% |
| Italy | 3 | 0.2% |
| Kenya | 3 | 0.2% |
| Latin America | 897 | 50.9% |
| Lebanon | 6 | 0.3% |
| Mexico | 76 | 4.3% |
| Peru | 5 | 0.3% |
| Philippines | 3 | 0.2% |
| Poland | 6 | 0.3% |
| South America | 570 | 32.4% |
| South Central Asia | 18 | 1.0% |
| South Eastern Asia | 8 | 0.4% |
| Southern Europe | 3 | 0.2% |
| Turkey | 7 | 0.4% |
| Venezuela | 28 | 1.6% |
| Vietnam | 5 | 0.3% |
| Western Asia | 18 | 1.0% | View All 33 Rows |
Sex and Age in Victory Gardens borough
Sex and Age in Victory Gardens borough
The most populous age groups in Victory Gardens borough are 50 to 54 Years (136 | 15.2%) for men and 40 to 44 Years (140 | 16.2%) for women.
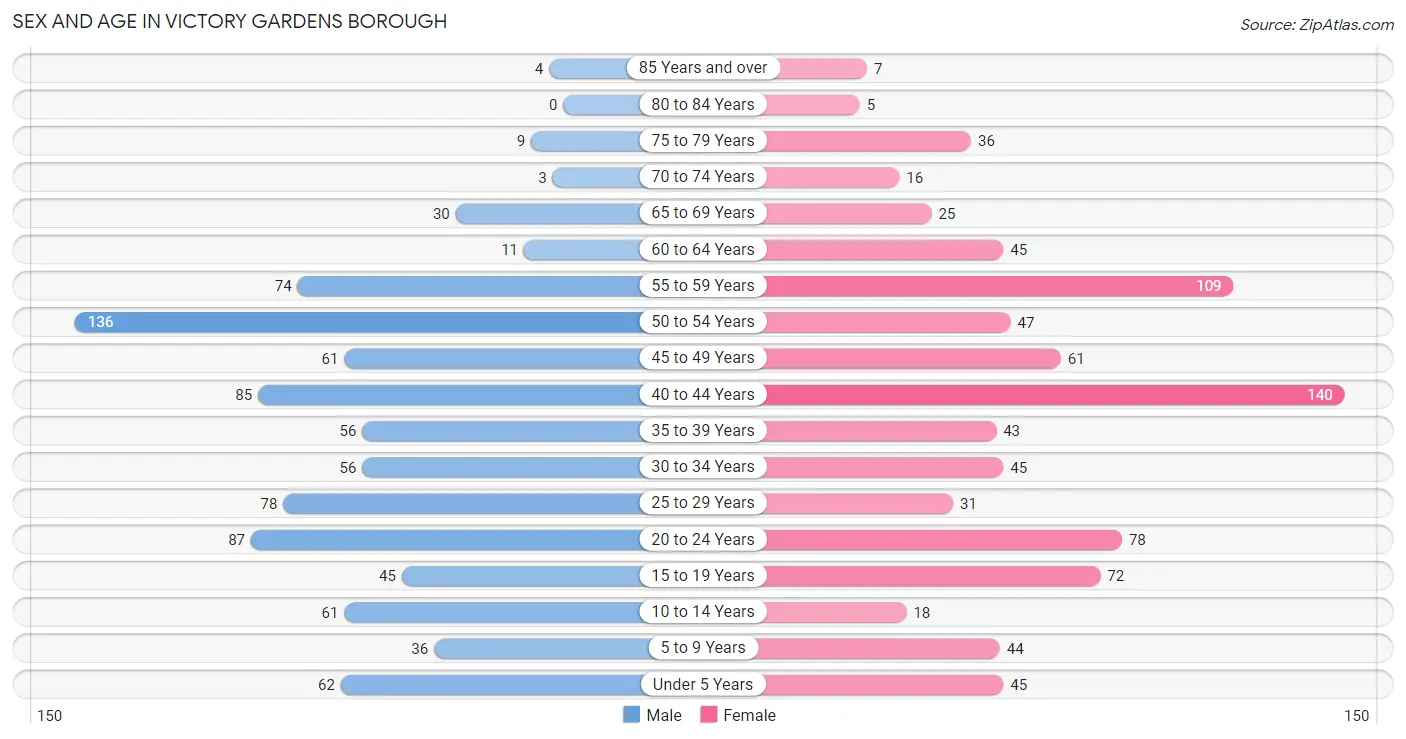
| Age Bracket | Male | Female |
| Under 5 Years | 62 (6.9%) | 45 (5.2%) |
| 5 to 9 Years | 36 (4.0%) | 44 (5.1%) |
| 10 to 14 Years | 61 (6.8%) | 18 (2.1%) |
| 15 to 19 Years | 45 (5.0%) | 72 (8.3%) |
| 20 to 24 Years | 87 (9.7%) | 78 (9.0%) |
| 25 to 29 Years | 78 (8.7%) | 31 (3.6%) |
| 30 to 34 Years | 56 (6.3%) | 45 (5.2%) |
| 35 to 39 Years | 56 (6.3%) | 43 (5.0%) |
| 40 to 44 Years | 85 (9.5%) | 140 (16.2%) |
| 45 to 49 Years | 61 (6.8%) | 61 (7.0%) |
| 50 to 54 Years | 136 (15.2%) | 47 (5.4%) |
| 55 to 59 Years | 74 (8.3%) | 109 (12.6%) |
| 60 to 64 Years | 11 (1.2%) | 45 (5.2%) |
| 65 to 69 Years | 30 (3.4%) | 25 (2.9%) |
| 70 to 74 Years | 3 (0.3%) | 16 (1.8%) |
| 75 to 79 Years | 9 (1.0%) | 36 (4.2%) |
| 80 to 84 Years | 0 (0.0%) | 5 (0.6%) |
| 85 Years and over | 4 (0.4%) | 7 (0.8%) |
| Total | 894 (100.0%) | 867 (100.0%) |
Families and Households in Victory Gardens borough
Median Family Size in Victory Gardens borough
The median family size in Victory Gardens borough is 2.82 persons per family, with married-couple families (285 | 52.4%) accounting for the largest median family size of 3.06 persons per family. On the other hand, single male/father families (61 | 11.2%) represent the smallest median family size with 2.44 persons per family.
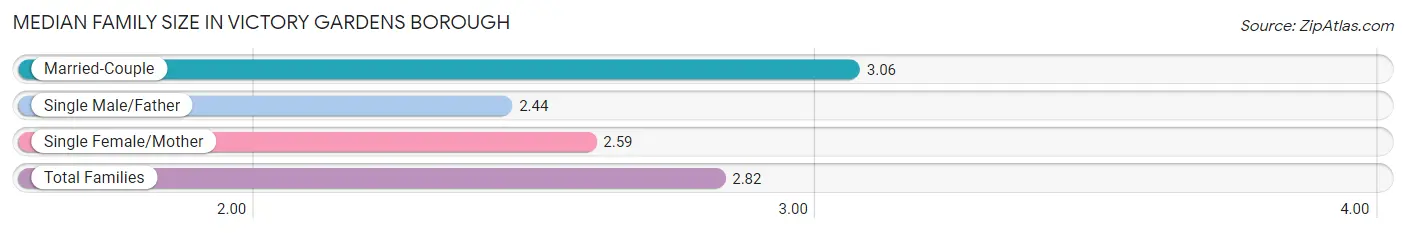
| Family Type | # Families | Family Size |
| Married-Couple | 285 (52.4%) | 3.06 |
| Single Male/Father | 61 (11.2%) | 2.44 |
| Single Female/Mother | 198 (36.4%) | 2.59 |
| Total Families | 544 (100.0%) | 2.82 |
Median Household Size in Victory Gardens borough
The median household size in Victory Gardens borough is 2.63 persons per household, with married-couple households (285 | 42.5%) accounting for the largest median household size of 3.07 persons per household. non-family households (126 | 18.8%) represent the smallest median household size with 1.23 persons per household.
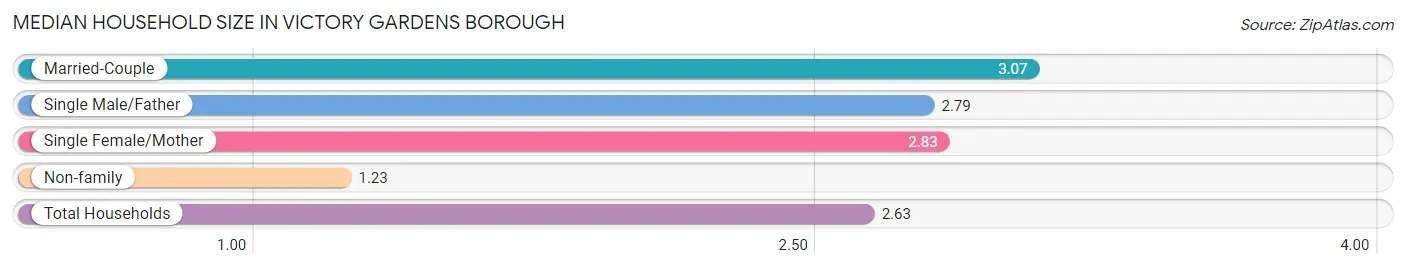
| Household Type | # Households | Household Size |
| Married-Couple | 285 (42.5%) | 3.07 |
| Single Male/Father | 61 (9.1%) | 2.79 |
| Single Female/Mother | 198 (29.5%) | 2.83 |
| Non-family | 126 (18.8%) | 1.23 |
| Total Households | 670 (100.0%) | 2.63 |
Household Size by Marriage Status in Victory Gardens borough
Out of a total of 670 households in Victory Gardens borough, 544 (81.2%) are family households, while 126 (18.8%) are nonfamily households. The most numerous type of family households are 2-person households, comprising 234, and the most common type of nonfamily households are 1-person households, comprising 103.
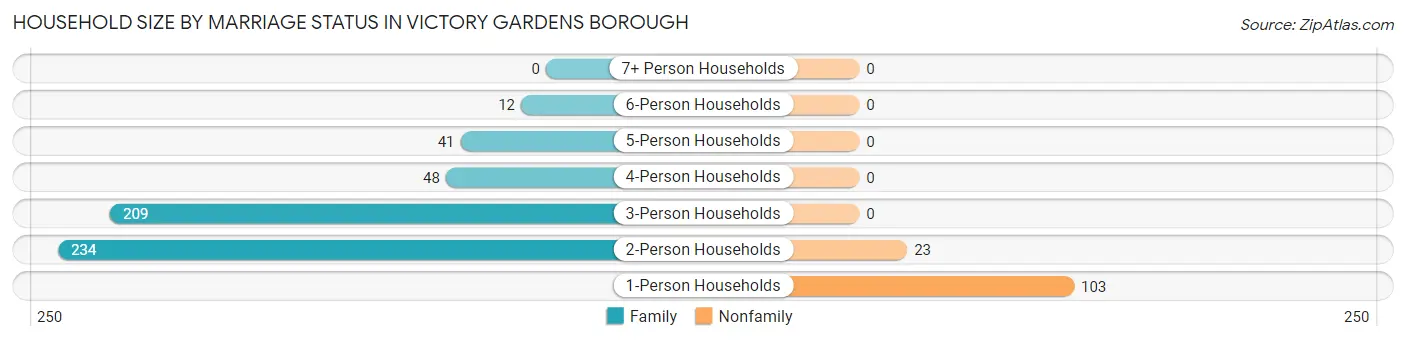
| Household Size | Family Households | Nonfamily Households |
| 1-Person Households | - | 103 (15.4%) |
| 2-Person Households | 234 (34.9%) | 23 (3.4%) |
| 3-Person Households | 209 (31.2%) | 0 (0.0%) |
| 4-Person Households | 48 (7.2%) | 0 (0.0%) |
| 5-Person Households | 41 (6.1%) | 0 (0.0%) |
| 6-Person Households | 12 (1.8%) | 0 (0.0%) |
| 7+ Person Households | 0 (0.0%) | 0 (0.0%) |
| Total | 544 (81.2%) | 126 (18.8%) |
Female Fertility in Victory Gardens borough
Fertility by Age in Victory Gardens borough
Average fertility rate in Victory Gardens borough is 32.0 births per 1,000 women. Women in the age bracket of 20 to 34 years have the highest fertility rate with 78.0 births per 1,000 women. Women in the age bracket of 20 to 34 years acount for 80.0% of all women with births.
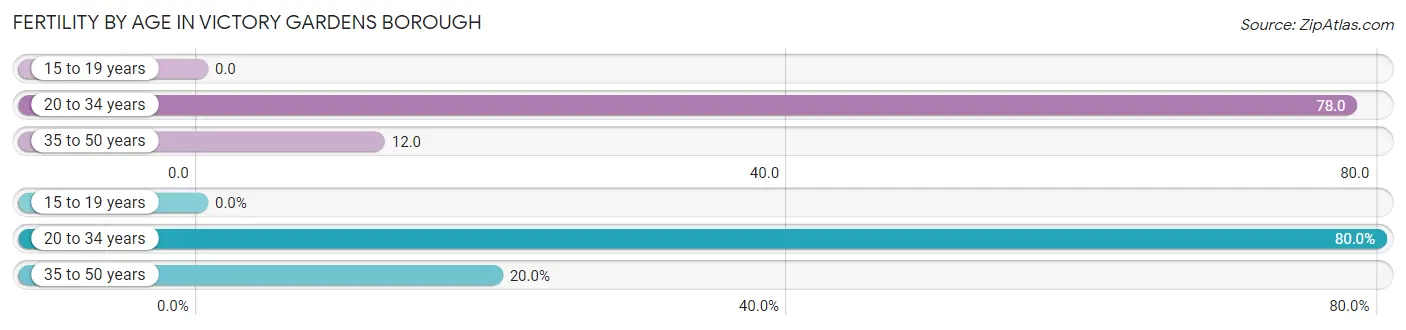
| Age Bracket | Women with Births | Births / 1,000 Women |
| 15 to 19 years | 0 (0.0%) | 0.0 |
| 20 to 34 years | 12 (80.0%) | 78.0 |
| 35 to 50 years | 3 (20.0%) | 12.0 |
| Total | 15 (100.0%) | 32.0 |
Fertility by Age by Marriage Status in Victory Gardens borough
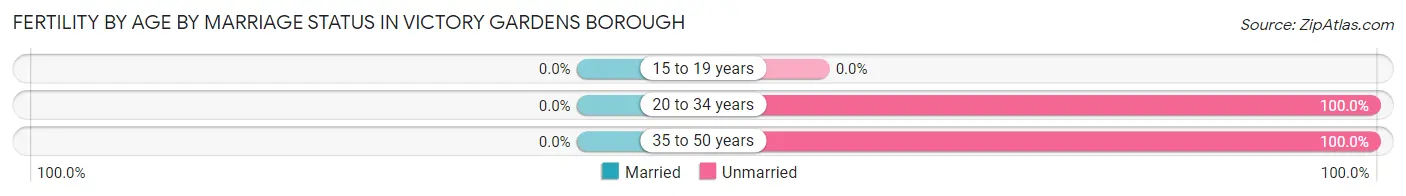
| Age Bracket | Married | Unmarried |
| 15 to 19 years | 0 (0.0%) | 0 (0.0%) |
| 20 to 34 years | 0 (0.0%) | 12 (100.0%) |
| 35 to 50 years | 0 (0.0%) | 3 (100.0%) |
| Total | 0 (0.0%) | 15 (100.0%) |
Fertility by Education in Victory Gardens borough
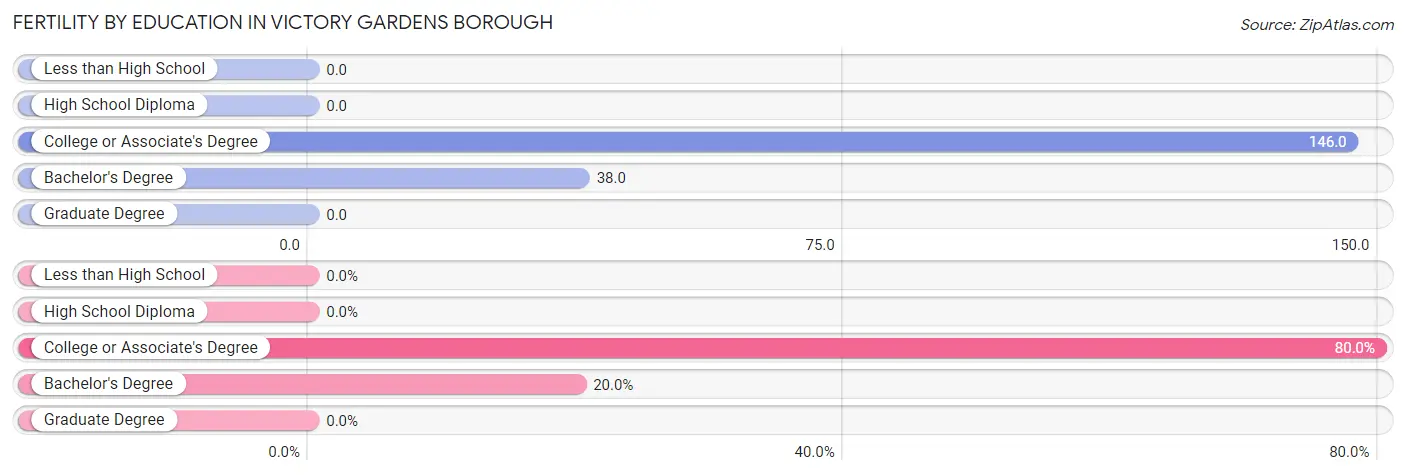
| Educational Attainment | Women with Births | Births / 1,000 Women |
| Less than High School | 0 (0.0%) | 0.0 |
| High School Diploma | 0 (0.0%) | 0.0 |
| College or Associate's Degree | 12 (80.0%) | 146.0 |
| Bachelor's Degree | 3 (20.0%) | 38.0 |
| Graduate Degree | 0 (0.0%) | 0.0 |
| Total | 15 (100.0%) | 32.0 |
Fertility by Education by Marriage Status in Victory Gardens borough
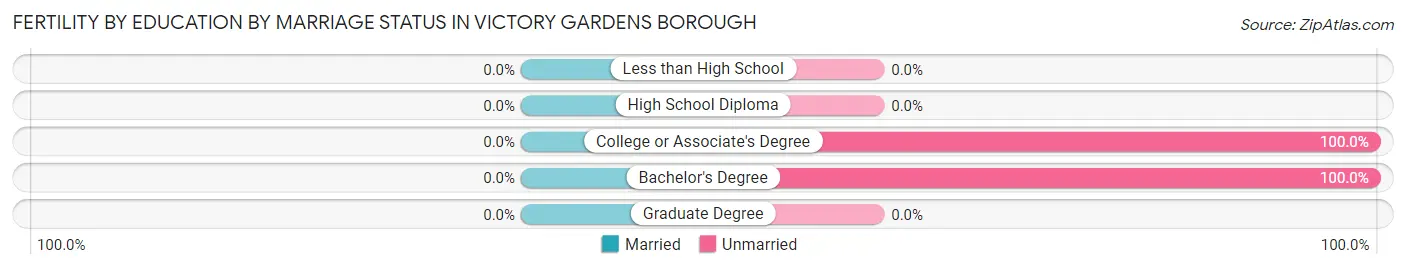
| Educational Attainment | Married | Unmarried |
| Less than High School | 0 (0.0%) | 0 (0.0%) |
| High School Diploma | 0 (0.0%) | 0 (0.0%) |
| College or Associate's Degree | 0 (0.0%) | 12 (100.0%) |
| Bachelor's Degree | 0 (0.0%) | 3 (100.0%) |
| Graduate Degree | 0 (0.0%) | 0 (0.0%) |
| Total | 0 (0.0%) | 15 (100.0%) |
Employment Characteristics in Victory Gardens borough
Employment by Class of Employer in Victory Gardens borough
Among the 933 employed individuals in Victory Gardens borough, private company employees (826 | 88.5%), self-employed (not incorporated) (45 | 4.8%), and local government employees (25 | 2.7%) make up the most common classes of employment.
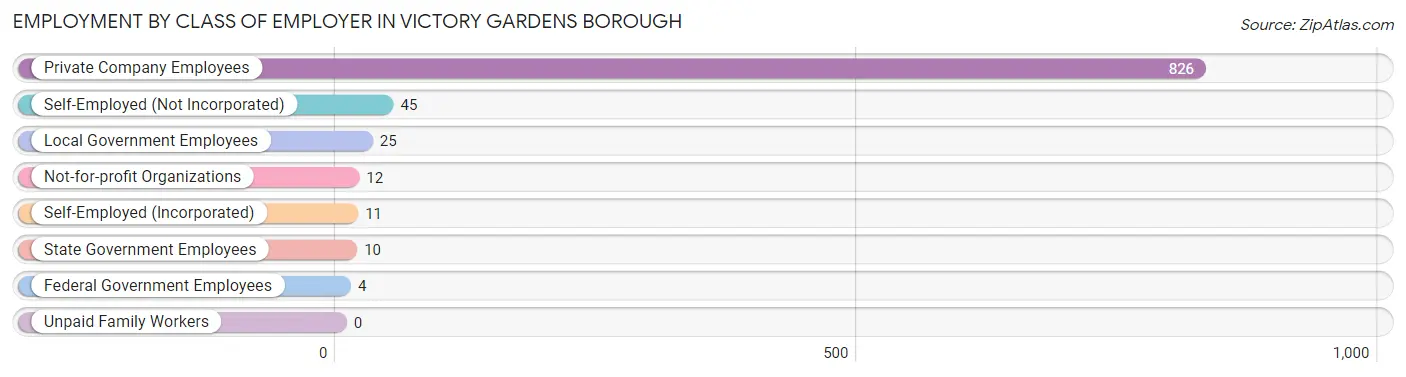
| Employer Class | # Employees | % Employees |
| Private Company Employees | 826 | 88.5% |
| Self-Employed (Incorporated) | 11 | 1.2% |
| Self-Employed (Not Incorporated) | 45 | 4.8% |
| Not-for-profit Organizations | 12 | 1.3% |
| Local Government Employees | 25 | 2.7% |
| State Government Employees | 10 | 1.1% |
| Federal Government Employees | 4 | 0.4% |
| Unpaid Family Workers | 0 | 0.0% |
| Total | 933 | 100.0% |
Employment Status by Age in Victory Gardens borough
According to the labor force statistics for Victory Gardens borough, out of the total population over 16 years of age (1,460), 72.4% or 1,057 individuals are in the labor force, with 8.2% or 87 of them unemployed. The age group with the highest labor force participation rate is 30 to 34 years, with 86.1% or 87 individuals in the labor force. Within the labor force, the 65 to 74 years age range has the highest percentage of unemployed individuals, with 41.0% or 16 of them being unemployed.
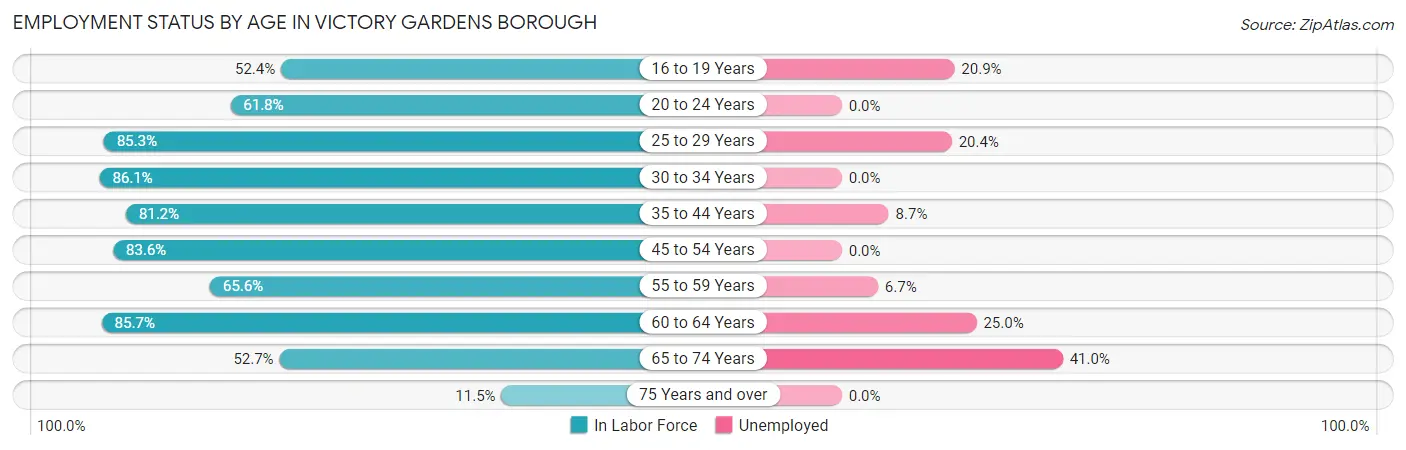
| Age Bracket | In Labor Force | Unemployed |
| 16 to 19 Years | 43 (52.4%) | 9 (20.9%) |
| 20 to 24 Years | 102 (61.8%) | 0 (0.0%) |
| 25 to 29 Years | 93 (85.3%) | 19 (20.4%) |
| 30 to 34 Years | 87 (86.1%) | 0 (0.0%) |
| 35 to 44 Years | 263 (81.2%) | 23 (8.7%) |
| 45 to 54 Years | 255 (83.6%) | 0 (0.0%) |
| 55 to 59 Years | 120 (65.6%) | 8 (6.7%) |
| 60 to 64 Years | 48 (85.7%) | 12 (25.0%) |
| 65 to 74 Years | 39 (52.7%) | 16 (41.0%) |
| 75 Years and over | 7 (11.5%) | 0 (0.0%) |
| Total | 1,057 (72.4%) | 87 (8.2%) |
Employment Status by Educational Attainment in Victory Gardens borough
According to labor force statistics for Victory Gardens borough, 80.3% of individuals (866) out of the total population between 25 and 64 years of age (1,078) are in the labor force, with 7.2% or 62 of them being unemployed. The group with the highest labor force participation rate are those with the educational attainment of college / associate degree, with 92.8% or 194 individuals in the labor force. Within the labor force, individuals with less than high school education have the highest percentage of unemployment, with 10.7% or 19 of them being unemployed.
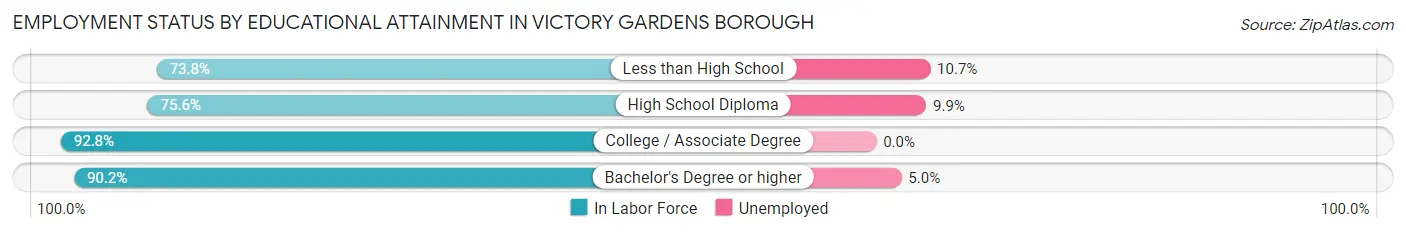
| Educational Attainment | In Labor Force | Unemployed |
| Less than High School | 177 (73.8%) | 26 (10.7%) |
| High School Diploma | 375 (75.6%) | 49 (9.9%) |
| College / Associate Degree | 194 (92.8%) | 0 (0.0%) |
| Bachelor's Degree or higher | 120 (90.2%) | 7 (5.0%) |
| Total | 866 (80.3%) | 78 (7.2%) |
Employment Occupations by Sex in Victory Gardens borough
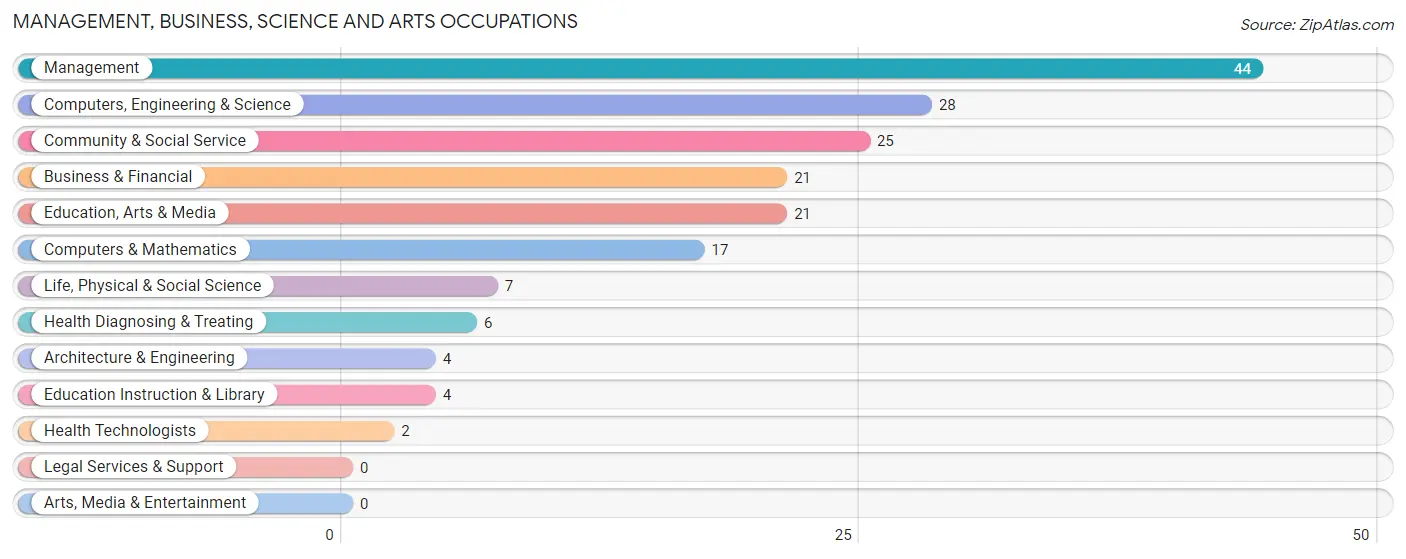
Management, Business, Science and Arts Occupations
The most common Management, Business, Science and Arts occupations in Victory Gardens borough are Management (44 | 4.5%), Computers, Engineering & Science (28 | 2.9%), Community & Social Service (25 | 2.6%), Business & Financial (21 | 2.2%), and Education, Arts & Media (21 | 2.2%).
Management, Business, Science and Arts Occupations by Sex
Within the Management, Business, Science and Arts occupations in Victory Gardens borough, the most male-oriented occupations are Computers & Mathematics (100.0%), Health Diagnosing & Treating (66.7%), and Computers, Engineering & Science (60.7%), while the most female-oriented occupations are Architecture & Engineering (100.0%), Life, Physical & Social Science (100.0%), and Education Instruction & Library (100.0%).
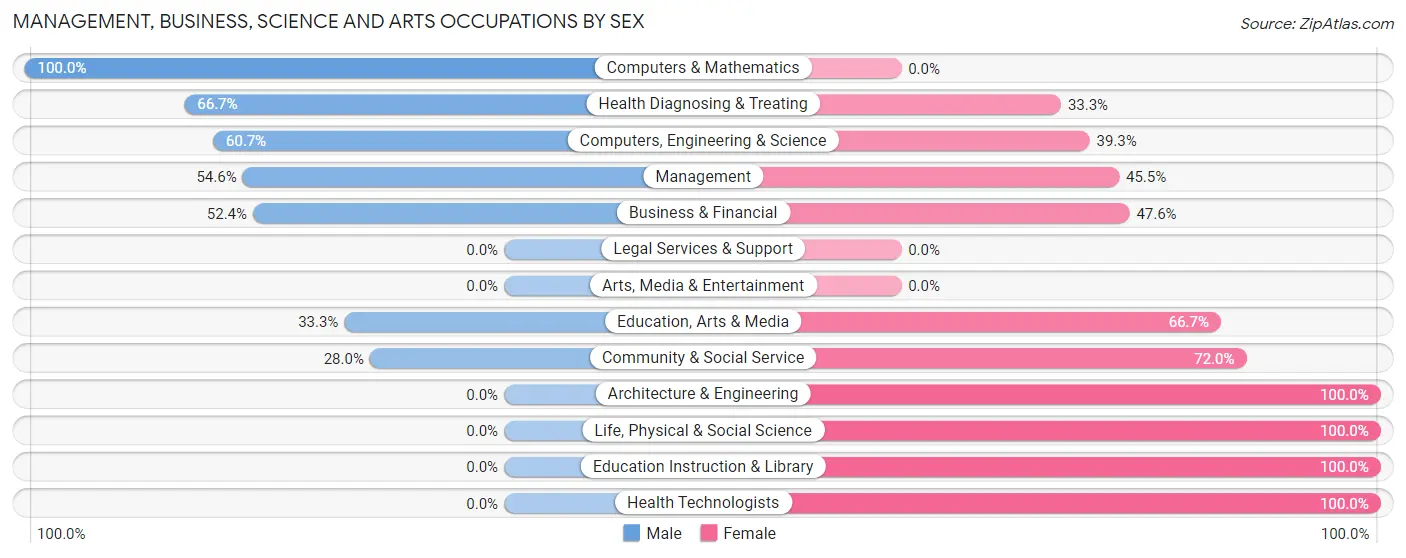
| Occupation | Male | Female |
| Management | 24 (54.5%) | 20 (45.5%) |
| Business & Financial | 11 (52.4%) | 10 (47.6%) |
| Computers, Engineering & Science | 17 (60.7%) | 11 (39.3%) |
| Computers & Mathematics | 17 (100.0%) | 0 (0.0%) |
| Architecture & Engineering | 0 (0.0%) | 4 (100.0%) |
| Life, Physical & Social Science | 0 (0.0%) | 7 (100.0%) |
| Community & Social Service | 7 (28.0%) | 18 (72.0%) |
| Education, Arts & Media | 7 (33.3%) | 14 (66.7%) |
| Legal Services & Support | 0 (0.0%) | 0 (0.0%) |
| Education Instruction & Library | 0 (0.0%) | 4 (100.0%) |
| Arts, Media & Entertainment | 0 (0.0%) | 0 (0.0%) |
| Health Diagnosing & Treating | 4 (66.7%) | 2 (33.3%) |
| Health Technologists | 0 (0.0%) | 2 (100.0%) |
| Total (Category) | 63 (50.8%) | 61 (49.2%) |
| Total (Overall) | 580 (59.8%) | 390 (40.2%) |
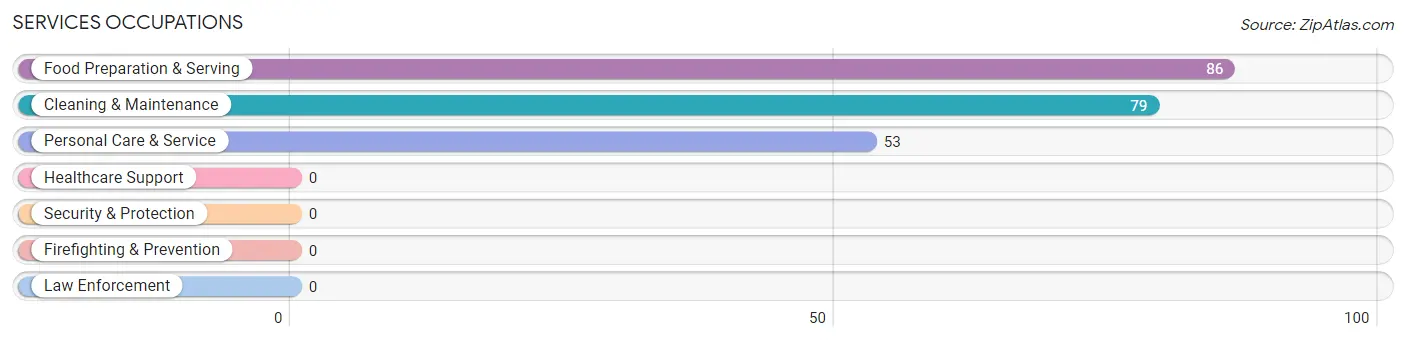
Services Occupations
The most common Services occupations in Victory Gardens borough are Food Preparation & Serving (86 | 8.9%), Cleaning & Maintenance (79 | 8.1%), and Personal Care & Service (53 | 5.5%).
Services Occupations by Sex
Within the Services occupations in Victory Gardens borough, the most male-oriented occupations are Cleaning & Maintenance (77.2%), Food Preparation & Serving (38.4%), and Personal Care & Service (9.4%), while the most female-oriented occupations are Personal Care & Service (90.6%), Food Preparation & Serving (61.6%), and Cleaning & Maintenance (22.8%).
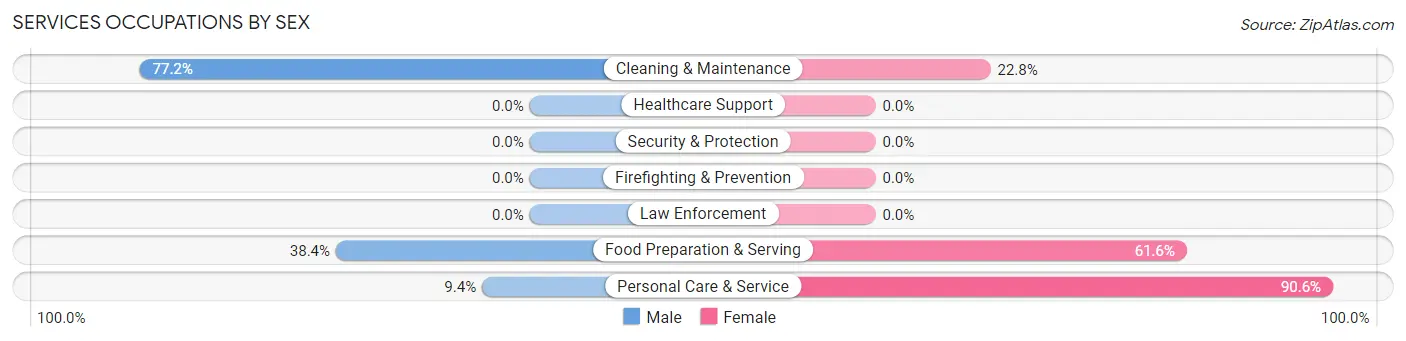
| Occupation | Male | Female |
| Healthcare Support | 0 (0.0%) | 0 (0.0%) |
| Security & Protection | 0 (0.0%) | 0 (0.0%) |
| Firefighting & Prevention | 0 (0.0%) | 0 (0.0%) |
| Law Enforcement | 0 (0.0%) | 0 (0.0%) |
| Food Preparation & Serving | 33 (38.4%) | 53 (61.6%) |
| Cleaning & Maintenance | 61 (77.2%) | 18 (22.8%) |
| Personal Care & Service | 5 (9.4%) | 48 (90.6%) |
| Total (Category) | 99 (45.4%) | 119 (54.6%) |
| Total (Overall) | 580 (59.8%) | 390 (40.2%) |
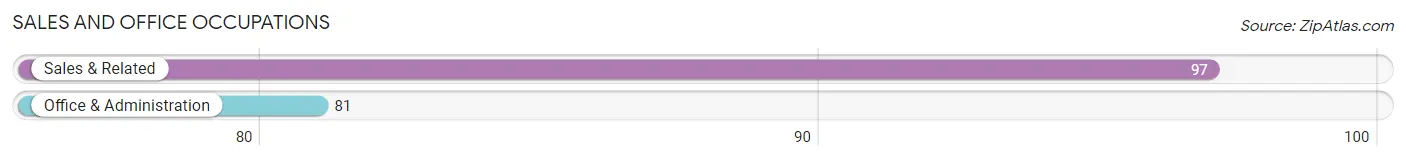
Sales and Office Occupations
The most common Sales and Office occupations in Victory Gardens borough are Sales & Related (97 | 10.0%), and Office & Administration (81 | 8.4%).
Sales and Office Occupations by Sex
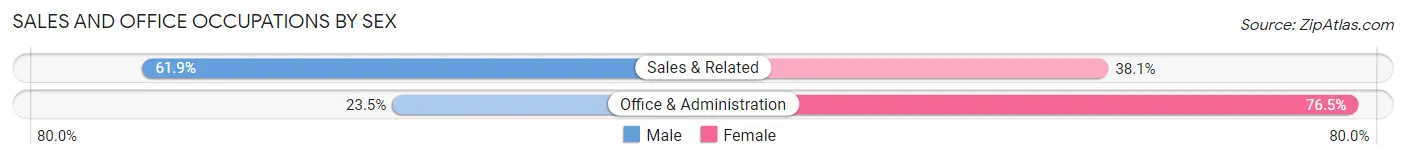
| Occupation | Male | Female |
| Sales & Related | 60 (61.9%) | 37 (38.1%) |
| Office & Administration | 19 (23.5%) | 62 (76.5%) |
| Total (Category) | 79 (44.4%) | 99 (55.6%) |
| Total (Overall) | 580 (59.8%) | 390 (40.2%) |
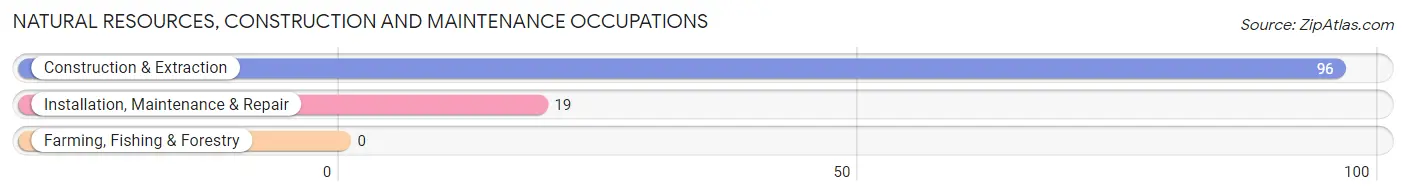
Natural Resources, Construction and Maintenance Occupations
The most common Natural Resources, Construction and Maintenance occupations in Victory Gardens borough are Construction & Extraction (96 | 9.9%), and Installation, Maintenance & Repair (19 | 2.0%).
Natural Resources, Construction and Maintenance Occupations by Sex
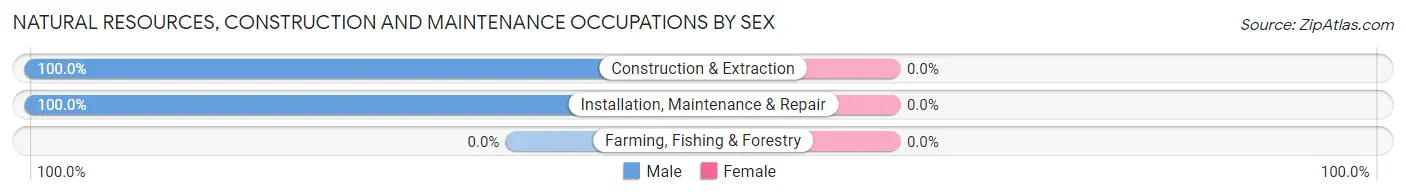
| Occupation | Male | Female |
| Farming, Fishing & Forestry | 0 (0.0%) | 0 (0.0%) |
| Construction & Extraction | 96 (100.0%) | 0 (0.0%) |
| Installation, Maintenance & Repair | 19 (100.0%) | 0 (0.0%) |
| Total (Category) | 115 (100.0%) | 0 (0.0%) |
| Total (Overall) | 580 (59.8%) | 390 (40.2%) |
Production, Transportation and Moving Occupations
The most common Production, Transportation and Moving occupations in Victory Gardens borough are Transportation (153 | 15.8%), Production (136 | 14.0%), and Material Moving (46 | 4.7%).
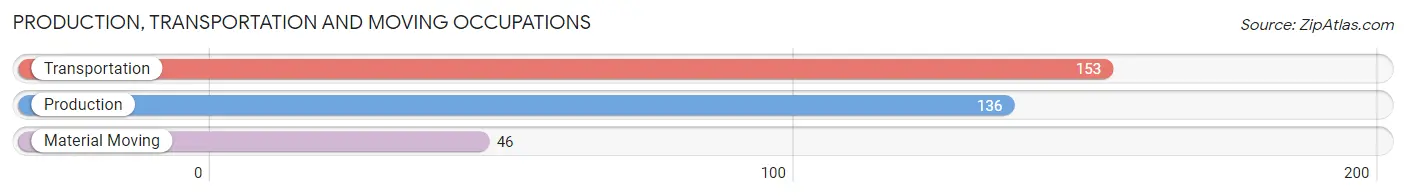
Production, Transportation and Moving Occupations by Sex
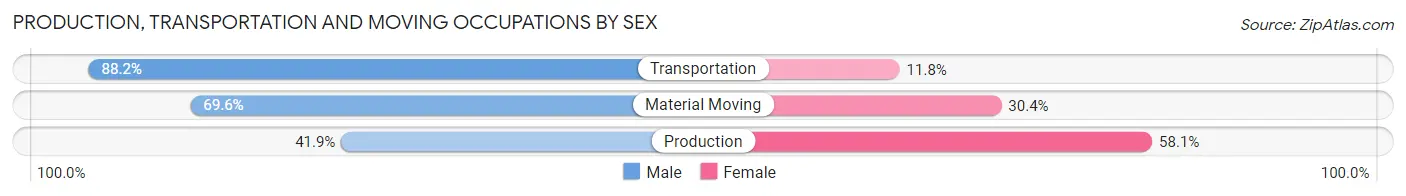
| Occupation | Male | Female |
| Production | 57 (41.9%) | 79 (58.1%) |
| Transportation | 135 (88.2%) | 18 (11.8%) |
| Material Moving | 32 (69.6%) | 14 (30.4%) |
| Total (Category) | 224 (66.9%) | 111 (33.1%) |
| Total (Overall) | 580 (59.8%) | 390 (40.2%) |
Employment Industries by Sex in Victory Gardens borough
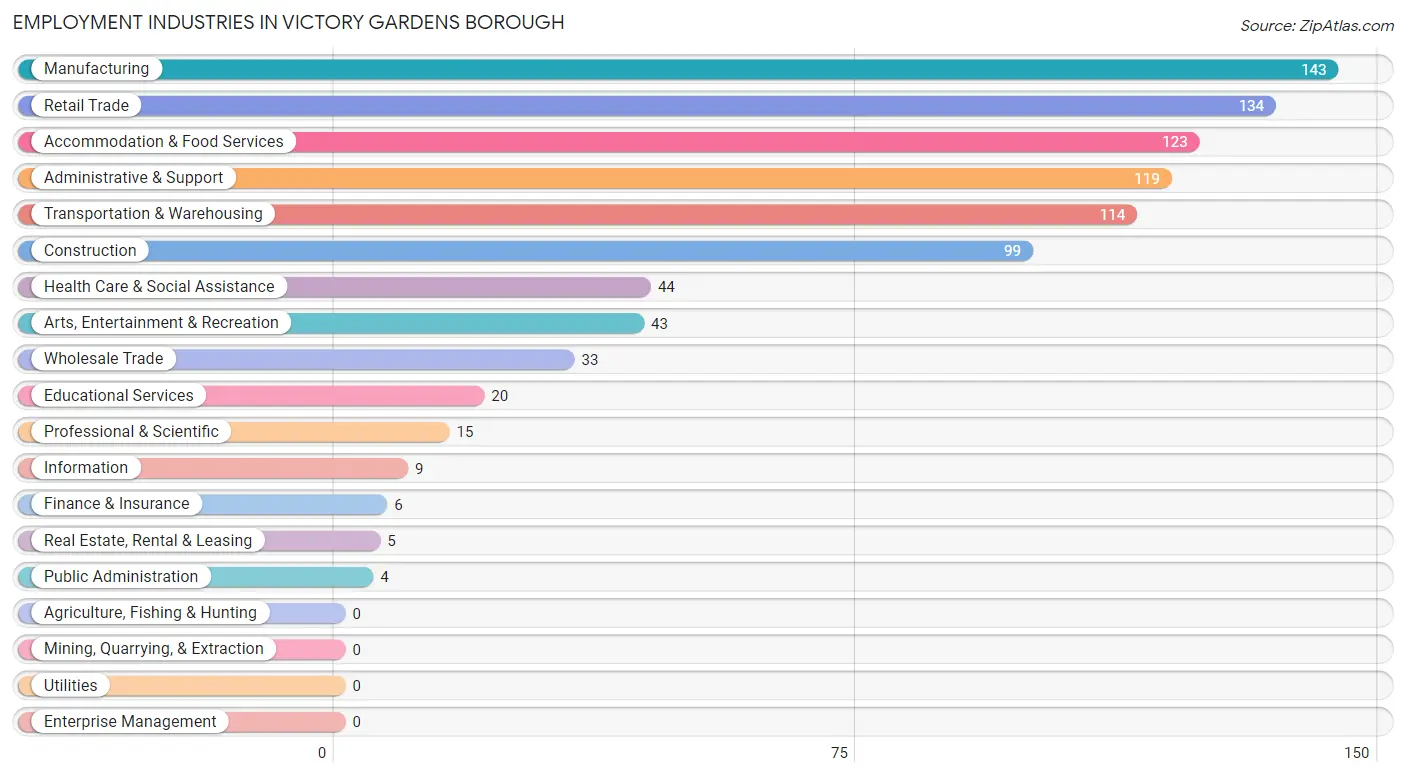
Employment Industries in Victory Gardens borough
The major employment industries in Victory Gardens borough include Manufacturing (143 | 14.7%), Retail Trade (134 | 13.8%), Accommodation & Food Services (123 | 12.7%), Administrative & Support (119 | 12.3%), and Transportation & Warehousing (114 | 11.7%).
Employment Industries by Sex in Victory Gardens borough
The Victory Gardens borough industries that see more men than women are Construction (100.0%), Wholesale Trade (100.0%), and Finance & Insurance (100.0%), whereas the industries that tend to have a higher number of women are Real Estate, Rental & Leasing (100.0%), Educational Services (100.0%), and Arts, Entertainment & Recreation (100.0%).
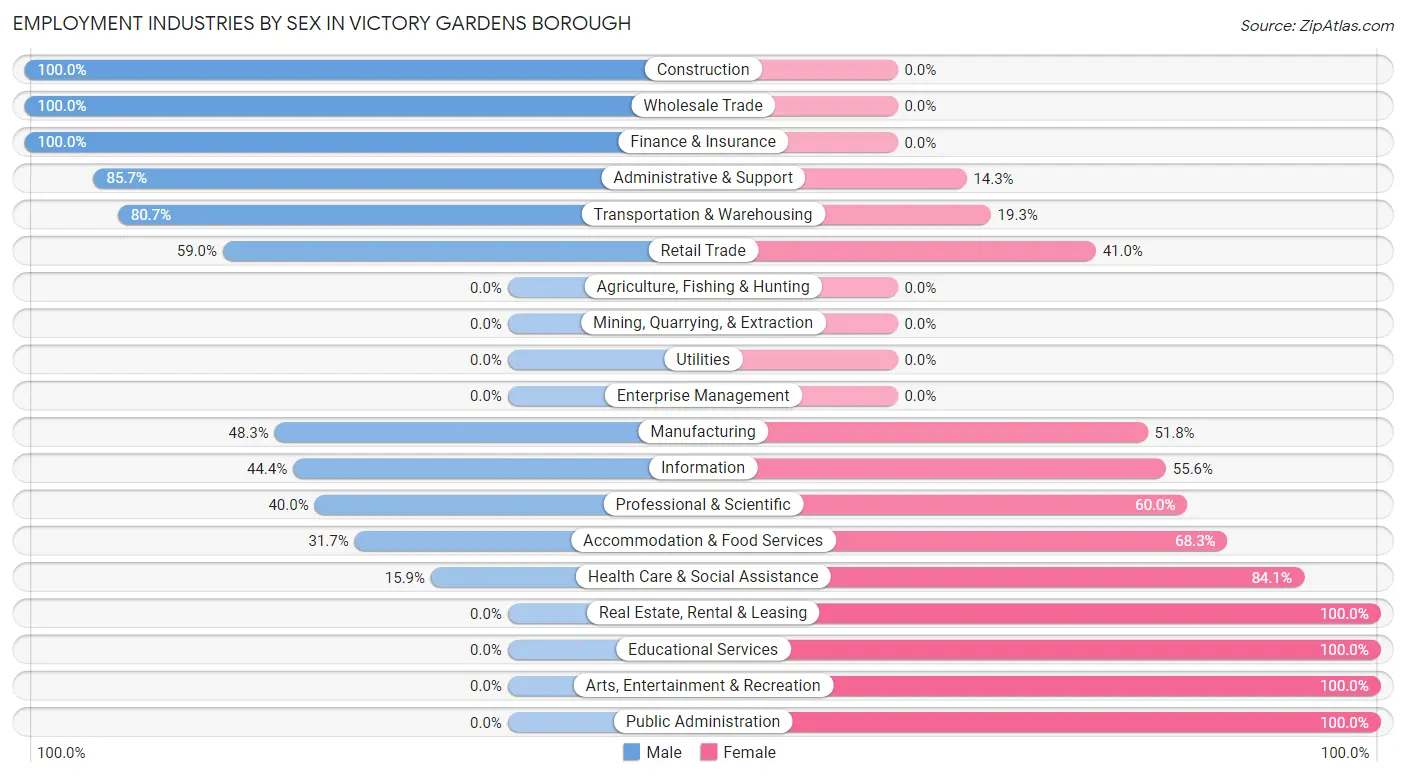
| Industry | Male | Female |
| Agriculture, Fishing & Hunting | 0 (0.0%) | 0 (0.0%) |
| Mining, Quarrying, & Extraction | 0 (0.0%) | 0 (0.0%) |
| Construction | 99 (100.0%) | 0 (0.0%) |
| Manufacturing | 69 (48.2%) | 74 (51.7%) |
| Wholesale Trade | 33 (100.0%) | 0 (0.0%) |
| Retail Trade | 79 (59.0%) | 55 (41.0%) |
| Transportation & Warehousing | 92 (80.7%) | 22 (19.3%) |
| Utilities | 0 (0.0%) | 0 (0.0%) |
| Information | 4 (44.4%) | 5 (55.6%) |
| Finance & Insurance | 6 (100.0%) | 0 (0.0%) |
| Real Estate, Rental & Leasing | 0 (0.0%) | 5 (100.0%) |
| Professional & Scientific | 6 (40.0%) | 9 (60.0%) |
| Enterprise Management | 0 (0.0%) | 0 (0.0%) |
| Administrative & Support | 102 (85.7%) | 17 (14.3%) |
| Educational Services | 0 (0.0%) | 20 (100.0%) |
| Health Care & Social Assistance | 7 (15.9%) | 37 (84.1%) |
| Arts, Entertainment & Recreation | 0 (0.0%) | 43 (100.0%) |
| Accommodation & Food Services | 39 (31.7%) | 84 (68.3%) |
| Public Administration | 0 (0.0%) | 4 (100.0%) |
| Total | 580 (59.8%) | 390 (40.2%) |
Education in Victory Gardens borough
School Enrollment in Victory Gardens borough
The most common levels of schooling among the 334 students in Victory Gardens borough are middle school (88 | 26.4%), high school (85 | 25.5%), and elementary school (72 | 21.6%).
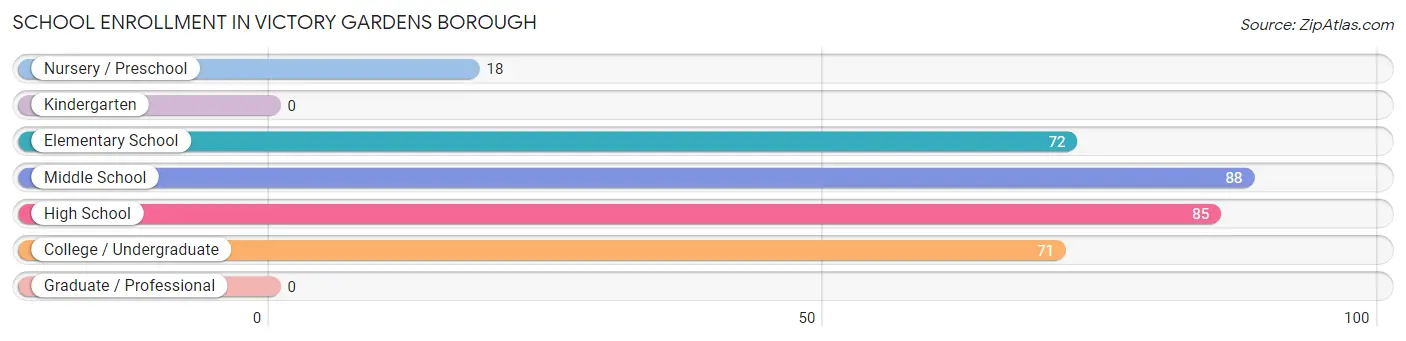
| School Level | # Students | % Students |
| Nursery / Preschool | 18 | 5.4% |
| Kindergarten | 0 | 0.0% |
| Elementary School | 72 | 21.6% |
| Middle School | 88 | 26.4% |
| High School | 85 | 25.5% |
| College / Undergraduate | 71 | 21.3% |
| Graduate / Professional | 0 | 0.0% |
| Total | 334 | 100.0% |
School Enrollment by Age by Funding Source in Victory Gardens borough
Out of a total of 334 students who are enrolled in schools in Victory Gardens borough, 30 (9.0%) attend a private institution, while the remaining 304 (91.0%) are enrolled in public schools. The age group of 18 to 19 year olds has the highest likelihood of being enrolled in private schools, with 14 (35.9% in the age bracket) enrolled. Conversely, the age group of 5 to 9 year old has the lowest likelihood of being enrolled in a private school, with 72 (100.0% in the age bracket) attending a public institution.
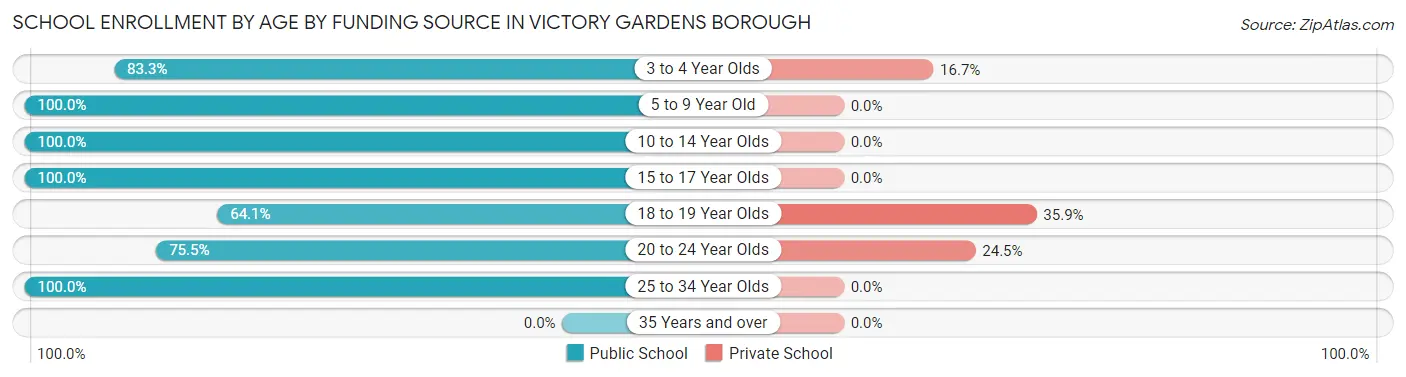
| Age Bracket | Public School | Private School |
| 3 to 4 Year Olds | 15 (83.3%) | 3 (16.7%) |
| 5 to 9 Year Old | 72 (100.0%) | 0 (0.0%) |
| 10 to 14 Year Olds | 79 (100.0%) | 0 (0.0%) |
| 15 to 17 Year Olds | 69 (100.0%) | 0 (0.0%) |
| 18 to 19 Year Olds | 25 (64.1%) | 14 (35.9%) |
| 20 to 24 Year Olds | 40 (75.5%) | 13 (24.5%) |
| 25 to 34 Year Olds | 4 (100.0%) | 0 (0.0%) |
| 35 Years and over | 0 (0.0%) | 0 (0.0%) |
| Total | 304 (91.0%) | 30 (9.0%) |
Educational Attainment by Field of Study in Victory Gardens borough
Psychology (46 | 31.7%), business (30 | 20.7%), education (17 | 11.7%), engineering (11 | 7.6%), and multidisciplinary studies (10 | 6.9%) are the most common fields of study among 145 individuals in Victory Gardens borough who have obtained a bachelor's degree or higher.
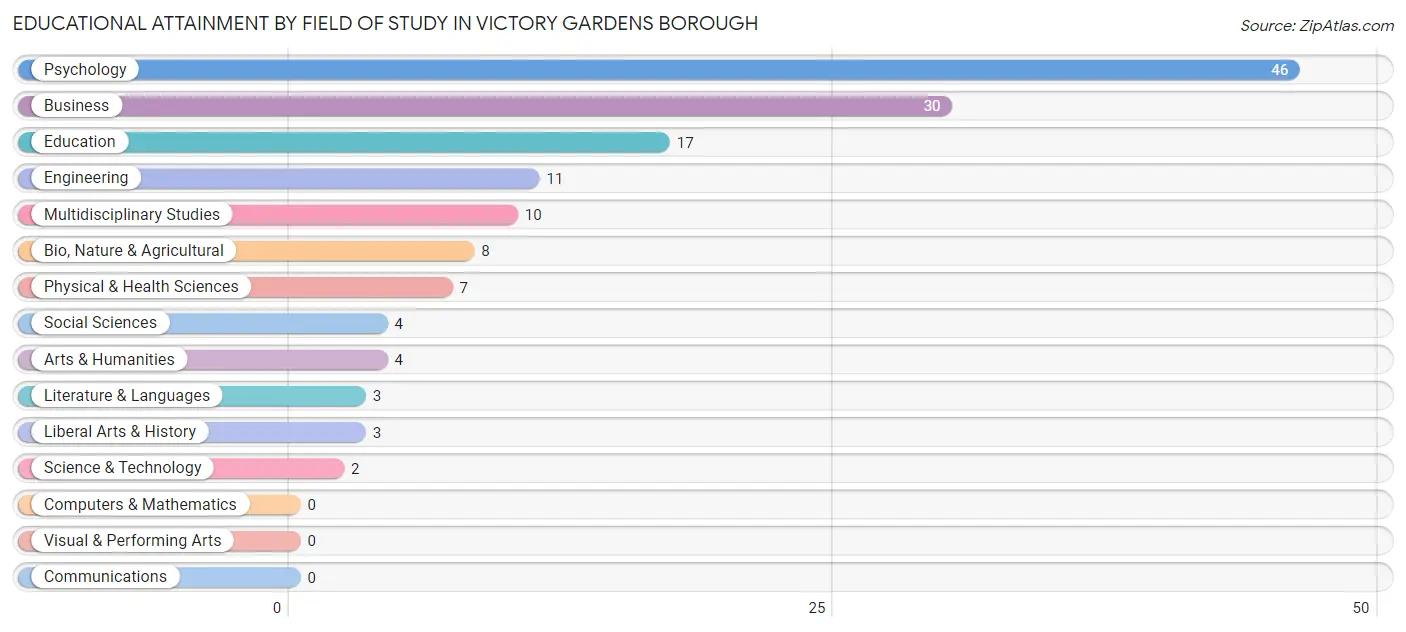
| Field of Study | # Graduates | % Graduates |
| Computers & Mathematics | 0 | 0.0% |
| Bio, Nature & Agricultural | 8 | 5.5% |
| Physical & Health Sciences | 7 | 4.8% |
| Psychology | 46 | 31.7% |
| Social Sciences | 4 | 2.8% |
| Engineering | 11 | 7.6% |
| Multidisciplinary Studies | 10 | 6.9% |
| Science & Technology | 2 | 1.4% |
| Business | 30 | 20.7% |
| Education | 17 | 11.7% |
| Literature & Languages | 3 | 2.1% |
| Liberal Arts & History | 3 | 2.1% |
| Visual & Performing Arts | 0 | 0.0% |
| Communications | 0 | 0.0% |
| Arts & Humanities | 4 | 2.8% |
| Total | 145 | 100.0% |
Transportation & Commute in Victory Gardens borough
Vehicle Availability by Sex in Victory Gardens borough
The most prevalent vehicle ownership categories in Victory Gardens borough are males with 1 vehicle (229, accounting for 40.5%) and females with 1 vehicle (142, making up 62.4%).
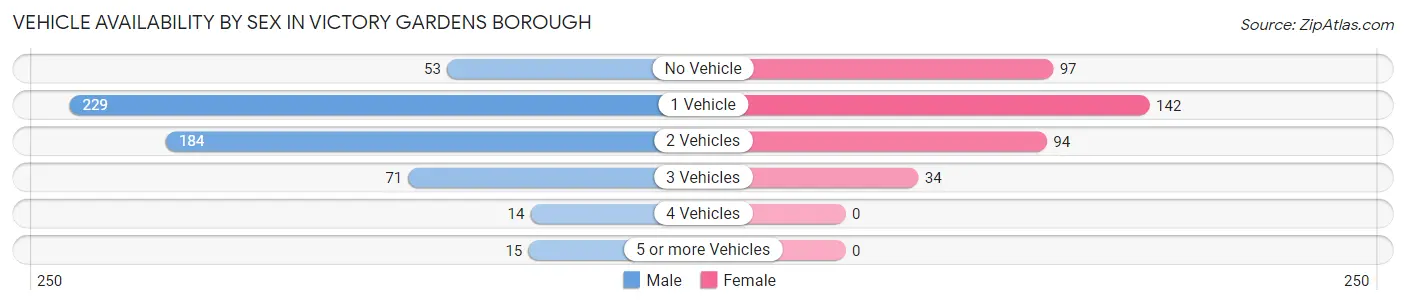
| Vehicles Available | Male | Female |
| No Vehicle | 53 (9.4%) | 97 (26.4%) |
| 1 Vehicle | 229 (40.5%) | 142 (38.7%) |
| 2 Vehicles | 184 (32.5%) | 94 (25.6%) |
| 3 Vehicles | 71 (12.5%) | 34 (9.3%) |
| 4 Vehicles | 14 (2.5%) | 0 (0.0%) |
| 5 or more Vehicles | 15 (2.6%) | 0 (0.0%) |
| Total | 566 (100.0%) | 367 (100.0%) |
Commute Time in Victory Gardens borough
The most frequently occuring commute durations in Victory Gardens borough are 15 to 19 minutes (221 commuters, 24.8%), 20 to 24 minutes (126 commuters, 14.1%), and 5 to 9 minutes (118 commuters, 13.2%).
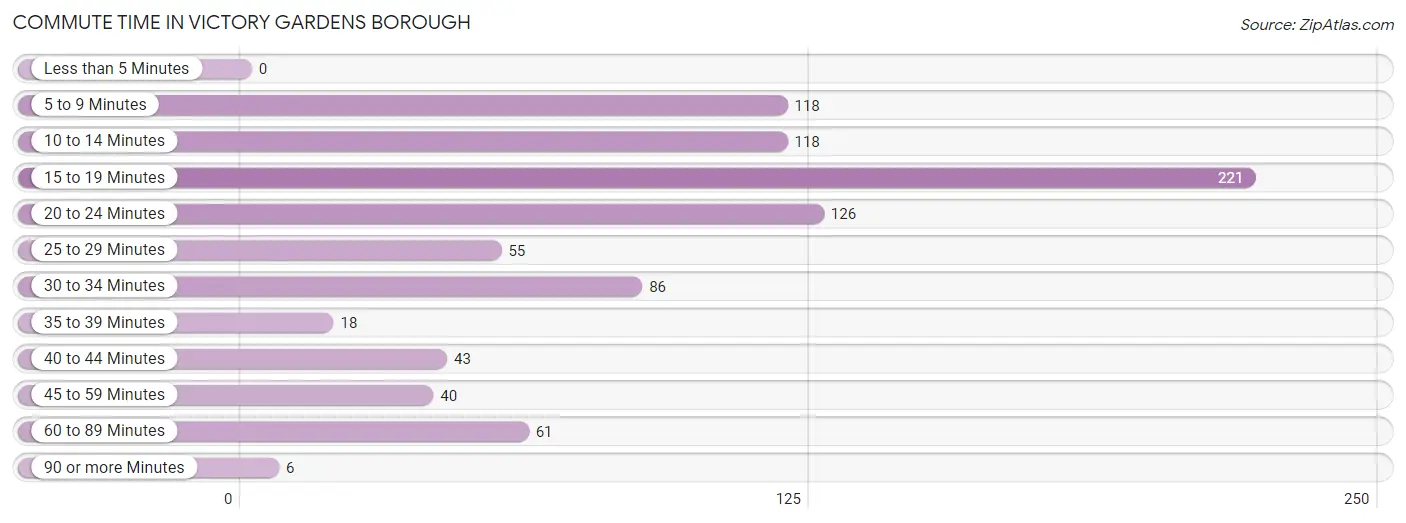
| Commute Time | # Commuters | % Commuters |
| Less than 5 Minutes | 0 | 0.0% |
| 5 to 9 Minutes | 118 | 13.2% |
| 10 to 14 Minutes | 118 | 13.2% |
| 15 to 19 Minutes | 221 | 24.8% |
| 20 to 24 Minutes | 126 | 14.1% |
| 25 to 29 Minutes | 55 | 6.2% |
| 30 to 34 Minutes | 86 | 9.6% |
| 35 to 39 Minutes | 18 | 2.0% |
| 40 to 44 Minutes | 43 | 4.8% |
| 45 to 59 Minutes | 40 | 4.5% |
| 60 to 89 Minutes | 61 | 6.8% |
| 90 or more Minutes | 6 | 0.7% |
Commute Time by Sex in Victory Gardens borough
The most common commute times in Victory Gardens borough are 30 to 34 minutes (74 commuters, 13.7%) for males and 15 to 19 minutes (154 commuters, 43.6%) for females.
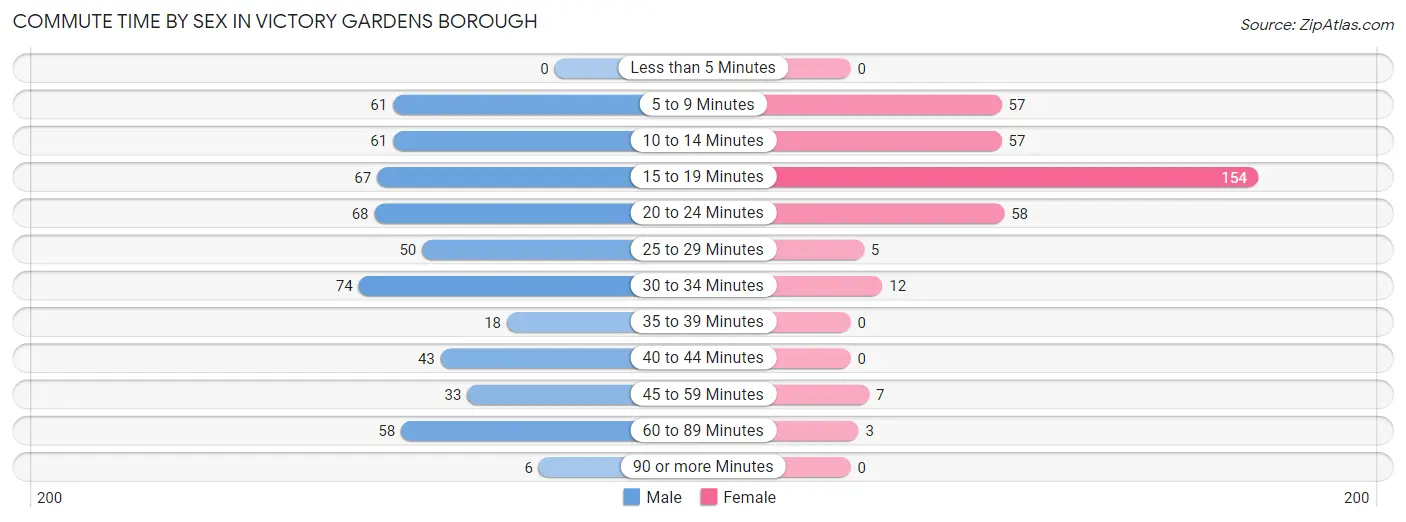
| Commute Time | Male | Female |
| Less than 5 Minutes | 0 (0.0%) | 0 (0.0%) |
| 5 to 9 Minutes | 61 (11.3%) | 57 (16.2%) |
| 10 to 14 Minutes | 61 (11.3%) | 57 (16.2%) |
| 15 to 19 Minutes | 67 (12.4%) | 154 (43.6%) |
| 20 to 24 Minutes | 68 (12.6%) | 58 (16.4%) |
| 25 to 29 Minutes | 50 (9.3%) | 5 (1.4%) |
| 30 to 34 Minutes | 74 (13.7%) | 12 (3.4%) |
| 35 to 39 Minutes | 18 (3.3%) | 0 (0.0%) |
| 40 to 44 Minutes | 43 (8.0%) | 0 (0.0%) |
| 45 to 59 Minutes | 33 (6.1%) | 7 (2.0%) |
| 60 to 89 Minutes | 58 (10.8%) | 3 (0.9%) |
| 90 or more Minutes | 6 (1.1%) | 0 (0.0%) |
Time of Departure to Work by Sex in Victory Gardens borough
The most frequent times of departure to work in Victory Gardens borough are 5:30 AM to 5:59 AM (96, 17.8%) for males and 4:00 PM to 11:59 PM (63, 17.8%) for females.
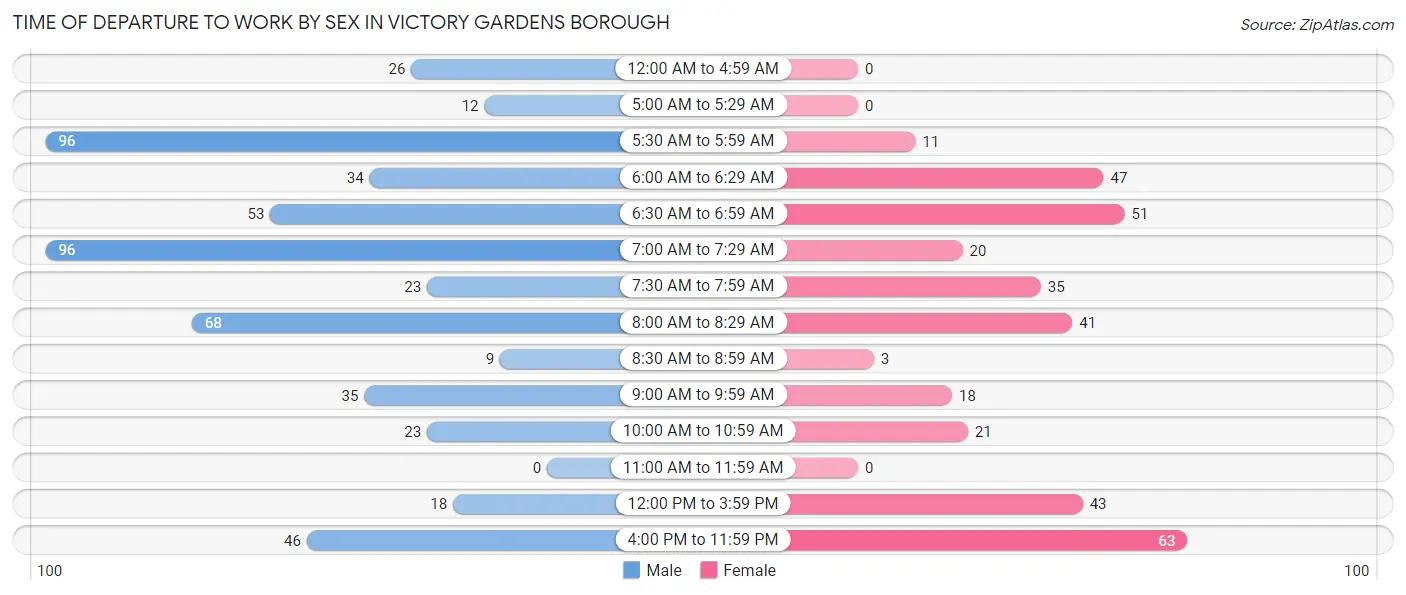
| Time of Departure | Male | Female |
| 12:00 AM to 4:59 AM | 26 (4.8%) | 0 (0.0%) |
| 5:00 AM to 5:29 AM | 12 (2.2%) | 0 (0.0%) |
| 5:30 AM to 5:59 AM | 96 (17.8%) | 11 (3.1%) |
| 6:00 AM to 6:29 AM | 34 (6.3%) | 47 (13.3%) |
| 6:30 AM to 6:59 AM | 53 (9.8%) | 51 (14.4%) |
| 7:00 AM to 7:29 AM | 96 (17.8%) | 20 (5.7%) |
| 7:30 AM to 7:59 AM | 23 (4.3%) | 35 (9.9%) |
| 8:00 AM to 8:29 AM | 68 (12.6%) | 41 (11.6%) |
| 8:30 AM to 8:59 AM | 9 (1.7%) | 3 (0.9%) |
| 9:00 AM to 9:59 AM | 35 (6.5%) | 18 (5.1%) |
| 10:00 AM to 10:59 AM | 23 (4.3%) | 21 (5.9%) |
| 11:00 AM to 11:59 AM | 0 (0.0%) | 0 (0.0%) |
| 12:00 PM to 3:59 PM | 18 (3.3%) | 43 (12.2%) |
| 4:00 PM to 11:59 PM | 46 (8.5%) | 63 (17.8%) |
| Total | 539 (100.0%) | 353 (100.0%) |
Housing Occupancy in Victory Gardens borough
Occupancy by Ownership in Victory Gardens borough
Of the total 670 dwellings in Victory Gardens borough, owner-occupied units account for 233 (34.8%), while renter-occupied units make up 437 (65.2%).
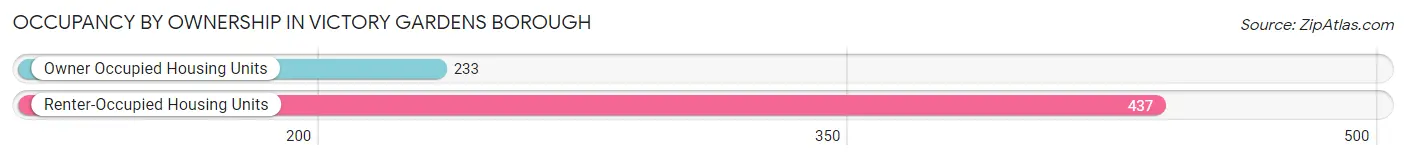
| Occupancy | # Housing Units | % Housing Units |
| Owner Occupied Housing Units | 233 | 34.8% |
| Renter-Occupied Housing Units | 437 | 65.2% |
| Total Occupied Housing Units | 670 | 100.0% |
Occupancy by Household Size in Victory Gardens borough
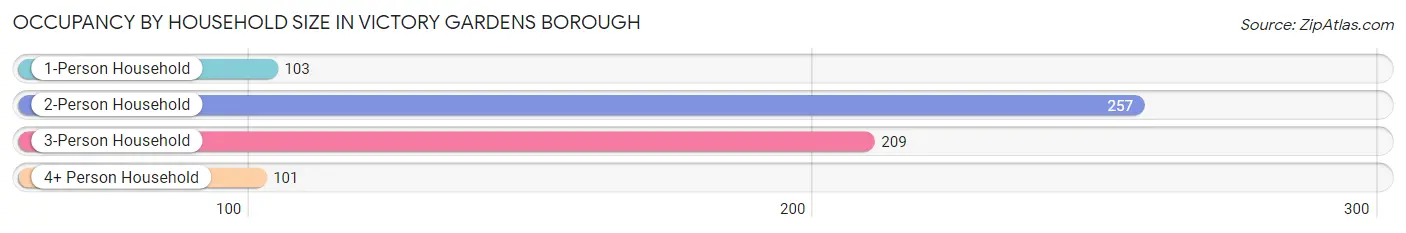
| Household Size | # Housing Units | % Housing Units |
| 1-Person Household | 103 | 15.4% |
| 2-Person Household | 257 | 38.4% |
| 3-Person Household | 209 | 31.2% |
| 4+ Person Household | 101 | 15.1% |
| Total Housing Units | 670 | 100.0% |
Occupancy by Ownership by Household Size in Victory Gardens borough
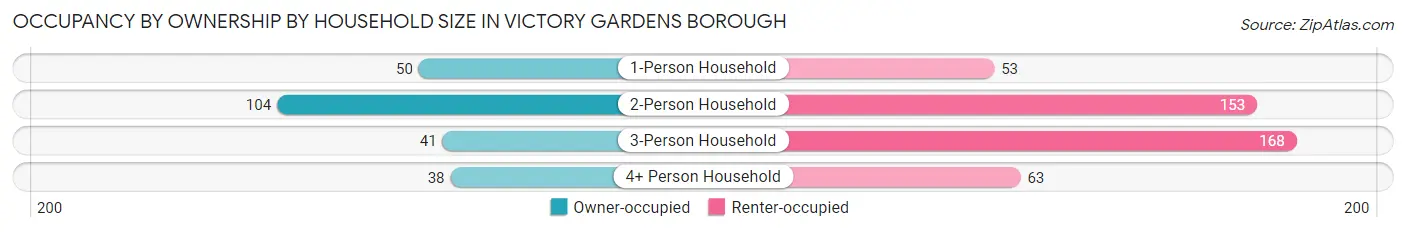
| Household Size | Owner-occupied | Renter-occupied |
| 1-Person Household | 50 (48.5%) | 53 (51.5%) |
| 2-Person Household | 104 (40.5%) | 153 (59.5%) |
| 3-Person Household | 41 (19.6%) | 168 (80.4%) |
| 4+ Person Household | 38 (37.6%) | 63 (62.4%) |
| Total Housing Units | 233 (34.8%) | 437 (65.2%) |
Occupancy by Educational Attainment in Victory Gardens borough
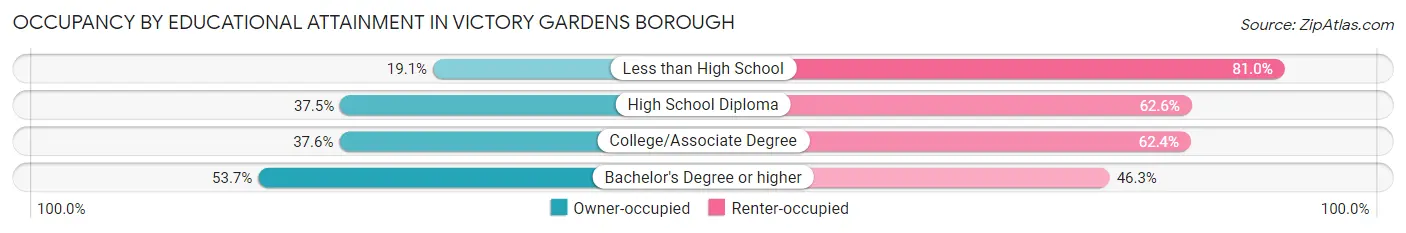
| Household Size | Owner-occupied | Renter-occupied |
| Less than High School | 28 (19.1%) | 119 (80.9%) |
| High School Diploma | 97 (37.4%) | 162 (62.5%) |
| College/Associate Degree | 79 (37.6%) | 131 (62.4%) |
| Bachelor's Degree or higher | 29 (53.7%) | 25 (46.3%) |
Occupancy by Age of Householder in Victory Gardens borough
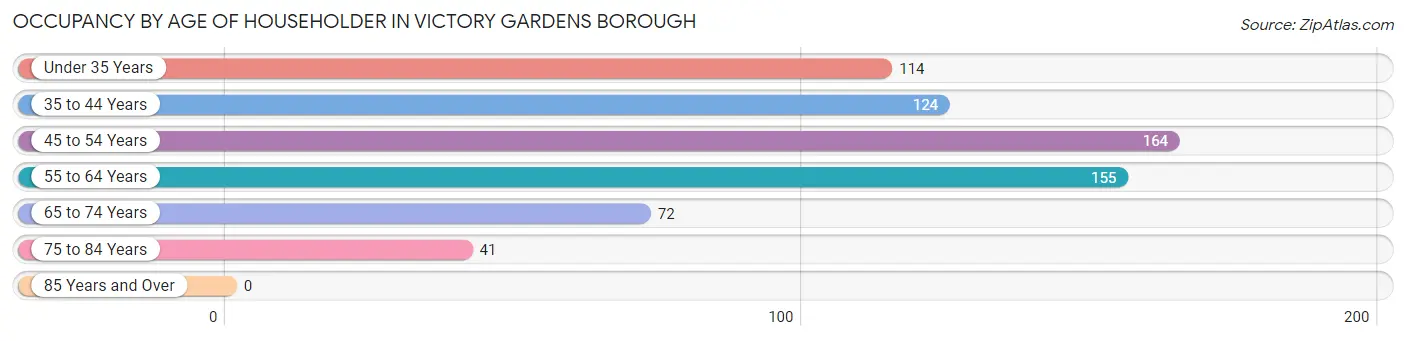
| Age Bracket | # Households | % Households |
| Under 35 Years | 114 | 17.0% |
| 35 to 44 Years | 124 | 18.5% |
| 45 to 54 Years | 164 | 24.5% |
| 55 to 64 Years | 155 | 23.1% |
| 65 to 74 Years | 72 | 10.7% |
| 75 to 84 Years | 41 | 6.1% |
| 85 Years and Over | 0 | 0.0% |
| Total | 670 | 100.0% |
Housing Finances in Victory Gardens borough
Median Income by Occupancy in Victory Gardens borough
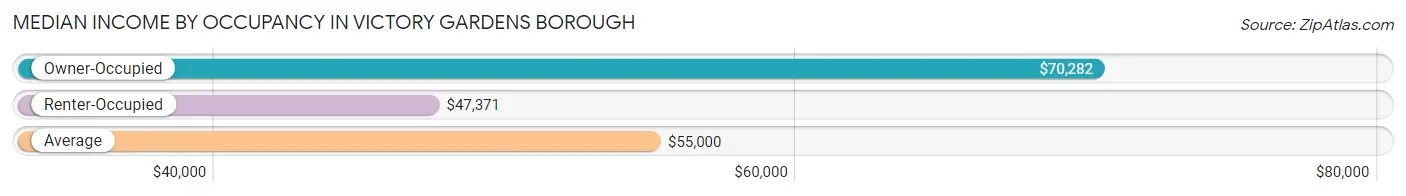
| Occupancy Type | # Households | Median Income |
| Owner-Occupied | 233 (34.8%) | $70,282 |
| Renter-Occupied | 437 (65.2%) | $47,371 |
| Average | 670 (100.0%) | $55,000 |
Occupancy by Householder Income Bracket in Victory Gardens borough
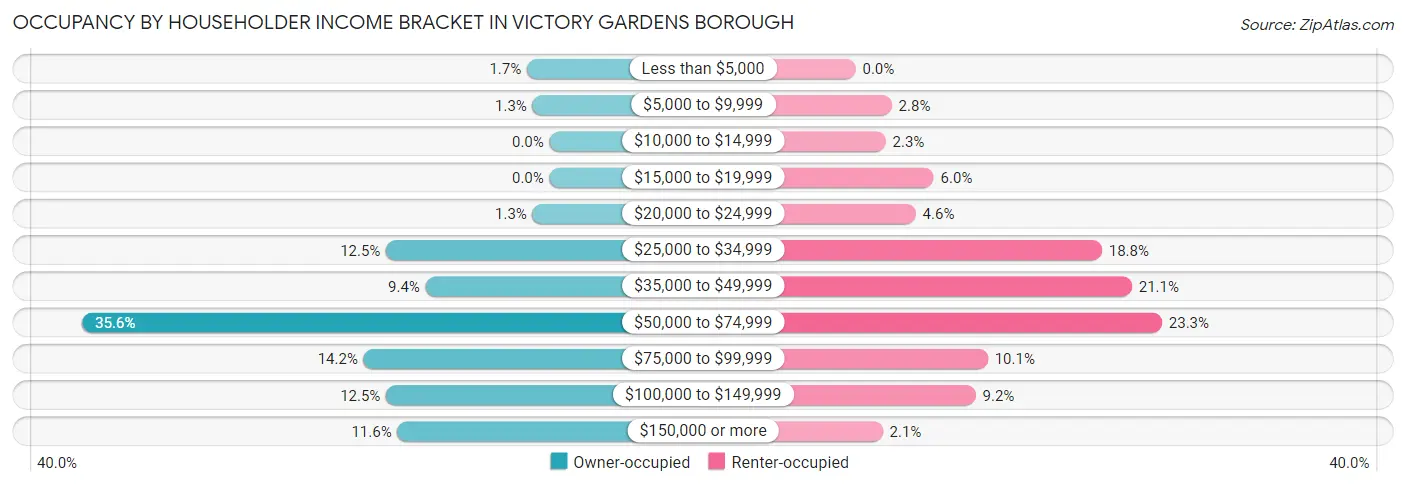
| Income Bracket | Owner-occupied | Renter-occupied |
| Less than $5,000 | 4 (1.7%) | 0 (0.0%) |
| $5,000 to $9,999 | 3 (1.3%) | 12 (2.8%) |
| $10,000 to $14,999 | 0 (0.0%) | 10 (2.3%) |
| $15,000 to $19,999 | 0 (0.0%) | 26 (5.9%) |
| $20,000 to $24,999 | 3 (1.3%) | 20 (4.6%) |
| $25,000 to $34,999 | 29 (12.4%) | 82 (18.8%) |
| $35,000 to $49,999 | 22 (9.4%) | 92 (21.0%) |
| $50,000 to $74,999 | 83 (35.6%) | 102 (23.3%) |
| $75,000 to $99,999 | 33 (14.2%) | 44 (10.1%) |
| $100,000 to $149,999 | 29 (12.4%) | 40 (9.1%) |
| $150,000 or more | 27 (11.6%) | 9 (2.1%) |
| Total | 233 (100.0%) | 437 (100.0%) |
Monthly Housing Cost Tiers in Victory Gardens borough
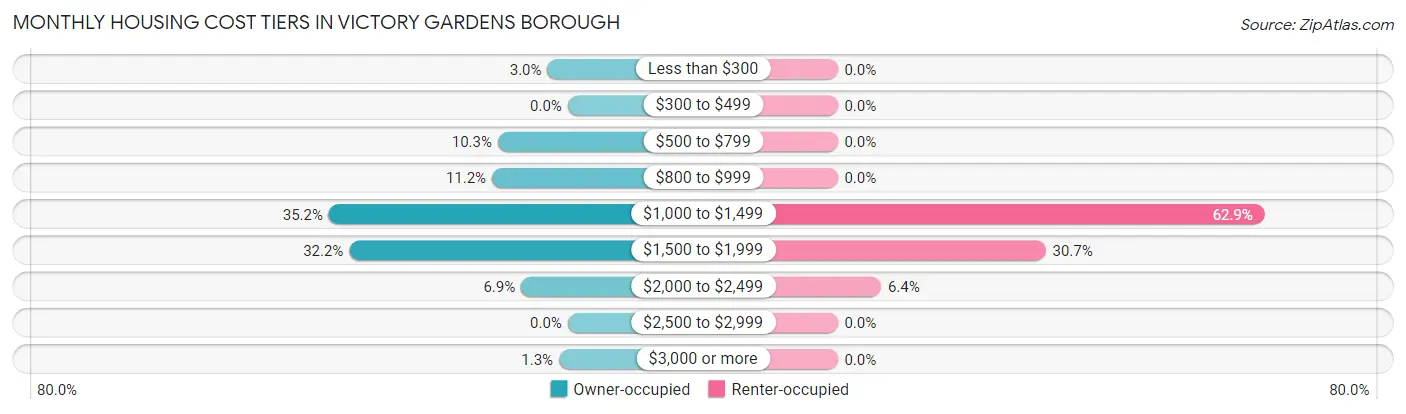
| Monthly Cost | Owner-occupied | Renter-occupied |
| Less than $300 | 7 (3.0%) | 0 (0.0%) |
| $300 to $499 | 0 (0.0%) | 0 (0.0%) |
| $500 to $799 | 24 (10.3%) | 0 (0.0%) |
| $800 to $999 | 26 (11.2%) | 0 (0.0%) |
| $1,000 to $1,499 | 82 (35.2%) | 275 (62.9%) |
| $1,500 to $1,999 | 75 (32.2%) | 134 (30.7%) |
| $2,000 to $2,499 | 16 (6.9%) | 28 (6.4%) |
| $2,500 to $2,999 | 0 (0.0%) | 0 (0.0%) |
| $3,000 or more | 3 (1.3%) | 0 (0.0%) |
| Total | 233 (100.0%) | 437 (100.0%) |
Physical Housing Characteristics in Victory Gardens borough
Housing Structures in Victory Gardens borough
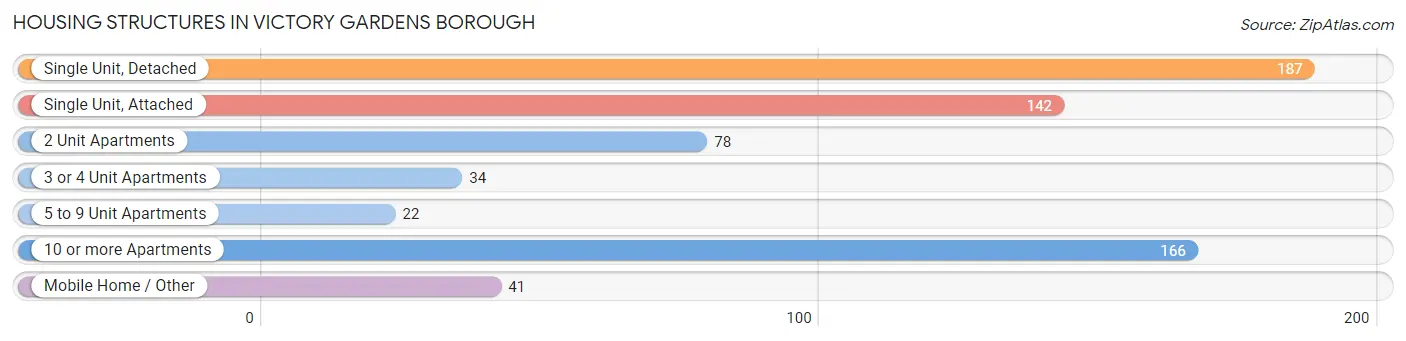
| Structure Type | # Housing Units | % Housing Units |
| Single Unit, Detached | 187 | 27.9% |
| Single Unit, Attached | 142 | 21.2% |
| 2 Unit Apartments | 78 | 11.6% |
| 3 or 4 Unit Apartments | 34 | 5.1% |
| 5 to 9 Unit Apartments | 22 | 3.3% |
| 10 or more Apartments | 166 | 24.8% |
| Mobile Home / Other | 41 | 6.1% |
| Total | 670 | 100.0% |
Housing Structures by Occupancy in Victory Gardens borough
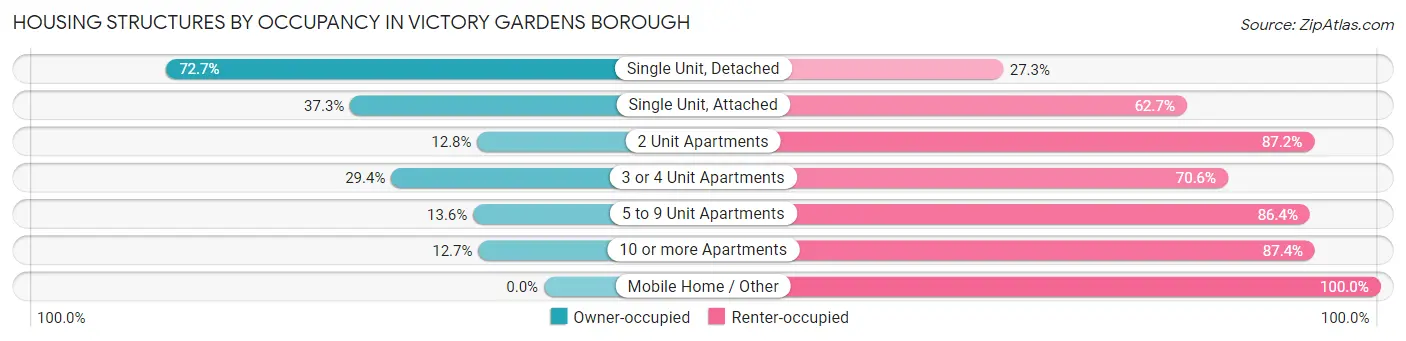
| Structure Type | Owner-occupied | Renter-occupied |
| Single Unit, Detached | 136 (72.7%) | 51 (27.3%) |
| Single Unit, Attached | 53 (37.3%) | 89 (62.7%) |
| 2 Unit Apartments | 10 (12.8%) | 68 (87.2%) |
| 3 or 4 Unit Apartments | 10 (29.4%) | 24 (70.6%) |
| 5 to 9 Unit Apartments | 3 (13.6%) | 19 (86.4%) |
| 10 or more Apartments | 21 (12.7%) | 145 (87.4%) |
| Mobile Home / Other | 0 (0.0%) | 41 (100.0%) |
| Total | 233 (34.8%) | 437 (65.2%) |
Housing Structures by Number of Rooms in Victory Gardens borough
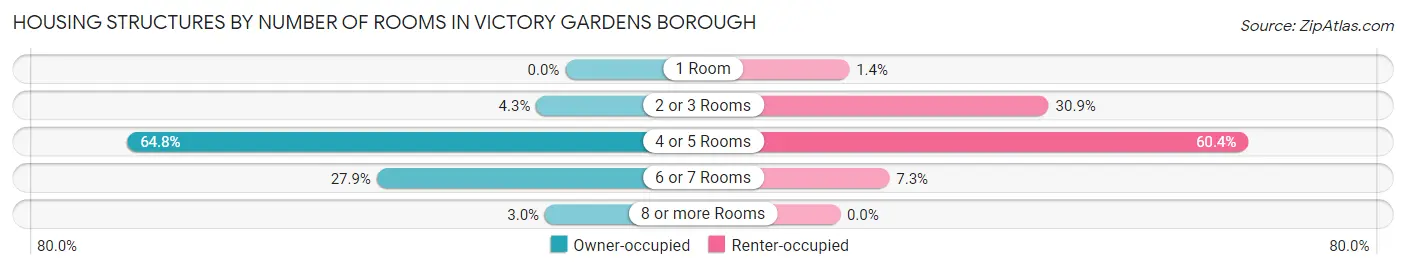
| Number of Rooms | Owner-occupied | Renter-occupied |
| 1 Room | 0 (0.0%) | 6 (1.4%) |
| 2 or 3 Rooms | 10 (4.3%) | 135 (30.9%) |
| 4 or 5 Rooms | 151 (64.8%) | 264 (60.4%) |
| 6 or 7 Rooms | 65 (27.9%) | 32 (7.3%) |
| 8 or more Rooms | 7 (3.0%) | 0 (0.0%) |
| Total | 233 (100.0%) | 437 (100.0%) |
Housing Structure by Heating Type in Victory Gardens borough
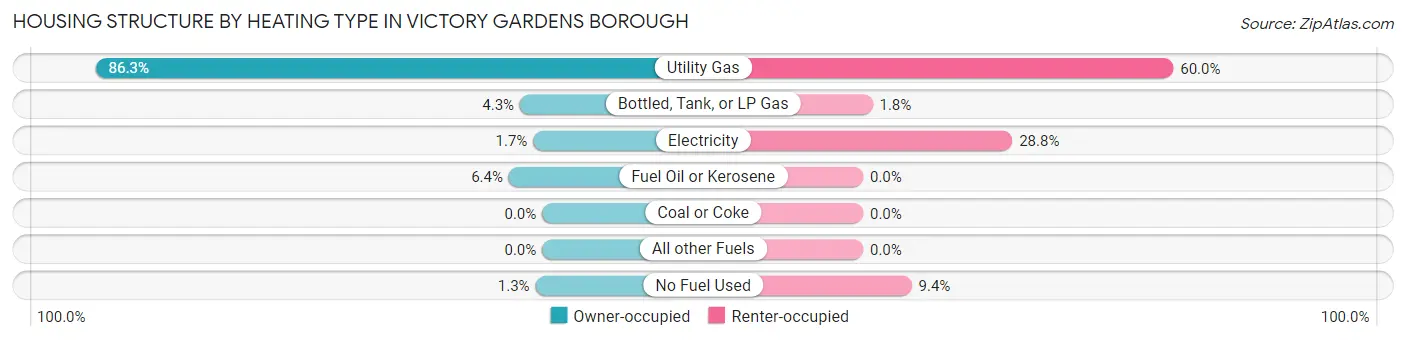
| Heating Type | Owner-occupied | Renter-occupied |
| Utility Gas | 201 (86.3%) | 262 (60.0%) |
| Bottled, Tank, or LP Gas | 10 (4.3%) | 8 (1.8%) |
| Electricity | 4 (1.7%) | 126 (28.8%) |
| Fuel Oil or Kerosene | 15 (6.4%) | 0 (0.0%) |
| Coal or Coke | 0 (0.0%) | 0 (0.0%) |
| All other Fuels | 0 (0.0%) | 0 (0.0%) |
| No Fuel Used | 3 (1.3%) | 41 (9.4%) |
| Total | 233 (100.0%) | 437 (100.0%) |
Household Vehicle Usage in Victory Gardens borough
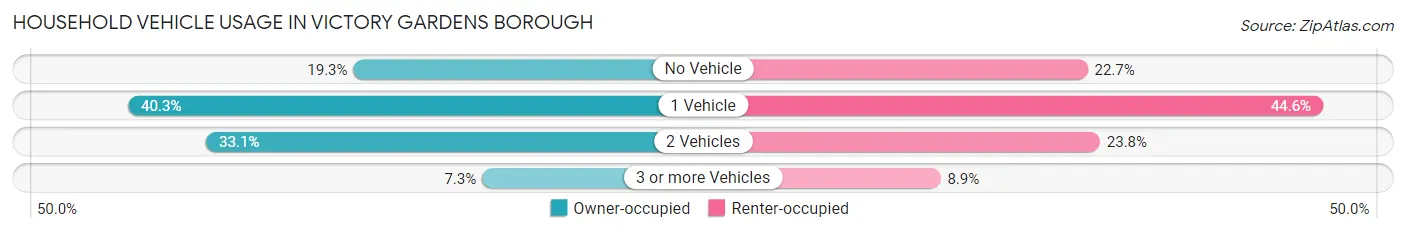
| Vehicles per Household | Owner-occupied | Renter-occupied |
| No Vehicle | 45 (19.3%) | 99 (22.7%) |
| 1 Vehicle | 94 (40.3%) | 195 (44.6%) |
| 2 Vehicles | 77 (33.1%) | 104 (23.8%) |
| 3 or more Vehicles | 17 (7.3%) | 39 (8.9%) |
| Total | 233 (100.0%) | 437 (100.0%) |
Real Estate & Mortgages in Victory Gardens borough
Real Estate and Mortgage Overview in Victory Gardens borough
| Characteristic | Without Mortgage | With Mortgage |
| Housing Units | 56 | 177 |
| Median Property Value | $226,500 | $224,200 |
| Median Household Income | $66,667 | $9 |
| Monthly Housing Costs | $904 | $3 |
| Real Estate Taxes | $5,441 | $0 |
Property Value by Mortgage Status in Victory Gardens borough
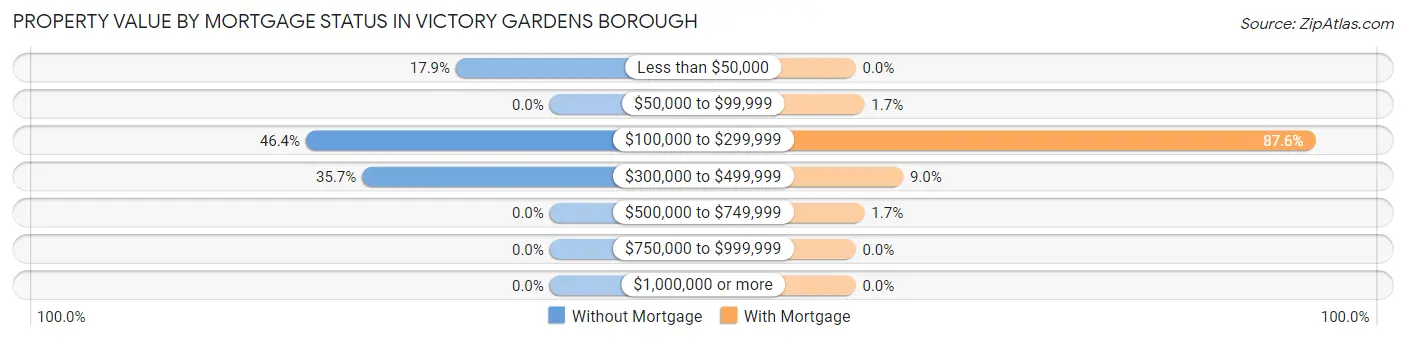
| Property Value | Without Mortgage | With Mortgage |
| Less than $50,000 | 10 (17.9%) | 0 (0.0%) |
| $50,000 to $99,999 | 0 (0.0%) | 3 (1.7%) |
| $100,000 to $299,999 | 26 (46.4%) | 155 (87.6%) |
| $300,000 to $499,999 | 20 (35.7%) | 16 (9.0%) |
| $500,000 to $749,999 | 0 (0.0%) | 3 (1.7%) |
| $750,000 to $999,999 | 0 (0.0%) | 0 (0.0%) |
| $1,000,000 or more | 0 (0.0%) | 0 (0.0%) |
| Total | 56 (100.0%) | 177 (100.0%) |
Household Income by Mortgage Status in Victory Gardens borough
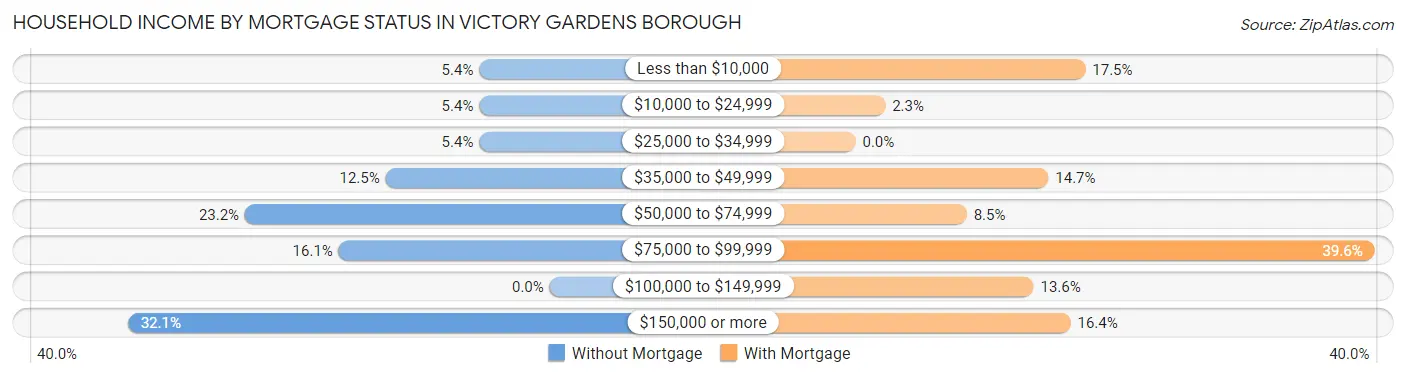
| Household Income | Without Mortgage | With Mortgage |
| Less than $10,000 | 3 (5.4%) | 31 (17.5%) |
| $10,000 to $24,999 | 3 (5.4%) | 4 (2.3%) |
| $25,000 to $34,999 | 3 (5.4%) | 0 (0.0%) |
| $35,000 to $49,999 | 7 (12.5%) | 26 (14.7%) |
| $50,000 to $74,999 | 13 (23.2%) | 15 (8.5%) |
| $75,000 to $99,999 | 9 (16.1%) | 70 (39.6%) |
| $100,000 to $149,999 | 0 (0.0%) | 24 (13.6%) |
| $150,000 or more | 18 (32.1%) | 29 (16.4%) |
| Total | 56 (100.0%) | 177 (100.0%) |
Property Value to Household Income Ratio in Victory Gardens borough
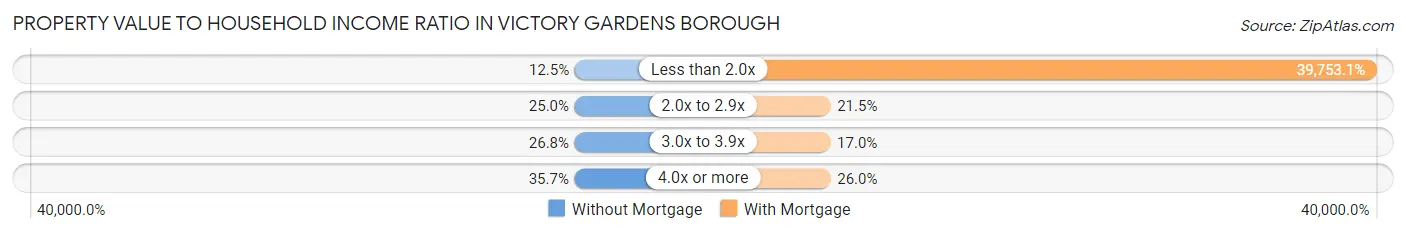
| Value-to-Income Ratio | Without Mortgage | With Mortgage |
| Less than 2.0x | 7 (12.5%) | 70,363 (39,753.1%) |
| 2.0x to 2.9x | 14 (25.0%) | 38 (21.5%) |
| 3.0x to 3.9x | 15 (26.8%) | 30 (17.0%) |
| 4.0x or more | 20 (35.7%) | 46 (26.0%) |
| Total | 56 (100.0%) | 177 (100.0%) |
Real Estate Taxes by Mortgage Status in Victory Gardens borough
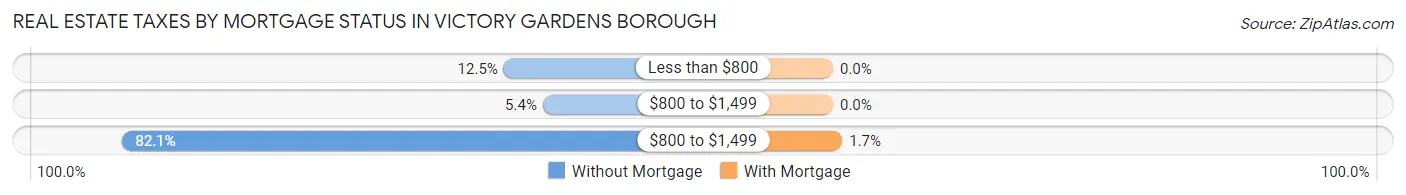
| Property Taxes | Without Mortgage | With Mortgage |
| Less than $800 | 7 (12.5%) | 0 (0.0%) |
| $800 to $1,499 | 3 (5.4%) | 0 (0.0%) |
| $800 to $1,499 | 46 (82.1%) | 3 (1.7%) |
| Total | 56 (100.0%) | 177 (100.0%) |
Health & Disability in Victory Gardens borough
Health Insurance Coverage by Age in Victory Gardens borough
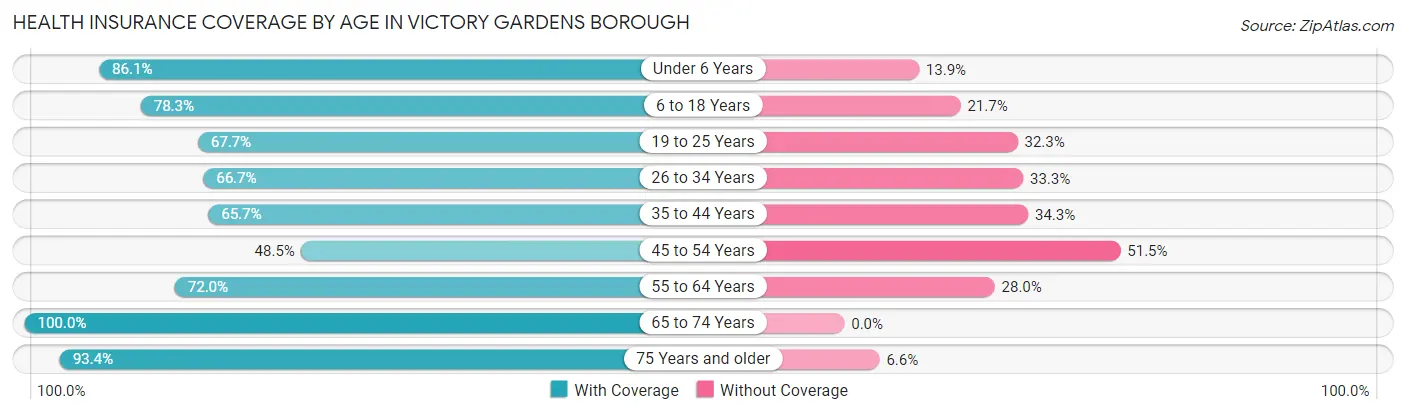
| Age Bracket | With Coverage | Without Coverage |
| Under 6 Years | 99 (86.1%) | 16 (13.9%) |
| 6 to 18 Years | 188 (78.3%) | 52 (21.7%) |
| 19 to 25 Years | 155 (67.7%) | 74 (32.3%) |
| 26 to 34 Years | 116 (66.7%) | 58 (33.3%) |
| 35 to 44 Years | 213 (65.7%) | 111 (34.3%) |
| 45 to 54 Years | 148 (48.5%) | 157 (51.5%) |
| 55 to 64 Years | 172 (72.0%) | 67 (28.0%) |
| 65 to 74 Years | 74 (100.0%) | 0 (0.0%) |
| 75 Years and older | 57 (93.4%) | 4 (6.6%) |
| Total | 1,222 (69.4%) | 539 (30.6%) |
Health Insurance Coverage by Citizenship Status in Victory Gardens borough
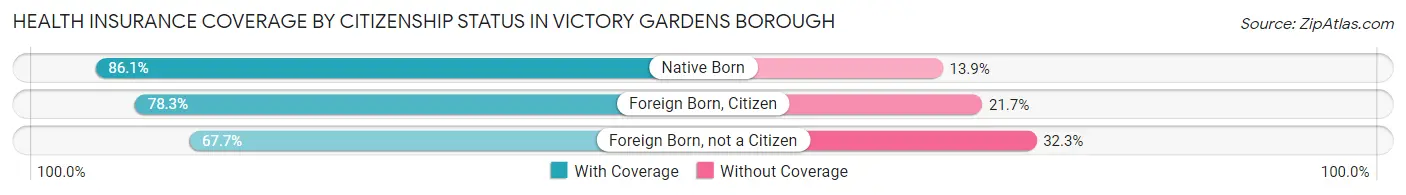
| Citizenship Status | With Coverage | Without Coverage |
| Native Born | 99 (86.1%) | 16 (13.9%) |
| Foreign Born, Citizen | 188 (78.3%) | 52 (21.7%) |
| Foreign Born, not a Citizen | 155 (67.7%) | 74 (32.3%) |
Health Insurance Coverage by Household Income in Victory Gardens borough
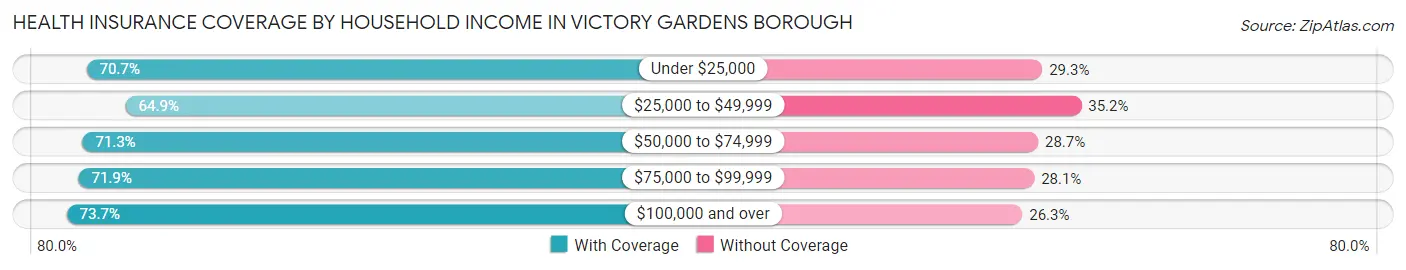
| Household Income | With Coverage | Without Coverage |
| Under $25,000 | 140 (70.7%) | 58 (29.3%) |
| $25,000 to $49,999 | 417 (64.8%) | 226 (35.1%) |
| $50,000 to $74,999 | 296 (71.3%) | 119 (28.7%) |
| $75,000 to $99,999 | 128 (71.9%) | 50 (28.1%) |
| $100,000 and over | 241 (73.7%) | 86 (26.3%) |
Public vs Private Health Insurance Coverage by Age in Victory Gardens borough
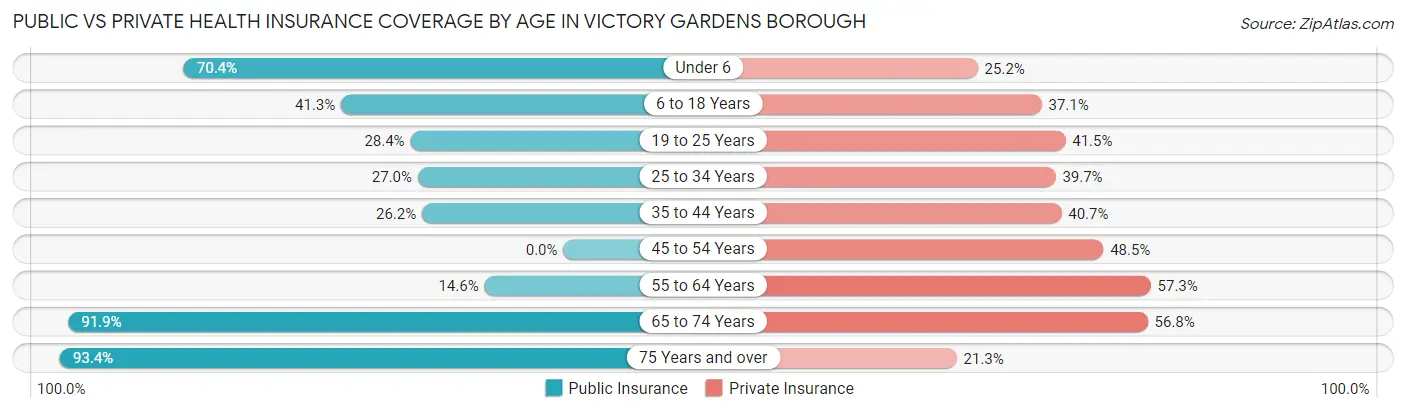
| Age Bracket | Public Insurance | Private Insurance |
| Under 6 | 81 (70.4%) | 29 (25.2%) |
| 6 to 18 Years | 99 (41.2%) | 89 (37.1%) |
| 19 to 25 Years | 65 (28.4%) | 95 (41.5%) |
| 25 to 34 Years | 47 (27.0%) | 69 (39.7%) |
| 35 to 44 Years | 85 (26.2%) | 132 (40.7%) |
| 45 to 54 Years | 0 (0.0%) | 148 (48.5%) |
| 55 to 64 Years | 35 (14.6%) | 137 (57.3%) |
| 65 to 74 Years | 68 (91.9%) | 42 (56.8%) |
| 75 Years and over | 57 (93.4%) | 13 (21.3%) |
| Total | 537 (30.5%) | 754 (42.8%) |
Disability Status by Sex by Age in Victory Gardens borough
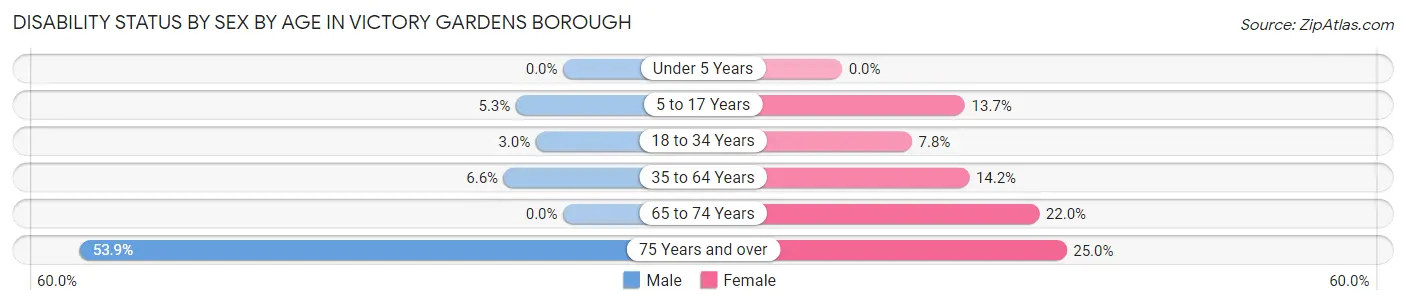
| Age Bracket | Male | Female |
| Under 5 Years | 0 (0.0%) | 0 (0.0%) |
| 5 to 17 Years | 7 (5.3%) | 13 (13.7%) |
| 18 to 34 Years | 7 (3.0%) | 15 (7.8%) |
| 35 to 64 Years | 28 (6.6%) | 63 (14.2%) |
| 65 to 74 Years | 0 (0.0%) | 9 (22.0%) |
| 75 Years and over | 7 (53.8%) | 12 (25.0%) |
Disability Class by Sex by Age in Victory Gardens borough
Disability Class: Hearing Difficulty
| Age Bracket | Male | Female |
| Under 5 Years | 0 (0.0%) | 0 (0.0%) |
| 5 to 17 Years | 0 (0.0%) | 0 (0.0%) |
| 18 to 34 Years | 0 (0.0%) | 0 (0.0%) |
| 35 to 64 Years | 0 (0.0%) | 0 (0.0%) |
| 65 to 74 Years | 0 (0.0%) | 0 (0.0%) |
| 75 Years and over | 3 (23.1%) | 7 (14.6%) |
Disability Class: Vision Difficulty
| Age Bracket | Male | Female |
| Under 5 Years | 0 (0.0%) | 0 (0.0%) |
| 5 to 17 Years | 7 (5.3%) | 0 (0.0%) |
| 18 to 34 Years | 7 (3.0%) | 4 (2.1%) |
| 35 to 64 Years | 20 (4.7%) | 5 (1.1%) |
| 65 to 74 Years | 0 (0.0%) | 4 (9.8%) |
| 75 Years and over | 0 (0.0%) | 5 (10.4%) |
Disability Class: Cognitive Difficulty
| Age Bracket | Male | Female |
| 5 to 17 Years | 7 (5.3%) | 13 (13.7%) |
| 18 to 34 Years | 7 (3.0%) | 9 (4.7%) |
| 35 to 64 Years | 8 (1.9%) | 18 (4.0%) |
| 65 to 74 Years | 0 (0.0%) | 0 (0.0%) |
| 75 Years and over | 4 (30.8%) | 12 (25.0%) |
Disability Class: Ambulatory Difficulty
| Age Bracket | Male | Female |
| 5 to 17 Years | 0 (0.0%) | 0 (0.0%) |
| 18 to 34 Years | 0 (0.0%) | 0 (0.0%) |
| 35 to 64 Years | 20 (4.7%) | 44 (9.9%) |
| 65 to 74 Years | 0 (0.0%) | 9 (22.0%) |
| 75 Years and over | 0 (0.0%) | 12 (25.0%) |
Disability Class: Self-Care Difficulty
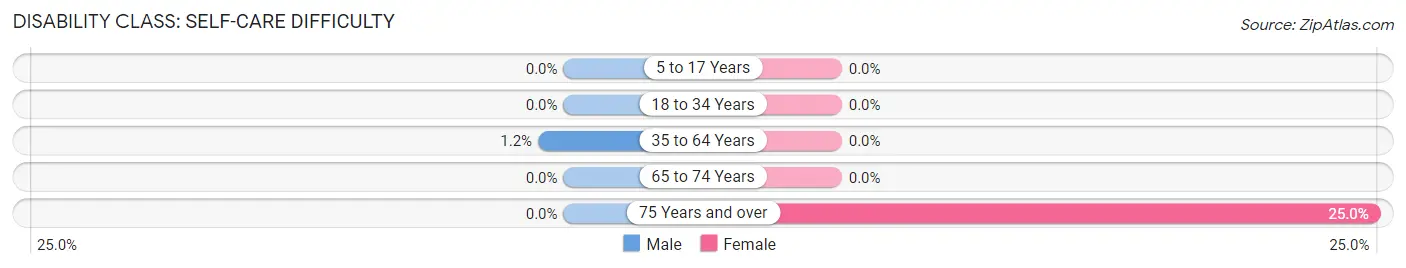
| Age Bracket | Male | Female |
| 5 to 17 Years | 0 (0.0%) | 0 (0.0%) |
| 18 to 34 Years | 0 (0.0%) | 0 (0.0%) |
| 35 to 64 Years | 5 (1.2%) | 0 (0.0%) |
| 65 to 74 Years | 0 (0.0%) | 0 (0.0%) |
| 75 Years and over | 0 (0.0%) | 12 (25.0%) |
Technology Access in Victory Gardens borough
Computing Device Access in Victory Gardens borough
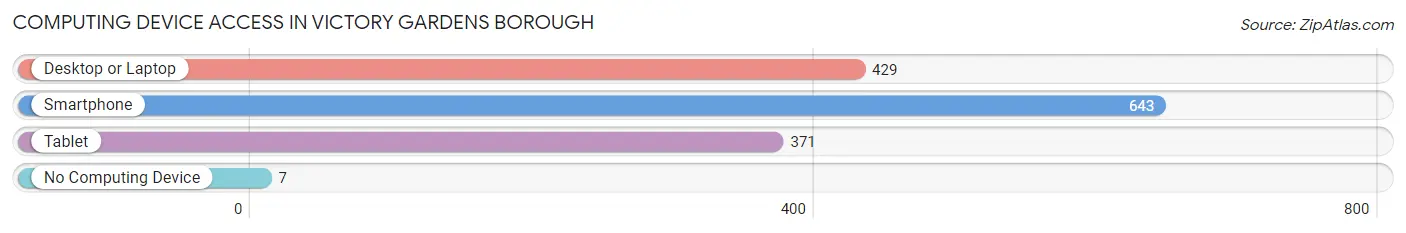
| Device Type | # Households | % Households |
| Desktop or Laptop | 429 | 64.0% |
| Smartphone | 643 | 96.0% |
| Tablet | 371 | 55.4% |
| No Computing Device | 7 | 1.0% |
| Total | 670 | 100.0% |
Internet Access in Victory Gardens borough
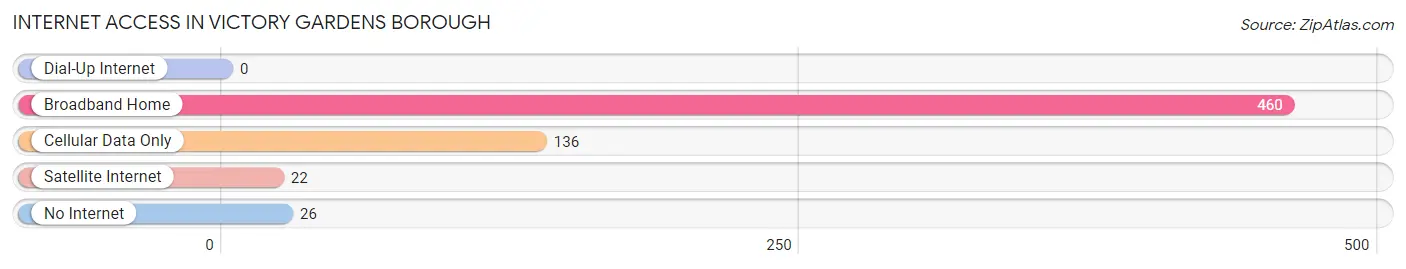
| Internet Type | # Households | % Households |
| Dial-Up Internet | 0 | 0.0% |
| Broadband Home | 460 | 68.7% |
| Cellular Data Only | 136 | 20.3% |
| Satellite Internet | 22 | 3.3% |
| No Internet | 26 | 3.9% |
| Total | 670 | 100.0% |
Victory Gardens borough Summary
Victory Gardens Borough is a small borough located in Morris County, New Jersey. It is situated in the northern part of the state, just south of the New York border. The borough is bordered by the towns of Parsippany-Troy Hills, Denville, and Rockaway. Victory Gardens Borough was incorporated in 1922 and is home to approximately 2,500 people.
Geography
Victory Gardens Borough is located in the northern part of Morris County, New Jersey. It is situated between the towns of Parsippany-Troy Hills, Denville, and Rockaway. The borough is approximately 2.5 square miles in size and is located at an elevation of approximately 500 feet. The borough is located in the Great Appalachian Valley, which is a large valley that stretches from Canada to Alabama. The borough is located in the Kittatinny Valley, which is a smaller valley that is part of the Great Appalachian Valley. The borough is located in the northern part of the valley, which is characterized by rolling hills and valleys. The borough is located in the watershed of the Rockaway River, which is a tributary of the Passaic River.
The climate in Victory Gardens Borough is classified as humid continental, which is characterized by warm summers and cold winters. The average temperature in the summer is around 75 degrees Fahrenheit, and the average temperature in the winter is around 25 degrees Fahrenheit. The average annual precipitation is around 45 inches.
Economy
Victory Gardens Borough has a small, but diverse economy. The borough is home to a variety of businesses, including retail stores, restaurants, and professional services. The borough is also home to a number of manufacturing companies, including a plastics manufacturer and a metal fabrication company. The borough is also home to a number of small businesses, including a bakery, a florist, and a pet store.
The borough is home to a number of educational institutions, including a public elementary school, a public middle school, and a public high school. The borough is also home to a number of private schools, including a Catholic elementary school and a private high school.
Demographics
As of the 2010 census, the population of Victory Gardens Borough was 2,521. The population is approximately 50% male and 50% female. The median age of the population is 43.7 years. The racial makeup of the borough is approximately 87.3% White, 5.2% Hispanic or Latino, 3.2% Asian, and 2.3% African American.
The median household income in Victory Gardens Borough is $77,917. The median home value is $346,400. The median rent is $1,541. The unemployment rate is 4.2%.
Conclusion
Victory Gardens Borough is a small borough located in Morris County, New Jersey. It is situated in the northern part of the state, just south of the New York border. The borough is bordered by the towns of Parsippany-Troy Hills, Denville, and Rockaway. Victory Gardens Borough was incorporated in 1922 and is home to approximately 2,500 people. The borough has a small, but diverse economy and is home to a variety of businesses, including retail stores, restaurants, and professional services. The population of Victory Gardens Borough is approximately 50% male and 50% female, and the median age of the population is 43.7 years. The median household income in Victory Gardens Borough is $77,917, and the median home value is $346,400.
Common Questions
What is Per Capita Income in Victory Gardens borough?
Per Capita income in Victory Gardens borough is $25,474.
What is the Median Family Income in Victory Gardens borough?
Median Family Income in Victory Gardens borough is $53,167.
What is the Median Household income in Victory Gardens borough?
Median Household Income in Victory Gardens borough is $55,000.
What is Income or Wage Gap in Victory Gardens borough?
Income or Wage Gap in Victory Gardens borough is 34.2%.
Women in Victory Gardens borough earn 65.8 cents for every dollar earned by a man.
What is Family Income Deficit in Victory Gardens borough?
Family Income Deficit in Victory Gardens borough is $5,088.
Families that are below poverty line in Victory Gardens borough earn $5,088 less on average than the poverty threshold level.
What is Inequality or Gini Index in Victory Gardens borough?
Inequality or Gini Index in Victory Gardens borough is 0.34.
What is the Total Population of Victory Gardens borough?
Total Population of Victory Gardens borough is 1,761.
What is the Total Male Population of Victory Gardens borough?
Total Male Population of Victory Gardens borough is 894.
What is the Total Female Population of Victory Gardens borough?
Total Female Population of Victory Gardens borough is 867.
What is the Ratio of Males per 100 Females in Victory Gardens borough?
There are 103.11 Males per 100 Females in Victory Gardens borough.
What is the Ratio of Females per 100 Males in Victory Gardens borough?
There are 96.98 Females per 100 Males in Victory Gardens borough.
What is the Median Population Age in Victory Gardens borough?
Median Population Age in Victory Gardens borough is 40.9 Years.
What is the Average Family Size in Victory Gardens borough
Average Family Size in Victory Gardens borough is 2.8 People.
What is the Average Household Size in Victory Gardens borough
Average Household Size in Victory Gardens borough is 2.6 People.
How Large is the Labor Force in Victory Gardens borough?
There are 1,057 People in the Labor Forcein in Victory Gardens borough.
What is the Percentage of People in the Labor Force in Victory Gardens borough?
72.4% of People are in the Labor Force in Victory Gardens borough.
What is the Unemployment Rate in Victory Gardens borough?
Unemployment Rate in Victory Gardens borough is 8.2%.