Penns Grove borough, NJ Map & Demographics
Penns Grove borough Overview
$15,903
PER CAPITA INCOME
$43,321
AVG FAMILY INCOME
$29,821
AVG HOUSEHOLD INCOME
46.3%
WAGE / INCOME GAP [ % ]
53.7¢/ $1
WAGE / INCOME GAP [ $ ]
0.51
INEQUALITY / GINI INDEX
4,841
TOTAL POPULATION
2,167
MALE POPULATION
2,674
FEMALE POPULATION
81.04
MALES / 100 FEMALES
123.40
FEMALES / 100 MALES
25.0
MEDIAN AGE
4.2
AVG FAMILY SIZE
3.0
AVG HOUSEHOLD SIZE
1,573
LABOR FORCE [ PEOPLE ]
51.6%
PERCENT IN LABOR FORCE
15.5%
UNEMPLOYMENT RATE
Income in Penns Grove borough
Income Overview in Penns Grove borough
Per Capita Income in Penns Grove borough is $15,903, while median incomes of families and households are $43,321 and $29,821 respectively.
| Characteristic | Number | Measure |
| Per Capita Income | 4,841 | $15,903 |
| Median Family Income | 899 | $43,321 |
| Mean Family Income | 899 | $55,512 |
| Median Household Income | 1,604 | $29,821 |
| Mean Household Income | 1,604 | $46,415 |
| Income Deficit | 899 | $0 |
| Wage / Income Gap (%) | 4,841 | 46.26% |
| Wage / Income Gap ($) | 4,841 | 53.74¢ per $1 |
| Gini / Inequality Index | 4,841 | 0.51 |
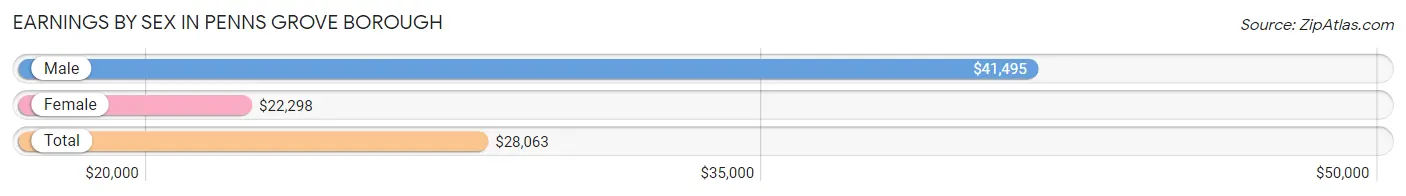
Earnings by Sex in Penns Grove borough
Average Earnings in Penns Grove borough are $28,063, $41,495 for men and $22,298 for women, a difference of 46.3%.
| Sex | Number | Average Earnings |
| Male | 613 (37.4%) | $41,495 |
| Female | 1,028 (62.6%) | $22,298 |
| Total | 1,641 (100.0%) | $28,063 |
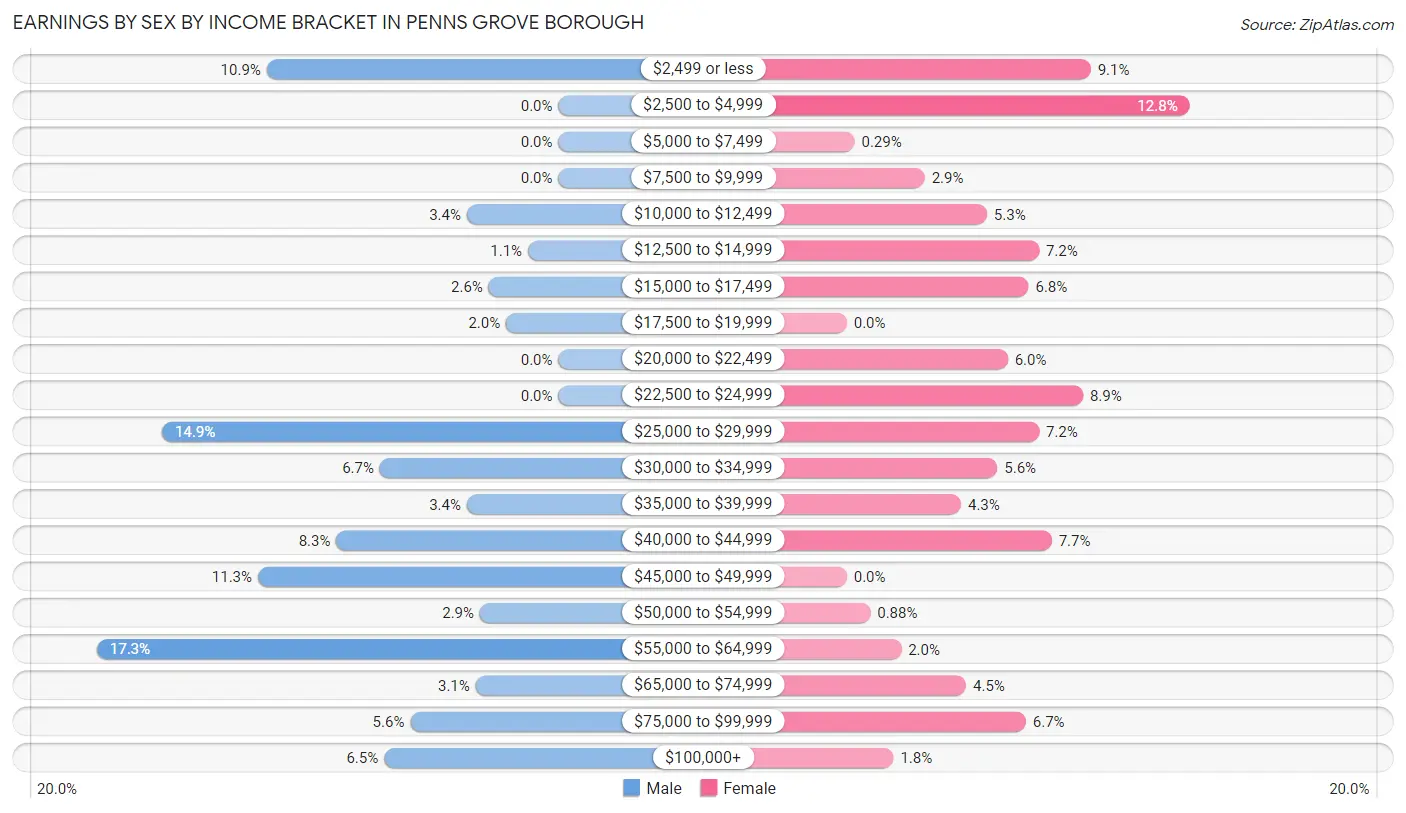
Earnings by Sex by Income Bracket in Penns Grove borough
The most common earnings brackets in Penns Grove borough are $55,000 to $64,999 for men (106 | 17.3%) and $2,500 to $4,999 for women (132 | 12.8%).
| Income | Male | Female |
| $2,499 or less | 67 (10.9%) | 94 (9.1%) |
| $2,500 to $4,999 | 0 (0.0%) | 132 (12.8%) |
| $5,000 to $7,499 | 0 (0.0%) | 3 (0.3%) |
| $7,500 to $9,999 | 0 (0.0%) | 30 (2.9%) |
| $10,000 to $12,499 | 21 (3.4%) | 54 (5.2%) |
| $12,500 to $14,999 | 7 (1.1%) | 74 (7.2%) |
| $15,000 to $17,499 | 16 (2.6%) | 70 (6.8%) |
| $17,500 to $19,999 | 12 (2.0%) | 0 (0.0%) |
| $20,000 to $22,499 | 0 (0.0%) | 62 (6.0%) |
| $22,500 to $24,999 | 0 (0.0%) | 91 (8.8%) |
| $25,000 to $29,999 | 91 (14.8%) | 74 (7.2%) |
| $30,000 to $34,999 | 41 (6.7%) | 58 (5.6%) |
| $35,000 to $39,999 | 21 (3.4%) | 44 (4.3%) |
| $40,000 to $44,999 | 51 (8.3%) | 79 (7.7%) |
| $45,000 to $49,999 | 69 (11.3%) | 0 (0.0%) |
| $50,000 to $54,999 | 18 (2.9%) | 9 (0.9%) |
| $55,000 to $64,999 | 106 (17.3%) | 21 (2.0%) |
| $65,000 to $74,999 | 19 (3.1%) | 46 (4.5%) |
| $75,000 to $99,999 | 34 (5.6%) | 69 (6.7%) |
| $100,000+ | 40 (6.5%) | 18 (1.8%) |
| Total | 613 (100.0%) | 1,028 (100.0%) |
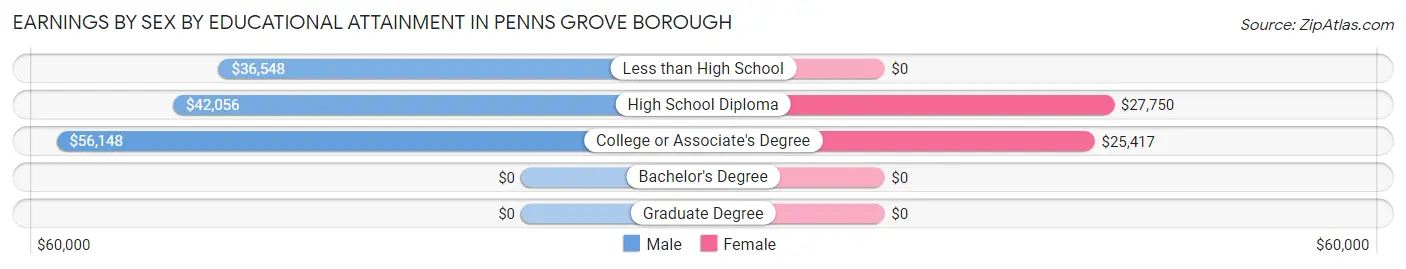
Earnings by Sex by Educational Attainment in Penns Grove borough
Average earnings in Penns Grove borough are $45,461 for men and $29,122 for women, a difference of 35.9%. Men with an educational attainment of college or associate's degree enjoy the highest average annual earnings of $56,148, while those with less than high school education earn the least with $36,548. Women with an educational attainment of high school diploma earn the most with the average annual earnings of $27,750, while those with college or associate's degree education have the smallest earnings of $25,417.
| Educational Attainment | Male Income | Female Income |
| Less than High School | $36,548 | $0 |
| High School Diploma | $42,056 | $27,750 |
| College or Associate's Degree | $56,148 | $25,417 |
| Bachelor's Degree | - | - |
| Graduate Degree | - | - |
| Total | $45,461 | $29,122 |
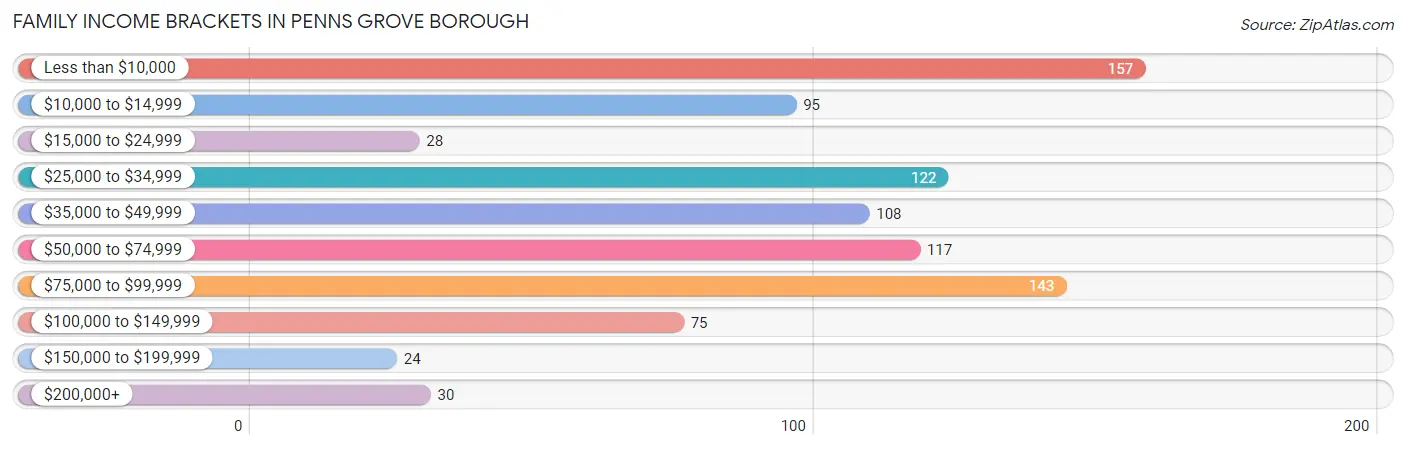
Family Income in Penns Grove borough
Family Income Brackets in Penns Grove borough
According to the Penns Grove borough family income data, there are 157 families falling into the less than $10,000 income range, which is the most common income bracket and makes up 17.5% of all families. Conversely, the $150,000 to $199,999 income bracket is the least frequent group with only 24 families (2.7%) belonging to this category.
| Income Bracket | # Families | % Families |
| Less than $10,000 | 157 | 17.5% |
| $10,000 to $14,999 | 95 | 10.6% |
| $15,000 to $24,999 | 28 | 3.1% |
| $25,000 to $34,999 | 122 | 13.6% |
| $35,000 to $49,999 | 108 | 12.0% |
| $50,000 to $74,999 | 117 | 13.0% |
| $75,000 to $99,999 | 143 | 15.9% |
| $100,000 to $149,999 | 75 | 8.3% |
| $150,000 to $199,999 | 24 | 2.7% |
| $200,000+ | 30 | 3.3% |
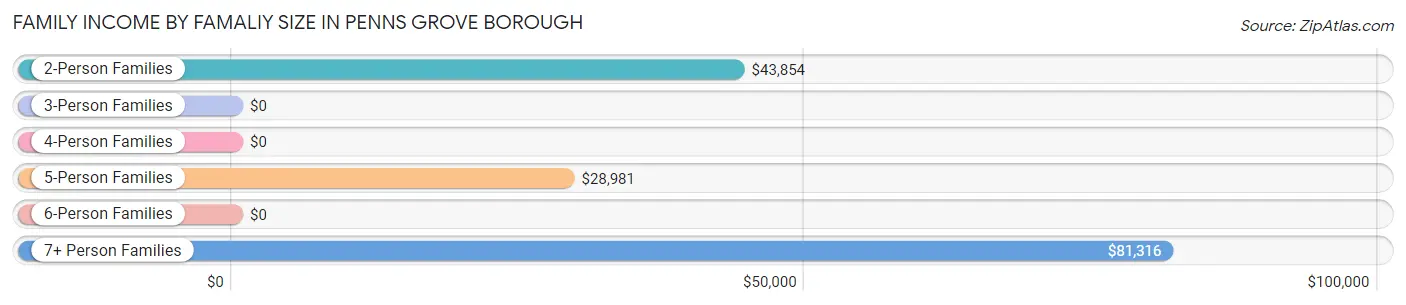
Family Income by Famaliy Size in Penns Grove borough
7+ person families (56 | 6.2%) account for the highest median family income in Penns Grove borough with $81,316 per family, while 2-person families (295 | 32.8%) have the highest median income of $21,927 per family member.
| Income Bracket | # Families | Median Income |
| 2-Person Families | 295 (32.8%) | $43,854 |
| 3-Person Families | 312 (34.7%) | $0 |
| 4-Person Families | 87 (9.7%) | $0 |
| 5-Person Families | 106 (11.8%) | $28,981 |
| 6-Person Families | 43 (4.8%) | $0 |
| 7+ Person Families | 56 (6.2%) | $81,316 |
| Total | 899 (100.0%) | $43,321 |
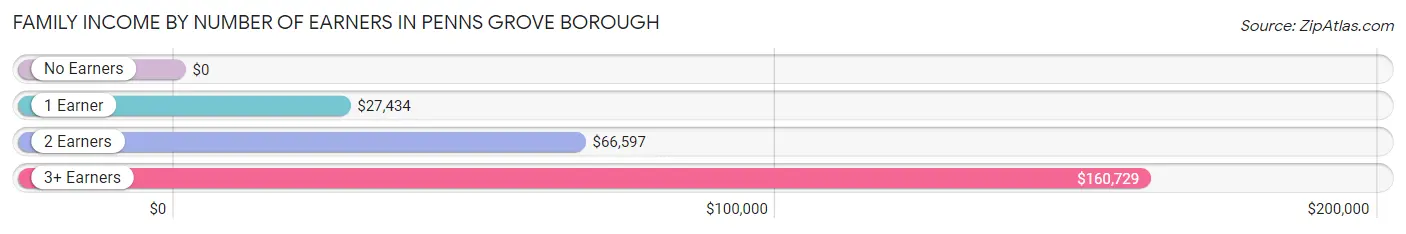
Family Income by Number of Earners in Penns Grove borough
| Number of Earners | # Families | Median Income |
| No Earners | 204 (22.7%) | $0 |
| 1 Earner | 362 (40.3%) | $27,434 |
| 2 Earners | 260 (28.9%) | $66,597 |
| 3+ Earners | 73 (8.1%) | $160,729 |
| Total | 899 (100.0%) | $43,321 |
Household Income in Penns Grove borough
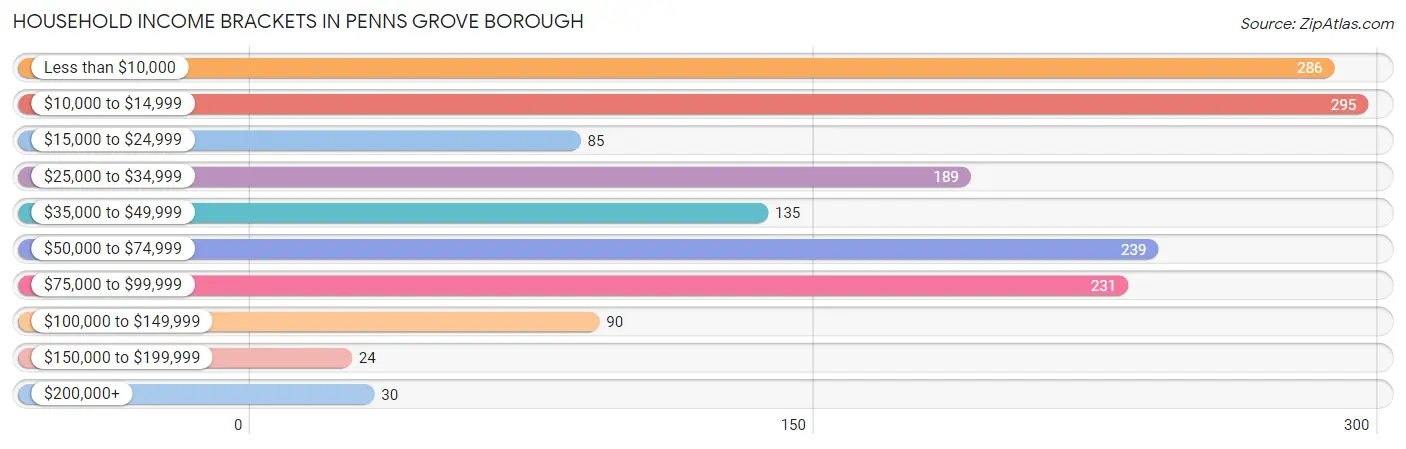
Household Income Brackets in Penns Grove borough
With 295 households falling in the category, the $10,000 to $14,999 income range is the most frequent in Penns Grove borough, accounting for 18.4% of all households. In contrast, only 24 households (1.5%) fall into the $150,000 to $199,999 income bracket, making it the least populous group.
| Income Bracket | # Households | % Households |
| Less than $10,000 | 286 | 17.8% |
| $10,000 to $14,999 | 295 | 18.4% |
| $15,000 to $24,999 | 85 | 5.3% |
| $25,000 to $34,999 | 189 | 11.8% |
| $35,000 to $49,999 | 135 | 8.4% |
| $50,000 to $74,999 | 239 | 14.9% |
| $75,000 to $99,999 | 231 | 14.4% |
| $100,000 to $149,999 | 90 | 5.6% |
| $150,000 to $199,999 | 24 | 1.5% |
| $200,000+ | 30 | 1.9% |
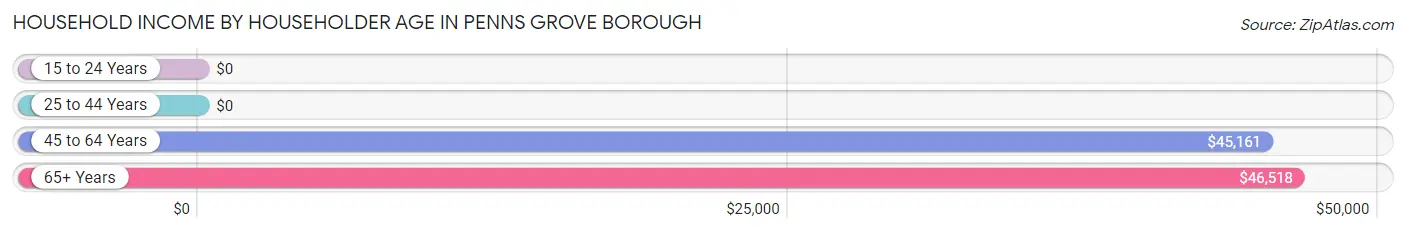
Household Income by Householder Age in Penns Grove borough
The median household income in Penns Grove borough is $29,821, with the highest median household income of $46,518 found in the 65+ years age bracket for the primary householder. A total of 297 households (18.5%) fall into this category. Meanwhile, the 15 to 24 years age bracket for the primary householder has the lowest median household income of $0, with 17 households (1.1%) in this group.
| Income Bracket | # Households | Median Income |
| 15 to 24 Years | 17 (1.1%) | $0 |
| 25 to 44 Years | 742 (46.3%) | $0 |
| 45 to 64 Years | 548 (34.2%) | $45,161 |
| 65+ Years | 297 (18.5%) | $46,518 |
| Total | 1,604 (100.0%) | $29,821 |
Poverty in Penns Grove borough
Income Below Poverty by Sex and Age in Penns Grove borough
With 37.9% poverty level for males and 42.6% for females among the residents of Penns Grove borough, 18 to 24 year old males and 12 to 14 year old females are the most vulnerable to poverty, with 165 males (79.3%) and 172 females (79.6%) in their respective age groups living below the poverty level.
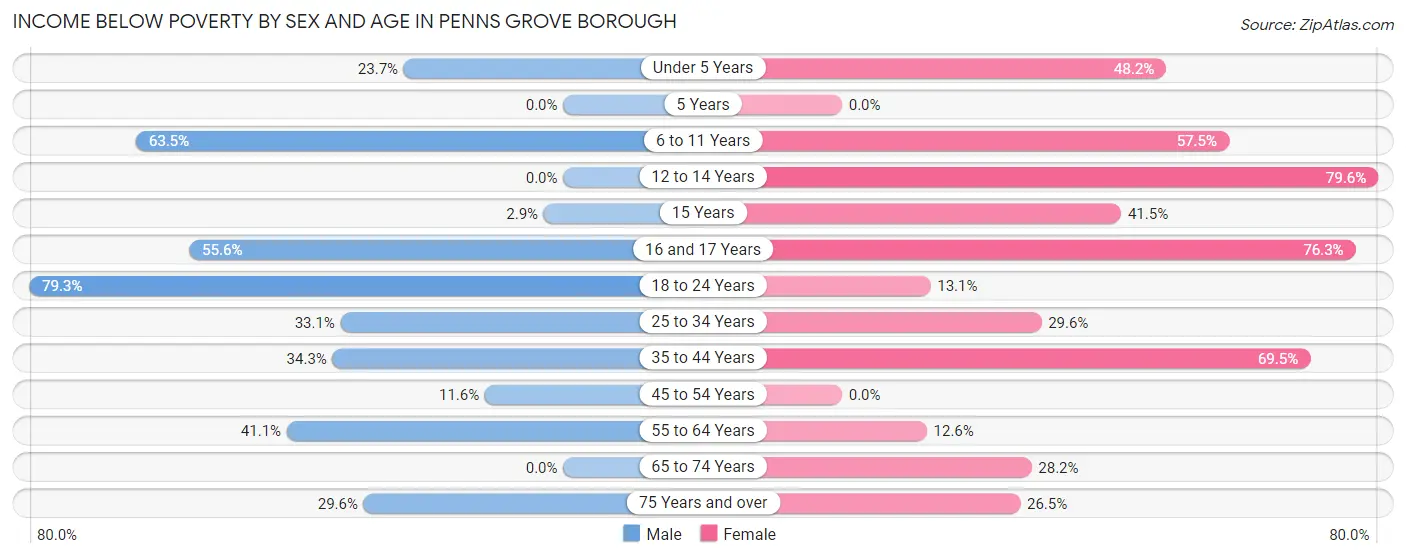
| Age Bracket | Male | Female |
| Under 5 Years | 27 (23.7%) | 131 (48.2%) |
| 5 Years | 0 (0.0%) | 0 (0.0%) |
| 6 to 11 Years | 304 (63.5%) | 181 (57.5%) |
| 12 to 14 Years | 0 (0.0%) | 172 (79.6%) |
| 15 Years | 3 (2.9%) | 34 (41.5%) |
| 16 and 17 Years | 15 (55.6%) | 90 (76.3%) |
| 18 to 24 Years | 165 (79.3%) | 36 (13.1%) |
| 25 to 34 Years | 82 (33.1%) | 69 (29.6%) |
| 35 to 44 Years | 74 (34.3%) | 333 (69.5%) |
| 45 to 54 Years | 15 (11.6%) | 0 (0.0%) |
| 55 to 64 Years | 94 (41.0%) | 36 (12.6%) |
| 65 to 74 Years | 0 (0.0%) | 38 (28.1%) |
| 75 Years and over | 16 (29.6%) | 18 (26.5%) |
| Total | 795 (37.9%) | 1,138 (42.6%) |
Income Above Poverty by Sex and Age in Penns Grove borough
According to the poverty statistics in Penns Grove borough, males aged 5 years and females aged 45 to 54 years are the age groups that are most secure financially, with 100.0% of males and 100.0% of females in these age groups living above the poverty line.
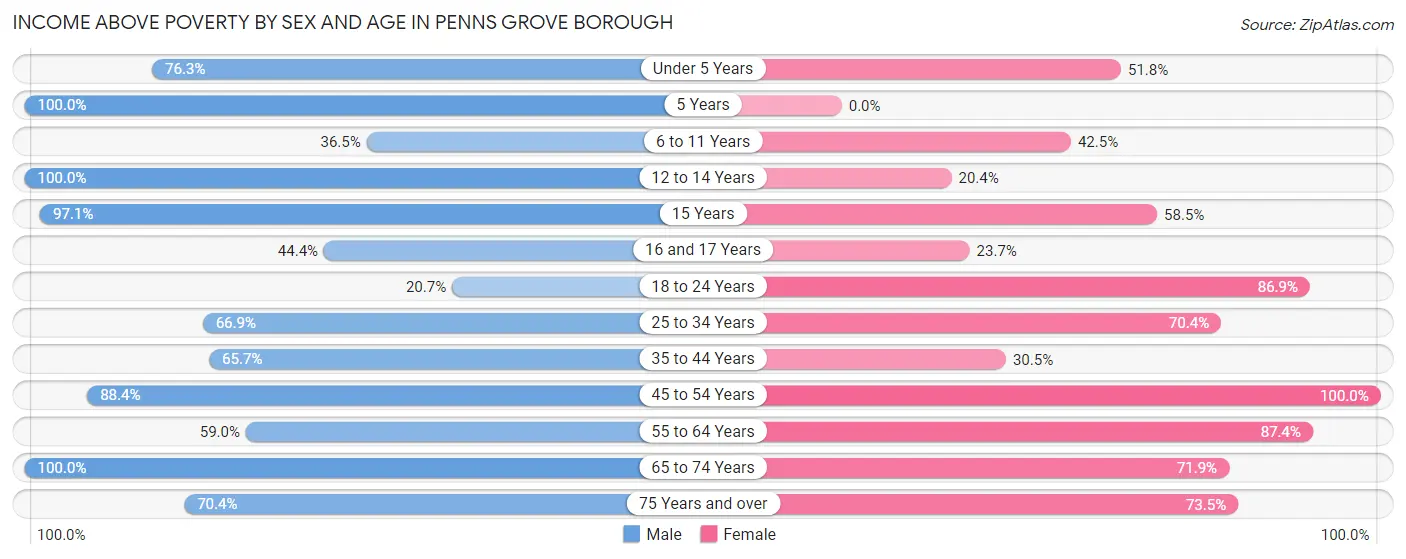
| Age Bracket | Male | Female |
| Under 5 Years | 87 (76.3%) | 141 (51.8%) |
| 5 Years | 10 (100.0%) | 0 (0.0%) |
| 6 to 11 Years | 175 (36.5%) | 134 (42.5%) |
| 12 to 14 Years | 131 (100.0%) | 44 (20.4%) |
| 15 Years | 101 (97.1%) | 48 (58.5%) |
| 16 and 17 Years | 12 (44.4%) | 28 (23.7%) |
| 18 to 24 Years | 43 (20.7%) | 238 (86.9%) |
| 25 to 34 Years | 166 (66.9%) | 164 (70.4%) |
| 35 to 44 Years | 142 (65.7%) | 146 (30.5%) |
| 45 to 54 Years | 114 (88.4%) | 196 (100.0%) |
| 55 to 64 Years | 135 (59.0%) | 250 (87.4%) |
| 65 to 74 Years | 148 (100.0%) | 97 (71.9%) |
| 75 Years and over | 38 (70.4%) | 50 (73.5%) |
| Total | 1,302 (62.1%) | 1,536 (57.4%) |
Income Below Poverty Among Married-Couple Families in Penns Grove borough
The poverty statistics for married-couple families in Penns Grove borough show that 6.5% or 23 of the total 355 families live below the poverty line. Families with 1 or 2 children have the highest poverty rate of 35.4%, comprising of 23 families. On the other hand, families with no children have the lowest poverty rate of 0.0%, which includes 0 families.
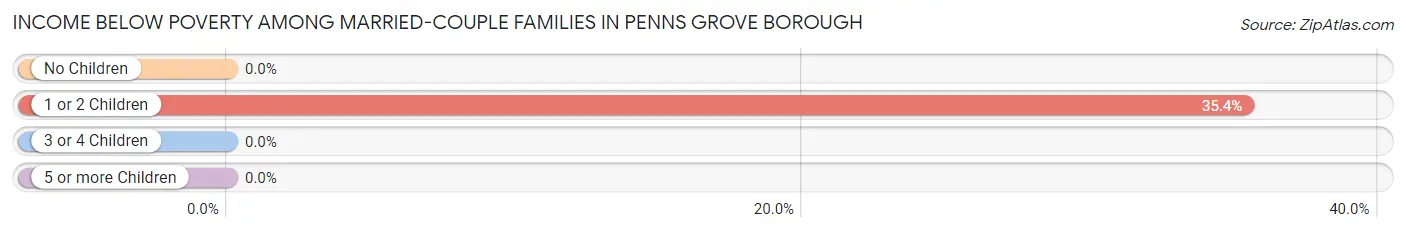
| Children | Above Poverty | Below Poverty |
| No Children | 213 (100.0%) | 0 (0.0%) |
| 1 or 2 Children | 42 (64.6%) | 23 (35.4%) |
| 3 or 4 Children | 58 (100.0%) | 0 (0.0%) |
| 5 or more Children | 19 (100.0%) | 0 (0.0%) |
| Total | 332 (93.5%) | 23 (6.5%) |
Income Below Poverty Among Single-Parent Households in Penns Grove borough
According to the poverty data in Penns Grove borough, 17.3% or 9 single-father households and 59.4% or 292 single-mother households are living below the poverty line. Among single-father households, those with no children have the highest poverty rate, with 9 households (47.4%) experiencing poverty. Likewise, among single-mother households, those with 1 or 2 children have the highest poverty rate, with 270 households (74.2%) falling below the poverty line.
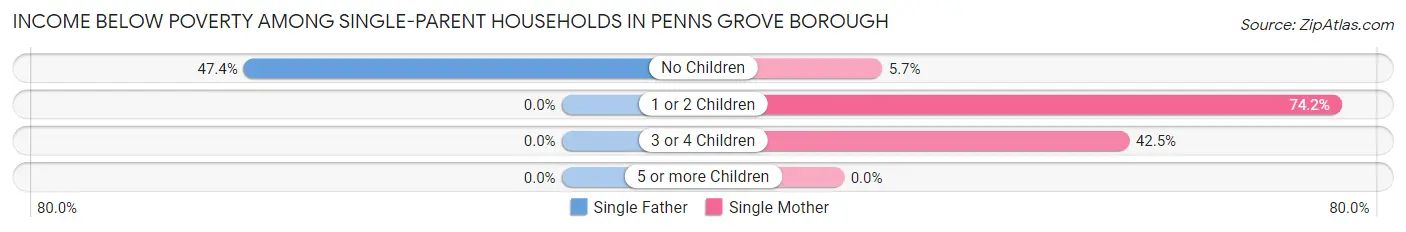
| Children | Single Father | Single Mother |
| No Children | 9 (47.4%) | 5 (5.7%) |
| 1 or 2 Children | 0 (0.0%) | 270 (74.2%) |
| 3 or 4 Children | 0 (0.0%) | 17 (42.5%) |
| 5 or more Children | 0 (0.0%) | 0 (0.0%) |
| Total | 9 (17.3%) | 292 (59.4%) |
Income Below Poverty Among Married-Couple vs Single-Parent Households in Penns Grove borough
The poverty data for Penns Grove borough shows that 23 of the married-couple family households (6.5%) and 301 of the single-parent households (55.3%) are living below the poverty level. Within the married-couple family households, those with 1 or 2 children have the highest poverty rate, with 23 households (35.4%) falling below the poverty line. Among the single-parent households, those with 1 or 2 children have the highest poverty rate, with 270 household (68.0%) living below poverty.
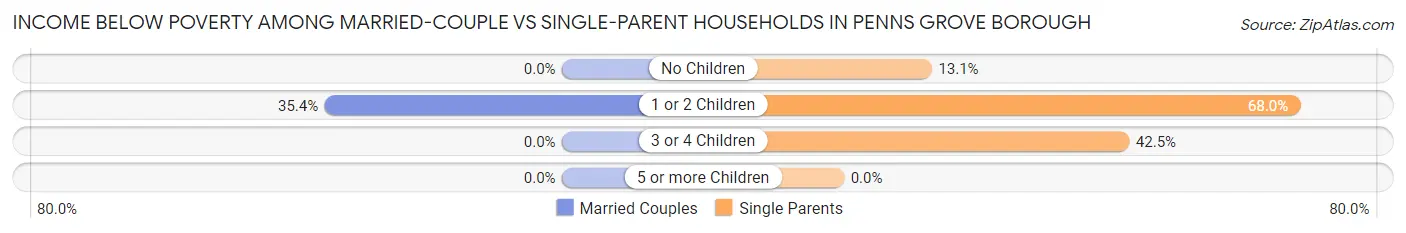
| Children | Married-Couple Families | Single-Parent Households |
| No Children | 0 (0.0%) | 14 (13.1%) |
| 1 or 2 Children | 23 (35.4%) | 270 (68.0%) |
| 3 or 4 Children | 0 (0.0%) | 17 (42.5%) |
| 5 or more Children | 0 (0.0%) | 0 (0.0%) |
| Total | 23 (6.5%) | 301 (55.3%) |
Race in Penns Grove borough
The most populous races in Penns Grove borough are Black / African American (2,021 | 41.7%), White / Caucasian (1,921 | 39.7%), and Hispanic or Latino (1,566 | 32.4%).
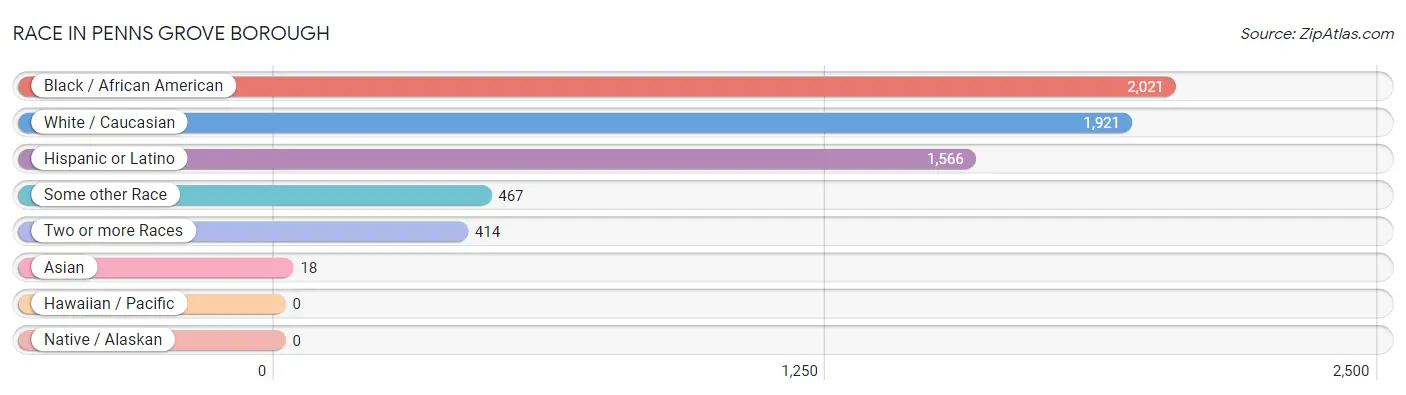
| Race | # Population | % Population |
| Asian | 18 | 0.4% |
| Black / African American | 2,021 | 41.7% |
| Hawaiian / Pacific | 0 | 0.0% |
| Hispanic or Latino | 1,566 | 32.4% |
| Native / Alaskan | 0 | 0.0% |
| White / Caucasian | 1,921 | 39.7% |
| Two or more Races | 414 | 8.6% |
| Some other Race | 467 | 9.7% |
| Total | 4,841 | 100.0% |
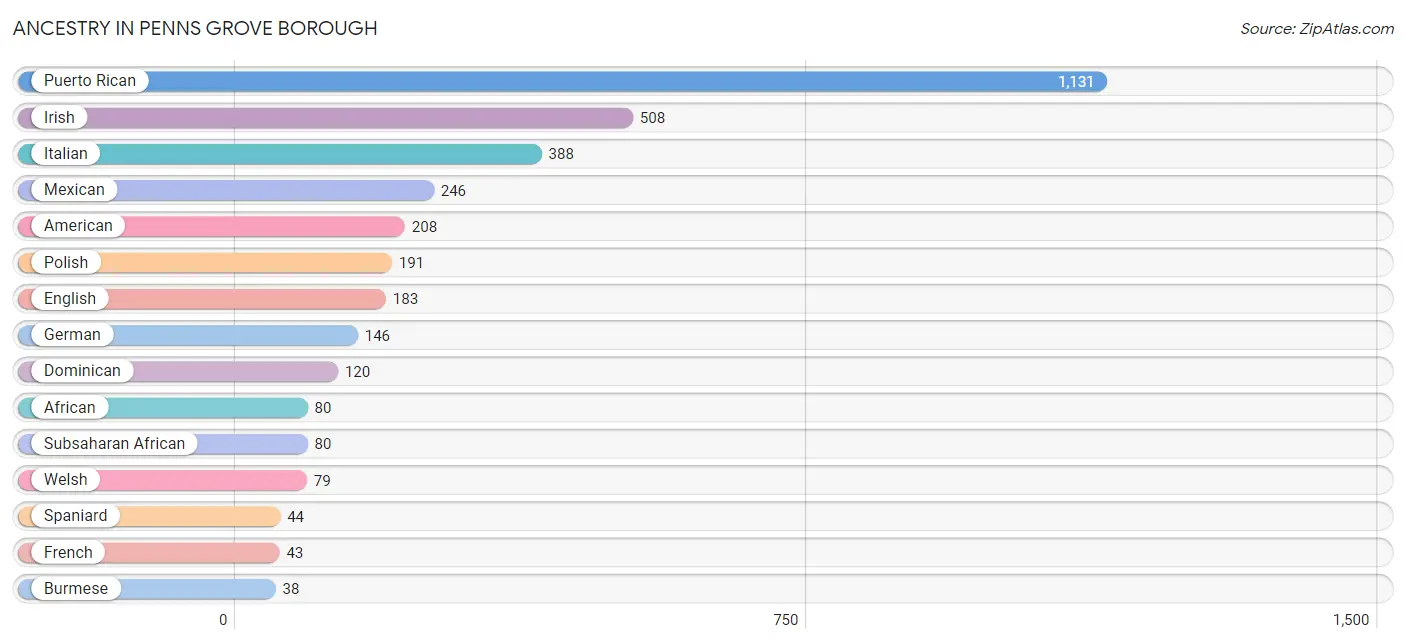
Ancestry in Penns Grove borough
The most populous ancestries reported in Penns Grove borough are Puerto Rican (1,131 | 23.4%), Irish (508 | 10.5%), Italian (388 | 8.0%), Mexican (246 | 5.1%), and American (208 | 4.3%), together accounting for 51.2% of all Penns Grove borough residents.
| Ancestry | # Population | % Population |
| African | 80 | 1.7% |
| American | 208 | 4.3% |
| Arab | 17 | 0.4% |
| British | 5 | 0.1% |
| Burmese | 38 | 0.8% |
| Dominican | 120 | 2.5% |
| Dutch | 15 | 0.3% |
| English | 183 | 3.8% |
| French | 43 | 0.9% |
| French Canadian | 16 | 0.3% |
| German | 146 | 3.0% |
| Irish | 508 | 10.5% |
| Italian | 388 | 8.0% |
| Lebanese | 17 | 0.4% |
| Mexican | 246 | 5.1% |
| Polish | 191 | 4.0% |
| Portuguese | 4 | 0.1% |
| Puerto Rican | 1,131 | 23.4% |
| Scotch-Irish | 15 | 0.3% |
| Spaniard | 44 | 0.9% |
| Subsaharan African | 80 | 1.7% |
| Swedish | 37 | 0.8% |
| Ukrainian | 15 | 0.3% |
| Welsh | 79 | 1.6% | View All 24 Rows |
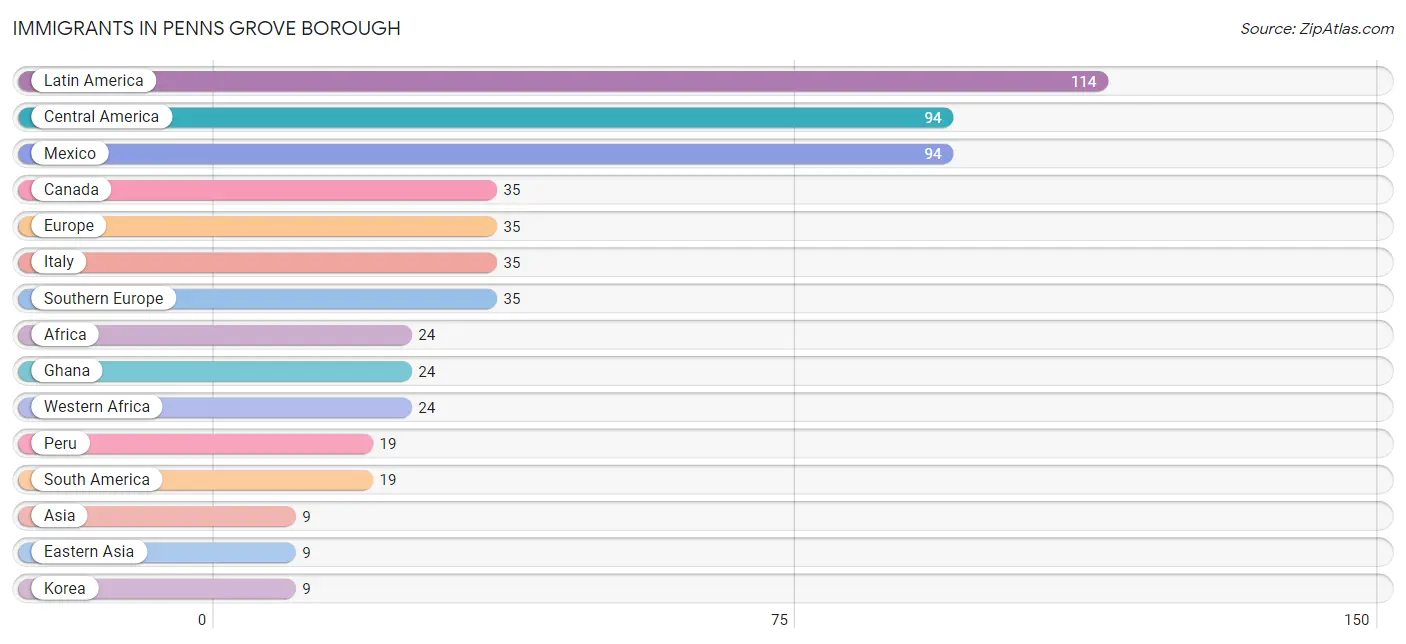
Immigrants in Penns Grove borough
The most numerous immigrant groups reported in Penns Grove borough came from Latin America (114 | 2.4%), Central America (94 | 1.9%), Mexico (94 | 1.9%), Canada (35 | 0.7%), and Europe (35 | 0.7%), together accounting for 7.7% of all Penns Grove borough residents.
| Immigration Origin | # Population | % Population |
| Africa | 24 | 0.5% |
| Asia | 9 | 0.2% |
| Canada | 35 | 0.7% |
| Caribbean | 1 | 0.0% |
| Central America | 94 | 1.9% |
| Dominican Republic | 1 | 0.0% |
| Eastern Asia | 9 | 0.2% |
| Europe | 35 | 0.7% |
| Ghana | 24 | 0.5% |
| Italy | 35 | 0.7% |
| Korea | 9 | 0.2% |
| Latin America | 114 | 2.4% |
| Mexico | 94 | 1.9% |
| Peru | 19 | 0.4% |
| South America | 19 | 0.4% |
| Southern Europe | 35 | 0.7% |
| Western Africa | 24 | 0.5% | View All 17 Rows |
Sex and Age in Penns Grove borough
Sex and Age in Penns Grove borough
The most populous age groups in Penns Grove borough are 10 to 14 Years (434 | 20.0%) for men and 10 to 14 Years (294 | 11.0%) for women.
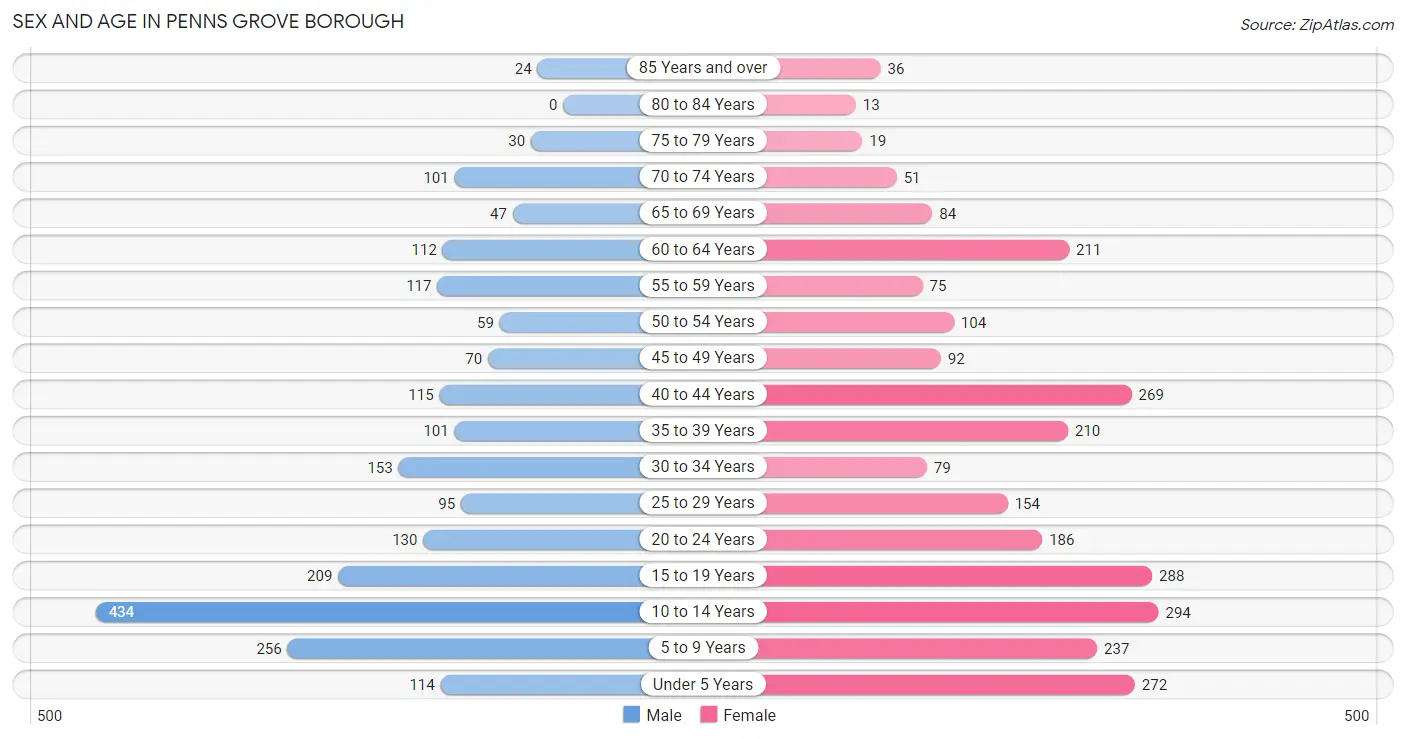
| Age Bracket | Male | Female |
| Under 5 Years | 114 (5.3%) | 272 (10.2%) |
| 5 to 9 Years | 256 (11.8%) | 237 (8.9%) |
| 10 to 14 Years | 434 (20.0%) | 294 (11.0%) |
| 15 to 19 Years | 209 (9.6%) | 288 (10.8%) |
| 20 to 24 Years | 130 (6.0%) | 186 (7.0%) |
| 25 to 29 Years | 95 (4.4%) | 154 (5.8%) |
| 30 to 34 Years | 153 (7.1%) | 79 (2.9%) |
| 35 to 39 Years | 101 (4.7%) | 210 (7.9%) |
| 40 to 44 Years | 115 (5.3%) | 269 (10.1%) |
| 45 to 49 Years | 70 (3.2%) | 92 (3.4%) |
| 50 to 54 Years | 59 (2.7%) | 104 (3.9%) |
| 55 to 59 Years | 117 (5.4%) | 75 (2.8%) |
| 60 to 64 Years | 112 (5.2%) | 211 (7.9%) |
| 65 to 69 Years | 47 (2.2%) | 84 (3.1%) |
| 70 to 74 Years | 101 (4.7%) | 51 (1.9%) |
| 75 to 79 Years | 30 (1.4%) | 19 (0.7%) |
| 80 to 84 Years | 0 (0.0%) | 13 (0.5%) |
| 85 Years and over | 24 (1.1%) | 36 (1.3%) |
| Total | 2,167 (100.0%) | 2,674 (100.0%) |
Families and Households in Penns Grove borough
Median Family Size in Penns Grove borough
The median family size in Penns Grove borough is 4.24 persons per family, with single male/father families (52 | 5.8%) accounting for the largest median family size of 4.69 persons per family. On the other hand, single female/mother families (492 | 54.7%) represent the smallest median family size with 4.12 persons per family.
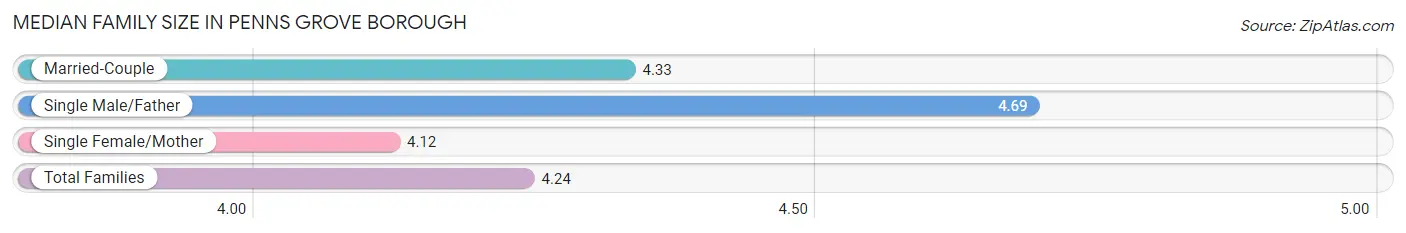
| Family Type | # Families | Family Size |
| Married-Couple | 355 (39.5%) | 4.33 |
| Single Male/Father | 52 (5.8%) | 4.69 |
| Single Female/Mother | 492 (54.7%) | 4.12 |
| Total Families | 899 (100.0%) | 4.24 |
Median Household Size in Penns Grove borough
The median household size in Penns Grove borough is 3.01 persons per household, with single male/father households (52 | 3.2%) accounting for the largest median household size of 5.02 persons per household. non-family households (705 | 44.0%) represent the smallest median household size with 1.39 persons per household.
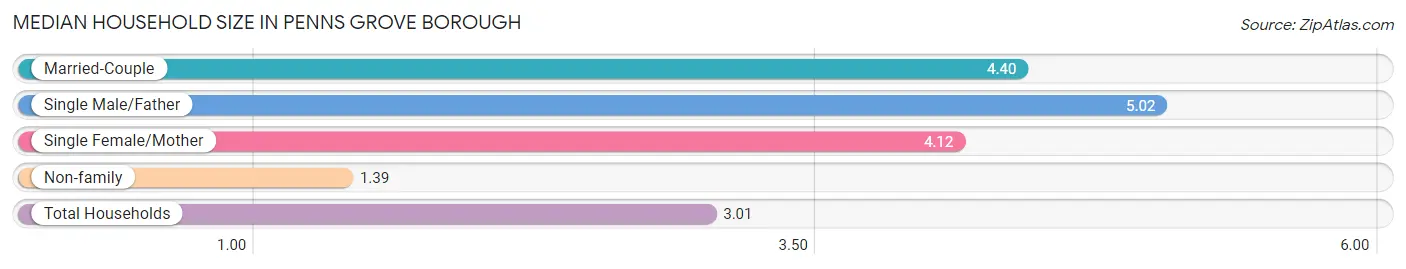
| Household Type | # Households | Household Size |
| Married-Couple | 355 (22.1%) | 4.40 |
| Single Male/Father | 52 (3.2%) | 5.02 |
| Single Female/Mother | 492 (30.7%) | 4.12 |
| Non-family | 705 (44.0%) | 1.39 |
| Total Households | 1,604 (100.0%) | 3.01 |
Household Size by Marriage Status in Penns Grove borough
Out of a total of 1,604 households in Penns Grove borough, 899 (56.0%) are family households, while 705 (44.0%) are nonfamily households. The most numerous type of family households are 3-person households, comprising 321, and the most common type of nonfamily households are 1-person households, comprising 622.
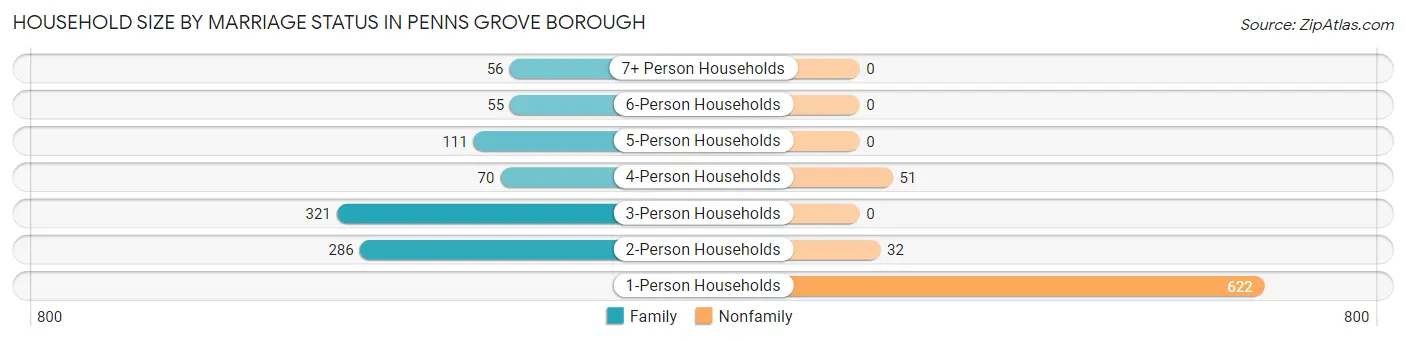
| Household Size | Family Households | Nonfamily Households |
| 1-Person Households | - | 622 (38.8%) |
| 2-Person Households | 286 (17.8%) | 32 (2.0%) |
| 3-Person Households | 321 (20.0%) | 0 (0.0%) |
| 4-Person Households | 70 (4.4%) | 51 (3.2%) |
| 5-Person Households | 111 (6.9%) | 0 (0.0%) |
| 6-Person Households | 55 (3.4%) | 0 (0.0%) |
| 7+ Person Households | 56 (3.5%) | 0 (0.0%) |
| Total | 899 (56.0%) | 705 (44.0%) |
Female Fertility in Penns Grove borough
Fertility by Age in Penns Grove borough
Average fertility rate in Penns Grove borough is 96.0 births per 1,000 women. Women in the age bracket of 20 to 34 years have the highest fertility rate with 165.0 births per 1,000 women. Women in the age bracket of 20 to 34 years acount for 55.6% of all women with births.
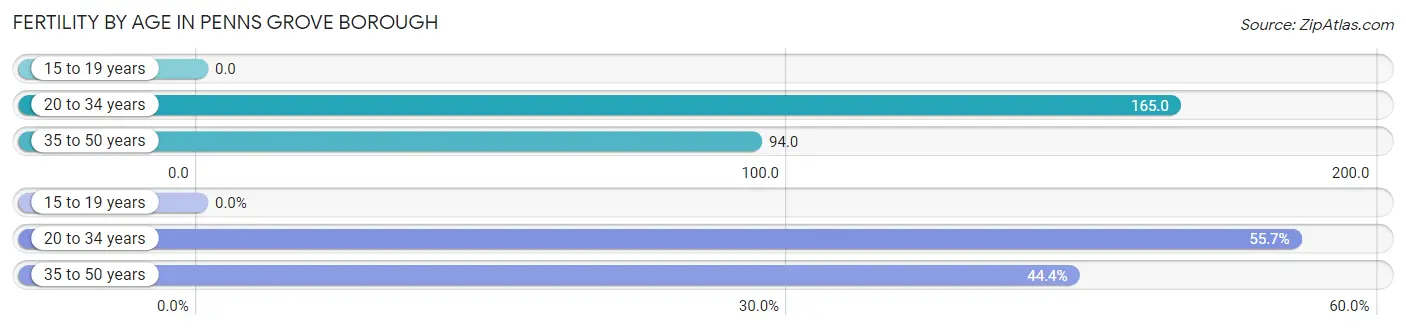
| Age Bracket | Women with Births | Births / 1,000 Women |
| 15 to 19 years | 0 (0.0%) | 0.0 |
| 20 to 34 years | 69 (55.6%) | 165.0 |
| 35 to 50 years | 55 (44.4%) | 94.0 |
| Total | 124 (100.0%) | 96.0 |
Fertility by Age by Marriage Status in Penns Grove borough
15.3% of women with births (124) in Penns Grove borough are married. The highest percentage of unmarried women with births falls into 35 to 50 years age bracket with 100.0% of them unmarried at the time of birth, while the lowest percentage of unmarried women with births belong to 20 to 34 years age bracket with 72.5% of them unmarried.
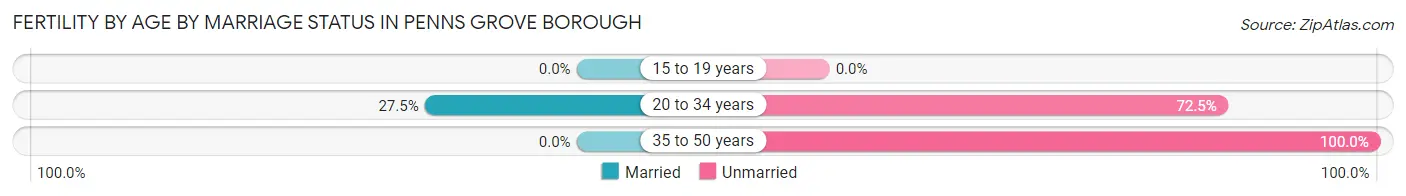
| Age Bracket | Married | Unmarried |
| 15 to 19 years | 0 (0.0%) | 0 (0.0%) |
| 20 to 34 years | 19 (27.5%) | 50 (72.5%) |
| 35 to 50 years | 0 (0.0%) | 55 (100.0%) |
| Total | 19 (15.3%) | 105 (84.7%) |
Fertility by Education in Penns Grove borough
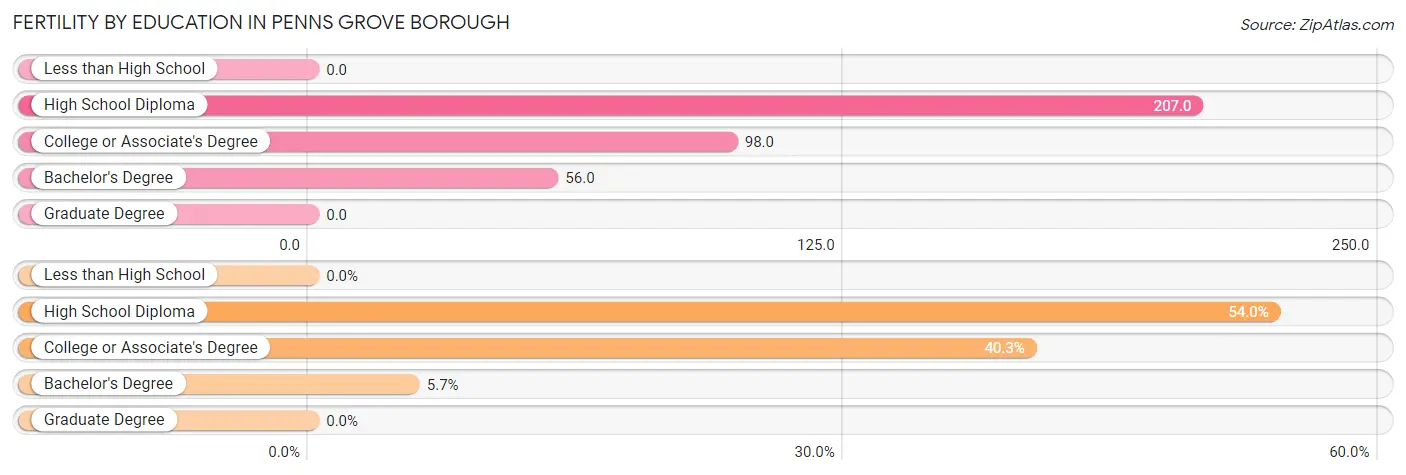
| Educational Attainment | Women with Births | Births / 1,000 Women |
| Less than High School | 0 (0.0%) | 0.0 |
| High School Diploma | 67 (54.0%) | 207.0 |
| College or Associate's Degree | 50 (40.3%) | 98.0 |
| Bachelor's Degree | 7 (5.7%) | 56.0 |
| Graduate Degree | 0 (0.0%) | 0.0 |
| Total | 124 (100.0%) | 96.0 |
Fertility by Education by Marriage Status in Penns Grove borough
84.7% of women with births in Penns Grove borough are unmarried. Women with the educational attainment of high school diploma are most likely to be married with 28.4% of them married at childbirth, while women with the educational attainment of college or associate's degree are least likely to be married with 100.0% of them unmarried at childbirth.
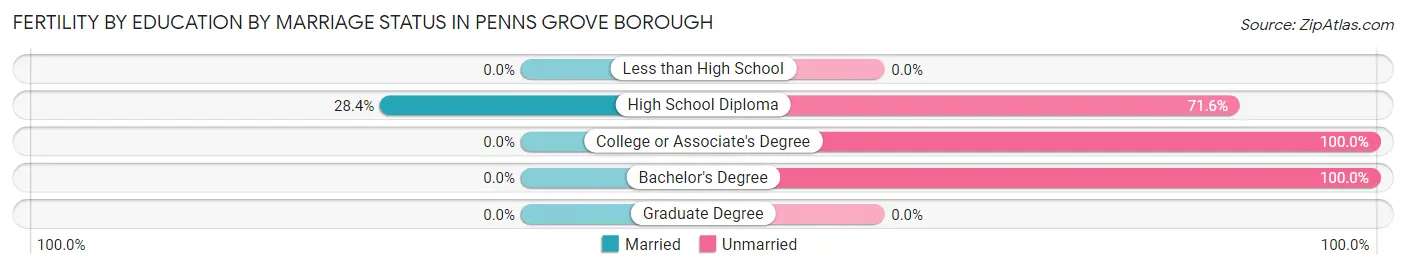
| Educational Attainment | Married | Unmarried |
| Less than High School | 0 (0.0%) | 0 (0.0%) |
| High School Diploma | 19 (28.4%) | 48 (71.6%) |
| College or Associate's Degree | 0 (0.0%) | 50 (100.0%) |
| Bachelor's Degree | 0 (0.0%) | 7 (100.0%) |
| Graduate Degree | 0 (0.0%) | 0 (0.0%) |
| Total | 19 (15.3%) | 105 (84.7%) |
Employment Characteristics in Penns Grove borough
Employment by Class of Employer in Penns Grove borough
Among the 1,308 employed individuals in Penns Grove borough, private company employees (964 | 73.7%), local government employees (128 | 9.8%), and not-for-profit organizations (100 | 7.6%) make up the most common classes of employment.
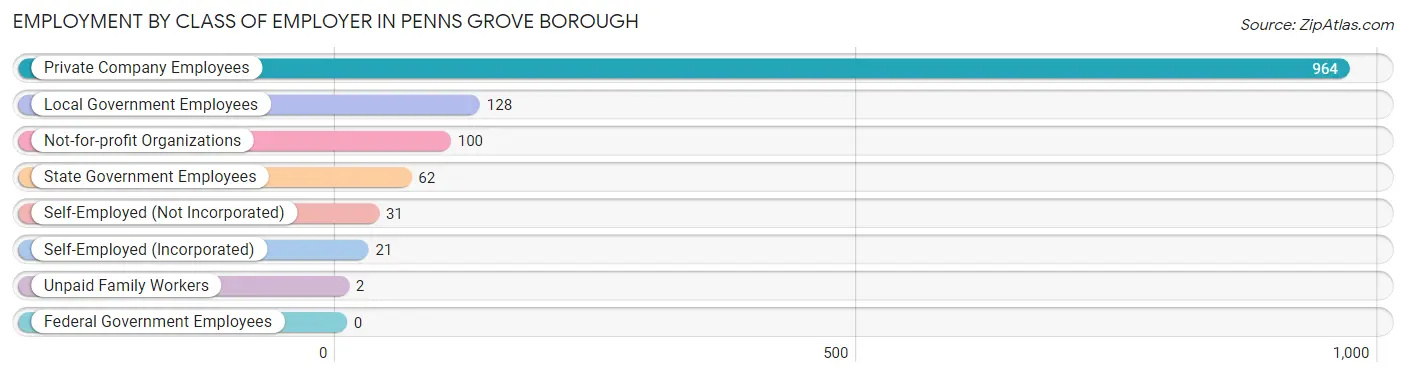
| Employer Class | # Employees | % Employees |
| Private Company Employees | 964 | 73.7% |
| Self-Employed (Incorporated) | 21 | 1.6% |
| Self-Employed (Not Incorporated) | 31 | 2.4% |
| Not-for-profit Organizations | 100 | 7.6% |
| Local Government Employees | 128 | 9.8% |
| State Government Employees | 62 | 4.7% |
| Federal Government Employees | 0 | 0.0% |
| Unpaid Family Workers | 2 | 0.2% |
| Total | 1,308 | 100.0% |
Employment Status by Age in Penns Grove borough
According to the labor force statistics for Penns Grove borough, out of the total population over 16 years of age (3,048), 51.6% or 1,573 individuals are in the labor force, with 15.5% or 244 of them unemployed. The age group with the highest labor force participation rate is 25 to 29 years, with 92.0% or 229 individuals in the labor force. Within the labor force, the 25 to 29 years age range has the highest percentage of unemployed individuals, with 41.5% or 95 of them being unemployed.
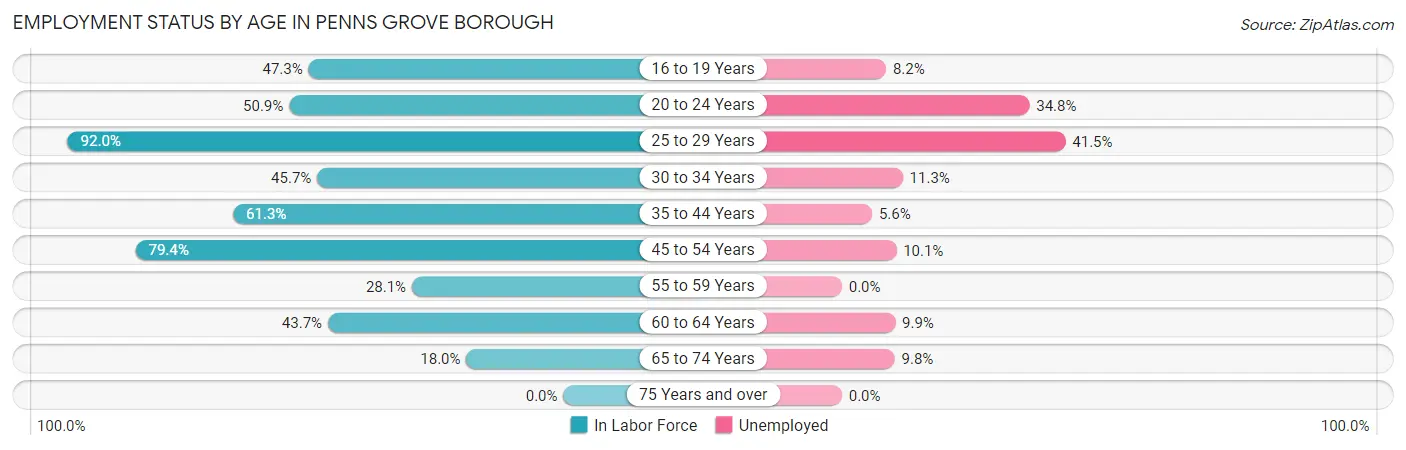
| Age Bracket | In Labor Force | Unemployed |
| 16 to 19 Years | 147 (47.3%) | 12 (8.2%) |
| 20 to 24 Years | 161 (50.9%) | 56 (34.8%) |
| 25 to 29 Years | 229 (92.0%) | 95 (41.5%) |
| 30 to 34 Years | 106 (45.7%) | 12 (11.3%) |
| 35 to 44 Years | 426 (61.3%) | 24 (5.6%) |
| 45 to 54 Years | 258 (79.4%) | 26 (10.1%) |
| 55 to 59 Years | 54 (28.1%) | 0 (0.0%) |
| 60 to 64 Years | 141 (43.7%) | 14 (9.9%) |
| 65 to 74 Years | 51 (18.0%) | 5 (9.8%) |
| 75 Years and over | 0 (0.0%) | 0 (0.0%) |
| Total | 1,573 (51.6%) | 244 (15.5%) |
Employment Status by Educational Attainment in Penns Grove borough
According to labor force statistics for Penns Grove borough, 60.2% of individuals (1,214) out of the total population between 25 and 64 years of age (2,016) are in the labor force, with 14.1% or 171 of them being unemployed. The group with the highest labor force participation rate are those with the educational attainment of bachelor's degree or higher, with 88.5% or 207 individuals in the labor force. Within the labor force, individuals with less than high school education have the highest percentage of unemployment, with 18.6% or 33 of them being unemployed.
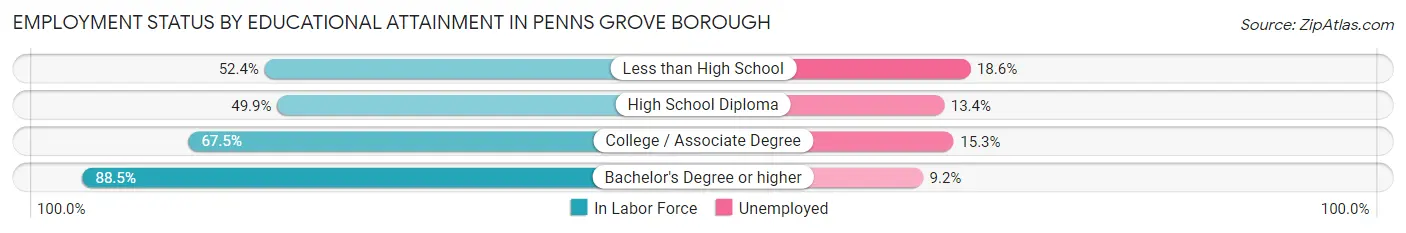
| Educational Attainment | In Labor Force | Unemployed |
| Less than High School | 177 (52.4%) | 63 (18.6%) |
| High School Diploma | 411 (49.9%) | 110 (13.4%) |
| College / Associate Degree | 419 (67.5%) | 95 (15.3%) |
| Bachelor's Degree or higher | 207 (88.5%) | 22 (9.2%) |
| Total | 1,214 (60.2%) | 284 (14.1%) |
Employment Occupations by Sex in Penns Grove borough
Management, Business, Science and Arts Occupations
The most common Management, Business, Science and Arts occupations in Penns Grove borough are Community & Social Service (200 | 15.0%), Education Instruction & Library (163 | 12.3%), Management (61 | 4.6%), Health Diagnosing & Treating (48 | 3.6%), and Education, Arts & Media (20 | 1.5%).
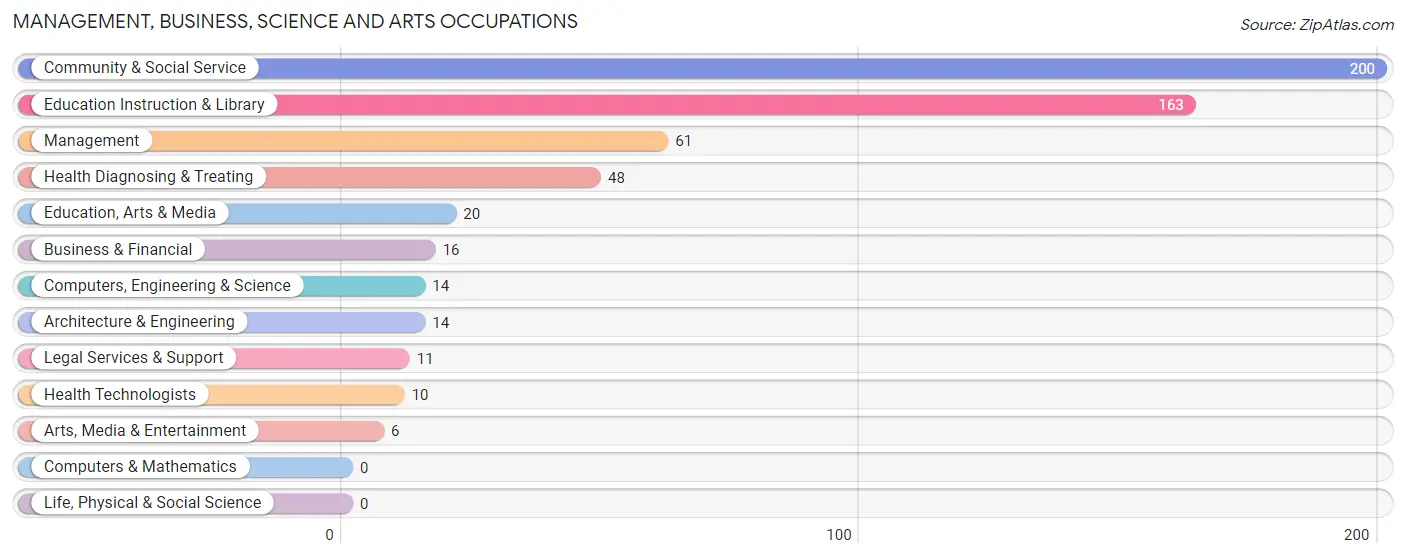
Management, Business, Science and Arts Occupations by Sex
Within the Management, Business, Science and Arts occupations in Penns Grove borough, the most male-oriented occupations are Education, Arts & Media (100.0%), Legal Services & Support (100.0%), and Management (65.6%), while the most female-oriented occupations are Computers, Engineering & Science (100.0%), Architecture & Engineering (100.0%), and Arts, Media & Entertainment (100.0%).
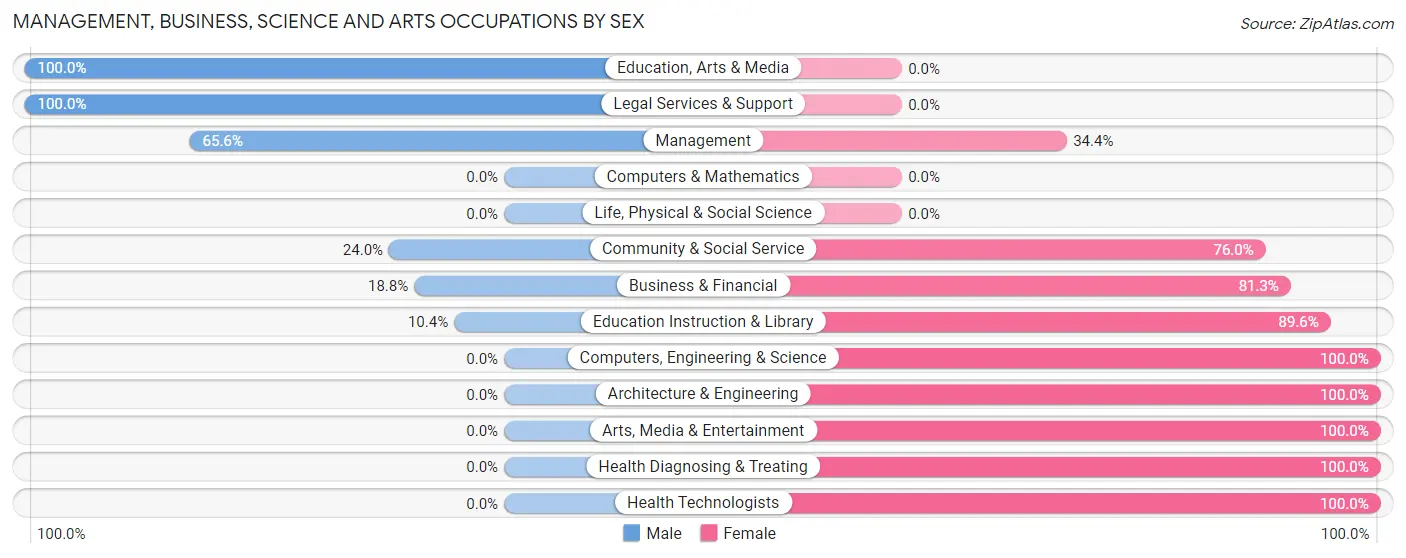
| Occupation | Male | Female |
| Management | 40 (65.6%) | 21 (34.4%) |
| Business & Financial | 3 (18.8%) | 13 (81.2%) |
| Computers, Engineering & Science | 0 (0.0%) | 14 (100.0%) |
| Computers & Mathematics | 0 (0.0%) | 0 (0.0%) |
| Architecture & Engineering | 0 (0.0%) | 14 (100.0%) |
| Life, Physical & Social Science | 0 (0.0%) | 0 (0.0%) |
| Community & Social Service | 48 (24.0%) | 152 (76.0%) |
| Education, Arts & Media | 20 (100.0%) | 0 (0.0%) |
| Legal Services & Support | 11 (100.0%) | 0 (0.0%) |
| Education Instruction & Library | 17 (10.4%) | 146 (89.6%) |
| Arts, Media & Entertainment | 0 (0.0%) | 6 (100.0%) |
| Health Diagnosing & Treating | 0 (0.0%) | 48 (100.0%) |
| Health Technologists | 0 (0.0%) | 10 (100.0%) |
| Total (Category) | 91 (26.8%) | 248 (73.2%) |
| Total (Overall) | 514 (38.7%) | 815 (61.3%) |
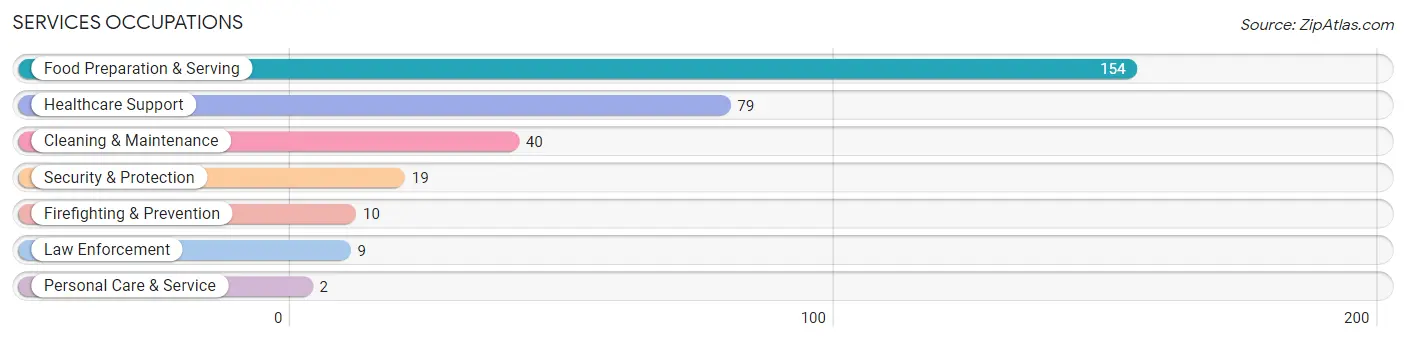
Services Occupations
The most common Services occupations in Penns Grove borough are Food Preparation & Serving (154 | 11.6%), Healthcare Support (79 | 5.9%), Cleaning & Maintenance (40 | 3.0%), Security & Protection (19 | 1.4%), and Firefighting & Prevention (10 | 0.7%).
Services Occupations by Sex
Within the Services occupations in Penns Grove borough, the most male-oriented occupations are Security & Protection (100.0%), Firefighting & Prevention (100.0%), and Law Enforcement (100.0%), while the most female-oriented occupations are Healthcare Support (100.0%), Personal Care & Service (100.0%), and Food Preparation & Serving (89.6%).
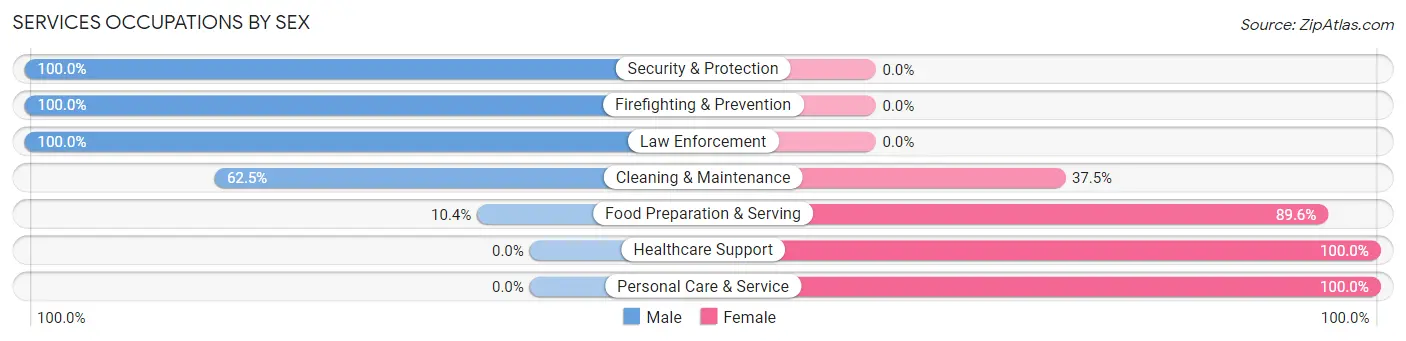
| Occupation | Male | Female |
| Healthcare Support | 0 (0.0%) | 79 (100.0%) |
| Security & Protection | 19 (100.0%) | 0 (0.0%) |
| Firefighting & Prevention | 10 (100.0%) | 0 (0.0%) |
| Law Enforcement | 9 (100.0%) | 0 (0.0%) |
| Food Preparation & Serving | 16 (10.4%) | 138 (89.6%) |
| Cleaning & Maintenance | 25 (62.5%) | 15 (37.5%) |
| Personal Care & Service | 0 (0.0%) | 2 (100.0%) |
| Total (Category) | 60 (20.4%) | 234 (79.6%) |
| Total (Overall) | 514 (38.7%) | 815 (61.3%) |
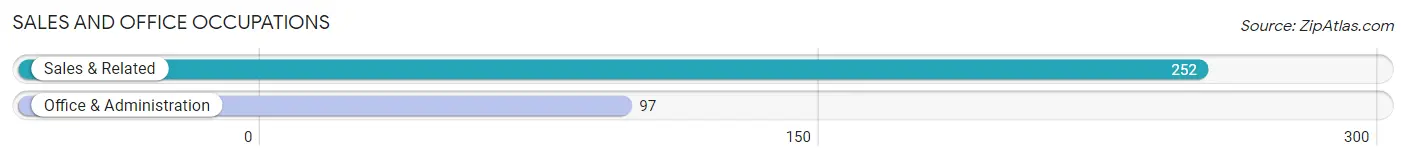
Sales and Office Occupations
The most common Sales and Office occupations in Penns Grove borough are Sales & Related (252 | 19.0%), and Office & Administration (97 | 7.3%).
Sales and Office Occupations by Sex
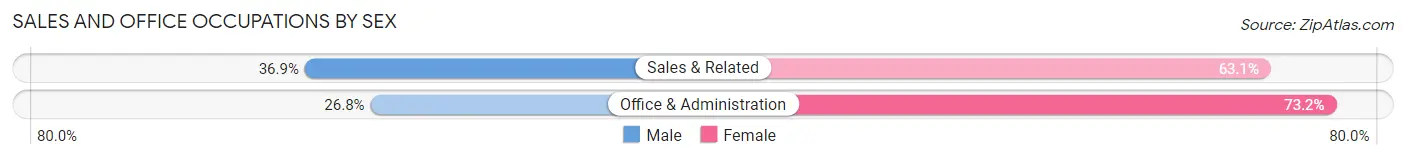
| Occupation | Male | Female |
| Sales & Related | 93 (36.9%) | 159 (63.1%) |
| Office & Administration | 26 (26.8%) | 71 (73.2%) |
| Total (Category) | 119 (34.1%) | 230 (65.9%) |
| Total (Overall) | 514 (38.7%) | 815 (61.3%) |
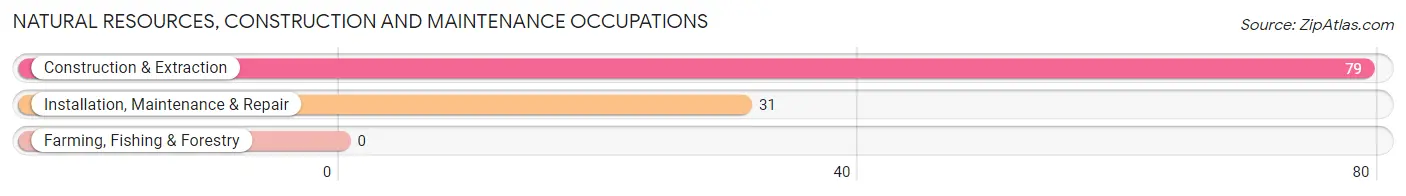
Natural Resources, Construction and Maintenance Occupations
The most common Natural Resources, Construction and Maintenance occupations in Penns Grove borough are Construction & Extraction (79 | 5.9%), and Installation, Maintenance & Repair (31 | 2.3%).
Natural Resources, Construction and Maintenance Occupations by Sex
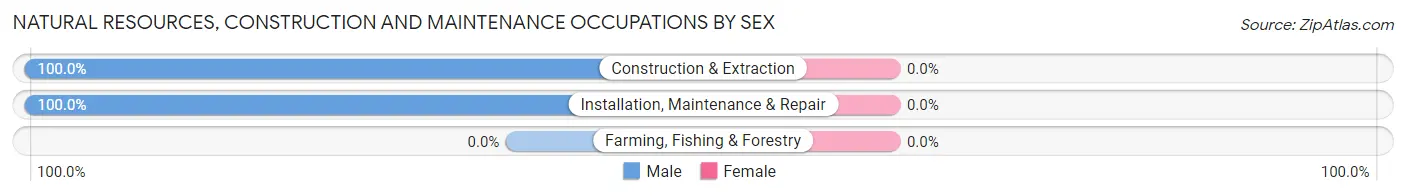
| Occupation | Male | Female |
| Farming, Fishing & Forestry | 0 (0.0%) | 0 (0.0%) |
| Construction & Extraction | 79 (100.0%) | 0 (0.0%) |
| Installation, Maintenance & Repair | 31 (100.0%) | 0 (0.0%) |
| Total (Category) | 110 (100.0%) | 0 (0.0%) |
| Total (Overall) | 514 (38.7%) | 815 (61.3%) |
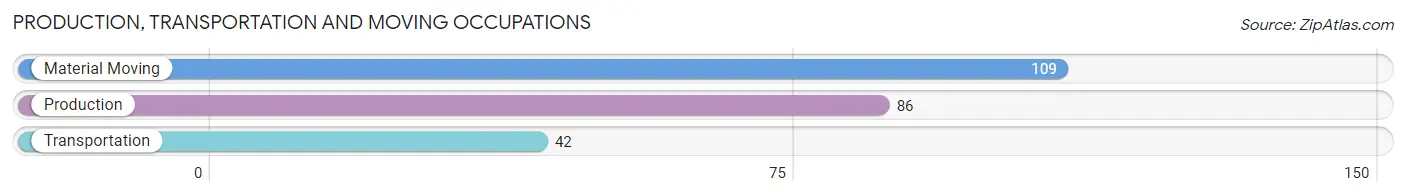
Production, Transportation and Moving Occupations
The most common Production, Transportation and Moving occupations in Penns Grove borough are Material Moving (109 | 8.2%), Production (86 | 6.5%), and Transportation (42 | 3.2%).
Production, Transportation and Moving Occupations by Sex
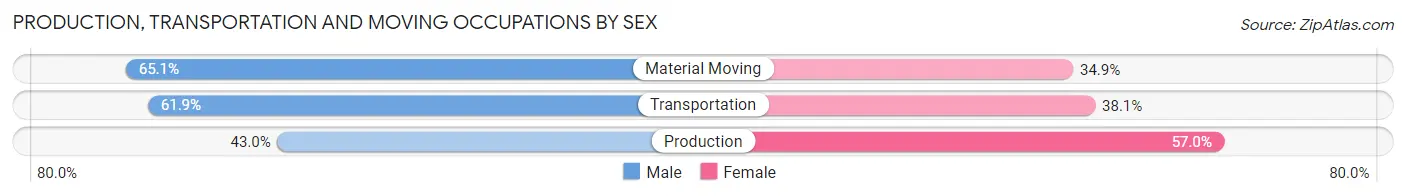
| Occupation | Male | Female |
| Production | 37 (43.0%) | 49 (57.0%) |
| Transportation | 26 (61.9%) | 16 (38.1%) |
| Material Moving | 71 (65.1%) | 38 (34.9%) |
| Total (Category) | 134 (56.5%) | 103 (43.5%) |
| Total (Overall) | 514 (38.7%) | 815 (61.3%) |
Employment Industries by Sex in Penns Grove borough
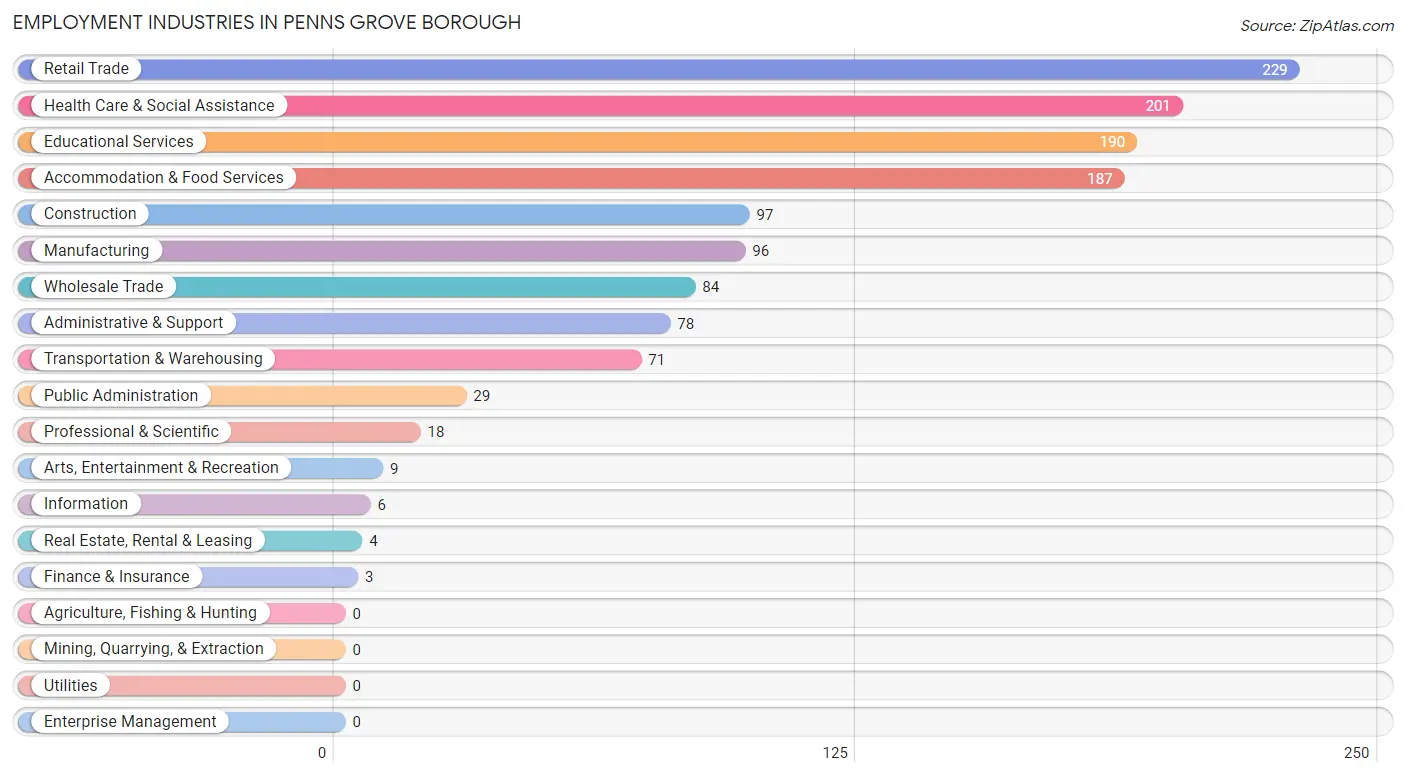
Employment Industries in Penns Grove borough
The major employment industries in Penns Grove borough include Retail Trade (229 | 17.2%), Health Care & Social Assistance (201 | 15.1%), Educational Services (190 | 14.3%), Accommodation & Food Services (187 | 14.1%), and Construction (97 | 7.3%).
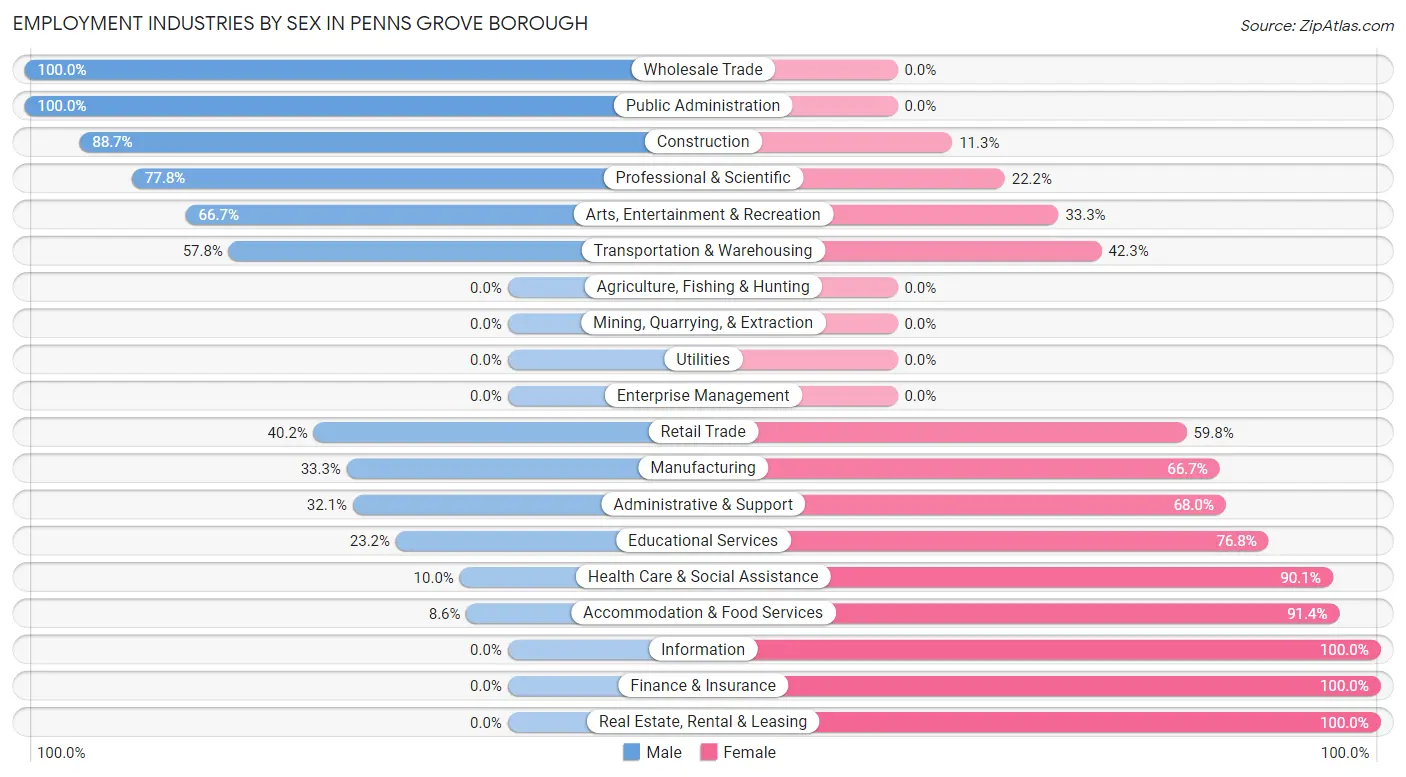
Employment Industries by Sex in Penns Grove borough
The Penns Grove borough industries that see more men than women are Wholesale Trade (100.0%), Public Administration (100.0%), and Construction (88.7%), whereas the industries that tend to have a higher number of women are Information (100.0%), Finance & Insurance (100.0%), and Real Estate, Rental & Leasing (100.0%).
| Industry | Male | Female |
| Agriculture, Fishing & Hunting | 0 (0.0%) | 0 (0.0%) |
| Mining, Quarrying, & Extraction | 0 (0.0%) | 0 (0.0%) |
| Construction | 86 (88.7%) | 11 (11.3%) |
| Manufacturing | 32 (33.3%) | 64 (66.7%) |
| Wholesale Trade | 84 (100.0%) | 0 (0.0%) |
| Retail Trade | 92 (40.2%) | 137 (59.8%) |
| Transportation & Warehousing | 41 (57.8%) | 30 (42.2%) |
| Utilities | 0 (0.0%) | 0 (0.0%) |
| Information | 0 (0.0%) | 6 (100.0%) |
| Finance & Insurance | 0 (0.0%) | 3 (100.0%) |
| Real Estate, Rental & Leasing | 0 (0.0%) | 4 (100.0%) |
| Professional & Scientific | 14 (77.8%) | 4 (22.2%) |
| Enterprise Management | 0 (0.0%) | 0 (0.0%) |
| Administrative & Support | 25 (32.1%) | 53 (67.9%) |
| Educational Services | 44 (23.2%) | 146 (76.8%) |
| Health Care & Social Assistance | 20 (10.0%) | 181 (90.0%) |
| Arts, Entertainment & Recreation | 6 (66.7%) | 3 (33.3%) |
| Accommodation & Food Services | 16 (8.6%) | 171 (91.4%) |
| Public Administration | 29 (100.0%) | 0 (0.0%) |
| Total | 514 (38.7%) | 815 (61.3%) |
Education in Penns Grove borough
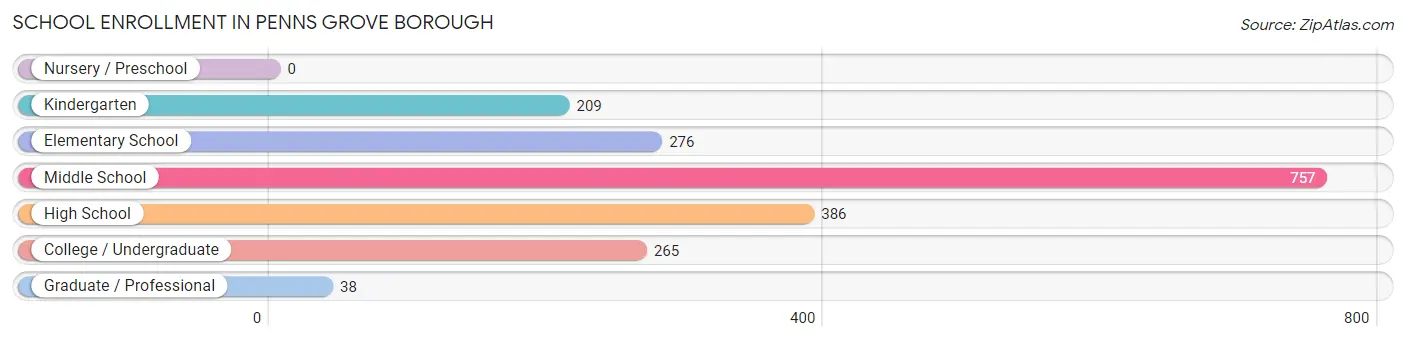
School Enrollment in Penns Grove borough
The most common levels of schooling among the 1,931 students in Penns Grove borough are middle school (757 | 39.2%), high school (386 | 20.0%), and elementary school (276 | 14.3%).
| School Level | # Students | % Students |
| Nursery / Preschool | 0 | 0.0% |
| Kindergarten | 209 | 10.8% |
| Elementary School | 276 | 14.3% |
| Middle School | 757 | 39.2% |
| High School | 386 | 20.0% |
| College / Undergraduate | 265 | 13.7% |
| Graduate / Professional | 38 | 2.0% |
| Total | 1,931 | 100.0% |
School Enrollment by Age by Funding Source in Penns Grove borough
Out of a total of 1,931 students who are enrolled in schools in Penns Grove borough, 60 (3.1%) attend a private institution, while the remaining 1,871 (96.9%) are enrolled in public schools. The age group of 18 to 19 year olds has the highest likelihood of being enrolled in private schools, with 21 (18.1% in the age bracket) enrolled. Conversely, the age group of 3 to 4 year olds has the lowest likelihood of being enrolled in a private school, with 19 (100.0% in the age bracket) attending a public institution.
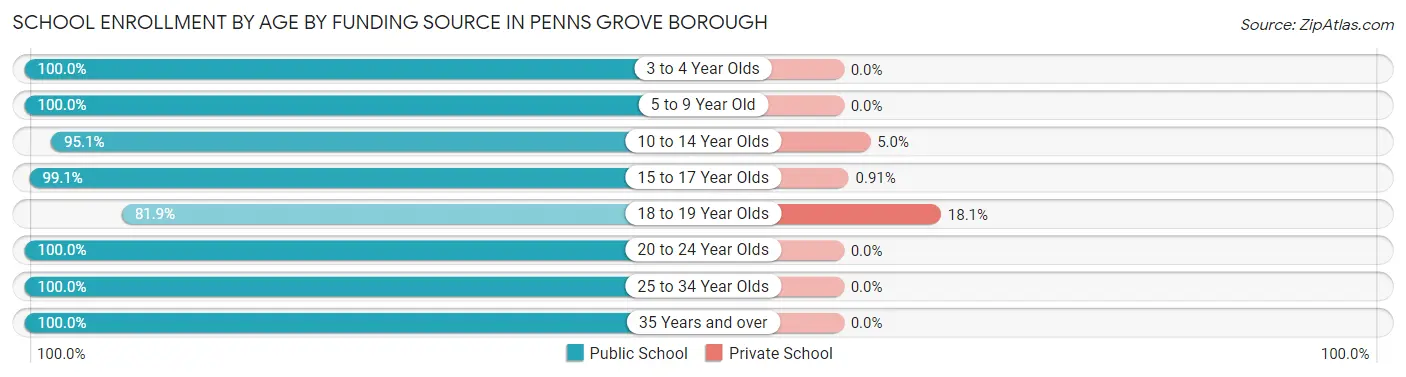
| Age Bracket | Public School | Private School |
| 3 to 4 Year Olds | 19 (100.0%) | 0 (0.0%) |
| 5 to 9 Year Old | 493 (100.0%) | 0 (0.0%) |
| 10 to 14 Year Olds | 692 (95.1%) | 36 (5.0%) |
| 15 to 17 Year Olds | 328 (99.1%) | 3 (0.9%) |
| 18 to 19 Year Olds | 95 (81.9%) | 21 (18.1%) |
| 20 to 24 Year Olds | 168 (100.0%) | 0 (0.0%) |
| 25 to 34 Year Olds | 29 (100.0%) | 0 (0.0%) |
| 35 Years and over | 47 (100.0%) | 0 (0.0%) |
| Total | 1,871 (96.9%) | 60 (3.1%) |
Educational Attainment by Field of Study in Penns Grove borough
Business (124 | 31.7%), education (48 | 12.3%), bio, nature & agricultural (37 | 9.5%), social sciences (32 | 8.2%), and communications (32 | 8.2%) are the most common fields of study among 391 individuals in Penns Grove borough who have obtained a bachelor's degree or higher.
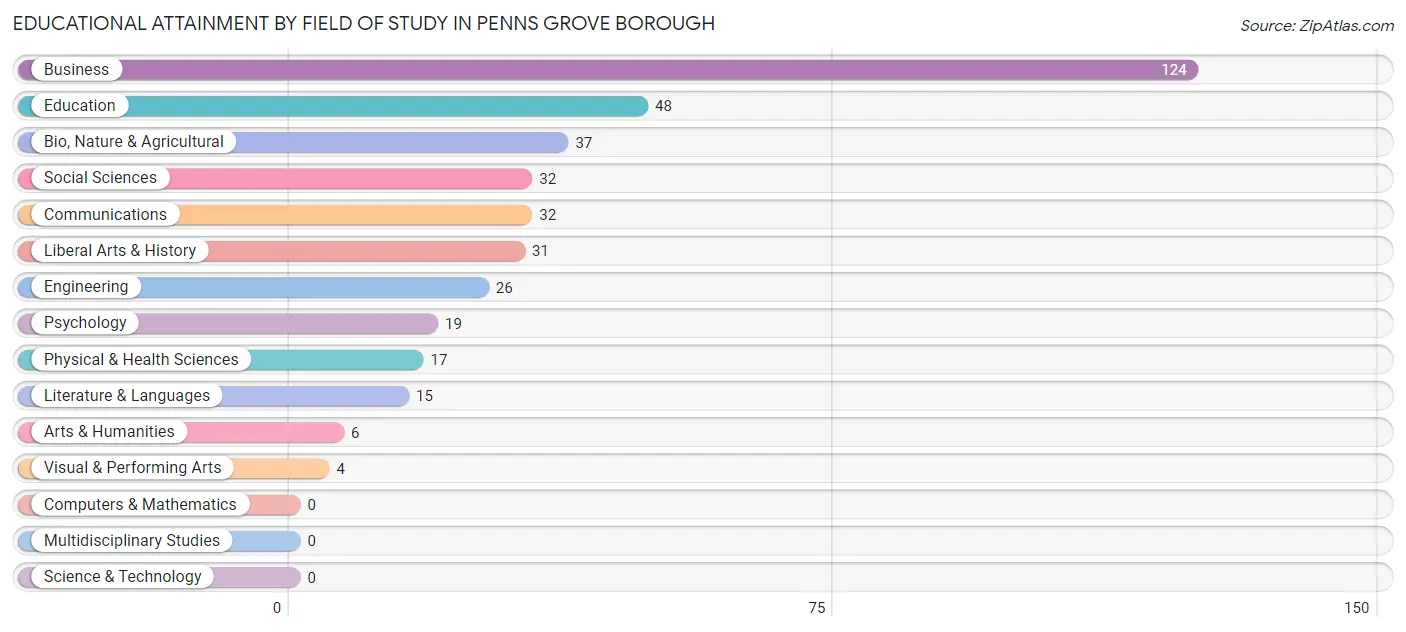
| Field of Study | # Graduates | % Graduates |
| Computers & Mathematics | 0 | 0.0% |
| Bio, Nature & Agricultural | 37 | 9.5% |
| Physical & Health Sciences | 17 | 4.3% |
| Psychology | 19 | 4.9% |
| Social Sciences | 32 | 8.2% |
| Engineering | 26 | 6.7% |
| Multidisciplinary Studies | 0 | 0.0% |
| Science & Technology | 0 | 0.0% |
| Business | 124 | 31.7% |
| Education | 48 | 12.3% |
| Literature & Languages | 15 | 3.8% |
| Liberal Arts & History | 31 | 7.9% |
| Visual & Performing Arts | 4 | 1.0% |
| Communications | 32 | 8.2% |
| Arts & Humanities | 6 | 1.5% |
| Total | 391 | 100.0% |
Transportation & Commute in Penns Grove borough
Vehicle Availability by Sex in Penns Grove borough
The most prevalent vehicle ownership categories in Penns Grove borough are males with 2 vehicles (152, accounting for 30.9%) and females with 2 vehicles (334, making up 18.7%).
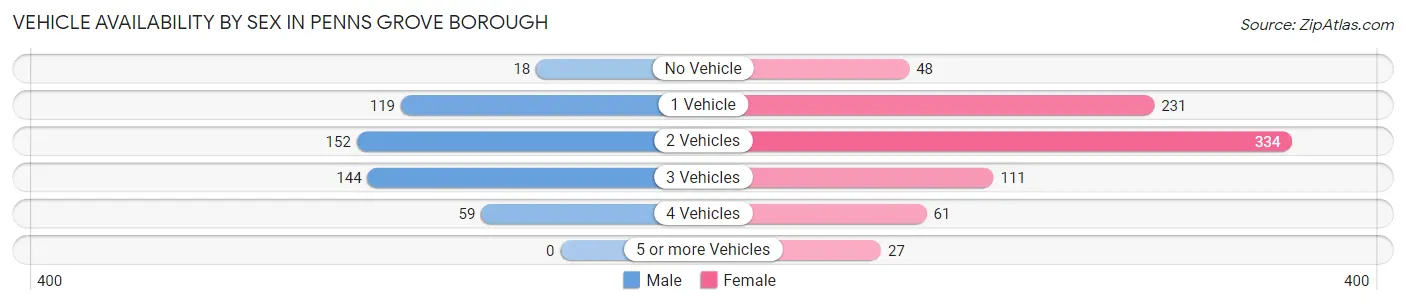
| Vehicles Available | Male | Female |
| No Vehicle | 18 (3.7%) | 48 (5.9%) |
| 1 Vehicle | 119 (24.2%) | 231 (28.4%) |
| 2 Vehicles | 152 (30.9%) | 334 (41.1%) |
| 3 Vehicles | 144 (29.3%) | 111 (13.7%) |
| 4 Vehicles | 59 (12.0%) | 61 (7.5%) |
| 5 or more Vehicles | 0 (0.0%) | 27 (3.3%) |
| Total | 492 (100.0%) | 812 (100.0%) |
Commute Time in Penns Grove borough
The most frequently occuring commute durations in Penns Grove borough are 20 to 24 minutes (291 commuters, 22.6%), 10 to 14 minutes (277 commuters, 21.5%), and 5 to 9 minutes (178 commuters, 13.8%).
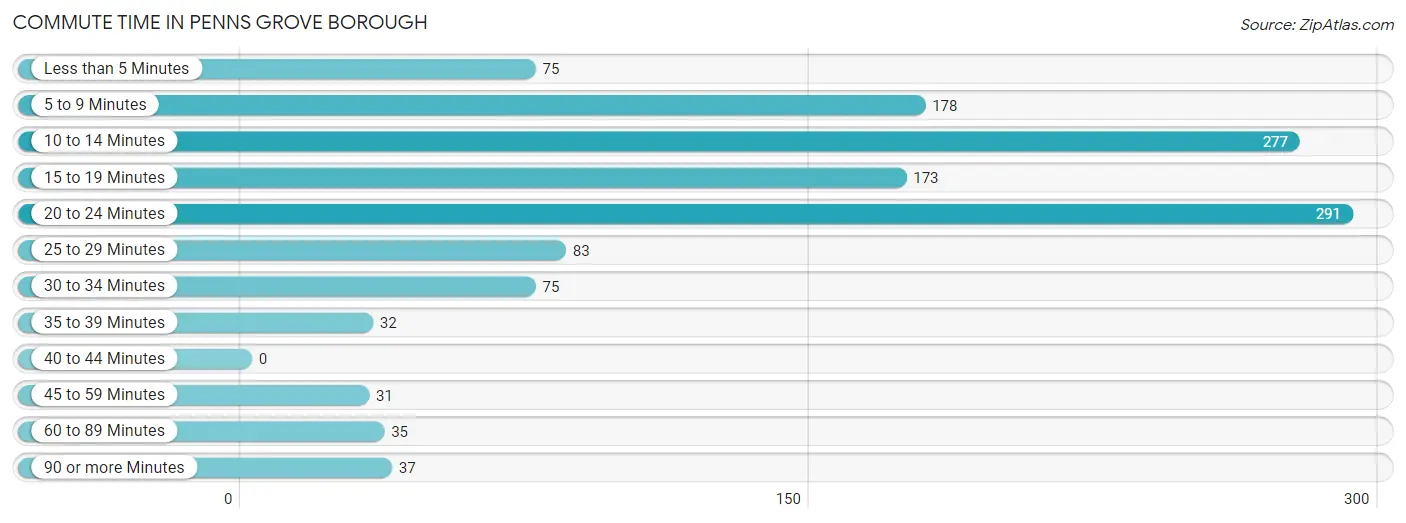
| Commute Time | # Commuters | % Commuters |
| Less than 5 Minutes | 75 | 5.8% |
| 5 to 9 Minutes | 178 | 13.8% |
| 10 to 14 Minutes | 277 | 21.5% |
| 15 to 19 Minutes | 173 | 13.4% |
| 20 to 24 Minutes | 291 | 22.6% |
| 25 to 29 Minutes | 83 | 6.5% |
| 30 to 34 Minutes | 75 | 5.8% |
| 35 to 39 Minutes | 32 | 2.5% |
| 40 to 44 Minutes | 0 | 0.0% |
| 45 to 59 Minutes | 31 | 2.4% |
| 60 to 89 Minutes | 35 | 2.7% |
| 90 or more Minutes | 37 | 2.9% |
Commute Time by Sex in Penns Grove borough
The most common commute times in Penns Grove borough are 10 to 14 minutes (122 commuters, 25.1%) for males and 20 to 24 minutes (239 commuters, 29.8%) for females.
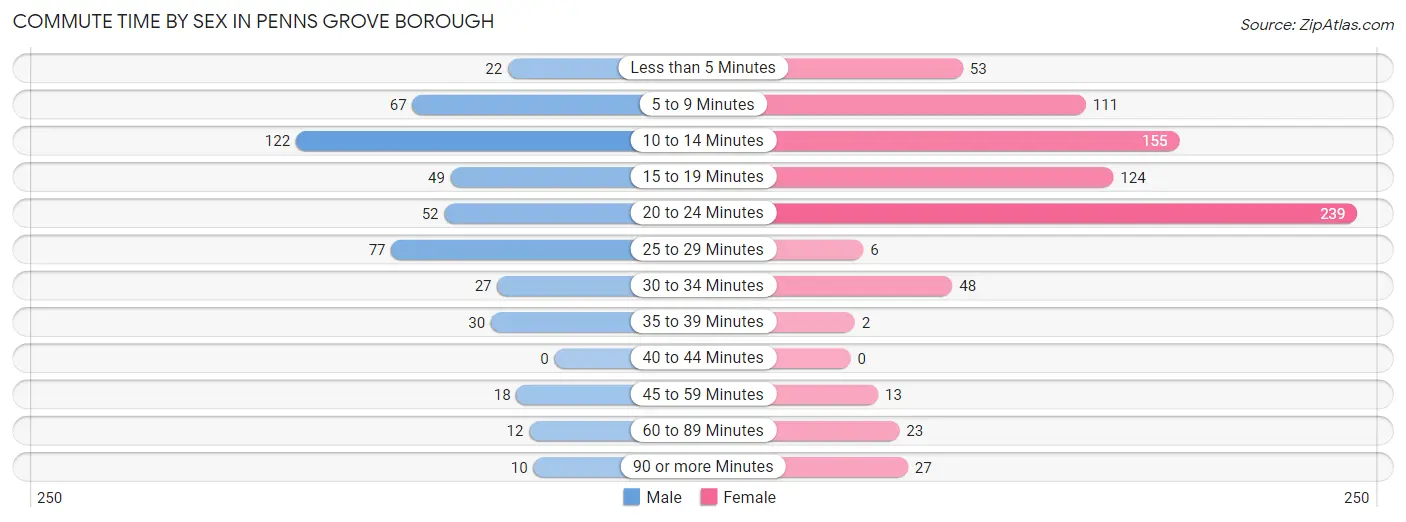
| Commute Time | Male | Female |
| Less than 5 Minutes | 22 (4.5%) | 53 (6.6%) |
| 5 to 9 Minutes | 67 (13.8%) | 111 (13.9%) |
| 10 to 14 Minutes | 122 (25.1%) | 155 (19.4%) |
| 15 to 19 Minutes | 49 (10.1%) | 124 (15.5%) |
| 20 to 24 Minutes | 52 (10.7%) | 239 (29.8%) |
| 25 to 29 Minutes | 77 (15.8%) | 6 (0.7%) |
| 30 to 34 Minutes | 27 (5.6%) | 48 (6.0%) |
| 35 to 39 Minutes | 30 (6.2%) | 2 (0.3%) |
| 40 to 44 Minutes | 0 (0.0%) | 0 (0.0%) |
| 45 to 59 Minutes | 18 (3.7%) | 13 (1.6%) |
| 60 to 89 Minutes | 12 (2.5%) | 23 (2.9%) |
| 90 or more Minutes | 10 (2.1%) | 27 (3.4%) |
Time of Departure to Work by Sex in Penns Grove borough
The most frequent times of departure to work in Penns Grove borough are 6:30 AM to 6:59 AM (86, 17.7%) for males and 7:30 AM to 7:59 AM (234, 29.2%) for females.
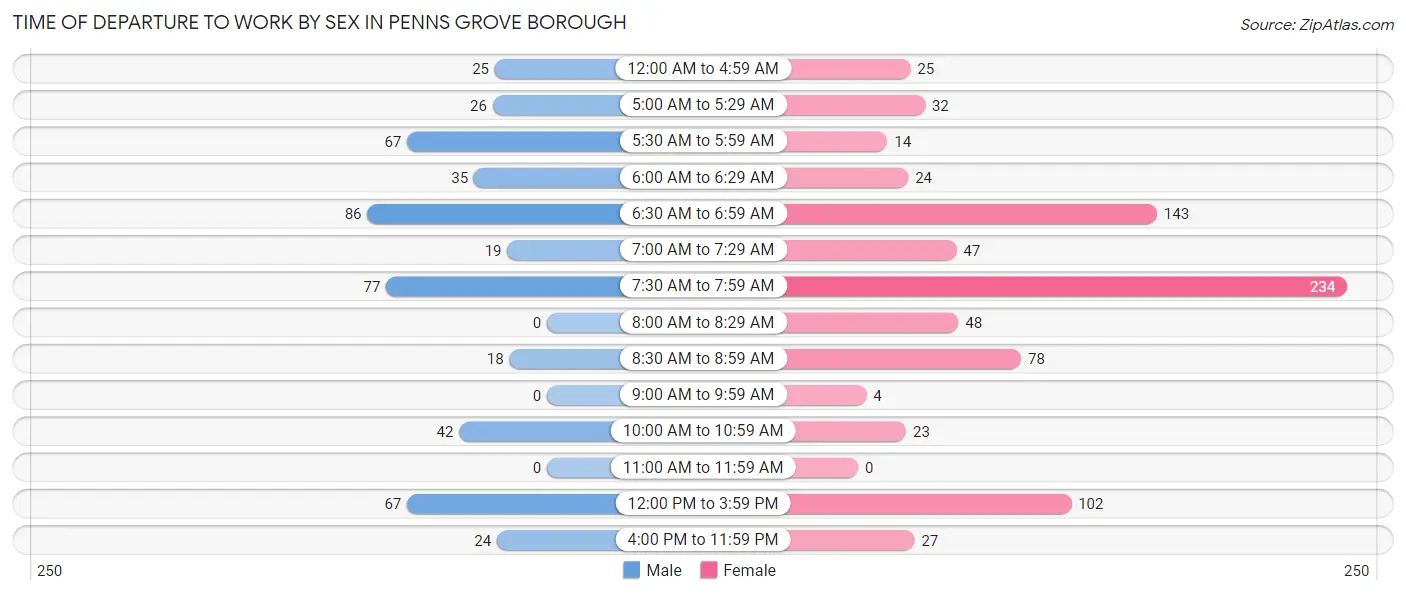
| Time of Departure | Male | Female |
| 12:00 AM to 4:59 AM | 25 (5.1%) | 25 (3.1%) |
| 5:00 AM to 5:29 AM | 26 (5.3%) | 32 (4.0%) |
| 5:30 AM to 5:59 AM | 67 (13.8%) | 14 (1.8%) |
| 6:00 AM to 6:29 AM | 35 (7.2%) | 24 (3.0%) |
| 6:30 AM to 6:59 AM | 86 (17.7%) | 143 (17.8%) |
| 7:00 AM to 7:29 AM | 19 (3.9%) | 47 (5.9%) |
| 7:30 AM to 7:59 AM | 77 (15.8%) | 234 (29.2%) |
| 8:00 AM to 8:29 AM | 0 (0.0%) | 48 (6.0%) |
| 8:30 AM to 8:59 AM | 18 (3.7%) | 78 (9.7%) |
| 9:00 AM to 9:59 AM | 0 (0.0%) | 4 (0.5%) |
| 10:00 AM to 10:59 AM | 42 (8.6%) | 23 (2.9%) |
| 11:00 AM to 11:59 AM | 0 (0.0%) | 0 (0.0%) |
| 12:00 PM to 3:59 PM | 67 (13.8%) | 102 (12.7%) |
| 4:00 PM to 11:59 PM | 24 (4.9%) | 27 (3.4%) |
| Total | 486 (100.0%) | 801 (100.0%) |
Housing Occupancy in Penns Grove borough
Occupancy by Ownership in Penns Grove borough
Of the total 1,604 dwellings in Penns Grove borough, owner-occupied units account for 485 (30.2%), while renter-occupied units make up 1,119 (69.8%).
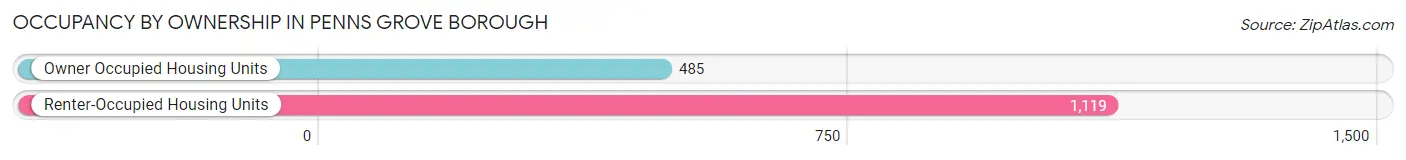
| Occupancy | # Housing Units | % Housing Units |
| Owner Occupied Housing Units | 485 | 30.2% |
| Renter-Occupied Housing Units | 1,119 | 69.8% |
| Total Occupied Housing Units | 1,604 | 100.0% |
Occupancy by Household Size in Penns Grove borough
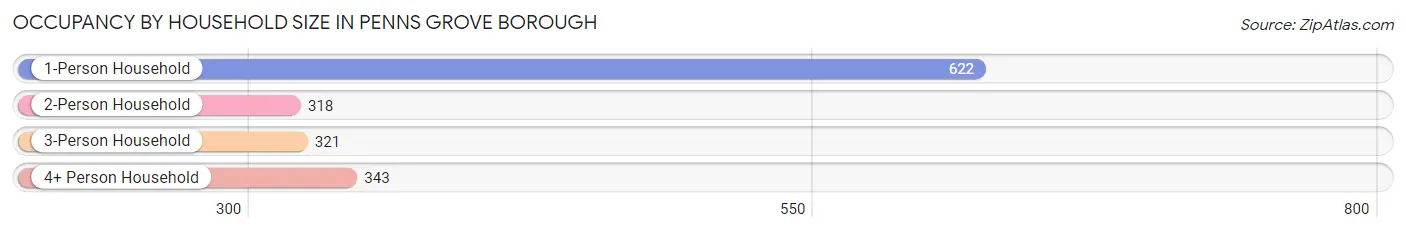
| Household Size | # Housing Units | % Housing Units |
| 1-Person Household | 622 | 38.8% |
| 2-Person Household | 318 | 19.8% |
| 3-Person Household | 321 | 20.0% |
| 4+ Person Household | 343 | 21.4% |
| Total Housing Units | 1,604 | 100.0% |
Occupancy by Ownership by Household Size in Penns Grove borough
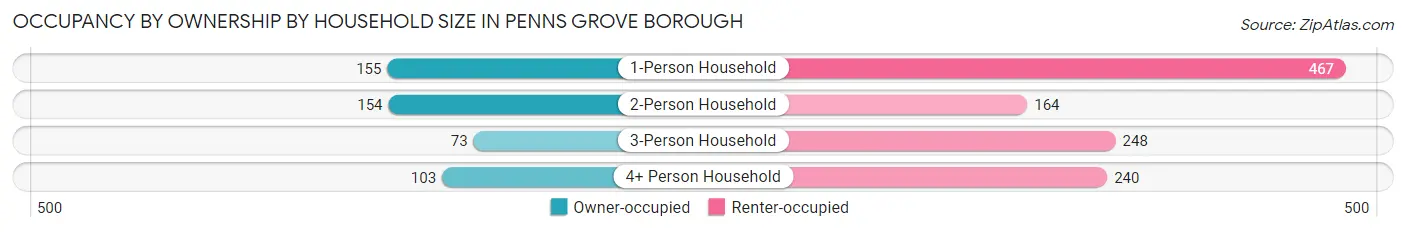
| Household Size | Owner-occupied | Renter-occupied |
| 1-Person Household | 155 (24.9%) | 467 (75.1%) |
| 2-Person Household | 154 (48.4%) | 164 (51.6%) |
| 3-Person Household | 73 (22.7%) | 248 (77.3%) |
| 4+ Person Household | 103 (30.0%) | 240 (70.0%) |
| Total Housing Units | 485 (30.2%) | 1,119 (69.8%) |
Occupancy by Educational Attainment in Penns Grove borough
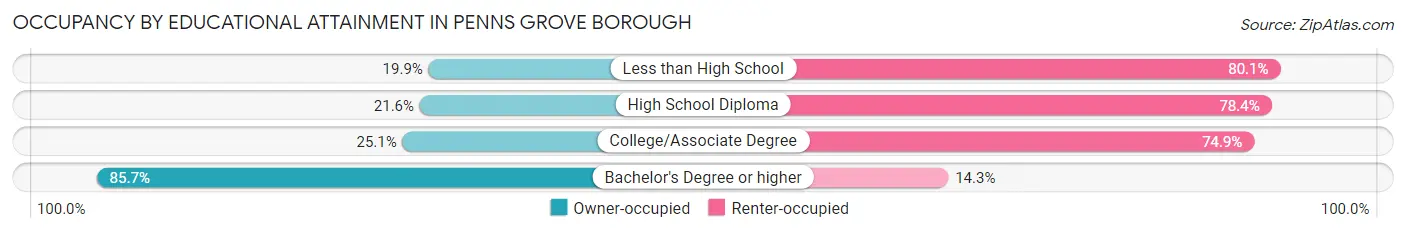
| Household Size | Owner-occupied | Renter-occupied |
| Less than High School | 72 (19.9%) | 290 (80.1%) |
| High School Diploma | 135 (21.6%) | 489 (78.4%) |
| College/Associate Degree | 104 (25.1%) | 311 (74.9%) |
| Bachelor's Degree or higher | 174 (85.7%) | 29 (14.3%) |
Occupancy by Age of Householder in Penns Grove borough
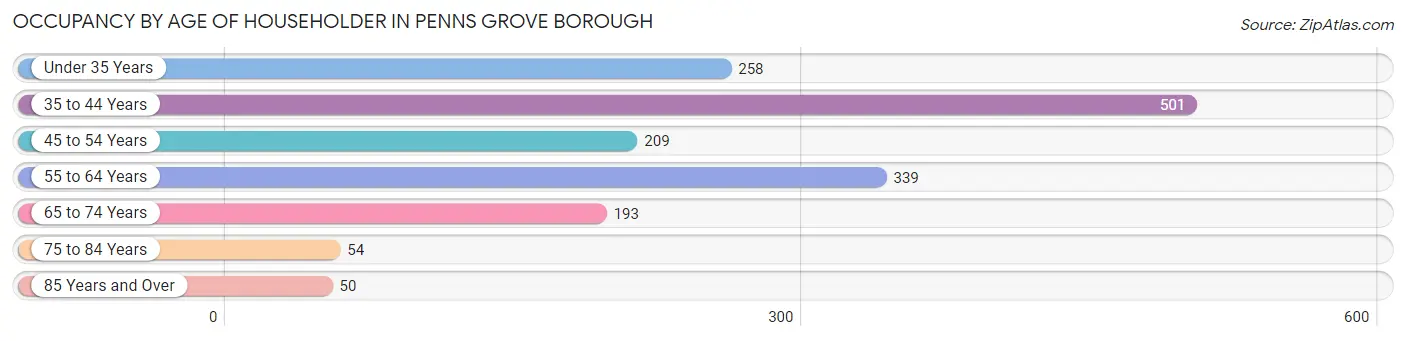
| Age Bracket | # Households | % Households |
| Under 35 Years | 258 | 16.1% |
| 35 to 44 Years | 501 | 31.2% |
| 45 to 54 Years | 209 | 13.0% |
| 55 to 64 Years | 339 | 21.1% |
| 65 to 74 Years | 193 | 12.0% |
| 75 to 84 Years | 54 | 3.4% |
| 85 Years and Over | 50 | 3.1% |
| Total | 1,604 | 100.0% |
Housing Finances in Penns Grove borough
Median Income by Occupancy in Penns Grove borough
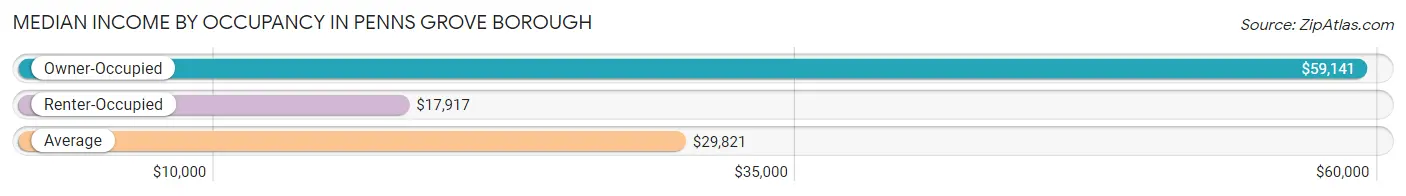
| Occupancy Type | # Households | Median Income |
| Owner-Occupied | 485 (30.2%) | $59,141 |
| Renter-Occupied | 1,119 (69.8%) | $17,917 |
| Average | 1,604 (100.0%) | $29,821 |
Occupancy by Householder Income Bracket in Penns Grove borough
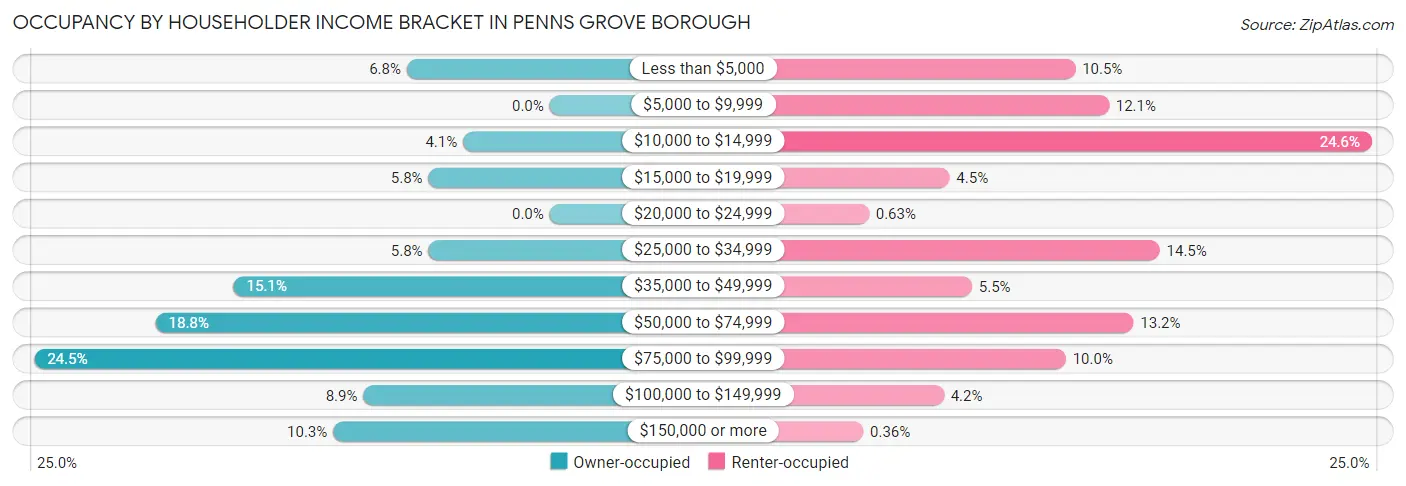
| Income Bracket | Owner-occupied | Renter-occupied |
| Less than $5,000 | 33 (6.8%) | 117 (10.5%) |
| $5,000 to $9,999 | 0 (0.0%) | 135 (12.1%) |
| $10,000 to $14,999 | 20 (4.1%) | 275 (24.6%) |
| $15,000 to $19,999 | 28 (5.8%) | 50 (4.5%) |
| $20,000 to $24,999 | 0 (0.0%) | 7 (0.6%) |
| $25,000 to $34,999 | 28 (5.8%) | 162 (14.5%) |
| $35,000 to $49,999 | 73 (15.0%) | 62 (5.5%) |
| $50,000 to $74,999 | 91 (18.8%) | 148 (13.2%) |
| $75,000 to $99,999 | 119 (24.5%) | 112 (10.0%) |
| $100,000 to $149,999 | 43 (8.9%) | 47 (4.2%) |
| $150,000 or more | 50 (10.3%) | 4 (0.4%) |
| Total | 485 (100.0%) | 1,119 (100.0%) |
Monthly Housing Cost Tiers in Penns Grove borough
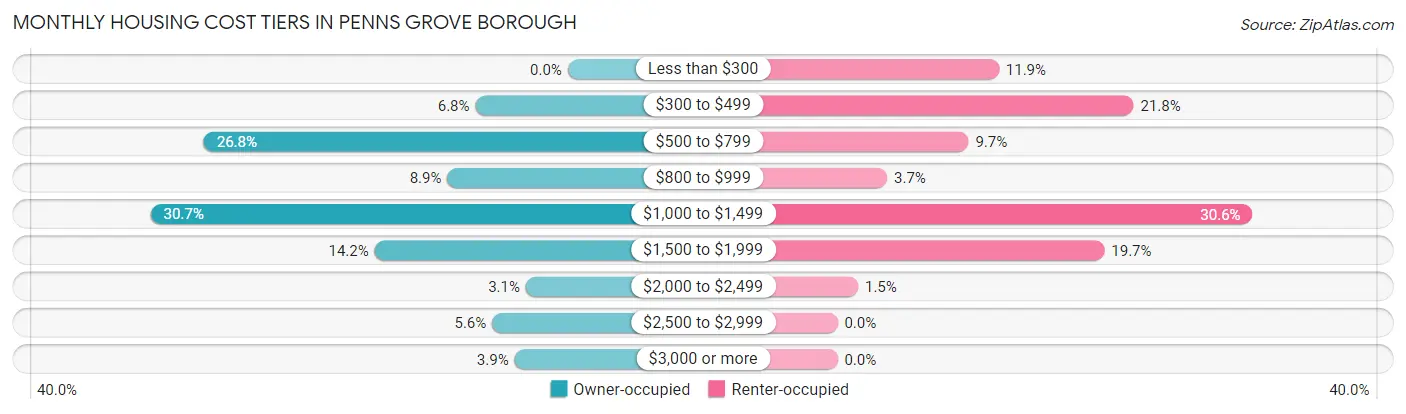
| Monthly Cost | Owner-occupied | Renter-occupied |
| Less than $300 | 0 (0.0%) | 133 (11.9%) |
| $300 to $499 | 33 (6.8%) | 244 (21.8%) |
| $500 to $799 | 130 (26.8%) | 108 (9.7%) |
| $800 to $999 | 43 (8.9%) | 41 (3.7%) |
| $1,000 to $1,499 | 149 (30.7%) | 342 (30.6%) |
| $1,500 to $1,999 | 69 (14.2%) | 220 (19.7%) |
| $2,000 to $2,499 | 15 (3.1%) | 17 (1.5%) |
| $2,500 to $2,999 | 27 (5.6%) | 0 (0.0%) |
| $3,000 or more | 19 (3.9%) | 0 (0.0%) |
| Total | 485 (100.0%) | 1,119 (100.0%) |
Physical Housing Characteristics in Penns Grove borough
Housing Structures in Penns Grove borough
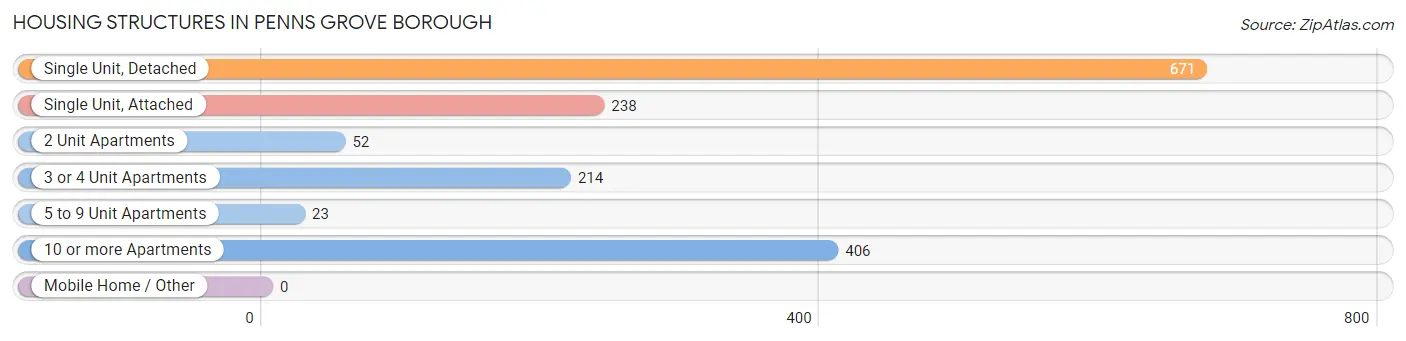
| Structure Type | # Housing Units | % Housing Units |
| Single Unit, Detached | 671 | 41.8% |
| Single Unit, Attached | 238 | 14.8% |
| 2 Unit Apartments | 52 | 3.2% |
| 3 or 4 Unit Apartments | 214 | 13.3% |
| 5 to 9 Unit Apartments | 23 | 1.4% |
| 10 or more Apartments | 406 | 25.3% |
| Mobile Home / Other | 0 | 0.0% |
| Total | 1,604 | 100.0% |
Housing Structures by Occupancy in Penns Grove borough
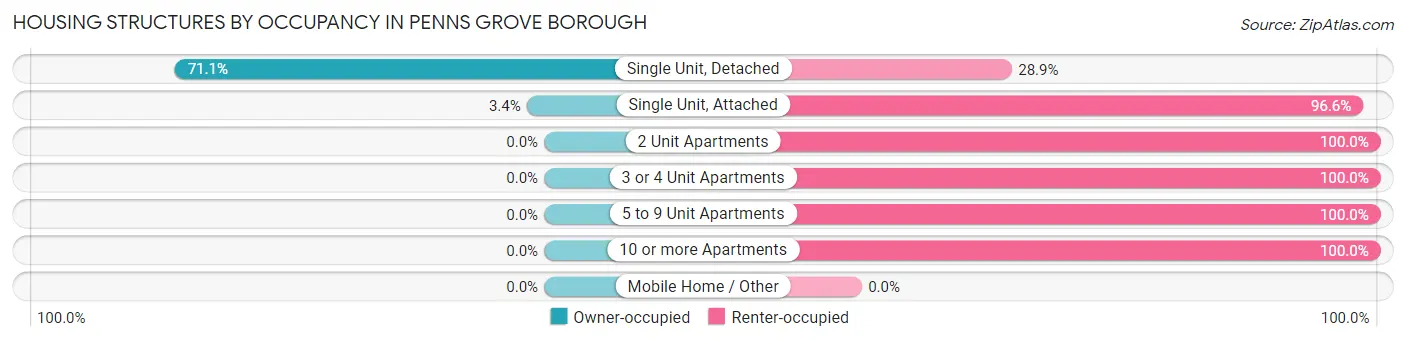
| Structure Type | Owner-occupied | Renter-occupied |
| Single Unit, Detached | 477 (71.1%) | 194 (28.9%) |
| Single Unit, Attached | 8 (3.4%) | 230 (96.6%) |
| 2 Unit Apartments | 0 (0.0%) | 52 (100.0%) |
| 3 or 4 Unit Apartments | 0 (0.0%) | 214 (100.0%) |
| 5 to 9 Unit Apartments | 0 (0.0%) | 23 (100.0%) |
| 10 or more Apartments | 0 (0.0%) | 406 (100.0%) |
| Mobile Home / Other | 0 (0.0%) | 0 (0.0%) |
| Total | 485 (30.2%) | 1,119 (69.8%) |
Housing Structures by Number of Rooms in Penns Grove borough
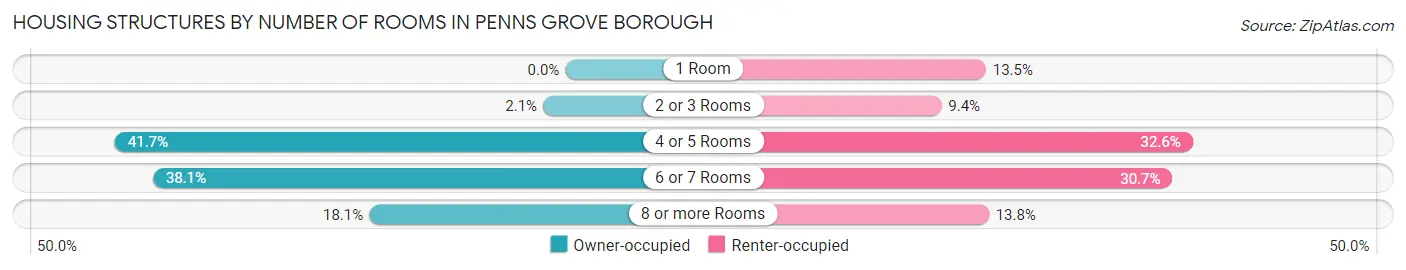
| Number of Rooms | Owner-occupied | Renter-occupied |
| 1 Room | 0 (0.0%) | 151 (13.5%) |
| 2 or 3 Rooms | 10 (2.1%) | 105 (9.4%) |
| 4 or 5 Rooms | 202 (41.6%) | 365 (32.6%) |
| 6 or 7 Rooms | 185 (38.1%) | 344 (30.7%) |
| 8 or more Rooms | 88 (18.1%) | 154 (13.8%) |
| Total | 485 (100.0%) | 1,119 (100.0%) |
Housing Structure by Heating Type in Penns Grove borough
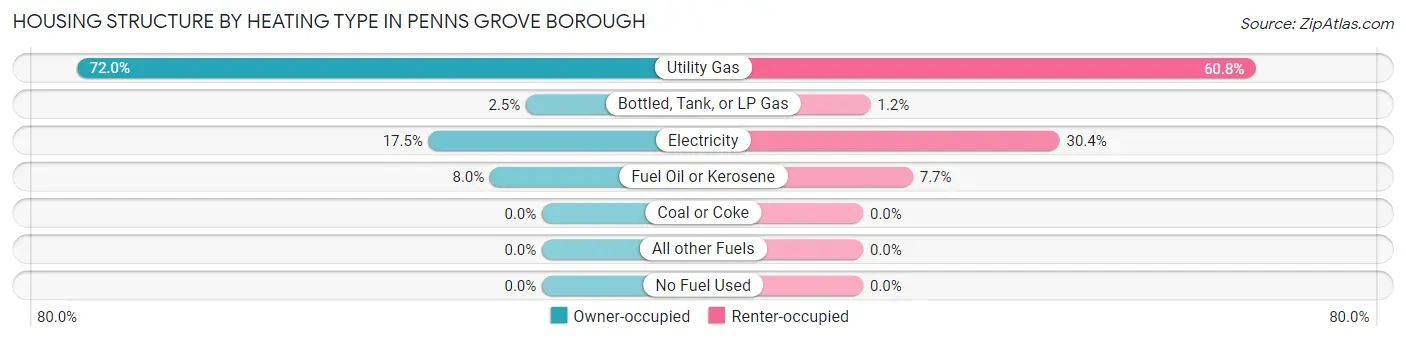
| Heating Type | Owner-occupied | Renter-occupied |
| Utility Gas | 349 (72.0%) | 680 (60.8%) |
| Bottled, Tank, or LP Gas | 12 (2.5%) | 13 (1.2%) |
| Electricity | 85 (17.5%) | 340 (30.4%) |
| Fuel Oil or Kerosene | 39 (8.0%) | 86 (7.7%) |
| Coal or Coke | 0 (0.0%) | 0 (0.0%) |
| All other Fuels | 0 (0.0%) | 0 (0.0%) |
| No Fuel Used | 0 (0.0%) | 0 (0.0%) |
| Total | 485 (100.0%) | 1,119 (100.0%) |
Household Vehicle Usage in Penns Grove borough
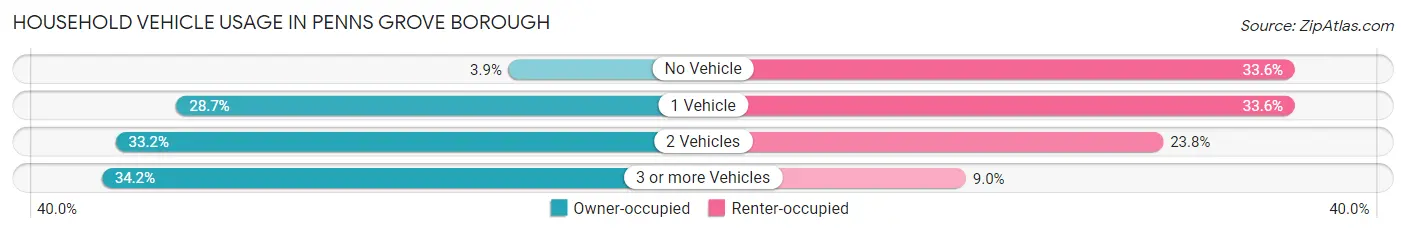
| Vehicles per Household | Owner-occupied | Renter-occupied |
| No Vehicle | 19 (3.9%) | 376 (33.6%) |
| 1 Vehicle | 139 (28.7%) | 376 (33.6%) |
| 2 Vehicles | 161 (33.2%) | 266 (23.8%) |
| 3 or more Vehicles | 166 (34.2%) | 101 (9.0%) |
| Total | 485 (100.0%) | 1,119 (100.0%) |
Real Estate & Mortgages in Penns Grove borough
Real Estate and Mortgage Overview in Penns Grove borough
| Characteristic | Without Mortgage | With Mortgage |
| Housing Units | 238 | 247 |
| Median Property Value | $151,200 | $140,900 |
| Median Household Income | $57,656 | $41 |
| Monthly Housing Costs | $704 | $19 |
| Real Estate Taxes | $4,347 | $0 |
Property Value by Mortgage Status in Penns Grove borough
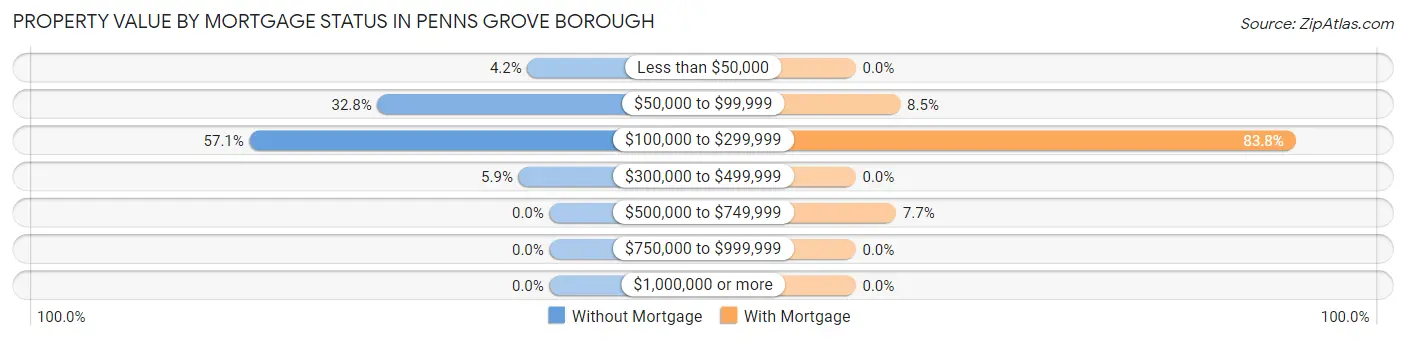
| Property Value | Without Mortgage | With Mortgage |
| Less than $50,000 | 10 (4.2%) | 0 (0.0%) |
| $50,000 to $99,999 | 78 (32.8%) | 21 (8.5%) |
| $100,000 to $299,999 | 136 (57.1%) | 207 (83.8%) |
| $300,000 to $499,999 | 14 (5.9%) | 0 (0.0%) |
| $500,000 to $749,999 | 0 (0.0%) | 19 (7.7%) |
| $750,000 to $999,999 | 0 (0.0%) | 0 (0.0%) |
| $1,000,000 or more | 0 (0.0%) | 0 (0.0%) |
| Total | 238 (100.0%) | 247 (100.0%) |
Household Income by Mortgage Status in Penns Grove borough
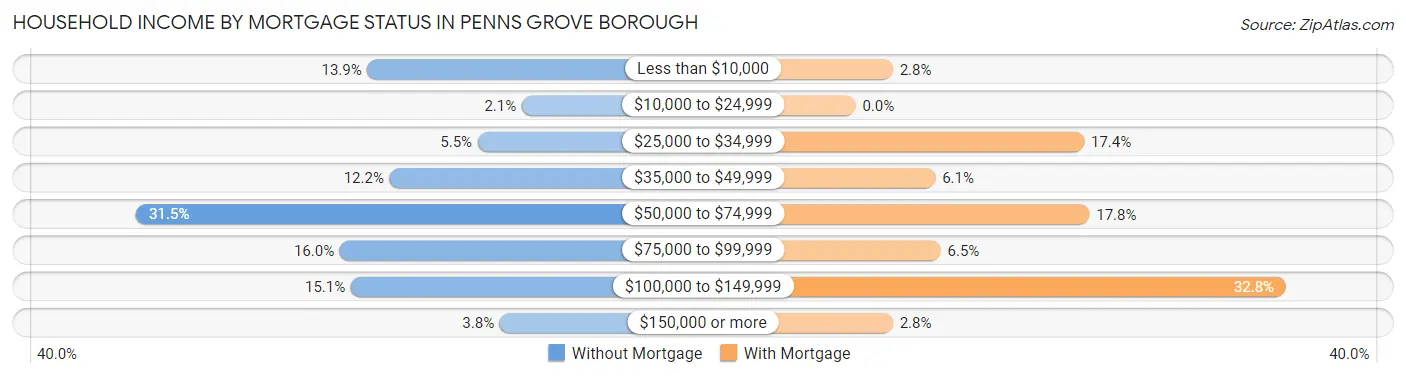
| Household Income | Without Mortgage | With Mortgage |
| Less than $10,000 | 33 (13.9%) | 7 (2.8%) |
| $10,000 to $24,999 | 5 (2.1%) | 0 (0.0%) |
| $25,000 to $34,999 | 13 (5.5%) | 43 (17.4%) |
| $35,000 to $49,999 | 29 (12.2%) | 15 (6.1%) |
| $50,000 to $74,999 | 75 (31.5%) | 44 (17.8%) |
| $75,000 to $99,999 | 38 (16.0%) | 16 (6.5%) |
| $100,000 to $149,999 | 36 (15.1%) | 81 (32.8%) |
| $150,000 or more | 9 (3.8%) | 7 (2.8%) |
| Total | 238 (100.0%) | 247 (100.0%) |
Property Value to Household Income Ratio in Penns Grove borough
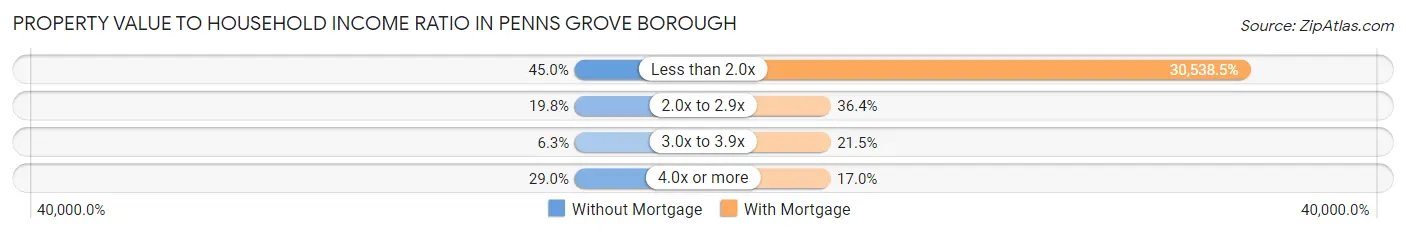
| Value-to-Income Ratio | Without Mortgage | With Mortgage |
| Less than 2.0x | 107 (45.0%) | 75,430 (30,538.5%) |
| 2.0x to 2.9x | 47 (19.8%) | 90 (36.4%) |
| 3.0x to 3.9x | 15 (6.3%) | 53 (21.5%) |
| 4.0x or more | 69 (29.0%) | 42 (17.0%) |
| Total | 238 (100.0%) | 247 (100.0%) |
Real Estate Taxes by Mortgage Status in Penns Grove borough
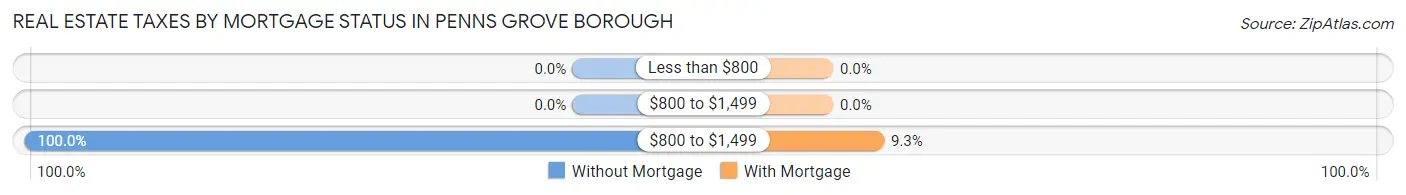
| Property Taxes | Without Mortgage | With Mortgage |
| Less than $800 | 0 (0.0%) | 0 (0.0%) |
| $800 to $1,499 | 0 (0.0%) | 0 (0.0%) |
| $800 to $1,499 | 238 (100.0%) | 23 (9.3%) |
| Total | 238 (100.0%) | 247 (100.0%) |
Health & Disability in Penns Grove borough
Health Insurance Coverage by Age in Penns Grove borough
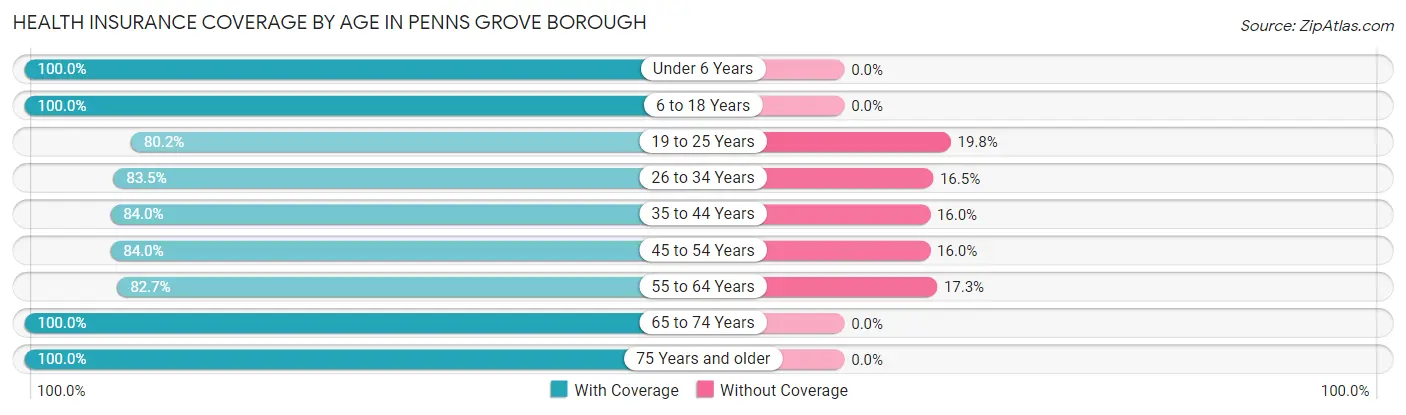
| Age Bracket | With Coverage | Without Coverage |
| Under 6 Years | 396 (100.0%) | 0 (0.0%) |
| 6 to 18 Years | 1,637 (100.0%) | 0 (0.0%) |
| 19 to 25 Years | 376 (80.2%) | 93 (19.8%) |
| 26 to 34 Years | 333 (83.5%) | 66 (16.5%) |
| 35 to 44 Years | 584 (84.0%) | 111 (16.0%) |
| 45 to 54 Years | 273 (84.0%) | 52 (16.0%) |
| 55 to 64 Years | 426 (82.7%) | 89 (17.3%) |
| 65 to 74 Years | 283 (100.0%) | 0 (0.0%) |
| 75 Years and older | 122 (100.0%) | 0 (0.0%) |
| Total | 4,430 (91.5%) | 411 (8.5%) |
Health Insurance Coverage by Citizenship Status in Penns Grove borough
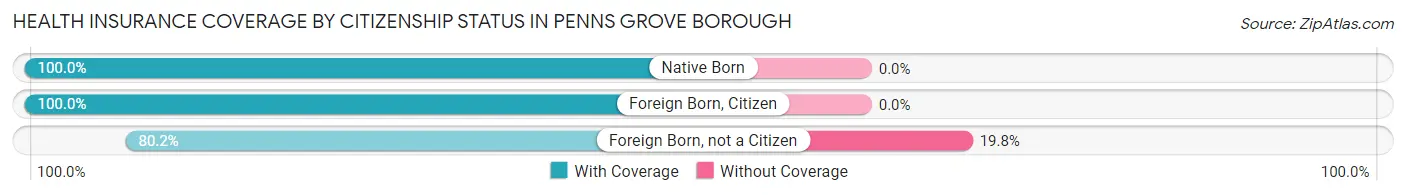
| Citizenship Status | With Coverage | Without Coverage |
| Native Born | 396 (100.0%) | 0 (0.0%) |
| Foreign Born, Citizen | 1,637 (100.0%) | 0 (0.0%) |
| Foreign Born, not a Citizen | 376 (80.2%) | 93 (19.8%) |
Health Insurance Coverage by Household Income in Penns Grove borough
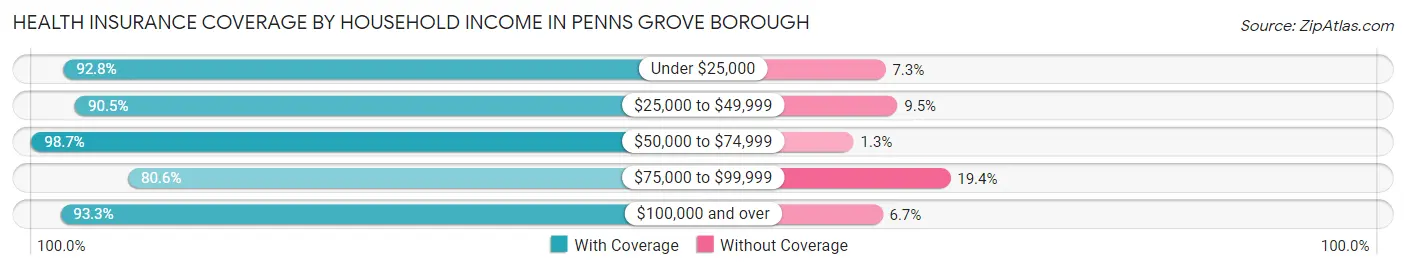
| Household Income | With Coverage | Without Coverage |
| Under $25,000 | 1,279 (92.7%) | 100 (7.2%) |
| $25,000 to $49,999 | 1,013 (90.5%) | 106 (9.5%) |
| $50,000 to $74,999 | 924 (98.7%) | 12 (1.3%) |
| $75,000 to $99,999 | 632 (80.6%) | 152 (19.4%) |
| $100,000 and over | 571 (93.3%) | 41 (6.7%) |
Public vs Private Health Insurance Coverage by Age in Penns Grove borough
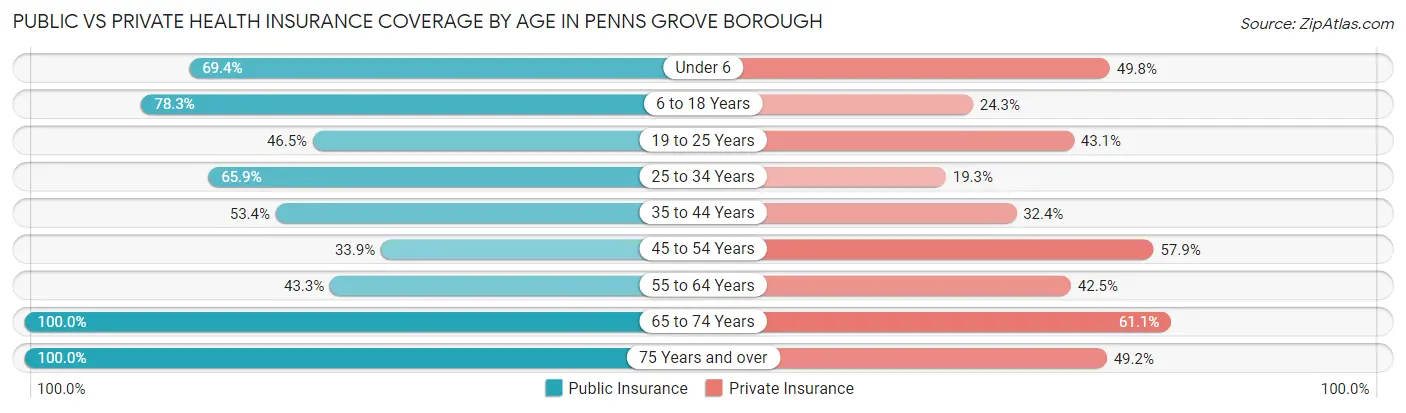
| Age Bracket | Public Insurance | Private Insurance |
| Under 6 | 275 (69.4%) | 197 (49.7%) |
| 6 to 18 Years | 1,282 (78.3%) | 398 (24.3%) |
| 19 to 25 Years | 218 (46.5%) | 202 (43.1%) |
| 25 to 34 Years | 263 (65.9%) | 77 (19.3%) |
| 35 to 44 Years | 371 (53.4%) | 225 (32.4%) |
| 45 to 54 Years | 110 (33.9%) | 188 (57.9%) |
| 55 to 64 Years | 223 (43.3%) | 219 (42.5%) |
| 65 to 74 Years | 283 (100.0%) | 173 (61.1%) |
| 75 Years and over | 122 (100.0%) | 60 (49.2%) |
| Total | 3,147 (65.0%) | 1,739 (35.9%) |
Disability Status by Sex by Age in Penns Grove borough
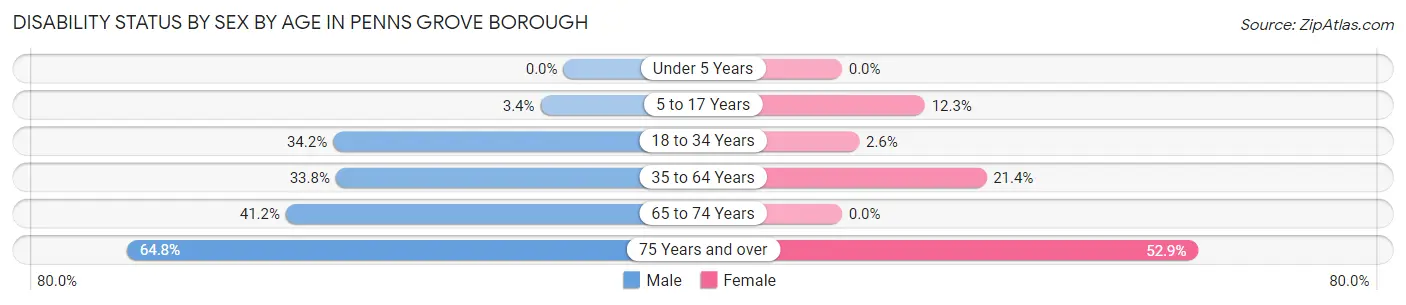
| Age Bracket | Male | Female |
| Under 5 Years | 0 (0.0%) | 0 (0.0%) |
| 5 to 17 Years | 28 (3.4%) | 90 (12.3%) |
| 18 to 34 Years | 156 (34.2%) | 13 (2.6%) |
| 35 to 64 Years | 194 (33.8%) | 206 (21.4%) |
| 65 to 74 Years | 61 (41.2%) | 0 (0.0%) |
| 75 Years and over | 35 (64.8%) | 36 (52.9%) |
Disability Class by Sex by Age in Penns Grove borough
Disability Class: Hearing Difficulty
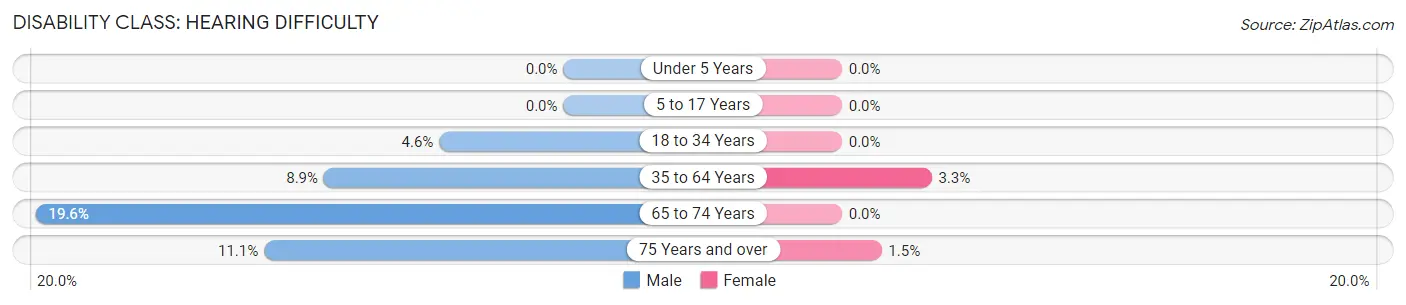
| Age Bracket | Male | Female |
| Under 5 Years | 0 (0.0%) | 0 (0.0%) |
| 5 to 17 Years | 0 (0.0%) | 0 (0.0%) |
| 18 to 34 Years | 21 (4.6%) | 0 (0.0%) |
| 35 to 64 Years | 51 (8.9%) | 32 (3.3%) |
| 65 to 74 Years | 29 (19.6%) | 0 (0.0%) |
| 75 Years and over | 6 (11.1%) | 1 (1.5%) |
Disability Class: Vision Difficulty
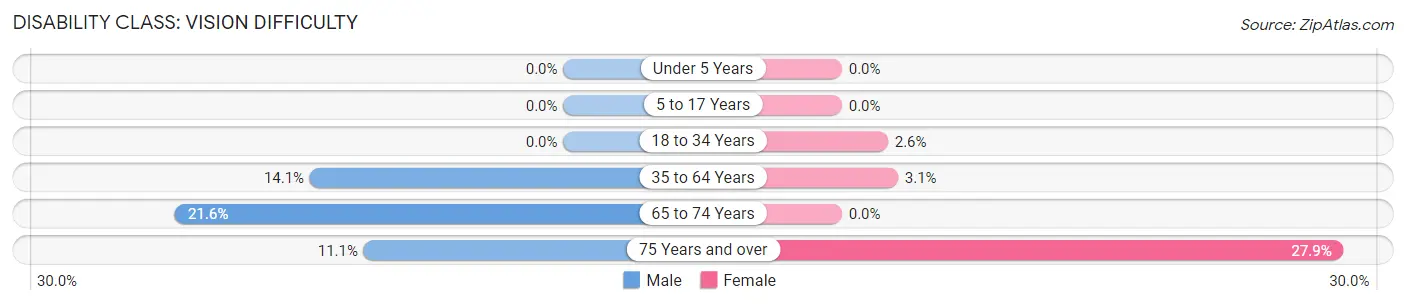
| Age Bracket | Male | Female |
| Under 5 Years | 0 (0.0%) | 0 (0.0%) |
| 5 to 17 Years | 0 (0.0%) | 0 (0.0%) |
| 18 to 34 Years | 0 (0.0%) | 13 (2.6%) |
| 35 to 64 Years | 81 (14.1%) | 30 (3.1%) |
| 65 to 74 Years | 32 (21.6%) | 0 (0.0%) |
| 75 Years and over | 6 (11.1%) | 19 (27.9%) |
Disability Class: Cognitive Difficulty
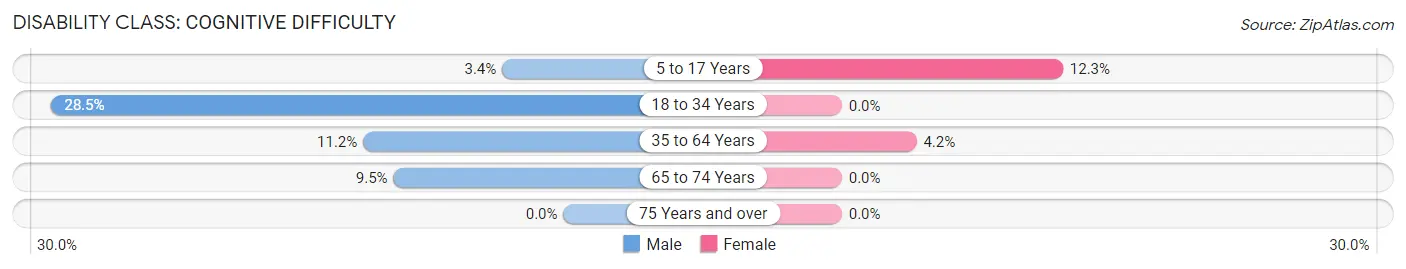
| Age Bracket | Male | Female |
| 5 to 17 Years | 28 (3.4%) | 90 (12.3%) |
| 18 to 34 Years | 130 (28.5%) | 0 (0.0%) |
| 35 to 64 Years | 64 (11.2%) | 40 (4.2%) |
| 65 to 74 Years | 14 (9.5%) | 0 (0.0%) |
| 75 Years and over | 0 (0.0%) | 0 (0.0%) |
Disability Class: Ambulatory Difficulty
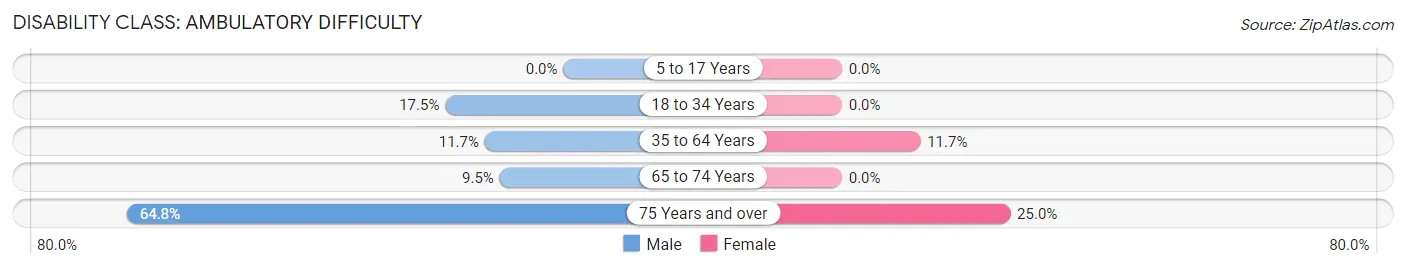
| Age Bracket | Male | Female |
| 5 to 17 Years | 0 (0.0%) | 0 (0.0%) |
| 18 to 34 Years | 80 (17.5%) | 0 (0.0%) |
| 35 to 64 Years | 67 (11.7%) | 112 (11.7%) |
| 65 to 74 Years | 14 (9.5%) | 0 (0.0%) |
| 75 Years and over | 35 (64.8%) | 17 (25.0%) |
Disability Class: Self-Care Difficulty
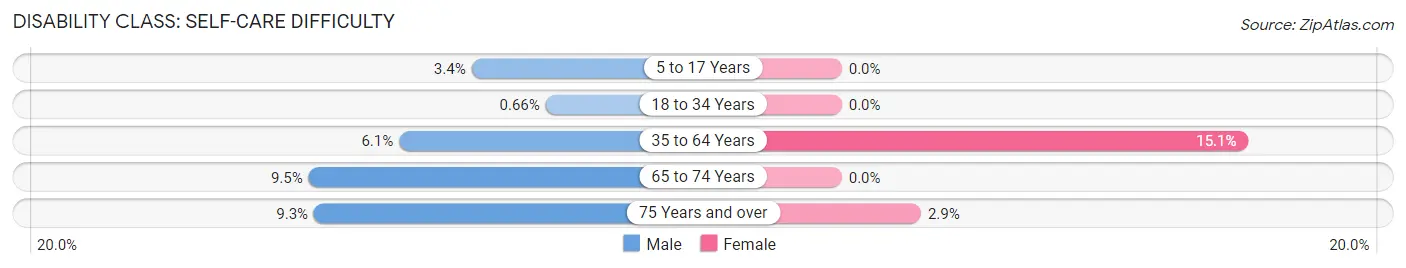
| Age Bracket | Male | Female |
| 5 to 17 Years | 28 (3.4%) | 0 (0.0%) |
| 18 to 34 Years | 3 (0.7%) | 0 (0.0%) |
| 35 to 64 Years | 35 (6.1%) | 145 (15.1%) |
| 65 to 74 Years | 14 (9.5%) | 0 (0.0%) |
| 75 Years and over | 5 (9.3%) | 2 (2.9%) |
Technology Access in Penns Grove borough
Computing Device Access in Penns Grove borough
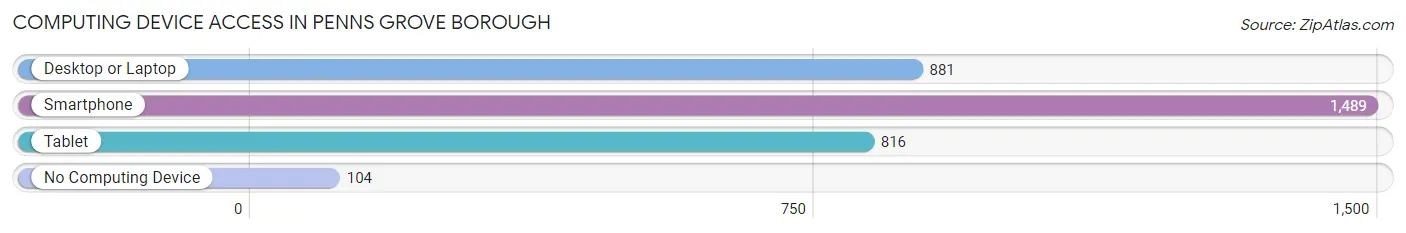
| Device Type | # Households | % Households |
| Desktop or Laptop | 881 | 54.9% |
| Smartphone | 1,489 | 92.8% |
| Tablet | 816 | 50.9% |
| No Computing Device | 104 | 6.5% |
| Total | 1,604 | 100.0% |
Internet Access in Penns Grove borough
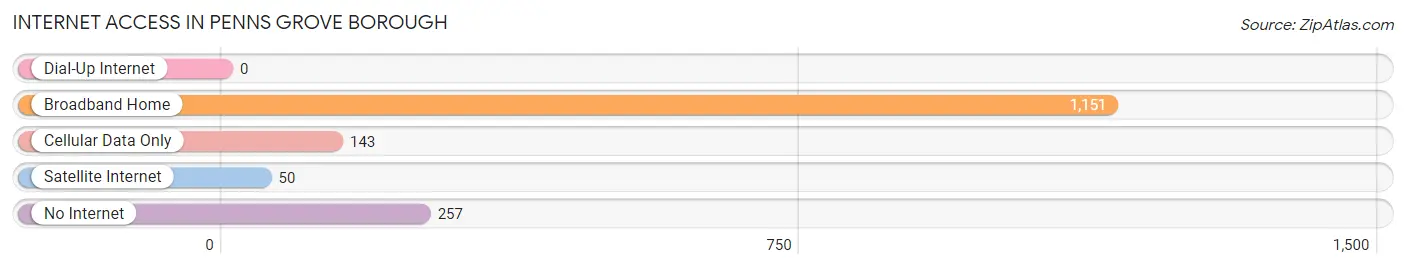
| Internet Type | # Households | % Households |
| Dial-Up Internet | 0 | 0.0% |
| Broadband Home | 1,151 | 71.8% |
| Cellular Data Only | 143 | 8.9% |
| Satellite Internet | 50 | 3.1% |
| No Internet | 257 | 16.0% |
| Total | 1,604 | 100.0% |
Penns Grove borough Summary
Penns Grove Borough is a small borough located in Salem County, New Jersey. It is situated on the Delaware River, just south of the Delaware Memorial Bridge. The borough is part of the Delaware Valley metropolitan area and is located approximately 25 miles south of Philadelphia. As of the 2010 United States Census, the borough had a total population of 5,147.
History
The area that is now Penns Grove Borough was originally inhabited by the Lenape Native Americans. The first European settlers arrived in the area in the late 1600s. The area was originally part of the Province of West Jersey, and was later part of the Township of Penns Neck. In 1876, the area was incorporated as the Borough of Penns Grove.
Geography
Penns Grove Borough is located at 39°33'25" North, 75°20'45" West (39.5569, -75.3458). It has a total area of 1.2 square miles, all of which is land. The borough is bordered by the Delaware River to the east, Pennsville Township to the north, Carneys Point Township to the west, and Oldmans Township to the south.
Economy
The economy of Penns Grove Borough is largely based on manufacturing and services. The borough is home to several manufacturing companies, including Penns Grove Plastics, Penns Grove Glass, and Penns Grove Metal. The borough also has a number of retail stores, restaurants, and other businesses.
Demographics
As of the 2010 United States Census, there were 5,147 people, 1,945 households, and 1,323 families residing in the borough. The population density was 4,269.2 people per square mile. The racial makeup of the borough was 63.2% White, 28.2% African American, 0.3% Native American, 0.7% Asian, 0.1% Pacific Islander, 5.2% from other races, and 2.3% from two or more races. Hispanic or Latino of any race were 11.3% of the population.
The median income for a household in the borough was $41,944, and the median income for a family was $50,972. The per capita income for the borough was $20,845. About 16.2% of families and 19.2% of the population were below the poverty line, including 28.2% of those under age 18 and 11.2% of those age 65 or over.
Common Questions
What is Per Capita Income in Penns Grove borough?
Per Capita income in Penns Grove borough is $15,903.
What is the Median Family Income in Penns Grove borough?
Median Family Income in Penns Grove borough is $43,321.
What is the Median Household income in Penns Grove borough?
Median Household Income in Penns Grove borough is $29,821.
What is Income or Wage Gap in Penns Grove borough?
Income or Wage Gap in Penns Grove borough is 46.3%.
Women in Penns Grove borough earn 53.7 cents for every dollar earned by a man.
What is Inequality or Gini Index in Penns Grove borough?
Inequality or Gini Index in Penns Grove borough is 0.51.
What is the Total Population of Penns Grove borough?
Total Population of Penns Grove borough is 4,841.
What is the Total Male Population of Penns Grove borough?
Total Male Population of Penns Grove borough is 2,167.
What is the Total Female Population of Penns Grove borough?
Total Female Population of Penns Grove borough is 2,674.
What is the Ratio of Males per 100 Females in Penns Grove borough?
There are 81.04 Males per 100 Females in Penns Grove borough.
What is the Ratio of Females per 100 Males in Penns Grove borough?
There are 123.40 Females per 100 Males in Penns Grove borough.
What is the Median Population Age in Penns Grove borough?
Median Population Age in Penns Grove borough is 25.0 Years.
What is the Average Family Size in Penns Grove borough
Average Family Size in Penns Grove borough is 4.2 People.
What is the Average Household Size in Penns Grove borough
Average Household Size in Penns Grove borough is 3.0 People.
How Large is the Labor Force in Penns Grove borough?
There are 1,573 People in the Labor Forcein in Penns Grove borough.
What is the Percentage of People in the Labor Force in Penns Grove borough?
51.6% of People are in the Labor Force in Penns Grove borough.
What is the Unemployment Rate in Penns Grove borough?
Unemployment Rate in Penns Grove borough is 15.5%.