Freehold borough, NJ Map & Demographics
Freehold borough Overview
$33,223
PER CAPITA INCOME
$93,565
AVG FAMILY INCOME
$71,205
AVG HOUSEHOLD INCOME
12.6%
WAGE / INCOME GAP [ % ]
87.4¢/ $1
WAGE / INCOME GAP [ $ ]
0.47
INEQUALITY / GINI INDEX
12,498
TOTAL POPULATION
6,018
MALE POPULATION
6,480
FEMALE POPULATION
92.87
MALES / 100 FEMALES
107.68
FEMALES / 100 MALES
35.5
MEDIAN AGE
3.3
AVG FAMILY SIZE
2.8
AVG HOUSEHOLD SIZE
6,936
LABOR FORCE [ PEOPLE ]
72.8%
PERCENT IN LABOR FORCE
8.2%
UNEMPLOYMENT RATE
Income in Freehold borough
Income Overview in Freehold borough
Per Capita Income in Freehold borough is $33,223, while median incomes of families and households are $93,565 and $71,205 respectively.
| Characteristic | Number | Measure |
| Per Capita Income | 12,498 | $33,223 |
| Median Family Income | 2,991 | $93,565 |
| Mean Family Income | 2,991 | $105,525 |
| Median Household Income | 4,388 | $71,205 |
| Mean Household Income | 4,388 | $95,122 |
| Income Deficit | 2,991 | $0 |
| Wage / Income Gap (%) | 12,498 | 12.64% |
| Wage / Income Gap ($) | 12,498 | 87.36¢ per $1 |
| Gini / Inequality Index | 12,498 | 0.47 |
Earnings by Sex in Freehold borough
Average Earnings in Freehold borough are $29,566, $32,874 for men and $28,718 for women, a difference of 12.6%.
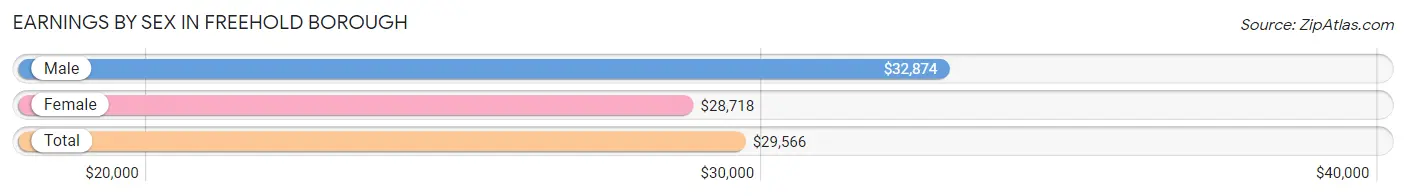
| Sex | Number | Average Earnings |
| Male | 3,605 (51.9%) | $32,874 |
| Female | 3,344 (48.1%) | $28,718 |
| Total | 6,949 (100.0%) | $29,566 |
Earnings by Sex by Income Bracket in Freehold borough
The most common earnings brackets in Freehold borough are $22,500 to $24,999 for men (545 | 15.1%) and $25,000 to $29,999 for women (424 | 12.7%).
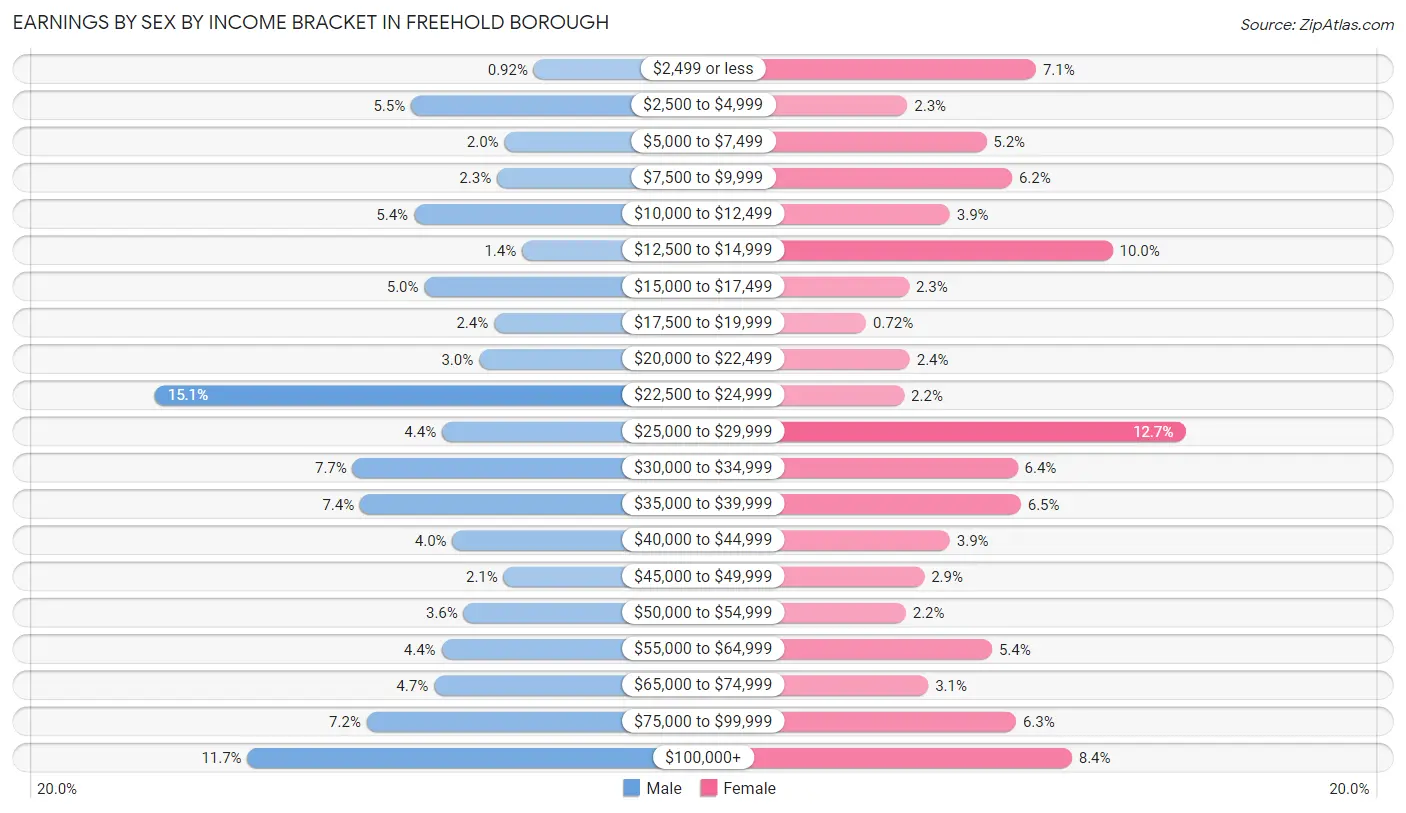
| Income | Male | Female |
| $2,499 or less | 33 (0.9%) | 237 (7.1%) |
| $2,500 to $4,999 | 199 (5.5%) | 76 (2.3%) |
| $5,000 to $7,499 | 73 (2.0%) | 175 (5.2%) |
| $7,500 to $9,999 | 83 (2.3%) | 207 (6.2%) |
| $10,000 to $12,499 | 195 (5.4%) | 129 (3.9%) |
| $12,500 to $14,999 | 49 (1.4%) | 333 (10.0%) |
| $15,000 to $17,499 | 181 (5.0%) | 78 (2.3%) |
| $17,500 to $19,999 | 87 (2.4%) | 24 (0.7%) |
| $20,000 to $22,499 | 107 (3.0%) | 79 (2.4%) |
| $22,500 to $24,999 | 545 (15.1%) | 72 (2.1%) |
| $25,000 to $29,999 | 157 (4.4%) | 424 (12.7%) |
| $30,000 to $34,999 | 278 (7.7%) | 214 (6.4%) |
| $35,000 to $39,999 | 268 (7.4%) | 218 (6.5%) |
| $40,000 to $44,999 | 143 (4.0%) | 129 (3.9%) |
| $45,000 to $49,999 | 74 (2.1%) | 97 (2.9%) |
| $50,000 to $54,999 | 128 (3.5%) | 74 (2.2%) |
| $55,000 to $64,999 | 158 (4.4%) | 182 (5.4%) |
| $65,000 to $74,999 | 168 (4.7%) | 102 (3.0%) |
| $75,000 to $99,999 | 259 (7.2%) | 212 (6.3%) |
| $100,000+ | 420 (11.7%) | 282 (8.4%) |
| Total | 3,605 (100.0%) | 3,344 (100.0%) |
Earnings by Sex by Educational Attainment in Freehold borough
Average earnings in Freehold borough are $37,708 for men and $33,849 for women, a difference of 10.2%. Men with an educational attainment of graduate degree enjoy the highest average annual earnings of $73,750, while those with less than high school education earn the least with $32,604. Women with an educational attainment of graduate degree earn the most with the average annual earnings of $65,565, while those with college or associate's degree education have the smallest earnings of $25,149.
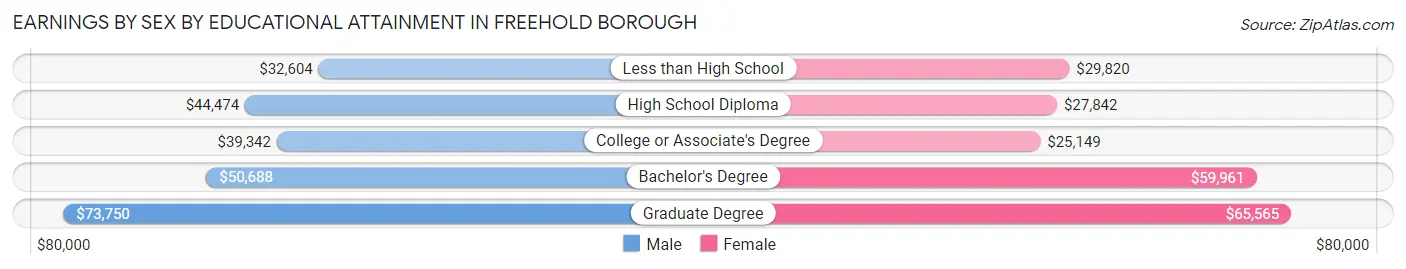
| Educational Attainment | Male Income | Female Income |
| Less than High School | $32,604 | $29,820 |
| High School Diploma | $44,474 | $27,842 |
| College or Associate's Degree | $39,342 | $25,149 |
| Bachelor's Degree | $50,688 | $59,961 |
| Graduate Degree | $73,750 | $65,565 |
| Total | $37,708 | $33,849 |
Family Income in Freehold borough
Family Income Brackets in Freehold borough
According to the Freehold borough family income data, there are 805 families falling into the $100,000 to $149,999 income range, which is the most common income bracket and makes up 26.9% of all families. Conversely, the less than $10,000 income bracket is the least frequent group with only 39 families (1.3%) belonging to this category.
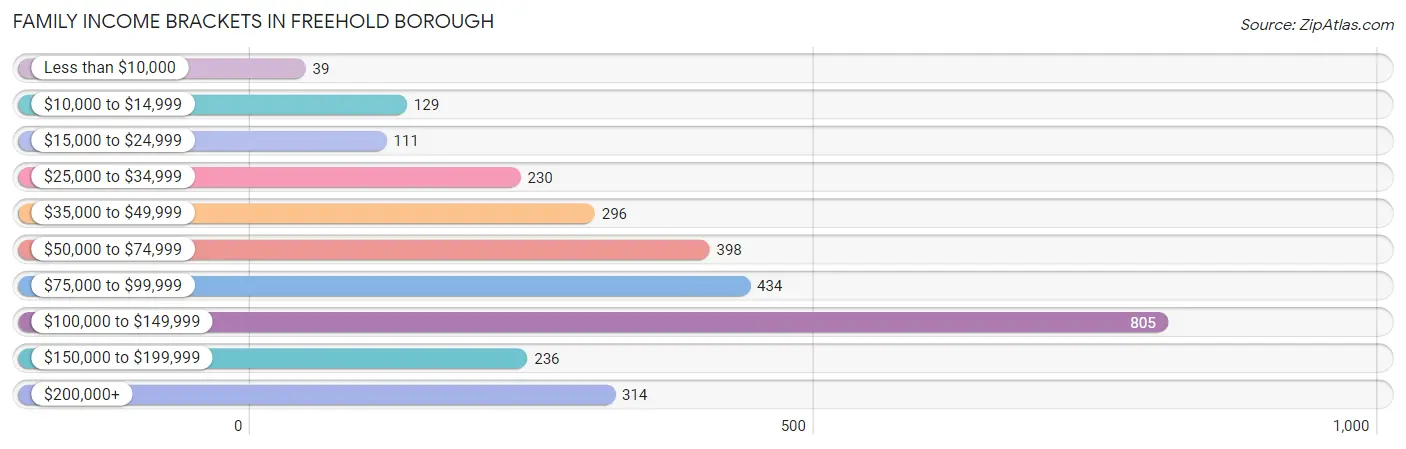
| Income Bracket | # Families | % Families |
| Less than $10,000 | 39 | 1.3% |
| $10,000 to $14,999 | 129 | 4.3% |
| $15,000 to $24,999 | 111 | 3.7% |
| $25,000 to $34,999 | 230 | 7.7% |
| $35,000 to $49,999 | 296 | 9.9% |
| $50,000 to $74,999 | 398 | 13.3% |
| $75,000 to $99,999 | 434 | 14.5% |
| $100,000 to $149,999 | 805 | 26.9% |
| $150,000 to $199,999 | 236 | 7.9% |
| $200,000+ | 314 | 10.5% |
Family Income by Famaliy Size in Freehold borough
6-person families (100 | 3.3%) account for the highest median family income in Freehold borough with $168,553 per family, while 2-person families (1,109 | 37.1%) have the highest median income of $43,292 per family member.
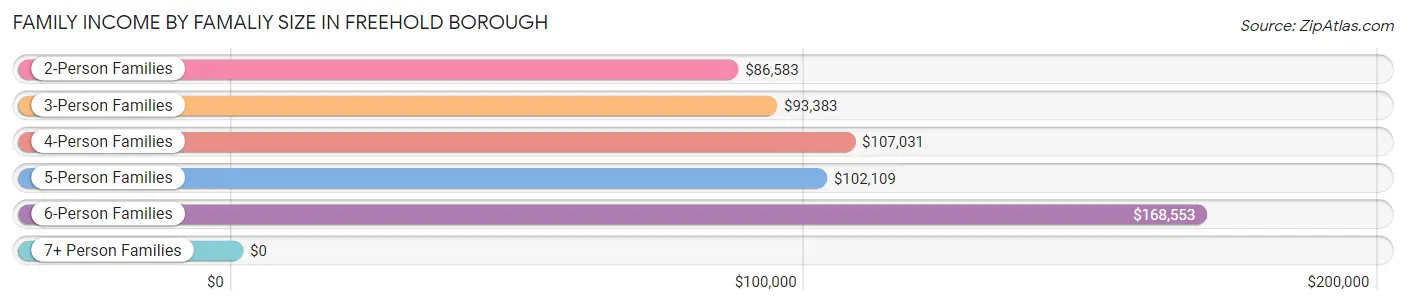
| Income Bracket | # Families | Median Income |
| 2-Person Families | 1,109 (37.1%) | $86,583 |
| 3-Person Families | 743 (24.8%) | $93,383 |
| 4-Person Families | 709 (23.7%) | $107,031 |
| 5-Person Families | 291 (9.7%) | $102,109 |
| 6-Person Families | 100 (3.3%) | $168,553 |
| 7+ Person Families | 39 (1.3%) | $0 |
| Total | 2,991 (100.0%) | $93,565 |
Family Income by Number of Earners in Freehold borough
The median family income in Freehold borough is $93,565, with families comprising 3+ earners (717) having the highest median family income of $129,635, while families with 1 earner (696) have the lowest median family income of $39,559, accounting for 24.0% and 23.3% of families, respectively.
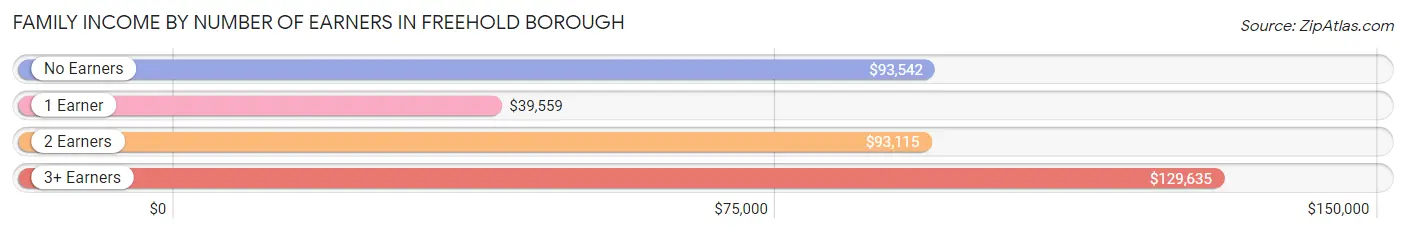
| Number of Earners | # Families | Median Income |
| No Earners | 348 (11.6%) | $93,542 |
| 1 Earner | 696 (23.3%) | $39,559 |
| 2 Earners | 1,230 (41.1%) | $93,115 |
| 3+ Earners | 717 (24.0%) | $129,635 |
| Total | 2,991 (100.0%) | $93,565 |
Household Income in Freehold borough
Household Income Brackets in Freehold borough
With 878 households falling in the category, the $100,000 to $149,999 income range is the most frequent in Freehold borough, accounting for 20.0% of all households. In contrast, only 149 households (3.4%) fall into the $10,000 to $14,999 income bracket, making it the least populous group.
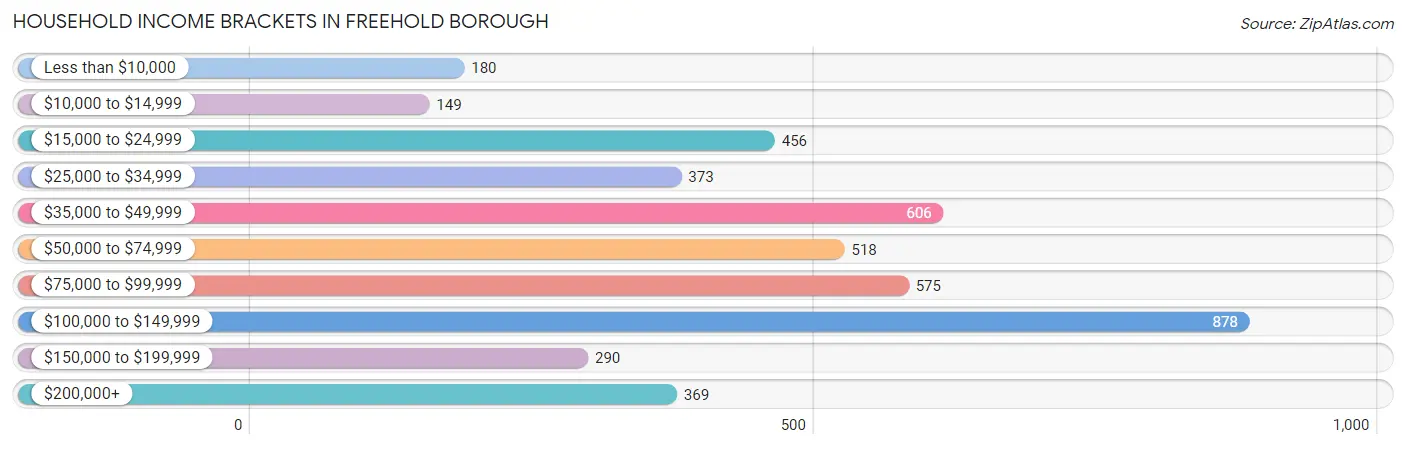
| Income Bracket | # Households | % Households |
| Less than $10,000 | 180 | 4.1% |
| $10,000 to $14,999 | 149 | 3.4% |
| $15,000 to $24,999 | 456 | 10.4% |
| $25,000 to $34,999 | 373 | 8.5% |
| $35,000 to $49,999 | 606 | 13.8% |
| $50,000 to $74,999 | 518 | 11.8% |
| $75,000 to $99,999 | 575 | 13.1% |
| $100,000 to $149,999 | 878 | 20.0% |
| $150,000 to $199,999 | 290 | 6.6% |
| $200,000+ | 369 | 8.4% |
Household Income by Householder Age in Freehold borough
The median household income in Freehold borough is $71,205, with the highest median household income of $87,650 found in the 45 to 64 years age bracket for the primary householder. A total of 1,777 households (40.5%) fall into this category. Meanwhile, the 25 to 44 years age bracket for the primary householder has the lowest median household income of $59,036, with 1,449 households (33.0%) in this group.
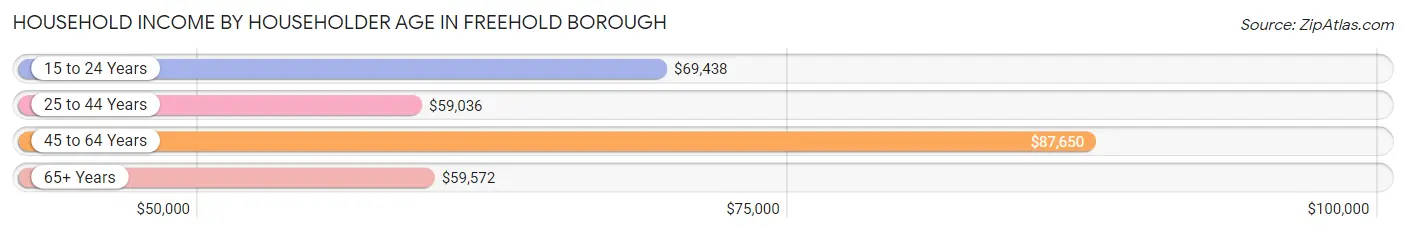
| Income Bracket | # Households | Median Income |
| 15 to 24 Years | 95 (2.2%) | $69,438 |
| 25 to 44 Years | 1,449 (33.0%) | $59,036 |
| 45 to 64 Years | 1,777 (40.5%) | $87,650 |
| 65+ Years | 1,067 (24.3%) | $59,572 |
| Total | 4,388 (100.0%) | $71,205 |
Poverty in Freehold borough
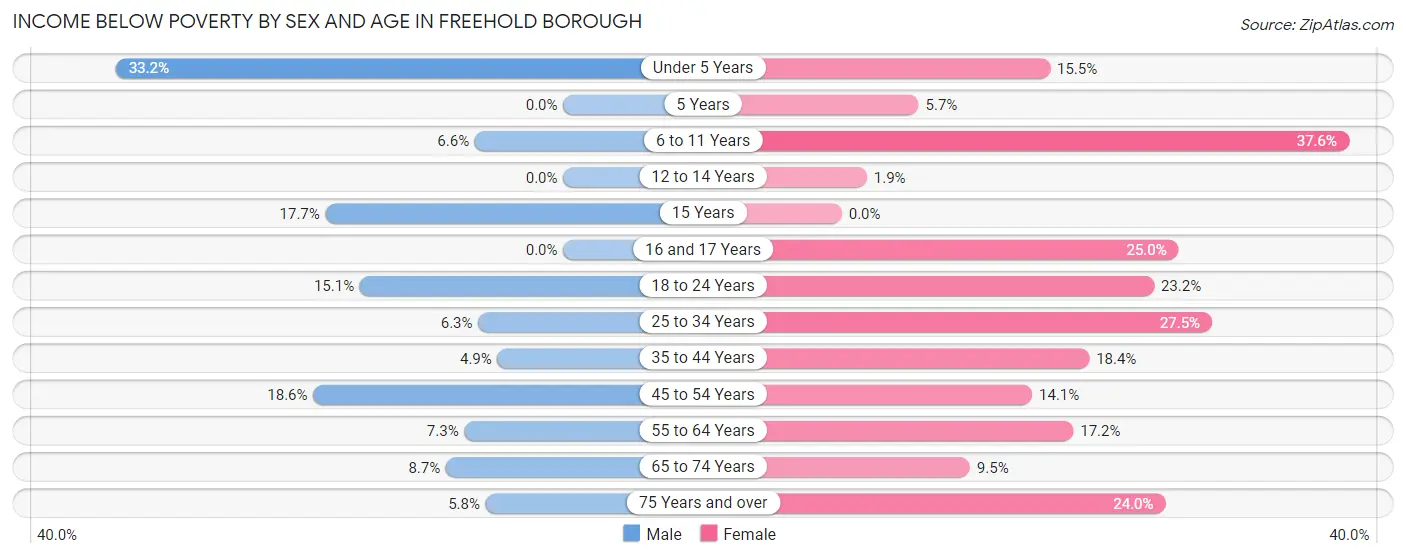
Income Below Poverty by Sex and Age in Freehold borough
With 10.9% poverty level for males and 19.1% for females among the residents of Freehold borough, under 5 year old males and 6 to 11 year old females are the most vulnerable to poverty, with 104 males (33.2%) and 195 females (37.6%) in their respective age groups living below the poverty level.
| Age Bracket | Male | Female |
| Under 5 Years | 104 (33.2%) | 30 (15.5%) |
| 5 Years | 0 (0.0%) | 15 (5.7%) |
| 6 to 11 Years | 30 (6.6%) | 195 (37.6%) |
| 12 to 14 Years | 0 (0.0%) | 4 (1.9%) |
| 15 Years | 21 (17.6%) | 0 (0.0%) |
| 16 and 17 Years | 0 (0.0%) | 80 (25.0%) |
| 18 to 24 Years | 95 (15.1%) | 118 (23.2%) |
| 25 to 34 Years | 58 (6.3%) | 208 (27.5%) |
| 35 to 44 Years | 27 (4.9%) | 212 (18.4%) |
| 45 to 54 Years | 191 (18.6%) | 90 (14.1%) |
| 55 to 64 Years | 48 (7.3%) | 109 (17.2%) |
| 65 to 74 Years | 35 (8.7%) | 50 (9.5%) |
| 75 Years and over | 20 (5.8%) | 92 (24.0%) |
| Total | 629 (10.9%) | 1,203 (19.1%) |
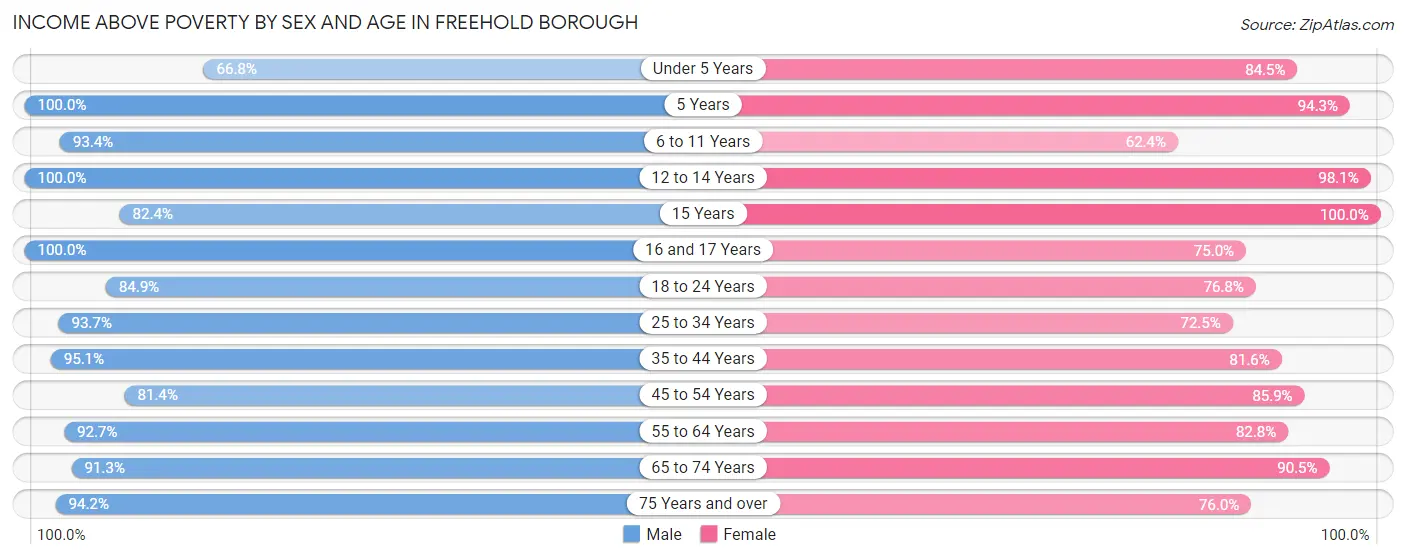
Income Above Poverty by Sex and Age in Freehold borough
According to the poverty statistics in Freehold borough, males aged 5 years and females aged 15 years are the age groups that are most secure financially, with 100.0% of males and 100.0% of females in these age groups living above the poverty line.
| Age Bracket | Male | Female |
| Under 5 Years | 209 (66.8%) | 164 (84.5%) |
| 5 Years | 31 (100.0%) | 248 (94.3%) |
| 6 to 11 Years | 427 (93.4%) | 323 (62.4%) |
| 12 to 14 Years | 244 (100.0%) | 211 (98.1%) |
| 15 Years | 98 (82.4%) | 186 (100.0%) |
| 16 and 17 Years | 74 (100.0%) | 240 (75.0%) |
| 18 to 24 Years | 534 (84.9%) | 391 (76.8%) |
| 25 to 34 Years | 861 (93.7%) | 549 (72.5%) |
| 35 to 44 Years | 526 (95.1%) | 942 (81.6%) |
| 45 to 54 Years | 838 (81.4%) | 547 (85.9%) |
| 55 to 64 Years | 606 (92.7%) | 525 (82.8%) |
| 65 to 74 Years | 367 (91.3%) | 476 (90.5%) |
| 75 Years and over | 327 (94.2%) | 291 (76.0%) |
| Total | 5,142 (89.1%) | 5,093 (80.9%) |
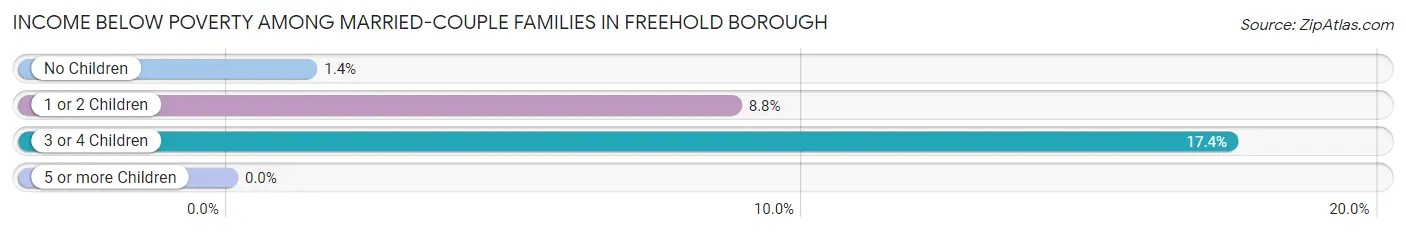
Income Below Poverty Among Married-Couple Families in Freehold borough
The poverty statistics for married-couple families in Freehold borough show that 5.3% or 99 of the total 1,856 families live below the poverty line. Families with 3 or 4 children have the highest poverty rate of 17.4%, comprising of 23 families. On the other hand, families with no children have the lowest poverty rate of 1.4%, which includes 14 families.
| Children | Above Poverty | Below Poverty |
| No Children | 1,003 (98.6%) | 14 (1.4%) |
| 1 or 2 Children | 645 (91.2%) | 62 (8.8%) |
| 3 or 4 Children | 109 (82.6%) | 23 (17.4%) |
| 5 or more Children | 0 (0.0%) | 0 (0.0%) |
| Total | 1,757 (94.7%) | 99 (5.3%) |
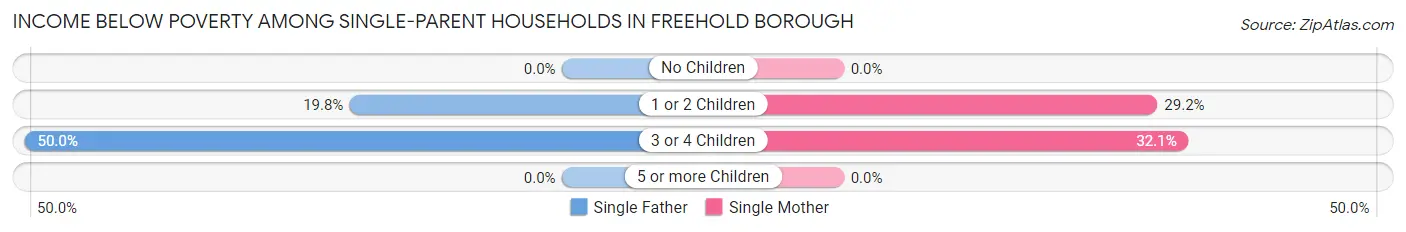
Income Below Poverty Among Single-Parent Households in Freehold borough
According to the poverty data in Freehold borough, 10.1% or 38 single-father households and 21.5% or 163 single-mother households are living below the poverty line. Among single-father households, those with 3 or 4 children have the highest poverty rate, with 4 households (50.0%) experiencing poverty. Likewise, among single-mother households, those with 3 or 4 children have the highest poverty rate, with 35 households (32.1%) falling below the poverty line.
| Children | Single Father | Single Mother |
| No Children | 0 (0.0%) | 0 (0.0%) |
| 1 or 2 Children | 34 (19.8%) | 128 (29.2%) |
| 3 or 4 Children | 4 (50.0%) | 35 (32.1%) |
| 5 or more Children | 0 (0.0%) | 0 (0.0%) |
| Total | 38 (10.1%) | 163 (21.5%) |
Income Below Poverty Among Married-Couple vs Single-Parent Households in Freehold borough
The poverty data for Freehold borough shows that 99 of the married-couple family households (5.3%) and 201 of the single-parent households (17.7%) are living below the poverty level. Within the married-couple family households, those with 3 or 4 children have the highest poverty rate, with 23 households (17.4%) falling below the poverty line. Among the single-parent households, those with 3 or 4 children have the highest poverty rate, with 39 household (33.3%) living below poverty.
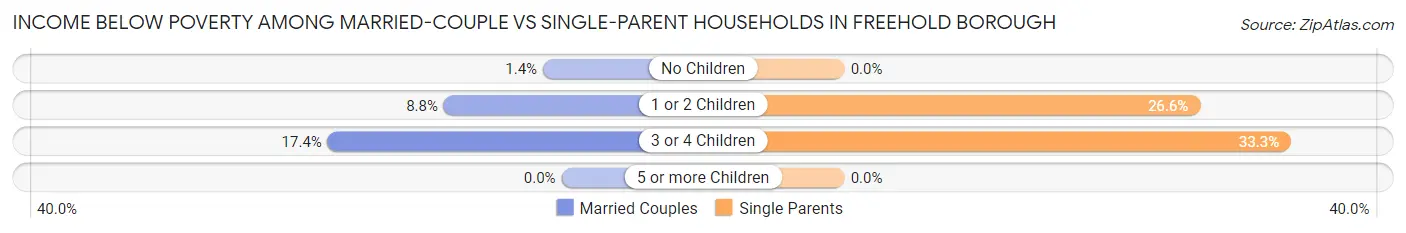
| Children | Married-Couple Families | Single-Parent Households |
| No Children | 14 (1.4%) | 0 (0.0%) |
| 1 or 2 Children | 62 (8.8%) | 162 (26.6%) |
| 3 or 4 Children | 23 (17.4%) | 39 (33.3%) |
| 5 or more Children | 0 (0.0%) | 0 (0.0%) |
| Total | 99 (5.3%) | 201 (17.7%) |
Race in Freehold borough
The most populous races in Freehold borough are White / Caucasian (6,508 | 52.1%), Hispanic or Latino (5,622 | 45.0%), and Some other Race (2,208 | 17.7%).
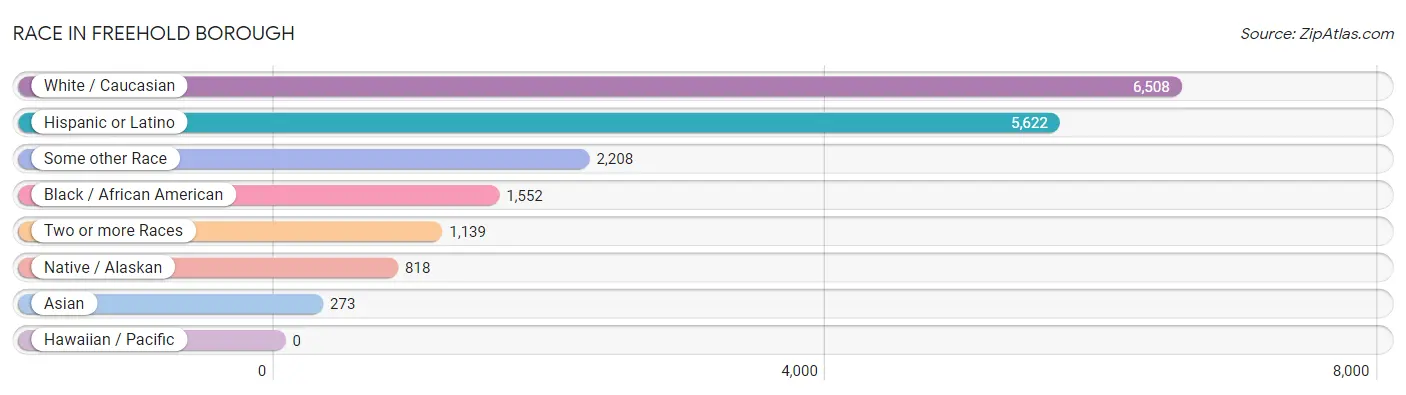
| Race | # Population | % Population |
| Asian | 273 | 2.2% |
| Black / African American | 1,552 | 12.4% |
| Hawaiian / Pacific | 0 | 0.0% |
| Hispanic or Latino | 5,622 | 45.0% |
| Native / Alaskan | 818 | 6.6% |
| White / Caucasian | 6,508 | 52.1% |
| Two or more Races | 1,139 | 9.1% |
| Some other Race | 2,208 | 17.7% |
| Total | 12,498 | 100.0% |
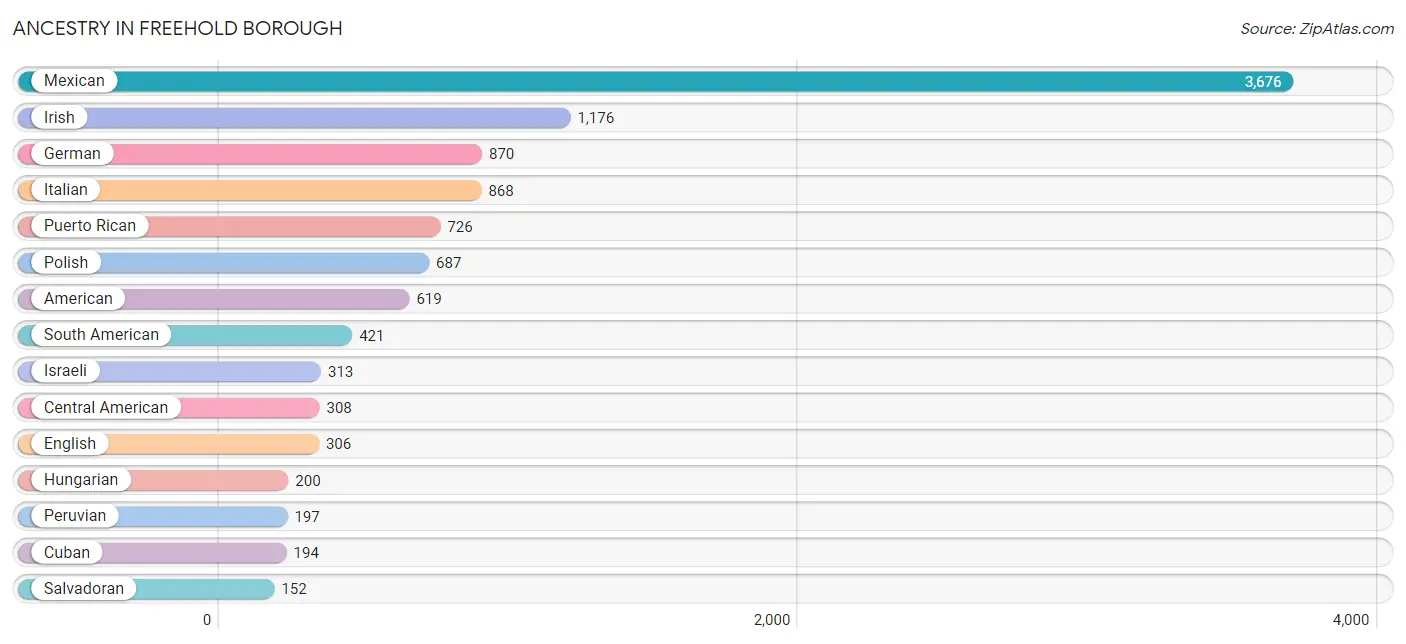
Ancestry in Freehold borough
The most populous ancestries reported in Freehold borough are Mexican (3,676 | 29.4%), Irish (1,176 | 9.4%), German (870 | 7.0%), Italian (868 | 7.0%), and Puerto Rican (726 | 5.8%), together accounting for 58.5% of all Freehold borough residents.
| Ancestry | # Population | % Population |
| American | 619 | 5.0% |
| Arab | 69 | 0.5% |
| British | 28 | 0.2% |
| British West Indian | 117 | 0.9% |
| Burmese | 5 | 0.0% |
| Canadian | 8 | 0.1% |
| Central American | 308 | 2.5% |
| Central American Indian | 46 | 0.4% |
| Colombian | 134 | 1.1% |
| Costa Rican | 18 | 0.1% |
| Croatian | 30 | 0.2% |
| Cuban | 194 | 1.5% |
| Czech | 46 | 0.4% |
| Czechoslovakian | 4 | 0.0% |
| Danish | 5 | 0.0% |
| Dominican | 107 | 0.9% |
| Dutch | 46 | 0.4% |
| Eastern European | 37 | 0.3% |
| Ecuadorian | 90 | 0.7% |
| Egyptian | 61 | 0.5% |
| English | 306 | 2.5% |
| European | 34 | 0.3% |
| French | 43 | 0.3% |
| French Canadian | 34 | 0.3% |
| German | 870 | 7.0% |
| Greek | 36 | 0.3% |
| Guatemalan | 138 | 1.1% |
| Haitian | 108 | 0.9% |
| Hungarian | 200 | 1.6% |
| Icelander | 16 | 0.1% |
| Indian (Asian) | 110 | 0.9% |
| Irish | 1,176 | 9.4% |
| Israeli | 313 | 2.5% |
| Italian | 868 | 7.0% |
| Jamaican | 19 | 0.2% |
| Korean | 57 | 0.5% |
| Lebanese | 3 | 0.0% |
| Lithuanian | 19 | 0.2% |
| Malaysian | 6 | 0.1% |
| Mexican | 3,676 | 29.4% |
| Mexican American Indian | 32 | 0.3% |
| Norwegian | 79 | 0.6% |
| Peruvian | 197 | 1.6% |
| Polish | 687 | 5.5% |
| Portuguese | 16 | 0.1% |
| Puerto Rican | 726 | 5.8% |
| Romanian | 29 | 0.2% |
| Russian | 73 | 0.6% |
| Salvadoran | 152 | 1.2% |
| Scandinavian | 17 | 0.1% |
| Scotch-Irish | 39 | 0.3% |
| Scottish | 78 | 0.6% |
| Slavic | 39 | 0.3% |
| Slovak | 50 | 0.4% |
| South American | 421 | 3.4% |
| Spaniard | 109 | 0.9% |
| Spanish | 13 | 0.1% |
| Sri Lankan | 35 | 0.3% |
| Swedish | 39 | 0.3% |
| Swiss | 10 | 0.1% |
| Thai | 52 | 0.4% |
| Turkish | 15 | 0.1% |
| U.S. Virgin Islander | 74 | 0.6% |
| Ukrainian | 64 | 0.5% |
| Vietnamese | 24 | 0.2% |
| Welsh | 36 | 0.3% |
| West Indian | 76 | 0.6% | View All 67 Rows |
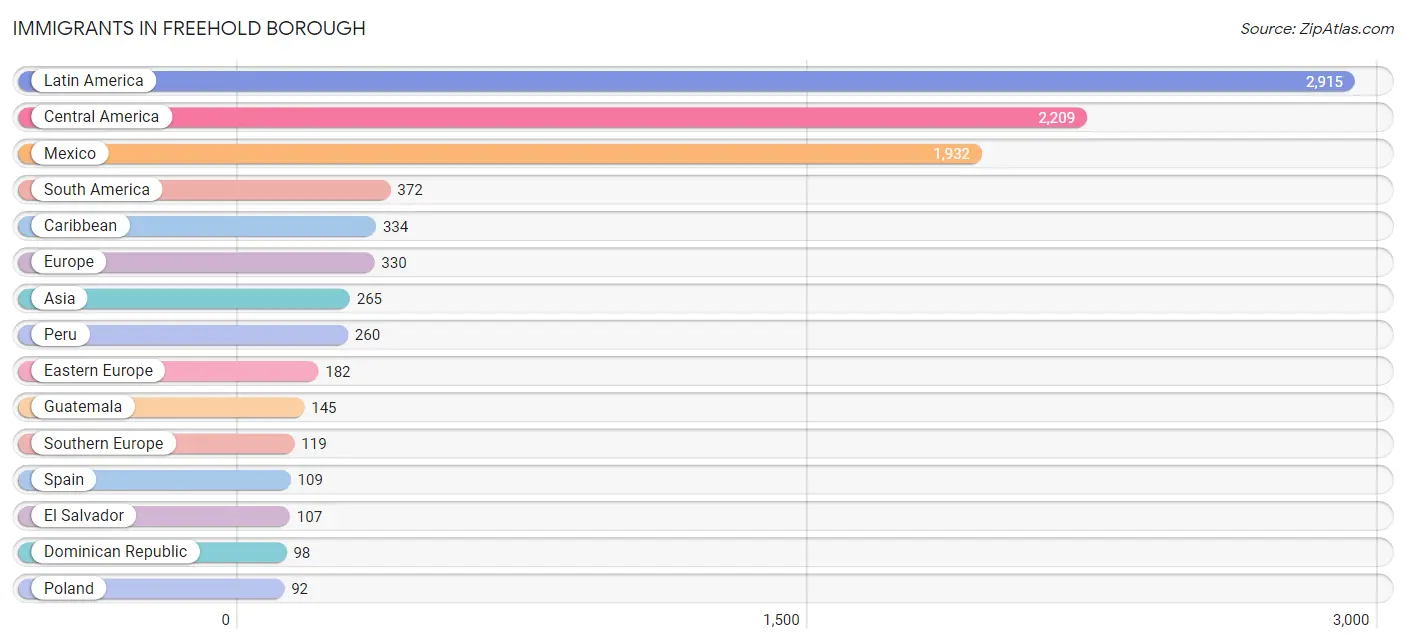
Immigrants in Freehold borough
The most numerous immigrant groups reported in Freehold borough came from Latin America (2,915 | 23.3%), Central America (2,209 | 17.7%), Mexico (1,932 | 15.5%), South America (372 | 3.0%), and Caribbean (334 | 2.7%), together accounting for 62.1% of all Freehold borough residents.
| Immigration Origin | # Population | % Population |
| Africa | 38 | 0.3% |
| Asia | 265 | 2.1% |
| Bangladesh | 10 | 0.1% |
| Belarus | 23 | 0.2% |
| Bosnia and Herzegovina | 14 | 0.1% |
| Caribbean | 334 | 2.7% |
| Central America | 2,209 | 17.7% |
| China | 66 | 0.5% |
| Colombia | 75 | 0.6% |
| Costa Rica | 18 | 0.1% |
| Cuba | 49 | 0.4% |
| Dominican Republic | 98 | 0.8% |
| Eastern Asia | 71 | 0.6% |
| Eastern Europe | 182 | 1.5% |
| Ecuador | 37 | 0.3% |
| Egypt | 8 | 0.1% |
| El Salvador | 107 | 0.9% |
| England | 10 | 0.1% |
| Europe | 330 | 2.6% |
| Germany | 10 | 0.1% |
| Guatemala | 145 | 1.2% |
| Honduras | 7 | 0.1% |
| Hong Kong | 5 | 0.0% |
| India | 40 | 0.3% |
| Israel | 54 | 0.4% |
| Italy | 4 | 0.0% |
| Jamaica | 21 | 0.2% |
| Korea | 5 | 0.0% |
| Laos | 6 | 0.1% |
| Latin America | 2,915 | 23.3% |
| Liberia | 7 | 0.1% |
| Mexico | 1,932 | 15.5% |
| Middle Africa | 23 | 0.2% |
| Netherlands | 9 | 0.1% |
| Northern Africa | 8 | 0.1% |
| Northern Europe | 10 | 0.1% |
| Pakistan | 9 | 0.1% |
| Peru | 260 | 2.1% |
| Philippines | 53 | 0.4% |
| Poland | 92 | 0.7% |
| Portugal | 6 | 0.1% |
| Russia | 3 | 0.0% |
| South America | 372 | 3.0% |
| South Central Asia | 59 | 0.5% |
| South Eastern Asia | 72 | 0.6% |
| Southern Europe | 119 | 0.9% |
| Spain | 109 | 0.9% |
| St. Vincent and the Grenadines | 43 | 0.3% |
| Trinidad and Tobago | 49 | 0.4% |
| Ukraine | 50 | 0.4% |
| Vietnam | 13 | 0.1% |
| Western Africa | 7 | 0.1% |
| Western Asia | 63 | 0.5% |
| Western Europe | 19 | 0.2% | View All 54 Rows |
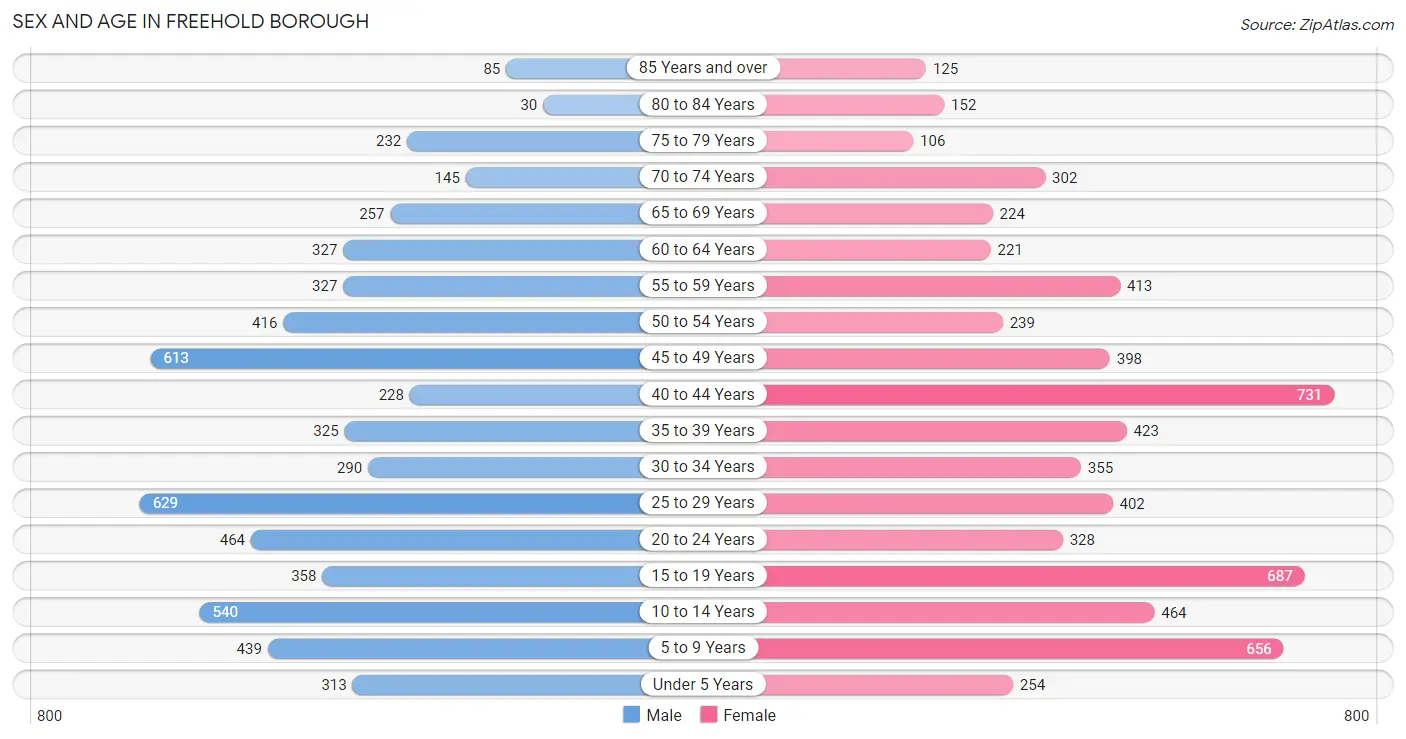
Sex and Age in Freehold borough
Sex and Age in Freehold borough
The most populous age groups in Freehold borough are 25 to 29 Years (629 | 10.4%) for men and 40 to 44 Years (731 | 11.3%) for women.
| Age Bracket | Male | Female |
| Under 5 Years | 313 (5.2%) | 254 (3.9%) |
| 5 to 9 Years | 439 (7.3%) | 656 (10.1%) |
| 10 to 14 Years | 540 (9.0%) | 464 (7.2%) |
| 15 to 19 Years | 358 (5.9%) | 687 (10.6%) |
| 20 to 24 Years | 464 (7.7%) | 328 (5.1%) |
| 25 to 29 Years | 629 (10.4%) | 402 (6.2%) |
| 30 to 34 Years | 290 (4.8%) | 355 (5.5%) |
| 35 to 39 Years | 325 (5.4%) | 423 (6.5%) |
| 40 to 44 Years | 228 (3.8%) | 731 (11.3%) |
| 45 to 49 Years | 613 (10.2%) | 398 (6.1%) |
| 50 to 54 Years | 416 (6.9%) | 239 (3.7%) |
| 55 to 59 Years | 327 (5.4%) | 413 (6.4%) |
| 60 to 64 Years | 327 (5.4%) | 221 (3.4%) |
| 65 to 69 Years | 257 (4.3%) | 224 (3.5%) |
| 70 to 74 Years | 145 (2.4%) | 302 (4.7%) |
| 75 to 79 Years | 232 (3.9%) | 106 (1.6%) |
| 80 to 84 Years | 30 (0.5%) | 152 (2.4%) |
| 85 Years and over | 85 (1.4%) | 125 (1.9%) |
| Total | 6,018 (100.0%) | 6,480 (100.0%) |
Families and Households in Freehold borough
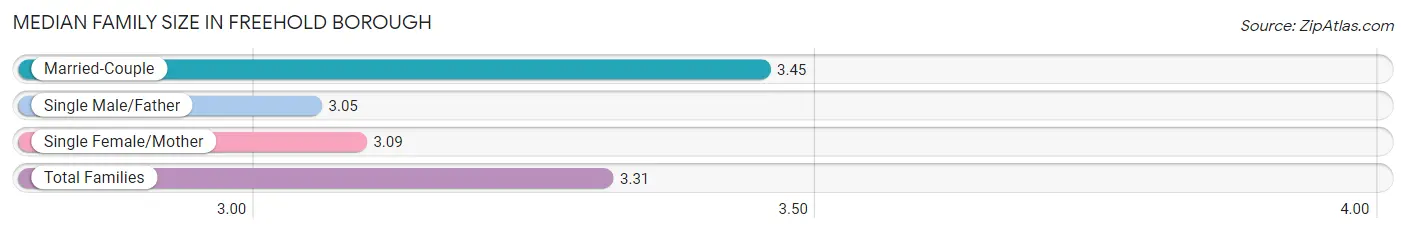
Median Family Size in Freehold borough
The median family size in Freehold borough is 3.31 persons per family, with married-couple families (1,856 | 62.1%) accounting for the largest median family size of 3.45 persons per family. On the other hand, single male/father families (378 | 12.6%) represent the smallest median family size with 3.05 persons per family.
| Family Type | # Families | Family Size |
| Married-Couple | 1,856 (62.1%) | 3.45 |
| Single Male/Father | 378 (12.6%) | 3.05 |
| Single Female/Mother | 757 (25.3%) | 3.09 |
| Total Families | 2,991 (100.0%) | 3.31 |
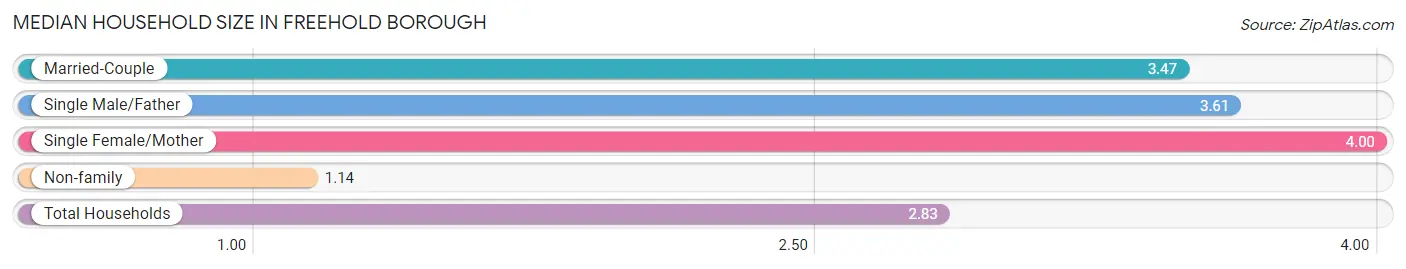
Median Household Size in Freehold borough
The median household size in Freehold borough is 2.83 persons per household, with single female/mother households (757 | 17.2%) accounting for the largest median household size of 4 persons per household. non-family households (1,397 | 31.8%) represent the smallest median household size with 1.14 persons per household.
| Household Type | # Households | Household Size |
| Married-Couple | 1,856 (42.3%) | 3.47 |
| Single Male/Father | 378 (8.6%) | 3.61 |
| Single Female/Mother | 757 (17.2%) | 4.00 |
| Non-family | 1,397 (31.8%) | 1.14 |
| Total Households | 4,388 (100.0%) | 2.83 |
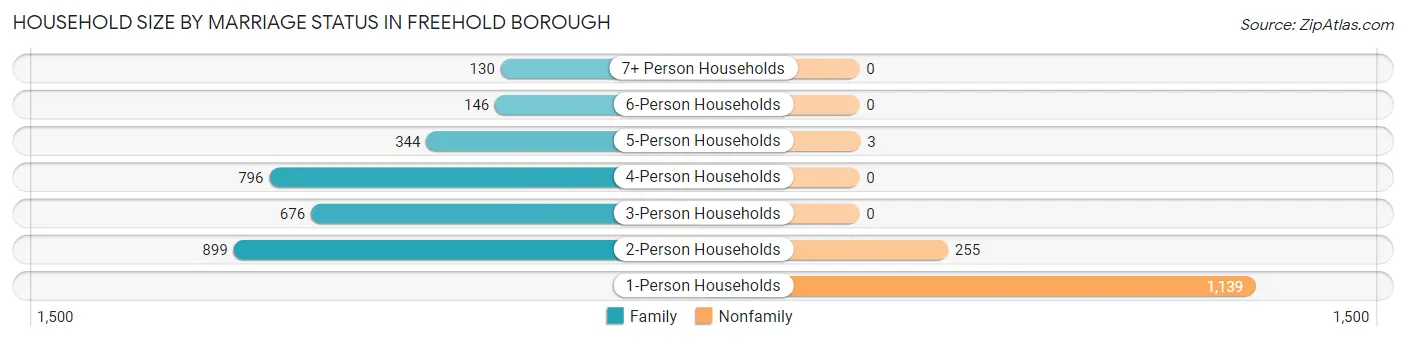
Household Size by Marriage Status in Freehold borough
Out of a total of 4,388 households in Freehold borough, 2,991 (68.2%) are family households, while 1,397 (31.8%) are nonfamily households. The most numerous type of family households are 2-person households, comprising 899, and the most common type of nonfamily households are 1-person households, comprising 1,139.
| Household Size | Family Households | Nonfamily Households |
| 1-Person Households | - | 1,139 (26.0%) |
| 2-Person Households | 899 (20.5%) | 255 (5.8%) |
| 3-Person Households | 676 (15.4%) | 0 (0.0%) |
| 4-Person Households | 796 (18.1%) | 0 (0.0%) |
| 5-Person Households | 344 (7.8%) | 3 (0.1%) |
| 6-Person Households | 146 (3.3%) | 0 (0.0%) |
| 7+ Person Households | 130 (3.0%) | 0 (0.0%) |
| Total | 2,991 (68.2%) | 1,397 (31.8%) |
Female Fertility in Freehold borough
Fertility by Age in Freehold borough
Average fertility rate in Freehold borough is 65.0 births per 1,000 women. Women in the age bracket of 20 to 34 years have the highest fertility rate with 193.0 births per 1,000 women. Women in the age bracket of 20 to 34 years acount for 96.8% of all women with births.
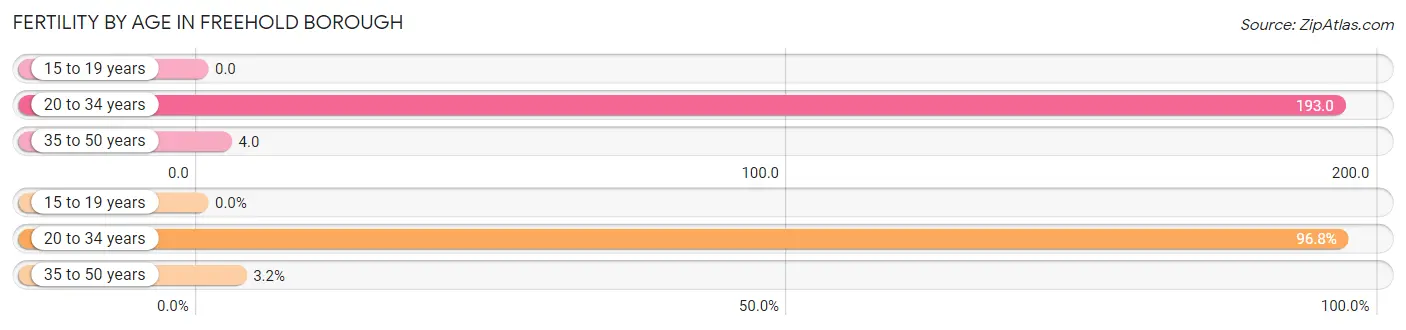
| Age Bracket | Women with Births | Births / 1,000 Women |
| 15 to 19 years | 0 (0.0%) | 0.0 |
| 20 to 34 years | 209 (96.8%) | 193.0 |
| 35 to 50 years | 7 (3.2%) | 4.0 |
| Total | 216 (100.0%) | 65.0 |
Fertility by Age by Marriage Status in Freehold borough
53.7% of women with births (216) in Freehold borough are married. The highest percentage of unmarried women with births falls into 20 to 34 years age bracket with 46.4% of them unmarried at the time of birth, while the lowest percentage of unmarried women with births belong to 35 to 50 years age bracket with 42.9% of them unmarried.
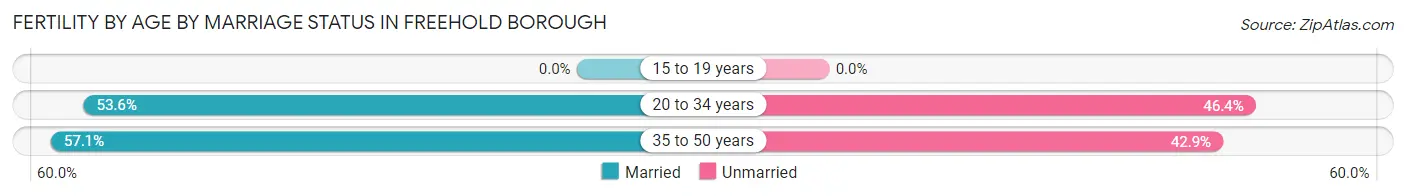
| Age Bracket | Married | Unmarried |
| 15 to 19 years | 0 (0.0%) | 0 (0.0%) |
| 20 to 34 years | 112 (53.6%) | 97 (46.4%) |
| 35 to 50 years | 4 (57.1%) | 3 (42.9%) |
| Total | 116 (53.7%) | 100 (46.3%) |
Fertility by Education in Freehold borough
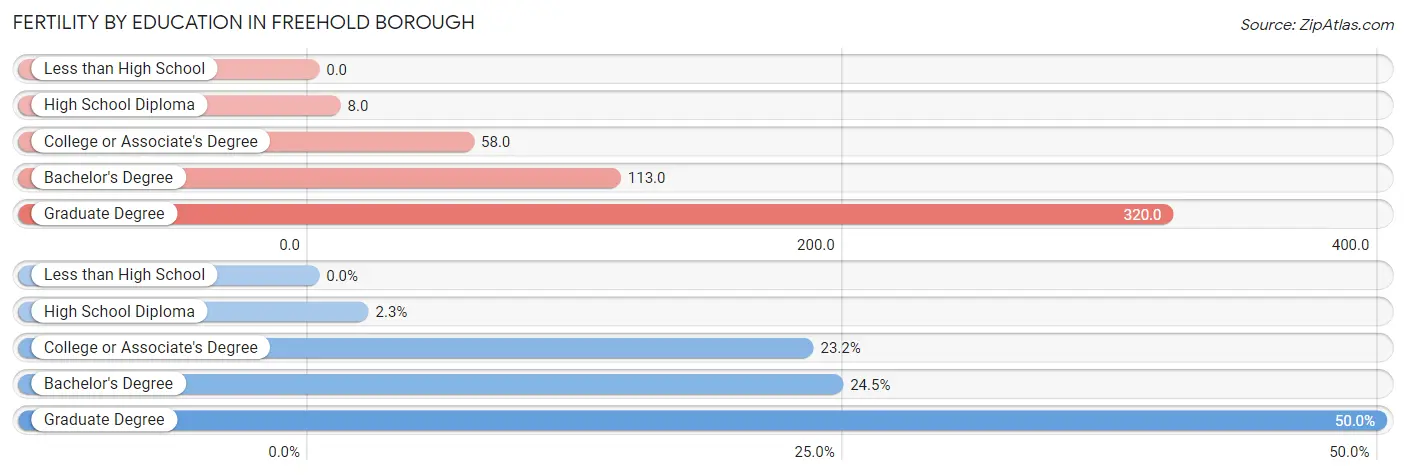
| Educational Attainment | Women with Births | Births / 1,000 Women |
| Less than High School | 0 (0.0%) | 0.0 |
| High School Diploma | 5 (2.3%) | 8.0 |
| College or Associate's Degree | 50 (23.2%) | 58.0 |
| Bachelor's Degree | 53 (24.5%) | 113.0 |
| Graduate Degree | 108 (50.0%) | 320.0 |
| Total | 216 (100.0%) | 65.0 |
Fertility by Education by Marriage Status in Freehold borough
46.3% of women with births in Freehold borough are unmarried. Women with the educational attainment of bachelor's degree are most likely to be married with 100.0% of them married at childbirth, while women with the educational attainment of high school diploma are least likely to be married with 100.0% of them unmarried at childbirth.
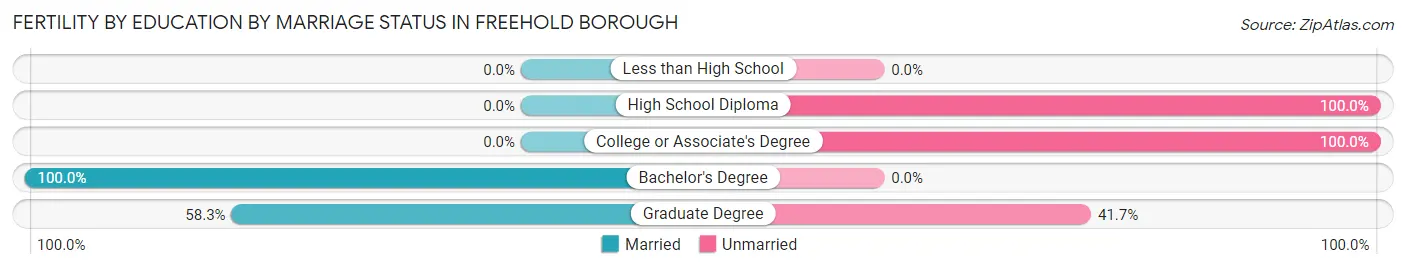
| Educational Attainment | Married | Unmarried |
| Less than High School | 0 (0.0%) | 0 (0.0%) |
| High School Diploma | 0 (0.0%) | 5 (100.0%) |
| College or Associate's Degree | 0 (0.0%) | 50 (100.0%) |
| Bachelor's Degree | 53 (100.0%) | 0 (0.0%) |
| Graduate Degree | 63 (58.3%) | 45 (41.7%) |
| Total | 116 (53.7%) | 100 (46.3%) |
Employment Characteristics in Freehold borough
Employment by Class of Employer in Freehold borough
Among the 6,291 employed individuals in Freehold borough, private company employees (4,802 | 76.3%), local government employees (595 | 9.5%), and not-for-profit organizations (455 | 7.2%) make up the most common classes of employment.
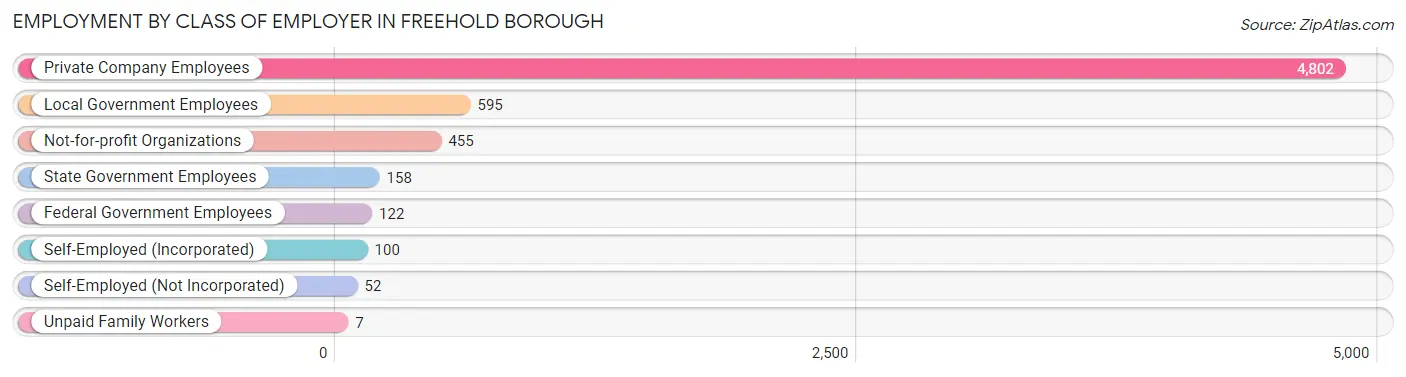
| Employer Class | # Employees | % Employees |
| Private Company Employees | 4,802 | 76.3% |
| Self-Employed (Incorporated) | 100 | 1.6% |
| Self-Employed (Not Incorporated) | 52 | 0.8% |
| Not-for-profit Organizations | 455 | 7.2% |
| Local Government Employees | 595 | 9.5% |
| State Government Employees | 158 | 2.5% |
| Federal Government Employees | 122 | 1.9% |
| Unpaid Family Workers | 7 | 0.1% |
| Total | 6,291 | 100.0% |
Employment Status by Age in Freehold borough
According to the labor force statistics for Freehold borough, out of the total population over 16 years of age (9,527), 72.8% or 6,936 individuals are in the labor force, with 8.2% or 569 of them unemployed. The age group with the highest labor force participation rate is 25 to 29 years, with 96.4% or 994 individuals in the labor force. Within the labor force, the 60 to 64 years age range has the highest percentage of unemployed individuals, with 31.0% or 103 of them being unemployed.
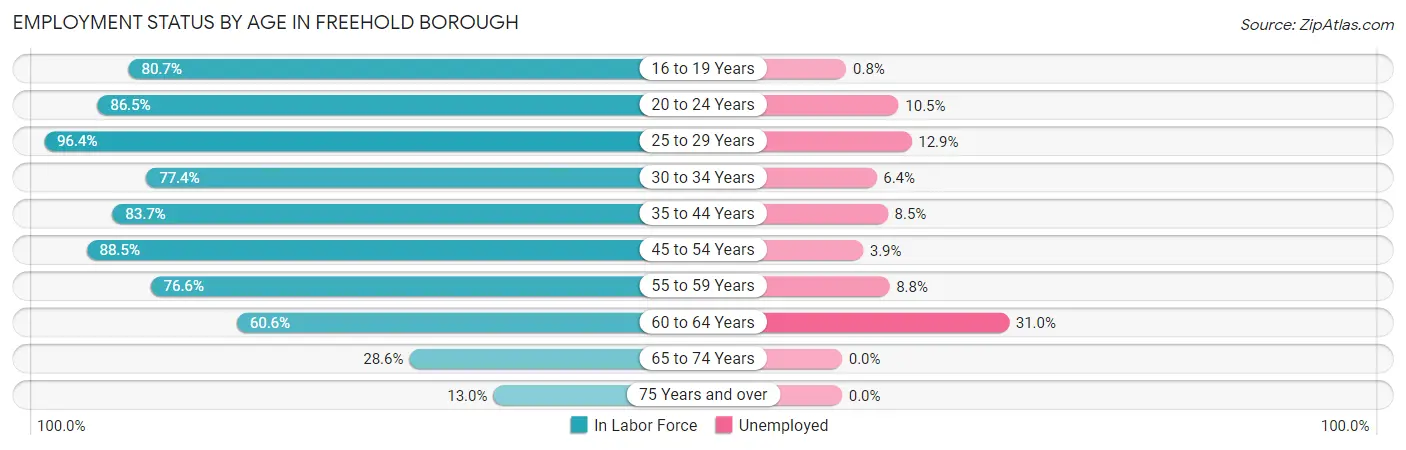
| Age Bracket | In Labor Force | Unemployed |
| 16 to 19 Years | 597 (80.7%) | 5 (0.8%) |
| 20 to 24 Years | 685 (86.5%) | 72 (10.5%) |
| 25 to 29 Years | 994 (96.4%) | 128 (12.9%) |
| 30 to 34 Years | 499 (77.4%) | 32 (6.4%) |
| 35 to 44 Years | 1,429 (83.7%) | 121 (8.5%) |
| 45 to 54 Years | 1,474 (88.5%) | 57 (3.9%) |
| 55 to 59 Years | 567 (76.6%) | 50 (8.8%) |
| 60 to 64 Years | 332 (60.6%) | 103 (31.0%) |
| 65 to 74 Years | 265 (28.6%) | 0 (0.0%) |
| 75 Years and over | 95 (13.0%) | 0 (0.0%) |
| Total | 6,936 (72.8%) | 569 (8.2%) |
Employment Status by Educational Attainment in Freehold borough
According to labor force statistics for Freehold borough, 83.5% of individuals (5,291) out of the total population between 25 and 64 years of age (6,337) are in the labor force, with 9.3% or 492 of them being unemployed. The group with the highest labor force participation rate are those with the educational attainment of bachelor's degree or higher, with 90.7% or 1,656 individuals in the labor force. Within the labor force, individuals with college / associate degree education have the highest percentage of unemployment, with 13.5% or 164 of them being unemployed.
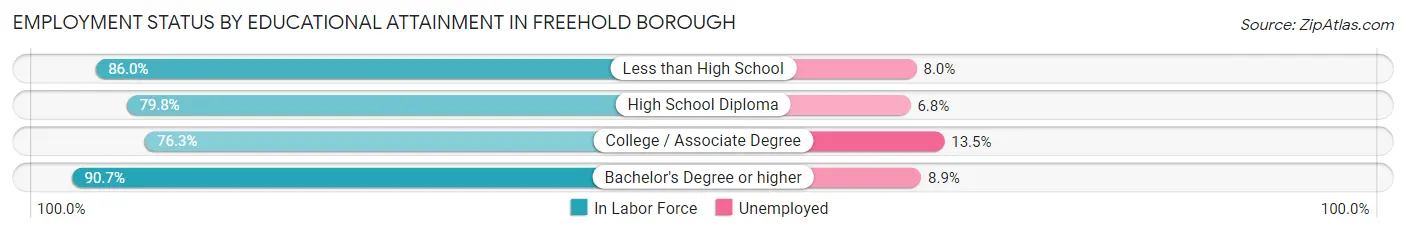
| Educational Attainment | In Labor Force | Unemployed |
| Less than High School | 1,317 (86.0%) | 122 (8.0%) |
| High School Diploma | 1,108 (79.8%) | 94 (6.8%) |
| College / Associate Degree | 1,214 (76.3%) | 215 (13.5%) |
| Bachelor's Degree or higher | 1,656 (90.7%) | 163 (8.9%) |
| Total | 5,291 (83.5%) | 589 (9.3%) |
Employment Occupations by Sex in Freehold borough
Management, Business, Science and Arts Occupations
The most common Management, Business, Science and Arts occupations in Freehold borough are Community & Social Service (657 | 10.4%), Management (401 | 6.3%), Education Instruction & Library (356 | 5.6%), Health Diagnosing & Treating (274 | 4.3%), and Business & Financial (273 | 4.3%).
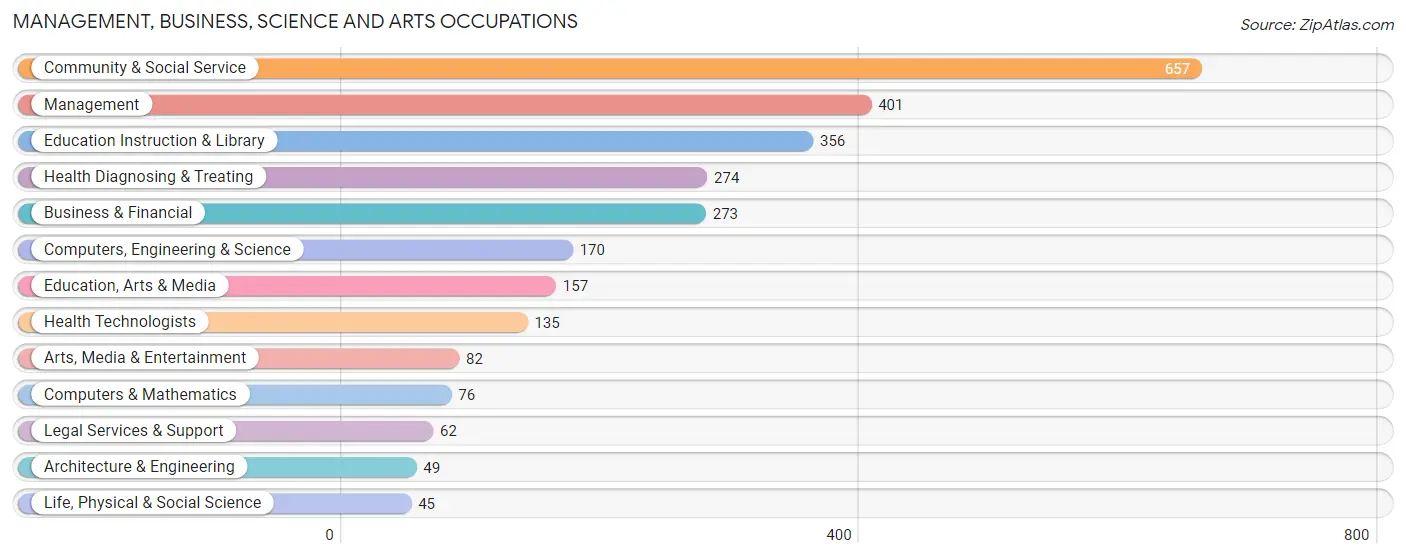
Management, Business, Science and Arts Occupations by Sex
Within the Management, Business, Science and Arts occupations in Freehold borough, the most male-oriented occupations are Computers & Mathematics (100.0%), Architecture & Engineering (100.0%), and Computers, Engineering & Science (73.5%), while the most female-oriented occupations are Life, Physical & Social Science (100.0%), Education Instruction & Library (81.2%), and Legal Services & Support (79.0%).
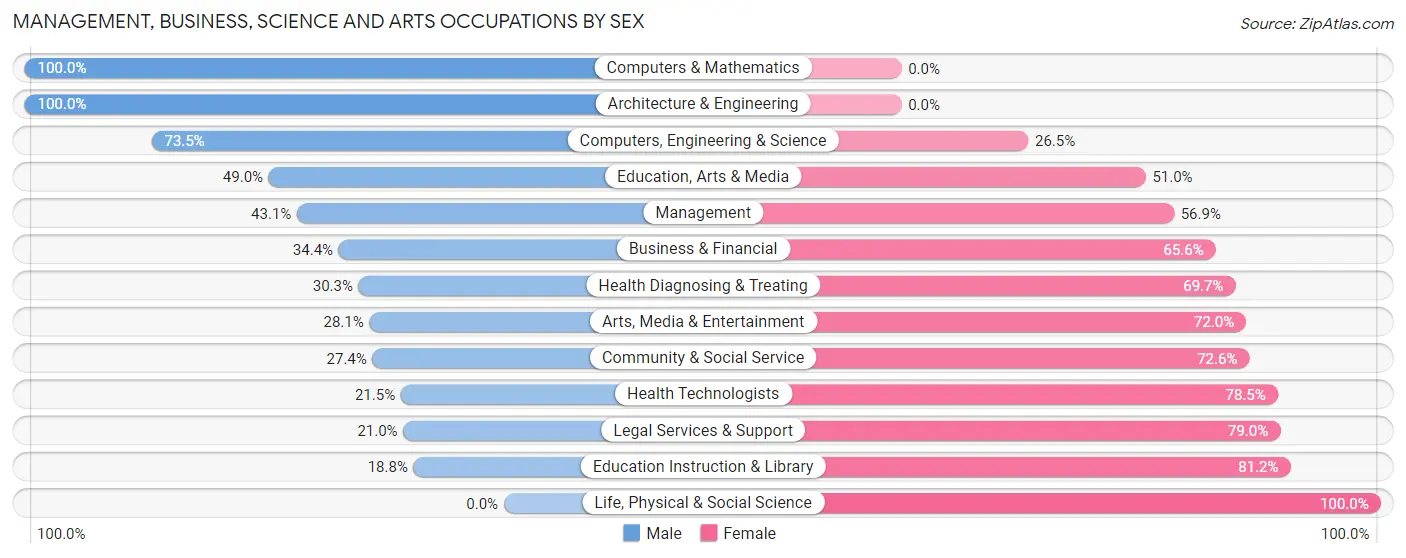
| Occupation | Male | Female |
| Management | 173 (43.1%) | 228 (56.9%) |
| Business & Financial | 94 (34.4%) | 179 (65.6%) |
| Computers, Engineering & Science | 125 (73.5%) | 45 (26.5%) |
| Computers & Mathematics | 76 (100.0%) | 0 (0.0%) |
| Architecture & Engineering | 49 (100.0%) | 0 (0.0%) |
| Life, Physical & Social Science | 0 (0.0%) | 45 (100.0%) |
| Community & Social Service | 180 (27.4%) | 477 (72.6%) |
| Education, Arts & Media | 77 (49.0%) | 80 (51.0%) |
| Legal Services & Support | 13 (21.0%) | 49 (79.0%) |
| Education Instruction & Library | 67 (18.8%) | 289 (81.2%) |
| Arts, Media & Entertainment | 23 (28.1%) | 59 (72.0%) |
| Health Diagnosing & Treating | 83 (30.3%) | 191 (69.7%) |
| Health Technologists | 29 (21.5%) | 106 (78.5%) |
| Total (Category) | 655 (36.9%) | 1,120 (63.1%) |
| Total (Overall) | 3,207 (50.6%) | 3,132 (49.4%) |
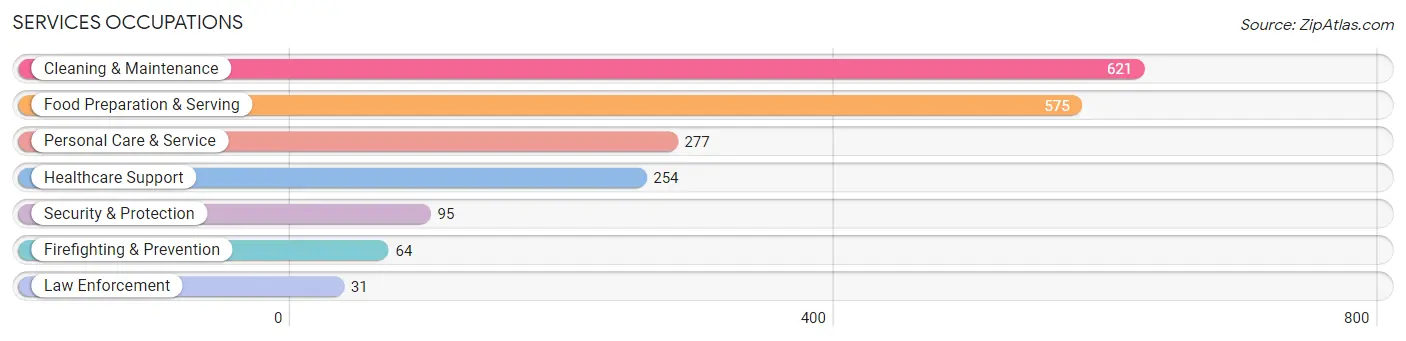
Services Occupations
The most common Services occupations in Freehold borough are Cleaning & Maintenance (621 | 9.8%), Food Preparation & Serving (575 | 9.1%), Personal Care & Service (277 | 4.4%), Healthcare Support (254 | 4.0%), and Security & Protection (95 | 1.5%).
Services Occupations by Sex
Within the Services occupations in Freehold borough, the most male-oriented occupations are Law Enforcement (100.0%), Security & Protection (91.6%), and Firefighting & Prevention (87.5%), while the most female-oriented occupations are Healthcare Support (81.1%), Personal Care & Service (80.1%), and Cleaning & Maintenance (51.7%).
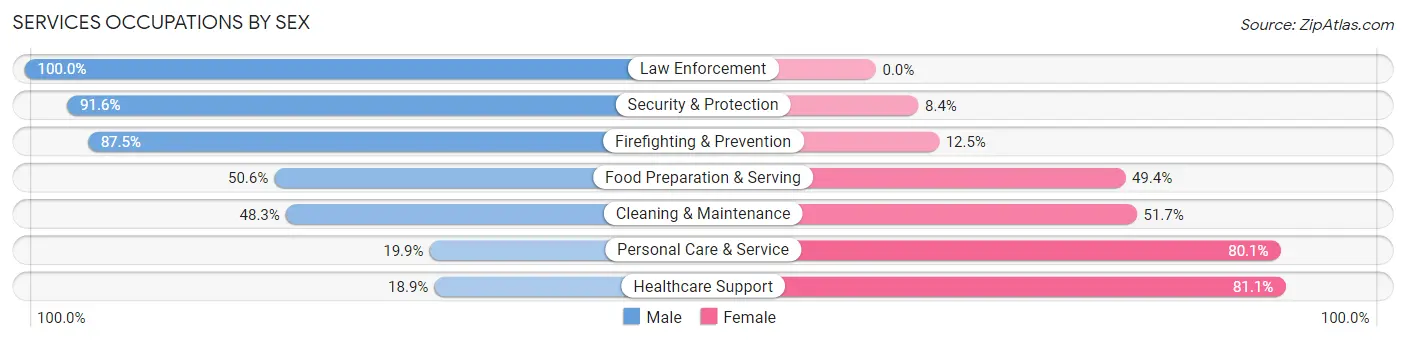
| Occupation | Male | Female |
| Healthcare Support | 48 (18.9%) | 206 (81.1%) |
| Security & Protection | 87 (91.6%) | 8 (8.4%) |
| Firefighting & Prevention | 56 (87.5%) | 8 (12.5%) |
| Law Enforcement | 31 (100.0%) | 0 (0.0%) |
| Food Preparation & Serving | 291 (50.6%) | 284 (49.4%) |
| Cleaning & Maintenance | 300 (48.3%) | 321 (51.7%) |
| Personal Care & Service | 55 (19.9%) | 222 (80.1%) |
| Total (Category) | 781 (42.9%) | 1,041 (57.1%) |
| Total (Overall) | 3,207 (50.6%) | 3,132 (49.4%) |
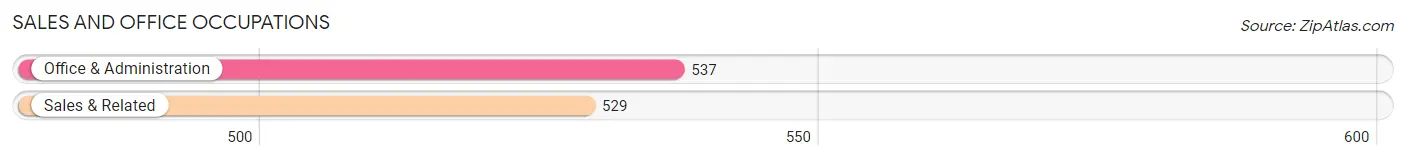
Sales and Office Occupations
The most common Sales and Office occupations in Freehold borough are Office & Administration (537 | 8.5%), and Sales & Related (529 | 8.4%).
Sales and Office Occupations by Sex
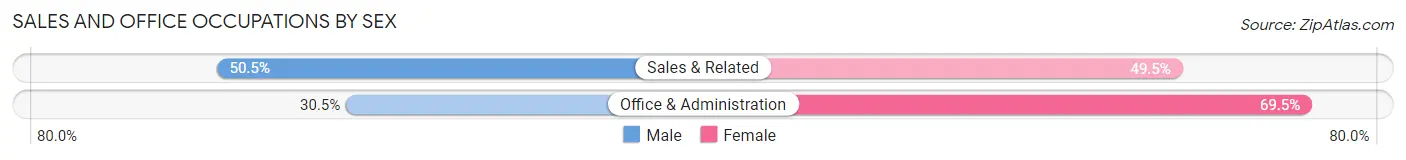
| Occupation | Male | Female |
| Sales & Related | 267 (50.5%) | 262 (49.5%) |
| Office & Administration | 164 (30.5%) | 373 (69.5%) |
| Total (Category) | 431 (40.4%) | 635 (59.6%) |
| Total (Overall) | 3,207 (50.6%) | 3,132 (49.4%) |
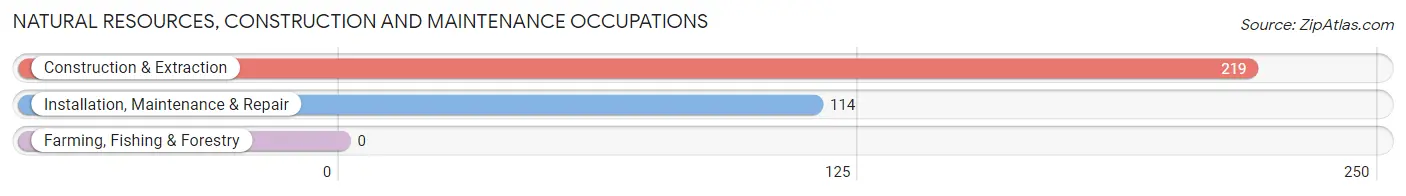
Natural Resources, Construction and Maintenance Occupations
The most common Natural Resources, Construction and Maintenance occupations in Freehold borough are Construction & Extraction (219 | 3.5%), and Installation, Maintenance & Repair (114 | 1.8%).
Natural Resources, Construction and Maintenance Occupations by Sex
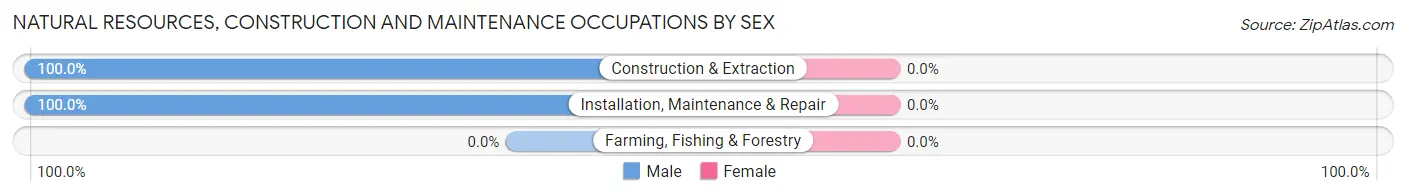
| Occupation | Male | Female |
| Farming, Fishing & Forestry | 0 (0.0%) | 0 (0.0%) |
| Construction & Extraction | 219 (100.0%) | 0 (0.0%) |
| Installation, Maintenance & Repair | 114 (100.0%) | 0 (0.0%) |
| Total (Category) | 333 (100.0%) | 0 (0.0%) |
| Total (Overall) | 3,207 (50.6%) | 3,132 (49.4%) |
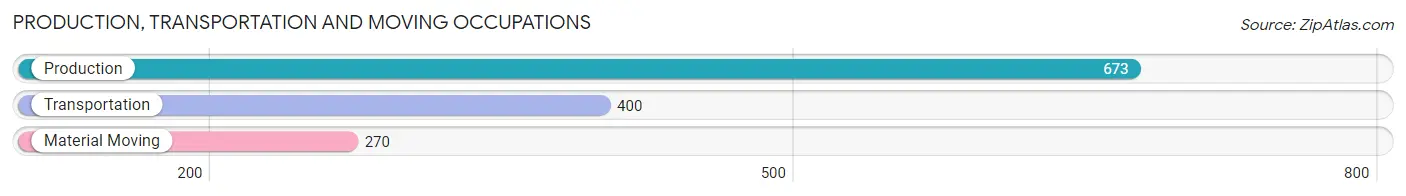
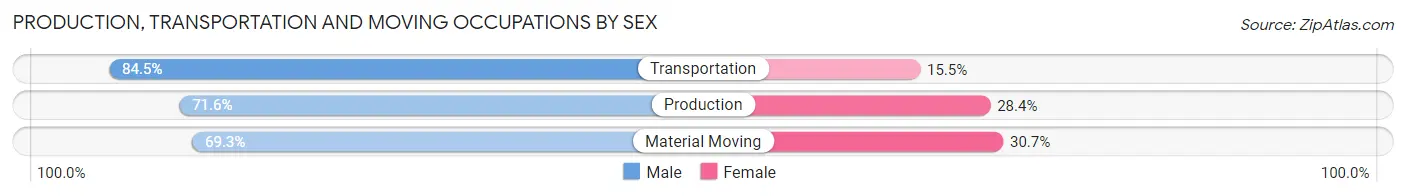
Production, Transportation and Moving Occupations
The most common Production, Transportation and Moving occupations in Freehold borough are Production (673 | 10.6%), Transportation (400 | 6.3%), and Material Moving (270 | 4.3%).
Production, Transportation and Moving Occupations by Sex
| Occupation | Male | Female |
| Production | 482 (71.6%) | 191 (28.4%) |
| Transportation | 338 (84.5%) | 62 (15.5%) |
| Material Moving | 187 (69.3%) | 83 (30.7%) |
| Total (Category) | 1,007 (75.0%) | 336 (25.0%) |
| Total (Overall) | 3,207 (50.6%) | 3,132 (49.4%) |
Employment Industries by Sex in Freehold borough
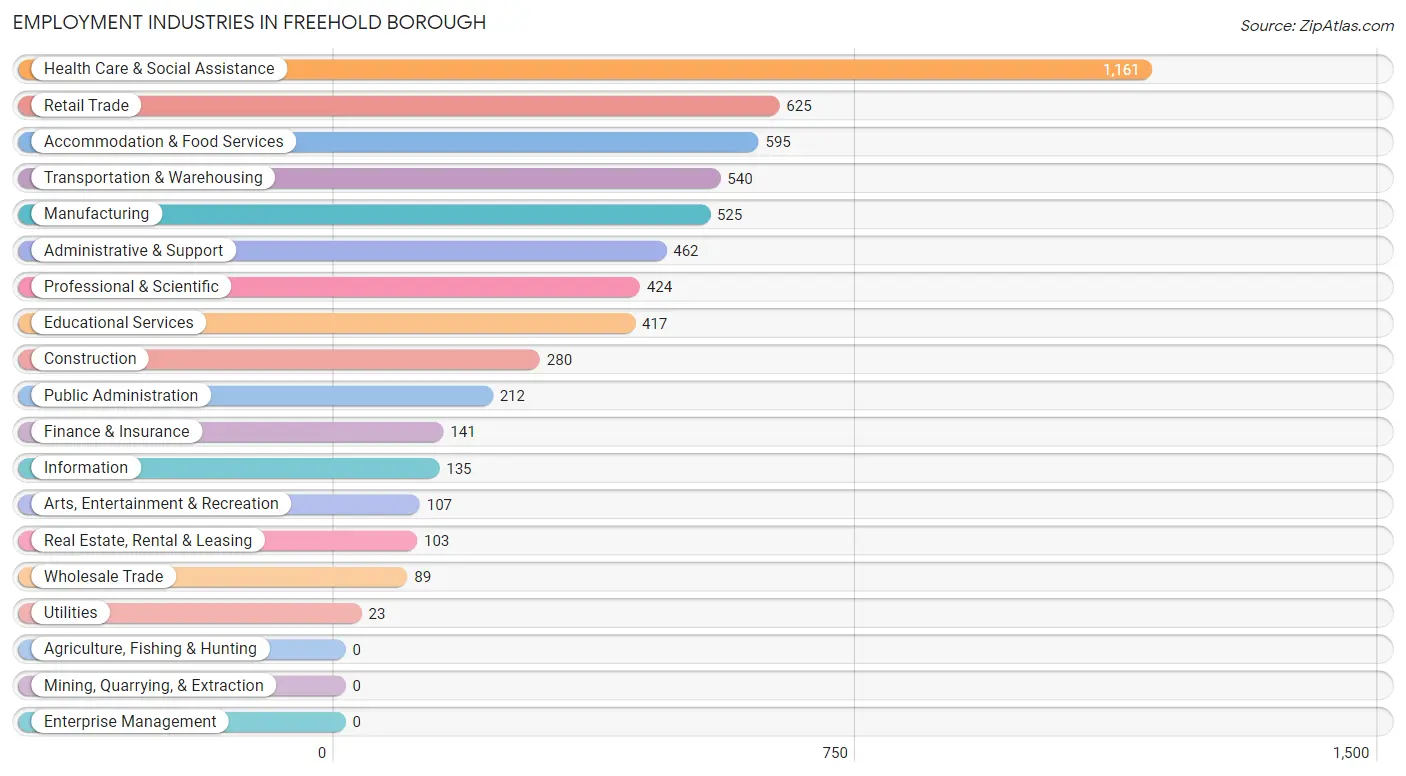
Employment Industries in Freehold borough
The major employment industries in Freehold borough include Health Care & Social Assistance (1,161 | 18.3%), Retail Trade (625 | 9.9%), Accommodation & Food Services (595 | 9.4%), Transportation & Warehousing (540 | 8.5%), and Manufacturing (525 | 8.3%).
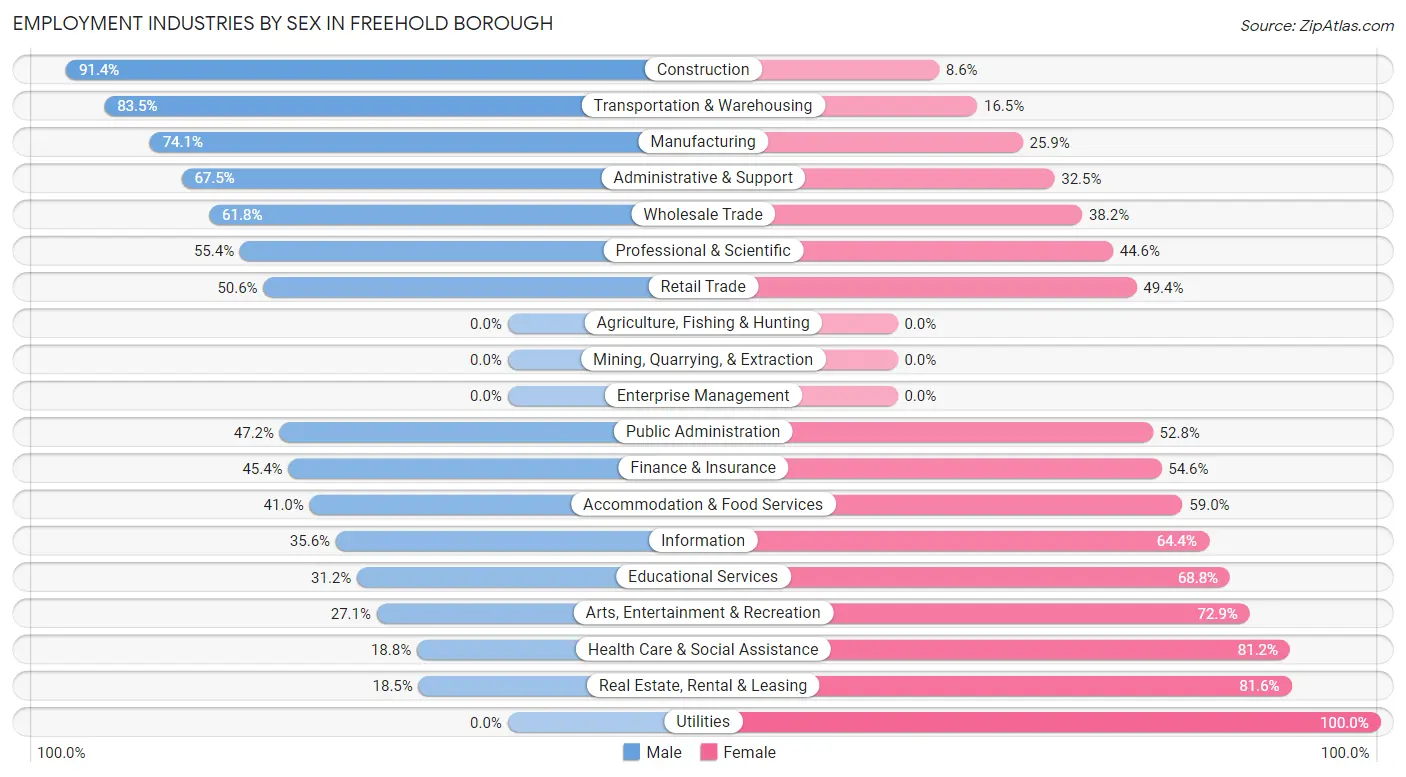
Employment Industries by Sex in Freehold borough
The Freehold borough industries that see more men than women are Construction (91.4%), Transportation & Warehousing (83.5%), and Manufacturing (74.1%), whereas the industries that tend to have a higher number of women are Utilities (100.0%), Real Estate, Rental & Leasing (81.6%), and Health Care & Social Assistance (81.2%).
| Industry | Male | Female |
| Agriculture, Fishing & Hunting | 0 (0.0%) | 0 (0.0%) |
| Mining, Quarrying, & Extraction | 0 (0.0%) | 0 (0.0%) |
| Construction | 256 (91.4%) | 24 (8.6%) |
| Manufacturing | 389 (74.1%) | 136 (25.9%) |
| Wholesale Trade | 55 (61.8%) | 34 (38.2%) |
| Retail Trade | 316 (50.6%) | 309 (49.4%) |
| Transportation & Warehousing | 451 (83.5%) | 89 (16.5%) |
| Utilities | 0 (0.0%) | 23 (100.0%) |
| Information | 48 (35.6%) | 87 (64.4%) |
| Finance & Insurance | 64 (45.4%) | 77 (54.6%) |
| Real Estate, Rental & Leasing | 19 (18.4%) | 84 (81.6%) |
| Professional & Scientific | 235 (55.4%) | 189 (44.6%) |
| Enterprise Management | 0 (0.0%) | 0 (0.0%) |
| Administrative & Support | 312 (67.5%) | 150 (32.5%) |
| Educational Services | 130 (31.2%) | 287 (68.8%) |
| Health Care & Social Assistance | 218 (18.8%) | 943 (81.2%) |
| Arts, Entertainment & Recreation | 29 (27.1%) | 78 (72.9%) |
| Accommodation & Food Services | 244 (41.0%) | 351 (59.0%) |
| Public Administration | 100 (47.2%) | 112 (52.8%) |
| Total | 3,207 (50.6%) | 3,132 (49.4%) |
Education in Freehold borough
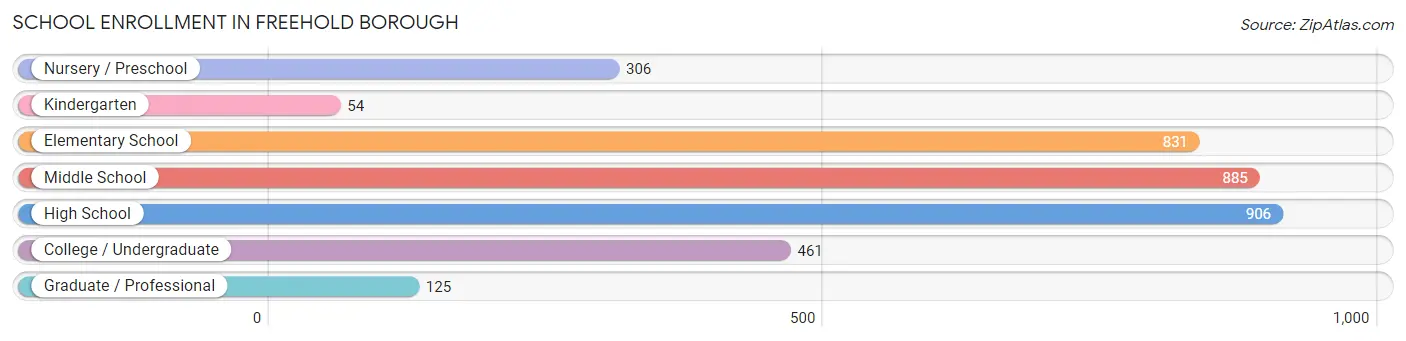
School Enrollment in Freehold borough
The most common levels of schooling among the 3,568 students in Freehold borough are high school (906 | 25.4%), middle school (885 | 24.8%), and elementary school (831 | 23.3%).
| School Level | # Students | % Students |
| Nursery / Preschool | 306 | 8.6% |
| Kindergarten | 54 | 1.5% |
| Elementary School | 831 | 23.3% |
| Middle School | 885 | 24.8% |
| High School | 906 | 25.4% |
| College / Undergraduate | 461 | 12.9% |
| Graduate / Professional | 125 | 3.5% |
| Total | 3,568 | 100.0% |
School Enrollment by Age by Funding Source in Freehold borough
Out of a total of 3,568 students who are enrolled in schools in Freehold borough, 453 (12.7%) attend a private institution, while the remaining 3,115 (87.3%) are enrolled in public schools. The age group of 35 years and over has the highest likelihood of being enrolled in private schools, with 78 (56.9% in the age bracket) enrolled. Conversely, the age group of 10 to 14 year olds has the lowest likelihood of being enrolled in a private school, with 984 (98.0% in the age bracket) attending a public institution.
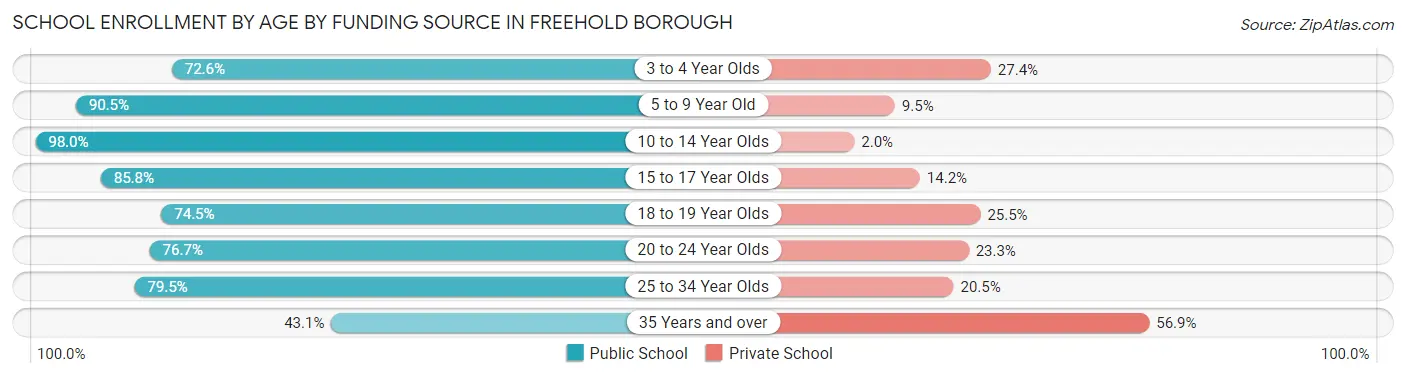
| Age Bracket | Public School | Private School |
| 3 to 4 Year Olds | 45 (72.6%) | 17 (27.4%) |
| 5 to 9 Year Old | 986 (90.5%) | 104 (9.5%) |
| 10 to 14 Year Olds | 984 (98.0%) | 20 (2.0%) |
| 15 to 17 Year Olds | 568 (85.8%) | 94 (14.2%) |
| 18 to 19 Year Olds | 155 (74.5%) | 53 (25.5%) |
| 20 to 24 Year Olds | 112 (76.7%) | 34 (23.3%) |
| 25 to 34 Year Olds | 206 (79.5%) | 53 (20.5%) |
| 35 Years and over | 59 (43.1%) | 78 (56.9%) |
| Total | 3,115 (87.3%) | 453 (12.7%) |
Educational Attainment by Field of Study in Freehold borough
Business (619 | 23.0%), education (450 | 16.7%), psychology (232 | 8.6%), science & technology (223 | 8.3%), and social sciences (218 | 8.1%) are the most common fields of study among 2,693 individuals in Freehold borough who have obtained a bachelor's degree or higher.
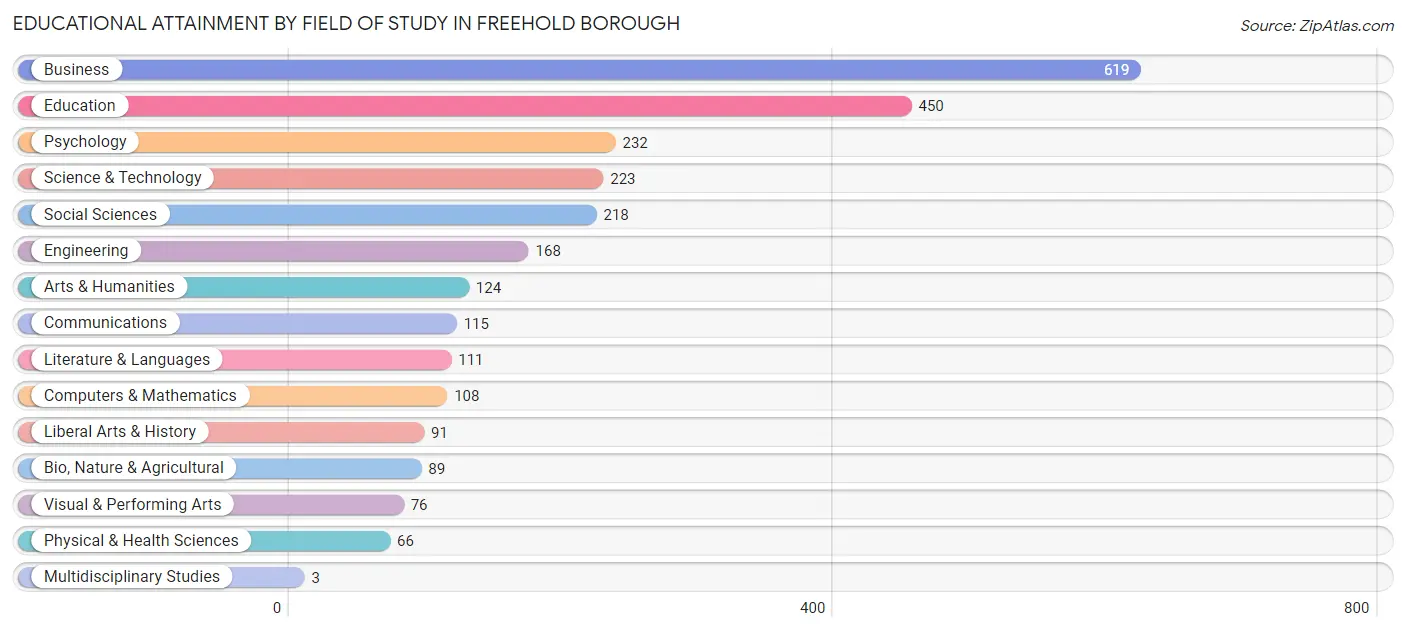
| Field of Study | # Graduates | % Graduates |
| Computers & Mathematics | 108 | 4.0% |
| Bio, Nature & Agricultural | 89 | 3.3% |
| Physical & Health Sciences | 66 | 2.5% |
| Psychology | 232 | 8.6% |
| Social Sciences | 218 | 8.1% |
| Engineering | 168 | 6.2% |
| Multidisciplinary Studies | 3 | 0.1% |
| Science & Technology | 223 | 8.3% |
| Business | 619 | 23.0% |
| Education | 450 | 16.7% |
| Literature & Languages | 111 | 4.1% |
| Liberal Arts & History | 91 | 3.4% |
| Visual & Performing Arts | 76 | 2.8% |
| Communications | 115 | 4.3% |
| Arts & Humanities | 124 | 4.6% |
| Total | 2,693 | 100.0% |
Transportation & Commute in Freehold borough
Vehicle Availability by Sex in Freehold borough
The most prevalent vehicle ownership categories in Freehold borough are males with 2 vehicles (1,263, accounting for 39.2%) and females with 2 vehicles (1,286, making up 41.4%).
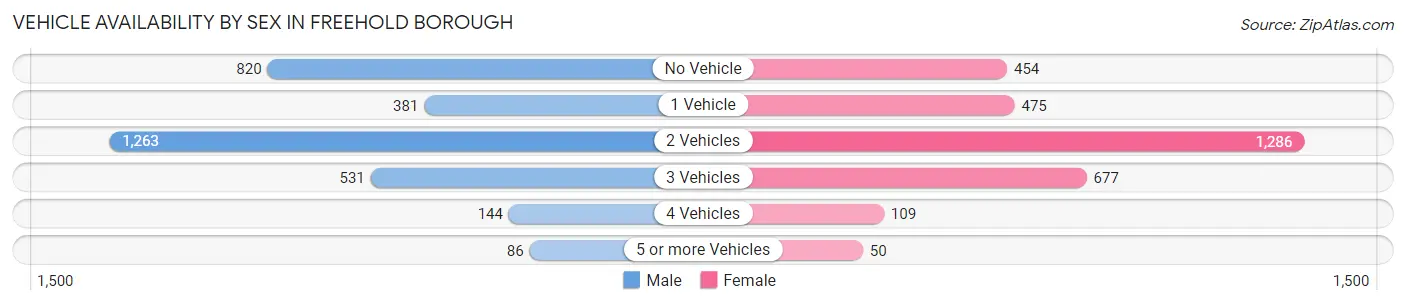
| Vehicles Available | Male | Female |
| No Vehicle | 820 (25.4%) | 454 (14.9%) |
| 1 Vehicle | 381 (11.8%) | 475 (15.6%) |
| 2 Vehicles | 1,263 (39.2%) | 1,286 (42.1%) |
| 3 Vehicles | 531 (16.5%) | 677 (22.2%) |
| 4 Vehicles | 144 (4.5%) | 109 (3.6%) |
| 5 or more Vehicles | 86 (2.7%) | 50 (1.6%) |
| Total | 3,225 (100.0%) | 3,051 (100.0%) |
Commute Time in Freehold borough
The most frequently occuring commute durations in Freehold borough are 15 to 19 minutes (1,271 commuters, 22.0%), 5 to 9 minutes (740 commuters, 12.8%), and 30 to 34 minutes (738 commuters, 12.8%).
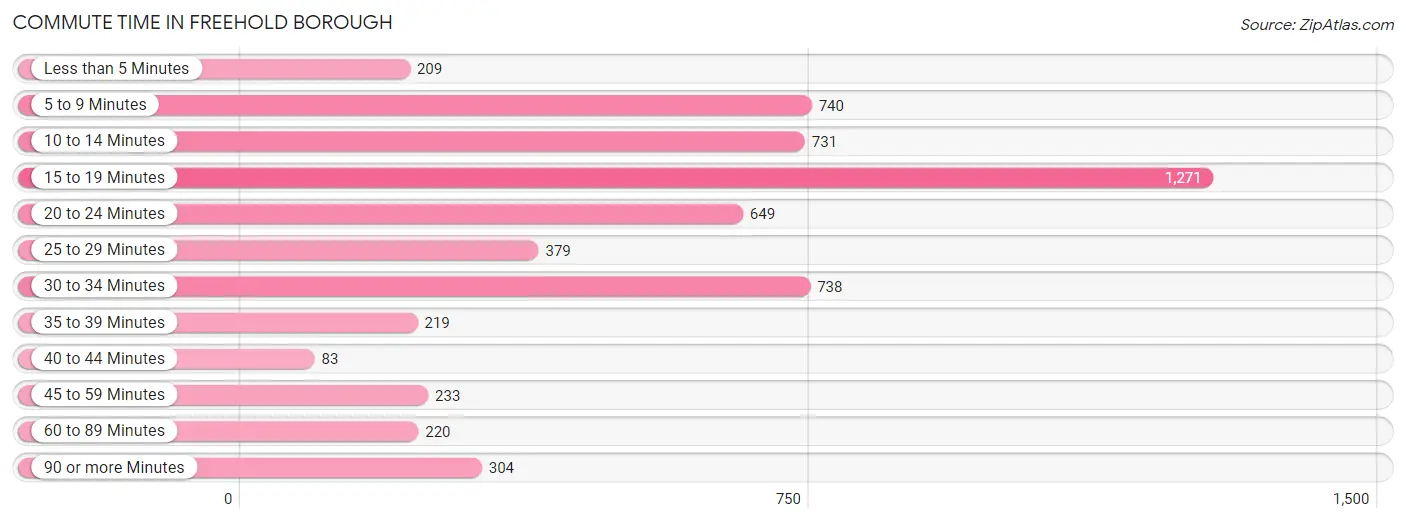
| Commute Time | # Commuters | % Commuters |
| Less than 5 Minutes | 209 | 3.6% |
| 5 to 9 Minutes | 740 | 12.8% |
| 10 to 14 Minutes | 731 | 12.7% |
| 15 to 19 Minutes | 1,271 | 22.0% |
| 20 to 24 Minutes | 649 | 11.2% |
| 25 to 29 Minutes | 379 | 6.6% |
| 30 to 34 Minutes | 738 | 12.8% |
| 35 to 39 Minutes | 219 | 3.8% |
| 40 to 44 Minutes | 83 | 1.4% |
| 45 to 59 Minutes | 233 | 4.0% |
| 60 to 89 Minutes | 220 | 3.8% |
| 90 or more Minutes | 304 | 5.3% |
Commute Time by Sex in Freehold borough
The most common commute times in Freehold borough are 15 to 19 minutes (805 commuters, 26.6%) for males and 15 to 19 minutes (466 commuters, 17.0%) for females.
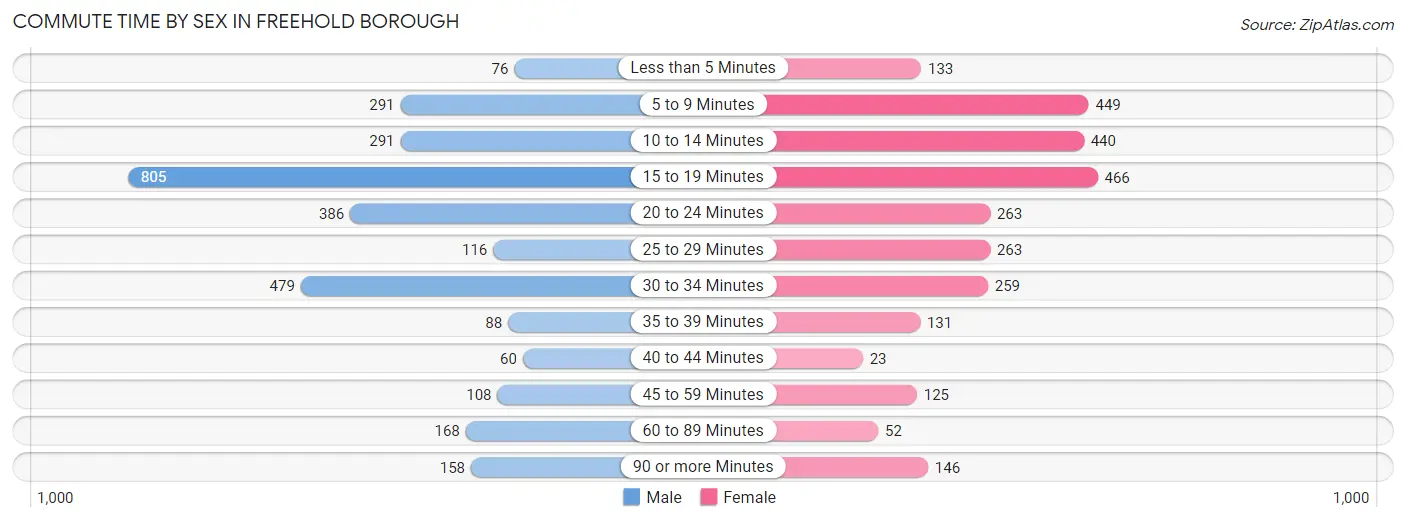
| Commute Time | Male | Female |
| Less than 5 Minutes | 76 (2.5%) | 133 (4.8%) |
| 5 to 9 Minutes | 291 (9.6%) | 449 (16.3%) |
| 10 to 14 Minutes | 291 (9.6%) | 440 (16.0%) |
| 15 to 19 Minutes | 805 (26.6%) | 466 (17.0%) |
| 20 to 24 Minutes | 386 (12.8%) | 263 (9.6%) |
| 25 to 29 Minutes | 116 (3.8%) | 263 (9.6%) |
| 30 to 34 Minutes | 479 (15.8%) | 259 (9.4%) |
| 35 to 39 Minutes | 88 (2.9%) | 131 (4.8%) |
| 40 to 44 Minutes | 60 (2.0%) | 23 (0.8%) |
| 45 to 59 Minutes | 108 (3.6%) | 125 (4.5%) |
| 60 to 89 Minutes | 168 (5.6%) | 52 (1.9%) |
| 90 or more Minutes | 158 (5.2%) | 146 (5.3%) |
Time of Departure to Work by Sex in Freehold borough
The most frequent times of departure to work in Freehold borough are 6:30 AM to 6:59 AM (560, 18.5%) for males and 7:00 AM to 7:29 AM (608, 22.1%) for females.
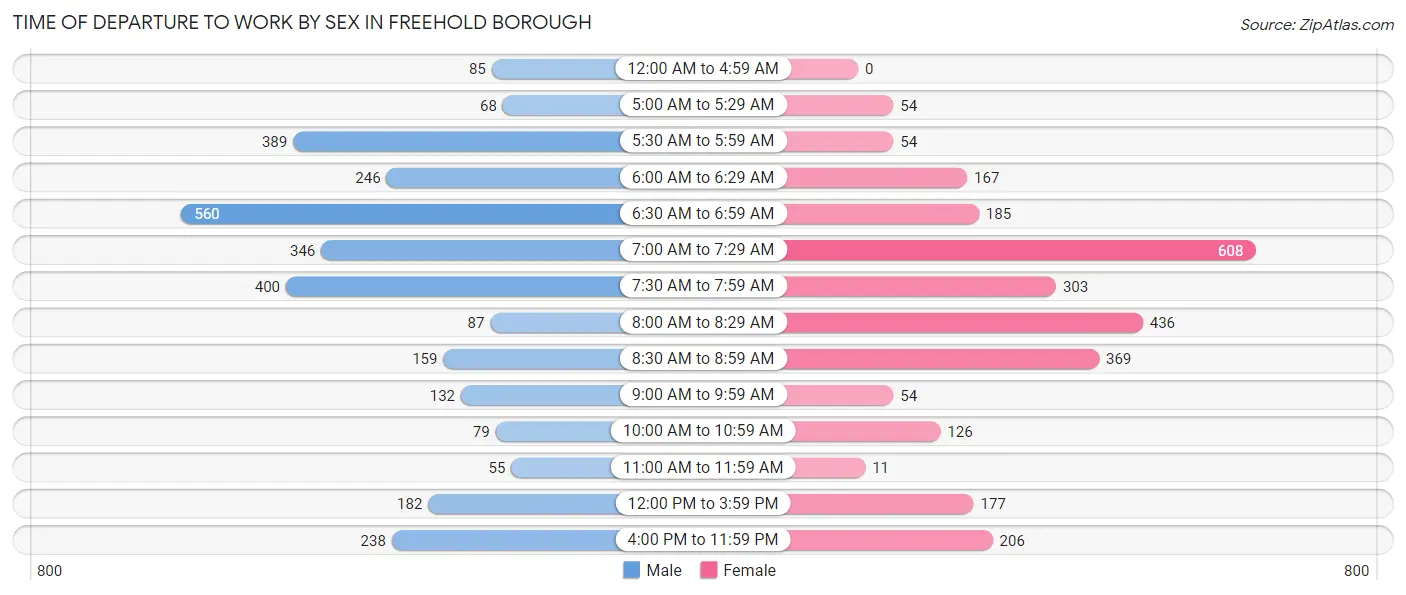
| Time of Departure | Male | Female |
| 12:00 AM to 4:59 AM | 85 (2.8%) | 0 (0.0%) |
| 5:00 AM to 5:29 AM | 68 (2.2%) | 54 (2.0%) |
| 5:30 AM to 5:59 AM | 389 (12.9%) | 54 (2.0%) |
| 6:00 AM to 6:29 AM | 246 (8.1%) | 167 (6.1%) |
| 6:30 AM to 6:59 AM | 560 (18.5%) | 185 (6.7%) |
| 7:00 AM to 7:29 AM | 346 (11.4%) | 608 (22.1%) |
| 7:30 AM to 7:59 AM | 400 (13.2%) | 303 (11.0%) |
| 8:00 AM to 8:29 AM | 87 (2.9%) | 436 (15.9%) |
| 8:30 AM to 8:59 AM | 159 (5.2%) | 369 (13.4%) |
| 9:00 AM to 9:59 AM | 132 (4.4%) | 54 (2.0%) |
| 10:00 AM to 10:59 AM | 79 (2.6%) | 126 (4.6%) |
| 11:00 AM to 11:59 AM | 55 (1.8%) | 11 (0.4%) |
| 12:00 PM to 3:59 PM | 182 (6.0%) | 177 (6.4%) |
| 4:00 PM to 11:59 PM | 238 (7.9%) | 206 (7.5%) |
| Total | 3,026 (100.0%) | 2,750 (100.0%) |
Housing Occupancy in Freehold borough
Occupancy by Ownership in Freehold borough
Of the total 4,388 dwellings in Freehold borough, owner-occupied units account for 2,239 (51.0%), while renter-occupied units make up 2,149 (49.0%).
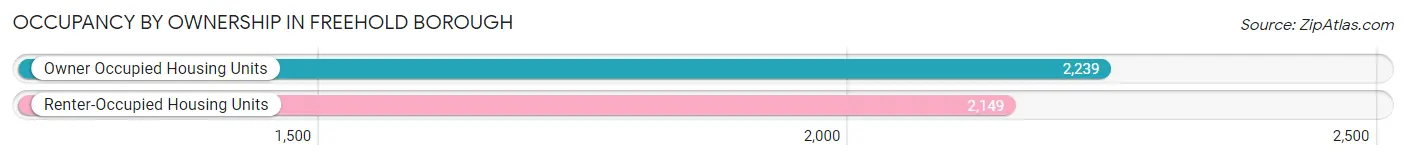
| Occupancy | # Housing Units | % Housing Units |
| Owner Occupied Housing Units | 2,239 | 51.0% |
| Renter-Occupied Housing Units | 2,149 | 49.0% |
| Total Occupied Housing Units | 4,388 | 100.0% |
Occupancy by Household Size in Freehold borough
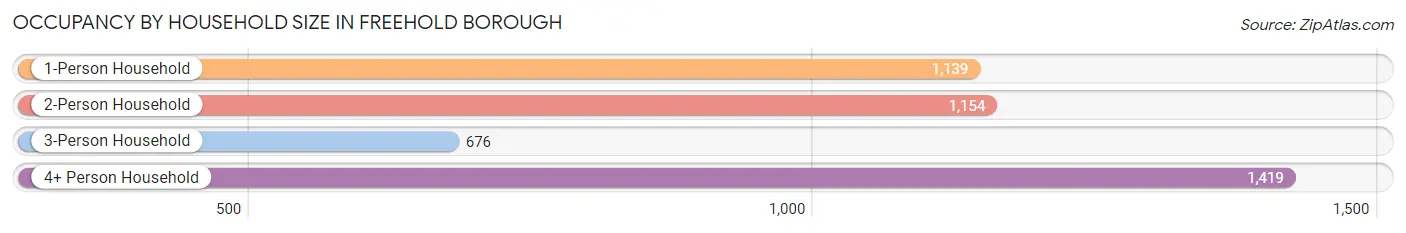
| Household Size | # Housing Units | % Housing Units |
| 1-Person Household | 1,139 | 26.0% |
| 2-Person Household | 1,154 | 26.3% |
| 3-Person Household | 676 | 15.4% |
| 4+ Person Household | 1,419 | 32.3% |
| Total Housing Units | 4,388 | 100.0% |
Occupancy by Ownership by Household Size in Freehold borough
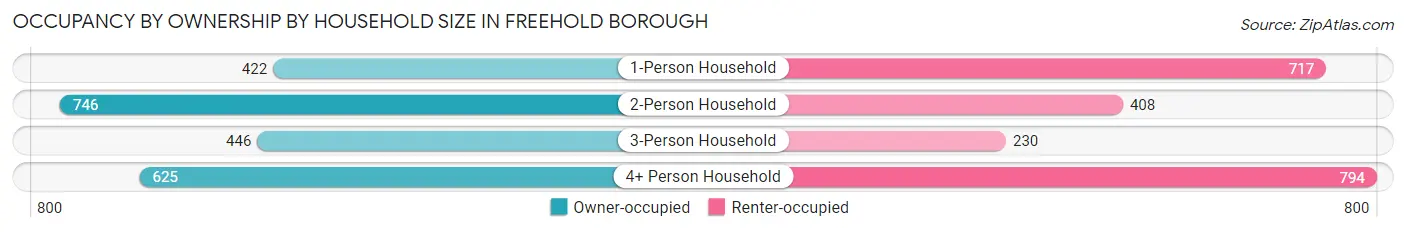
| Household Size | Owner-occupied | Renter-occupied |
| 1-Person Household | 422 (37.0%) | 717 (62.9%) |
| 2-Person Household | 746 (64.6%) | 408 (35.4%) |
| 3-Person Household | 446 (66.0%) | 230 (34.0%) |
| 4+ Person Household | 625 (44.1%) | 794 (55.9%) |
| Total Housing Units | 2,239 (51.0%) | 2,149 (49.0%) |
Occupancy by Educational Attainment in Freehold borough
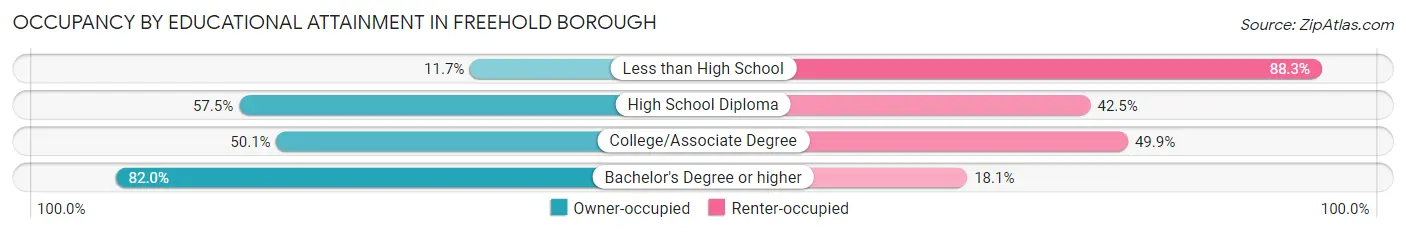
| Household Size | Owner-occupied | Renter-occupied |
| Less than High School | 119 (11.7%) | 902 (88.3%) |
| High School Diploma | 449 (57.5%) | 332 (42.5%) |
| College/Associate Degree | 704 (50.1%) | 702 (49.9%) |
| Bachelor's Degree or higher | 967 (82.0%) | 213 (18.0%) |
Occupancy by Age of Householder in Freehold borough
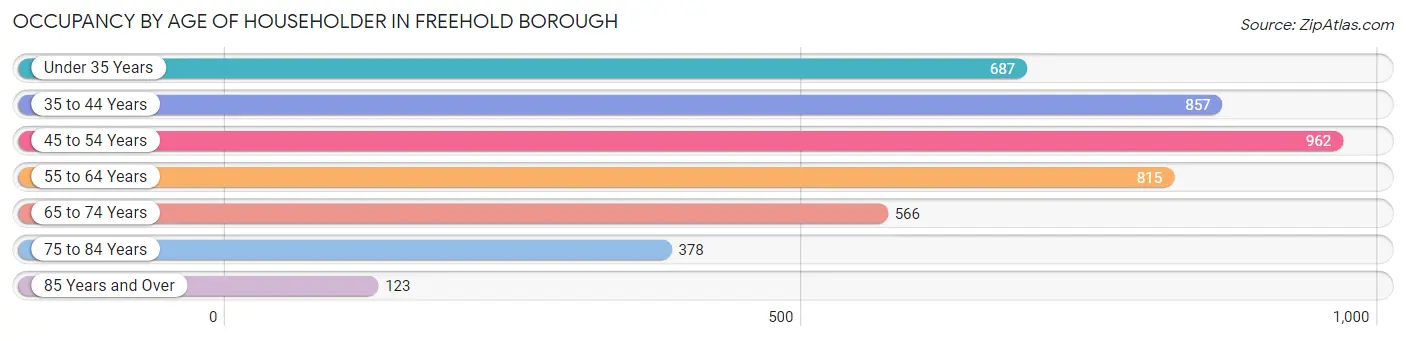
| Age Bracket | # Households | % Households |
| Under 35 Years | 687 | 15.7% |
| 35 to 44 Years | 857 | 19.5% |
| 45 to 54 Years | 962 | 21.9% |
| 55 to 64 Years | 815 | 18.6% |
| 65 to 74 Years | 566 | 12.9% |
| 75 to 84 Years | 378 | 8.6% |
| 85 Years and Over | 123 | 2.8% |
| Total | 4,388 | 100.0% |
Housing Finances in Freehold borough
Median Income by Occupancy in Freehold borough
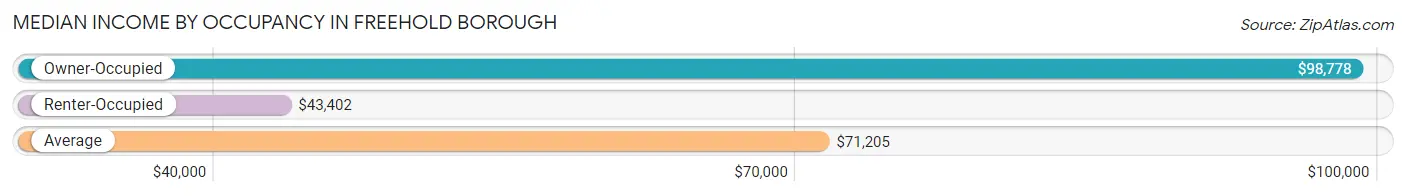
| Occupancy Type | # Households | Median Income |
| Owner-Occupied | 2,239 (51.0%) | $98,778 |
| Renter-Occupied | 2,149 (49.0%) | $43,402 |
| Average | 4,388 (100.0%) | $71,205 |
Occupancy by Householder Income Bracket in Freehold borough
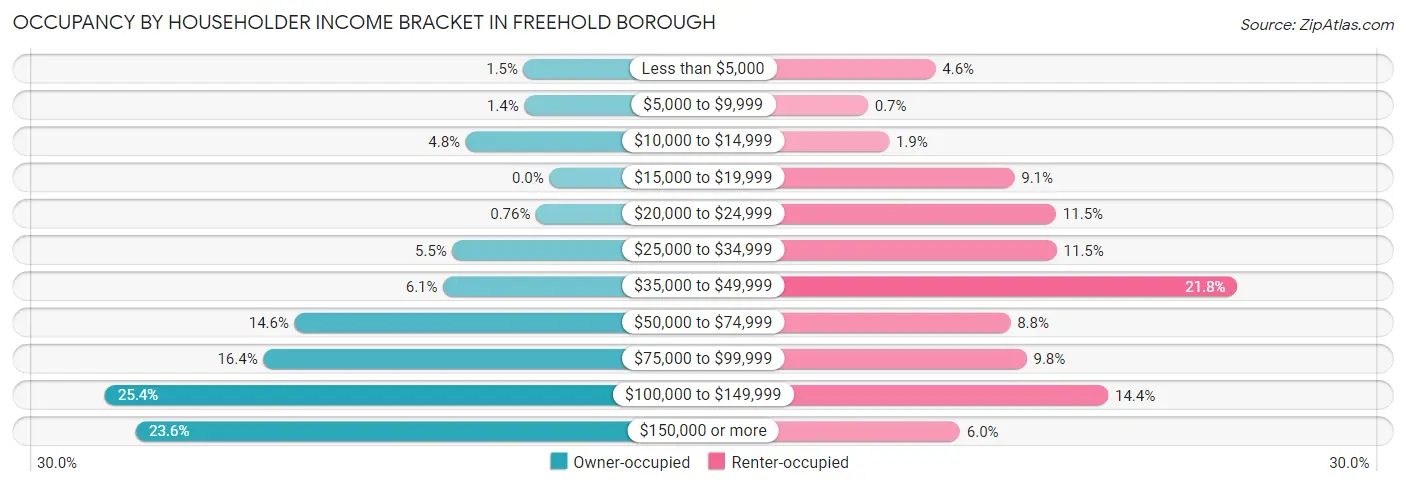
| Income Bracket | Owner-occupied | Renter-occupied |
| Less than $5,000 | 33 (1.5%) | 98 (4.6%) |
| $5,000 to $9,999 | 32 (1.4%) | 15 (0.7%) |
| $10,000 to $14,999 | 107 (4.8%) | 41 (1.9%) |
| $15,000 to $19,999 | 0 (0.0%) | 195 (9.1%) |
| $20,000 to $24,999 | 17 (0.8%) | 246 (11.5%) |
| $25,000 to $34,999 | 124 (5.5%) | 247 (11.5%) |
| $35,000 to $49,999 | 136 (6.1%) | 469 (21.8%) |
| $50,000 to $74,999 | 326 (14.6%) | 190 (8.8%) |
| $75,000 to $99,999 | 366 (16.4%) | 210 (9.8%) |
| $100,000 to $149,999 | 569 (25.4%) | 310 (14.4%) |
| $150,000 or more | 529 (23.6%) | 128 (6.0%) |
| Total | 2,239 (100.0%) | 2,149 (100.0%) |
Monthly Housing Cost Tiers in Freehold borough
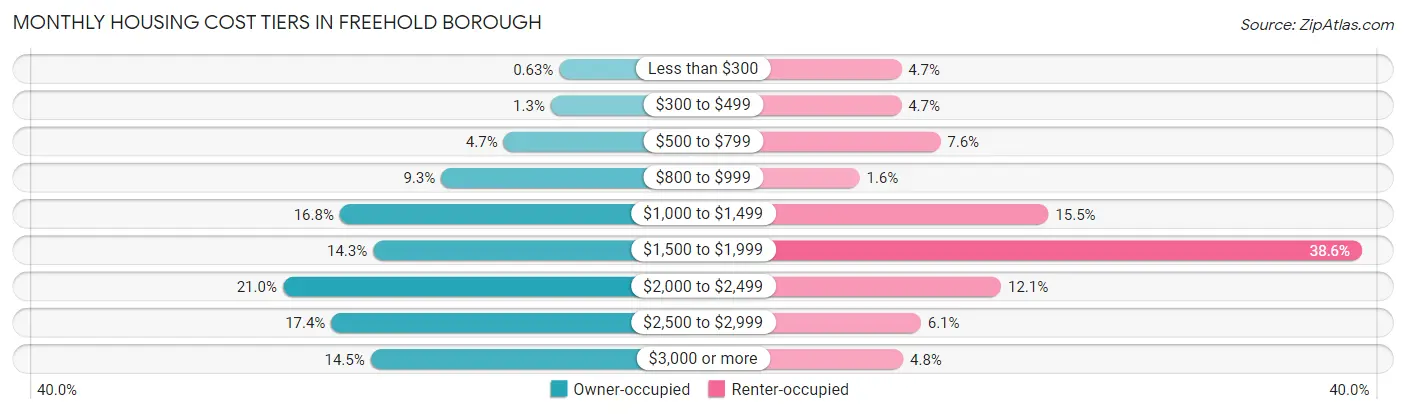
| Monthly Cost | Owner-occupied | Renter-occupied |
| Less than $300 | 14 (0.6%) | 101 (4.7%) |
| $300 to $499 | 28 (1.3%) | 101 (4.7%) |
| $500 to $799 | 106 (4.7%) | 163 (7.6%) |
| $800 to $999 | 209 (9.3%) | 35 (1.6%) |
| $1,000 to $1,499 | 376 (16.8%) | 334 (15.5%) |
| $1,500 to $1,999 | 321 (14.3%) | 830 (38.6%) |
| $2,000 to $2,499 | 470 (21.0%) | 259 (12.0%) |
| $2,500 to $2,999 | 390 (17.4%) | 132 (6.1%) |
| $3,000 or more | 325 (14.5%) | 104 (4.8%) |
| Total | 2,239 (100.0%) | 2,149 (100.0%) |
Physical Housing Characteristics in Freehold borough
Housing Structures in Freehold borough
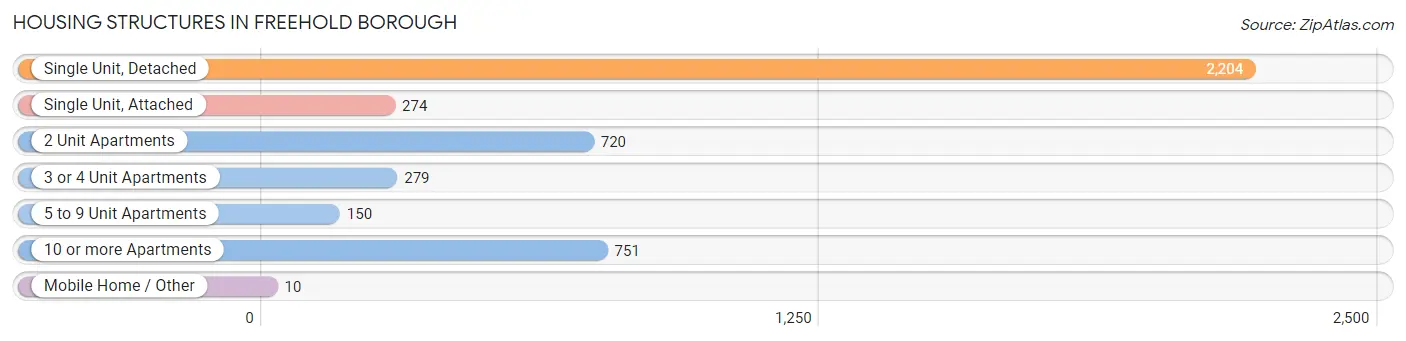
| Structure Type | # Housing Units | % Housing Units |
| Single Unit, Detached | 2,204 | 50.2% |
| Single Unit, Attached | 274 | 6.2% |
| 2 Unit Apartments | 720 | 16.4% |
| 3 or 4 Unit Apartments | 279 | 6.4% |
| 5 to 9 Unit Apartments | 150 | 3.4% |
| 10 or more Apartments | 751 | 17.1% |
| Mobile Home / Other | 10 | 0.2% |
| Total | 4,388 | 100.0% |
Housing Structures by Occupancy in Freehold borough
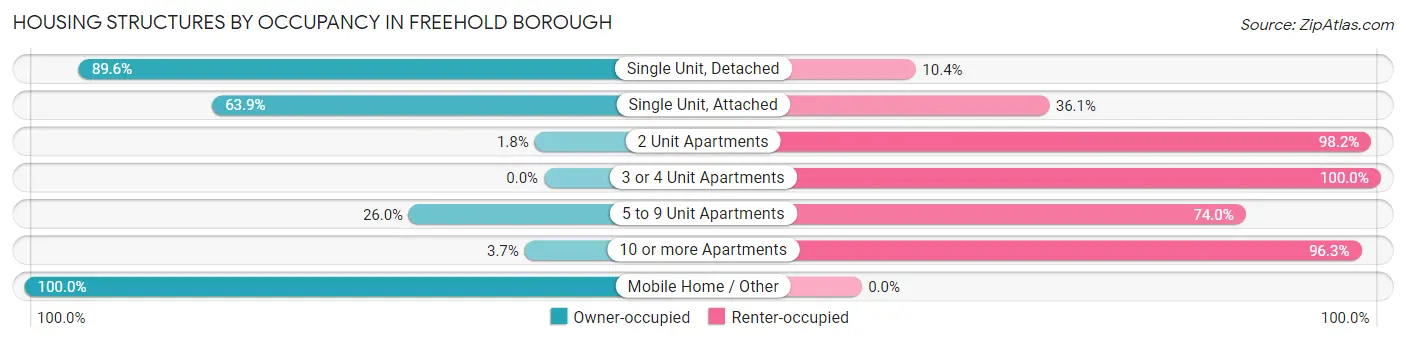
| Structure Type | Owner-occupied | Renter-occupied |
| Single Unit, Detached | 1,974 (89.6%) | 230 (10.4%) |
| Single Unit, Attached | 175 (63.9%) | 99 (36.1%) |
| 2 Unit Apartments | 13 (1.8%) | 707 (98.2%) |
| 3 or 4 Unit Apartments | 0 (0.0%) | 279 (100.0%) |
| 5 to 9 Unit Apartments | 39 (26.0%) | 111 (74.0%) |
| 10 or more Apartments | 28 (3.7%) | 723 (96.3%) |
| Mobile Home / Other | 10 (100.0%) | 0 (0.0%) |
| Total | 2,239 (51.0%) | 2,149 (49.0%) |
Housing Structures by Number of Rooms in Freehold borough
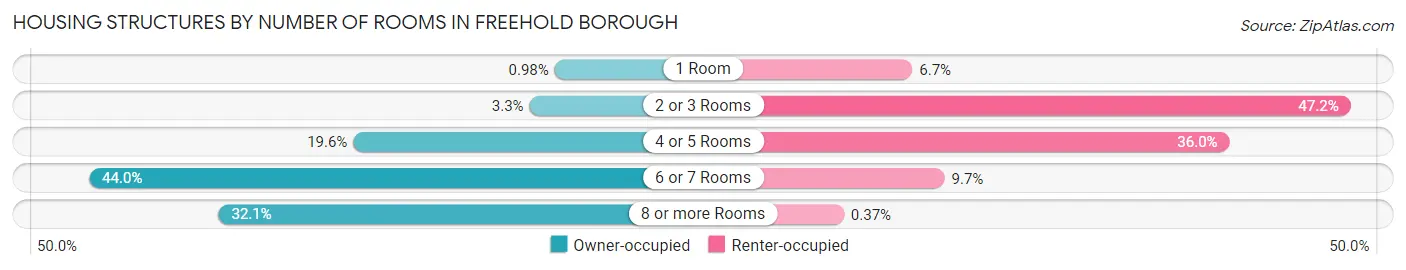
| Number of Rooms | Owner-occupied | Renter-occupied |
| 1 Room | 22 (1.0%) | 144 (6.7%) |
| 2 or 3 Rooms | 74 (3.3%) | 1,015 (47.2%) |
| 4 or 5 Rooms | 439 (19.6%) | 774 (36.0%) |
| 6 or 7 Rooms | 986 (44.0%) | 208 (9.7%) |
| 8 or more Rooms | 718 (32.1%) | 8 (0.4%) |
| Total | 2,239 (100.0%) | 2,149 (100.0%) |
Housing Structure by Heating Type in Freehold borough
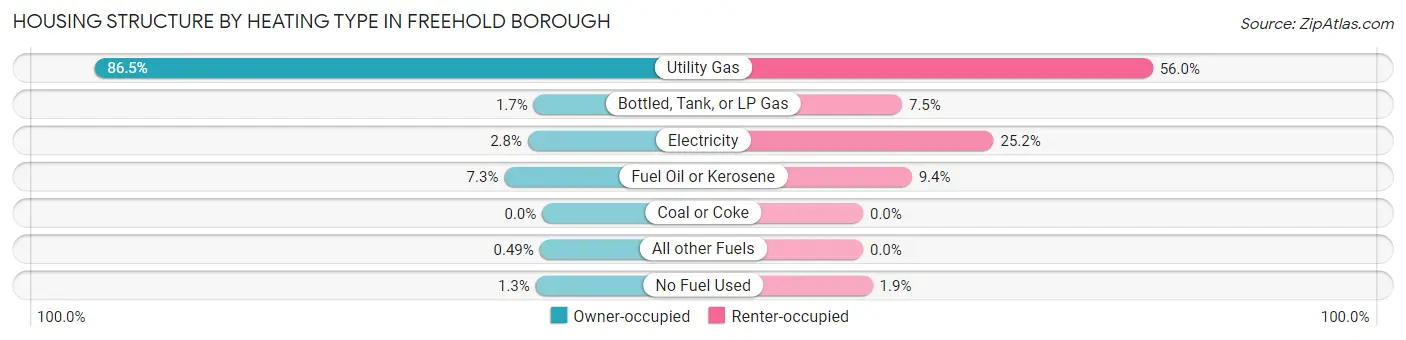
| Heating Type | Owner-occupied | Renter-occupied |
| Utility Gas | 1,937 (86.5%) | 1,203 (56.0%) |
| Bottled, Tank, or LP Gas | 37 (1.7%) | 162 (7.5%) |
| Electricity | 62 (2.8%) | 542 (25.2%) |
| Fuel Oil or Kerosene | 164 (7.3%) | 202 (9.4%) |
| Coal or Coke | 0 (0.0%) | 0 (0.0%) |
| All other Fuels | 11 (0.5%) | 0 (0.0%) |
| No Fuel Used | 28 (1.3%) | 40 (1.9%) |
| Total | 2,239 (100.0%) | 2,149 (100.0%) |
Household Vehicle Usage in Freehold borough
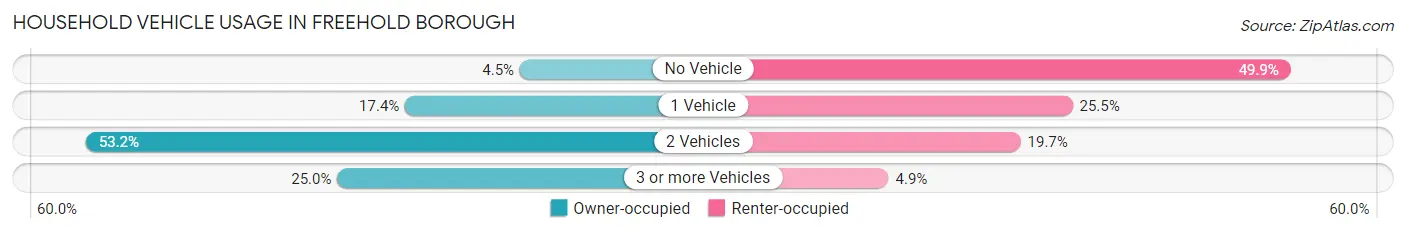
| Vehicles per Household | Owner-occupied | Renter-occupied |
| No Vehicle | 101 (4.5%) | 1,073 (49.9%) |
| 1 Vehicle | 389 (17.4%) | 548 (25.5%) |
| 2 Vehicles | 1,190 (53.1%) | 423 (19.7%) |
| 3 or more Vehicles | 559 (25.0%) | 105 (4.9%) |
| Total | 2,239 (100.0%) | 2,149 (100.0%) |
Real Estate & Mortgages in Freehold borough
Real Estate and Mortgage Overview in Freehold borough
| Characteristic | Without Mortgage | With Mortgage |
| Housing Units | 875 | 1,364 |
| Median Property Value | $352,000 | $366,900 |
| Median Household Income | $67,604 | $396 |
| Monthly Housing Costs | $1,097 | $325 |
| Real Estate Taxes | $8,653 | $11 |
Property Value by Mortgage Status in Freehold borough
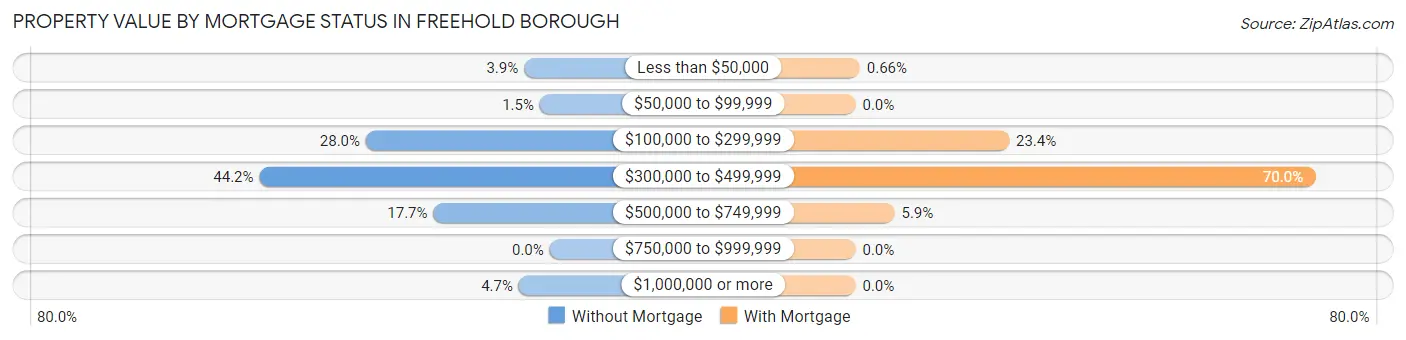
| Property Value | Without Mortgage | With Mortgage |
| Less than $50,000 | 34 (3.9%) | 9 (0.7%) |
| $50,000 to $99,999 | 13 (1.5%) | 0 (0.0%) |
| $100,000 to $299,999 | 245 (28.0%) | 319 (23.4%) |
| $300,000 to $499,999 | 387 (44.2%) | 955 (70.0%) |
| $500,000 to $749,999 | 155 (17.7%) | 81 (5.9%) |
| $750,000 to $999,999 | 0 (0.0%) | 0 (0.0%) |
| $1,000,000 or more | 41 (4.7%) | 0 (0.0%) |
| Total | 875 (100.0%) | 1,364 (100.0%) |
Household Income by Mortgage Status in Freehold borough
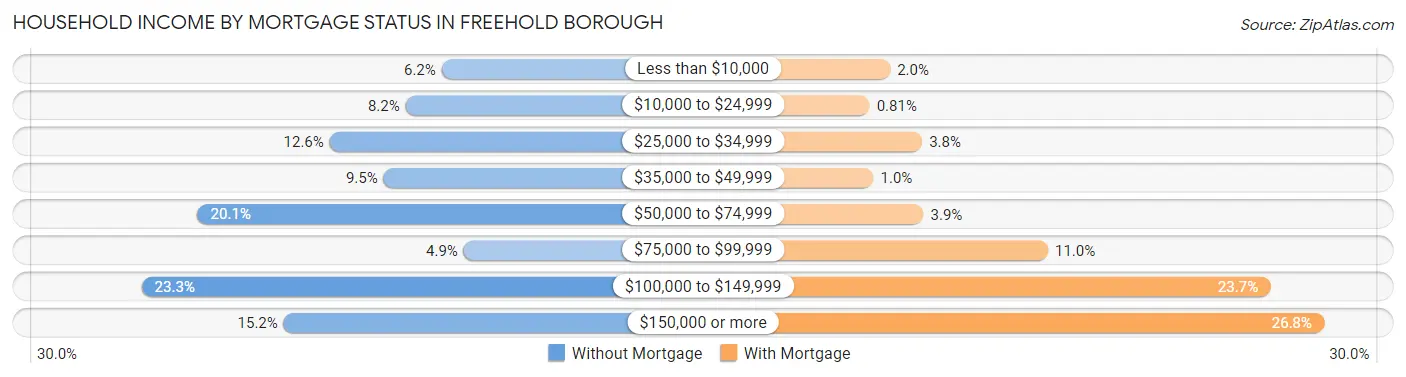
| Household Income | Without Mortgage | With Mortgage |
| Less than $10,000 | 54 (6.2%) | 27 (2.0%) |
| $10,000 to $24,999 | 72 (8.2%) | 11 (0.8%) |
| $25,000 to $34,999 | 110 (12.6%) | 52 (3.8%) |
| $35,000 to $49,999 | 83 (9.5%) | 14 (1.0%) |
| $50,000 to $74,999 | 176 (20.1%) | 53 (3.9%) |
| $75,000 to $99,999 | 43 (4.9%) | 150 (11.0%) |
| $100,000 to $149,999 | 204 (23.3%) | 323 (23.7%) |
| $150,000 or more | 133 (15.2%) | 365 (26.8%) |
| Total | 875 (100.0%) | 1,364 (100.0%) |
Property Value to Household Income Ratio in Freehold borough
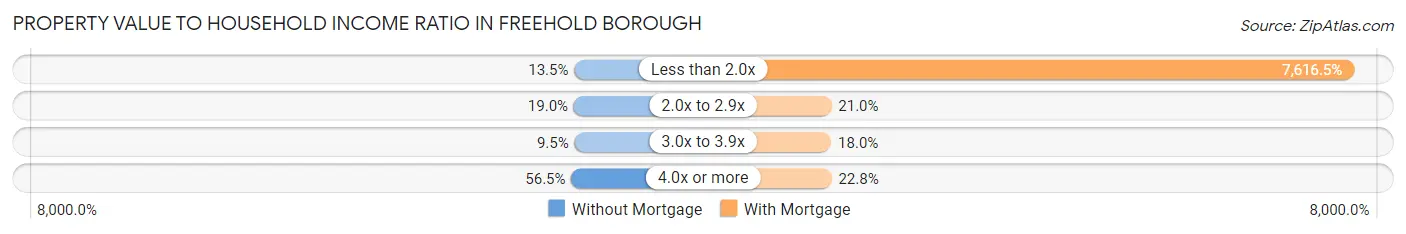
| Value-to-Income Ratio | Without Mortgage | With Mortgage |
| Less than 2.0x | 118 (13.5%) | 103,889 (7,616.5%) |
| 2.0x to 2.9x | 166 (19.0%) | 287 (21.0%) |
| 3.0x to 3.9x | 83 (9.5%) | 246 (18.0%) |
| 4.0x or more | 494 (56.5%) | 311 (22.8%) |
| Total | 875 (100.0%) | 1,364 (100.0%) |
Real Estate Taxes by Mortgage Status in Freehold borough
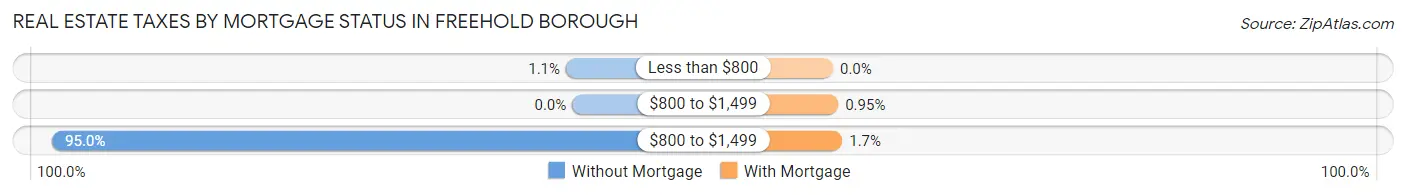
| Property Taxes | Without Mortgage | With Mortgage |
| Less than $800 | 10 (1.1%) | 0 (0.0%) |
| $800 to $1,499 | 0 (0.0%) | 13 (0.9%) |
| $800 to $1,499 | 831 (95.0%) | 23 (1.7%) |
| Total | 875 (100.0%) | 1,364 (100.0%) |
Health & Disability in Freehold borough
Health Insurance Coverage by Age in Freehold borough
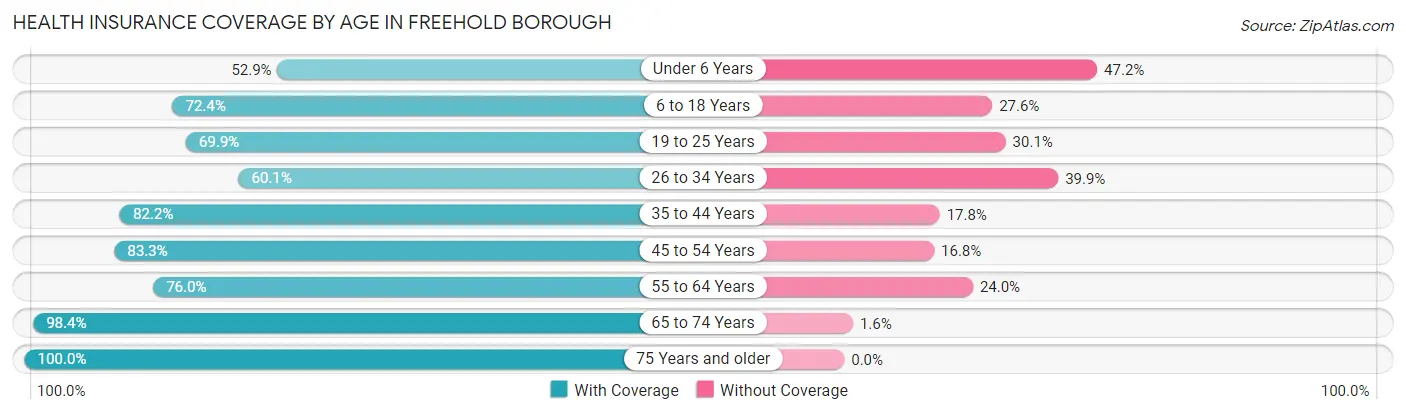
| Age Bracket | With Coverage | Without Coverage |
| Under 6 Years | 455 (52.8%) | 406 (47.1%) |
| 6 to 18 Years | 1,969 (72.4%) | 750 (27.6%) |
| 19 to 25 Years | 820 (69.9%) | 353 (30.1%) |
| 26 to 34 Years | 844 (60.1%) | 560 (39.9%) |
| 35 to 44 Years | 1,396 (82.2%) | 302 (17.8%) |
| 45 to 54 Years | 1,387 (83.3%) | 279 (16.8%) |
| 55 to 64 Years | 979 (76.0%) | 309 (24.0%) |
| 65 to 74 Years | 913 (98.4%) | 15 (1.6%) |
| 75 Years and older | 730 (100.0%) | 0 (0.0%) |
| Total | 9,493 (76.1%) | 2,974 (23.8%) |
Health Insurance Coverage by Citizenship Status in Freehold borough
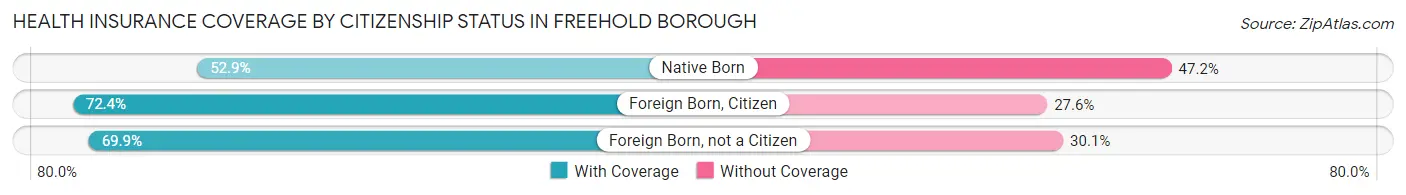
| Citizenship Status | With Coverage | Without Coverage |
| Native Born | 455 (52.8%) | 406 (47.1%) |
| Foreign Born, Citizen | 1,969 (72.4%) | 750 (27.6%) |
| Foreign Born, not a Citizen | 820 (69.9%) | 353 (30.1%) |
Health Insurance Coverage by Household Income in Freehold borough
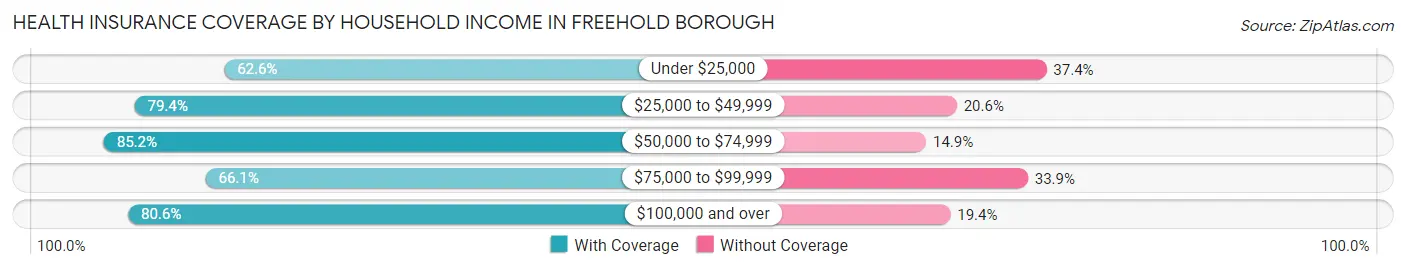
| Household Income | With Coverage | Without Coverage |
| Under $25,000 | 1,145 (62.6%) | 684 (37.4%) |
| $25,000 to $49,999 | 1,734 (79.4%) | 450 (20.6%) |
| $50,000 to $74,999 | 1,198 (85.2%) | 209 (14.8%) |
| $75,000 to $99,999 | 1,259 (66.1%) | 646 (33.9%) |
| $100,000 and over | 4,091 (80.6%) | 984 (19.4%) |
Public vs Private Health Insurance Coverage by Age in Freehold borough
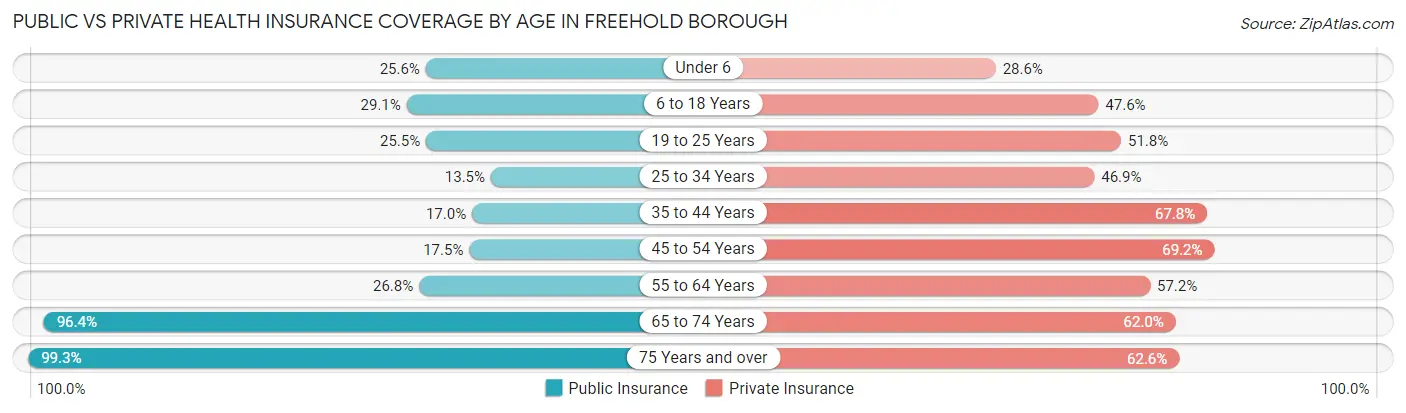
| Age Bracket | Public Insurance | Private Insurance |
| Under 6 | 220 (25.6%) | 246 (28.6%) |
| 6 to 18 Years | 791 (29.1%) | 1,295 (47.6%) |
| 19 to 25 Years | 299 (25.5%) | 608 (51.8%) |
| 25 to 34 Years | 189 (13.5%) | 658 (46.9%) |
| 35 to 44 Years | 288 (17.0%) | 1,151 (67.8%) |
| 45 to 54 Years | 291 (17.5%) | 1,152 (69.2%) |
| 55 to 64 Years | 345 (26.8%) | 737 (57.2%) |
| 65 to 74 Years | 895 (96.4%) | 575 (62.0%) |
| 75 Years and over | 725 (99.3%) | 457 (62.6%) |
| Total | 4,043 (32.4%) | 6,879 (55.2%) |
Disability Status by Sex by Age in Freehold borough
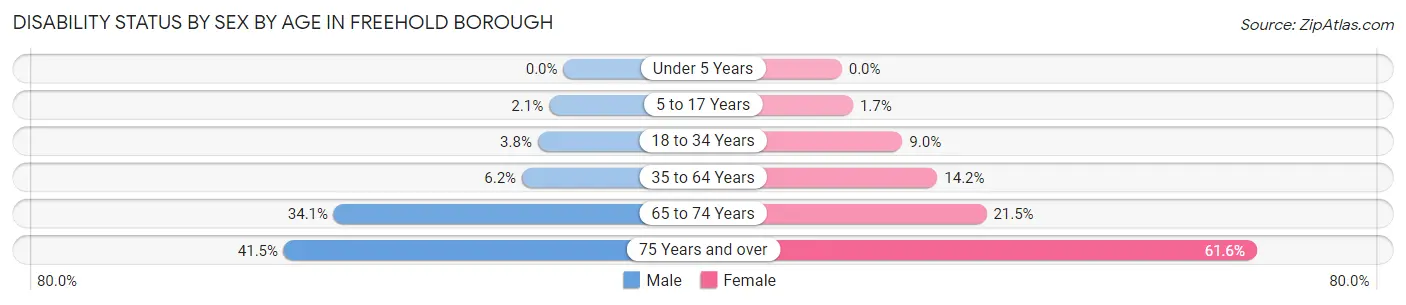
| Age Bracket | Male | Female |
| Under 5 Years | 0 (0.0%) | 0 (0.0%) |
| 5 to 17 Years | 25 (2.1%) | 27 (1.7%) |
| 18 to 34 Years | 58 (3.8%) | 114 (9.0%) |
| 35 to 64 Years | 137 (6.1%) | 344 (14.2%) |
| 65 to 74 Years | 137 (34.1%) | 113 (21.5%) |
| 75 Years and over | 144 (41.5%) | 236 (61.6%) |
Disability Class by Sex by Age in Freehold borough
Disability Class: Hearing Difficulty
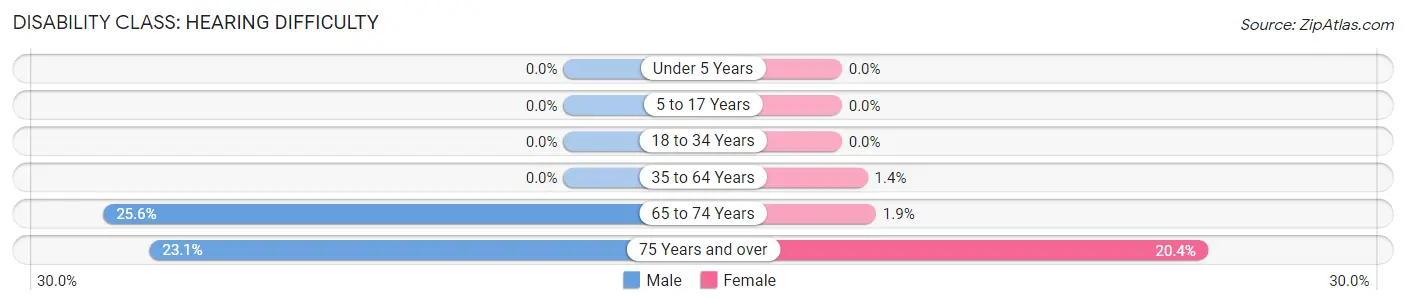
| Age Bracket | Male | Female |
| Under 5 Years | 0 (0.0%) | 0 (0.0%) |
| 5 to 17 Years | 0 (0.0%) | 0 (0.0%) |
| 18 to 34 Years | 0 (0.0%) | 0 (0.0%) |
| 35 to 64 Years | 0 (0.0%) | 35 (1.4%) |
| 65 to 74 Years | 103 (25.6%) | 10 (1.9%) |
| 75 Years and over | 80 (23.1%) | 78 (20.4%) |
Disability Class: Vision Difficulty
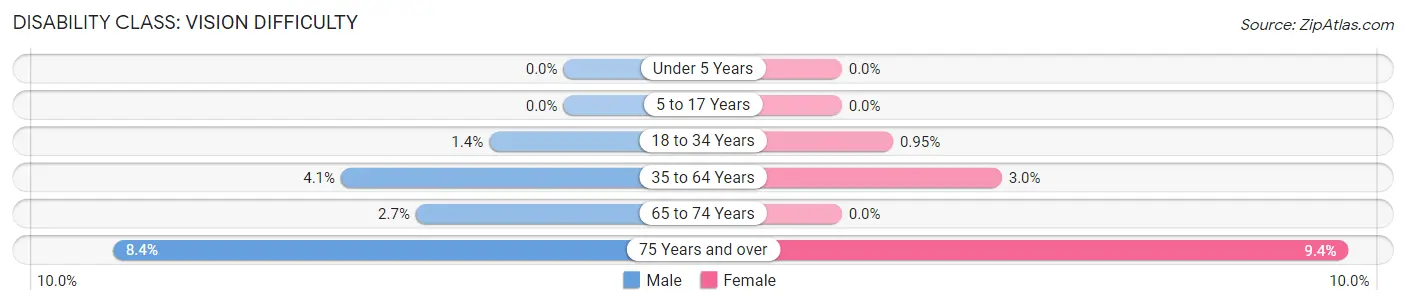
| Age Bracket | Male | Female |
| Under 5 Years | 0 (0.0%) | 0 (0.0%) |
| 5 to 17 Years | 0 (0.0%) | 0 (0.0%) |
| 18 to 34 Years | 21 (1.4%) | 12 (0.9%) |
| 35 to 64 Years | 92 (4.1%) | 72 (3.0%) |
| 65 to 74 Years | 11 (2.7%) | 0 (0.0%) |
| 75 Years and over | 29 (8.4%) | 36 (9.4%) |
Disability Class: Cognitive Difficulty
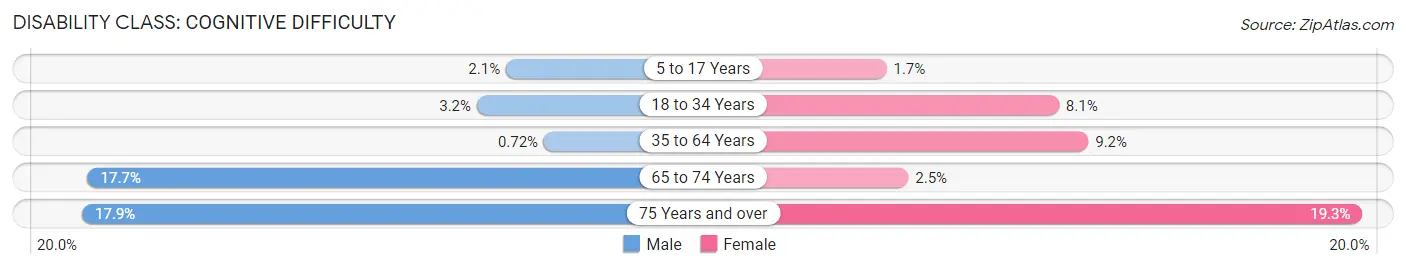
| Age Bracket | Male | Female |
| 5 to 17 Years | 25 (2.1%) | 27 (1.7%) |
| 18 to 34 Years | 49 (3.2%) | 102 (8.1%) |
| 35 to 64 Years | 16 (0.7%) | 222 (9.1%) |
| 65 to 74 Years | 71 (17.7%) | 13 (2.5%) |
| 75 Years and over | 62 (17.9%) | 74 (19.3%) |
Disability Class: Ambulatory Difficulty
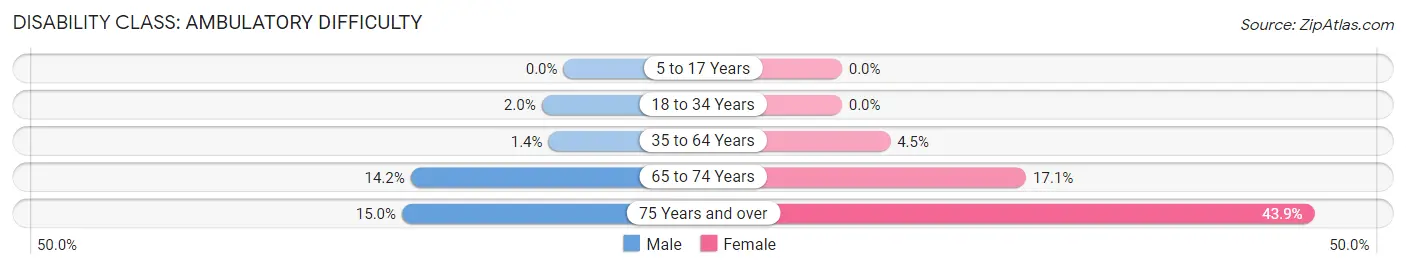
| Age Bracket | Male | Female |
| 5 to 17 Years | 0 (0.0%) | 0 (0.0%) |
| 18 to 34 Years | 31 (2.0%) | 0 (0.0%) |
| 35 to 64 Years | 31 (1.4%) | 109 (4.5%) |
| 65 to 74 Years | 57 (14.2%) | 90 (17.1%) |
| 75 Years and over | 52 (15.0%) | 168 (43.9%) |
Disability Class: Self-Care Difficulty
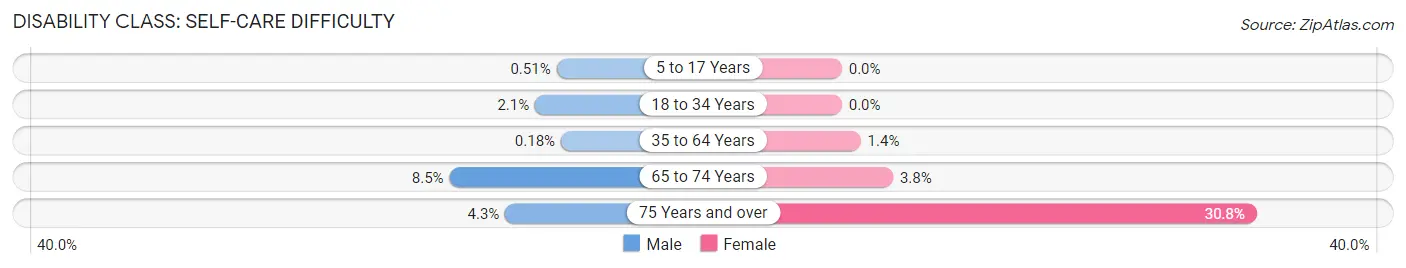
| Age Bracket | Male | Female |
| 5 to 17 Years | 6 (0.5%) | 0 (0.0%) |
| 18 to 34 Years | 32 (2.1%) | 0 (0.0%) |
| 35 to 64 Years | 4 (0.2%) | 34 (1.4%) |
| 65 to 74 Years | 34 (8.5%) | 20 (3.8%) |
| 75 Years and over | 15 (4.3%) | 118 (30.8%) |
Technology Access in Freehold borough
Computing Device Access in Freehold borough
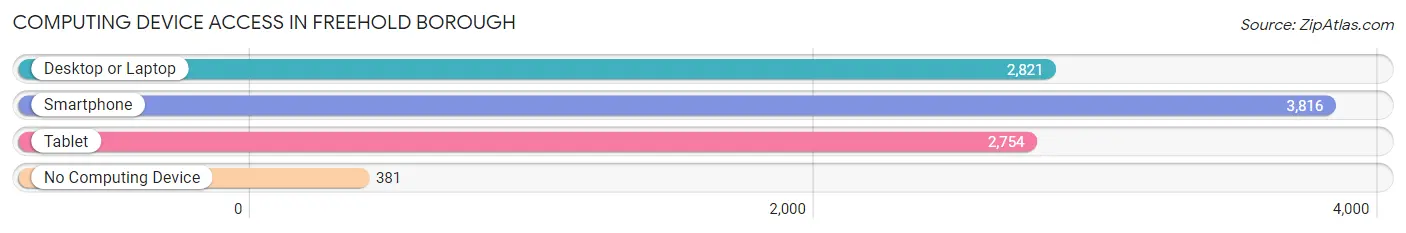
| Device Type | # Households | % Households |
| Desktop or Laptop | 2,821 | 64.3% |
| Smartphone | 3,816 | 87.0% |
| Tablet | 2,754 | 62.8% |
| No Computing Device | 381 | 8.7% |
| Total | 4,388 | 100.0% |
Internet Access in Freehold borough
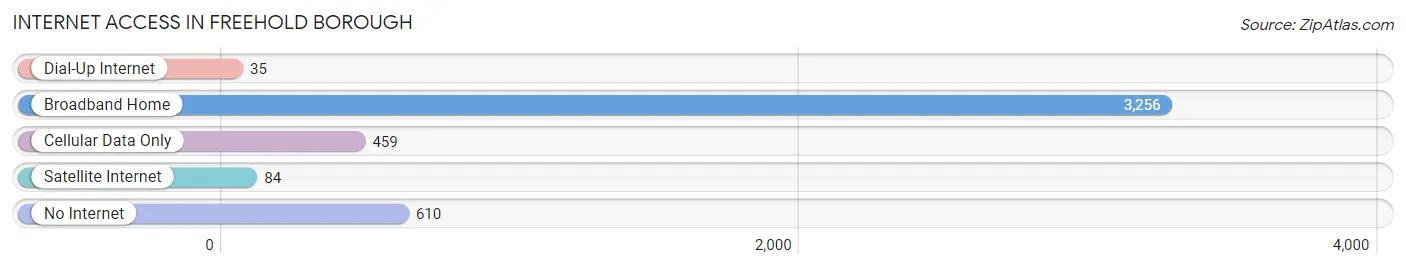
| Internet Type | # Households | % Households |
| Dial-Up Internet | 35 | 0.8% |
| Broadband Home | 3,256 | 74.2% |
| Cellular Data Only | 459 | 10.5% |
| Satellite Internet | 84 | 1.9% |
| No Internet | 610 | 13.9% |
| Total | 4,388 | 100.0% |
Freehold borough Summary
Freehold Borough is a small borough located in Monmouth County, New Jersey. It is situated in the heart of the state, approximately 35 miles south of New York City and 40 miles north of Philadelphia. The borough is bordered by Freehold Township to the north, Manalapan Township to the east, Marlboro Township to the south, and Howell Township to the west. Freehold Borough is home to a population of approximately 12,000 people, making it the most densely populated municipality in Monmouth County.
History
The area that is now Freehold Borough was first settled in the late 17th century by Dutch and English settlers. The town was officially established in 1869, when it was separated from Freehold Township and incorporated as a borough. The town was named after the Freehold Township, which was named after the colonial land grant given to the settlers by the British Crown.
The town quickly grew in the 19th century, becoming a center of commerce and industry. The town was home to several factories, including a cotton mill, a paper mill, and a tannery. The town was also home to several churches, including the First Presbyterian Church, which was founded in 1745.
In the early 20th century, the town experienced a period of growth and prosperity. The town was home to several large businesses, including a brewery, a canning factory, and a shoe factory. The town was also home to several theaters, including the Strand Theater, which opened in 1915.
Geography
Freehold Borough is located in the heart of Monmouth County, approximately 35 miles south of New York City and 40 miles north of Philadelphia. The borough is bordered by Freehold Township to the north, Manalapan Township to the east, Marlboro Township to the south, and Howell Township to the west.
The borough is situated on the Raritan River, which flows through the town and provides a source of recreation for residents. The borough is also home to several parks, including the Freehold Borough Park, which features a playground, a basketball court, and a baseball field.
Economy
The economy of Freehold Borough is largely based on retail and services. The town is home to several large retail stores, including Walmart, Target, and Home Depot. The town is also home to several restaurants, including Applebee’s, Olive Garden, and Red Lobster.
The town is also home to several small businesses, including a variety of professional services, such as lawyers, accountants, and real estate agents. The town is also home to several manufacturing companies, including a printing company and a plastics manufacturer.
Demographics
As of the 2010 census, the population of Freehold Borough was 12,052. The racial makeup of the borough was 79.3% White, 11.2% African American, 0.3% Native American, 3.2% Asian, and 4.9% from other races. Hispanic or Latino of any race were 8.7% of the population.
The median household income in Freehold Borough was $62,813, and the median family income was $76,945. The per capita income was $30,945. About 5.2% of families and 7.2% of the population were below the poverty line, including 8.3% of those under age 18 and 6.2% of those age 65 or over.
Common Questions
What is Per Capita Income in Freehold borough?
Per Capita income in Freehold borough is $33,223.
What is the Median Family Income in Freehold borough?
Median Family Income in Freehold borough is $93,565.
What is the Median Household income in Freehold borough?
Median Household Income in Freehold borough is $71,205.
What is Income or Wage Gap in Freehold borough?
Income or Wage Gap in Freehold borough is 12.6%.
Women in Freehold borough earn 87.4 cents for every dollar earned by a man.
What is Inequality or Gini Index in Freehold borough?
Inequality or Gini Index in Freehold borough is 0.47.
What is the Total Population of Freehold borough?
Total Population of Freehold borough is 12,498.
What is the Total Male Population of Freehold borough?
Total Male Population of Freehold borough is 6,018.
What is the Total Female Population of Freehold borough?
Total Female Population of Freehold borough is 6,480.
What is the Ratio of Males per 100 Females in Freehold borough?
There are 92.87 Males per 100 Females in Freehold borough.
What is the Ratio of Females per 100 Males in Freehold borough?
There are 107.68 Females per 100 Males in Freehold borough.
What is the Median Population Age in Freehold borough?
Median Population Age in Freehold borough is 35.5 Years.
What is the Average Family Size in Freehold borough
Average Family Size in Freehold borough is 3.3 People.
What is the Average Household Size in Freehold borough
Average Household Size in Freehold borough is 2.8 People.
How Large is the Labor Force in Freehold borough?
There are 6,936 People in the Labor Forcein in Freehold borough.
What is the Percentage of People in the Labor Force in Freehold borough?
72.8% of People are in the Labor Force in Freehold borough.
What is the Unemployment Rate in Freehold borough?
Unemployment Rate in Freehold borough is 8.2%.