Zip Codes with the Highest Percentage of Population Employed in Food Preparation & Serving in Joint Base Mdl, NJ
RELATED REPORTS & OPTIONS
Food Preparation & Serving
Joint Base Mdl
Compare Zip Codes
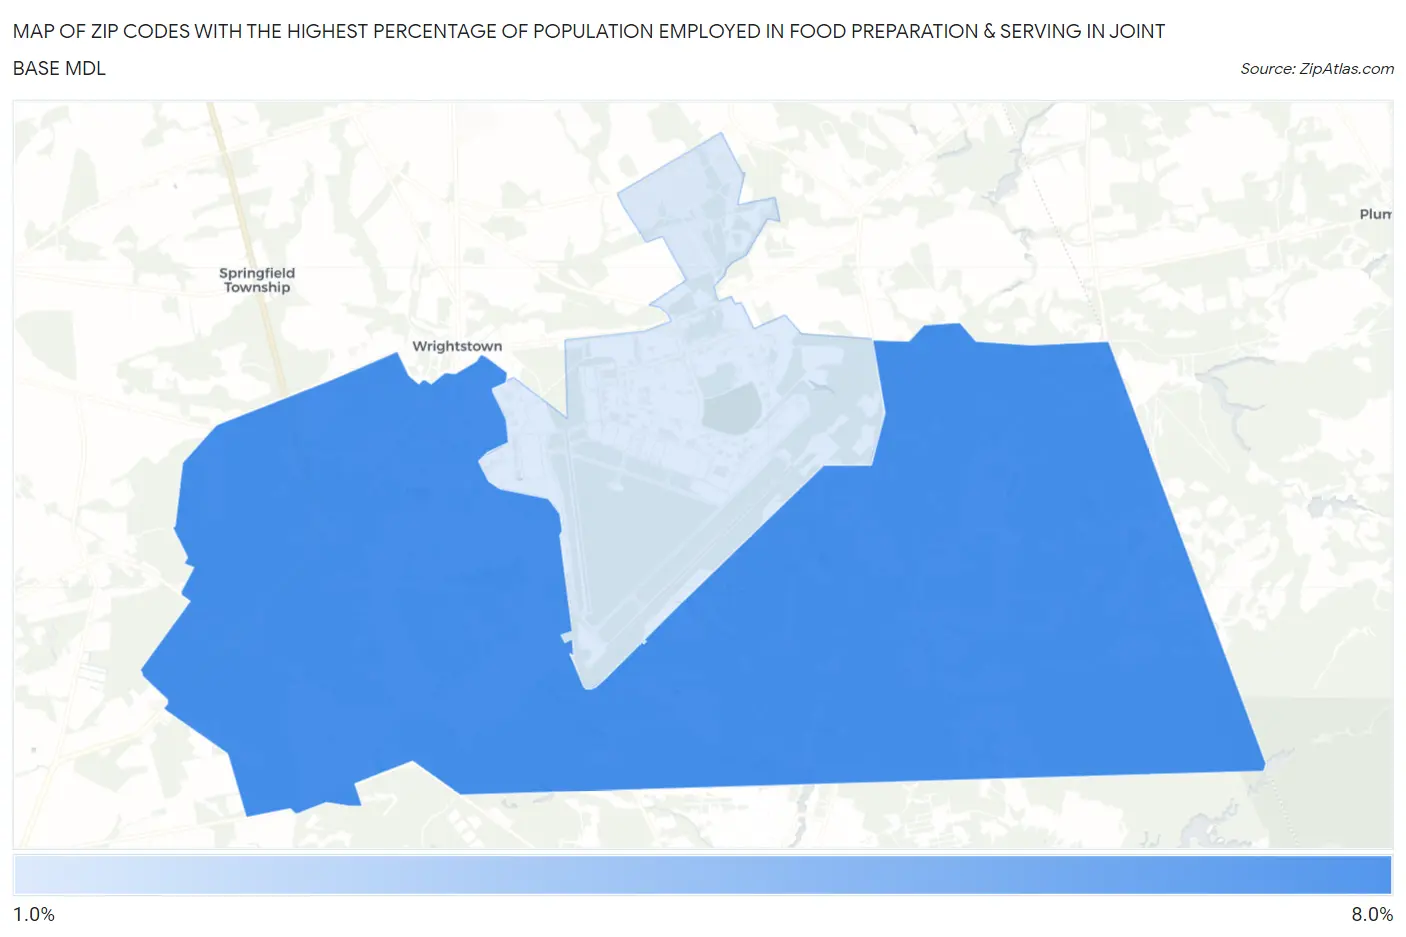
Map of Zip Codes with the Highest Percentage of Population Employed in Food Preparation & Serving in Joint Base Mdl
1.8%
6.7%
Zip Codes with the Highest Percentage of Population Employed in Food Preparation & Serving in Joint Base Mdl, NJ
| Zip Code | % Employed | vs State | vs National | |
| 1. | 08640 | 6.7% | 4.0%(+2.72)#59 | 5.3%(+1.39)#7,385 |
| 2. | 08641 | 1.8% | 4.0%(-2.20)#462 | 5.3%(-3.52)#25,362 |
1
Common Questions
What are the Top Zip Codes with the Highest Percentage of Population Employed in Food Preparation & Serving in Joint Base Mdl, NJ?
Top Zip Codes with the Highest Percentage of Population Employed in Food Preparation & Serving in Joint Base Mdl, NJ are:
What zip code has the Highest Percentage of Population Employed in Food Preparation & Serving in Joint Base Mdl, NJ?
08640 has the Highest Percentage of Population Employed in Food Preparation & Serving in Joint Base Mdl, NJ with 6.7%.
What is the Percentage of Population Employed in Food Preparation & Serving in New Jersey?
Percentage of Population Employed in Food Preparation & Serving in New Jersey is 4.0%.
What is the Percentage of Population Employed in Food Preparation & Serving in the United States?
Percentage of Population Employed in Food Preparation & Serving in the United States is 5.3%.