Holiday Heights, NJ Map & Demographics
Holiday Heights Map
Holiday Heights Overview
$41,078
PER CAPITA INCOME
$76,167
AVG FAMILY INCOME
$57,412
AVG HOUSEHOLD INCOME
14.2%
WAGE / INCOME GAP [ % ]
85.8¢/ $1
WAGE / INCOME GAP [ $ ]
$9,804
FAMILY INCOME DEFICIT
0.37
INEQUALITY / GINI INDEX
2,049
TOTAL POPULATION
949
MALE POPULATION
1,100
FEMALE POPULATION
86.27
MALES / 100 FEMALES
115.91
FEMALES / 100 MALES
71.9
MEDIAN AGE
2.2
AVG FAMILY SIZE
1.7
AVG HOUSEHOLD SIZE
511
LABOR FORCE [ PEOPLE ]
25.1%
PERCENT IN LABOR FORCE
8.2%
UNEMPLOYMENT RATE
Income in Holiday Heights
Income Overview in Holiday Heights
Per Capita Income in Holiday Heights is $41,078, while median incomes of families and households are $76,167 and $57,412 respectively.
| Characteristic | Number | Measure |
| Per Capita Income | 2,049 | $41,078 |
| Median Family Income | 668 | $76,167 |
| Mean Family Income | 668 | $87,307 |
| Median Household Income | 1,189 | $57,412 |
| Mean Household Income | 1,189 | $69,659 |
| Income Deficit | 668 | $9,804 |
| Wage / Income Gap (%) | 2,049 | 14.16% |
| Wage / Income Gap ($) | 2,049 | 85.84¢ per $1 |
| Gini / Inequality Index | 2,049 | 0.37 |
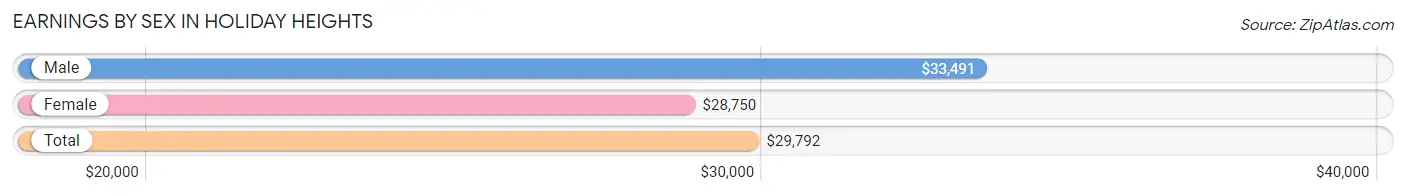
Earnings by Sex in Holiday Heights
Average Earnings in Holiday Heights are $29,792, $33,491 for men and $28,750 for women, a difference of 14.2%.
| Sex | Number | Average Earnings |
| Male | 203 (36.4%) | $33,491 |
| Female | 354 (63.5%) | $28,750 |
| Total | 557 (100.0%) | $29,792 |
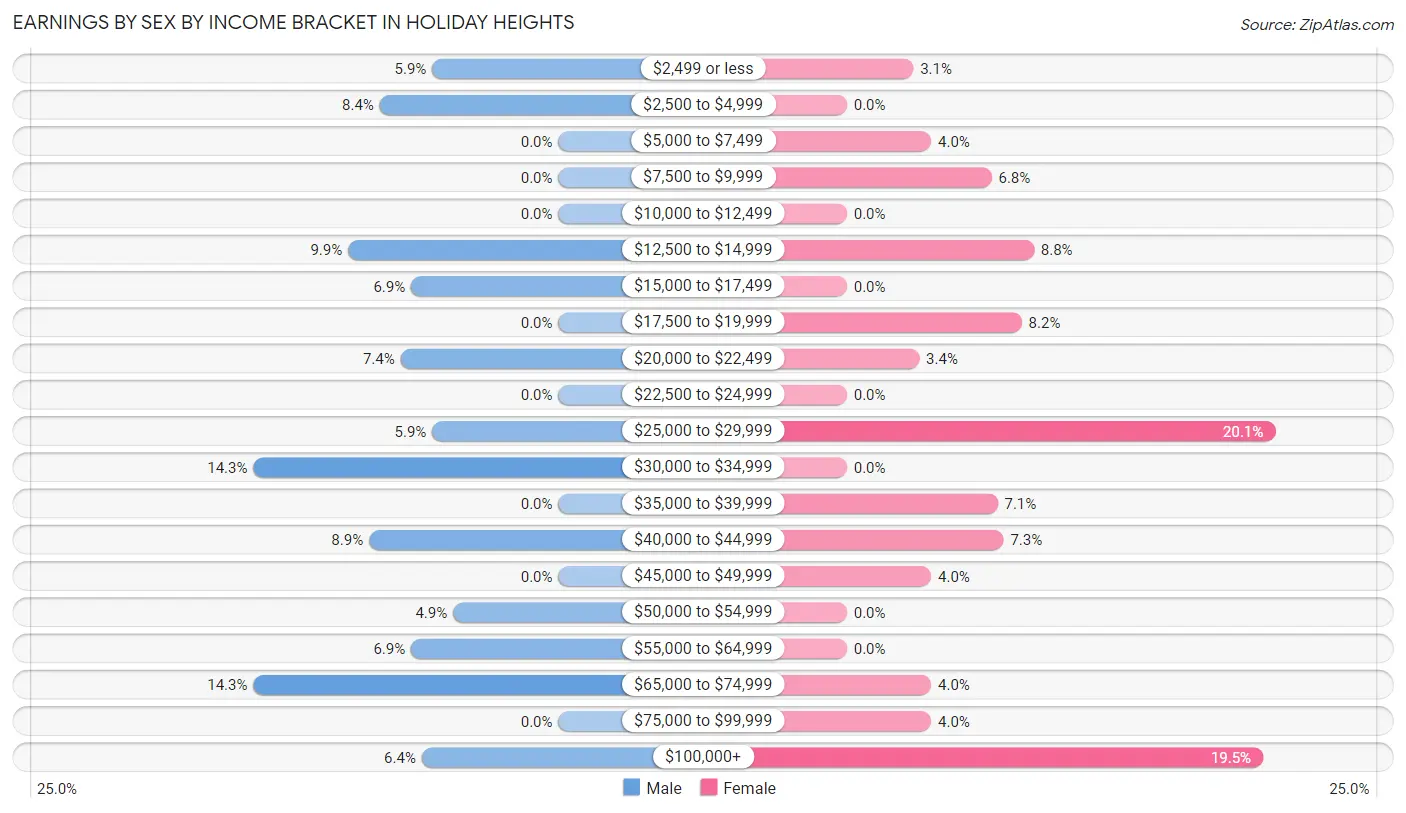
Earnings by Sex by Income Bracket in Holiday Heights
The most common earnings brackets in Holiday Heights are $30,000 to $34,999 for men (29 | 14.3%) and $25,000 to $29,999 for women (71 | 20.1%).
| Income | Male | Female |
| $2,499 or less | 12 (5.9%) | 11 (3.1%) |
| $2,500 to $4,999 | 17 (8.4%) | 0 (0.0%) |
| $5,000 to $7,499 | 0 (0.0%) | 14 (4.0%) |
| $7,500 to $9,999 | 0 (0.0%) | 24 (6.8%) |
| $10,000 to $12,499 | 0 (0.0%) | 0 (0.0%) |
| $12,500 to $14,999 | 20 (9.9%) | 31 (8.8%) |
| $15,000 to $17,499 | 14 (6.9%) | 0 (0.0%) |
| $17,500 to $19,999 | 0 (0.0%) | 29 (8.2%) |
| $20,000 to $22,499 | 15 (7.4%) | 12 (3.4%) |
| $22,500 to $24,999 | 0 (0.0%) | 0 (0.0%) |
| $25,000 to $29,999 | 12 (5.9%) | 71 (20.1%) |
| $30,000 to $34,999 | 29 (14.3%) | 0 (0.0%) |
| $35,000 to $39,999 | 0 (0.0%) | 25 (7.1%) |
| $40,000 to $44,999 | 18 (8.9%) | 26 (7.3%) |
| $45,000 to $49,999 | 0 (0.0%) | 14 (4.0%) |
| $50,000 to $54,999 | 10 (4.9%) | 0 (0.0%) |
| $55,000 to $64,999 | 14 (6.9%) | 0 (0.0%) |
| $65,000 to $74,999 | 29 (14.3%) | 14 (4.0%) |
| $75,000 to $99,999 | 0 (0.0%) | 14 (4.0%) |
| $100,000+ | 13 (6.4%) | 69 (19.5%) |
| Total | 203 (100.0%) | 354 (100.0%) |
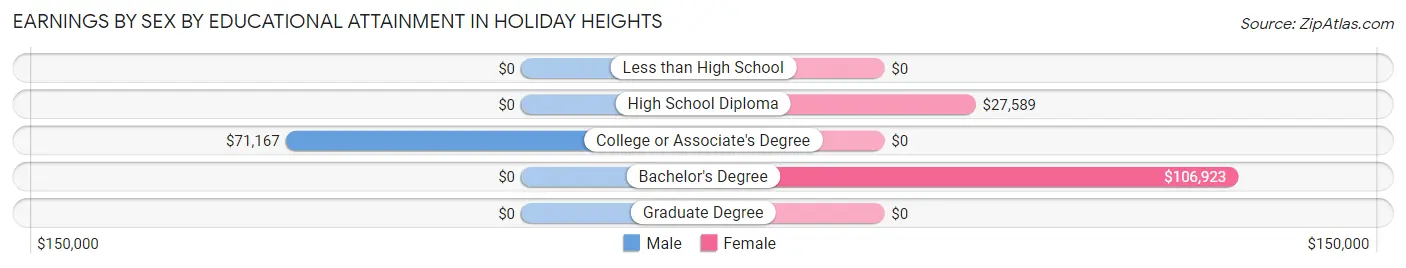
Earnings by Sex by Educational Attainment in Holiday Heights
Average earnings in Holiday Heights are $34,353 for men and $28,750 for women, a difference of 16.3%. Men with an educational attainment of college or associate's degree enjoy the highest average annual earnings of $71,167, while those with college or associate's degree education earn the least with $71,167. Women with an educational attainment of bachelor's degree earn the most with the average annual earnings of $106,923, while those with high school diploma education have the smallest earnings of $27,589.
| Educational Attainment | Male Income | Female Income |
| Less than High School | - | - |
| High School Diploma | - | - |
| College or Associate's Degree | $71,167 | $0 |
| Bachelor's Degree | - | - |
| Graduate Degree | - | - |
| Total | $34,353 | $28,750 |
Family Income in Holiday Heights
Family Income Brackets in Holiday Heights
According to the Holiday Heights family income data, there are 189 families falling into the $100,000 to $149,999 income range, which is the most common income bracket and makes up 28.3% of all families.
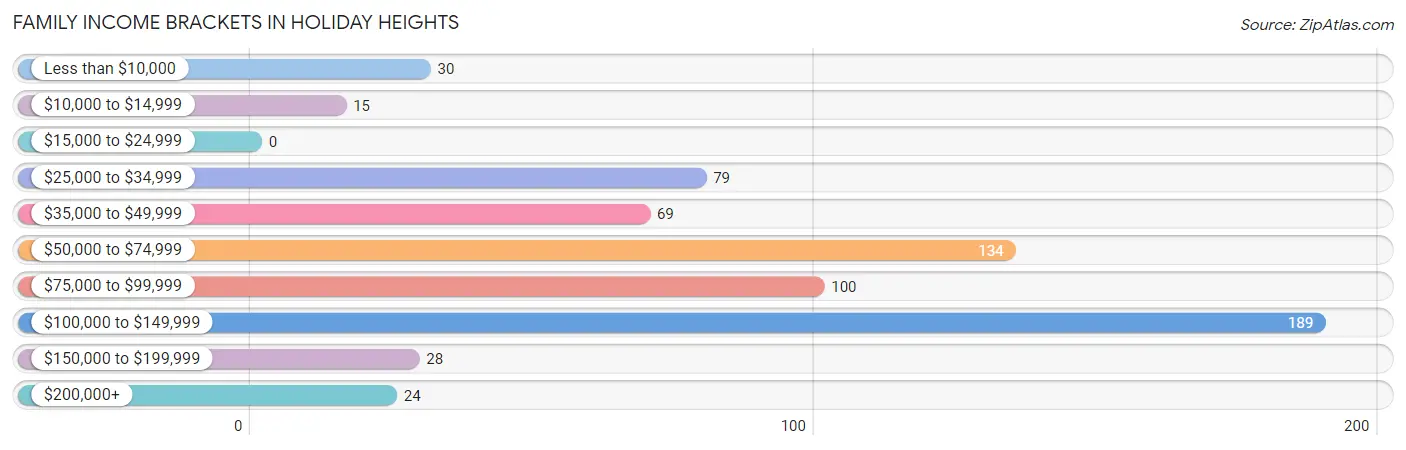
| Income Bracket | # Families | % Families |
| Less than $10,000 | 30 | 4.5% |
| $10,000 to $14,999 | 15 | 2.2% |
| $15,000 to $24,999 | 0 | 0.0% |
| $25,000 to $34,999 | 79 | 11.8% |
| $35,000 to $49,999 | 69 | 10.3% |
| $50,000 to $74,999 | 134 | 20.1% |
| $75,000 to $99,999 | 100 | 15.0% |
| $100,000 to $149,999 | 189 | 28.3% |
| $150,000 to $199,999 | 28 | 4.2% |
| $200,000+ | 24 | 3.6% |
Family Income by Famaliy Size in Holiday Heights
3-person families (56 | 8.4%) account for the highest median family income in Holiday Heights with $75,333 per family, while 2-person families (599 | 89.7%) have the highest median income of $36,224 per family member.
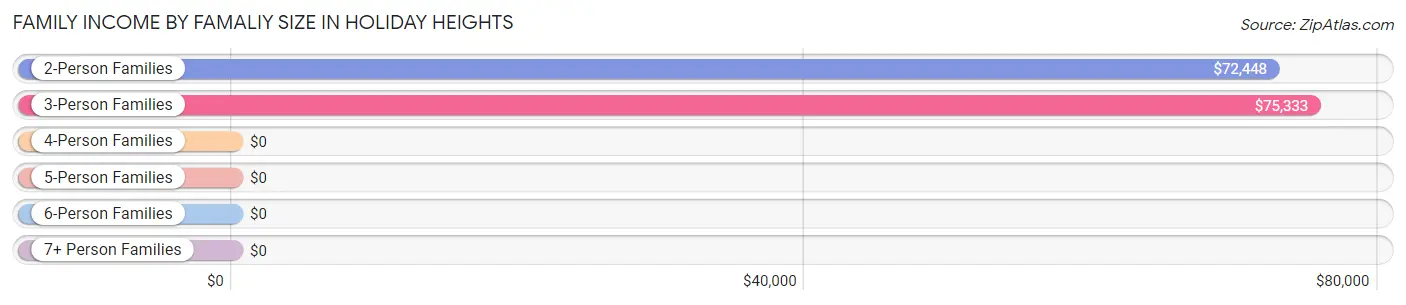
| Income Bracket | # Families | Median Income |
| 2-Person Families | 599 (89.7%) | $72,448 |
| 3-Person Families | 56 (8.4%) | $75,333 |
| 4-Person Families | 13 (1.9%) | $0 |
| 5-Person Families | 0 (0.0%) | $0 |
| 6-Person Families | 0 (0.0%) | $0 |
| 7+ Person Families | 0 (0.0%) | $0 |
| Total | 668 (100.0%) | $76,167 |
Family Income by Number of Earners in Holiday Heights
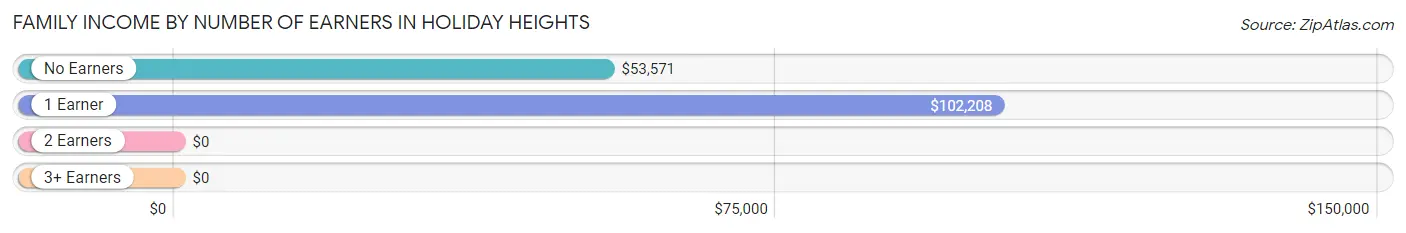
| Number of Earners | # Families | Median Income |
| No Earners | 340 (50.9%) | $53,571 |
| 1 Earner | 251 (37.6%) | $102,208 |
| 2 Earners | 62 (9.3%) | $0 |
| 3+ Earners | 15 (2.2%) | $0 |
| Total | 668 (100.0%) | $76,167 |
Household Income in Holiday Heights
Household Income Brackets in Holiday Heights
With 288 households falling in the category, the $50,000 to $74,999 income range is the most frequent in Holiday Heights, accounting for 24.2% of all households. In contrast, only 15 households (1.3%) fall into the $10,000 to $14,999 income bracket, making it the least populous group.
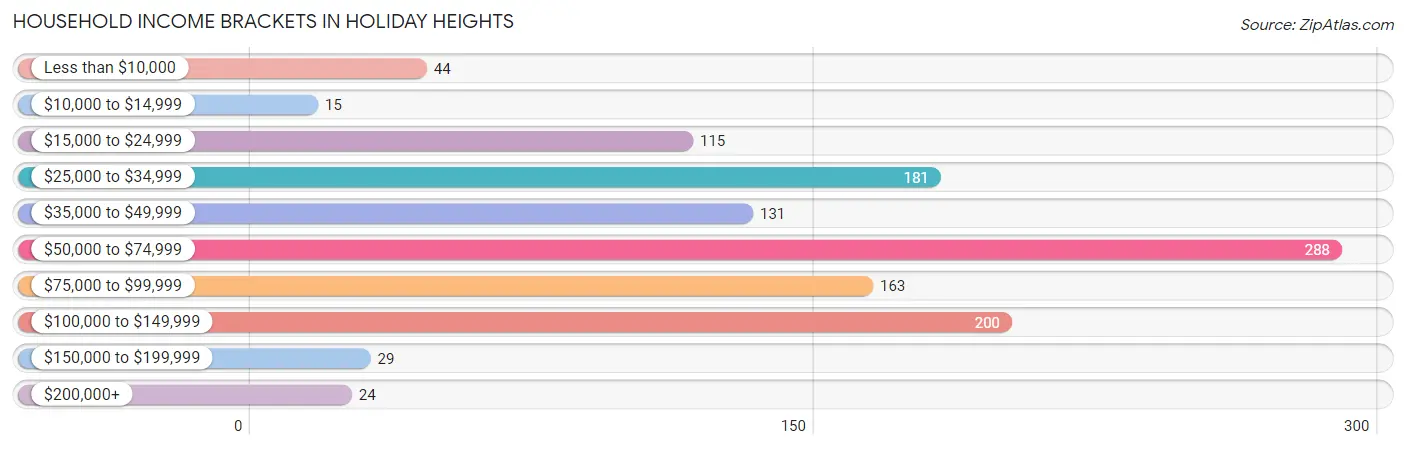
| Income Bracket | # Households | % Households |
| Less than $10,000 | 44 | 3.7% |
| $10,000 to $14,999 | 15 | 1.3% |
| $15,000 to $24,999 | 115 | 9.7% |
| $25,000 to $34,999 | 181 | 15.2% |
| $35,000 to $49,999 | 131 | 11.0% |
| $50,000 to $74,999 | 288 | 24.2% |
| $75,000 to $99,999 | 163 | 13.7% |
| $100,000 to $149,999 | 200 | 16.8% |
| $150,000 to $199,999 | 29 | 2.4% |
| $200,000+ | 24 | 2.0% |
Household Income by Householder Age in Holiday Heights
The median household income in Holiday Heights is $57,412, with the highest median household income of $71,083 found in the 45 to 64 years age bracket for the primary householder. A total of 235 households (19.8%) fall into this category.
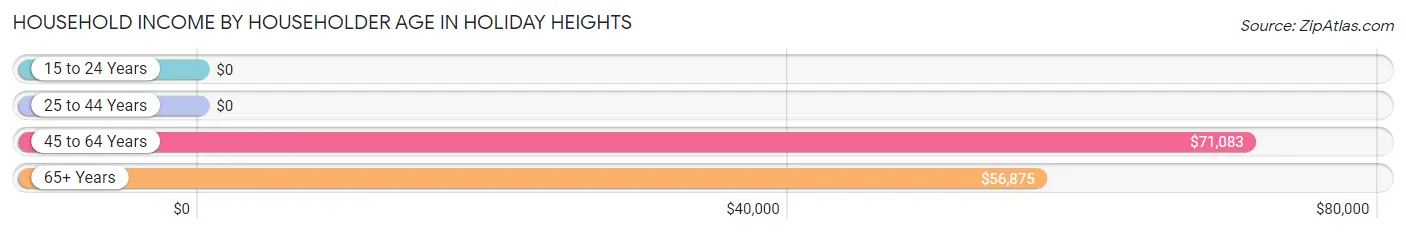
| Income Bracket | # Households | Median Income |
| 15 to 24 Years | 0 (0.0%) | $0 |
| 25 to 44 Years | 11 (0.9%) | $0 |
| 45 to 64 Years | 235 (19.8%) | $71,083 |
| 65+ Years | 943 (79.3%) | $56,875 |
| Total | 1,189 (100.0%) | $57,412 |
Poverty in Holiday Heights
Income Below Poverty by Sex and Age in Holiday Heights
With 6.4% poverty level for males and 8.1% for females among the residents of Holiday Heights, 55 to 64 year old males and 75 year old and over females are the most vulnerable to poverty, with 16 males (11.4%) and 45 females (12.2%) in their respective age groups living below the poverty level.
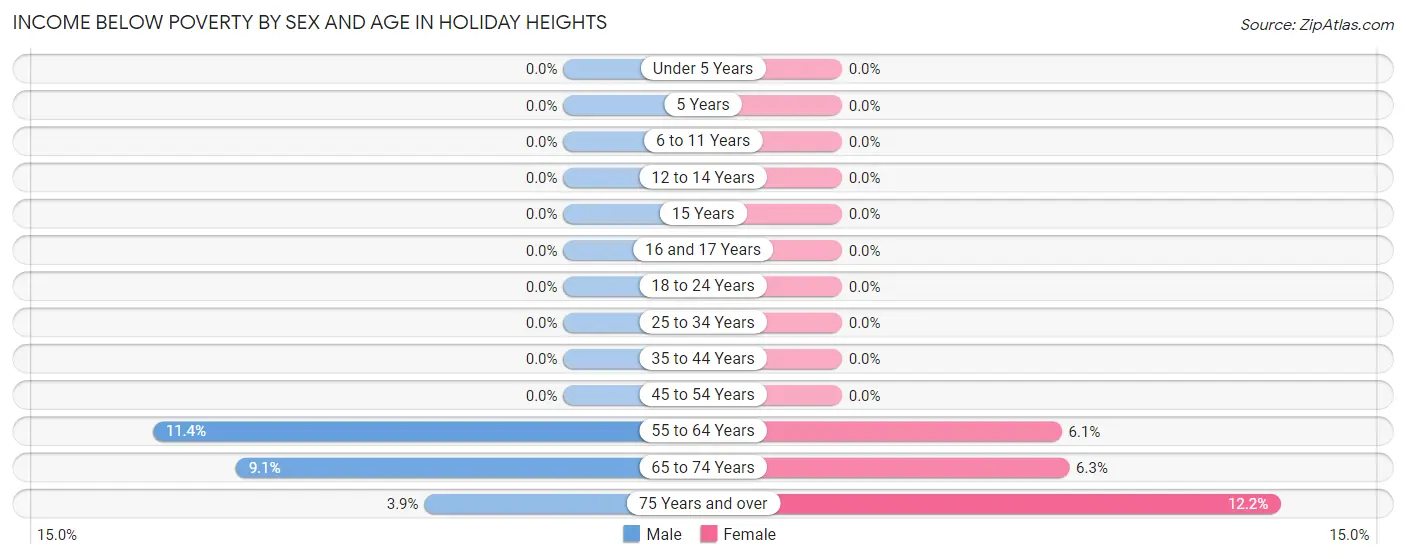
| Age Bracket | Male | Female |
| Under 5 Years | 0 (0.0%) | 0 (0.0%) |
| 5 Years | 0 (0.0%) | 0 (0.0%) |
| 6 to 11 Years | 0 (0.0%) | 0 (0.0%) |
| 12 to 14 Years | 0 (0.0%) | 0 (0.0%) |
| 15 Years | 0 (0.0%) | 0 (0.0%) |
| 16 and 17 Years | 0 (0.0%) | 0 (0.0%) |
| 18 to 24 Years | 0 (0.0%) | 0 (0.0%) |
| 25 to 34 Years | 0 (0.0%) | 0 (0.0%) |
| 35 to 44 Years | 0 (0.0%) | 0 (0.0%) |
| 45 to 54 Years | 0 (0.0%) | 0 (0.0%) |
| 55 to 64 Years | 16 (11.4%) | 15 (6.1%) |
| 65 to 74 Years | 30 (9.1%) | 29 (6.3%) |
| 75 Years and over | 15 (3.9%) | 45 (12.2%) |
| Total | 61 (6.4%) | 89 (8.1%) |
Income Above Poverty by Sex and Age in Holiday Heights
According to the poverty statistics in Holiday Heights, males aged under 5 years and females aged 25 to 34 years are the age groups that are most secure financially, with 100.0% of males and 100.0% of females in these age groups living above the poverty line.
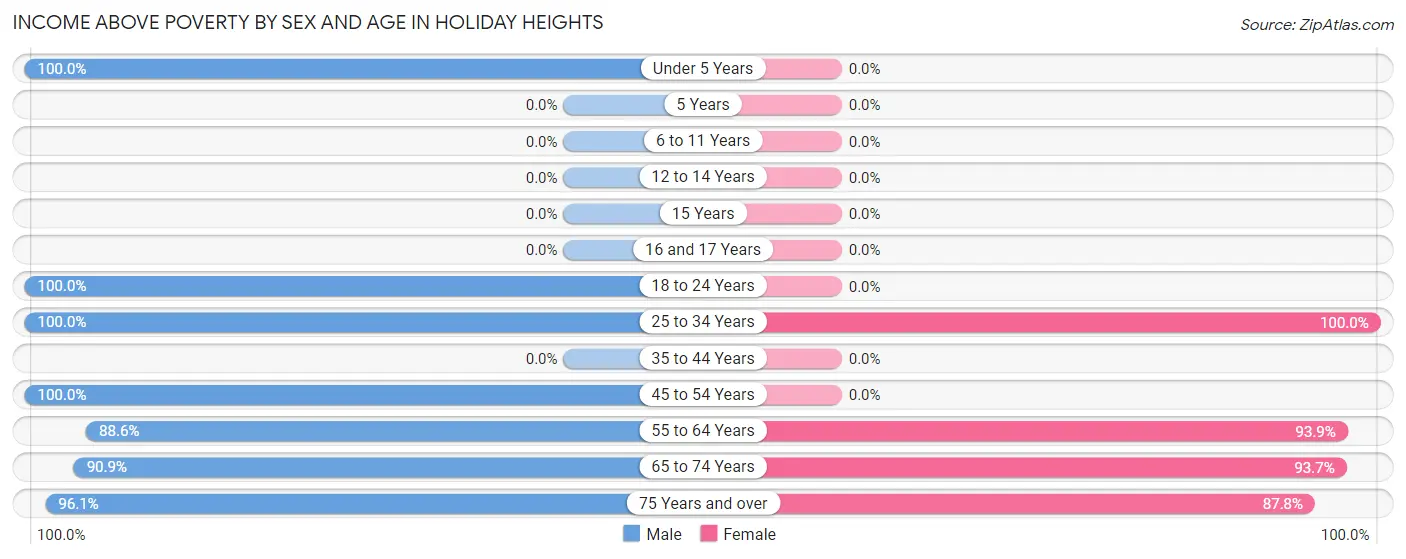
| Age Bracket | Male | Female |
| Under 5 Years | 15 (100.0%) | 0 (0.0%) |
| 5 Years | 0 (0.0%) | 0 (0.0%) |
| 6 to 11 Years | 0 (0.0%) | 0 (0.0%) |
| 12 to 14 Years | 0 (0.0%) | 0 (0.0%) |
| 15 Years | 0 (0.0%) | 0 (0.0%) |
| 16 and 17 Years | 0 (0.0%) | 0 (0.0%) |
| 18 to 24 Years | 20 (100.0%) | 0 (0.0%) |
| 25 to 34 Years | 28 (100.0%) | 28 (100.0%) |
| 35 to 44 Years | 0 (0.0%) | 0 (0.0%) |
| 45 to 54 Years | 29 (100.0%) | 0 (0.0%) |
| 55 to 64 Years | 124 (88.6%) | 230 (93.9%) |
| 65 to 74 Years | 299 (90.9%) | 429 (93.7%) |
| 75 Years and over | 373 (96.1%) | 324 (87.8%) |
| Total | 888 (93.6%) | 1,011 (91.9%) |
Income Below Poverty Among Married-Couple Families in Holiday Heights
The poverty statistics for married-couple families in Holiday Heights show that 7.4% or 45 of the total 605 families live below the poverty line. Families with no children have the highest poverty rate of 7.4%, comprising of 45 families. On the other hand, families with no children have the lowest poverty rate of 7.4%, which includes 45 families.
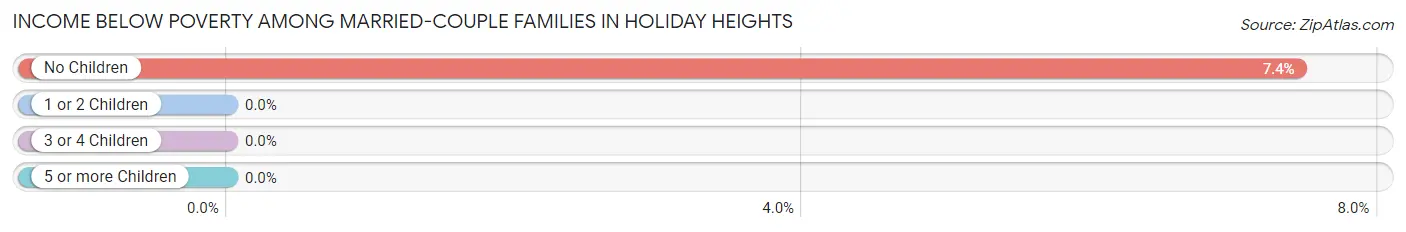
| Children | Above Poverty | Below Poverty |
| No Children | 560 (92.6%) | 45 (7.4%) |
| 1 or 2 Children | 0 (0.0%) | 0 (0.0%) |
| 3 or 4 Children | 0 (0.0%) | 0 (0.0%) |
| 5 or more Children | 0 (0.0%) | 0 (0.0%) |
| Total | 560 (92.6%) | 45 (7.4%) |
Income Below Poverty Among Single-Parent Households in Holiday Heights
| Children | Single Father | Single Mother |
| No Children | 0 (0.0%) | 0 (0.0%) |
| 1 or 2 Children | 0 (0.0%) | 0 (0.0%) |
| 3 or 4 Children | 0 (0.0%) | 0 (0.0%) |
| 5 or more Children | 0 (0.0%) | 0 (0.0%) |
| Total | 0 (0.0%) | 0 (0.0%) |
Income Below Poverty Among Married-Couple vs Single-Parent Households in Holiday Heights
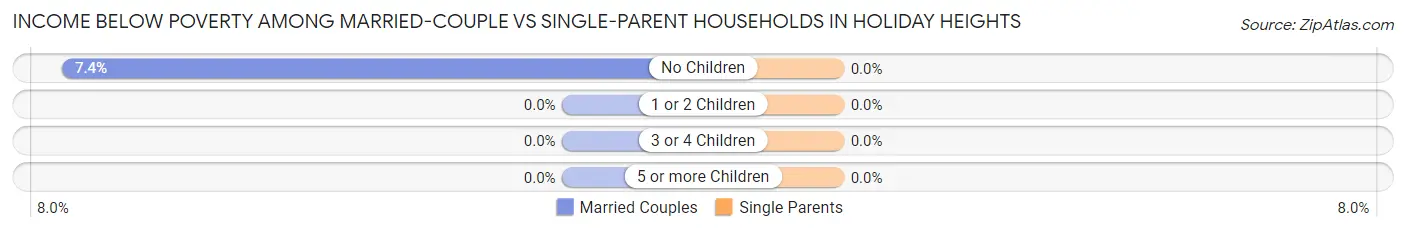
| Children | Married-Couple Families | Single-Parent Households |
| No Children | 45 (7.4%) | 0 (0.0%) |
| 1 or 2 Children | 0 (0.0%) | 0 (0.0%) |
| 3 or 4 Children | 0 (0.0%) | 0 (0.0%) |
| 5 or more Children | 0 (0.0%) | 0 (0.0%) |
| Total | 45 (7.4%) | 0 (0.0%) |
Race in Holiday Heights
The most populous races in Holiday Heights are White / Caucasian (1,911 | 93.3%), Black / African American (59 | 2.9%), and Hispanic or Latino (49 | 2.4%).
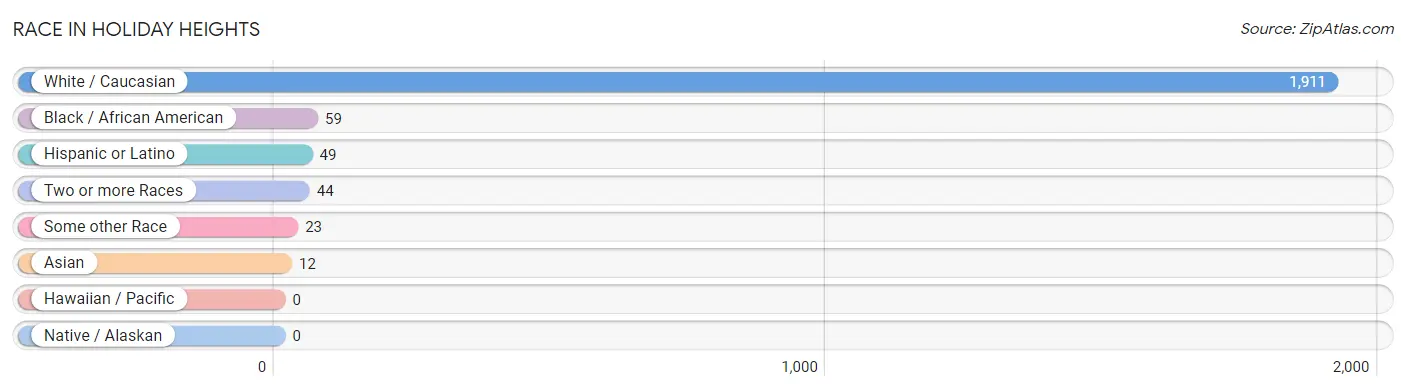
| Race | # Population | % Population |
| Asian | 12 | 0.6% |
| Black / African American | 59 | 2.9% |
| Hawaiian / Pacific | 0 | 0.0% |
| Hispanic or Latino | 49 | 2.4% |
| Native / Alaskan | 0 | 0.0% |
| White / Caucasian | 1,911 | 93.3% |
| Two or more Races | 44 | 2.1% |
| Some other Race | 23 | 1.1% |
| Total | 2,049 | 100.0% |
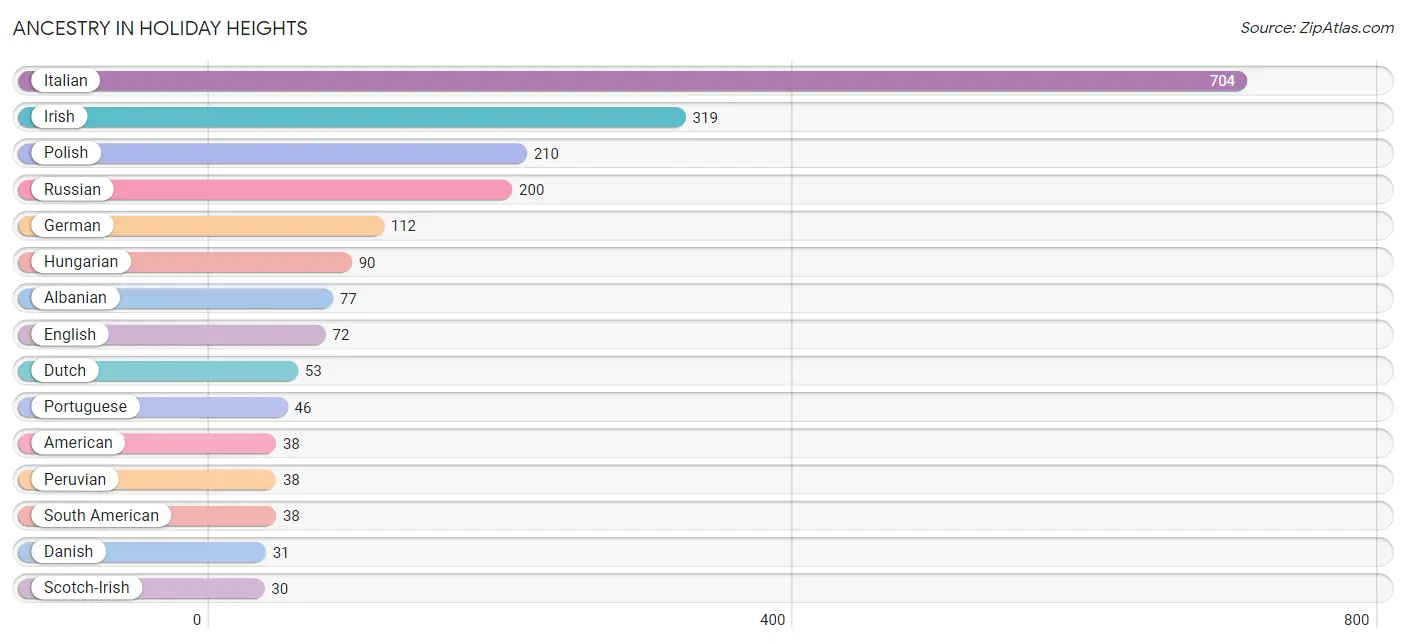
Ancestry in Holiday Heights
The most populous ancestries reported in Holiday Heights are Italian (704 | 34.4%), Irish (319 | 15.6%), Polish (210 | 10.2%), Russian (200 | 9.8%), and German (112 | 5.5%), together accounting for 75.4% of all Holiday Heights residents.
| Ancestry | # Population | % Population |
| Albanian | 77 | 3.8% |
| American | 38 | 1.8% |
| Arab | 14 | 0.7% |
| Belgian | 12 | 0.6% |
| British | 17 | 0.8% |
| Czechoslovakian | 15 | 0.7% |
| Danish | 31 | 1.5% |
| Dutch | 53 | 2.6% |
| English | 72 | 3.5% |
| French | 12 | 0.6% |
| German | 112 | 5.5% |
| Hungarian | 90 | 4.4% |
| Irish | 319 | 15.6% |
| Italian | 704 | 34.4% |
| Korean | 12 | 0.6% |
| Lebanese | 14 | 0.7% |
| Lithuanian | 13 | 0.6% |
| Maltese | 13 | 0.6% |
| Norwegian | 26 | 1.3% |
| Peruvian | 38 | 1.8% |
| Polish | 210 | 10.2% |
| Portuguese | 46 | 2.2% |
| Puerto Rican | 11 | 0.5% |
| Romanian | 12 | 0.6% |
| Russian | 200 | 9.8% |
| Scotch-Irish | 30 | 1.5% |
| Slovak | 27 | 1.3% |
| South American | 38 | 1.8% |
| Syrian | 14 | 0.7% |
| Ukrainian | 27 | 1.3% | View All 30 Rows |
Immigrants in Holiday Heights
The most numerous immigrant groups reported in Holiday Heights came from Europe (457 | 22.3%), Eastern Europe (228 | 11.1%), Southern Europe (154 | 7.5%), Italy (110 | 5.4%), and Russia (82 | 4.0%), together accounting for 50.3% of all Holiday Heights residents.
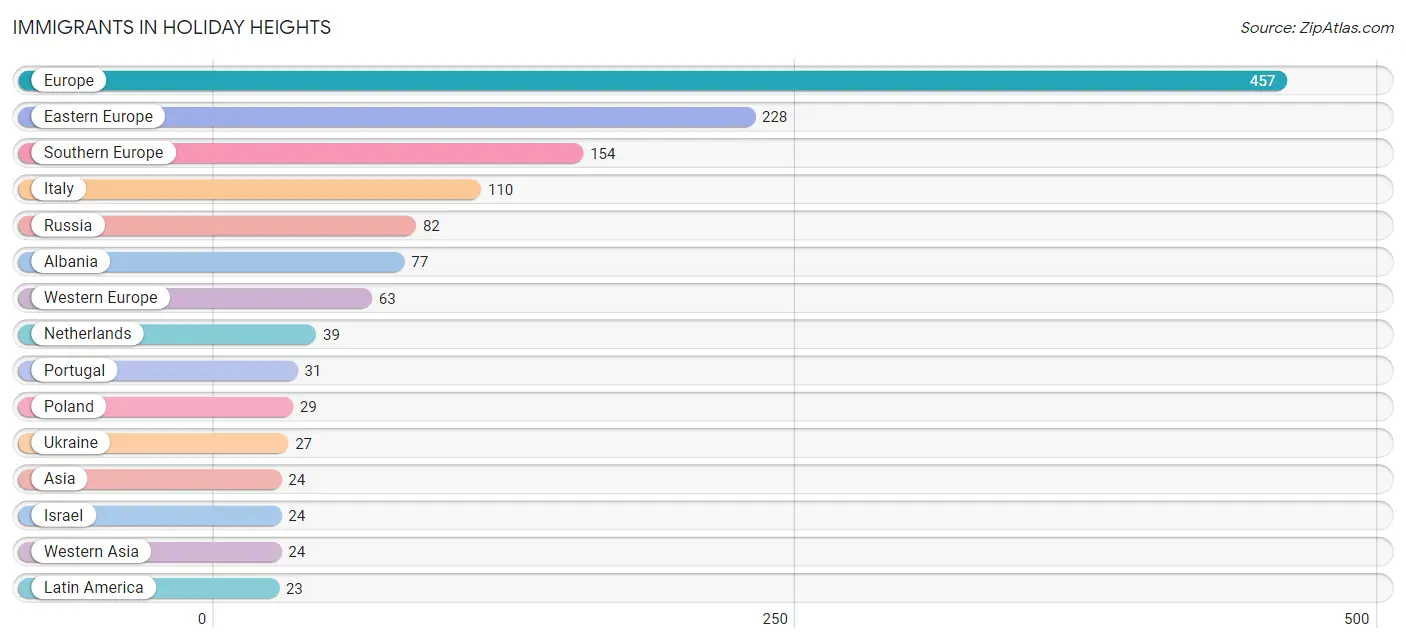
| Immigration Origin | # Population | % Population |
| Albania | 77 | 3.8% |
| Asia | 24 | 1.2% |
| Belgium | 12 | 0.6% |
| Eastern Europe | 228 | 11.1% |
| Europe | 457 | 22.3% |
| France | 12 | 0.6% |
| Ireland | 12 | 0.6% |
| Israel | 24 | 1.2% |
| Italy | 110 | 5.4% |
| Latin America | 23 | 1.1% |
| Lithuania | 13 | 0.6% |
| Netherlands | 39 | 1.9% |
| Northern Europe | 12 | 0.6% |
| Peru | 23 | 1.1% |
| Poland | 29 | 1.4% |
| Portugal | 31 | 1.5% |
| Russia | 82 | 4.0% |
| South America | 23 | 1.1% |
| Southern Europe | 154 | 7.5% |
| Ukraine | 27 | 1.3% |
| Western Asia | 24 | 1.2% |
| Western Europe | 63 | 3.1% | View All 22 Rows |
Sex and Age in Holiday Heights
Sex and Age in Holiday Heights
The most populous age groups in Holiday Heights are 65 to 69 Years (177 | 18.6%) for men and 65 to 69 Years (241 | 21.9%) for women.
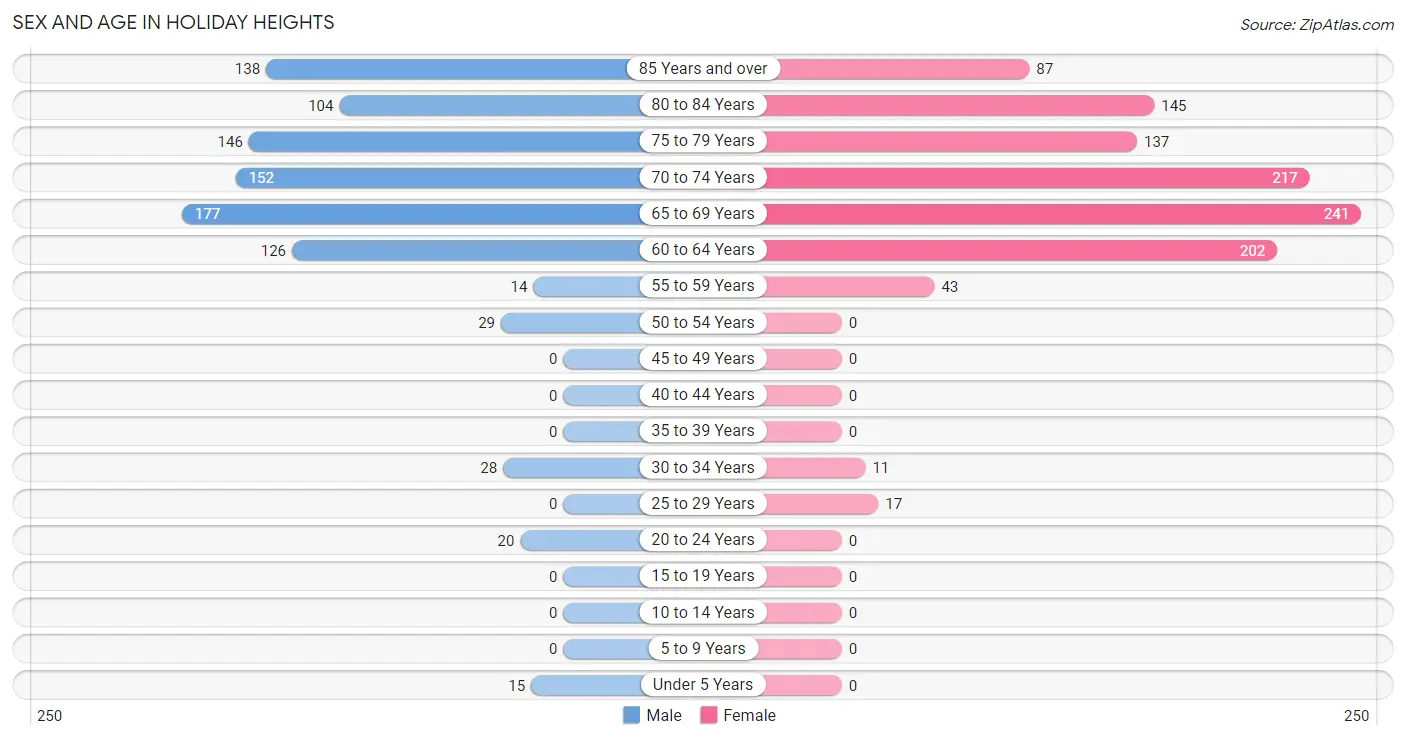
| Age Bracket | Male | Female |
| Under 5 Years | 15 (1.6%) | 0 (0.0%) |
| 5 to 9 Years | 0 (0.0%) | 0 (0.0%) |
| 10 to 14 Years | 0 (0.0%) | 0 (0.0%) |
| 15 to 19 Years | 0 (0.0%) | 0 (0.0%) |
| 20 to 24 Years | 20 (2.1%) | 0 (0.0%) |
| 25 to 29 Years | 0 (0.0%) | 17 (1.5%) |
| 30 to 34 Years | 28 (2.9%) | 11 (1.0%) |
| 35 to 39 Years | 0 (0.0%) | 0 (0.0%) |
| 40 to 44 Years | 0 (0.0%) | 0 (0.0%) |
| 45 to 49 Years | 0 (0.0%) | 0 (0.0%) |
| 50 to 54 Years | 29 (3.1%) | 0 (0.0%) |
| 55 to 59 Years | 14 (1.5%) | 43 (3.9%) |
| 60 to 64 Years | 126 (13.3%) | 202 (18.4%) |
| 65 to 69 Years | 177 (18.6%) | 241 (21.9%) |
| 70 to 74 Years | 152 (16.0%) | 217 (19.7%) |
| 75 to 79 Years | 146 (15.4%) | 137 (12.4%) |
| 80 to 84 Years | 104 (11.0%) | 145 (13.2%) |
| 85 Years and over | 138 (14.5%) | 87 (7.9%) |
| Total | 949 (100.0%) | 1,100 (100.0%) |
Families and Households in Holiday Heights
Median Family Size in Holiday Heights
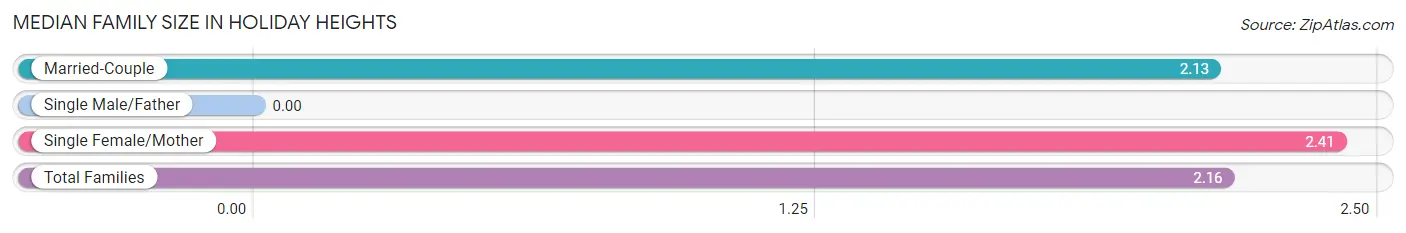
| Family Type | # Families | Family Size |
| Married-Couple | 605 (90.6%) | 2.13 |
| Single Male/Father | 0 (0.0%) | - |
| Single Female/Mother | 63 (9.4%) | 2.41 |
| Total Families | 668 (100.0%) | 2.16 |
Median Household Size in Holiday Heights
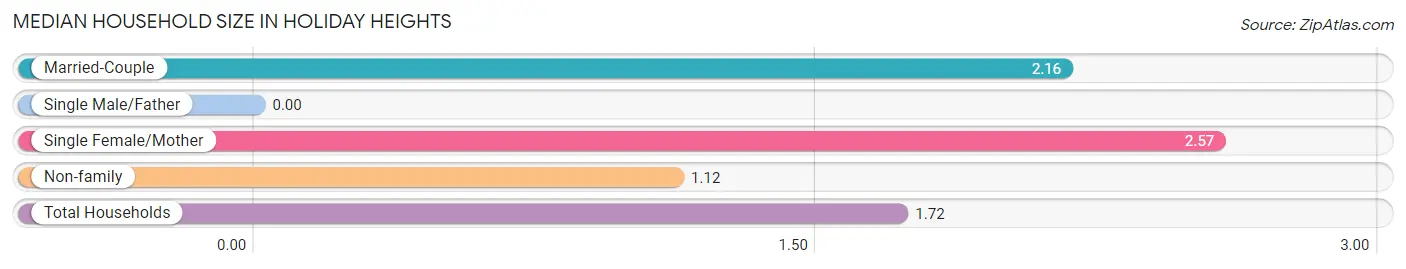
| Household Type | # Households | Household Size |
| Married-Couple | 605 (50.9%) | 2.16 |
| Single Male/Father | 0 (0.0%) | - |
| Single Female/Mother | 63 (5.3%) | 2.57 |
| Non-family | 521 (43.8%) | 1.12 |
| Total Households | 1,189 (100.0%) | 1.72 |
Household Size by Marriage Status in Holiday Heights
Out of a total of 1,189 households in Holiday Heights, 668 (56.2%) are family households, while 521 (43.8%) are nonfamily households. The most numerous type of family households are 2-person households, comprising 599, and the most common type of nonfamily households are 1-person households, comprising 463.
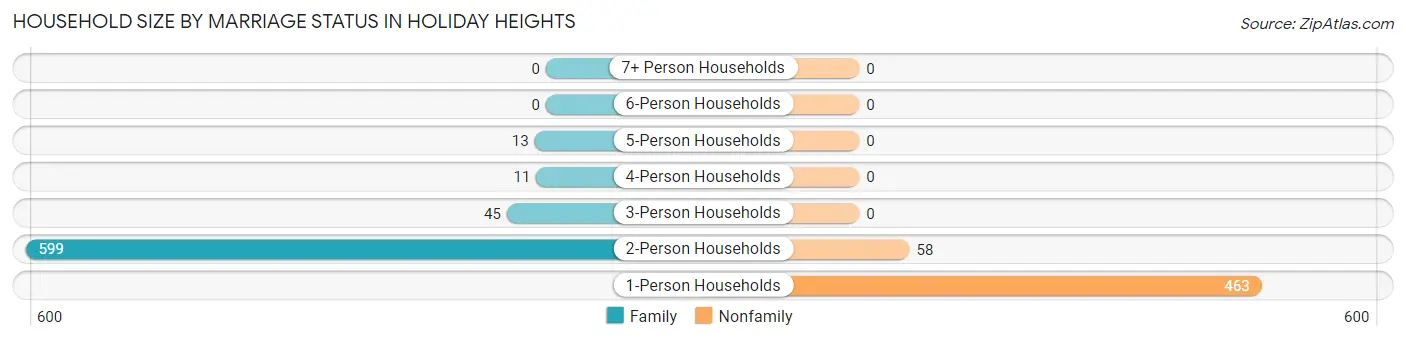
| Household Size | Family Households | Nonfamily Households |
| 1-Person Households | - | 463 (38.9%) |
| 2-Person Households | 599 (50.4%) | 58 (4.9%) |
| 3-Person Households | 45 (3.8%) | 0 (0.0%) |
| 4-Person Households | 11 (0.9%) | 0 (0.0%) |
| 5-Person Households | 13 (1.1%) | 0 (0.0%) |
| 6-Person Households | 0 (0.0%) | 0 (0.0%) |
| 7+ Person Households | 0 (0.0%) | 0 (0.0%) |
| Total | 668 (56.2%) | 521 (43.8%) |
Female Fertility in Holiday Heights
Fertility by Age in Holiday Heights
Average fertility rate in Holiday Heights is 393.0 births per 1,000 women. Women in the age bracket of 20 to 34 years have the highest fertility rate with 393.0 births per 1,000 women. Women in the age bracket of 20 to 34 years acount for 100.0% of all women with births.
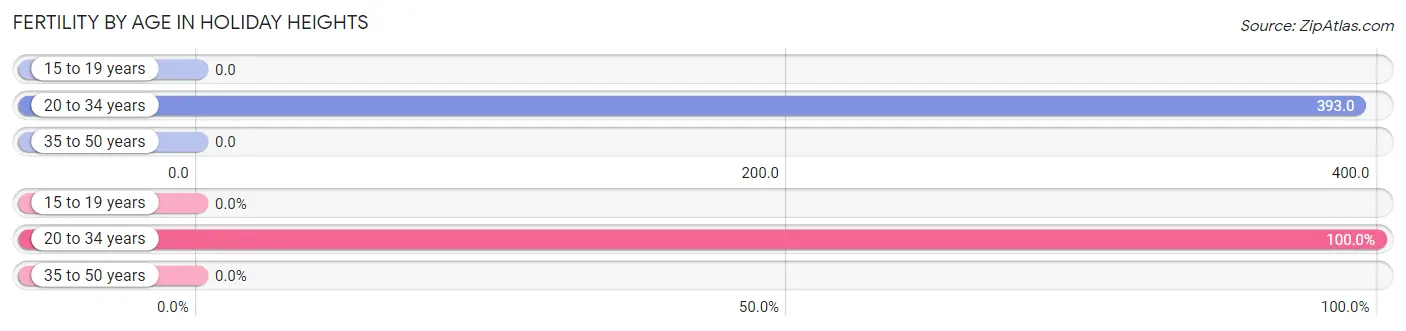
| Age Bracket | Women with Births | Births / 1,000 Women |
| 15 to 19 years | 0 (0.0%) | 0.0 |
| 20 to 34 years | 11 (100.0%) | 393.0 |
| 35 to 50 years | 0 (0.0%) | 0.0 |
| Total | 11 (100.0%) | 393.0 |
Fertility by Age by Marriage Status in Holiday Heights
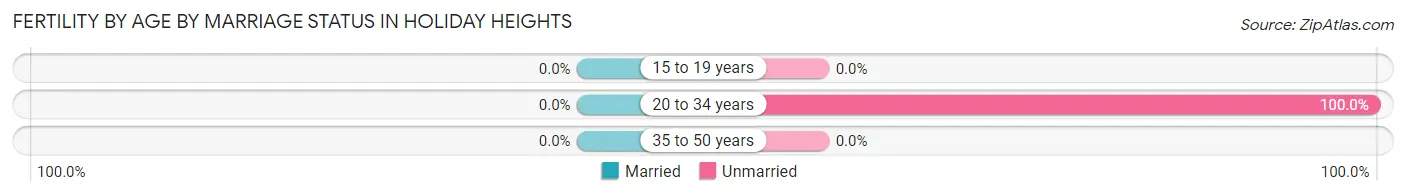
| Age Bracket | Married | Unmarried |
| 15 to 19 years | 0 (0.0%) | 0 (0.0%) |
| 20 to 34 years | 0 (0.0%) | 11 (100.0%) |
| 35 to 50 years | 0 (0.0%) | 0 (0.0%) |
| Total | 0 (0.0%) | 11 (100.0%) |
Fertility by Education in Holiday Heights
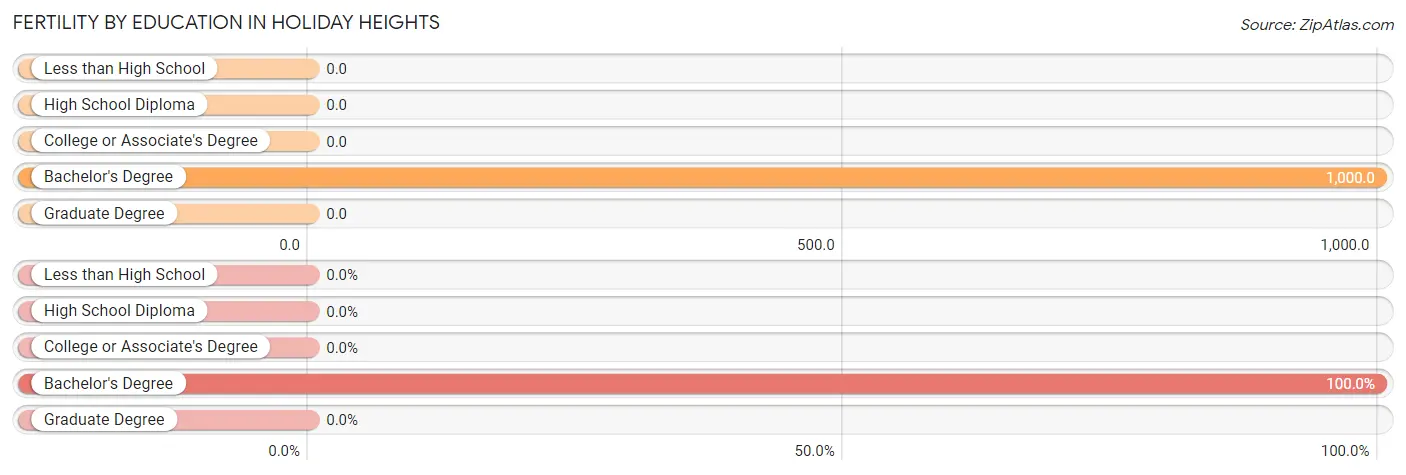
| Educational Attainment | Women with Births | Births / 1,000 Women |
| Less than High School | 0 (0.0%) | 0.0 |
| High School Diploma | 0 (0.0%) | 0.0 |
| College or Associate's Degree | 0 (0.0%) | 0.0 |
| Bachelor's Degree | 11 (100.0%) | 1,000.0 |
| Graduate Degree | 0 (0.0%) | 0.0 |
| Total | 11 (100.0%) | 393.0 |
Fertility by Education by Marriage Status in Holiday Heights
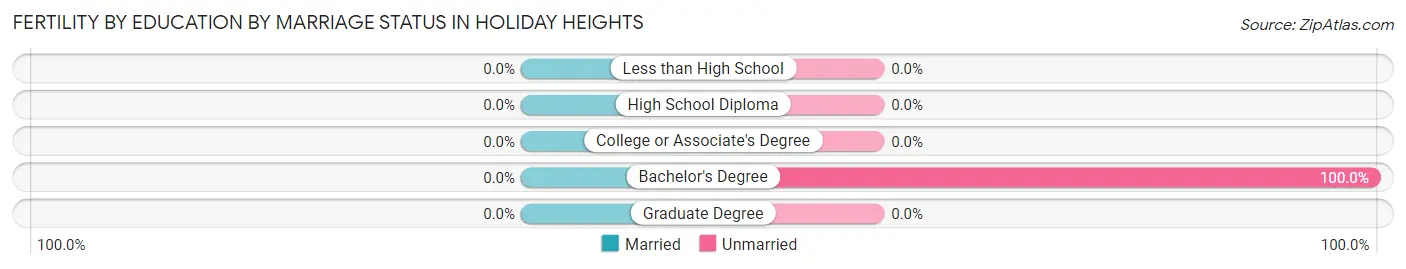
| Educational Attainment | Married | Unmarried |
| Less than High School | 0 (0.0%) | 0 (0.0%) |
| High School Diploma | 0 (0.0%) | 0 (0.0%) |
| College or Associate's Degree | 0 (0.0%) | 0 (0.0%) |
| Bachelor's Degree | 0 (0.0%) | 11 (100.0%) |
| Graduate Degree | 0 (0.0%) | 0 (0.0%) |
| Total | 0 (0.0%) | 11 (100.0%) |
Employment Characteristics in Holiday Heights
Employment by Class of Employer in Holiday Heights
Among the 454 employed individuals in Holiday Heights, private company employees (394 | 86.8%), local government employees (27 | 5.9%), and federal government employees (20 | 4.4%) make up the most common classes of employment.
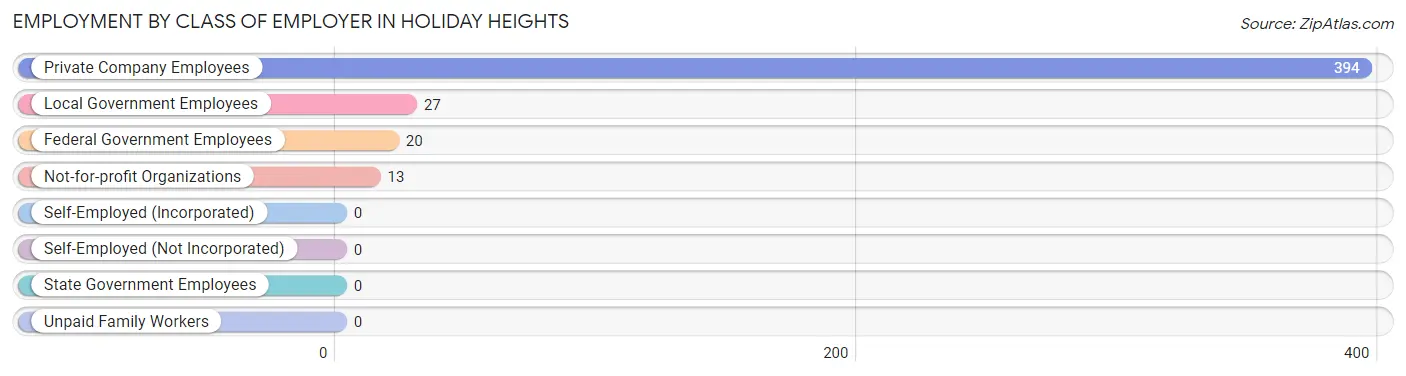
| Employer Class | # Employees | % Employees |
| Private Company Employees | 394 | 86.8% |
| Self-Employed (Incorporated) | 0 | 0.0% |
| Self-Employed (Not Incorporated) | 0 | 0.0% |
| Not-for-profit Organizations | 13 | 2.9% |
| Local Government Employees | 27 | 5.9% |
| State Government Employees | 0 | 0.0% |
| Federal Government Employees | 20 | 4.4% |
| Unpaid Family Workers | 0 | 0.0% |
| Total | 454 | 100.0% |
Employment Status by Age in Holiday Heights
According to the labor force statistics for Holiday Heights, out of the total population over 16 years of age (2,034), 25.1% or 511 individuals are in the labor force, with 8.2% or 42 of them unemployed. The age group with the highest labor force participation rate is 20 to 24 years, with 100.0% or 20 individuals in the labor force. Within the labor force, the 60 to 64 years age range has the highest percentage of unemployed individuals, with 16.8% or 25 of them being unemployed.
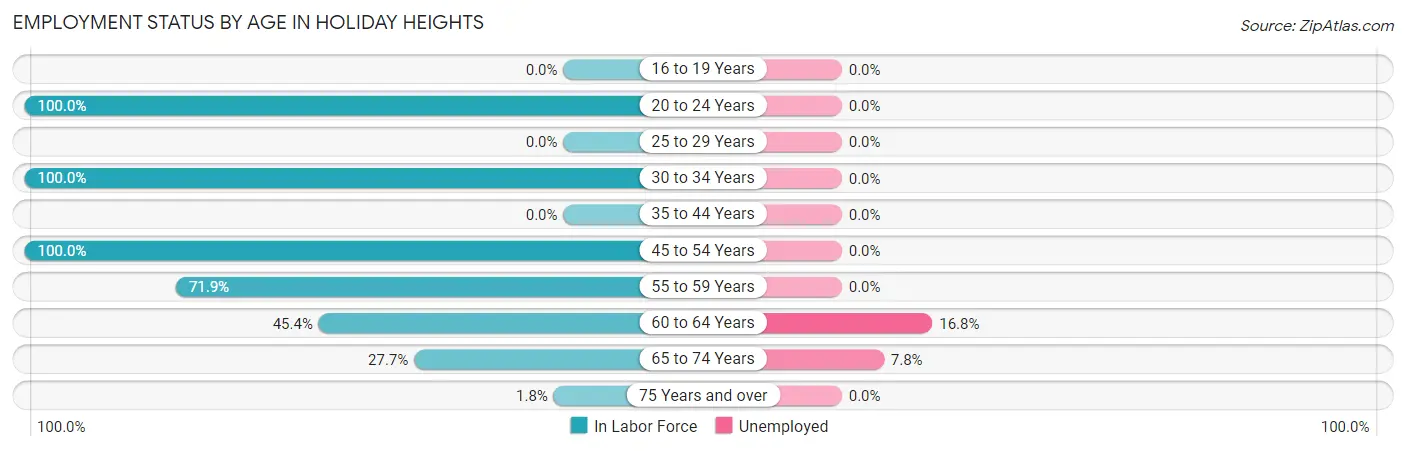
| Age Bracket | In Labor Force | Unemployed |
| 16 to 19 Years | 0 (0.0%) | 0 (0.0%) |
| 20 to 24 Years | 20 (100.0%) | 0 (0.0%) |
| 25 to 29 Years | 0 (0.0%) | 0 (0.0%) |
| 30 to 34 Years | 39 (100.0%) | 0 (0.0%) |
| 35 to 44 Years | 0 (0.0%) | 0 (0.0%) |
| 45 to 54 Years | 29 (100.0%) | 0 (0.0%) |
| 55 to 59 Years | 41 (71.9%) | 0 (0.0%) |
| 60 to 64 Years | 149 (45.4%) | 25 (16.8%) |
| 65 to 74 Years | 218 (27.7%) | 17 (7.8%) |
| 75 Years and over | 14 (1.8%) | 0 (0.0%) |
| Total | 511 (25.1%) | 42 (8.2%) |
Employment Status by Educational Attainment in Holiday Heights
According to labor force statistics for Holiday Heights, 54.9% of individuals (258) out of the total population between 25 and 64 years of age (470) are in the labor force, with 9.7% or 25 of them being unemployed. The group with the highest labor force participation rate are those with the educational attainment of college / associate degree, with 85.1% or 97 individuals in the labor force. Within the labor force, individuals with bachelor's degree or higher education have the highest percentage of unemployment, with 39.7% or 25 of them being unemployed.
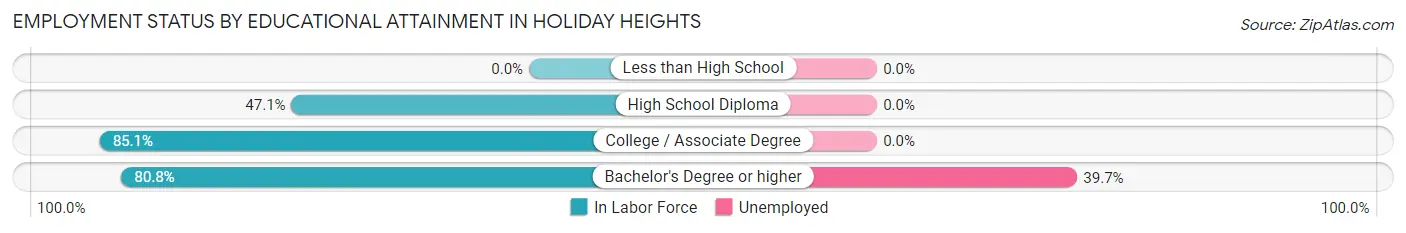
| Educational Attainment | In Labor Force | Unemployed |
| Less than High School | 0 (0.0%) | 0 (0.0%) |
| High School Diploma | 98 (47.1%) | 0 (0.0%) |
| College / Associate Degree | 97 (85.1%) | 0 (0.0%) |
| Bachelor's Degree or higher | 63 (80.8%) | 31 (39.7%) |
| Total | 258 (54.9%) | 46 (9.7%) |
Employment Occupations by Sex in Holiday Heights
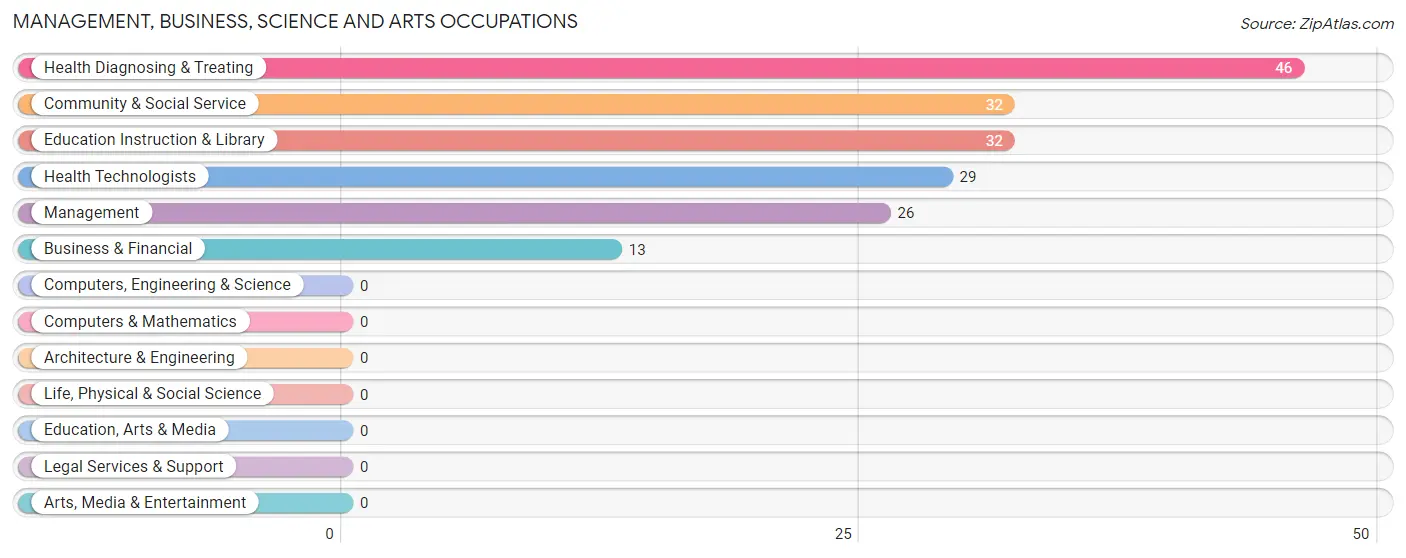
Management, Business, Science and Arts Occupations
The most common Management, Business, Science and Arts occupations in Holiday Heights are Health Diagnosing & Treating (46 | 9.8%), Community & Social Service (32 | 6.8%), Education Instruction & Library (32 | 6.8%), Health Technologists (29 | 6.2%), and Management (26 | 5.6%).
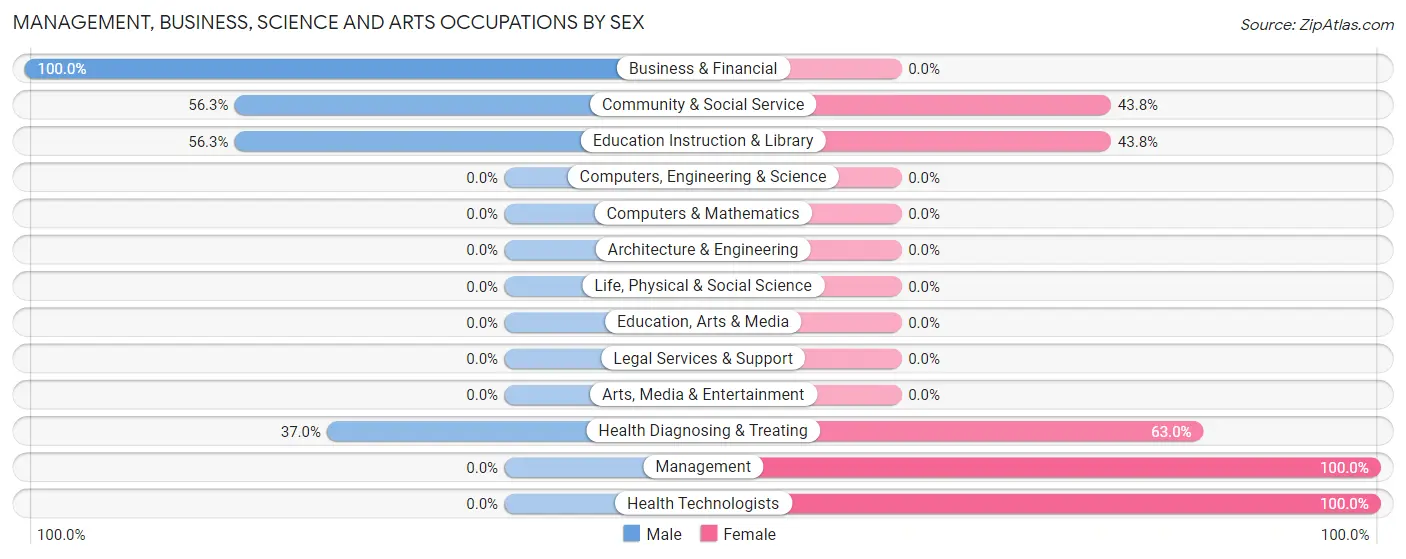
Management, Business, Science and Arts Occupations by Sex
Within the Management, Business, Science and Arts occupations in Holiday Heights, the most male-oriented occupations are Business & Financial (100.0%), Community & Social Service (56.2%), and Education Instruction & Library (56.2%), while the most female-oriented occupations are Management (100.0%), Health Technologists (100.0%), and Health Diagnosing & Treating (63.0%).
| Occupation | Male | Female |
| Management | 0 (0.0%) | 26 (100.0%) |
| Business & Financial | 13 (100.0%) | 0 (0.0%) |
| Computers, Engineering & Science | 0 (0.0%) | 0 (0.0%) |
| Computers & Mathematics | 0 (0.0%) | 0 (0.0%) |
| Architecture & Engineering | 0 (0.0%) | 0 (0.0%) |
| Life, Physical & Social Science | 0 (0.0%) | 0 (0.0%) |
| Community & Social Service | 18 (56.2%) | 14 (43.8%) |
| Education, Arts & Media | 0 (0.0%) | 0 (0.0%) |
| Legal Services & Support | 0 (0.0%) | 0 (0.0%) |
| Education Instruction & Library | 18 (56.2%) | 14 (43.8%) |
| Arts, Media & Entertainment | 0 (0.0%) | 0 (0.0%) |
| Health Diagnosing & Treating | 17 (37.0%) | 29 (63.0%) |
| Health Technologists | 0 (0.0%) | 29 (100.0%) |
| Total (Category) | 48 (41.0%) | 69 (59.0%) |
| Total (Overall) | 191 (40.8%) | 277 (59.2%) |
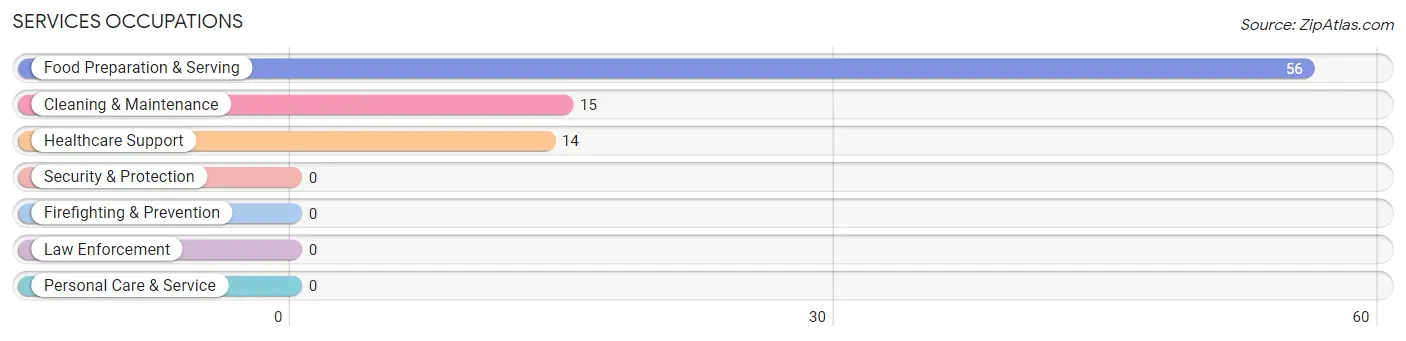
Services Occupations
The most common Services occupations in Holiday Heights are Food Preparation & Serving (56 | 12.0%), Cleaning & Maintenance (15 | 3.2%), and Healthcare Support (14 | 3.0%).
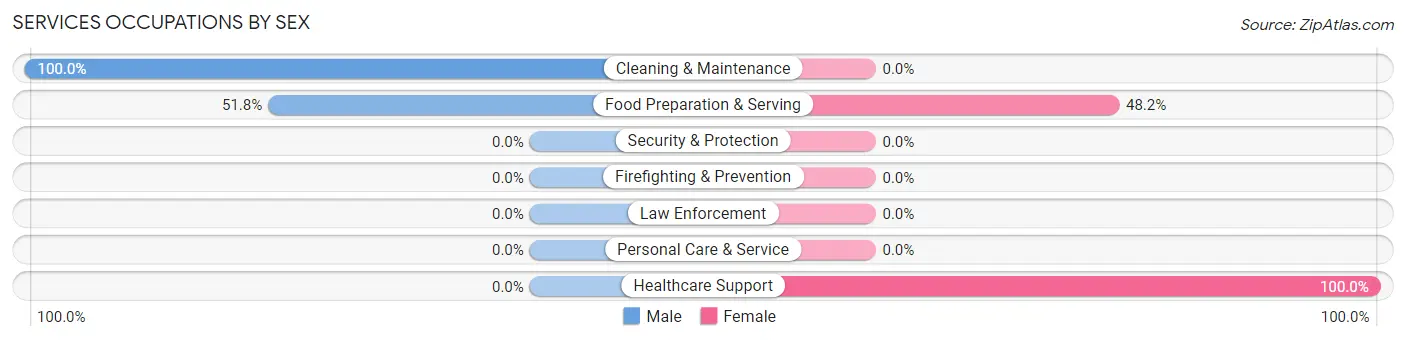
Services Occupations by Sex
Within the Services occupations in Holiday Heights, the most male-oriented occupations are Cleaning & Maintenance (100.0%), and Food Preparation & Serving (51.8%), while the most female-oriented occupations are Healthcare Support (100.0%), and Food Preparation & Serving (48.2%).
| Occupation | Male | Female |
| Healthcare Support | 0 (0.0%) | 14 (100.0%) |
| Security & Protection | 0 (0.0%) | 0 (0.0%) |
| Firefighting & Prevention | 0 (0.0%) | 0 (0.0%) |
| Law Enforcement | 0 (0.0%) | 0 (0.0%) |
| Food Preparation & Serving | 29 (51.8%) | 27 (48.2%) |
| Cleaning & Maintenance | 15 (100.0%) | 0 (0.0%) |
| Personal Care & Service | 0 (0.0%) | 0 (0.0%) |
| Total (Category) | 44 (51.8%) | 41 (48.2%) |
| Total (Overall) | 191 (40.8%) | 277 (59.2%) |
Sales and Office Occupations
The most common Sales and Office occupations in Holiday Heights are Office & Administration (158 | 33.8%), and Sales & Related (54 | 11.5%).
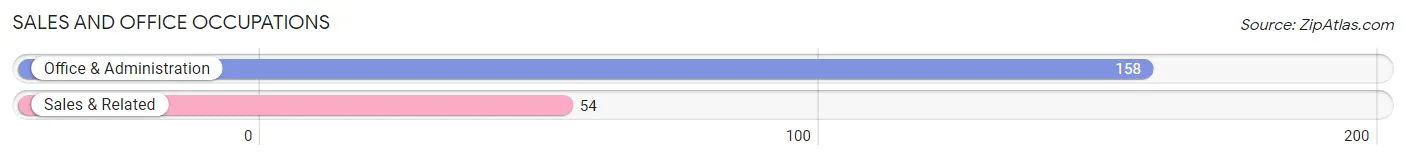
Sales and Office Occupations by Sex
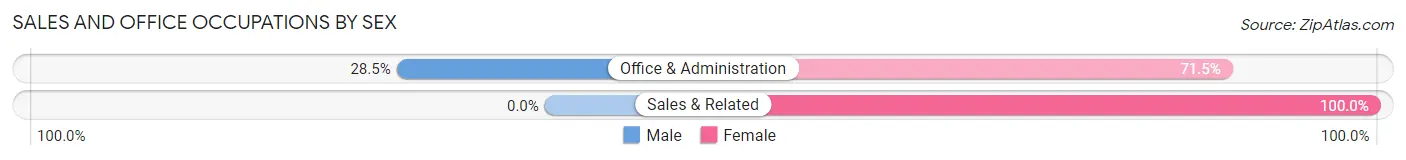
| Occupation | Male | Female |
| Sales & Related | 0 (0.0%) | 54 (100.0%) |
| Office & Administration | 45 (28.5%) | 113 (71.5%) |
| Total (Category) | 45 (21.2%) | 167 (78.8%) |
| Total (Overall) | 191 (40.8%) | 277 (59.2%) |
Natural Resources, Construction and Maintenance Occupations
The most common Natural Resources, Construction and Maintenance occupations in Holiday Heights are , and Construction & Extraction (28 | 6.0%).
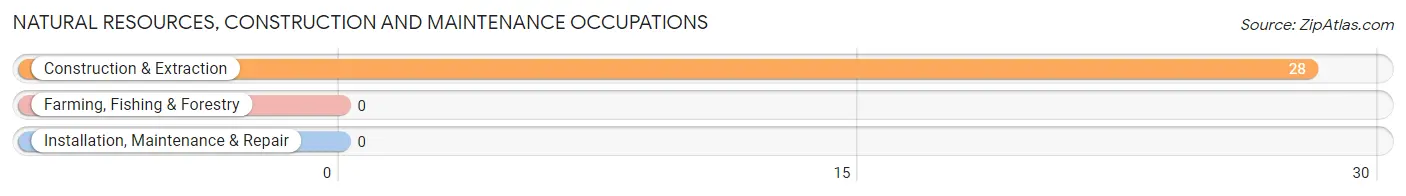
Natural Resources, Construction and Maintenance Occupations by Sex
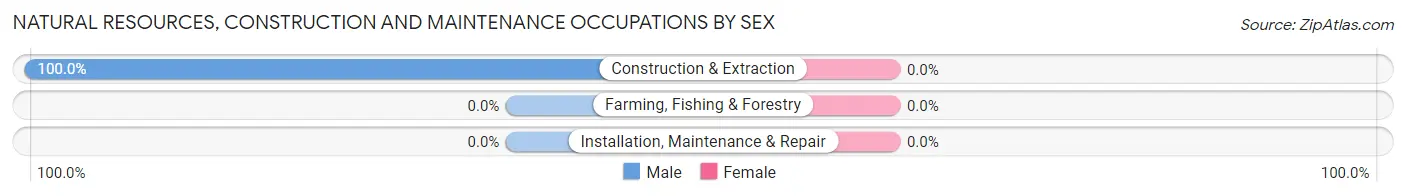
| Occupation | Male | Female |
| Farming, Fishing & Forestry | 0 (0.0%) | 0 (0.0%) |
| Construction & Extraction | 28 (100.0%) | 0 (0.0%) |
| Installation, Maintenance & Repair | 0 (0.0%) | 0 (0.0%) |
| Total (Category) | 28 (100.0%) | 0 (0.0%) |
| Total (Overall) | 191 (40.8%) | 277 (59.2%) |
Production, Transportation and Moving Occupations
The most common Production, Transportation and Moving occupations in Holiday Heights are Production (14 | 3.0%), and Transportation (12 | 2.6%).
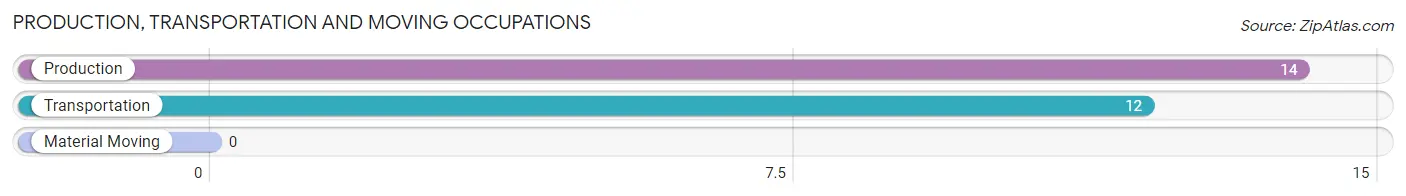
Production, Transportation and Moving Occupations by Sex
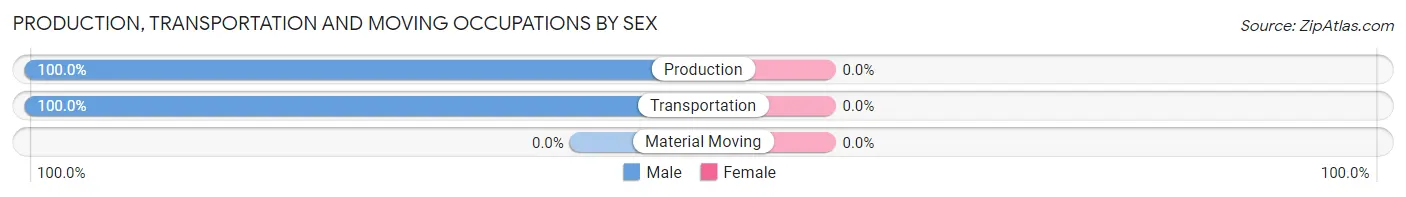
| Occupation | Male | Female |
| Production | 14 (100.0%) | 0 (0.0%) |
| Transportation | 12 (100.0%) | 0 (0.0%) |
| Material Moving | 0 (0.0%) | 0 (0.0%) |
| Total (Category) | 26 (100.0%) | 0 (0.0%) |
| Total (Overall) | 191 (40.8%) | 277 (59.2%) |
Employment Industries by Sex in Holiday Heights
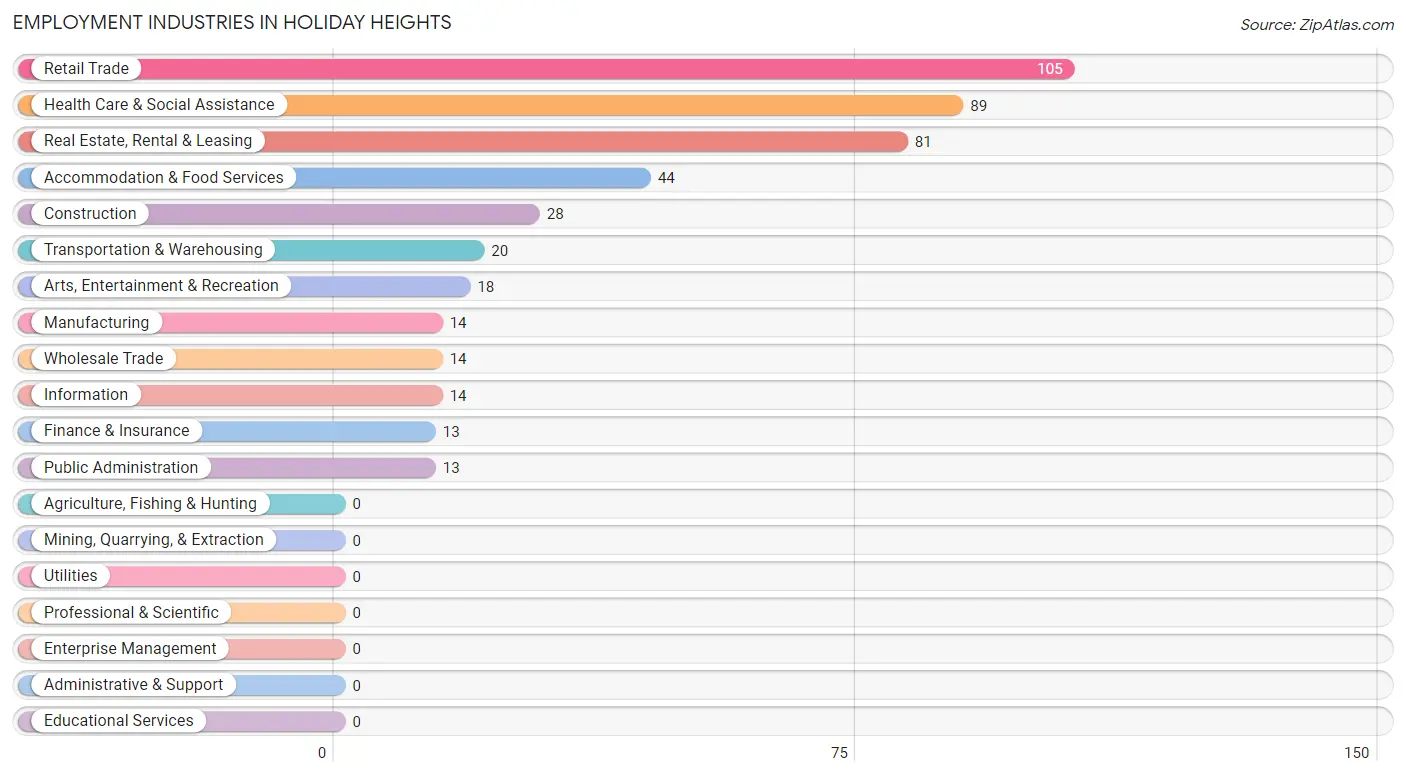
Employment Industries in Holiday Heights
The major employment industries in Holiday Heights include Retail Trade (105 | 22.4%), Health Care & Social Assistance (89 | 19.0%), Real Estate, Rental & Leasing (81 | 17.3%), Accommodation & Food Services (44 | 9.4%), and Construction (28 | 6.0%).
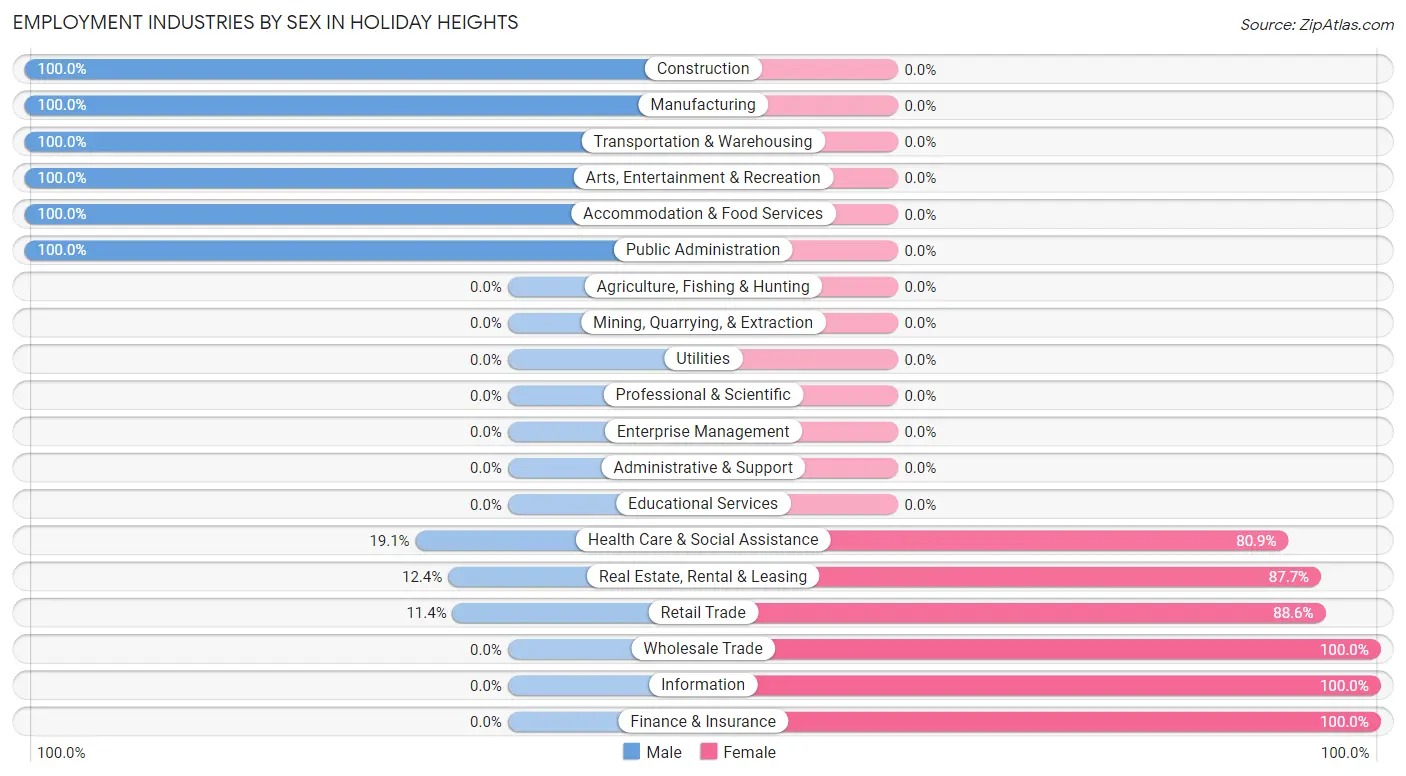
Employment Industries by Sex in Holiday Heights
The Holiday Heights industries that see more men than women are Construction (100.0%), Manufacturing (100.0%), and Transportation & Warehousing (100.0%), whereas the industries that tend to have a higher number of women are Wholesale Trade (100.0%), Information (100.0%), and Finance & Insurance (100.0%).
| Industry | Male | Female |
| Agriculture, Fishing & Hunting | 0 (0.0%) | 0 (0.0%) |
| Mining, Quarrying, & Extraction | 0 (0.0%) | 0 (0.0%) |
| Construction | 28 (100.0%) | 0 (0.0%) |
| Manufacturing | 14 (100.0%) | 0 (0.0%) |
| Wholesale Trade | 0 (0.0%) | 14 (100.0%) |
| Retail Trade | 12 (11.4%) | 93 (88.6%) |
| Transportation & Warehousing | 20 (100.0%) | 0 (0.0%) |
| Utilities | 0 (0.0%) | 0 (0.0%) |
| Information | 0 (0.0%) | 14 (100.0%) |
| Finance & Insurance | 0 (0.0%) | 13 (100.0%) |
| Real Estate, Rental & Leasing | 10 (12.3%) | 71 (87.6%) |
| Professional & Scientific | 0 (0.0%) | 0 (0.0%) |
| Enterprise Management | 0 (0.0%) | 0 (0.0%) |
| Administrative & Support | 0 (0.0%) | 0 (0.0%) |
| Educational Services | 0 (0.0%) | 0 (0.0%) |
| Health Care & Social Assistance | 17 (19.1%) | 72 (80.9%) |
| Arts, Entertainment & Recreation | 18 (100.0%) | 0 (0.0%) |
| Accommodation & Food Services | 44 (100.0%) | 0 (0.0%) |
| Public Administration | 13 (100.0%) | 0 (0.0%) |
| Total | 191 (40.8%) | 277 (59.2%) |
Education in Holiday Heights
School Enrollment in Holiday Heights
| School Level | # Students | % Students |
| Nursery / Preschool | 0 | 0.0% |
| Kindergarten | 0 | 0.0% |
| Elementary School | 0 | 0.0% |
| Middle School | 0 | 0.0% |
| High School | 0 | 0.0% |
| College / Undergraduate | 0 | 0.0% |
| Graduate / Professional | 0 | 0.0% |
| Total | 0 | 0.0% |
School Enrollment by Age by Funding Source in Holiday Heights
| Age Bracket | Public School | Private School |
| 3 to 4 Year Olds | 0 (0.0%) | 0 (0.0%) |
| 5 to 9 Year Old | 0 (0.0%) | 0 (0.0%) |
| 10 to 14 Year Olds | 0 (0.0%) | 0 (0.0%) |
| 15 to 17 Year Olds | 0 (0.0%) | 0 (0.0%) |
| 18 to 19 Year Olds | 0 (0.0%) | 0 (0.0%) |
| 20 to 24 Year Olds | 0 (0.0%) | 0 (0.0%) |
| 25 to 34 Year Olds | 0 (0.0%) | 0 (0.0%) |
| 35 Years and over | 0 (0.0%) | 0 (0.0%) |
| Total | 0 (0.0%) | 0 (0.0%) |
Educational Attainment by Field of Study in Holiday Heights
Science & technology (79 | 28.9%), engineering (58 | 21.2%), business (52 | 19.1%), psychology (25 | 9.2%), and visual & performing arts (16 | 5.9%) are the most common fields of study among 273 individuals in Holiday Heights who have obtained a bachelor's degree or higher.
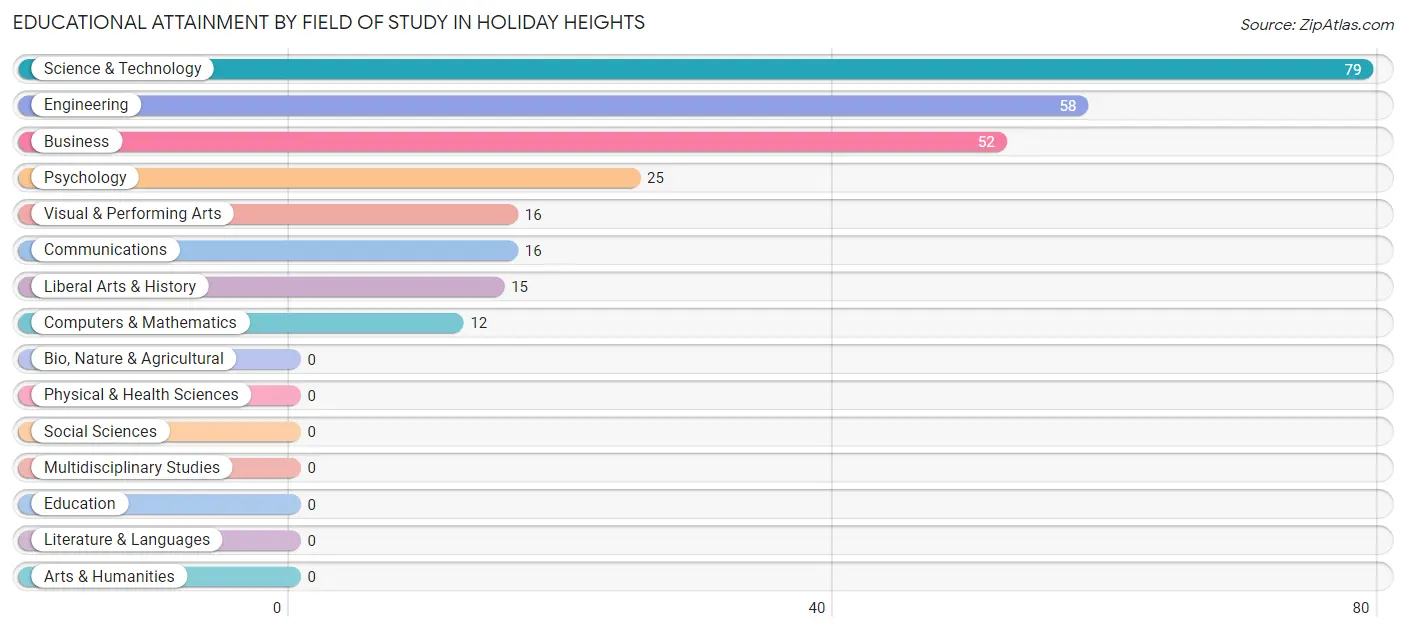
| Field of Study | # Graduates | % Graduates |
| Computers & Mathematics | 12 | 4.4% |
| Bio, Nature & Agricultural | 0 | 0.0% |
| Physical & Health Sciences | 0 | 0.0% |
| Psychology | 25 | 9.2% |
| Social Sciences | 0 | 0.0% |
| Engineering | 58 | 21.2% |
| Multidisciplinary Studies | 0 | 0.0% |
| Science & Technology | 79 | 28.9% |
| Business | 52 | 19.1% |
| Education | 0 | 0.0% |
| Literature & Languages | 0 | 0.0% |
| Liberal Arts & History | 15 | 5.5% |
| Visual & Performing Arts | 16 | 5.9% |
| Communications | 16 | 5.9% |
| Arts & Humanities | 0 | 0.0% |
| Total | 273 | 100.0% |
Transportation & Commute in Holiday Heights
Vehicle Availability by Sex in Holiday Heights
The most prevalent vehicle ownership categories in Holiday Heights are males with 2 vehicles (99, accounting for 55.9%) and females with 2 vehicles (150, making up 35.7%).
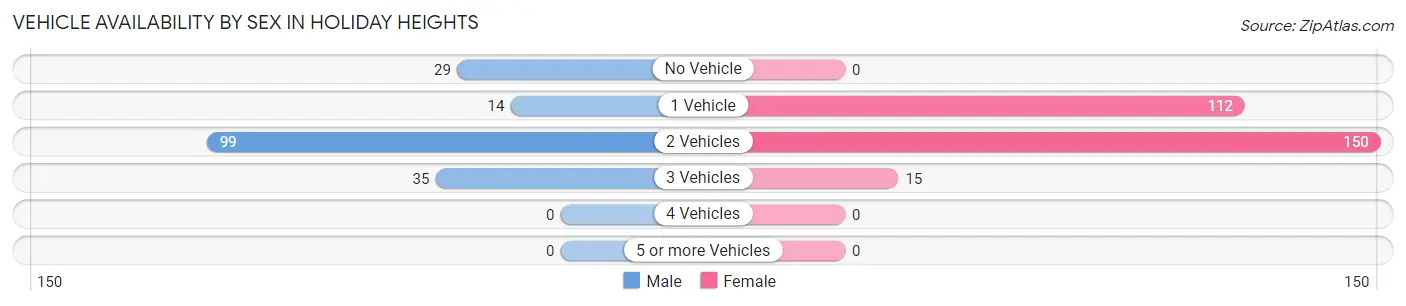
| Vehicles Available | Male | Female |
| No Vehicle | 29 (16.4%) | 0 (0.0%) |
| 1 Vehicle | 14 (7.9%) | 112 (40.4%) |
| 2 Vehicles | 99 (55.9%) | 150 (54.1%) |
| 3 Vehicles | 35 (19.8%) | 15 (5.4%) |
| 4 Vehicles | 0 (0.0%) | 0 (0.0%) |
| 5 or more Vehicles | 0 (0.0%) | 0 (0.0%) |
| Total | 177 (100.0%) | 277 (100.0%) |
Commute Time in Holiday Heights
The most frequently occuring commute durations in Holiday Heights are 5 to 9 minutes (87 commuters, 21.2%), 30 to 34 minutes (57 commuters, 13.9%), and 10 to 14 minutes (46 commuters, 11.2%).
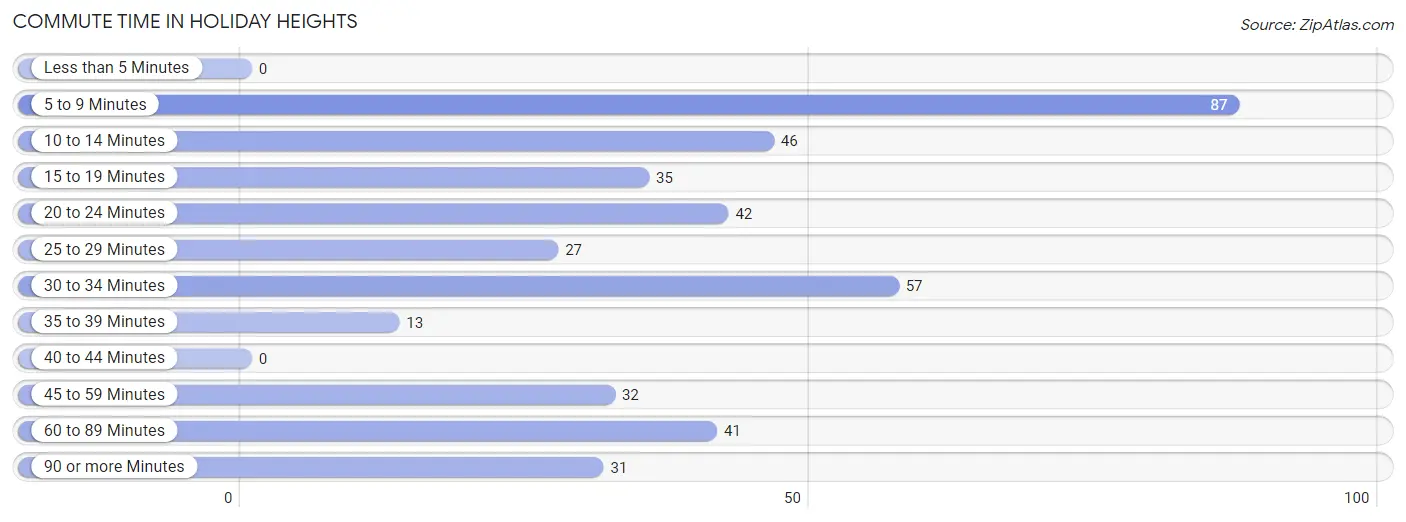
| Commute Time | # Commuters | % Commuters |
| Less than 5 Minutes | 0 | 0.0% |
| 5 to 9 Minutes | 87 | 21.2% |
| 10 to 14 Minutes | 46 | 11.2% |
| 15 to 19 Minutes | 35 | 8.5% |
| 20 to 24 Minutes | 42 | 10.2% |
| 25 to 29 Minutes | 27 | 6.6% |
| 30 to 34 Minutes | 57 | 13.9% |
| 35 to 39 Minutes | 13 | 3.2% |
| 40 to 44 Minutes | 0 | 0.0% |
| 45 to 59 Minutes | 32 | 7.8% |
| 60 to 89 Minutes | 41 | 10.0% |
| 90 or more Minutes | 31 | 7.5% |
Commute Time by Sex in Holiday Heights
The most common commute times in Holiday Heights are 5 to 9 minutes (49 commuters, 27.7%) for males and 20 to 24 minutes (42 commuters, 17.9%) for females.
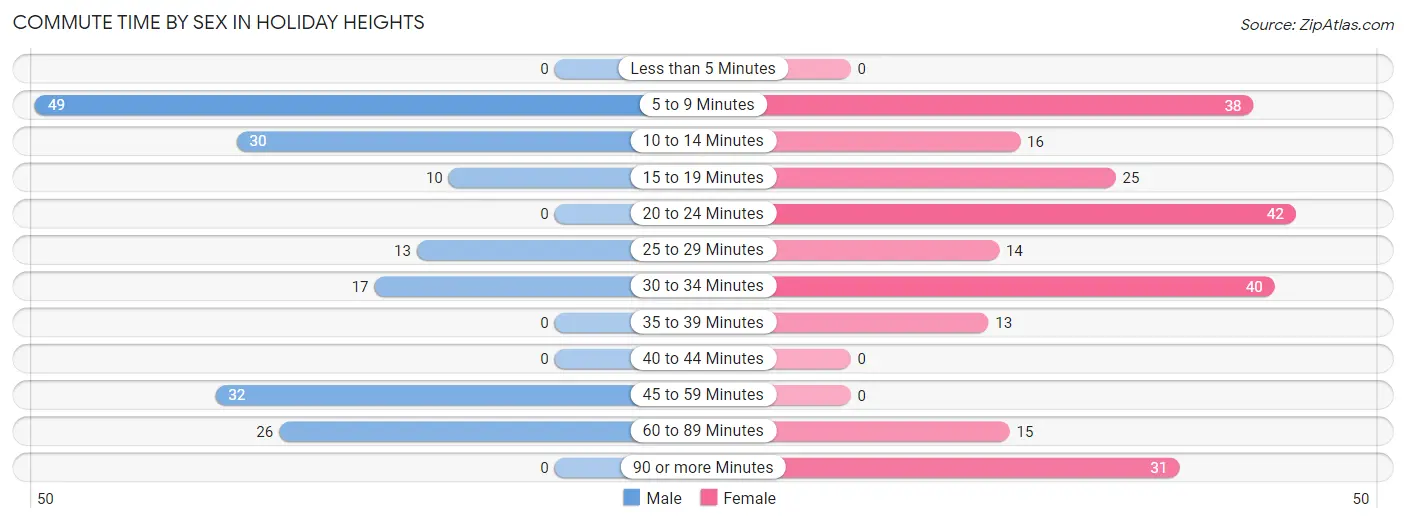
| Commute Time | Male | Female |
| Less than 5 Minutes | 0 (0.0%) | 0 (0.0%) |
| 5 to 9 Minutes | 49 (27.7%) | 38 (16.2%) |
| 10 to 14 Minutes | 30 (17.0%) | 16 (6.8%) |
| 15 to 19 Minutes | 10 (5.7%) | 25 (10.7%) |
| 20 to 24 Minutes | 0 (0.0%) | 42 (17.9%) |
| 25 to 29 Minutes | 13 (7.3%) | 14 (6.0%) |
| 30 to 34 Minutes | 17 (9.6%) | 40 (17.1%) |
| 35 to 39 Minutes | 0 (0.0%) | 13 (5.6%) |
| 40 to 44 Minutes | 0 (0.0%) | 0 (0.0%) |
| 45 to 59 Minutes | 32 (18.1%) | 0 (0.0%) |
| 60 to 89 Minutes | 26 (14.7%) | 15 (6.4%) |
| 90 or more Minutes | 0 (0.0%) | 31 (13.3%) |
Time of Departure to Work by Sex in Holiday Heights
The most frequent times of departure to work in Holiday Heights are 8:00 AM to 8:29 AM (38, 21.5%) for males and 7:00 AM to 7:29 AM (55, 23.5%) for females.
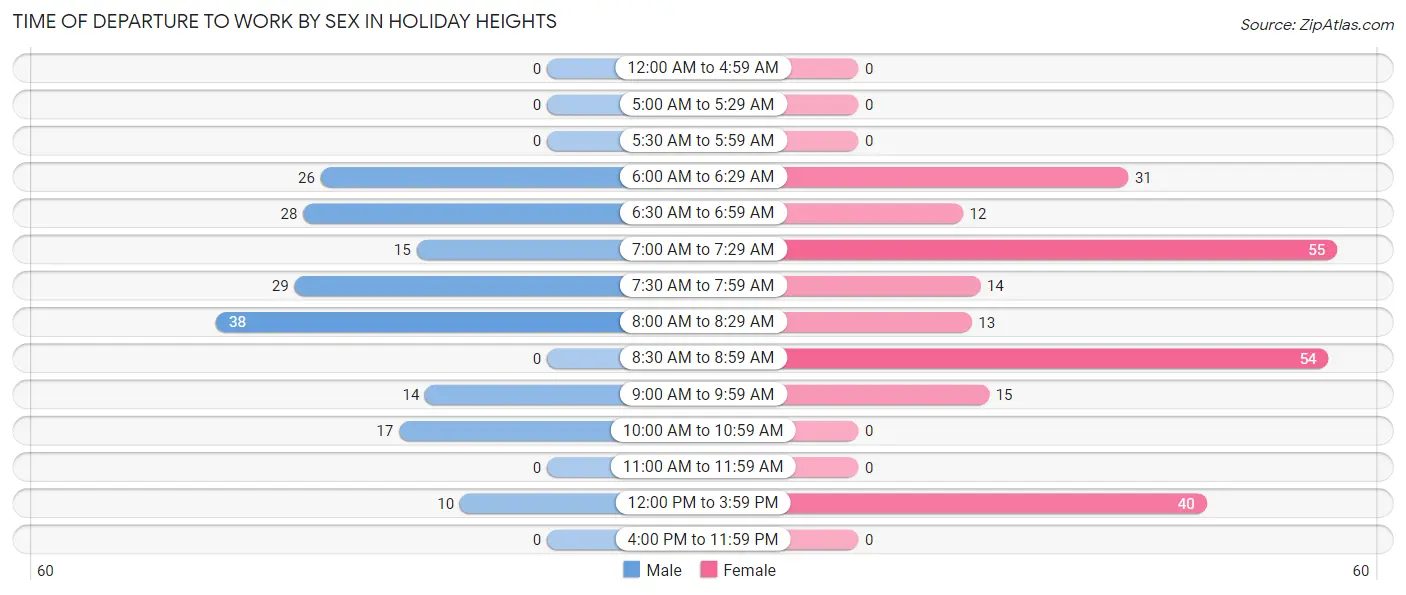
| Time of Departure | Male | Female |
| 12:00 AM to 4:59 AM | 0 (0.0%) | 0 (0.0%) |
| 5:00 AM to 5:29 AM | 0 (0.0%) | 0 (0.0%) |
| 5:30 AM to 5:59 AM | 0 (0.0%) | 0 (0.0%) |
| 6:00 AM to 6:29 AM | 26 (14.7%) | 31 (13.3%) |
| 6:30 AM to 6:59 AM | 28 (15.8%) | 12 (5.1%) |
| 7:00 AM to 7:29 AM | 15 (8.5%) | 55 (23.5%) |
| 7:30 AM to 7:59 AM | 29 (16.4%) | 14 (6.0%) |
| 8:00 AM to 8:29 AM | 38 (21.5%) | 13 (5.6%) |
| 8:30 AM to 8:59 AM | 0 (0.0%) | 54 (23.1%) |
| 9:00 AM to 9:59 AM | 14 (7.9%) | 15 (6.4%) |
| 10:00 AM to 10:59 AM | 17 (9.6%) | 0 (0.0%) |
| 11:00 AM to 11:59 AM | 0 (0.0%) | 0 (0.0%) |
| 12:00 PM to 3:59 PM | 10 (5.7%) | 40 (17.1%) |
| 4:00 PM to 11:59 PM | 0 (0.0%) | 0 (0.0%) |
| Total | 177 (100.0%) | 234 (100.0%) |
Housing Occupancy in Holiday Heights
Occupancy by Ownership in Holiday Heights
Of the total 1,189 dwellings in Holiday Heights, owner-occupied units account for 1,147 (96.5%), while renter-occupied units make up 42 (3.5%).
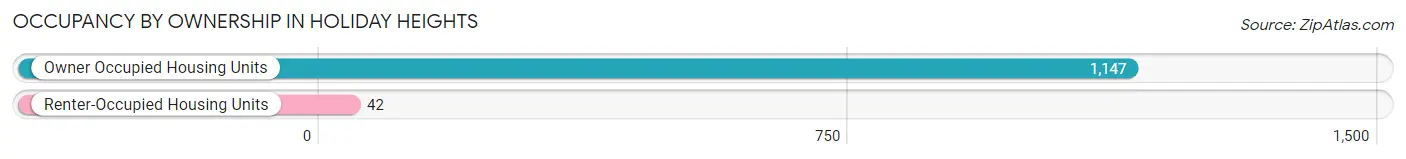
| Occupancy | # Housing Units | % Housing Units |
| Owner Occupied Housing Units | 1,147 | 96.5% |
| Renter-Occupied Housing Units | 42 | 3.5% |
| Total Occupied Housing Units | 1,189 | 100.0% |
Occupancy by Household Size in Holiday Heights
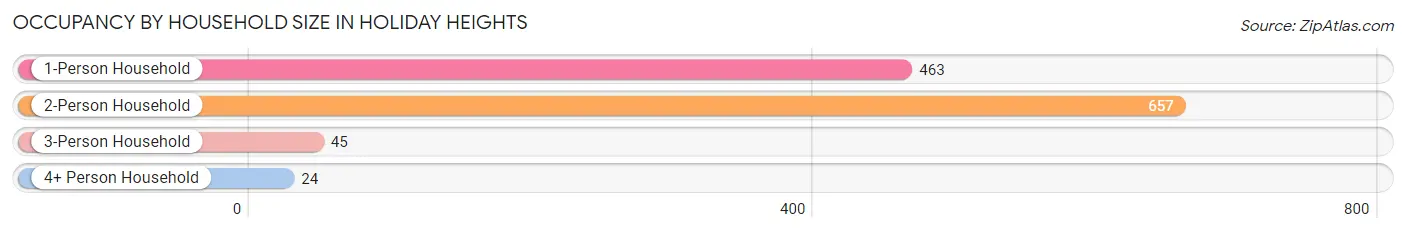
| Household Size | # Housing Units | % Housing Units |
| 1-Person Household | 463 | 38.9% |
| 2-Person Household | 657 | 55.3% |
| 3-Person Household | 45 | 3.8% |
| 4+ Person Household | 24 | 2.0% |
| Total Housing Units | 1,189 | 100.0% |
Occupancy by Ownership by Household Size in Holiday Heights
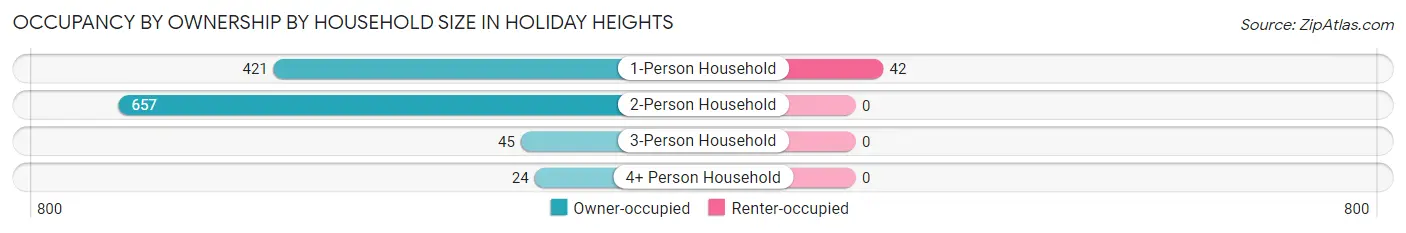
| Household Size | Owner-occupied | Renter-occupied |
| 1-Person Household | 421 (90.9%) | 42 (9.1%) |
| 2-Person Household | 657 (100.0%) | 0 (0.0%) |
| 3-Person Household | 45 (100.0%) | 0 (0.0%) |
| 4+ Person Household | 24 (100.0%) | 0 (0.0%) |
| Total Housing Units | 1,147 (96.5%) | 42 (3.5%) |
Occupancy by Educational Attainment in Holiday Heights
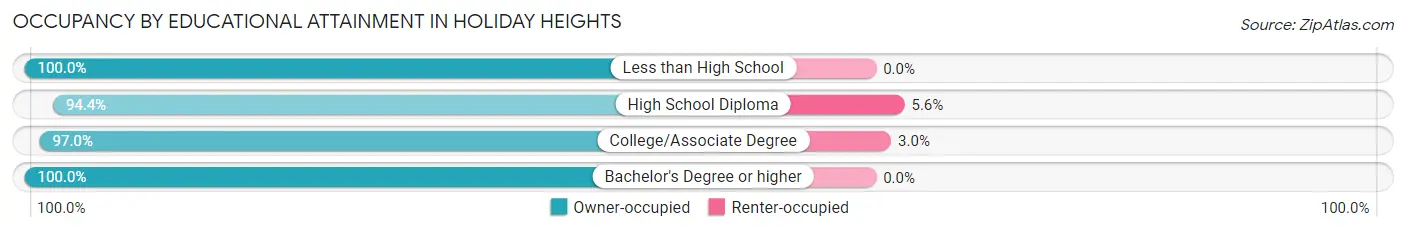
| Household Size | Owner-occupied | Renter-occupied |
| Less than High School | 64 (100.0%) | 0 (0.0%) |
| High School Diploma | 486 (94.4%) | 29 (5.6%) |
| College/Associate Degree | 424 (97.0%) | 13 (3.0%) |
| Bachelor's Degree or higher | 173 (100.0%) | 0 (0.0%) |
Occupancy by Age of Householder in Holiday Heights
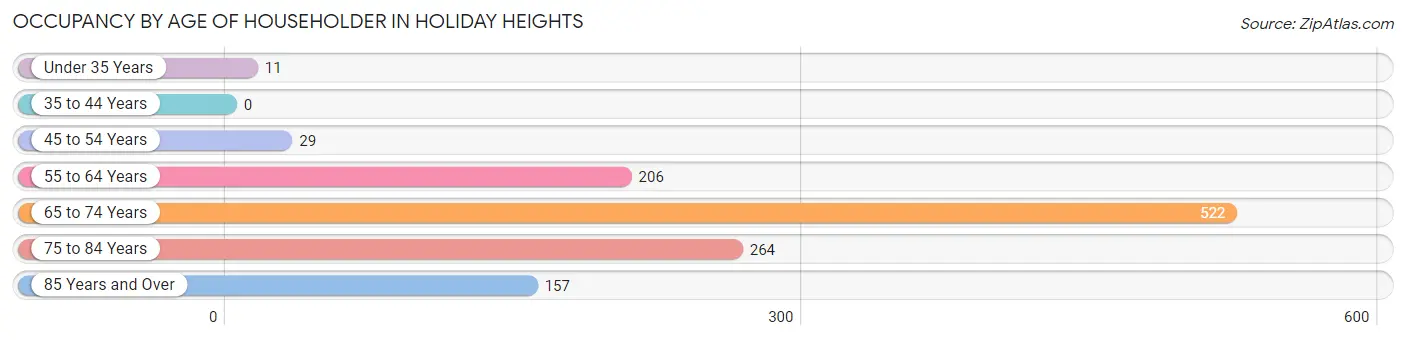
| Age Bracket | # Households | % Households |
| Under 35 Years | 11 | 0.9% |
| 35 to 44 Years | 0 | 0.0% |
| 45 to 54 Years | 29 | 2.4% |
| 55 to 64 Years | 206 | 17.3% |
| 65 to 74 Years | 522 | 43.9% |
| 75 to 84 Years | 264 | 22.2% |
| 85 Years and Over | 157 | 13.2% |
| Total | 1,189 | 100.0% |
Housing Finances in Holiday Heights
Median Income by Occupancy in Holiday Heights
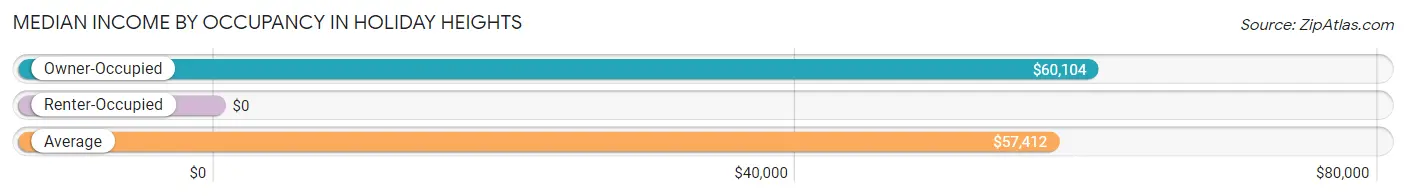
| Occupancy Type | # Households | Median Income |
| Owner-Occupied | 1,147 (96.5%) | $60,104 |
| Renter-Occupied | 42 (3.5%) | $0 |
| Average | 1,189 (100.0%) | $57,412 |
Occupancy by Householder Income Bracket in Holiday Heights
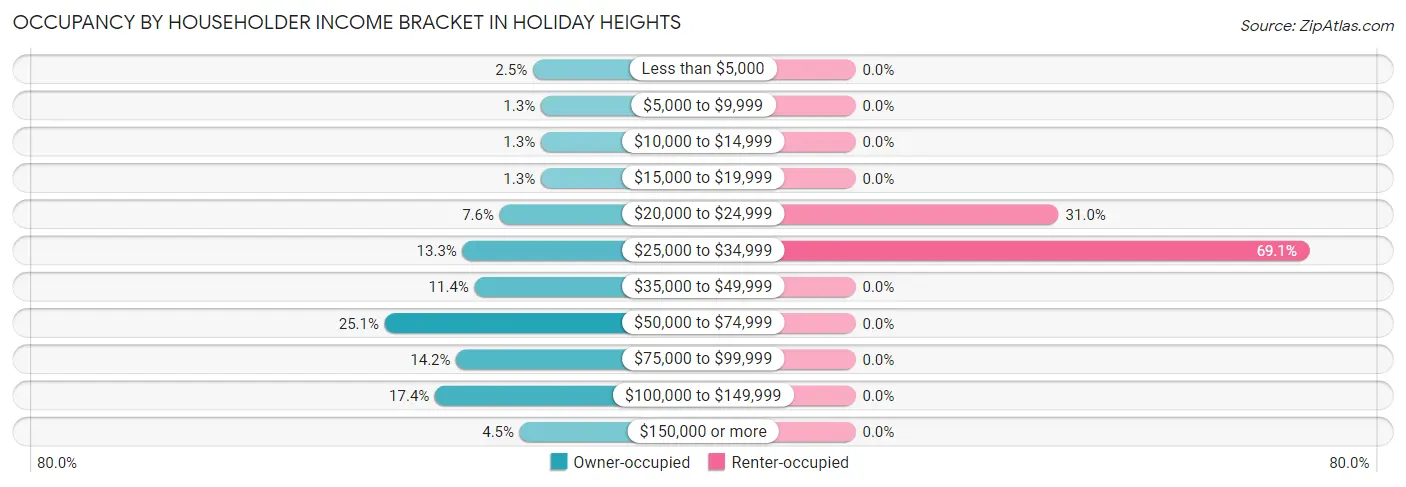
| Income Bracket | Owner-occupied | Renter-occupied |
| Less than $5,000 | 29 (2.5%) | 0 (0.0%) |
| $5,000 to $9,999 | 15 (1.3%) | 0 (0.0%) |
| $10,000 to $14,999 | 15 (1.3%) | 0 (0.0%) |
| $15,000 to $19,999 | 15 (1.3%) | 0 (0.0%) |
| $20,000 to $24,999 | 87 (7.6%) | 13 (30.9%) |
| $25,000 to $34,999 | 152 (13.3%) | 29 (69.1%) |
| $35,000 to $49,999 | 131 (11.4%) | 0 (0.0%) |
| $50,000 to $74,999 | 288 (25.1%) | 0 (0.0%) |
| $75,000 to $99,999 | 163 (14.2%) | 0 (0.0%) |
| $100,000 to $149,999 | 200 (17.4%) | 0 (0.0%) |
| $150,000 or more | 52 (4.5%) | 0 (0.0%) |
| Total | 1,147 (100.0%) | 42 (100.0%) |
Monthly Housing Cost Tiers in Holiday Heights
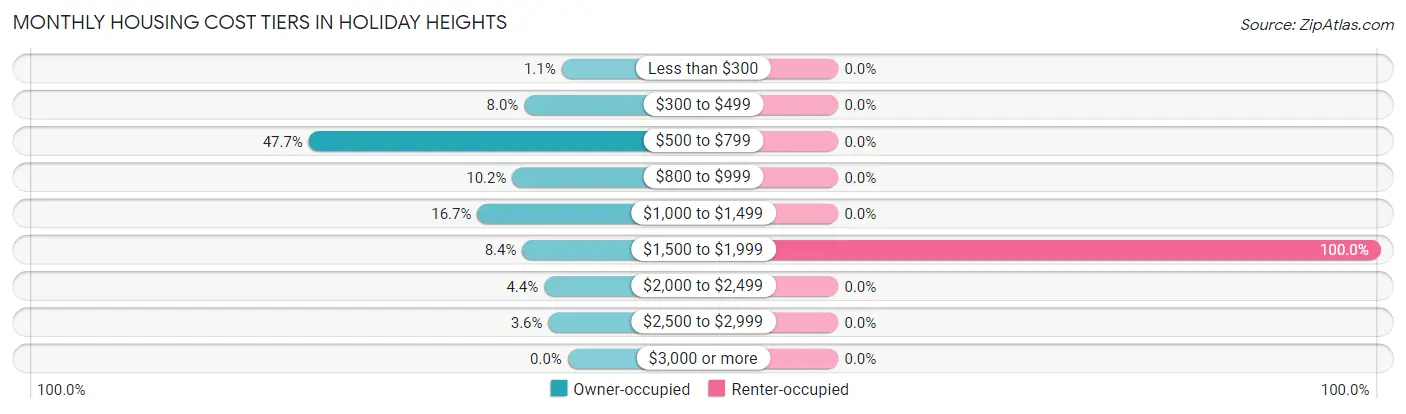
| Monthly Cost | Owner-occupied | Renter-occupied |
| Less than $300 | 13 (1.1%) | 0 (0.0%) |
| $300 to $499 | 92 (8.0%) | 0 (0.0%) |
| $500 to $799 | 547 (47.7%) | 0 (0.0%) |
| $800 to $999 | 117 (10.2%) | 0 (0.0%) |
| $1,000 to $1,499 | 191 (16.7%) | 0 (0.0%) |
| $1,500 to $1,999 | 96 (8.4%) | 42 (100.0%) |
| $2,000 to $2,499 | 50 (4.4%) | 0 (0.0%) |
| $2,500 to $2,999 | 41 (3.6%) | 0 (0.0%) |
| $3,000 or more | 0 (0.0%) | 0 (0.0%) |
| Total | 1,147 (100.0%) | 42 (100.0%) |
Physical Housing Characteristics in Holiday Heights
Housing Structures in Holiday Heights
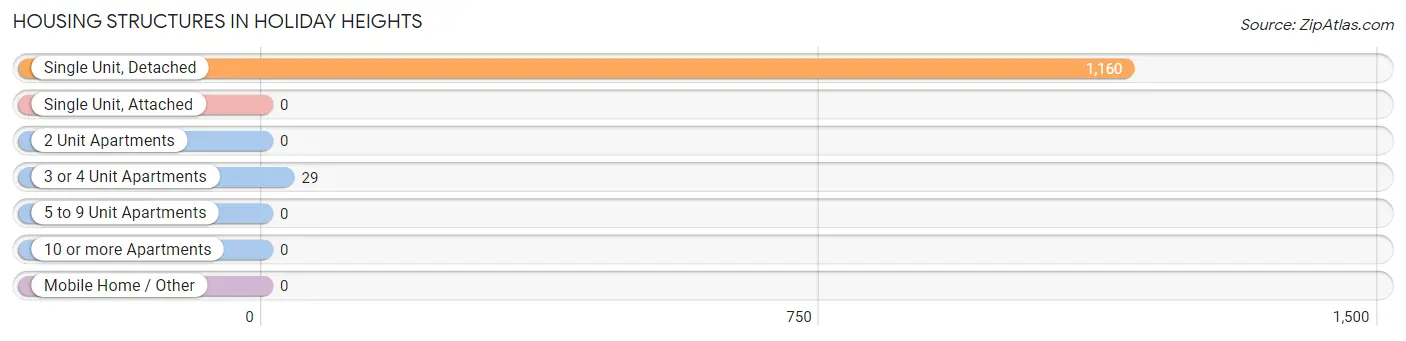
| Structure Type | # Housing Units | % Housing Units |
| Single Unit, Detached | 1,160 | 97.6% |
| Single Unit, Attached | 0 | 0.0% |
| 2 Unit Apartments | 0 | 0.0% |
| 3 or 4 Unit Apartments | 29 | 2.4% |
| 5 to 9 Unit Apartments | 0 | 0.0% |
| 10 or more Apartments | 0 | 0.0% |
| Mobile Home / Other | 0 | 0.0% |
| Total | 1,189 | 100.0% |
Housing Structures by Occupancy in Holiday Heights
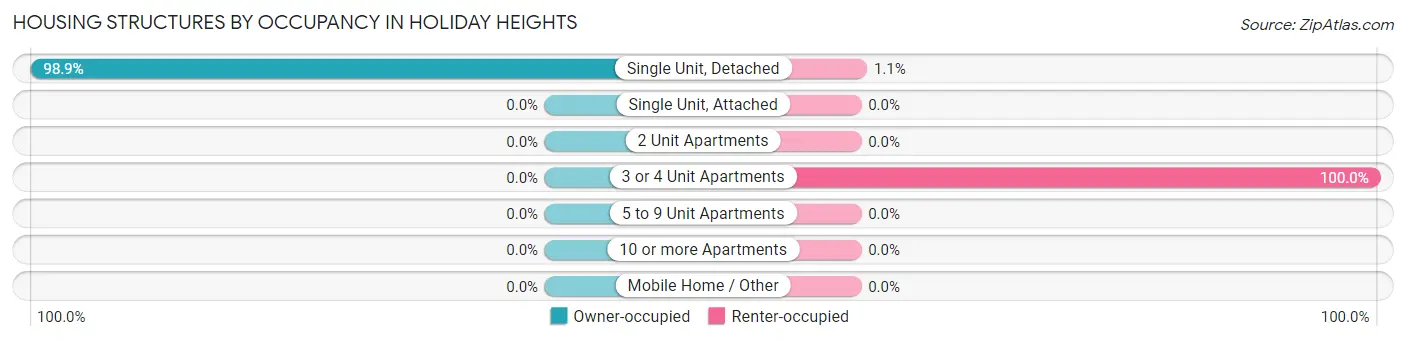
| Structure Type | Owner-occupied | Renter-occupied |
| Single Unit, Detached | 1,147 (98.9%) | 13 (1.1%) |
| Single Unit, Attached | 0 (0.0%) | 0 (0.0%) |
| 2 Unit Apartments | 0 (0.0%) | 0 (0.0%) |
| 3 or 4 Unit Apartments | 0 (0.0%) | 29 (100.0%) |
| 5 to 9 Unit Apartments | 0 (0.0%) | 0 (0.0%) |
| 10 or more Apartments | 0 (0.0%) | 0 (0.0%) |
| Mobile Home / Other | 0 (0.0%) | 0 (0.0%) |
| Total | 1,147 (96.5%) | 42 (3.5%) |
Housing Structures by Number of Rooms in Holiday Heights
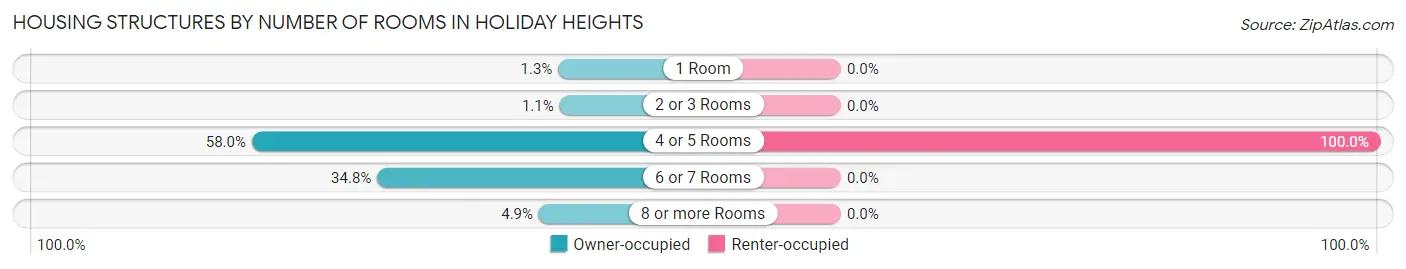
| Number of Rooms | Owner-occupied | Renter-occupied |
| 1 Room | 15 (1.3%) | 0 (0.0%) |
| 2 or 3 Rooms | 12 (1.1%) | 0 (0.0%) |
| 4 or 5 Rooms | 665 (58.0%) | 42 (100.0%) |
| 6 or 7 Rooms | 399 (34.8%) | 0 (0.0%) |
| 8 or more Rooms | 56 (4.9%) | 0 (0.0%) |
| Total | 1,147 (100.0%) | 42 (100.0%) |
Housing Structure by Heating Type in Holiday Heights
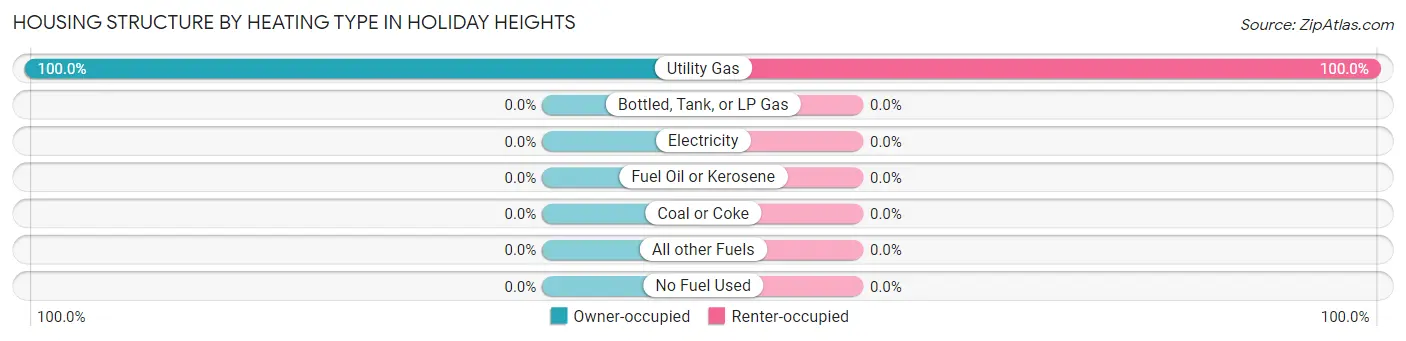
| Heating Type | Owner-occupied | Renter-occupied |
| Utility Gas | 1,147 (100.0%) | 42 (100.0%) |
| Bottled, Tank, or LP Gas | 0 (0.0%) | 0 (0.0%) |
| Electricity | 0 (0.0%) | 0 (0.0%) |
| Fuel Oil or Kerosene | 0 (0.0%) | 0 (0.0%) |
| Coal or Coke | 0 (0.0%) | 0 (0.0%) |
| All other Fuels | 0 (0.0%) | 0 (0.0%) |
| No Fuel Used | 0 (0.0%) | 0 (0.0%) |
| Total | 1,147 (100.0%) | 42 (100.0%) |
Household Vehicle Usage in Holiday Heights
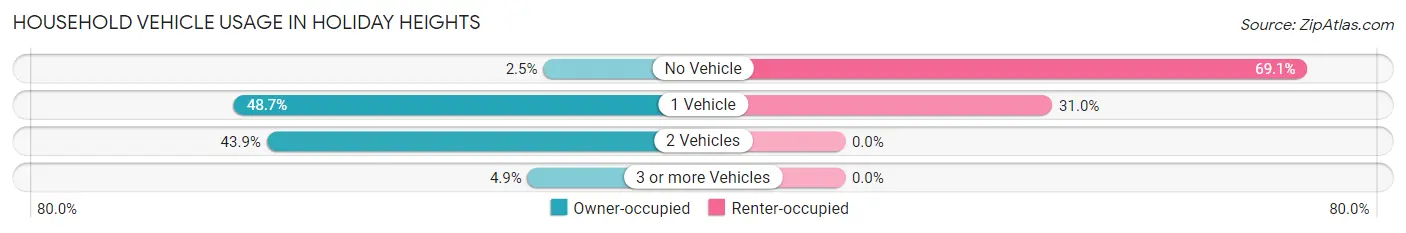
| Vehicles per Household | Owner-occupied | Renter-occupied |
| No Vehicle | 29 (2.5%) | 29 (69.1%) |
| 1 Vehicle | 559 (48.7%) | 13 (30.9%) |
| 2 Vehicles | 503 (43.9%) | 0 (0.0%) |
| 3 or more Vehicles | 56 (4.9%) | 0 (0.0%) |
| Total | 1,147 (100.0%) | 42 (100.0%) |
Real Estate & Mortgages in Holiday Heights
Real Estate and Mortgage Overview in Holiday Heights
| Characteristic | Without Mortgage | With Mortgage |
| Housing Units | 742 | 405 |
| Median Property Value | $302,500 | $306,300 |
| Median Household Income | $55,351 | $26 |
| Monthly Housing Costs | $639 | $0 |
| Real Estate Taxes | $4,342 | $0 |
Property Value by Mortgage Status in Holiday Heights
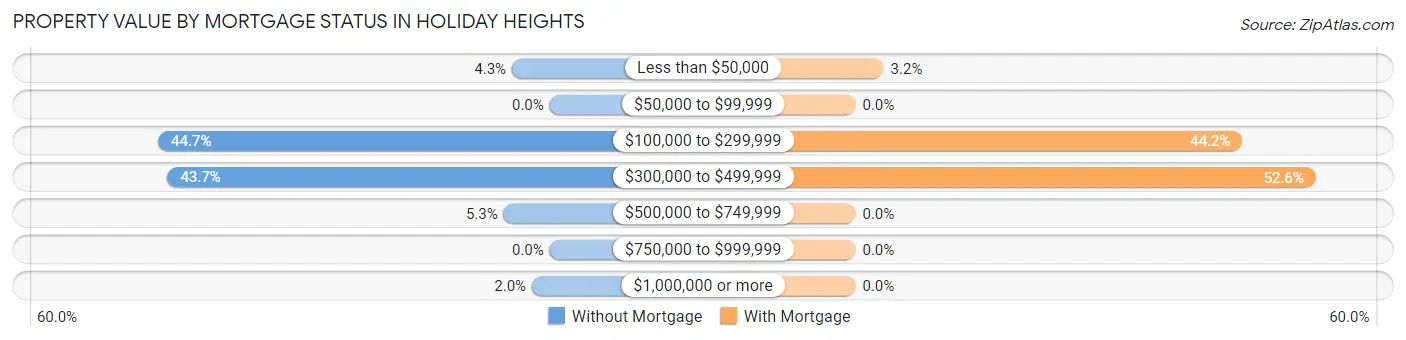
| Property Value | Without Mortgage | With Mortgage |
| Less than $50,000 | 32 (4.3%) | 13 (3.2%) |
| $50,000 to $99,999 | 0 (0.0%) | 0 (0.0%) |
| $100,000 to $299,999 | 332 (44.7%) | 179 (44.2%) |
| $300,000 to $499,999 | 324 (43.7%) | 213 (52.6%) |
| $500,000 to $749,999 | 39 (5.3%) | 0 (0.0%) |
| $750,000 to $999,999 | 0 (0.0%) | 0 (0.0%) |
| $1,000,000 or more | 15 (2.0%) | 0 (0.0%) |
| Total | 742 (100.0%) | 405 (100.0%) |
Household Income by Mortgage Status in Holiday Heights
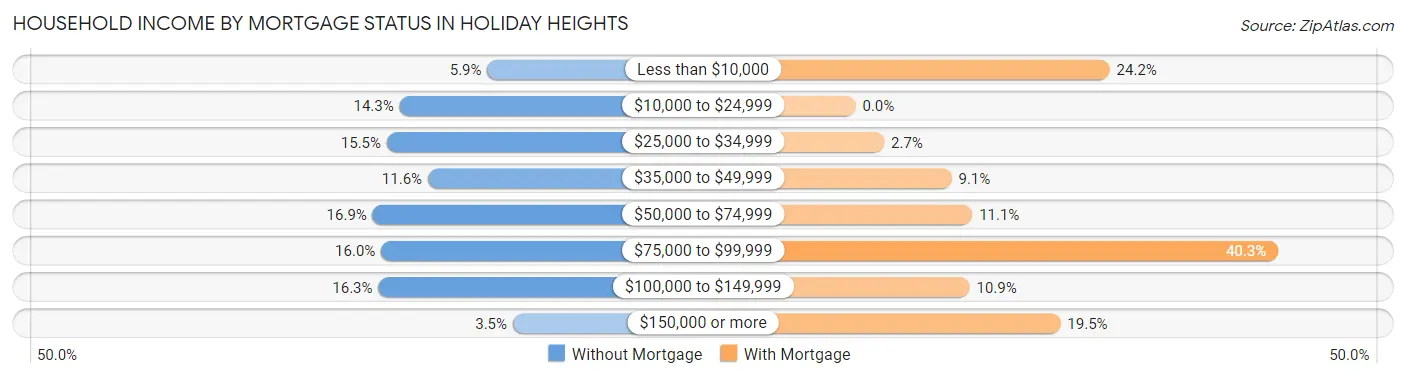
| Household Income | Without Mortgage | With Mortgage |
| Less than $10,000 | 44 (5.9%) | 98 (24.2%) |
| $10,000 to $24,999 | 106 (14.3%) | 0 (0.0%) |
| $25,000 to $34,999 | 115 (15.5%) | 11 (2.7%) |
| $35,000 to $49,999 | 86 (11.6%) | 37 (9.1%) |
| $50,000 to $74,999 | 125 (16.9%) | 45 (11.1%) |
| $75,000 to $99,999 | 119 (16.0%) | 163 (40.3%) |
| $100,000 to $149,999 | 121 (16.3%) | 44 (10.9%) |
| $150,000 or more | 26 (3.5%) | 79 (19.5%) |
| Total | 742 (100.0%) | 405 (100.0%) |
Property Value to Household Income Ratio in Holiday Heights
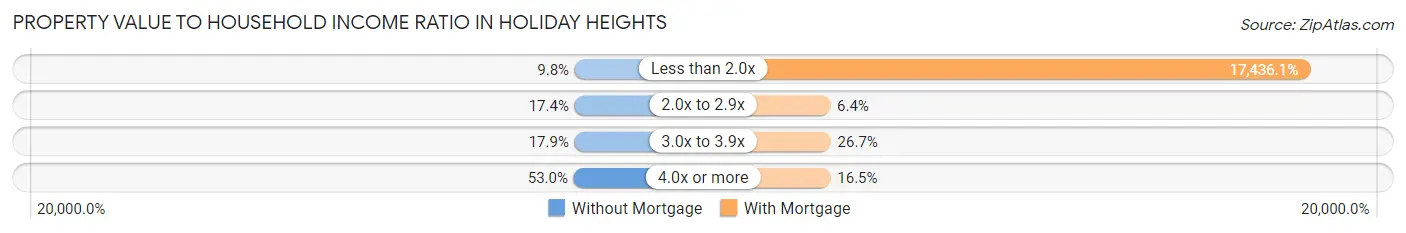
| Value-to-Income Ratio | Without Mortgage | With Mortgage |
| Less than 2.0x | 73 (9.8%) | 70,616 (17,436.1%) |
| 2.0x to 2.9x | 129 (17.4%) | 26 (6.4%) |
| 3.0x to 3.9x | 133 (17.9%) | 108 (26.7%) |
| 4.0x or more | 393 (53.0%) | 67 (16.5%) |
| Total | 742 (100.0%) | 405 (100.0%) |
Real Estate Taxes by Mortgage Status in Holiday Heights
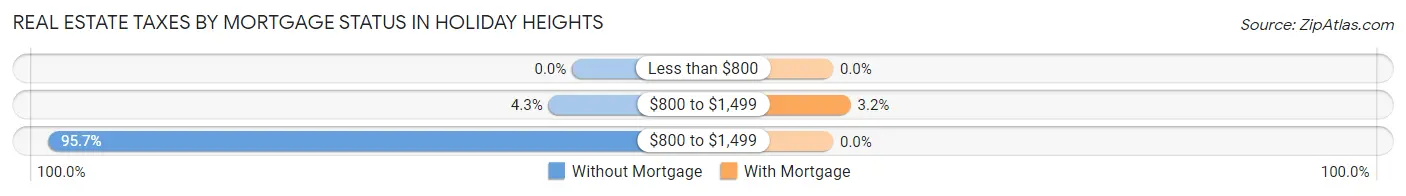
| Property Taxes | Without Mortgage | With Mortgage |
| Less than $800 | 0 (0.0%) | 0 (0.0%) |
| $800 to $1,499 | 32 (4.3%) | 13 (3.2%) |
| $800 to $1,499 | 710 (95.7%) | 0 (0.0%) |
| Total | 742 (100.0%) | 405 (100.0%) |
Health & Disability in Holiday Heights
Health Insurance Coverage by Age in Holiday Heights
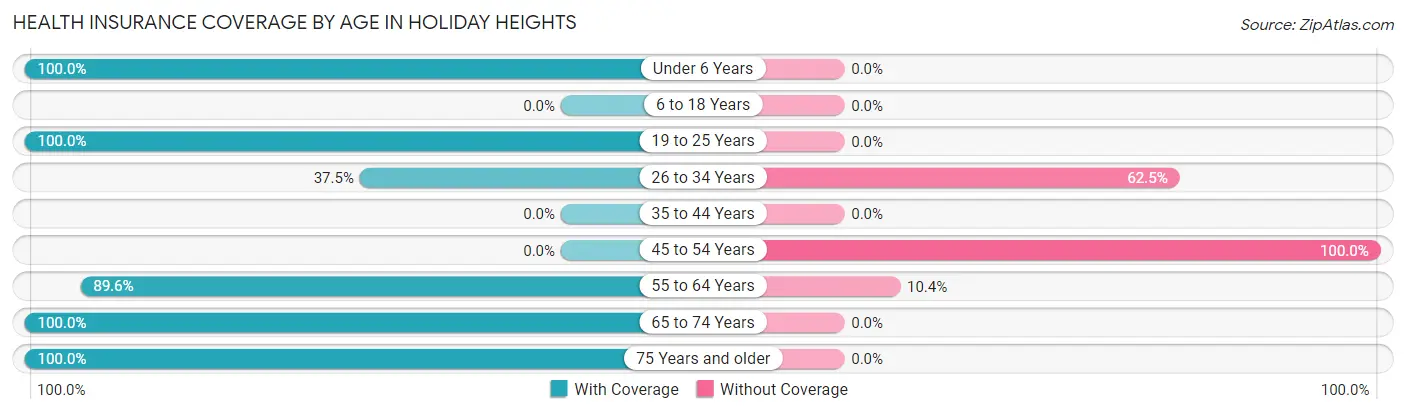
| Age Bracket | With Coverage | Without Coverage |
| Under 6 Years | 15 (100.0%) | 0 (0.0%) |
| 6 to 18 Years | 0 (0.0%) | 0 (0.0%) |
| 19 to 25 Years | 20 (100.0%) | 0 (0.0%) |
| 26 to 34 Years | 21 (37.5%) | 35 (62.5%) |
| 35 to 44 Years | 0 (0.0%) | 0 (0.0%) |
| 45 to 54 Years | 0 (0.0%) | 29 (100.0%) |
| 55 to 64 Years | 345 (89.6%) | 40 (10.4%) |
| 65 to 74 Years | 787 (100.0%) | 0 (0.0%) |
| 75 Years and older | 757 (100.0%) | 0 (0.0%) |
| Total | 1,945 (94.9%) | 104 (5.1%) |
Health Insurance Coverage by Citizenship Status in Holiday Heights
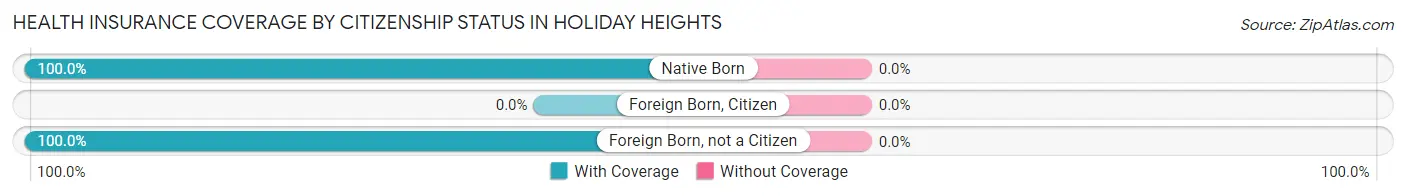
| Citizenship Status | With Coverage | Without Coverage |
| Native Born | 15 (100.0%) | 0 (0.0%) |
| Foreign Born, Citizen | 0 (0.0%) | 0 (0.0%) |
| Foreign Born, not a Citizen | 20 (100.0%) | 0 (0.0%) |
Health Insurance Coverage by Household Income in Holiday Heights
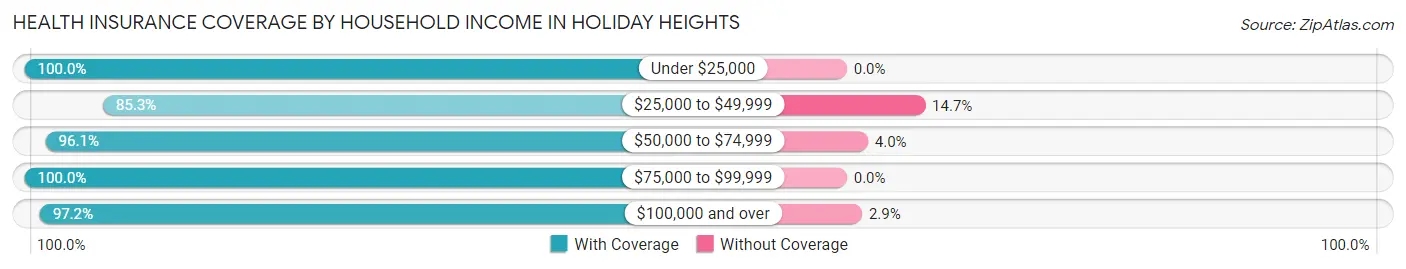
| Household Income | With Coverage | Without Coverage |
| Under $25,000 | 235 (100.0%) | 0 (0.0%) |
| $25,000 to $49,999 | 401 (85.3%) | 69 (14.7%) |
| $50,000 to $74,999 | 438 (96.1%) | 18 (4.0%) |
| $75,000 to $99,999 | 291 (100.0%) | 0 (0.0%) |
| $100,000 and over | 580 (97.2%) | 17 (2.9%) |
Public vs Private Health Insurance Coverage by Age in Holiday Heights
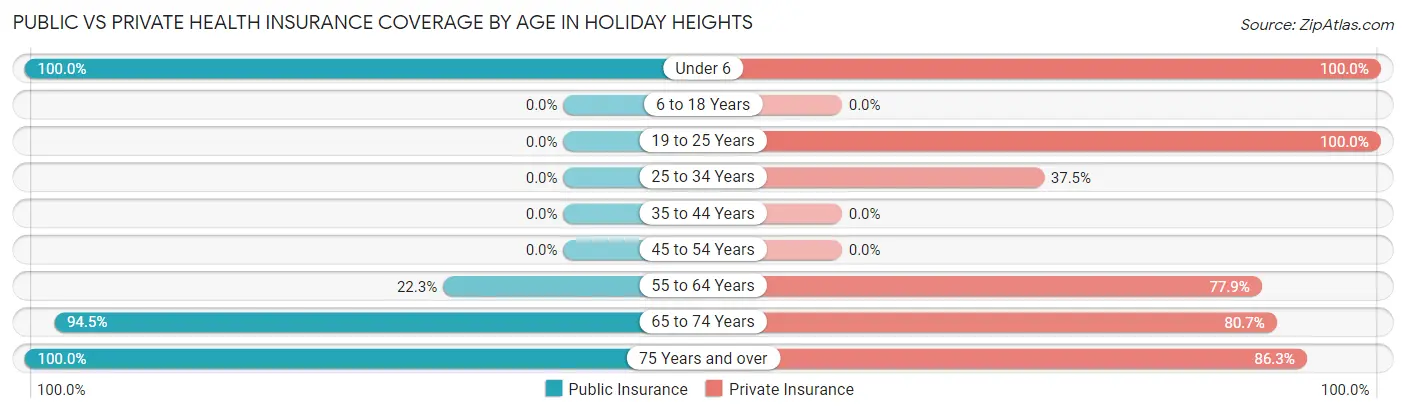
| Age Bracket | Public Insurance | Private Insurance |
| Under 6 | 15 (100.0%) | 15 (100.0%) |
| 6 to 18 Years | 0 (0.0%) | 0 (0.0%) |
| 19 to 25 Years | 0 (0.0%) | 20 (100.0%) |
| 25 to 34 Years | 0 (0.0%) | 21 (37.5%) |
| 35 to 44 Years | 0 (0.0%) | 0 (0.0%) |
| 45 to 54 Years | 0 (0.0%) | 0 (0.0%) |
| 55 to 64 Years | 86 (22.3%) | 300 (77.9%) |
| 65 to 74 Years | 744 (94.5%) | 635 (80.7%) |
| 75 Years and over | 757 (100.0%) | 653 (86.3%) |
| Total | 1,602 (78.2%) | 1,644 (80.2%) |
Disability Status by Sex by Age in Holiday Heights
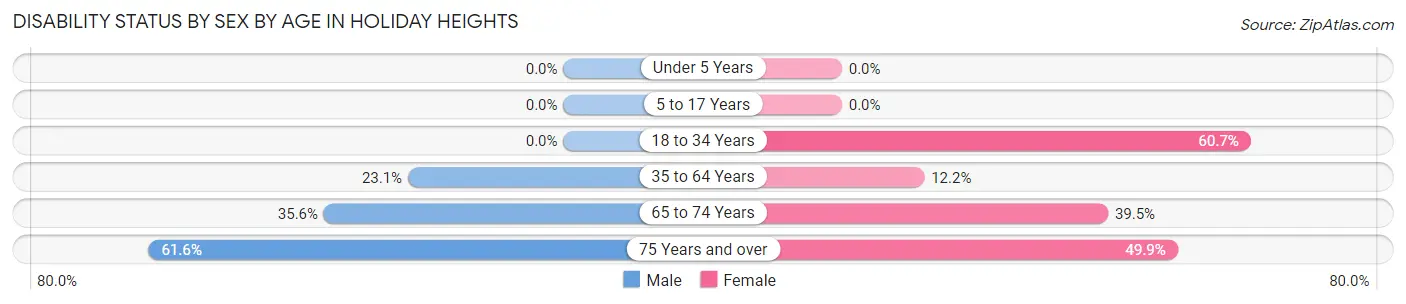
| Age Bracket | Male | Female |
| Under 5 Years | 0 (0.0%) | 0 (0.0%) |
| 5 to 17 Years | 0 (0.0%) | 0 (0.0%) |
| 18 to 34 Years | 0 (0.0%) | 17 (60.7%) |
| 35 to 64 Years | 39 (23.1%) | 30 (12.2%) |
| 65 to 74 Years | 117 (35.6%) | 181 (39.5%) |
| 75 Years and over | 239 (61.6%) | 184 (49.9%) |
Disability Class by Sex by Age in Holiday Heights
Disability Class: Hearing Difficulty
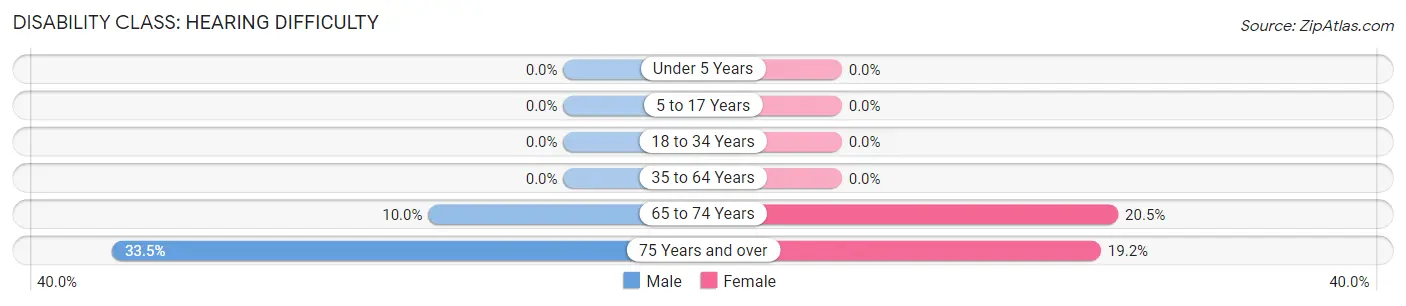
| Age Bracket | Male | Female |
| Under 5 Years | 0 (0.0%) | 0 (0.0%) |
| 5 to 17 Years | 0 (0.0%) | 0 (0.0%) |
| 18 to 34 Years | 0 (0.0%) | 0 (0.0%) |
| 35 to 64 Years | 0 (0.0%) | 0 (0.0%) |
| 65 to 74 Years | 33 (10.0%) | 94 (20.5%) |
| 75 Years and over | 130 (33.5%) | 71 (19.2%) |
Disability Class: Vision Difficulty
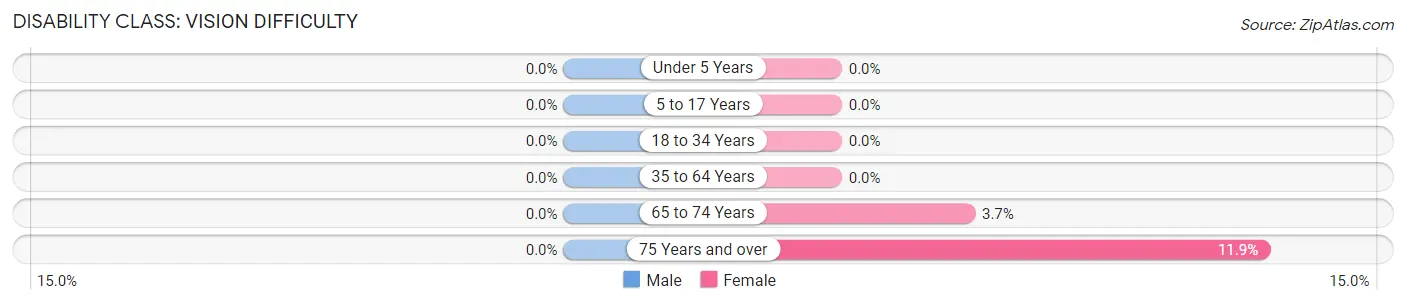
| Age Bracket | Male | Female |
| Under 5 Years | 0 (0.0%) | 0 (0.0%) |
| 5 to 17 Years | 0 (0.0%) | 0 (0.0%) |
| 18 to 34 Years | 0 (0.0%) | 0 (0.0%) |
| 35 to 64 Years | 0 (0.0%) | 0 (0.0%) |
| 65 to 74 Years | 0 (0.0%) | 17 (3.7%) |
| 75 Years and over | 0 (0.0%) | 44 (11.9%) |
Disability Class: Cognitive Difficulty
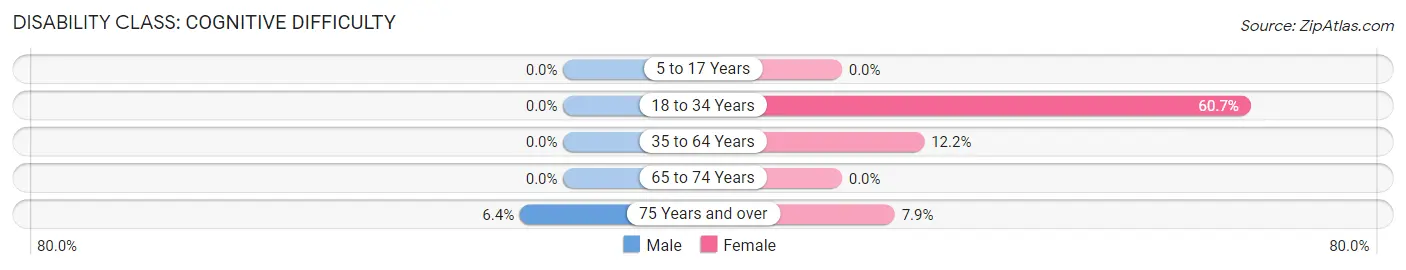
| Age Bracket | Male | Female |
| 5 to 17 Years | 0 (0.0%) | 0 (0.0%) |
| 18 to 34 Years | 0 (0.0%) | 17 (60.7%) |
| 35 to 64 Years | 0 (0.0%) | 30 (12.2%) |
| 65 to 74 Years | 0 (0.0%) | 0 (0.0%) |
| 75 Years and over | 25 (6.4%) | 29 (7.9%) |
Disability Class: Ambulatory Difficulty
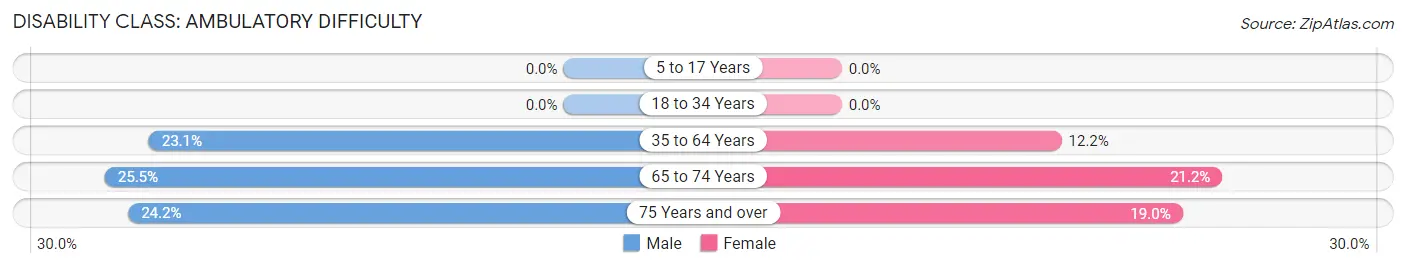
| Age Bracket | Male | Female |
| 5 to 17 Years | 0 (0.0%) | 0 (0.0%) |
| 18 to 34 Years | 0 (0.0%) | 0 (0.0%) |
| 35 to 64 Years | 39 (23.1%) | 30 (12.2%) |
| 65 to 74 Years | 84 (25.5%) | 97 (21.2%) |
| 75 Years and over | 94 (24.2%) | 70 (19.0%) |
Disability Class: Self-Care Difficulty
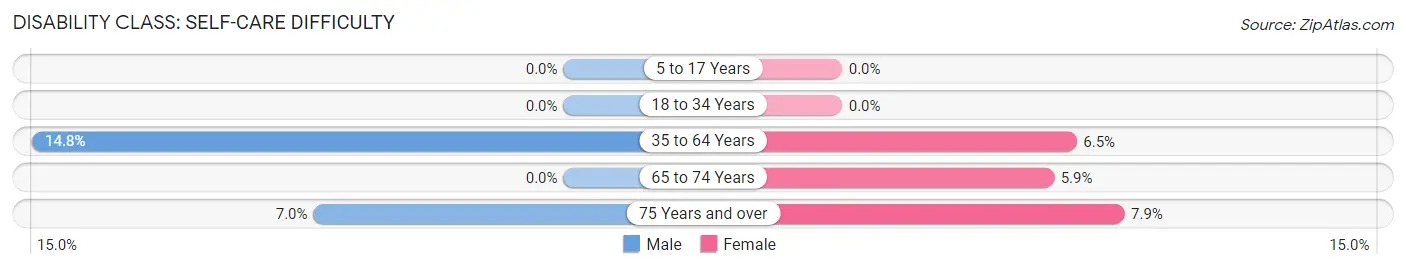
| Age Bracket | Male | Female |
| 5 to 17 Years | 0 (0.0%) | 0 (0.0%) |
| 18 to 34 Years | 0 (0.0%) | 0 (0.0%) |
| 35 to 64 Years | 25 (14.8%) | 16 (6.5%) |
| 65 to 74 Years | 0 (0.0%) | 27 (5.9%) |
| 75 Years and over | 27 (7.0%) | 29 (7.9%) |
Technology Access in Holiday Heights
Computing Device Access in Holiday Heights
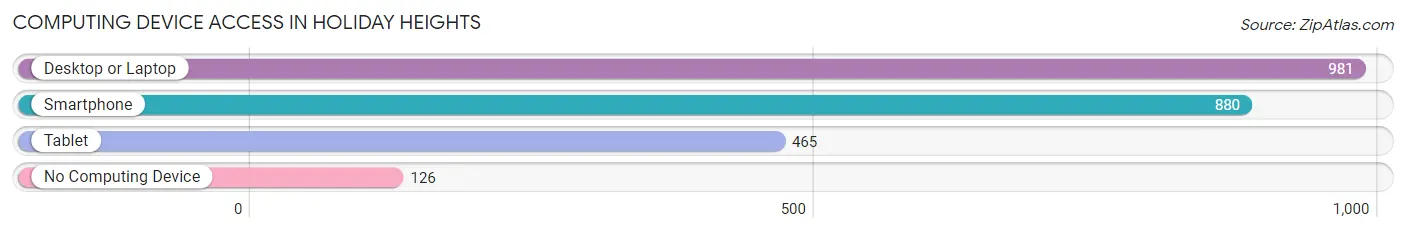
| Device Type | # Households | % Households |
| Desktop or Laptop | 981 | 82.5% |
| Smartphone | 880 | 74.0% |
| Tablet | 465 | 39.1% |
| No Computing Device | 126 | 10.6% |
| Total | 1,189 | 100.0% |
Internet Access in Holiday Heights
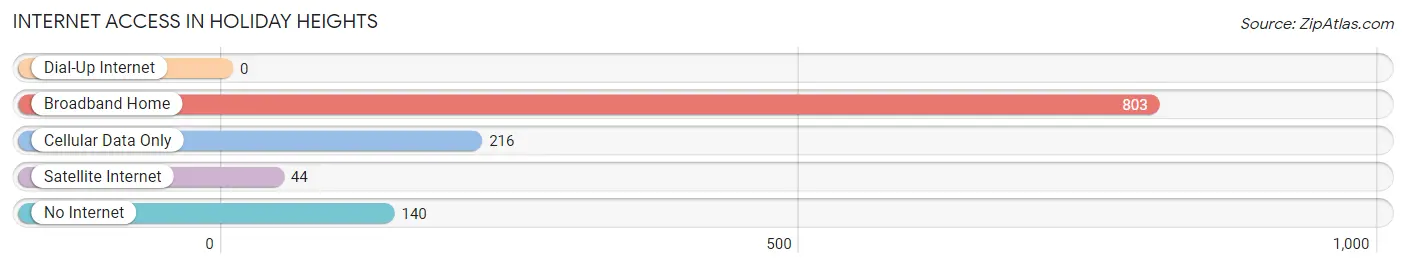
| Internet Type | # Households | % Households |
| Dial-Up Internet | 0 | 0.0% |
| Broadband Home | 803 | 67.5% |
| Cellular Data Only | 216 | 18.2% |
| Satellite Internet | 44 | 3.7% |
| No Internet | 140 | 11.8% |
| Total | 1,189 | 100.0% |
Holiday Heights Summary
Holiday Heights, NJ is a small borough located in Ocean County, New Jersey. It is situated on the Barnegat Peninsula, which is a narrow strip of land that separates Barnegat Bay from the Atlantic Ocean. The borough is bordered by the townships of Barnegat, Stafford, and Lacey. As of the 2010 United States Census, the borough had a population of 1,845.
History
Holiday Heights was originally part of the Township of Dover, which was established in 1767. In 1891, the area was incorporated as the Borough of Dover. In the early 1900s, the area was renamed Holiday Heights, after the Holiday Inn, which was built in the area in the 1920s. The Holiday Inn was a popular destination for vacationers and was the first hotel in the area.
In the 1950s, the area began to experience rapid growth as more people moved to the area. The population of Holiday Heights increased from 1,000 in 1950 to 1,845 in 2010.
Geography
Holiday Heights is located at 39°45'N 74°14'W (39.75, -74.23). It is situated on the Barnegat Peninsula, which is a narrow strip of land that separates Barnegat Bay from the Atlantic Ocean. The borough is bordered by the townships of Barnegat, Stafford, and Lacey.
The borough has a total area of 0.9 square miles, all of which is land. The terrain is mostly flat, with some rolling hills. The highest point in the borough is located at an elevation of 40 feet above sea level.
Economy
The economy of Holiday Heights is largely based on tourism. The borough is home to several popular attractions, including the Holiday Inn, which is a popular destination for vacationers. The borough also has several restaurants, bars, and shops.
The borough also has a small manufacturing sector, which is centered around the production of plastics and rubber products.
Demographics
As of the 2010 United States Census, there were 1,845 people, 745 households, and 486 families residing in the borough. The population density was 2,039.3 people per square mile. The racial makeup of the borough was 94.2% White, 1.7% African American, 0.2% Native American, 1.2% Asian, 0.1% Pacific Islander, 1.2% from other races, and 1.6% from two or more races. Hispanic or Latino of any race were 4.2% of the population.
There were 745 households, out of which 28.2% had children under the age of 18 living with them, 48.2% were married couples living together, 11.2% had a female householder with no husband present, and 35.2% were non-families. 28.2% of all households were made up of individuals, and 11.2% had someone living alone who was 65 years of age or older. The average household size was 2.48 and the average family size was 3.06.
In the borough, the population was spread out, with 22.7% under the age of 18, 7.2% from 18 to 24, 28.2% from 25 to 44, 25.2% from 45 to 64, and 16.7% who were 65 years of age or older. The median age was 39 years. For every 100 females, there were 97.2 males. For every 100 females age 18 and over, there were 94.2 males.
The median income for a household in the borough was $50,000, and the median income for a family was $60,000. Males had a median income of $41,000 versus $30,000 for females. The per capita income for the borough was $25,000. About 4.2% of families and 5.2% of the population were below the poverty line, including 6.2% of those under age 18 and 4.2% of those age 65 or over.
Common Questions
What is Per Capita Income in Holiday Heights?
Per Capita income in Holiday Heights is $41,078.
What is the Median Family Income in Holiday Heights?
Median Family Income in Holiday Heights is $76,167.
What is the Median Household income in Holiday Heights?
Median Household Income in Holiday Heights is $57,412.
What is Income or Wage Gap in Holiday Heights?
Income or Wage Gap in Holiday Heights is 14.2%.
Women in Holiday Heights earn 85.8 cents for every dollar earned by a man.
What is Family Income Deficit in Holiday Heights?
Family Income Deficit in Holiday Heights is $9,804.
Families that are below poverty line in Holiday Heights earn $9,804 less on average than the poverty threshold level.
What is Inequality or Gini Index in Holiday Heights?
Inequality or Gini Index in Holiday Heights is 0.37.
What is the Total Population of Holiday Heights?
Total Population of Holiday Heights is 2,049.
What is the Total Male Population of Holiday Heights?
Total Male Population of Holiday Heights is 949.
What is the Total Female Population of Holiday Heights?
Total Female Population of Holiday Heights is 1,100.
What is the Ratio of Males per 100 Females in Holiday Heights?
There are 86.27 Males per 100 Females in Holiday Heights.
What is the Ratio of Females per 100 Males in Holiday Heights?
There are 115.91 Females per 100 Males in Holiday Heights.
What is the Median Population Age in Holiday Heights?
Median Population Age in Holiday Heights is 71.9 Years.
What is the Average Family Size in Holiday Heights
Average Family Size in Holiday Heights is 2.2 People.
What is the Average Household Size in Holiday Heights
Average Household Size in Holiday Heights is 1.7 People.
How Large is the Labor Force in Holiday Heights?
There are 511 People in the Labor Forcein in Holiday Heights.
What is the Percentage of People in the Labor Force in Holiday Heights?
25.1% of People are in the Labor Force in Holiday Heights.
What is the Unemployment Rate in Holiday Heights?
Unemployment Rate in Holiday Heights is 8.2%.