Deal borough, NJ Map & Demographics
Deal borough Overview
$61,547
PER CAPITA INCOME
$133,636
AVG FAMILY INCOME
$73,380
AVG HOUSEHOLD INCOME
0.64
INEQUALITY / GINI INDEX
645
TOTAL POPULATION
281
MALE POPULATION
364
FEMALE POPULATION
77.20
MALES / 100 FEMALES
129.54
FEMALES / 100 MALES
34.2
MEDIAN AGE
3.4
AVG FAMILY SIZE
2.6
AVG HOUSEHOLD SIZE
287
LABOR FORCE [ PEOPLE ]
53.1%
PERCENT IN LABOR FORCE
5.2%
UNEMPLOYMENT RATE
Income in Deal borough
Income Overview in Deal borough
Per Capita Income in Deal borough is $61,547, while median incomes of families and households are $133,636 and $73,380 respectively.
| Characteristic | Number | Measure |
| Per Capita Income | 645 | $61,547 |
| Median Family Income | 144 | $133,636 |
| Mean Family Income | 144 | $242,919 |
| Median Household Income | 249 | $73,380 |
| Mean Household Income | 249 | $159,280 |
| Income Deficit | 144 | $0 |
| Wage / Income Gap (%) | 645 | 0.00% |
| Wage / Income Gap ($) | 645 | 100.00¢ per $1 |
| Gini / Inequality Index | 645 | 0.64 |
Earnings by Sex in Deal borough
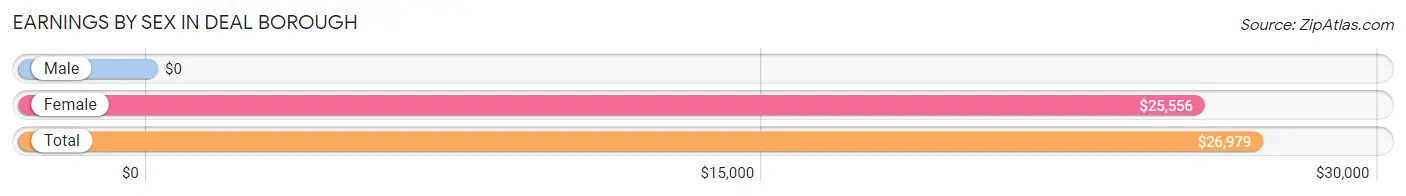
| Sex | Number | Average Earnings |
| Male | 149 (48.2%) | $0 |
| Female | 160 (51.8%) | $25,556 |
| Total | 309 (100.0%) | $26,979 |
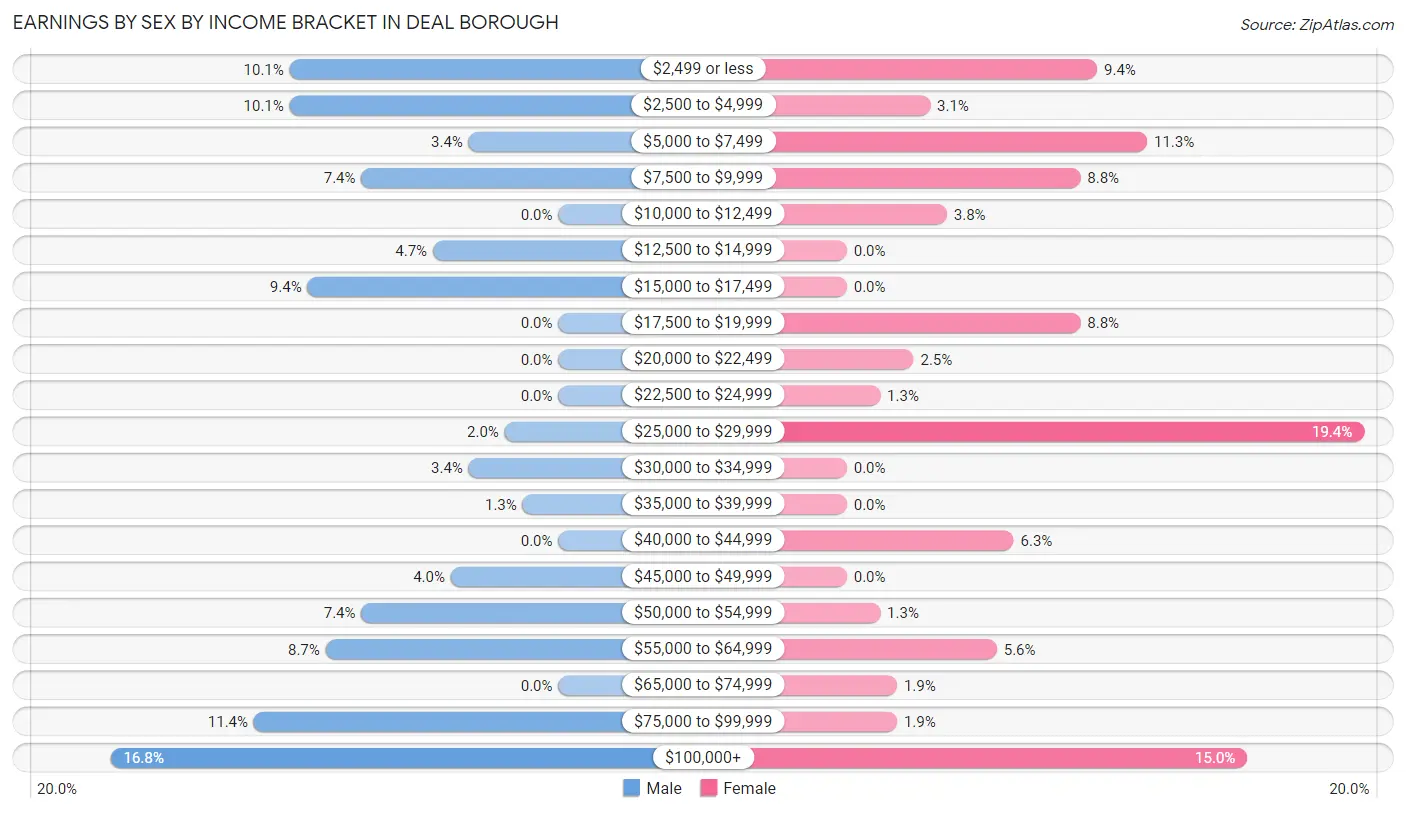
Earnings by Sex by Income Bracket in Deal borough
The most common earnings brackets in Deal borough are $100,000+ for men (25 | 16.8%) and $25,000 to $29,999 for women (31 | 19.4%).
| Income | Male | Female |
| $2,499 or less | 15 (10.1%) | 15 (9.4%) |
| $2,500 to $4,999 | 15 (10.1%) | 5 (3.1%) |
| $5,000 to $7,499 | 5 (3.4%) | 18 (11.3%) |
| $7,500 to $9,999 | 11 (7.4%) | 14 (8.7%) |
| $10,000 to $12,499 | 0 (0.0%) | 6 (3.7%) |
| $12,500 to $14,999 | 7 (4.7%) | 0 (0.0%) |
| $15,000 to $17,499 | 14 (9.4%) | 0 (0.0%) |
| $17,500 to $19,999 | 0 (0.0%) | 14 (8.7%) |
| $20,000 to $22,499 | 0 (0.0%) | 4 (2.5%) |
| $22,500 to $24,999 | 0 (0.0%) | 2 (1.3%) |
| $25,000 to $29,999 | 3 (2.0%) | 31 (19.4%) |
| $30,000 to $34,999 | 5 (3.4%) | 0 (0.0%) |
| $35,000 to $39,999 | 2 (1.3%) | 0 (0.0%) |
| $40,000 to $44,999 | 0 (0.0%) | 10 (6.2%) |
| $45,000 to $49,999 | 6 (4.0%) | 0 (0.0%) |
| $50,000 to $54,999 | 11 (7.4%) | 2 (1.3%) |
| $55,000 to $64,999 | 13 (8.7%) | 9 (5.6%) |
| $65,000 to $74,999 | 0 (0.0%) | 3 (1.9%) |
| $75,000 to $99,999 | 17 (11.4%) | 3 (1.9%) |
| $100,000+ | 25 (16.8%) | 24 (15.0%) |
| Total | 149 (100.0%) | 160 (100.0%) |
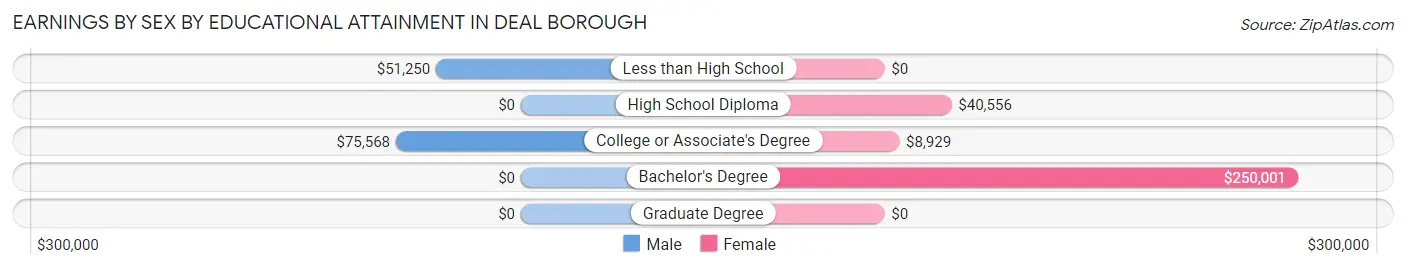
Earnings by Sex by Educational Attainment in Deal borough
Average earnings in Deal borough are $51,364 for men and $40,556 for women, a difference of 21.0%. Men with an educational attainment of college or associate's degree enjoy the highest average annual earnings of $75,568, while those with less than high school education earn the least with $51,250. Women with an educational attainment of bachelor's degree earn the most with the average annual earnings of $250,001, while those with college or associate's degree education have the smallest earnings of $8,929.
| Educational Attainment | Male Income | Female Income |
| Less than High School | $51,250 | $0 |
| High School Diploma | - | - |
| College or Associate's Degree | $75,568 | $8,929 |
| Bachelor's Degree | - | - |
| Graduate Degree | - | - |
| Total | $51,364 | $40,556 |
Family Income in Deal borough
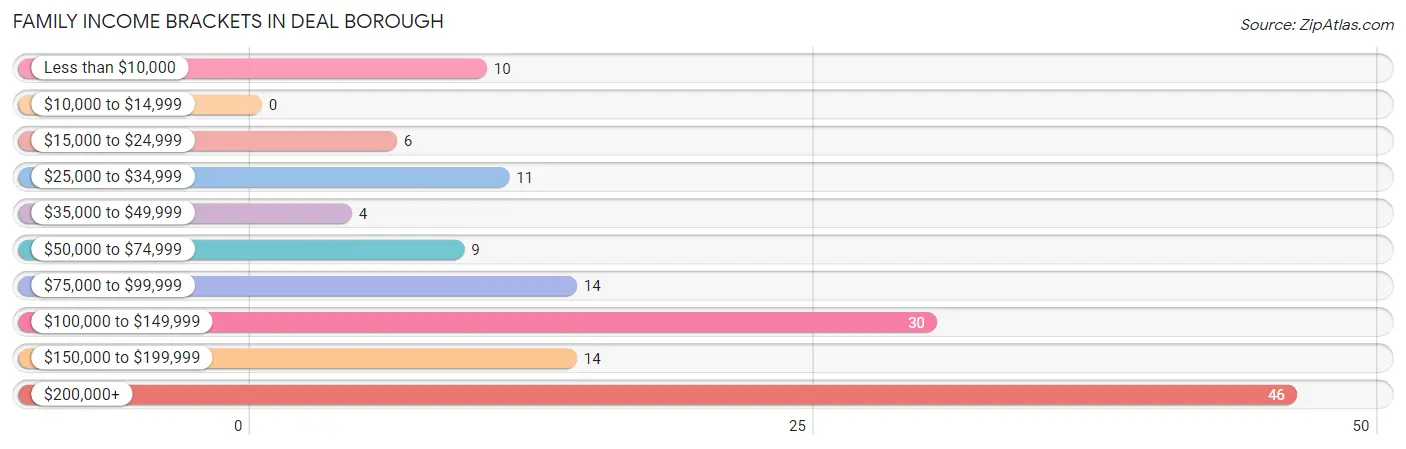
Family Income Brackets in Deal borough
According to the Deal borough family income data, there are 46 families falling into the $200,000+ income range, which is the most common income bracket and makes up 31.9% of all families.
| Income Bracket | # Families | % Families |
| Less than $10,000 | 10 | 6.9% |
| $10,000 to $14,999 | 0 | 0.0% |
| $15,000 to $24,999 | 6 | 4.2% |
| $25,000 to $34,999 | 11 | 7.6% |
| $35,000 to $49,999 | 4 | 2.8% |
| $50,000 to $74,999 | 9 | 6.3% |
| $75,000 to $99,999 | 14 | 9.7% |
| $100,000 to $149,999 | 30 | 20.8% |
| $150,000 to $199,999 | 14 | 9.7% |
| $200,000+ | 46 | 31.9% |
Family Income by Famaliy Size in Deal borough
2-person families (48 | 33.3%) account for the highest median family income in Deal borough with $250,001 per family, while 2-person families (48 | 33.3%) have the highest median income of $125,000 per family member.
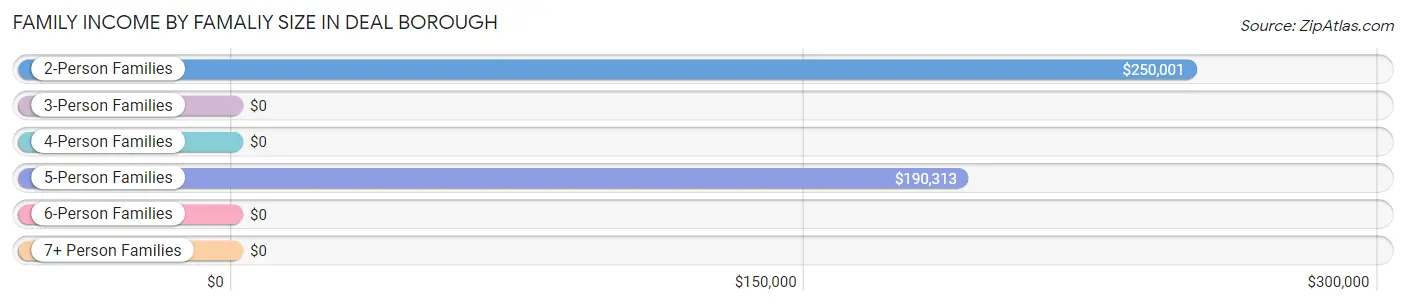
| Income Bracket | # Families | Median Income |
| 2-Person Families | 48 (33.3%) | $250,001 |
| 3-Person Families | 54 (37.5%) | $0 |
| 4-Person Families | 13 (9.0%) | $0 |
| 5-Person Families | 11 (7.6%) | $190,313 |
| 6-Person Families | 7 (4.9%) | $0 |
| 7+ Person Families | 11 (7.6%) | $0 |
| Total | 144 (100.0%) | $133,636 |
Family Income by Number of Earners in Deal borough
The median family income in Deal borough is $133,636, with families comprising 1 earner (54) having the highest median family income of $250,001, while families with no earners (28) have the lowest median family income of $93,125, accounting for 37.5% and 19.4% of families, respectively.
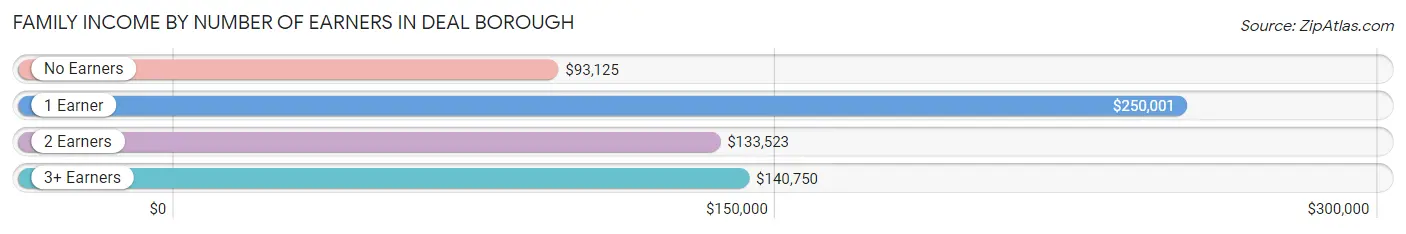
| Number of Earners | # Families | Median Income |
| No Earners | 28 (19.4%) | $93,125 |
| 1 Earner | 54 (37.5%) | $250,001 |
| 2 Earners | 37 (25.7%) | $133,523 |
| 3+ Earners | 25 (17.4%) | $140,750 |
| Total | 144 (100.0%) | $133,636 |
Household Income in Deal borough
Household Income Brackets in Deal borough
With 48 households falling in the category, the $200,000+ income range is the most frequent in Deal borough, accounting for 19.3% of all households. In contrast, only 9 households (3.6%) fall into the $10,000 to $14,999 income bracket, making it the least populous group.
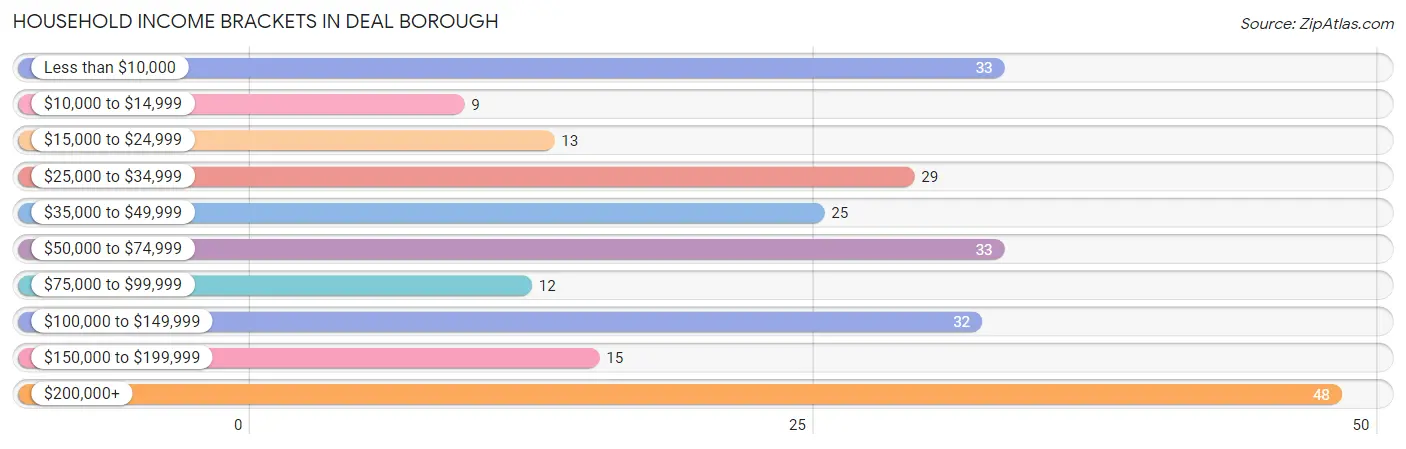
| Income Bracket | # Households | % Households |
| Less than $10,000 | 33 | 13.3% |
| $10,000 to $14,999 | 9 | 3.6% |
| $15,000 to $24,999 | 13 | 5.2% |
| $25,000 to $34,999 | 29 | 11.6% |
| $35,000 to $49,999 | 25 | 10.0% |
| $50,000 to $74,999 | 33 | 13.3% |
| $75,000 to $99,999 | 12 | 4.8% |
| $100,000 to $149,999 | 32 | 12.9% |
| $150,000 to $199,999 | 15 | 6.0% |
| $200,000+ | 48 | 19.3% |
Household Income by Householder Age in Deal borough
The median household income in Deal borough is $73,380, with the highest median household income of $74,306 found in the 65+ years age bracket for the primary householder. A total of 116 households (46.6%) fall into this category. Meanwhile, the 25 to 44 years age bracket for the primary householder has the lowest median household income of $0, with 33 households (13.3%) in this group.
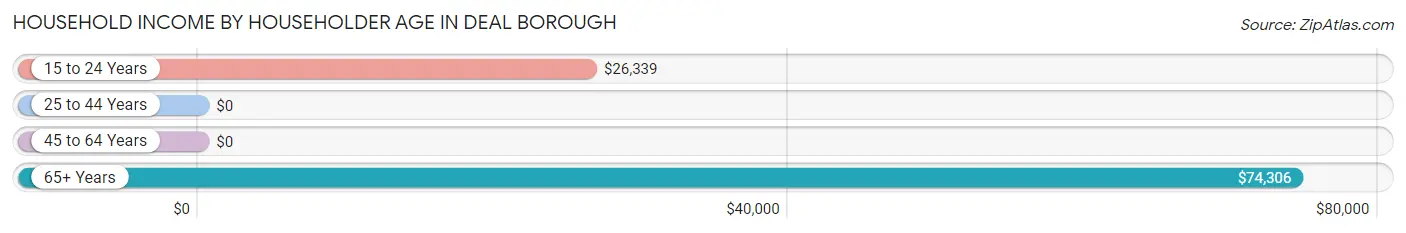
| Income Bracket | # Households | Median Income |
| 15 to 24 Years | 35 (14.1%) | $26,339 |
| 25 to 44 Years | 33 (13.3%) | $0 |
| 45 to 64 Years | 65 (26.1%) | $0 |
| 65+ Years | 116 (46.6%) | $74,306 |
| Total | 249 (100.0%) | $73,380 |
Poverty in Deal borough
Income Below Poverty by Sex and Age in Deal borough
With 11.4% poverty level for males and 20.3% for females among the residents of Deal borough, 55 to 64 year old males and 16 and 17 year old females are the most vulnerable to poverty, with 15 males (45.5%) and 15 females (100.0%) in their respective age groups living below the poverty level.
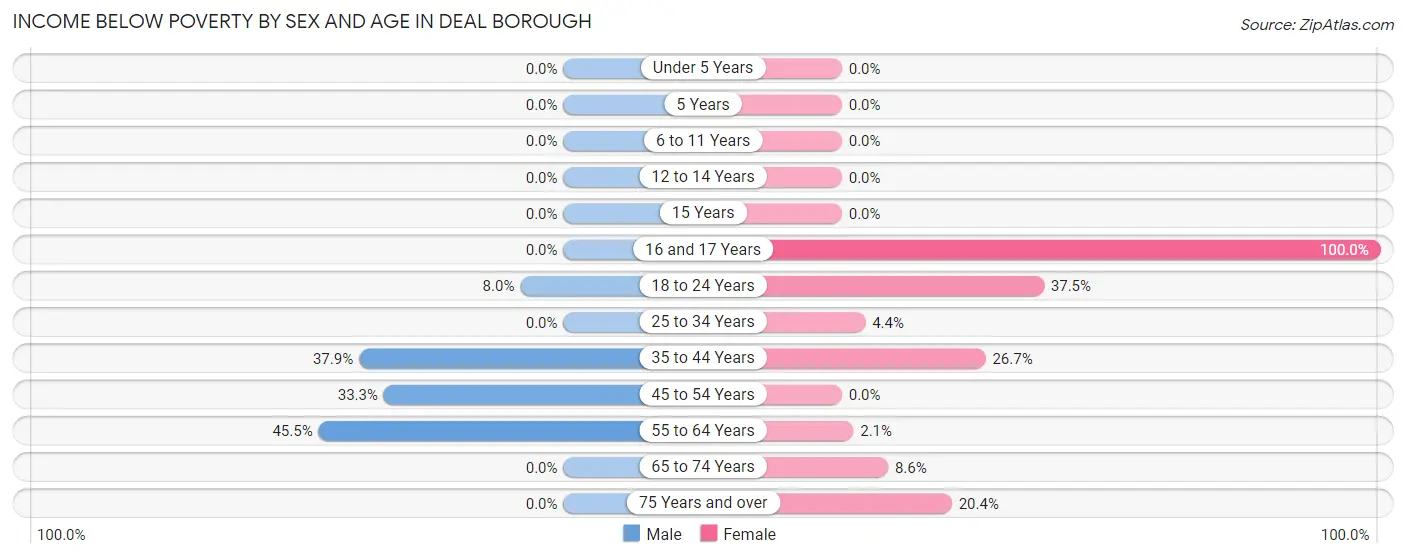
| Age Bracket | Male | Female |
| Under 5 Years | 0 (0.0%) | 0 (0.0%) |
| 5 Years | 0 (0.0%) | 0 (0.0%) |
| 6 to 11 Years | 0 (0.0%) | 0 (0.0%) |
| 12 to 14 Years | 0 (0.0%) | 0 (0.0%) |
| 15 Years | 0 (0.0%) | 0 (0.0%) |
| 16 and 17 Years | 0 (0.0%) | 15 (100.0%) |
| 18 to 24 Years | 4 (8.0%) | 36 (37.5%) |
| 25 to 34 Years | 0 (0.0%) | 1 (4.3%) |
| 35 to 44 Years | 11 (37.9%) | 8 (26.7%) |
| 45 to 54 Years | 2 (33.3%) | 0 (0.0%) |
| 55 to 64 Years | 15 (45.5%) | 1 (2.1%) |
| 65 to 74 Years | 0 (0.0%) | 3 (8.6%) |
| 75 Years and over | 0 (0.0%) | 10 (20.4%) |
| Total | 32 (11.4%) | 74 (20.3%) |
Income Above Poverty by Sex and Age in Deal borough
According to the poverty statistics in Deal borough, males aged under 5 years and females aged under 5 years are the age groups that are most secure financially, with 100.0% of males and 100.0% of females in these age groups living above the poverty line.
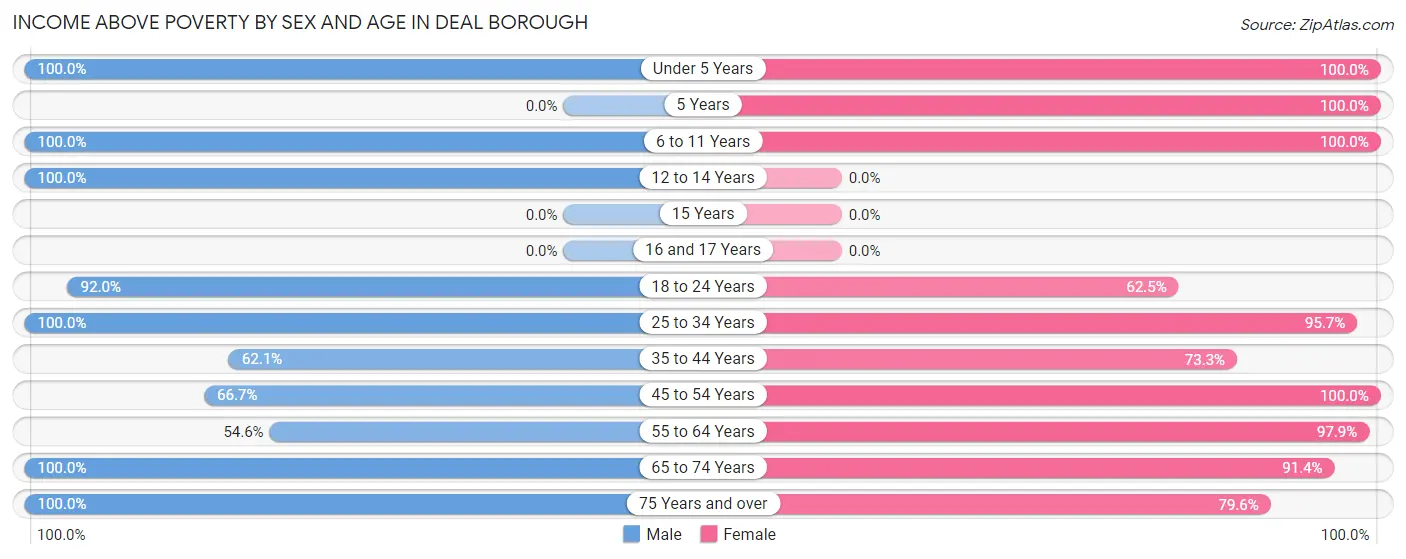
| Age Bracket | Male | Female |
| Under 5 Years | 21 (100.0%) | 2 (100.0%) |
| 5 Years | 0 (0.0%) | 14 (100.0%) |
| 6 to 11 Years | 22 (100.0%) | 31 (100.0%) |
| 12 to 14 Years | 15 (100.0%) | 0 (0.0%) |
| 15 Years | 0 (0.0%) | 0 (0.0%) |
| 16 and 17 Years | 0 (0.0%) | 0 (0.0%) |
| 18 to 24 Years | 46 (92.0%) | 60 (62.5%) |
| 25 to 34 Years | 36 (100.0%) | 22 (95.7%) |
| 35 to 44 Years | 18 (62.1%) | 22 (73.3%) |
| 45 to 54 Years | 4 (66.7%) | 22 (100.0%) |
| 55 to 64 Years | 18 (54.5%) | 46 (97.9%) |
| 65 to 74 Years | 39 (100.0%) | 32 (91.4%) |
| 75 Years and over | 30 (100.0%) | 39 (79.6%) |
| Total | 249 (88.6%) | 290 (79.7%) |
Income Below Poverty Among Married-Couple Families in Deal borough
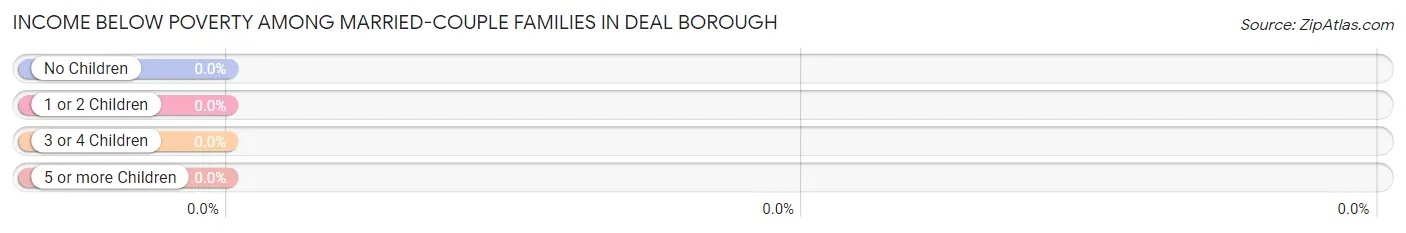
| Children | Above Poverty | Below Poverty |
| No Children | 50 (100.0%) | 0 (0.0%) |
| 1 or 2 Children | 13 (100.0%) | 0 (0.0%) |
| 3 or 4 Children | 7 (100.0%) | 0 (0.0%) |
| 5 or more Children | 0 (0.0%) | 0 (0.0%) |
| Total | 70 (100.0%) | 0 (0.0%) |
Income Below Poverty Among Single-Parent Households in Deal borough
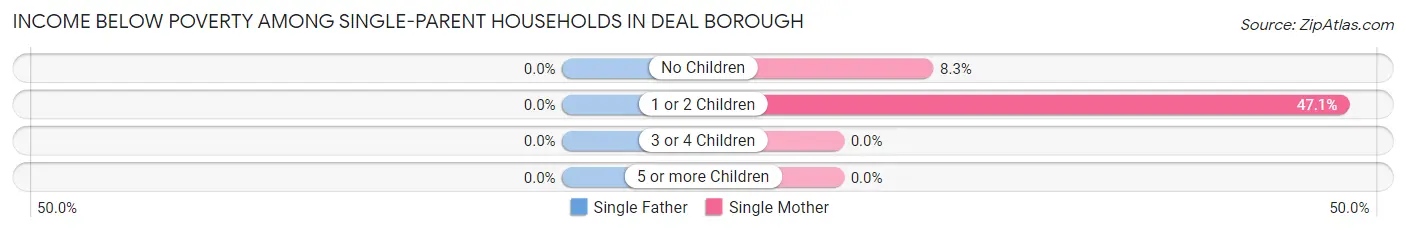
| Children | Single Father | Single Mother |
| No Children | 0 (0.0%) | 2 (8.3%) |
| 1 or 2 Children | 0 (0.0%) | 8 (47.1%) |
| 3 or 4 Children | 0 (0.0%) | 0 (0.0%) |
| 5 or more Children | 0 (0.0%) | 0 (0.0%) |
| Total | 0 (0.0%) | 10 (19.2%) |
Income Below Poverty Among Married-Couple vs Single-Parent Households in Deal borough
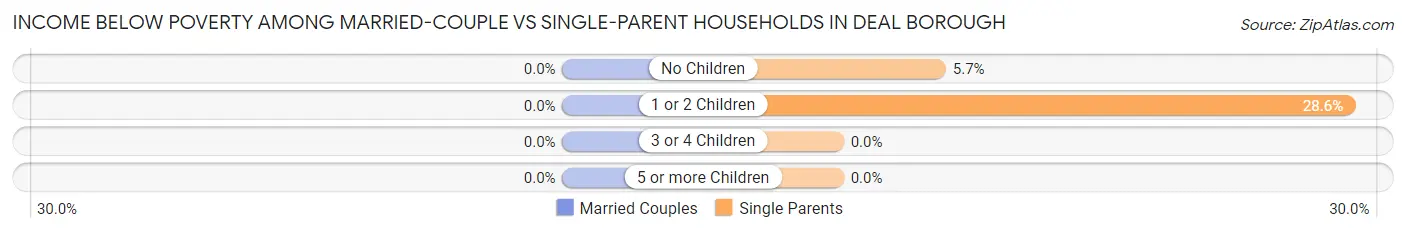
| Children | Married-Couple Families | Single-Parent Households |
| No Children | 0 (0.0%) | 2 (5.7%) |
| 1 or 2 Children | 0 (0.0%) | 8 (28.6%) |
| 3 or 4 Children | 0 (0.0%) | 0 (0.0%) |
| 5 or more Children | 0 (0.0%) | 0 (0.0%) |
| Total | 0 (0.0%) | 10 (13.5%) |
Race in Deal borough
The most populous races in Deal borough are White / Caucasian (506 | 78.4%), Hispanic or Latino (148 | 23.0%), and Some other Race (74 | 11.5%).
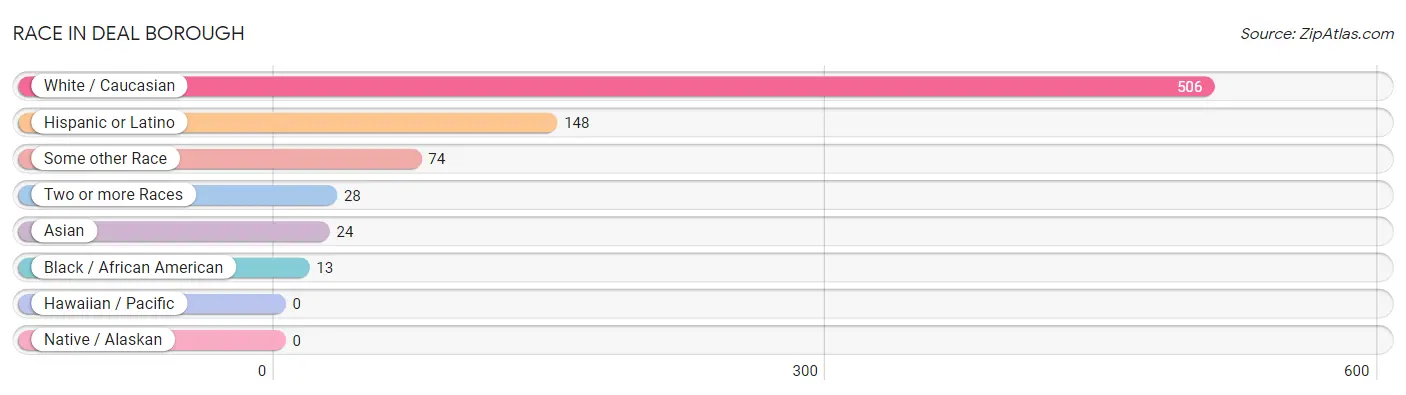
| Race | # Population | % Population |
| Asian | 24 | 3.7% |
| Black / African American | 13 | 2.0% |
| Hawaiian / Pacific | 0 | 0.0% |
| Hispanic or Latino | 148 | 23.0% |
| Native / Alaskan | 0 | 0.0% |
| White / Caucasian | 506 | 78.4% |
| Two or more Races | 28 | 4.3% |
| Some other Race | 74 | 11.5% |
| Total | 645 | 100.0% |
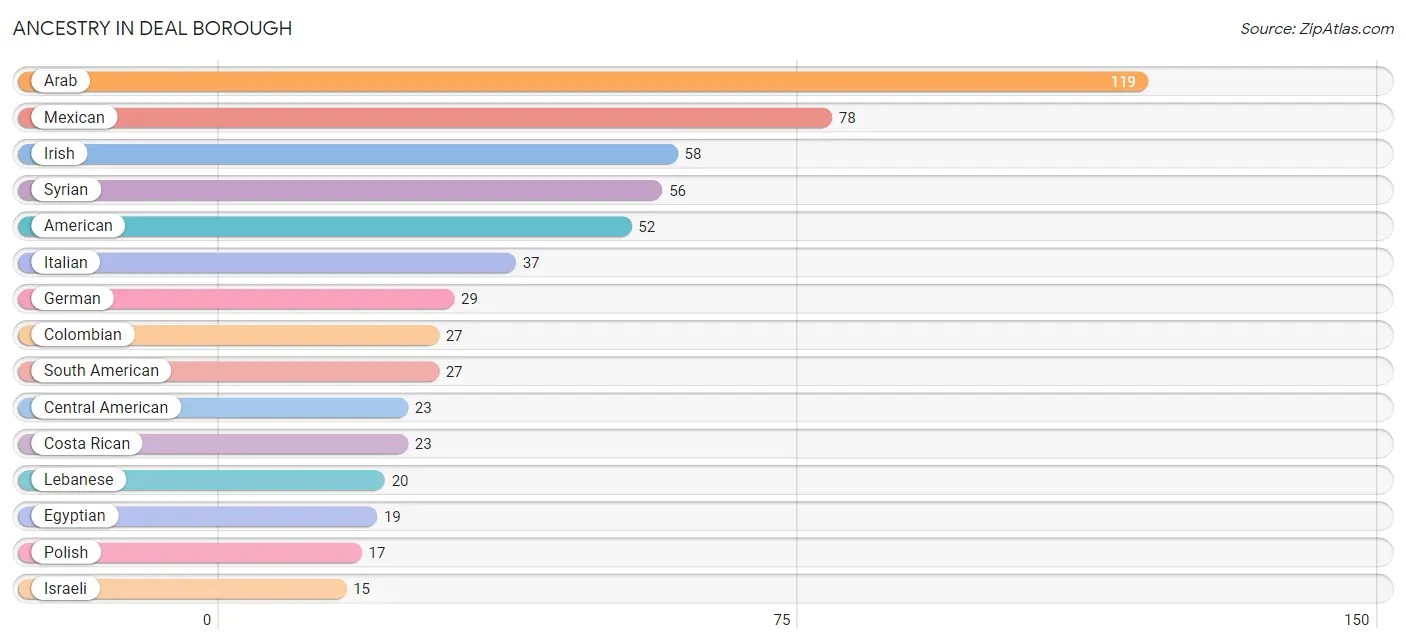
Ancestry in Deal borough
The most populous ancestries reported in Deal borough are Arab (119 | 18.4%), Mexican (78 | 12.1%), Irish (58 | 9.0%), Syrian (56 | 8.7%), and American (52 | 8.1%), together accounting for 56.3% of all Deal borough residents.
| Ancestry | # Population | % Population |
| American | 52 | 8.1% |
| Arab | 119 | 18.4% |
| Central American | 23 | 3.6% |
| Colombian | 27 | 4.2% |
| Costa Rican | 23 | 3.6% |
| Danish | 3 | 0.5% |
| Dutch | 4 | 0.6% |
| Egyptian | 19 | 2.9% |
| English | 2 | 0.3% |
| French | 9 | 1.4% |
| German | 29 | 4.5% |
| Ghanaian | 2 | 0.3% |
| Haitian | 1 | 0.2% |
| Hungarian | 12 | 1.9% |
| Irish | 58 | 9.0% |
| Israeli | 15 | 2.3% |
| Italian | 37 | 5.7% |
| Lebanese | 20 | 3.1% |
| Mexican | 78 | 12.1% |
| Moroccan | 2 | 0.3% |
| Pakistani | 1 | 0.2% |
| Polish | 17 | 2.6% |
| Portuguese | 1 | 0.2% |
| Puerto Rican | 14 | 2.2% |
| Russian | 7 | 1.1% |
| South American | 27 | 4.2% |
| Spaniard | 4 | 0.6% |
| Subsaharan African | 2 | 0.3% |
| Syrian | 56 | 8.7% |
| Turkish | 10 | 1.5% | View All 30 Rows |
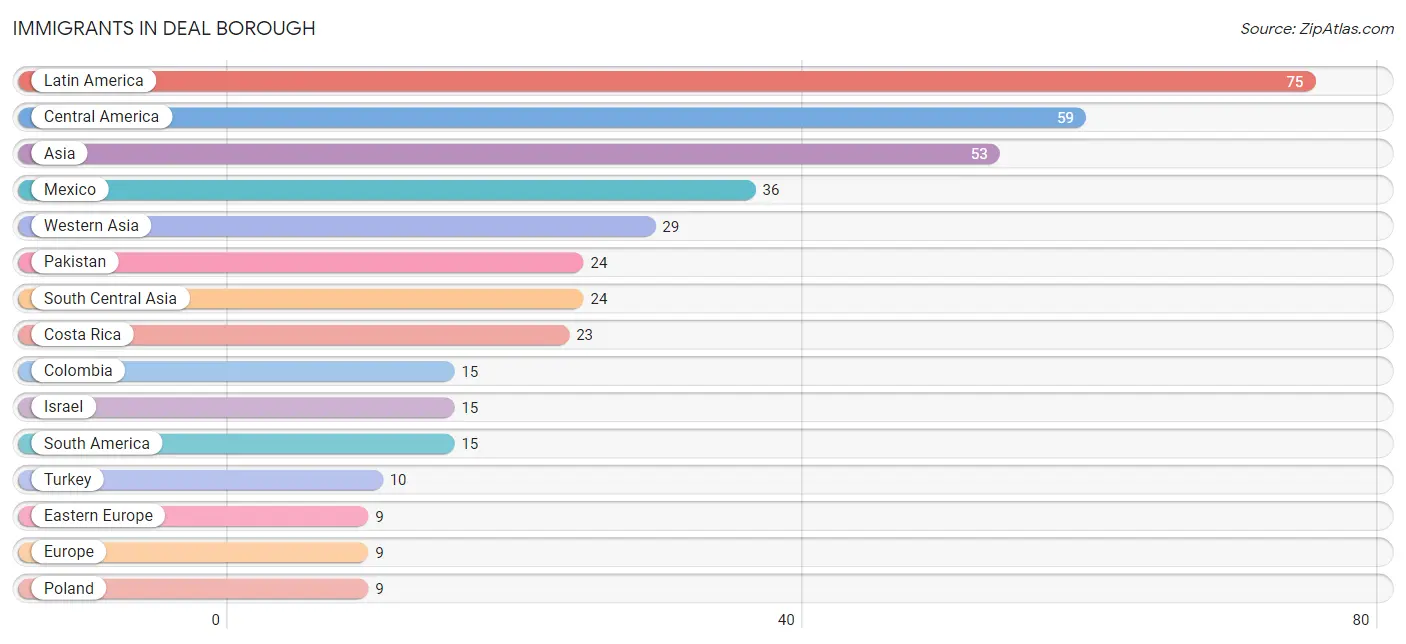
Immigrants in Deal borough
The most numerous immigrant groups reported in Deal borough came from Latin America (75 | 11.6%), Central America (59 | 9.1%), Asia (53 | 8.2%), Mexico (36 | 5.6%), and Western Asia (29 | 4.5%), together accounting for 39.1% of all Deal borough residents.
| Immigration Origin | # Population | % Population |
| Africa | 2 | 0.3% |
| Asia | 53 | 8.2% |
| Caribbean | 1 | 0.2% |
| Central America | 59 | 9.1% |
| Colombia | 15 | 2.3% |
| Costa Rica | 23 | 3.6% |
| Eastern Europe | 9 | 1.4% |
| Europe | 9 | 1.4% |
| Ghana | 2 | 0.3% |
| Haiti | 1 | 0.2% |
| Israel | 15 | 2.3% |
| Latin America | 75 | 11.6% |
| Mexico | 36 | 5.6% |
| Pakistan | 24 | 3.7% |
| Poland | 9 | 1.4% |
| South America | 15 | 2.3% |
| South Central Asia | 24 | 3.7% |
| Syria | 4 | 0.6% |
| Turkey | 10 | 1.5% |
| Western Africa | 2 | 0.3% |
| Western Asia | 29 | 4.5% | View All 21 Rows |
Sex and Age in Deal borough
Sex and Age in Deal borough
The most populous age groups in Deal borough are 20 to 24 Years (39 | 13.9%) for men and 20 to 24 Years (58 | 15.9%) for women.
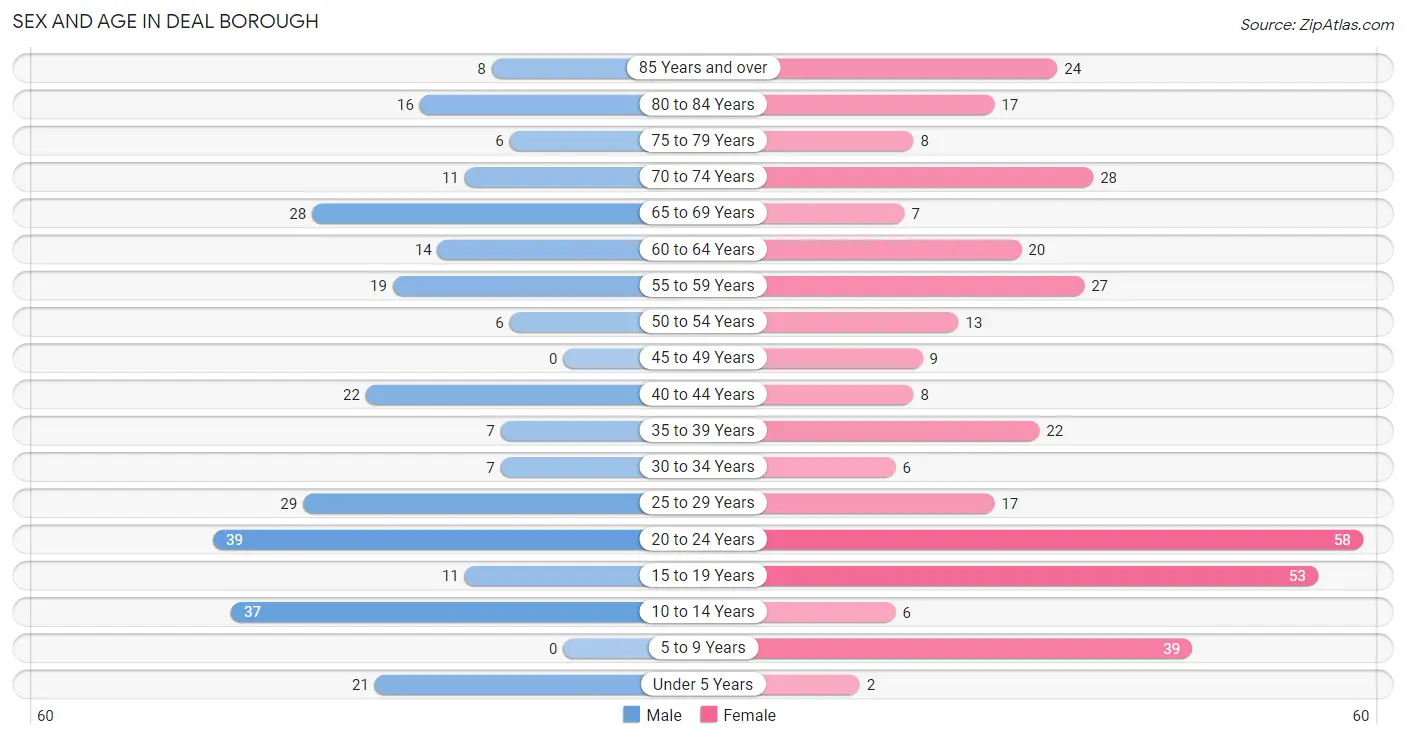
| Age Bracket | Male | Female |
| Under 5 Years | 21 (7.5%) | 2 (0.5%) |
| 5 to 9 Years | 0 (0.0%) | 39 (10.7%) |
| 10 to 14 Years | 37 (13.2%) | 6 (1.7%) |
| 15 to 19 Years | 11 (3.9%) | 53 (14.6%) |
| 20 to 24 Years | 39 (13.9%) | 58 (15.9%) |
| 25 to 29 Years | 29 (10.3%) | 17 (4.7%) |
| 30 to 34 Years | 7 (2.5%) | 6 (1.7%) |
| 35 to 39 Years | 7 (2.5%) | 22 (6.0%) |
| 40 to 44 Years | 22 (7.8%) | 8 (2.2%) |
| 45 to 49 Years | 0 (0.0%) | 9 (2.5%) |
| 50 to 54 Years | 6 (2.1%) | 13 (3.6%) |
| 55 to 59 Years | 19 (6.8%) | 27 (7.4%) |
| 60 to 64 Years | 14 (5.0%) | 20 (5.5%) |
| 65 to 69 Years | 28 (10.0%) | 7 (1.9%) |
| 70 to 74 Years | 11 (3.9%) | 28 (7.7%) |
| 75 to 79 Years | 6 (2.1%) | 8 (2.2%) |
| 80 to 84 Years | 16 (5.7%) | 17 (4.7%) |
| 85 Years and over | 8 (2.9%) | 24 (6.6%) |
| Total | 281 (100.0%) | 364 (100.0%) |
Families and Households in Deal borough
Median Family Size in Deal borough
The median family size in Deal borough is 3.42 persons per family, with single male/father families (22 | 15.3%) accounting for the largest median family size of 3.91 persons per family. On the other hand, married-couple families (70 | 48.6%) represent the smallest median family size with 3.03 persons per family.
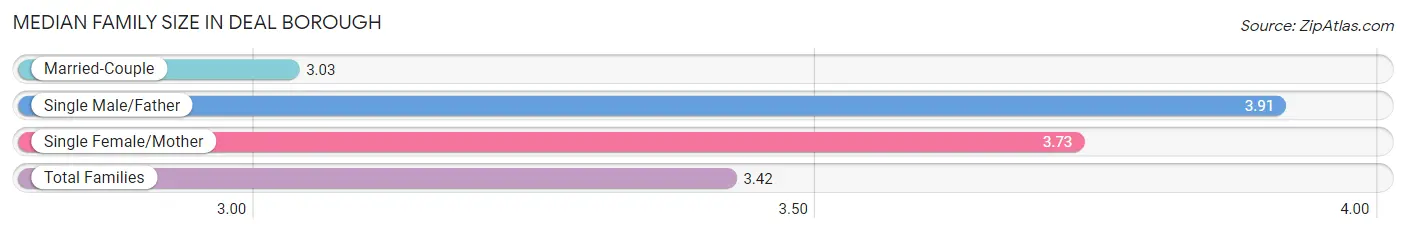
| Family Type | # Families | Family Size |
| Married-Couple | 70 (48.6%) | 3.03 |
| Single Male/Father | 22 (15.3%) | 3.91 |
| Single Female/Mother | 52 (36.1%) | 3.73 |
| Total Families | 144 (100.0%) | 3.42 |
Median Household Size in Deal borough
The median household size in Deal borough is 2.57 persons per household, with single male/father households (22 | 8.8%) accounting for the largest median household size of 4 persons per household. non-family households (105 | 42.2%) represent the smallest median household size with 1.39 persons per household.
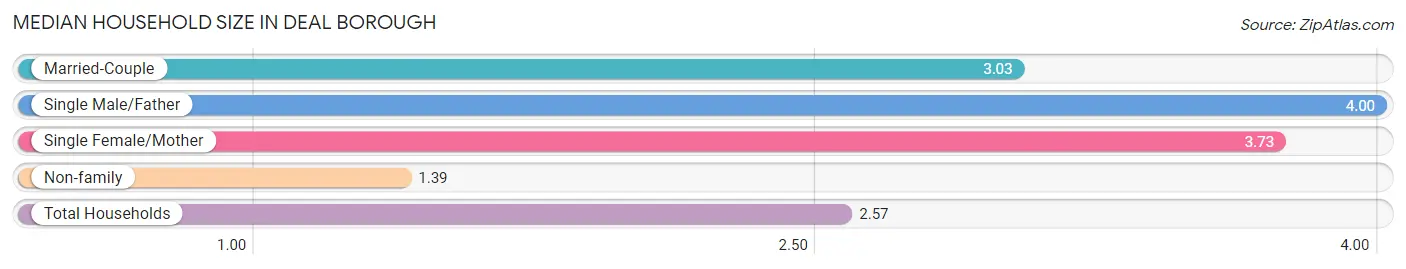
| Household Type | # Households | Household Size |
| Married-Couple | 70 (28.1%) | 3.03 |
| Single Male/Father | 22 (8.8%) | 4.00 |
| Single Female/Mother | 52 (20.9%) | 3.73 |
| Non-family | 105 (42.2%) | 1.39 |
| Total Households | 249 (100.0%) | 2.57 |
Household Size by Marriage Status in Deal borough
Out of a total of 249 households in Deal borough, 144 (57.8%) are family households, while 105 (42.2%) are nonfamily households. The most numerous type of family households are 3-person households, comprising 56, and the most common type of nonfamily households are 1-person households, comprising 71.
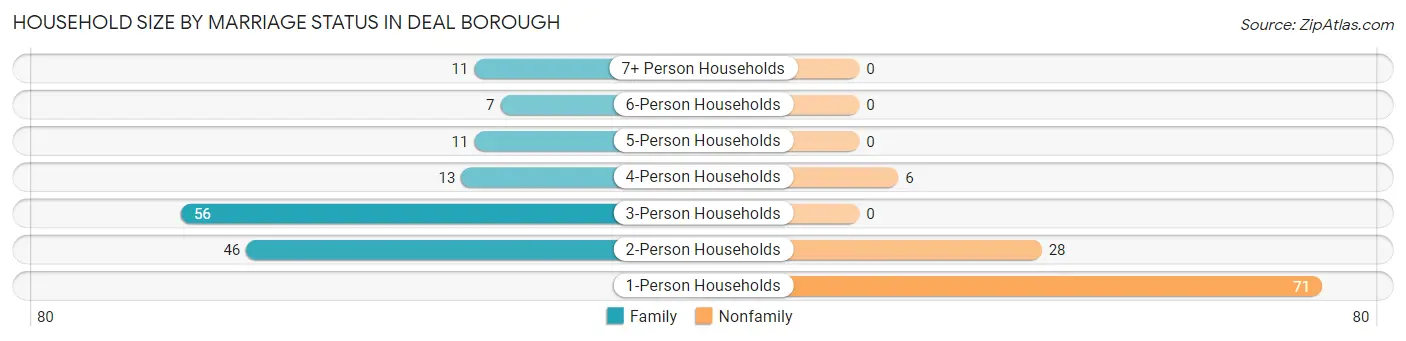
| Household Size | Family Households | Nonfamily Households |
| 1-Person Households | - | 71 (28.5%) |
| 2-Person Households | 46 (18.5%) | 28 (11.2%) |
| 3-Person Households | 56 (22.5%) | 0 (0.0%) |
| 4-Person Households | 13 (5.2%) | 6 (2.4%) |
| 5-Person Households | 11 (4.4%) | 0 (0.0%) |
| 6-Person Households | 7 (2.8%) | 0 (0.0%) |
| 7+ Person Households | 11 (4.4%) | 0 (0.0%) |
| Total | 144 (57.8%) | 105 (42.2%) |
Female Fertility in Deal borough
Fertility by Age in Deal borough
Average fertility rate in Deal borough is 11.0 births per 1,000 women. Women in the age bracket of 35 to 50 years have the highest fertility rate with 23.0 births per 1,000 women. Women in the age bracket of 20 to 34 years acount for 50.0% of all women with births.
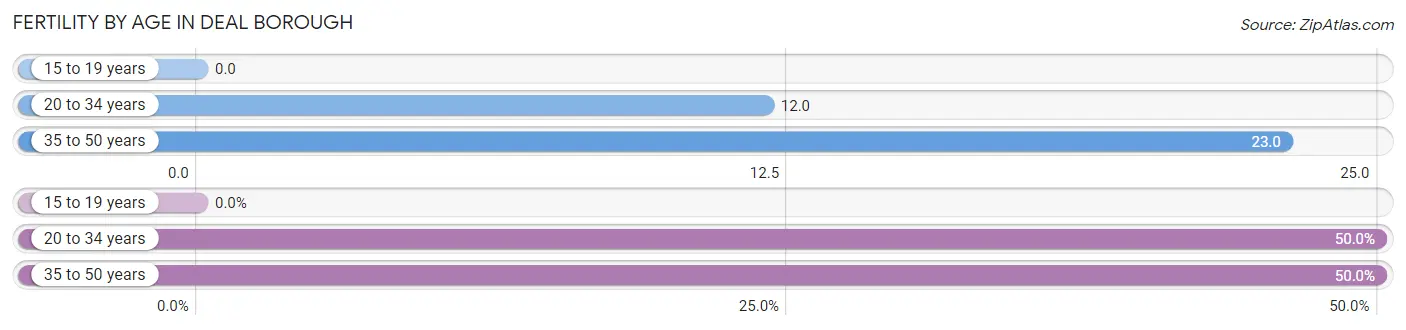
| Age Bracket | Women with Births | Births / 1,000 Women |
| 15 to 19 years | 0 (0.0%) | 0.0 |
| 20 to 34 years | 1 (50.0%) | 12.0 |
| 35 to 50 years | 1 (50.0%) | 23.0 |
| Total | 2 (100.0%) | 11.0 |
Fertility by Age by Marriage Status in Deal borough
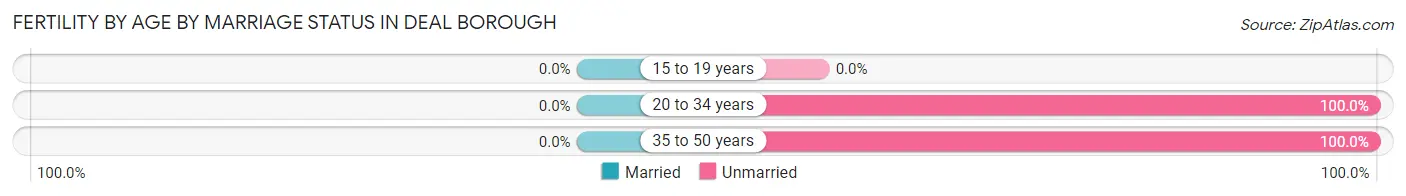
| Age Bracket | Married | Unmarried |
| 15 to 19 years | 0 (0.0%) | 0 (0.0%) |
| 20 to 34 years | 0 (0.0%) | 1 (100.0%) |
| 35 to 50 years | 0 (0.0%) | 1 (100.0%) |
| Total | 0 (0.0%) | 2 (100.0%) |
Fertility by Education in Deal borough
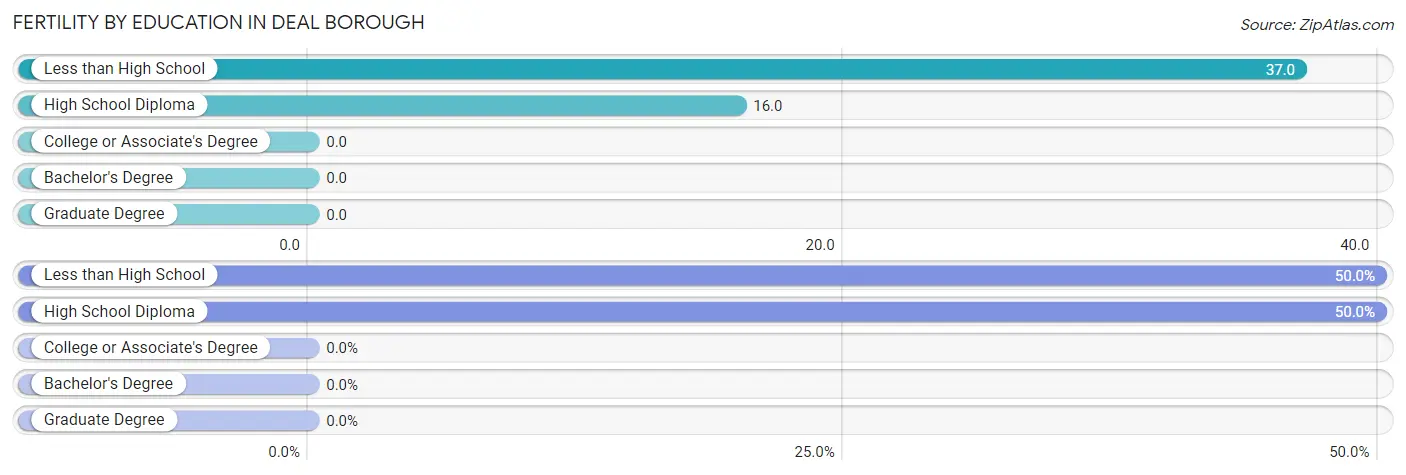
| Educational Attainment | Women with Births | Births / 1,000 Women |
| Less than High School | 1 (50.0%) | 37.0 |
| High School Diploma | 1 (50.0%) | 16.0 |
| College or Associate's Degree | 0 (0.0%) | 0.0 |
| Bachelor's Degree | 0 (0.0%) | 0.0 |
| Graduate Degree | 0 (0.0%) | 0.0 |
| Total | 2 (100.0%) | 11.0 |
Fertility by Education by Marriage Status in Deal borough
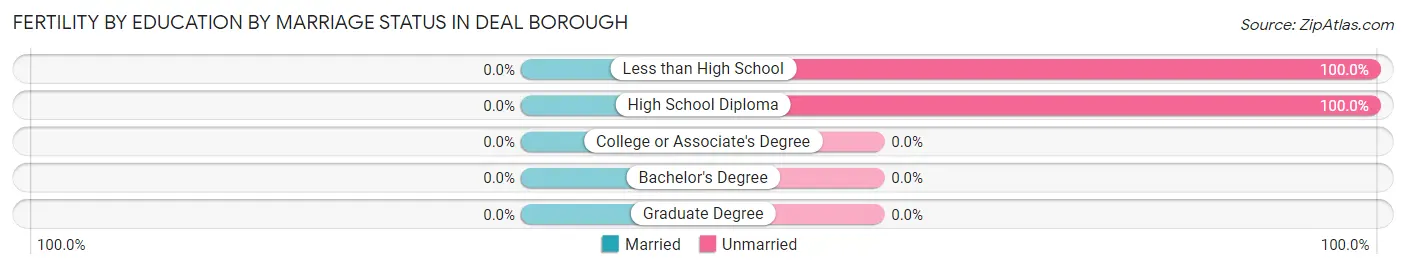
| Educational Attainment | Married | Unmarried |
| Less than High School | 0 (0.0%) | 1 (100.0%) |
| High School Diploma | 0 (0.0%) | 1 (100.0%) |
| College or Associate's Degree | 0 (0.0%) | 0 (0.0%) |
| Bachelor's Degree | 0 (0.0%) | 0 (0.0%) |
| Graduate Degree | 0 (0.0%) | 0 (0.0%) |
| Total | 0 (0.0%) | 2 (100.0%) |
Employment Characteristics in Deal borough
Employment by Class of Employer in Deal borough
Among the 272 employed individuals in Deal borough, private company employees (172 | 63.2%), self-employed (not incorporated) (44 | 16.2%), and not-for-profit organizations (43 | 15.8%) make up the most common classes of employment.
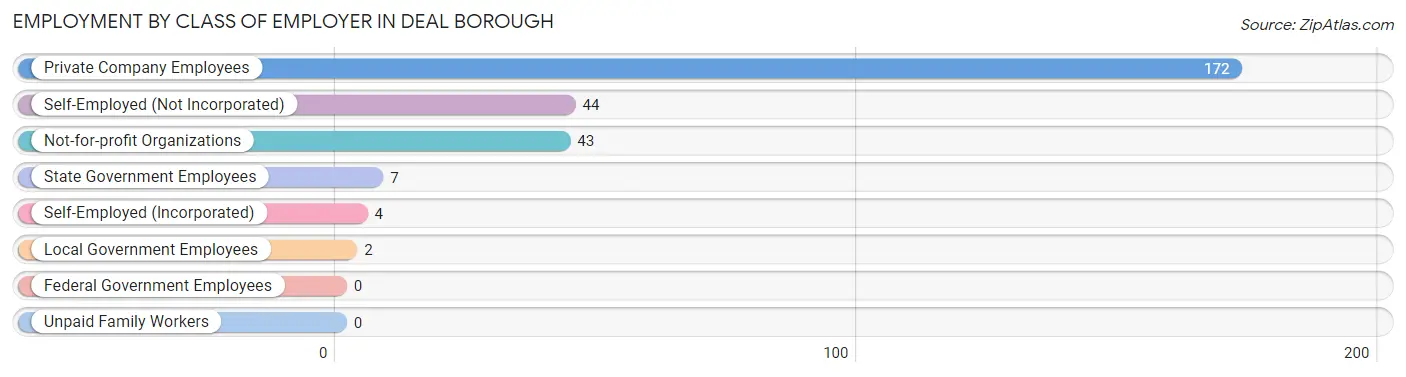
| Employer Class | # Employees | % Employees |
| Private Company Employees | 172 | 63.2% |
| Self-Employed (Incorporated) | 4 | 1.5% |
| Self-Employed (Not Incorporated) | 44 | 16.2% |
| Not-for-profit Organizations | 43 | 15.8% |
| Local Government Employees | 2 | 0.7% |
| State Government Employees | 7 | 2.6% |
| Federal Government Employees | 0 | 0.0% |
| Unpaid Family Workers | 0 | 0.0% |
| Total | 272 | 100.0% |
Employment Status by Age in Deal borough
According to the labor force statistics for Deal borough, out of the total population over 16 years of age (540), 53.1% or 287 individuals are in the labor force, with 5.2% or 15 of them unemployed. The age group with the highest labor force participation rate is 25 to 29 years, with 87.0% or 40 individuals in the labor force. Within the labor force, the 75 years and over age range has the highest percentage of unemployed individuals, with 42.9% or 3 of them being unemployed.
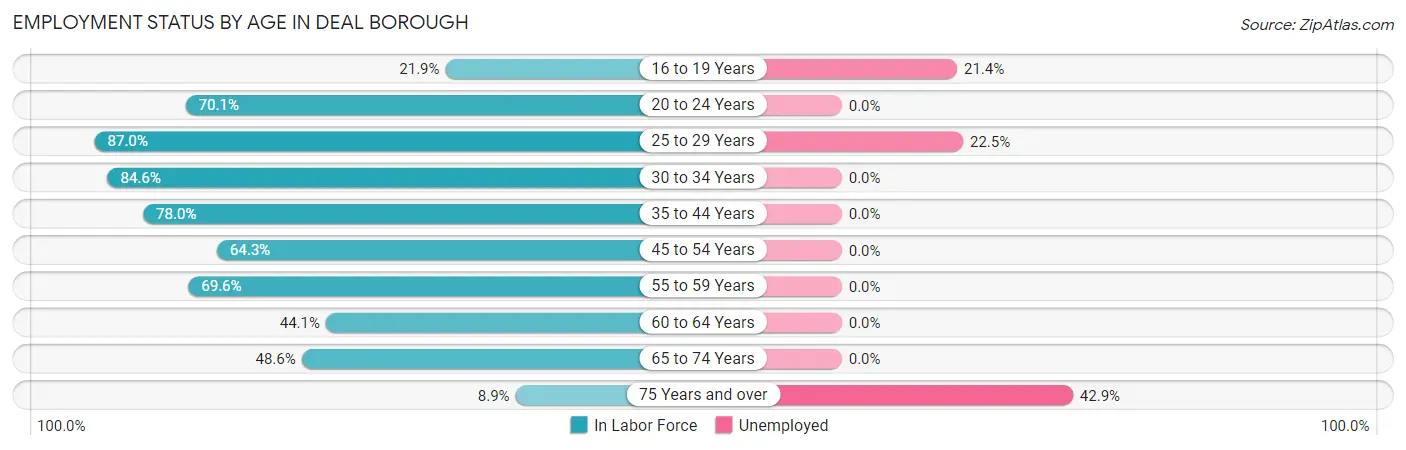
| Age Bracket | In Labor Force | Unemployed |
| 16 to 19 Years | 14 (21.9%) | 3 (21.4%) |
| 20 to 24 Years | 68 (70.1%) | 0 (0.0%) |
| 25 to 29 Years | 40 (87.0%) | 9 (22.5%) |
| 30 to 34 Years | 11 (84.6%) | 0 (0.0%) |
| 35 to 44 Years | 46 (78.0%) | 0 (0.0%) |
| 45 to 54 Years | 18 (64.3%) | 0 (0.0%) |
| 55 to 59 Years | 32 (69.6%) | 0 (0.0%) |
| 60 to 64 Years | 15 (44.1%) | 0 (0.0%) |
| 65 to 74 Years | 36 (48.6%) | 0 (0.0%) |
| 75 Years and over | 7 (8.9%) | 3 (42.9%) |
| Total | 287 (53.1%) | 15 (5.2%) |
Employment Status by Educational Attainment in Deal borough
According to labor force statistics for Deal borough, 71.7% of individuals (162) out of the total population between 25 and 64 years of age (226) are in the labor force, with 5.6% or 9 of them being unemployed. The group with the highest labor force participation rate are those with the educational attainment of bachelor's degree or higher, with 91.2% or 62 individuals in the labor force. Within the labor force, individuals with college / associate degree education have the highest percentage of unemployment, with 11.5% or 6 of them being unemployed.
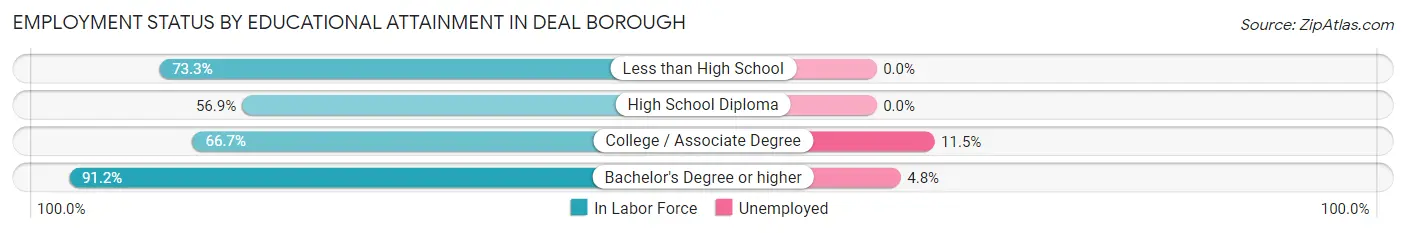
| Educational Attainment | In Labor Force | Unemployed |
| Less than High School | 11 (73.3%) | 0 (0.0%) |
| High School Diploma | 37 (56.9%) | 0 (0.0%) |
| College / Associate Degree | 52 (66.7%) | 9 (11.5%) |
| Bachelor's Degree or higher | 62 (91.2%) | 3 (4.8%) |
| Total | 162 (71.7%) | 13 (5.6%) |
Employment Occupations by Sex in Deal borough
Management, Business, Science and Arts Occupations
The most common Management, Business, Science and Arts occupations in Deal borough are Management (47 | 17.3%), Community & Social Service (26 | 9.6%), Education Instruction & Library (24 | 8.8%), Health Diagnosing & Treating (10 | 3.7%), and Business & Financial (4 | 1.5%).
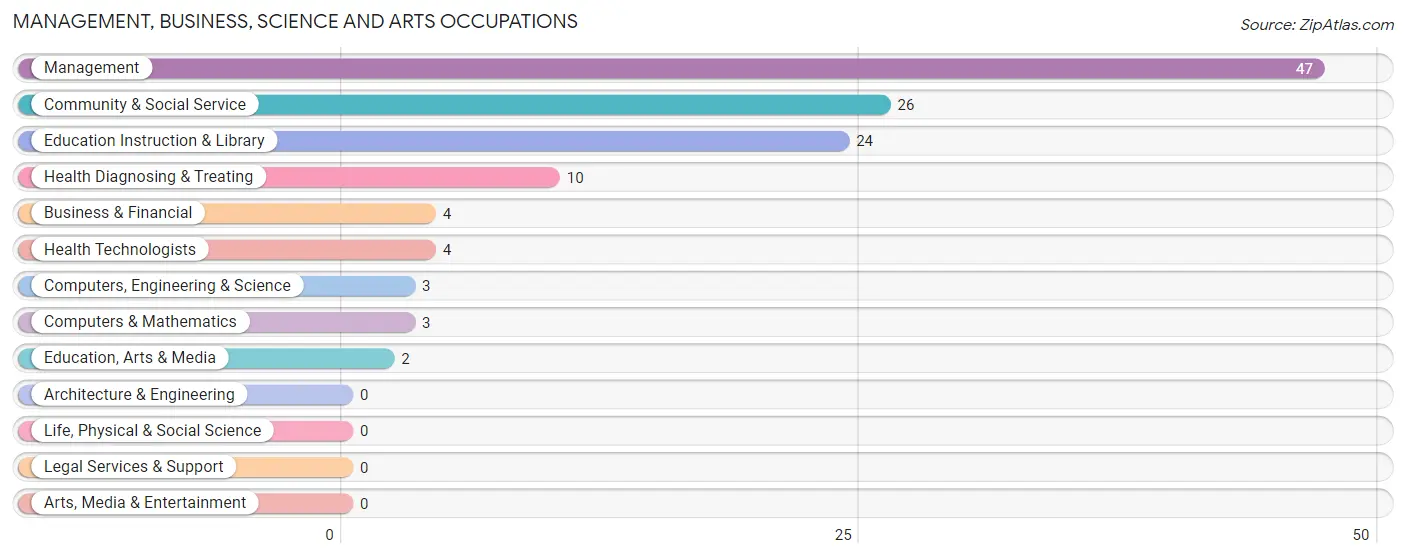
Management, Business, Science and Arts Occupations by Sex
Within the Management, Business, Science and Arts occupations in Deal borough, the most male-oriented occupations are Education, Arts & Media (100.0%), Business & Financial (75.0%), and Community & Social Service (65.4%), while the most female-oriented occupations are Computers, Engineering & Science (100.0%), Computers & Mathematics (100.0%), and Health Diagnosing & Treating (100.0%).
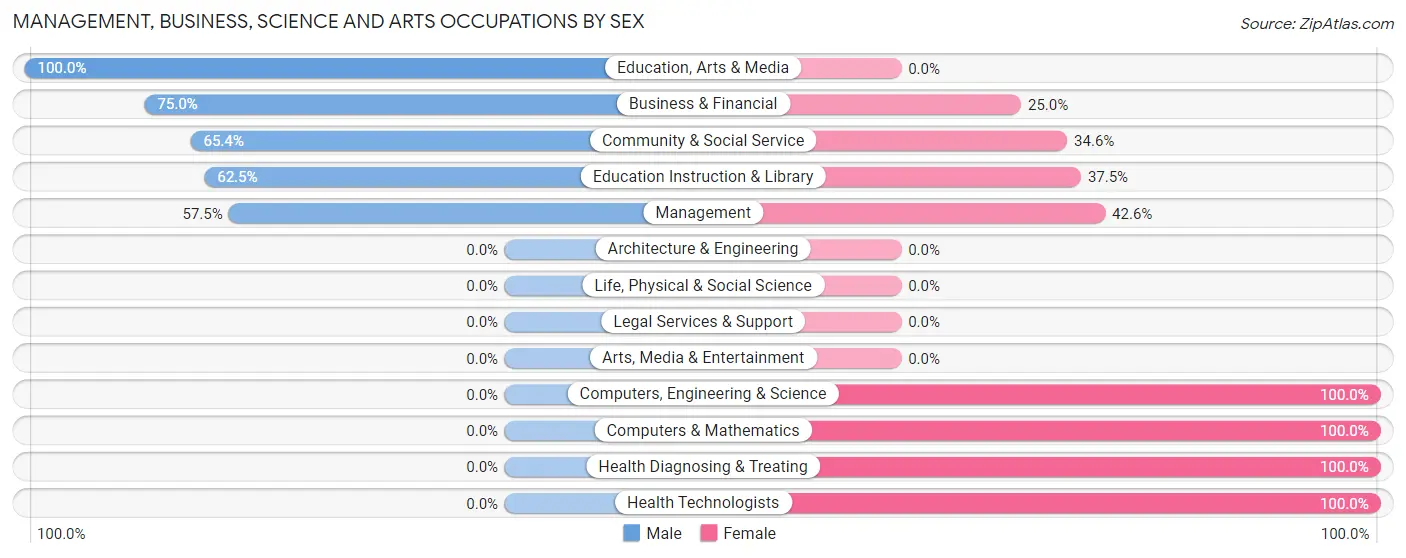
| Occupation | Male | Female |
| Management | 27 (57.5%) | 20 (42.5%) |
| Business & Financial | 3 (75.0%) | 1 (25.0%) |
| Computers, Engineering & Science | 0 (0.0%) | 3 (100.0%) |
| Computers & Mathematics | 0 (0.0%) | 3 (100.0%) |
| Architecture & Engineering | 0 (0.0%) | 0 (0.0%) |
| Life, Physical & Social Science | 0 (0.0%) | 0 (0.0%) |
| Community & Social Service | 17 (65.4%) | 9 (34.6%) |
| Education, Arts & Media | 2 (100.0%) | 0 (0.0%) |
| Legal Services & Support | 0 (0.0%) | 0 (0.0%) |
| Education Instruction & Library | 15 (62.5%) | 9 (37.5%) |
| Arts, Media & Entertainment | 0 (0.0%) | 0 (0.0%) |
| Health Diagnosing & Treating | 0 (0.0%) | 10 (100.0%) |
| Health Technologists | 0 (0.0%) | 4 (100.0%) |
| Total (Category) | 47 (52.2%) | 43 (47.8%) |
| Total (Overall) | 144 (52.9%) | 128 (47.1%) |
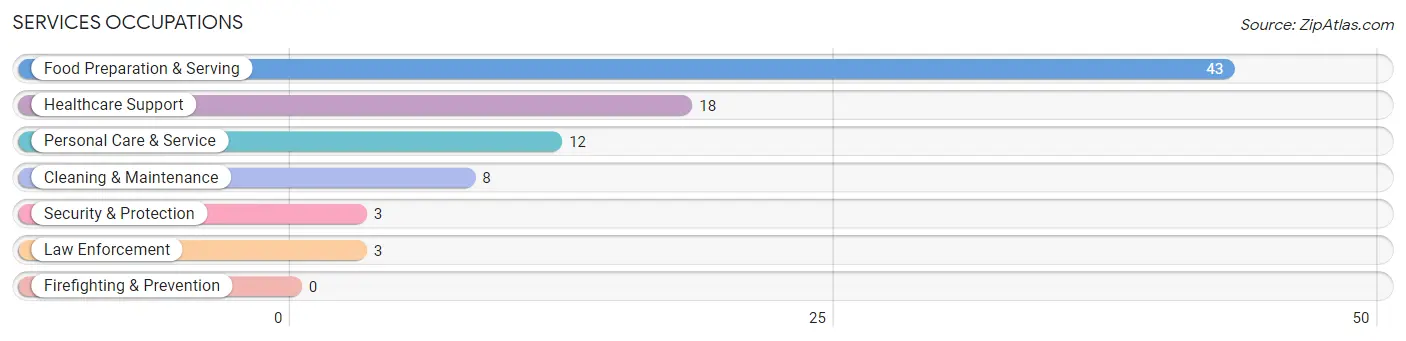
Services Occupations
The most common Services occupations in Deal borough are Food Preparation & Serving (43 | 15.8%), Healthcare Support (18 | 6.6%), Personal Care & Service (12 | 4.4%), Cleaning & Maintenance (8 | 2.9%), and Security & Protection (3 | 1.1%).
Services Occupations by Sex
Within the Services occupations in Deal borough, the most male-oriented occupations are Security & Protection (100.0%), Law Enforcement (100.0%), and Food Preparation & Serving (30.2%), while the most female-oriented occupations are Healthcare Support (100.0%), Cleaning & Maintenance (100.0%), and Personal Care & Service (100.0%).
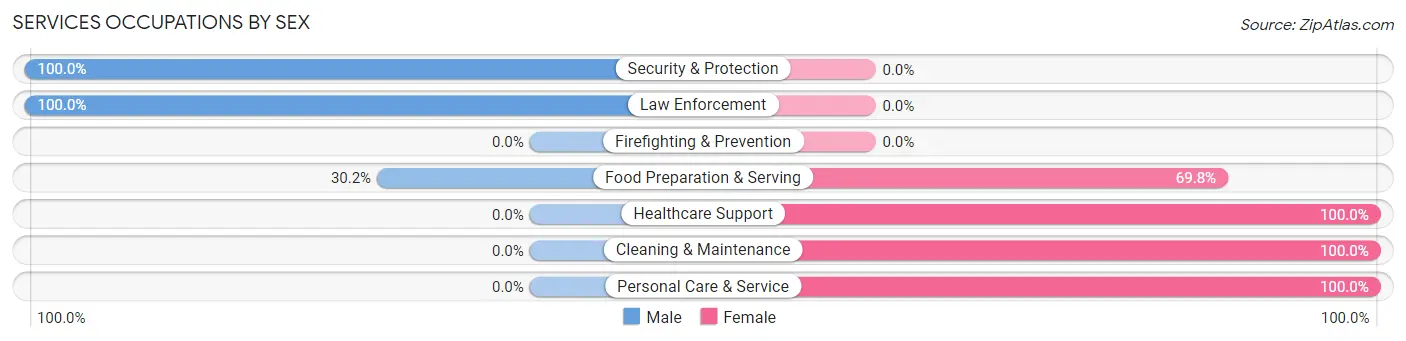
| Occupation | Male | Female |
| Healthcare Support | 0 (0.0%) | 18 (100.0%) |
| Security & Protection | 3 (100.0%) | 0 (0.0%) |
| Firefighting & Prevention | 0 (0.0%) | 0 (0.0%) |
| Law Enforcement | 3 (100.0%) | 0 (0.0%) |
| Food Preparation & Serving | 13 (30.2%) | 30 (69.8%) |
| Cleaning & Maintenance | 0 (0.0%) | 8 (100.0%) |
| Personal Care & Service | 0 (0.0%) | 12 (100.0%) |
| Total (Category) | 16 (19.1%) | 68 (80.9%) |
| Total (Overall) | 144 (52.9%) | 128 (47.1%) |
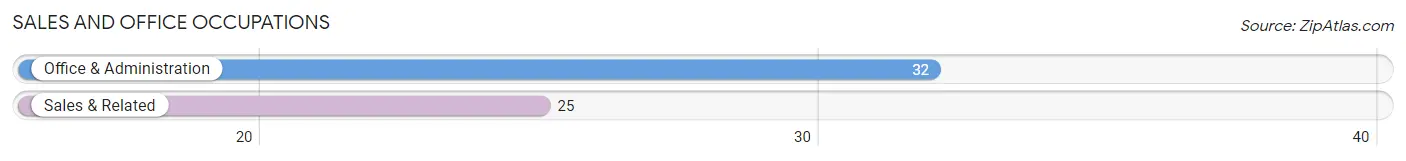
Sales and Office Occupations
The most common Sales and Office occupations in Deal borough are Office & Administration (32 | 11.8%), and Sales & Related (25 | 9.2%).
Sales and Office Occupations by Sex
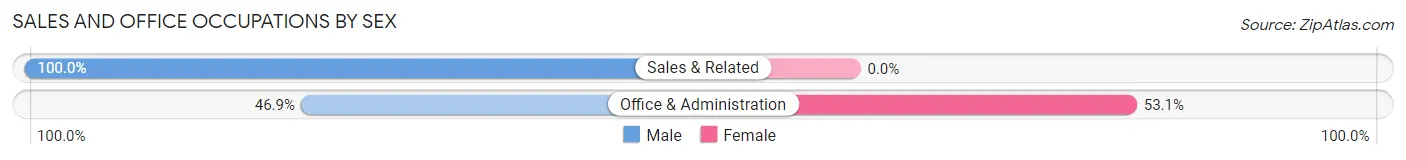
| Occupation | Male | Female |
| Sales & Related | 25 (100.0%) | 0 (0.0%) |
| Office & Administration | 15 (46.9%) | 17 (53.1%) |
| Total (Category) | 40 (70.2%) | 17 (29.8%) |
| Total (Overall) | 144 (52.9%) | 128 (47.1%) |
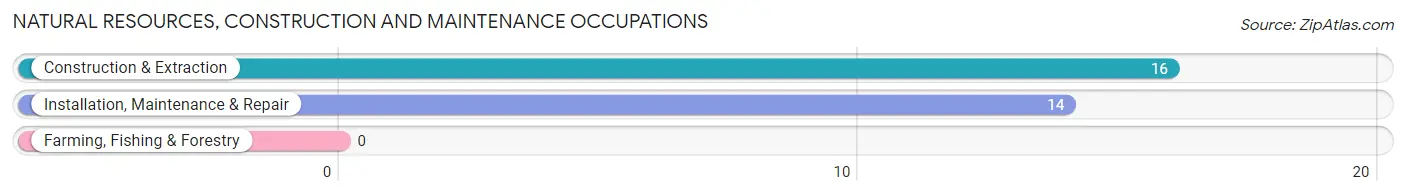
Natural Resources, Construction and Maintenance Occupations
The most common Natural Resources, Construction and Maintenance occupations in Deal borough are Construction & Extraction (16 | 5.9%), and Installation, Maintenance & Repair (14 | 5.1%).
Natural Resources, Construction and Maintenance Occupations by Sex
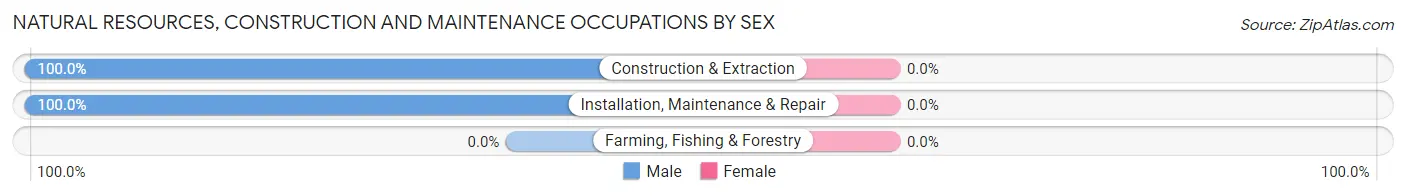
| Occupation | Male | Female |
| Farming, Fishing & Forestry | 0 (0.0%) | 0 (0.0%) |
| Construction & Extraction | 16 (100.0%) | 0 (0.0%) |
| Installation, Maintenance & Repair | 14 (100.0%) | 0 (0.0%) |
| Total (Category) | 30 (100.0%) | 0 (0.0%) |
| Total (Overall) | 144 (52.9%) | 128 (47.1%) |
Production, Transportation and Moving Occupations
The most common Production, Transportation and Moving occupations in Deal borough are , and Transportation (11 | 4.0%).
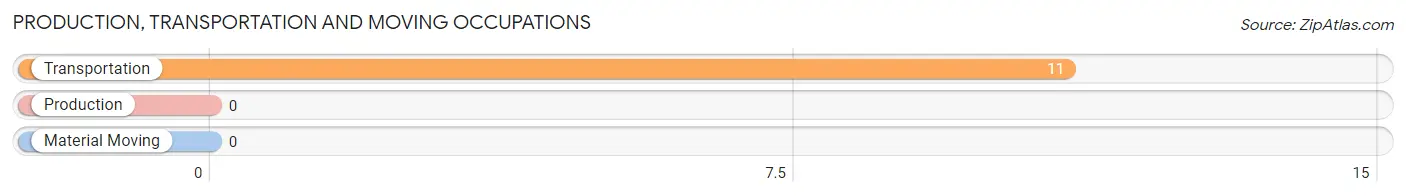
Production, Transportation and Moving Occupations by Sex
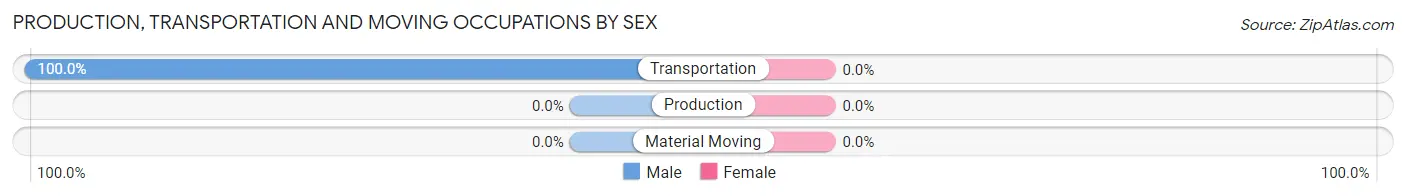
| Occupation | Male | Female |
| Production | 0 (0.0%) | 0 (0.0%) |
| Transportation | 11 (100.0%) | 0 (0.0%) |
| Material Moving | 0 (0.0%) | 0 (0.0%) |
| Total (Category) | 11 (100.0%) | 0 (0.0%) |
| Total (Overall) | 144 (52.9%) | 128 (47.1%) |
Employment Industries by Sex in Deal borough
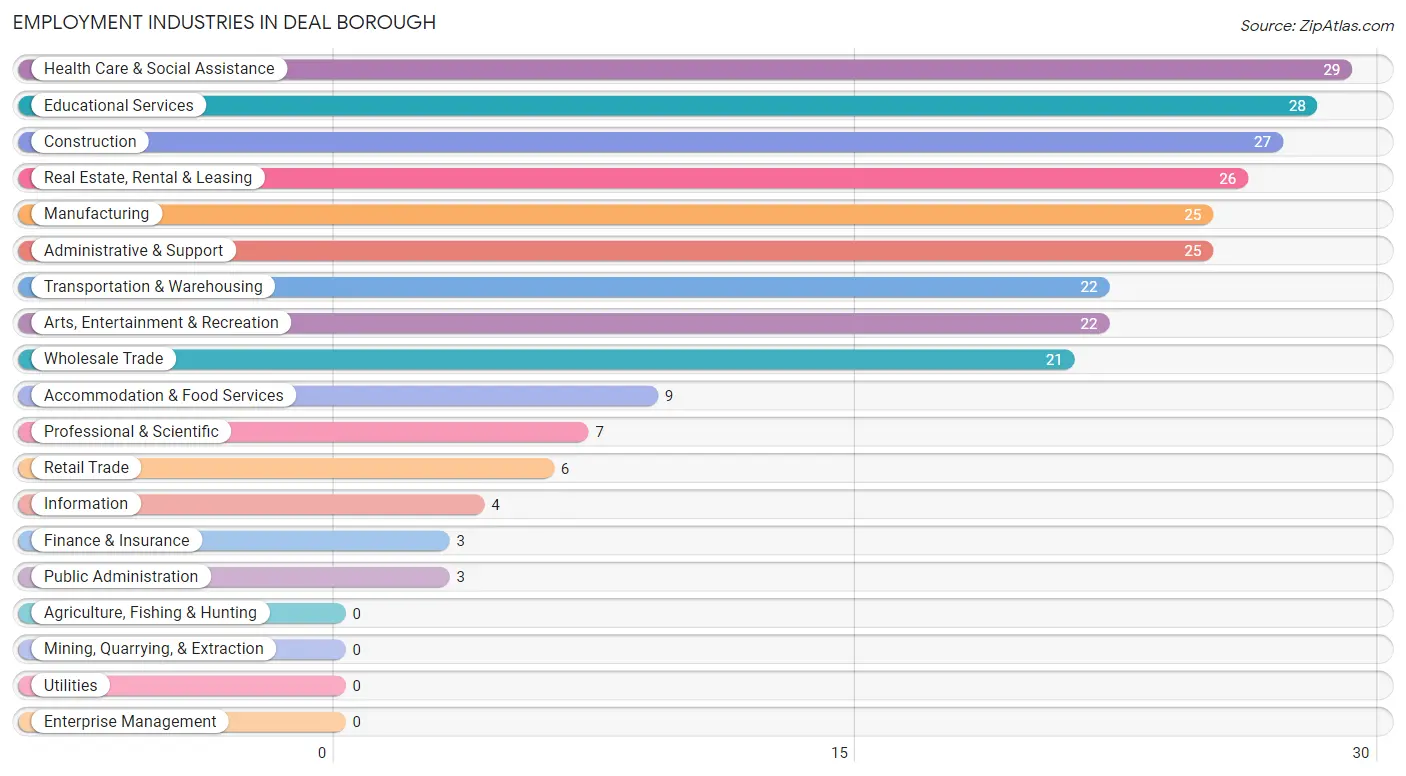
Employment Industries in Deal borough
The major employment industries in Deal borough include Health Care & Social Assistance (29 | 10.7%), Educational Services (28 | 10.3%), Construction (27 | 9.9%), Real Estate, Rental & Leasing (26 | 9.6%), and Manufacturing (25 | 9.2%).
Employment Industries by Sex in Deal borough
The Deal borough industries that see more men than women are Construction (100.0%), Retail Trade (100.0%), and Finance & Insurance (100.0%), whereas the industries that tend to have a higher number of women are Information (100.0%), Health Care & Social Assistance (100.0%), and Accommodation & Food Services (100.0%).
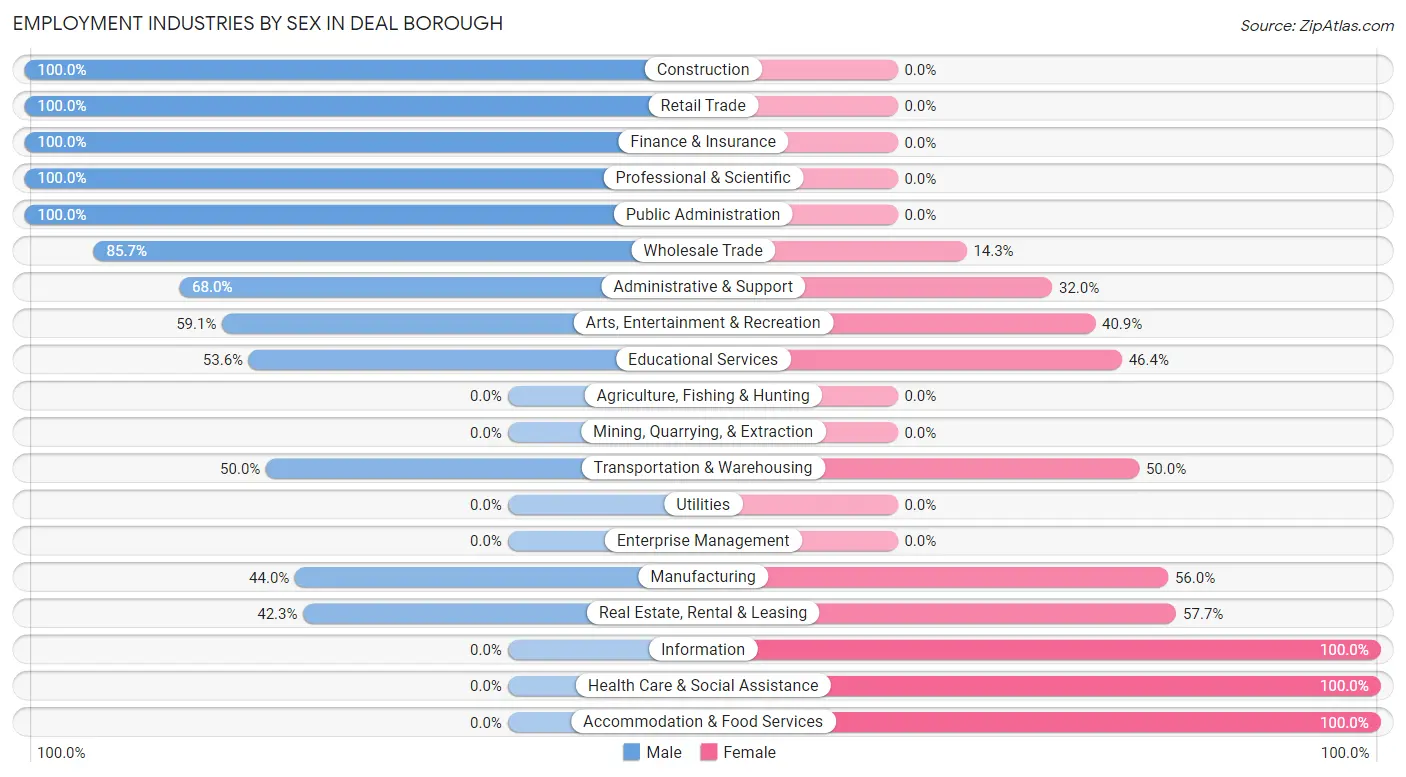
| Industry | Male | Female |
| Agriculture, Fishing & Hunting | 0 (0.0%) | 0 (0.0%) |
| Mining, Quarrying, & Extraction | 0 (0.0%) | 0 (0.0%) |
| Construction | 27 (100.0%) | 0 (0.0%) |
| Manufacturing | 11 (44.0%) | 14 (56.0%) |
| Wholesale Trade | 18 (85.7%) | 3 (14.3%) |
| Retail Trade | 6 (100.0%) | 0 (0.0%) |
| Transportation & Warehousing | 11 (50.0%) | 11 (50.0%) |
| Utilities | 0 (0.0%) | 0 (0.0%) |
| Information | 0 (0.0%) | 4 (100.0%) |
| Finance & Insurance | 3 (100.0%) | 0 (0.0%) |
| Real Estate, Rental & Leasing | 11 (42.3%) | 15 (57.7%) |
| Professional & Scientific | 7 (100.0%) | 0 (0.0%) |
| Enterprise Management | 0 (0.0%) | 0 (0.0%) |
| Administrative & Support | 17 (68.0%) | 8 (32.0%) |
| Educational Services | 15 (53.6%) | 13 (46.4%) |
| Health Care & Social Assistance | 0 (0.0%) | 29 (100.0%) |
| Arts, Entertainment & Recreation | 13 (59.1%) | 9 (40.9%) |
| Accommodation & Food Services | 0 (0.0%) | 9 (100.0%) |
| Public Administration | 3 (100.0%) | 0 (0.0%) |
| Total | 144 (52.9%) | 128 (47.1%) |
Education in Deal borough
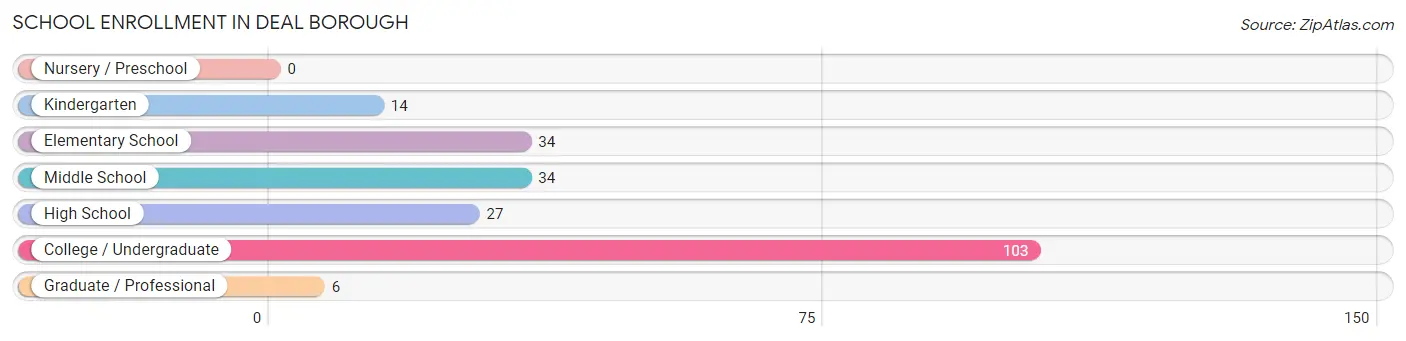
School Enrollment in Deal borough
The most common levels of schooling among the 218 students in Deal borough are college / undergraduate (103 | 47.2%), elementary school (34 | 15.6%), and middle school (34 | 15.6%).
| School Level | # Students | % Students |
| Nursery / Preschool | 0 | 0.0% |
| Kindergarten | 14 | 6.4% |
| Elementary School | 34 | 15.6% |
| Middle School | 34 | 15.6% |
| High School | 27 | 12.4% |
| College / Undergraduate | 103 | 47.2% |
| Graduate / Professional | 6 | 2.8% |
| Total | 218 | 100.0% |
School Enrollment by Age by Funding Source in Deal borough
Out of a total of 218 students who are enrolled in schools in Deal borough, 105 (48.2%) attend a private institution, while the remaining 113 (51.8%) are enrolled in public schools. The age group of 20 to 24 year olds has the highest likelihood of being enrolled in private schools, with 44 (75.9% in the age bracket) enrolled. Conversely, the age group of 15 to 17 year olds has the lowest likelihood of being enrolled in a private school, with 15 (100.0% in the age bracket) attending a public institution.
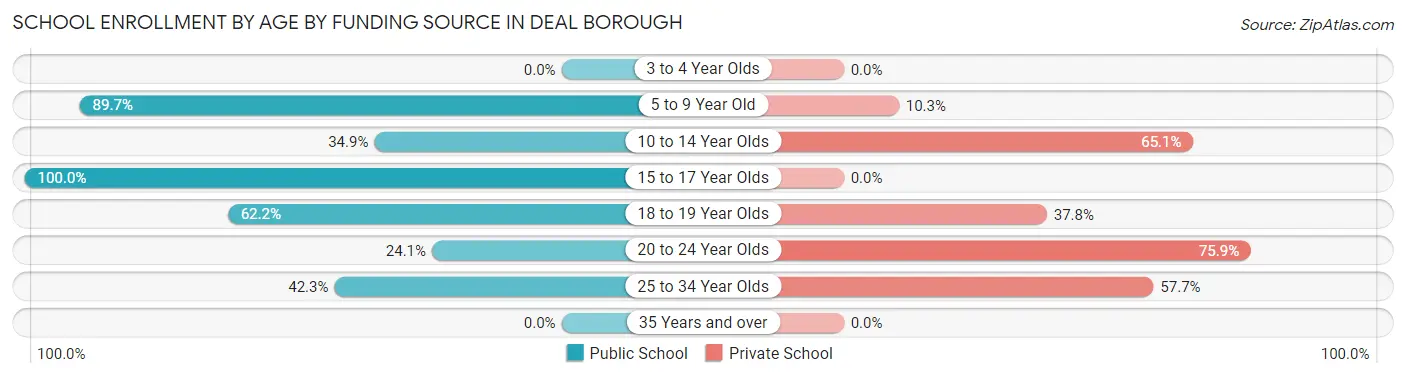
| Age Bracket | Public School | Private School |
| 3 to 4 Year Olds | 0 (0.0%) | 0 (0.0%) |
| 5 to 9 Year Old | 35 (89.7%) | 4 (10.3%) |
| 10 to 14 Year Olds | 15 (34.9%) | 28 (65.1%) |
| 15 to 17 Year Olds | 15 (100.0%) | 0 (0.0%) |
| 18 to 19 Year Olds | 23 (62.2%) | 14 (37.8%) |
| 20 to 24 Year Olds | 14 (24.1%) | 44 (75.9%) |
| 25 to 34 Year Olds | 11 (42.3%) | 15 (57.7%) |
| 35 Years and over | 0 (0.0%) | 0 (0.0%) |
| Total | 113 (51.8%) | 105 (48.2%) |
Educational Attainment by Field of Study in Deal borough
Business (36 | 31.0%), social sciences (21 | 18.1%), education (14 | 12.1%), liberal arts & history (12 | 10.3%), and psychology (8 | 6.9%) are the most common fields of study among 116 individuals in Deal borough who have obtained a bachelor's degree or higher.
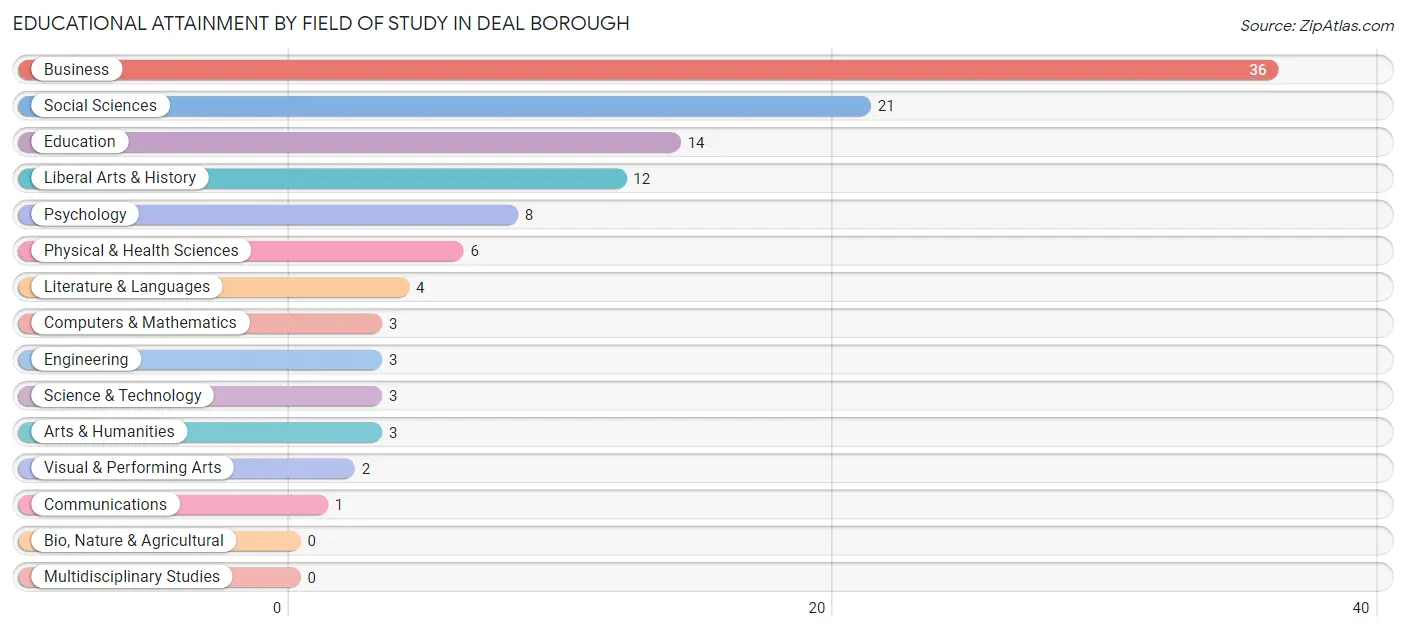
| Field of Study | # Graduates | % Graduates |
| Computers & Mathematics | 3 | 2.6% |
| Bio, Nature & Agricultural | 0 | 0.0% |
| Physical & Health Sciences | 6 | 5.2% |
| Psychology | 8 | 6.9% |
| Social Sciences | 21 | 18.1% |
| Engineering | 3 | 2.6% |
| Multidisciplinary Studies | 0 | 0.0% |
| Science & Technology | 3 | 2.6% |
| Business | 36 | 31.0% |
| Education | 14 | 12.1% |
| Literature & Languages | 4 | 3.5% |
| Liberal Arts & History | 12 | 10.3% |
| Visual & Performing Arts | 2 | 1.7% |
| Communications | 1 | 0.9% |
| Arts & Humanities | 3 | 2.6% |
| Total | 116 | 100.0% |
Transportation & Commute in Deal borough
Vehicle Availability by Sex in Deal borough
The most prevalent vehicle ownership categories in Deal borough are males with 1 vehicle (43, accounting for 29.9%) and females with 1 vehicle (23, making up 33.6%).
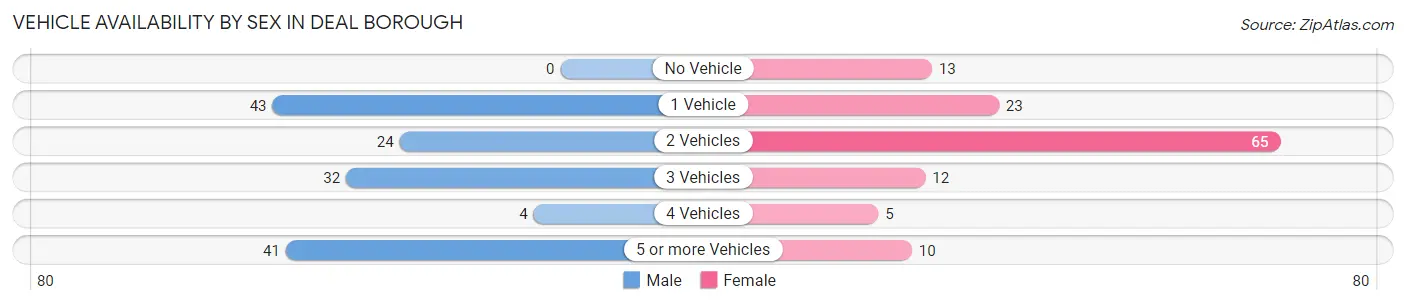
| Vehicles Available | Male | Female |
| No Vehicle | 0 (0.0%) | 13 (10.2%) |
| 1 Vehicle | 43 (29.9%) | 23 (18.0%) |
| 2 Vehicles | 24 (16.7%) | 65 (50.8%) |
| 3 Vehicles | 32 (22.2%) | 12 (9.4%) |
| 4 Vehicles | 4 (2.8%) | 5 (3.9%) |
| 5 or more Vehicles | 41 (28.5%) | 10 (7.8%) |
| Total | 144 (100.0%) | 128 (100.0%) |
Commute Time in Deal borough
The most frequently occuring commute durations in Deal borough are 5 to 9 minutes (67 commuters, 26.9%), 25 to 29 minutes (44 commuters, 17.7%), and 30 to 34 minutes (25 commuters, 10.0%).
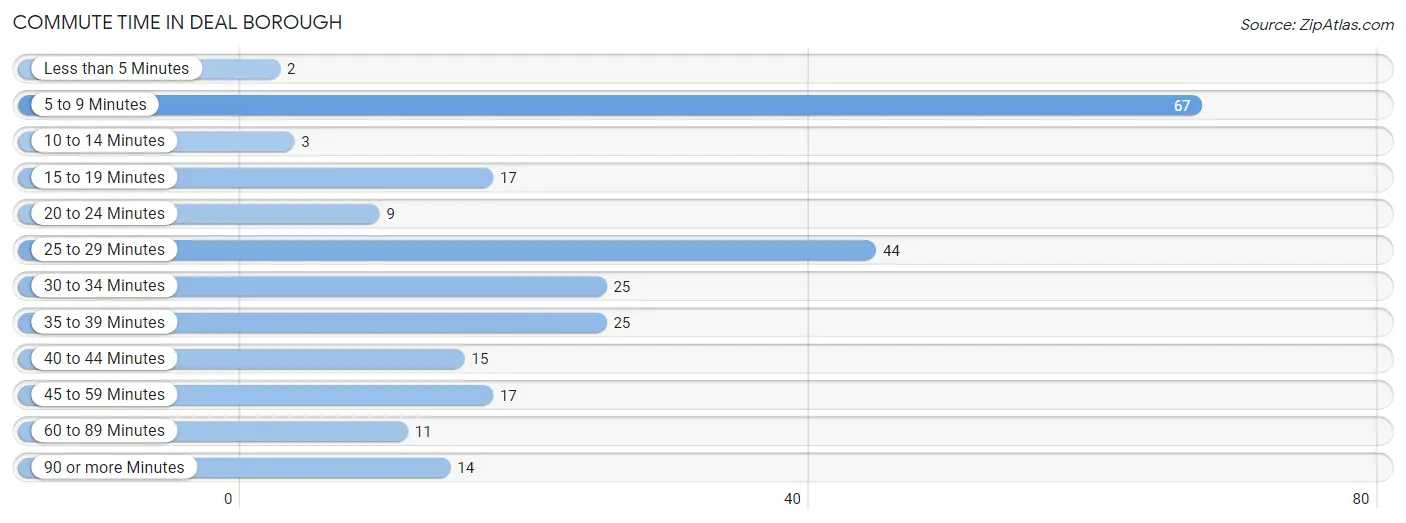
| Commute Time | # Commuters | % Commuters |
| Less than 5 Minutes | 2 | 0.8% |
| 5 to 9 Minutes | 67 | 26.9% |
| 10 to 14 Minutes | 3 | 1.2% |
| 15 to 19 Minutes | 17 | 6.8% |
| 20 to 24 Minutes | 9 | 3.6% |
| 25 to 29 Minutes | 44 | 17.7% |
| 30 to 34 Minutes | 25 | 10.0% |
| 35 to 39 Minutes | 25 | 10.0% |
| 40 to 44 Minutes | 15 | 6.0% |
| 45 to 59 Minutes | 17 | 6.8% |
| 60 to 89 Minutes | 11 | 4.4% |
| 90 or more Minutes | 14 | 5.6% |
Commute Time by Sex in Deal borough
The most common commute times in Deal borough are 5 to 9 minutes (42 commuters, 34.2%) for males and 5 to 9 minutes (25 commuters, 19.8%) for females.
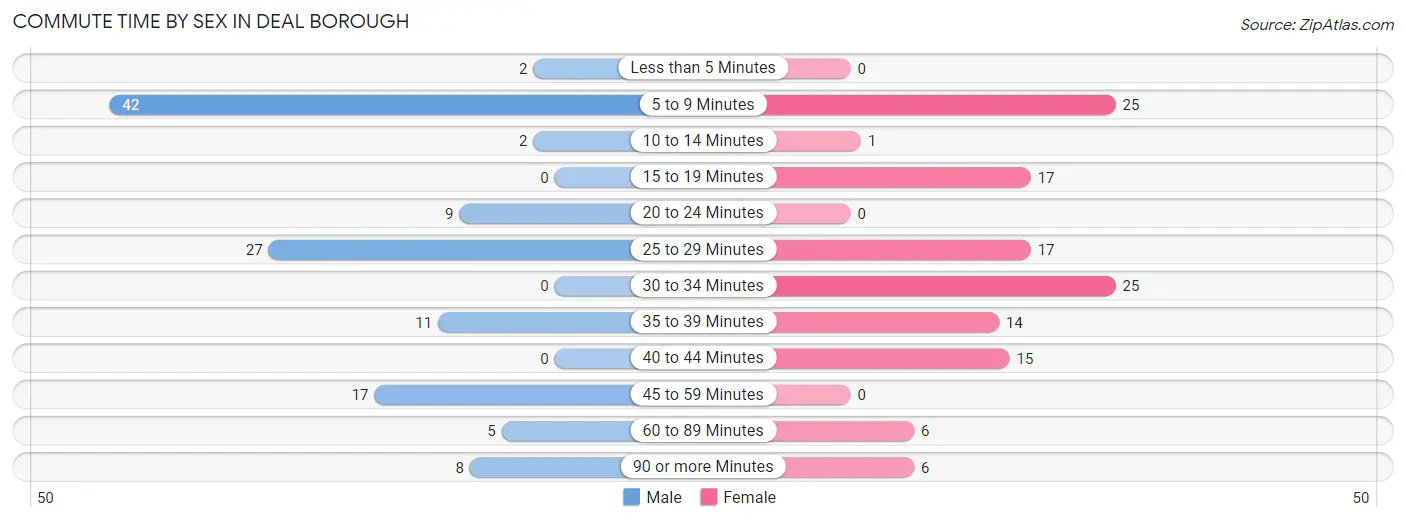
| Commute Time | Male | Female |
| Less than 5 Minutes | 2 (1.6%) | 0 (0.0%) |
| 5 to 9 Minutes | 42 (34.2%) | 25 (19.8%) |
| 10 to 14 Minutes | 2 (1.6%) | 1 (0.8%) |
| 15 to 19 Minutes | 0 (0.0%) | 17 (13.5%) |
| 20 to 24 Minutes | 9 (7.3%) | 0 (0.0%) |
| 25 to 29 Minutes | 27 (22.0%) | 17 (13.5%) |
| 30 to 34 Minutes | 0 (0.0%) | 25 (19.8%) |
| 35 to 39 Minutes | 11 (8.9%) | 14 (11.1%) |
| 40 to 44 Minutes | 0 (0.0%) | 15 (11.9%) |
| 45 to 59 Minutes | 17 (13.8%) | 0 (0.0%) |
| 60 to 89 Minutes | 5 (4.1%) | 6 (4.8%) |
| 90 or more Minutes | 8 (6.5%) | 6 (4.8%) |
Time of Departure to Work by Sex in Deal borough
The most frequent times of departure to work in Deal borough are 8:00 AM to 8:29 AM (32, 26.0%) for males and 8:00 AM to 8:29 AM (37, 29.4%) for females.
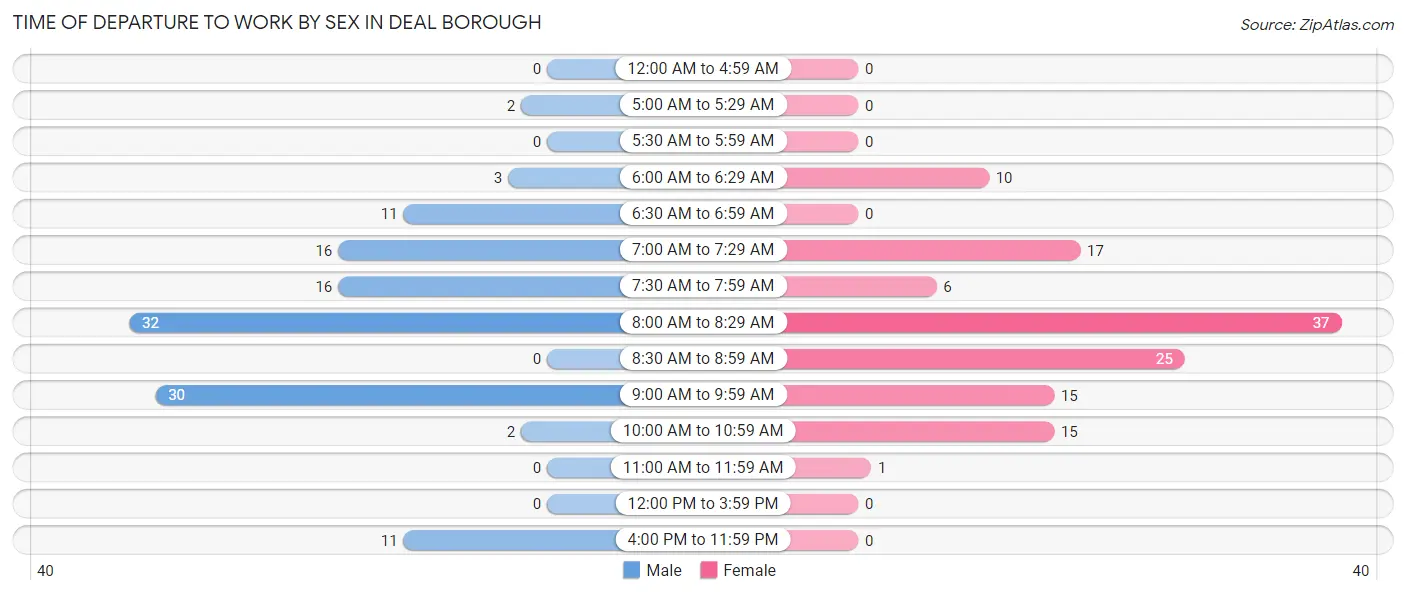
| Time of Departure | Male | Female |
| 12:00 AM to 4:59 AM | 0 (0.0%) | 0 (0.0%) |
| 5:00 AM to 5:29 AM | 2 (1.6%) | 0 (0.0%) |
| 5:30 AM to 5:59 AM | 0 (0.0%) | 0 (0.0%) |
| 6:00 AM to 6:29 AM | 3 (2.4%) | 10 (7.9%) |
| 6:30 AM to 6:59 AM | 11 (8.9%) | 0 (0.0%) |
| 7:00 AM to 7:29 AM | 16 (13.0%) | 17 (13.5%) |
| 7:30 AM to 7:59 AM | 16 (13.0%) | 6 (4.8%) |
| 8:00 AM to 8:29 AM | 32 (26.0%) | 37 (29.4%) |
| 8:30 AM to 8:59 AM | 0 (0.0%) | 25 (19.8%) |
| 9:00 AM to 9:59 AM | 30 (24.4%) | 15 (11.9%) |
| 10:00 AM to 10:59 AM | 2 (1.6%) | 15 (11.9%) |
| 11:00 AM to 11:59 AM | 0 (0.0%) | 1 (0.8%) |
| 12:00 PM to 3:59 PM | 0 (0.0%) | 0 (0.0%) |
| 4:00 PM to 11:59 PM | 11 (8.9%) | 0 (0.0%) |
| Total | 123 (100.0%) | 126 (100.0%) |
Housing Occupancy in Deal borough
Occupancy by Ownership in Deal borough
Of the total 249 dwellings in Deal borough, owner-occupied units account for 131 (52.6%), while renter-occupied units make up 118 (47.4%).
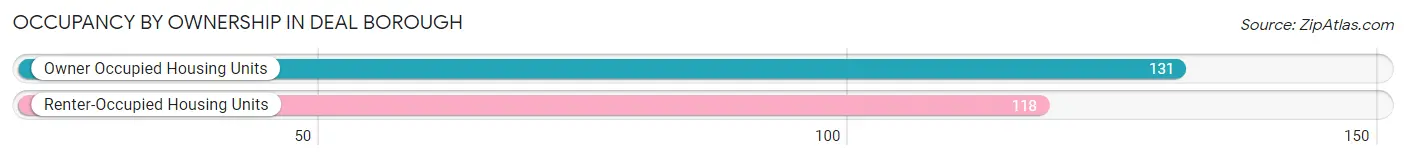
| Occupancy | # Housing Units | % Housing Units |
| Owner Occupied Housing Units | 131 | 52.6% |
| Renter-Occupied Housing Units | 118 | 47.4% |
| Total Occupied Housing Units | 249 | 100.0% |
Occupancy by Household Size in Deal borough
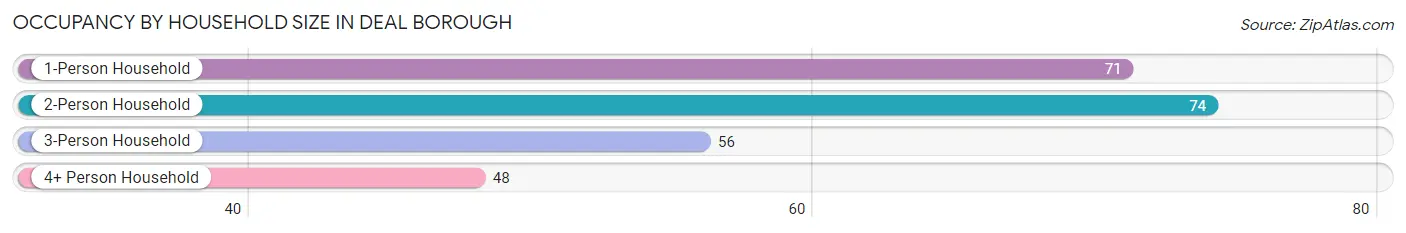
| Household Size | # Housing Units | % Housing Units |
| 1-Person Household | 71 | 28.5% |
| 2-Person Household | 74 | 29.7% |
| 3-Person Household | 56 | 22.5% |
| 4+ Person Household | 48 | 19.3% |
| Total Housing Units | 249 | 100.0% |
Occupancy by Ownership by Household Size in Deal borough
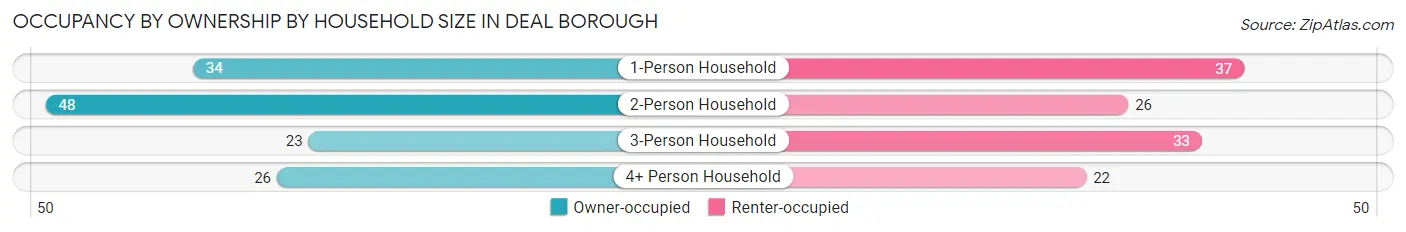
| Household Size | Owner-occupied | Renter-occupied |
| 1-Person Household | 34 (47.9%) | 37 (52.1%) |
| 2-Person Household | 48 (64.9%) | 26 (35.1%) |
| 3-Person Household | 23 (41.1%) | 33 (58.9%) |
| 4+ Person Household | 26 (54.2%) | 22 (45.8%) |
| Total Housing Units | 131 (52.6%) | 118 (47.4%) |
Occupancy by Educational Attainment in Deal borough
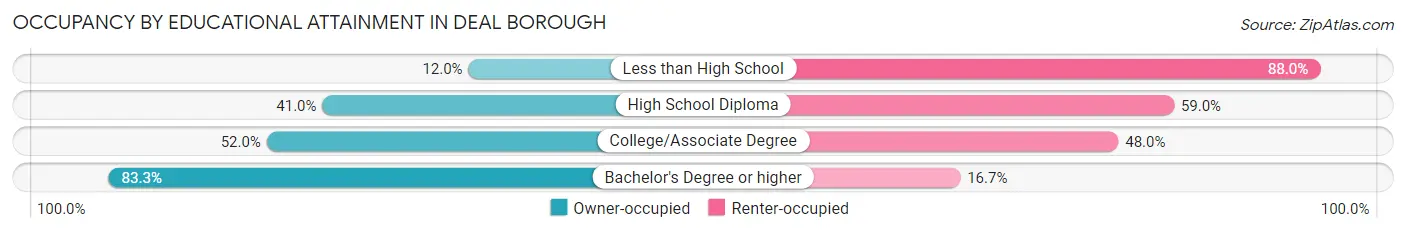
| Household Size | Owner-occupied | Renter-occupied |
| Less than High School | 3 (12.0%) | 22 (88.0%) |
| High School Diploma | 34 (41.0%) | 49 (59.0%) |
| College/Associate Degree | 39 (52.0%) | 36 (48.0%) |
| Bachelor's Degree or higher | 55 (83.3%) | 11 (16.7%) |
Occupancy by Age of Householder in Deal borough
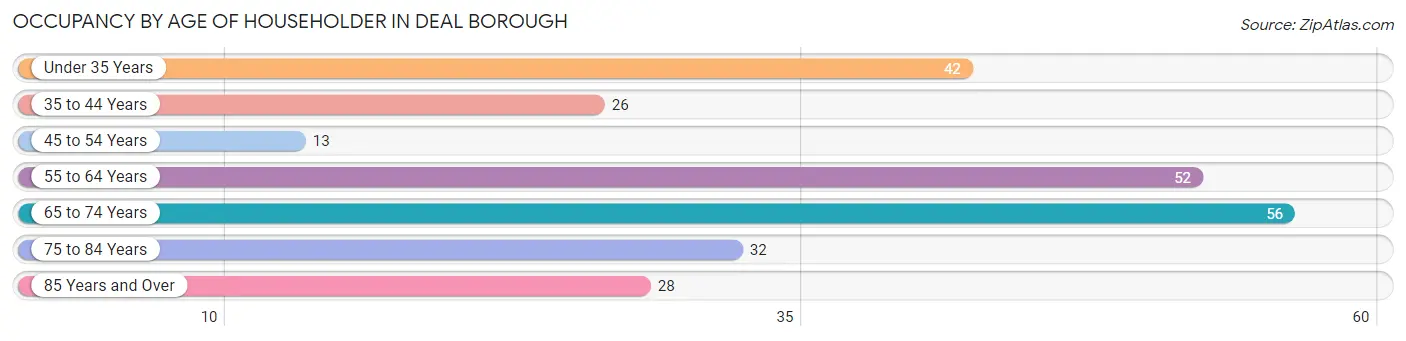
| Age Bracket | # Households | % Households |
| Under 35 Years | 42 | 16.9% |
| 35 to 44 Years | 26 | 10.4% |
| 45 to 54 Years | 13 | 5.2% |
| 55 to 64 Years | 52 | 20.9% |
| 65 to 74 Years | 56 | 22.5% |
| 75 to 84 Years | 32 | 12.9% |
| 85 Years and Over | 28 | 11.2% |
| Total | 249 | 100.0% |
Housing Finances in Deal borough
Median Income by Occupancy in Deal borough
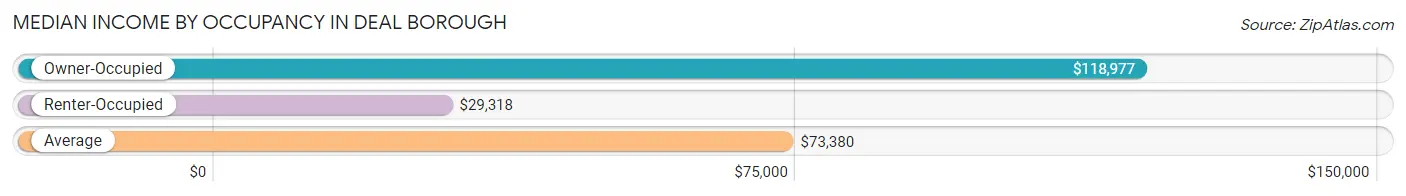
| Occupancy Type | # Households | Median Income |
| Owner-Occupied | 131 (52.6%) | $118,977 |
| Renter-Occupied | 118 (47.4%) | $29,318 |
| Average | 249 (100.0%) | $73,380 |
Occupancy by Householder Income Bracket in Deal borough
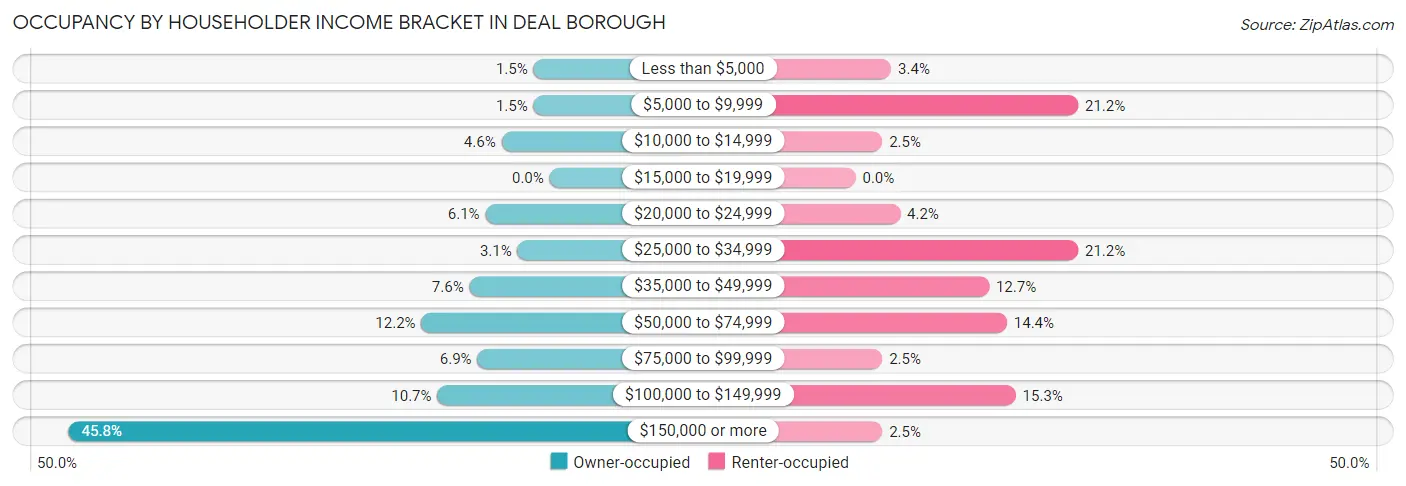
| Income Bracket | Owner-occupied | Renter-occupied |
| Less than $5,000 | 2 (1.5%) | 4 (3.4%) |
| $5,000 to $9,999 | 2 (1.5%) | 25 (21.2%) |
| $10,000 to $14,999 | 6 (4.6%) | 3 (2.5%) |
| $15,000 to $19,999 | 0 (0.0%) | 0 (0.0%) |
| $20,000 to $24,999 | 8 (6.1%) | 5 (4.2%) |
| $25,000 to $34,999 | 4 (3.0%) | 25 (21.2%) |
| $35,000 to $49,999 | 10 (7.6%) | 15 (12.7%) |
| $50,000 to $74,999 | 16 (12.2%) | 17 (14.4%) |
| $75,000 to $99,999 | 9 (6.9%) | 3 (2.5%) |
| $100,000 to $149,999 | 14 (10.7%) | 18 (15.2%) |
| $150,000 or more | 60 (45.8%) | 3 (2.5%) |
| Total | 131 (100.0%) | 118 (100.0%) |
Monthly Housing Cost Tiers in Deal borough
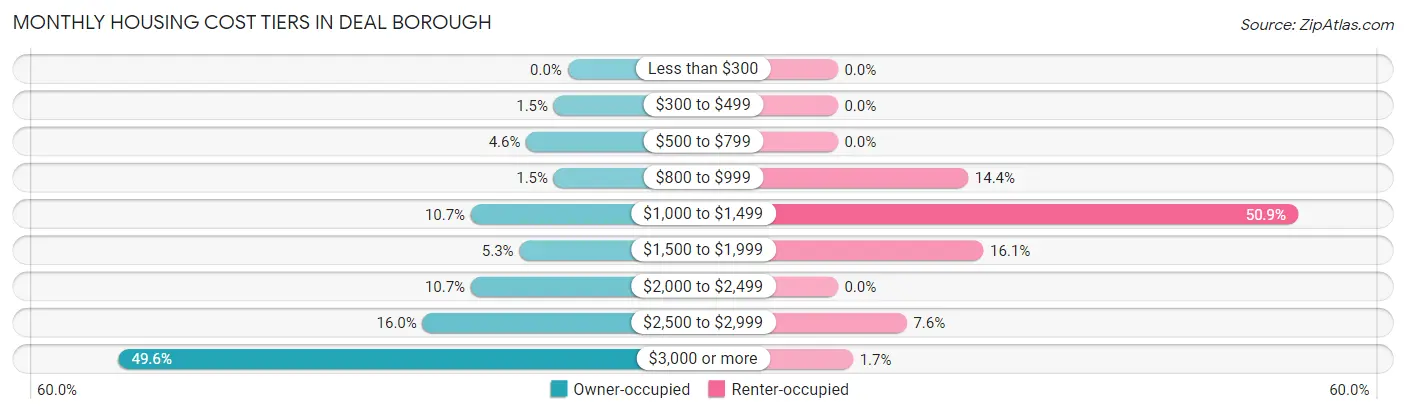
| Monthly Cost | Owner-occupied | Renter-occupied |
| Less than $300 | 0 (0.0%) | 0 (0.0%) |
| $300 to $499 | 2 (1.5%) | 0 (0.0%) |
| $500 to $799 | 6 (4.6%) | 0 (0.0%) |
| $800 to $999 | 2 (1.5%) | 17 (14.4%) |
| $1,000 to $1,499 | 14 (10.7%) | 60 (50.8%) |
| $1,500 to $1,999 | 7 (5.3%) | 19 (16.1%) |
| $2,000 to $2,499 | 14 (10.7%) | 0 (0.0%) |
| $2,500 to $2,999 | 21 (16.0%) | 9 (7.6%) |
| $3,000 or more | 65 (49.6%) | 2 (1.7%) |
| Total | 131 (100.0%) | 118 (100.0%) |
Physical Housing Characteristics in Deal borough
Housing Structures in Deal borough
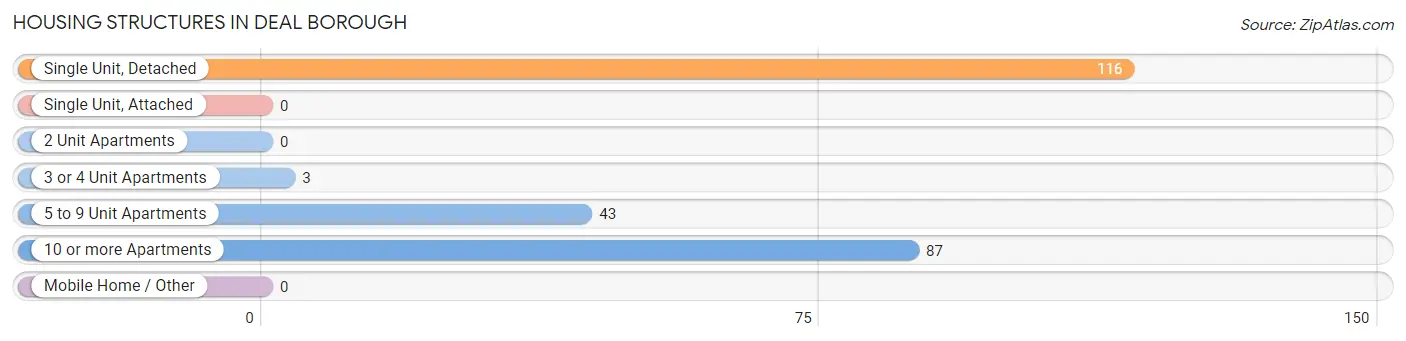
| Structure Type | # Housing Units | % Housing Units |
| Single Unit, Detached | 116 | 46.6% |
| Single Unit, Attached | 0 | 0.0% |
| 2 Unit Apartments | 0 | 0.0% |
| 3 or 4 Unit Apartments | 3 | 1.2% |
| 5 to 9 Unit Apartments | 43 | 17.3% |
| 10 or more Apartments | 87 | 34.9% |
| Mobile Home / Other | 0 | 0.0% |
| Total | 249 | 100.0% |
Housing Structures by Occupancy in Deal borough
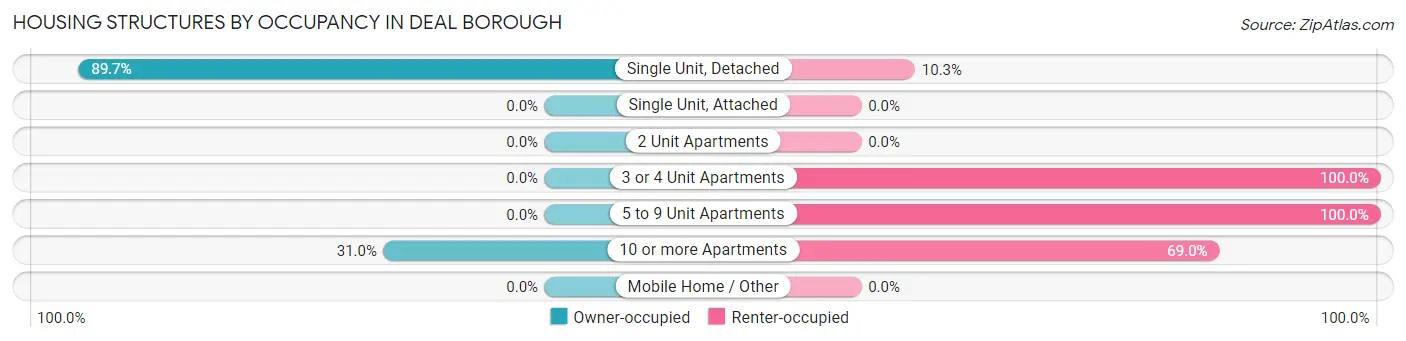
| Structure Type | Owner-occupied | Renter-occupied |
| Single Unit, Detached | 104 (89.7%) | 12 (10.3%) |
| Single Unit, Attached | 0 (0.0%) | 0 (0.0%) |
| 2 Unit Apartments | 0 (0.0%) | 0 (0.0%) |
| 3 or 4 Unit Apartments | 0 (0.0%) | 3 (100.0%) |
| 5 to 9 Unit Apartments | 0 (0.0%) | 43 (100.0%) |
| 10 or more Apartments | 27 (31.0%) | 60 (69.0%) |
| Mobile Home / Other | 0 (0.0%) | 0 (0.0%) |
| Total | 131 (52.6%) | 118 (47.4%) |
Housing Structures by Number of Rooms in Deal borough
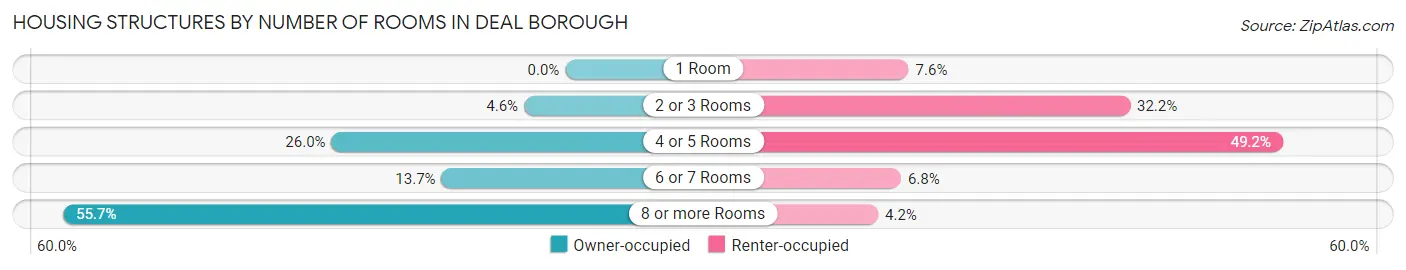
| Number of Rooms | Owner-occupied | Renter-occupied |
| 1 Room | 0 (0.0%) | 9 (7.6%) |
| 2 or 3 Rooms | 6 (4.6%) | 38 (32.2%) |
| 4 or 5 Rooms | 34 (26.0%) | 58 (49.1%) |
| 6 or 7 Rooms | 18 (13.7%) | 8 (6.8%) |
| 8 or more Rooms | 73 (55.7%) | 5 (4.2%) |
| Total | 131 (100.0%) | 118 (100.0%) |
Housing Structure by Heating Type in Deal borough
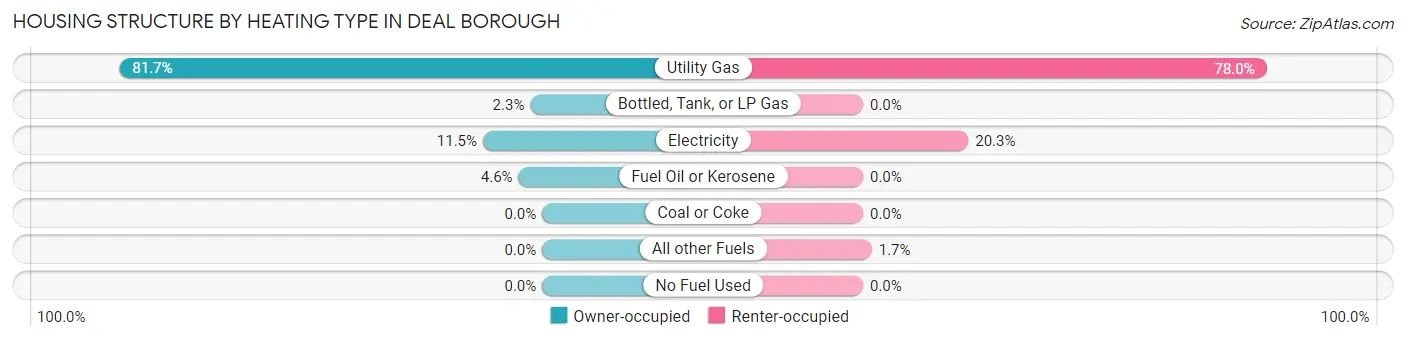
| Heating Type | Owner-occupied | Renter-occupied |
| Utility Gas | 107 (81.7%) | 92 (78.0%) |
| Bottled, Tank, or LP Gas | 3 (2.3%) | 0 (0.0%) |
| Electricity | 15 (11.5%) | 24 (20.3%) |
| Fuel Oil or Kerosene | 6 (4.6%) | 0 (0.0%) |
| Coal or Coke | 0 (0.0%) | 0 (0.0%) |
| All other Fuels | 0 (0.0%) | 2 (1.7%) |
| No Fuel Used | 0 (0.0%) | 0 (0.0%) |
| Total | 131 (100.0%) | 118 (100.0%) |
Household Vehicle Usage in Deal borough
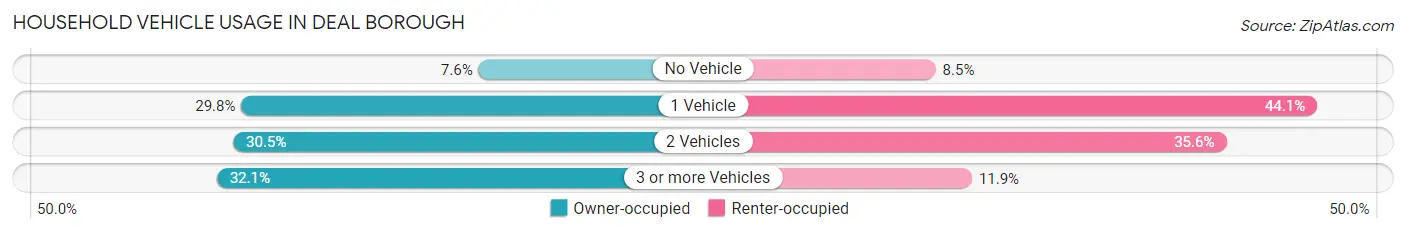
| Vehicles per Household | Owner-occupied | Renter-occupied |
| No Vehicle | 10 (7.6%) | 10 (8.5%) |
| 1 Vehicle | 39 (29.8%) | 52 (44.1%) |
| 2 Vehicles | 40 (30.5%) | 42 (35.6%) |
| 3 or more Vehicles | 42 (32.1%) | 14 (11.9%) |
| Total | 131 (100.0%) | 118 (100.0%) |
Real Estate & Mortgages in Deal borough
Real Estate and Mortgage Overview in Deal borough
| Characteristic | Without Mortgage | With Mortgage |
| Housing Units | 67 | 64 |
| Median Property Value | $2,000,001 | $1,083,300 |
| Median Household Income | $93,125 | $40 |
| Monthly Housing Costs | $1,501 | $54 |
| Real Estate Taxes | $10,001 | $0 |
Property Value by Mortgage Status in Deal borough
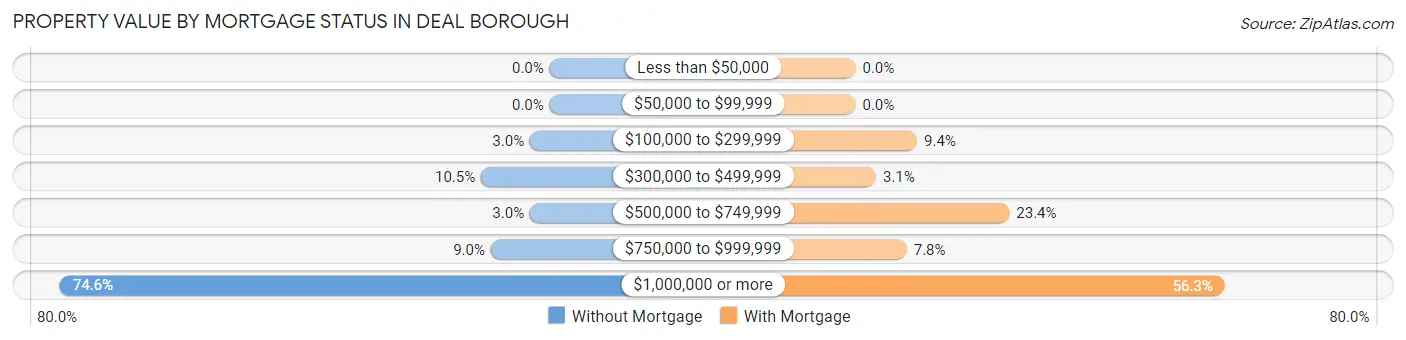
| Property Value | Without Mortgage | With Mortgage |
| Less than $50,000 | 0 (0.0%) | 0 (0.0%) |
| $50,000 to $99,999 | 0 (0.0%) | 0 (0.0%) |
| $100,000 to $299,999 | 2 (3.0%) | 6 (9.4%) |
| $300,000 to $499,999 | 7 (10.4%) | 2 (3.1%) |
| $500,000 to $749,999 | 2 (3.0%) | 15 (23.4%) |
| $750,000 to $999,999 | 6 (9.0%) | 5 (7.8%) |
| $1,000,000 or more | 50 (74.6%) | 36 (56.2%) |
| Total | 67 (100.0%) | 64 (100.0%) |
Household Income by Mortgage Status in Deal borough
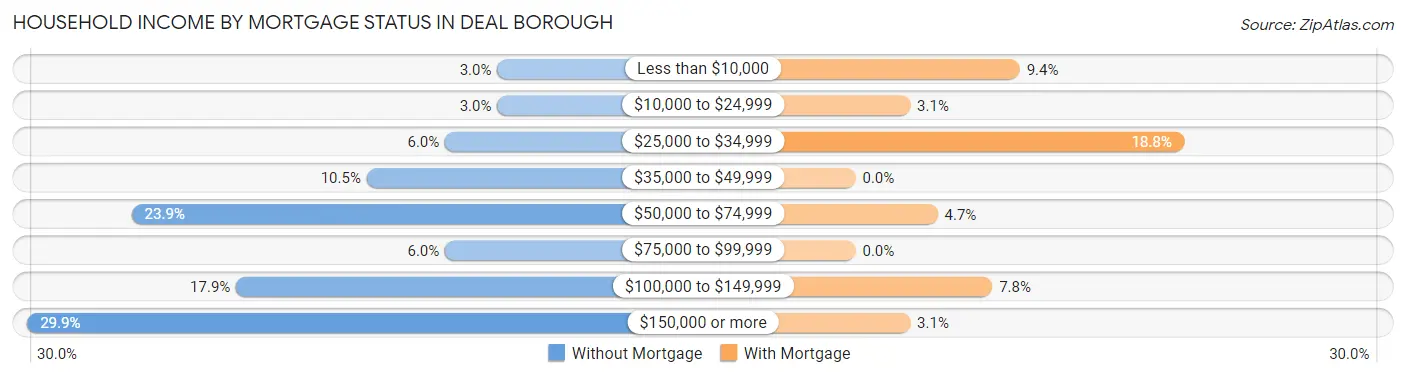
| Household Income | Without Mortgage | With Mortgage |
| Less than $10,000 | 2 (3.0%) | 6 (9.4%) |
| $10,000 to $24,999 | 2 (3.0%) | 2 (3.1%) |
| $25,000 to $34,999 | 4 (6.0%) | 12 (18.8%) |
| $35,000 to $49,999 | 7 (10.4%) | 0 (0.0%) |
| $50,000 to $74,999 | 16 (23.9%) | 3 (4.7%) |
| $75,000 to $99,999 | 4 (6.0%) | 0 (0.0%) |
| $100,000 to $149,999 | 12 (17.9%) | 5 (7.8%) |
| $150,000 or more | 20 (29.8%) | 2 (3.1%) |
| Total | 67 (100.0%) | 64 (100.0%) |
Property Value to Household Income Ratio in Deal borough
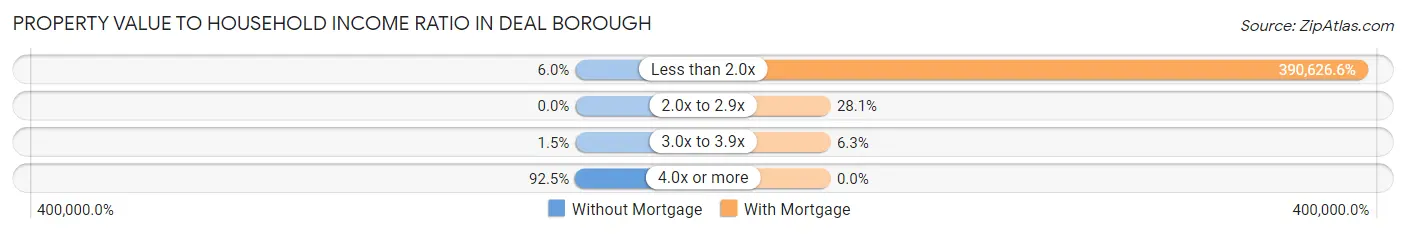
| Value-to-Income Ratio | Without Mortgage | With Mortgage |
| Less than 2.0x | 4 (6.0%) | 250,001 (390,626.6%) |
| 2.0x to 2.9x | 0 (0.0%) | 18 (28.1%) |
| 3.0x to 3.9x | 1 (1.5%) | 4 (6.2%) |
| 4.0x or more | 62 (92.5%) | 0 (0.0%) |
| Total | 67 (100.0%) | 64 (100.0%) |
Real Estate Taxes by Mortgage Status in Deal borough
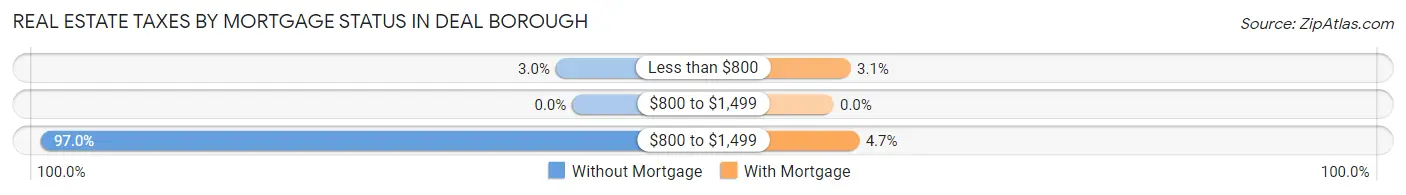
| Property Taxes | Without Mortgage | With Mortgage |
| Less than $800 | 2 (3.0%) | 2 (3.1%) |
| $800 to $1,499 | 0 (0.0%) | 0 (0.0%) |
| $800 to $1,499 | 65 (97.0%) | 3 (4.7%) |
| Total | 67 (100.0%) | 64 (100.0%) |
Health & Disability in Deal borough
Health Insurance Coverage by Age in Deal borough
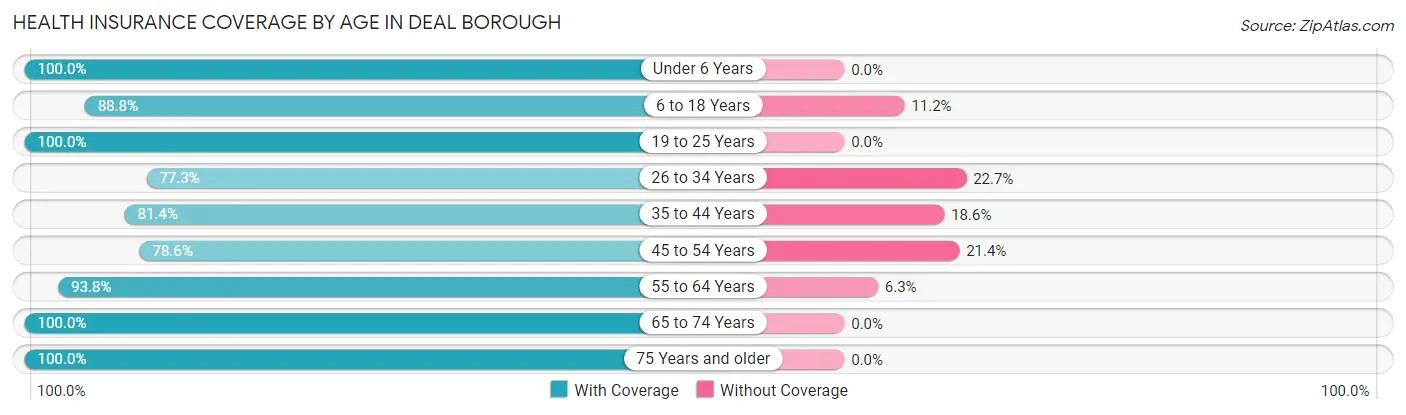
| Age Bracket | With Coverage | Without Coverage |
| Under 6 Years | 37 (100.0%) | 0 (0.0%) |
| 6 to 18 Years | 87 (88.8%) | 11 (11.2%) |
| 19 to 25 Years | 146 (100.0%) | 0 (0.0%) |
| 26 to 34 Years | 34 (77.3%) | 10 (22.7%) |
| 35 to 44 Years | 48 (81.4%) | 11 (18.6%) |
| 45 to 54 Years | 22 (78.6%) | 6 (21.4%) |
| 55 to 64 Years | 75 (93.8%) | 5 (6.2%) |
| 65 to 74 Years | 74 (100.0%) | 0 (0.0%) |
| 75 Years and older | 79 (100.0%) | 0 (0.0%) |
| Total | 602 (93.3%) | 43 (6.7%) |
Health Insurance Coverage by Citizenship Status in Deal borough
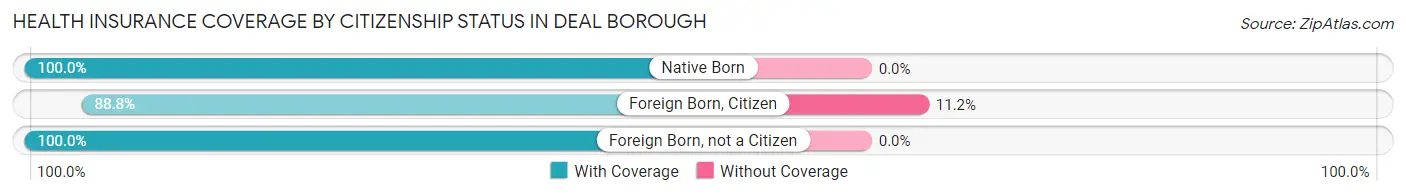
| Citizenship Status | With Coverage | Without Coverage |
| Native Born | 37 (100.0%) | 0 (0.0%) |
| Foreign Born, Citizen | 87 (88.8%) | 11 (11.2%) |
| Foreign Born, not a Citizen | 146 (100.0%) | 0 (0.0%) |
Health Insurance Coverage by Household Income in Deal borough
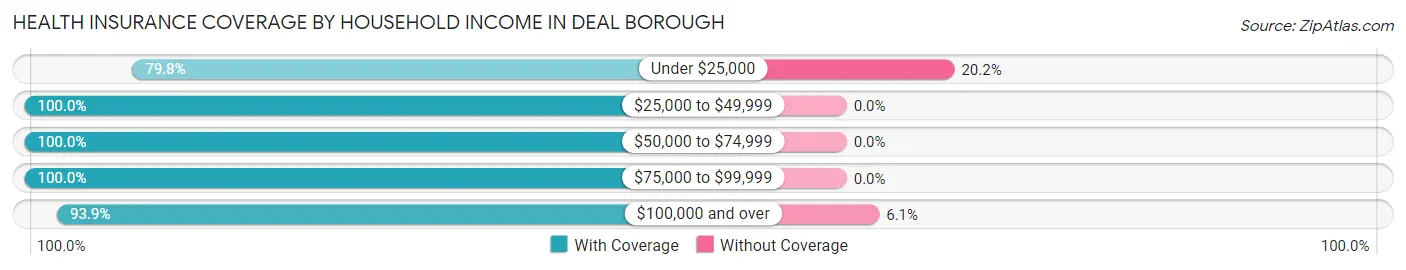
| Household Income | With Coverage | Without Coverage |
| Under $25,000 | 87 (79.8%) | 22 (20.2%) |
| $25,000 to $49,999 | 87 (100.0%) | 0 (0.0%) |
| $50,000 to $74,999 | 60 (100.0%) | 0 (0.0%) |
| $75,000 to $99,999 | 39 (100.0%) | 0 (0.0%) |
| $100,000 and over | 324 (93.9%) | 21 (6.1%) |
Public vs Private Health Insurance Coverage by Age in Deal borough
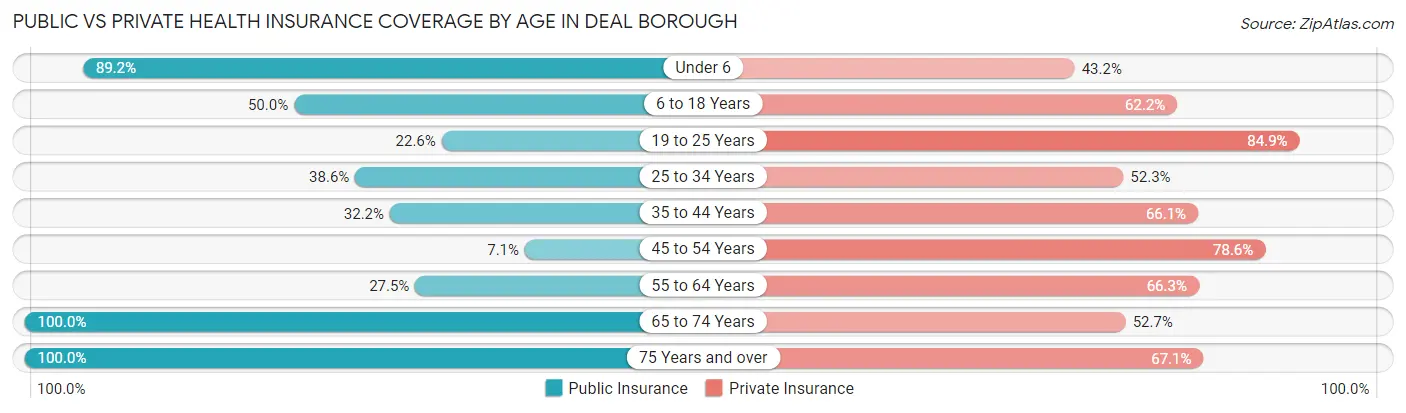
| Age Bracket | Public Insurance | Private Insurance |
| Under 6 | 33 (89.2%) | 16 (43.2%) |
| 6 to 18 Years | 49 (50.0%) | 61 (62.2%) |
| 19 to 25 Years | 33 (22.6%) | 124 (84.9%) |
| 25 to 34 Years | 17 (38.6%) | 23 (52.3%) |
| 35 to 44 Years | 19 (32.2%) | 39 (66.1%) |
| 45 to 54 Years | 2 (7.1%) | 22 (78.6%) |
| 55 to 64 Years | 22 (27.5%) | 53 (66.2%) |
| 65 to 74 Years | 74 (100.0%) | 39 (52.7%) |
| 75 Years and over | 79 (100.0%) | 53 (67.1%) |
| Total | 328 (50.8%) | 430 (66.7%) |
Disability Status by Sex by Age in Deal borough
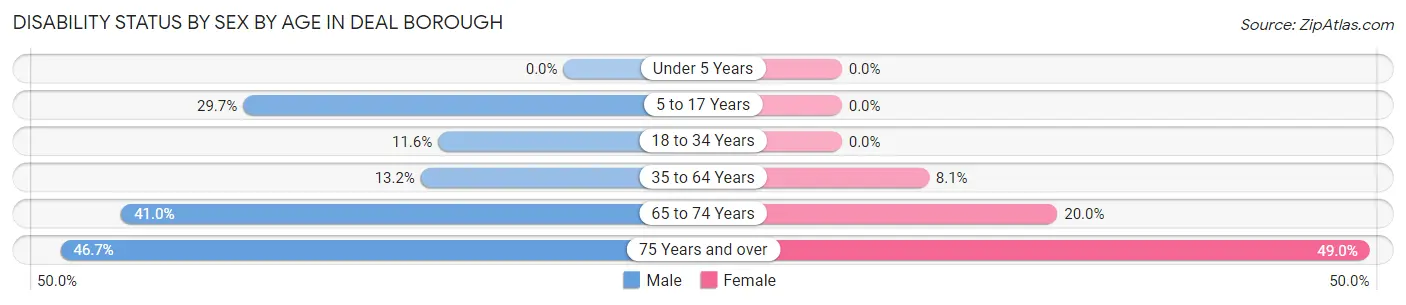
| Age Bracket | Male | Female |
| Under 5 Years | 0 (0.0%) | 0 (0.0%) |
| 5 to 17 Years | 11 (29.7%) | 0 (0.0%) |
| 18 to 34 Years | 10 (11.6%) | 0 (0.0%) |
| 35 to 64 Years | 9 (13.2%) | 8 (8.1%) |
| 65 to 74 Years | 16 (41.0%) | 7 (20.0%) |
| 75 Years and over | 14 (46.7%) | 24 (49.0%) |
Disability Class by Sex by Age in Deal borough
Disability Class: Hearing Difficulty
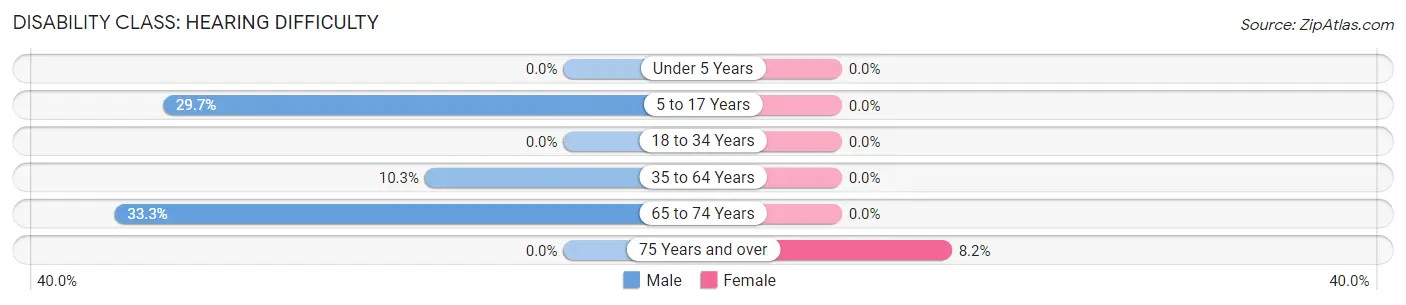
| Age Bracket | Male | Female |
| Under 5 Years | 0 (0.0%) | 0 (0.0%) |
| 5 to 17 Years | 11 (29.7%) | 0 (0.0%) |
| 18 to 34 Years | 0 (0.0%) | 0 (0.0%) |
| 35 to 64 Years | 7 (10.3%) | 0 (0.0%) |
| 65 to 74 Years | 13 (33.3%) | 0 (0.0%) |
| 75 Years and over | 0 (0.0%) | 4 (8.2%) |
Disability Class: Vision Difficulty
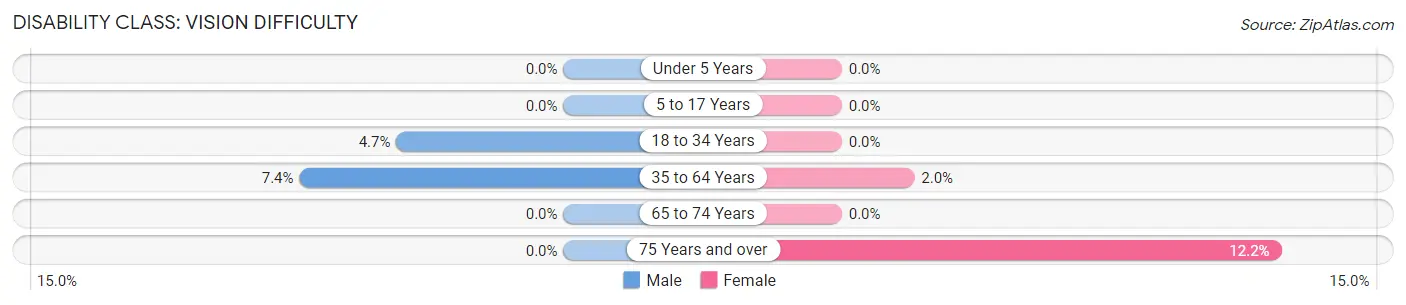
| Age Bracket | Male | Female |
| Under 5 Years | 0 (0.0%) | 0 (0.0%) |
| 5 to 17 Years | 0 (0.0%) | 0 (0.0%) |
| 18 to 34 Years | 4 (4.6%) | 0 (0.0%) |
| 35 to 64 Years | 5 (7.3%) | 2 (2.0%) |
| 65 to 74 Years | 0 (0.0%) | 0 (0.0%) |
| 75 Years and over | 0 (0.0%) | 6 (12.2%) |
Disability Class: Cognitive Difficulty
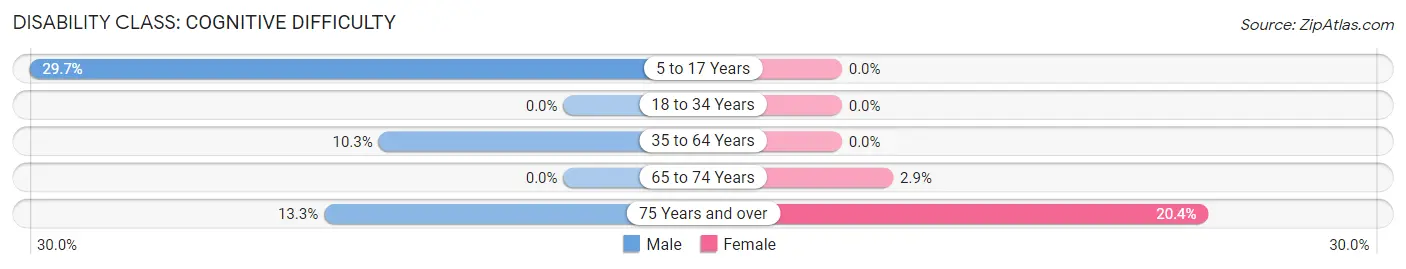
| Age Bracket | Male | Female |
| 5 to 17 Years | 11 (29.7%) | 0 (0.0%) |
| 18 to 34 Years | 0 (0.0%) | 0 (0.0%) |
| 35 to 64 Years | 7 (10.3%) | 0 (0.0%) |
| 65 to 74 Years | 0 (0.0%) | 1 (2.9%) |
| 75 Years and over | 4 (13.3%) | 10 (20.4%) |
Disability Class: Ambulatory Difficulty
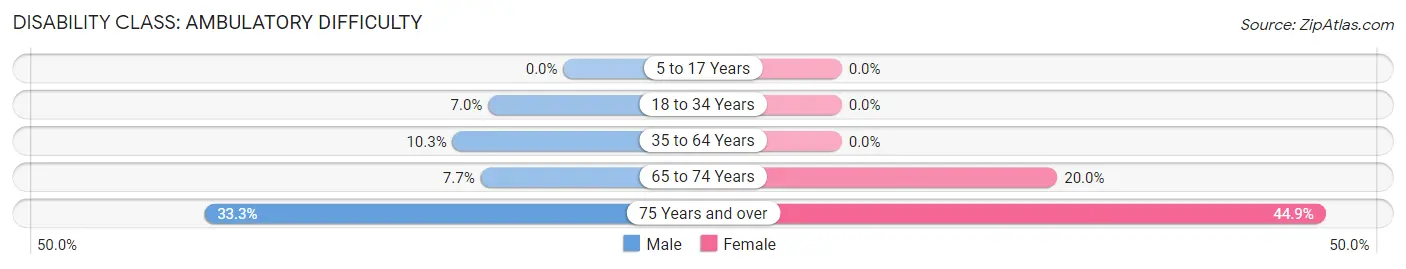
| Age Bracket | Male | Female |
| 5 to 17 Years | 0 (0.0%) | 0 (0.0%) |
| 18 to 34 Years | 6 (7.0%) | 0 (0.0%) |
| 35 to 64 Years | 7 (10.3%) | 0 (0.0%) |
| 65 to 74 Years | 3 (7.7%) | 7 (20.0%) |
| 75 Years and over | 10 (33.3%) | 22 (44.9%) |
Disability Class: Self-Care Difficulty
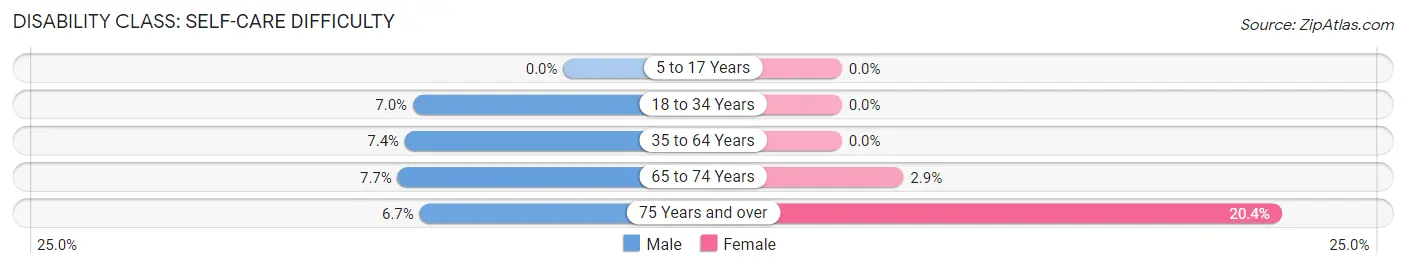
| Age Bracket | Male | Female |
| 5 to 17 Years | 0 (0.0%) | 0 (0.0%) |
| 18 to 34 Years | 6 (7.0%) | 0 (0.0%) |
| 35 to 64 Years | 5 (7.3%) | 0 (0.0%) |
| 65 to 74 Years | 3 (7.7%) | 1 (2.9%) |
| 75 Years and over | 2 (6.7%) | 10 (20.4%) |
Technology Access in Deal borough
Computing Device Access in Deal borough
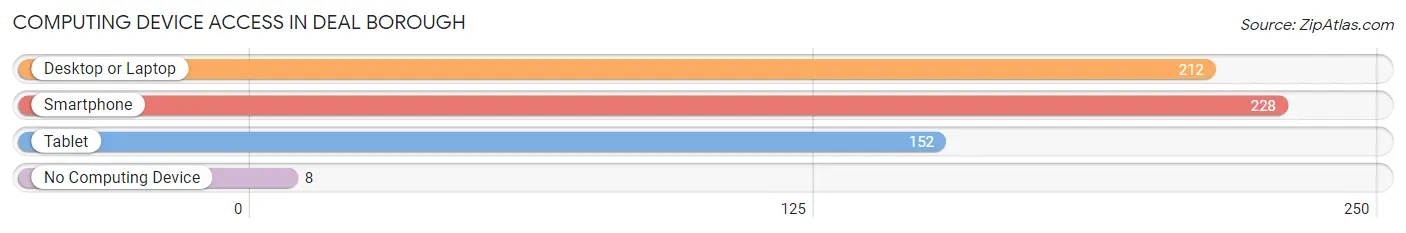
| Device Type | # Households | % Households |
| Desktop or Laptop | 212 | 85.1% |
| Smartphone | 228 | 91.6% |
| Tablet | 152 | 61.0% |
| No Computing Device | 8 | 3.2% |
| Total | 249 | 100.0% |
Internet Access in Deal borough
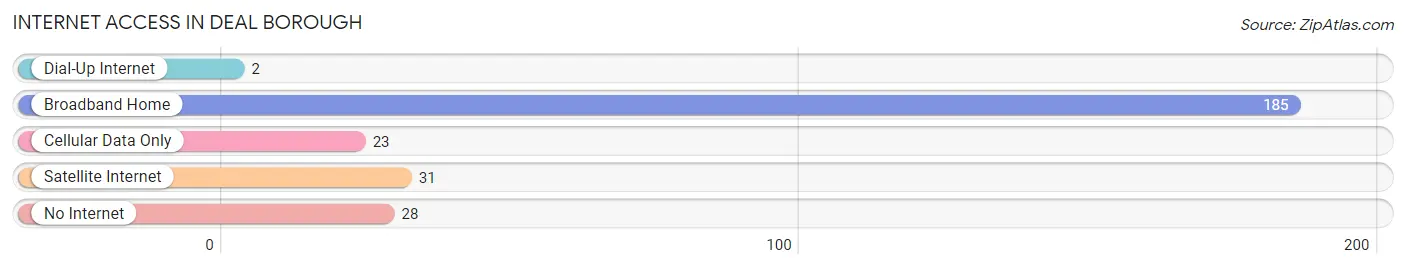
| Internet Type | # Households | % Households |
| Dial-Up Internet | 2 | 0.8% |
| Broadband Home | 185 | 74.3% |
| Cellular Data Only | 23 | 9.2% |
| Satellite Internet | 31 | 12.4% |
| No Internet | 28 | 11.2% |
| Total | 249 | 100.0% |
Deal borough Summary
Borough of Deal New Jersey
The Borough of Deal is a small, affluent community located in Monmouth County, New Jersey. It is situated on the Atlantic Ocean, just south of Long Branch and north of Asbury Park. The borough is home to a population of approximately 1,000 people, and is known for its beautiful beaches, historic homes, and vibrant downtown.
History
The area that is now Deal was originally inhabited by the Lenape Native Americans. In 1664, the area was purchased by English settlers from the Lenape, and the town was officially established in 1879. The town was named after the Deal family, who were among the first settlers in the area.
In the late 19th century, Deal became a popular summer destination for wealthy New Yorkers. The town was home to several grand hotels, including the Deal Casino and the Deal Beach Club. The town also became a popular spot for celebrities, including the likes of John D. Rockefeller, Jr., and the Vanderbilts.
In the early 20th century, Deal began to decline in popularity as a summer destination. The town was hit hard by the Great Depression, and many of the grand hotels were forced to close. However, the town was able to rebound in the 1950s and 1960s, thanks to the development of the nearby towns of Long Branch and Asbury Park.
Geography
Deal is located in Monmouth County, New Jersey, on the Atlantic Ocean. The borough is bordered by the towns of Long Branch to the north, Asbury Park to the south, and Ocean Township to the west. The borough is approximately 2.5 square miles in size, and is home to a population of approximately 1,000 people.
The borough is situated on a narrow strip of land between the Atlantic Ocean and Deal Lake. The lake is a popular spot for fishing, boating, and swimming. The borough also has several public beaches, including Deal Beach, which is one of the most popular beaches in the area.
Economy
The economy of Deal is largely based on tourism and real estate. The town is home to several luxury hotels, including the historic Deal Casino and the Deal Beach Club. The town also has several restaurants, bars, and shops, which attract visitors from all over the region.
The town is also home to several businesses, including a number of professional services firms, such as law firms and accounting firms. The town also has a number of small businesses, such as antique stores, art galleries, and boutiques.
Demographics
As of the 2010 census, the population of Deal was 1,000 people. The racial makeup of the borough was 94.2% White, 2.2% African American, 0.2% Native American, 0.8% Asian, and 2.6% from other races. The median household income was $90,000, and the median family income was $100,000.
Conclusion
The Borough of Deal is a small, affluent community located in Monmouth County, New Jersey. It is situated on the Atlantic Ocean, just south of Long Branch and north of Asbury Park. The borough is home to a population of approximately 1,000 people, and is known for its beautiful beaches, historic homes, and vibrant downtown. The economy of Deal is largely based on tourism and real estate, and the town is home to several luxury hotels, restaurants, bars, and shops. The racial makeup of the borough is 94.2% White, 2.2% African American, 0.2% Native American, 0.8% Asian, and 2.6% from other races. The median household income was $90,000, and the median family income was $100,000.
Common Questions
What is Per Capita Income in Deal borough?
Per Capita income in Deal borough is $61,547.
What is the Median Family Income in Deal borough?
Median Family Income in Deal borough is $133,636.
What is the Median Household income in Deal borough?
Median Household Income in Deal borough is $73,380.
What is Inequality or Gini Index in Deal borough?
Inequality or Gini Index in Deal borough is 0.64.
What is the Total Population of Deal borough?
Total Population of Deal borough is 645.
What is the Total Male Population of Deal borough?
Total Male Population of Deal borough is 281.
What is the Total Female Population of Deal borough?
Total Female Population of Deal borough is 364.
What is the Ratio of Males per 100 Females in Deal borough?
There are 77.20 Males per 100 Females in Deal borough.
What is the Ratio of Females per 100 Males in Deal borough?
There are 129.54 Females per 100 Males in Deal borough.
What is the Median Population Age in Deal borough?
Median Population Age in Deal borough is 34.2 Years.
What is the Average Family Size in Deal borough
Average Family Size in Deal borough is 3.4 People.
What is the Average Household Size in Deal borough
Average Household Size in Deal borough is 2.6 People.
How Large is the Labor Force in Deal borough?
There are 287 People in the Labor Forcein in Deal borough.
What is the Percentage of People in the Labor Force in Deal borough?
53.1% of People are in the Labor Force in Deal borough.
What is the Unemployment Rate in Deal borough?
Unemployment Rate in Deal borough is 5.2%.